Shootings of and by Chicago Police: Uncommon Crises--Part ...
49
Journal of Criminal Law and Criminology Volume 73 Issue 1 Spring Article 12 Spring 1982 Shootings of and by Chicago Police: Uncommon Crises--Part II: Shootings of Police, Shooting Correlates and Control Strategies William A. Geller Kevin J. Karales Follow this and additional works at: hps://scholarlycommons.law.northwestern.edu/jclc Part of the Criminal Law Commons , Criminology Commons , and the Criminology and Criminal Justice Commons is Criminology is brought to you for free and open access by Northwestern University School of Law Scholarly Commons. It has been accepted for inclusion in Journal of Criminal Law and Criminology by an authorized editor of Northwestern University School of Law Scholarly Commons. Recommended Citation William A. Geller, Kevin J. Karales, Shootings of and by Chicago Police: Uncommon Crises--Part II: Shootings of Police, Shooting Correlates and Control Strategies, 73 J. Crim. L. & Criminology 331 (1982)
Transcript of Shootings of and by Chicago Police: Uncommon Crises--Part ...

Journal of Criminal Law and CriminologyVolume 73Issue 1 Spring Article 12
Spring 1982
Shootings of and by Chicago Police: UncommonCrises--Part II: Shootings of Police, ShootingCorrelates and Control StrategiesWilliam A. Geller
Kevin J. Karales
Follow this and additional works at: https://scholarlycommons.law.northwestern.edu/jclc
Part of the Criminal Law Commons, Criminology Commons, and the Criminology and CriminalJustice Commons
This Criminology is brought to you for free and open access by Northwestern University School of Law Scholarly Commons. It has been accepted forinclusion in Journal of Criminal Law and Criminology by an authorized editor of Northwestern University School of Law Scholarly Commons.
Recommended CitationWilliam A. Geller, Kevin J. Karales, Shootings of and by Chicago Police: Uncommon Crises--Part II: Shootings of Police, ShootingCorrelates and Control Strategies, 73 J. Crim. L. & Criminology 331 (1982)
0091-4169/82/7301-331THEJOURNAL OF CRIMINAL LAW & CRIMINOLOGY Vol. 73, No. 1Copyright @ 1982 by Northwestern University School of Law r"inedin USA.
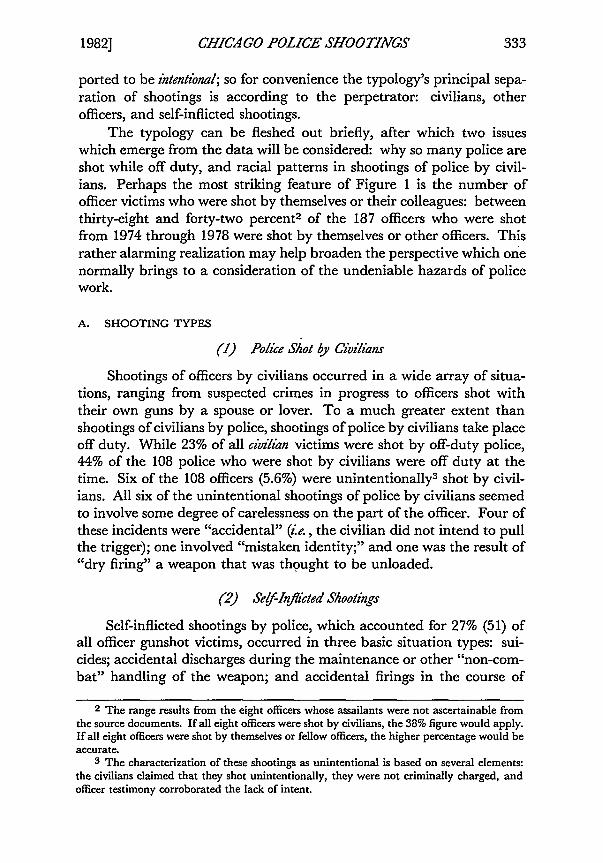
In 1977, the Chicago Police Department opened itsfiles concerning police-in-volved shootings to inspection by a public interest group, the Chicago Law EnforcementStudy Group. This represents the ftrst time a major cits police force has allowed itsshooting investigation files to be viewed by the public. The following article is basedon excerptsfiom that group's report. The study is presented in two parts. Theftst setof material, presented in 72 J. CRiM. L. & C. 1813 (1981), dealt with the method-ology, shooting types and racial factors involved in the shootings. The set of datapresented in this issue deals with shootings ofpolice officers, variations in shootingsover time and recommendations for shooting control strategies.
THE EDITORS
SHOOTINGS OF AND BY CHICAGOPOLICE: UNCOMMON CRISESPART II: SHOOTINGS OF POLICE,
SHOOTING CORRELATES ANDCONTROL STRATEGIES
WILLIAM A. GELLER* AND KEVIN J. KARALES**
Unlike much of the empirical literature on police shootings, thisarticle devotes attention not only to police use of deadly force againstcivilians but to police victimization as well.' This broadened focusstems from the conviction that minimizing police victimization is anequally important goal to minimizing inappropriate police use of deadlyforce, and from the belief that the latter objective can best be accom-plished by understanding as fully as possible the risks that officers face ofbeing shot. Following a description and analysis of the incidents inwhich 187 Chicago police officers were shot-by civilians, by them-selves, and by fellow officers-from 1974 through 1978, this article willexamine factors that might be associated with and help explain annualvariations in the number of civilians shot by Chicago police. Finally, we
* Research Attorney, American Bar Foundation; J.D., University of Chicago School of
Law, 1975. At the time this piece was written, Mr. Geller was the Director of the ChicagoLaw Enforcement Study Group.
** Research Associate, Chicago Law Enforcement Study Group.1 Of the few other recent studies that examine the causes and prevention of shootings of
police officers, the best are Fyfe, Always Prepared Police Of9Duly Guns, 452 ANNALS 72 (1980);Margarita, Killing the Police, 452 ANNALS 63 (1980); Margarita, Police As Vcim of Violence, 5JUST. Sys. J. 218 (1980); M. MARGARITA, CRIMINAL VIOLENCE AGAINST POLICE IN THE
UNITED STATES (forthcoming).

GELLER AND KARALES
will briefly discuss a variety of strategies that police administrators inChicago and other jurisdictions may find helpful in reducing the level ofpolice-involved shooting.
I. SHOOTINGS OF POLICE OFFICERS
As was the case with our typology of officers' reasons for shootingcivilians in part I of this article, our typology of officer victimization(Figure 1) is framed with shooting reduction in mind. Since officer pro-tection strategies are likely to vary according to whether the officer isshot intentionally or accidentally, the typology uses the intent of theperpetrator as one of its key divisions. Apart from suicides, however, allshootings of police by themselves or other officers were reported to beunintentional, and virtually all shootings of police by civilians were re-
FIGURE 1
TYPOLOGY: CHICAGO POLICE SHOT, 1974-1978(N = 187)
[Vol. 73
CHICAGO POLICE SHOOTINGS
ported to be intentional; so for convenience the typology's principal sepa-ration of shootings is according to the perpetrator: civilians, otherofficers, and self-inflicted shootings.
The typology can be fleshed out briefly, after which two issueswhich emerge from the data will be considered: why so many police areshot while off duty, and racial patterns in shootings of police by civil-ians. Perhaps the most striking feature of Figure 1 is the number ofofficer victims who were shot by themselves or their colleagues: betweenthirty-eight and forty-two percent2 of the 187 officers who were shotfrom 1974 through 1978 were shot by themselves or other officers. Thisrather alarming realization may help broaden the perspective which onenormally brings to a consideration of the undeniable hazards of policework.
A. SHOOTING TYPES
(I) Police Shot by Civilians
Shootings of officers by civilians occurred in a wide array of situa-tions, ranging from suspected crimes in progress to officers shot withtheir own guns by a spouse or lover. To a much greater extent thanshootings of civilians by police, shootings of police by civilians take placeoff duty. While 23% of all civilian victims were shot by off-duty police,44% of the 108 police who were shot by civilians were off duty at thetime. Six of the 108 officers (5.6%) were unintentionally3 shot by civil-ians. All six of the unintentional shootings of police by civilians seemedto involve some degree of carelessness on the part of the officer. Four ofthese incidents were "accidental" (ie., the civilian did not intend to pullthe trigger); one involved "mistaken identity;" and one was the result of"dry firing" a weapon that was thought to be unloaded.
(2) Self-Inflicted Shootings
Self-inflicted shootings by police, which accounted for 27% (51) ofall officer gunshot victims, occurred in three basic situation types: sui-cides; accidental discharges during the maintenance or other "non-com-bat" handling of the weapon; and accidental firings in the course of
2 The range results from the eight officers whose assailants were not ascertainable from
the source documents. If all eight officers were shot by civilians, the 38% figure would apply.If all eight officers were shot by themselves or fellow officers, the higher percentage would beaccurate.
3 The characterization of these shootings as unintentional is based on several elements:the civilians claimed that they shot unintentionally, they were not criminally charged, andofficer testimony corroborated the lack of intent.
1982]

GELLER AND KARALES
attempting arrests. Strategies for reducing the incidence of such shoot-ings are suggested later in this article.
The Chicago Police Department reported ten officer suicides andone suicide attempt for the five year study period. (These numbers ex-clude any suicides accomplished by means other than firearms becausewe do not have data on officer non-gun suicides.) While this figure com-putes to an annual average of only two gun-suicides for the Department,the officer gun-suicide rate is actually slightly higher than the overallrate (all means) for Chicago's adult population. In 1977, Chicagoans 18years of age and older committed suicide at the rate of approximately 13persons per 100,000 residing in the city.4 The average gun-suicide ratefor Chicago police officers, however, is 15 per 100,000 officers. Whetherthis difference in rates represents a significant difference between thegeneral populace and police is difficult to judge based on the number ofofficer suicides that occurred and the exclusion of non-gun suicides.One could assume with some confidence that some additional numberof Chicago police officers committed suicide during the study period bymeans other than guns, and that the total Chicago police officer suiciderate is actually higher than 15 per 100,000. The stresses, odd and varia-ble working hours and other aspects of police work might help explain adisproportionate suicide rate for police officers. 5
(3) Police Shot by Fellow Oftiers
Eleven percent (20) of all officers shot from 1974 through 1978 wereshot by other police officers. Shootings of police by fellow officers re-sulted primarily from accidental gun discharges. Some incidents seemedto be the result of bad gun handling habits by officers (e.g., an officerwas struck by a ricocheted bullet from a gun that was holstered in thehalf-cocked position by a fellow officer during roll call). Other incidentsresulted from stray bullets during shootouts and possibly from poor tac-tical coordination among several officers on a crime scene (e.g., officersgetting in the line of fire).
4 Telephone conversation with James Walker, Division of Planning, Center for HealthStatistics, State of Illinois (Dec. 30, 1980).
5 Edward Donovan, founder of the Boston Stress Counseling Program for Police Officers,indicated in a recent filmed interview that he believes "suicides are more prevalent in lawenforcement professions than in any other, although often these incidents are not recorded assuicides." The interview is part of a police training film, Interview with Edward Donovan onStress, produced by Harper and Row, reported in NCJRS, SELECTIVE NOTIFICATION OF
INFORMATION 24 (Dec. 1980). New York City police officers suffer a reported suicide ratetwice as high as that of the City's white male population. Fyfe, Shots Fired: A TypologicalExamination of New York City Police Firearms Discharges, 1971-1975, 476 (1978) (unpub-lished Ph.D. dissertation, School of Criminal Justice, S.U.N.Y. at Albany).
[Vol. 73

CHICAGO POLICE SHOOTINGS
B. SHOOTING PATTERNS
A few noteworthy patterns concerning shootings of police officersemerge from the data, most notably those associated with off-duty shoot-ings and with the race of the participants. Any attempt to devise strate-gies for reducing the number of police officers who are shot shouldprobably take into account the fact that a majority (52%) of the officervictims are off-duty when shot.6 This is important because the kinds ofcontrol strategies available may differ significantly for on- and off-dutyofficers. Table 1 shows the number of on- and off-duty officers shot,according to shooting type. - .
TABLE 1
POLICE SHOT IN CHICAGO, 1974-1978: DUTY STATUS OF
OFFICER VICTIMS BY SHOOTING TYPE
DUTY STATUS
SHOOTING TYPE OF OFFICER VICTIMS
On Off Total
(1) By civilian Number 61 47 108Row % 56% 44% 100%
(2) Self-Inflicted Accidental 10 30 4025% 75% 100%
Suicide 0 11 11- 100% 100%
(3) By other Officers Number 15 5 20Row % 75% 25% ,100%
TOTAL Number 86 93 179aRow% 48% 52% 100%
a Not ascertained = 8.
It is noteworthy that, while a majority of all officer victims are off-duty when shot, the duty status of officers varies considerably by shoot-ing type. Only self-inflicted gun shot wounds are mainly an off-dutyphenomenon (75% of the accidentals and all of the suicides occurredduring the officers' time off). The large number of self-inflicted shoot-ings that occur while officers are off-duty is a key explanation for why solarge a percentage of all officer victims are off-duty when shot. Sincemany self-inflicted wounds are the result of gun maintenance (an off-duty activity), it is not particularly surprising that most of the self-in-flicted shootings are off-duty events. Shootings by fellow officers, which
6 We indicated above that 44% of the officers shot b cidlians were off-duty at the time of
their injuries.
1982]
GELLER AND KARALES
are relatively few in number, are predominantly an on-duty phenome-non. Shootings by civilians are closer to being evenly divided betweenon- and off-duty events, as Table 1 shows.
In addition to the concentration of off-duty officers among self-in-flicted shooting victims, two other explanations can be offered for thelarge number of officers who are shot while off duty. Both concernshootings of police by civilians. First, Police Department policy requiresoff-duty officers to take appropriate police action when they encounterpossible criminal activity. Police officers traditionally have considereds-their responsibility for off-duty action to include aggressive intervention(termination of crimes and arrest of suspects) and not just careful obser-vation and notification of on-duty police. Yet off-duty police may beunprepared for a confrontation with armed opponents, who frequentlywill have the element of surprise, in their favor. Moreover, off-duty of-
ficers usually intervene in a suspected crime on their own initiativerather than at the request of a member of the public, which may depriveoff-duty officers of some "legitimacy" and may make forceful resistanceto their authority more likely.7 The arming of off-duty police, a practicewhich is receiving increasing criticism,8 facilitates such aggressive action.
The result of large-scale, aggressive intervention by off-duty officers isthat off-duty police run almost the same risk of being shot by civilians asdo on-duty officers.
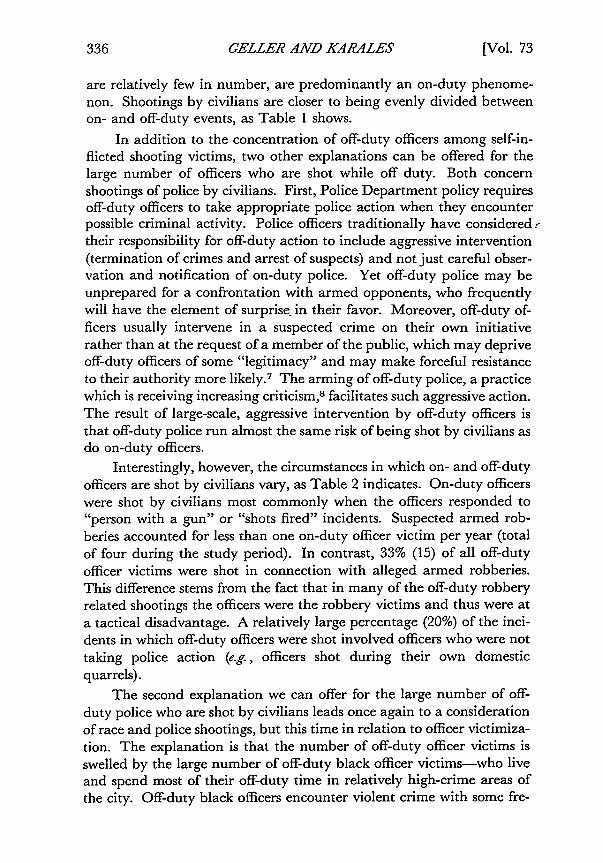
Interestingly, however, the circumstances in which on- and off-dutyofficers are shot by civilians vary, as Table 2 indicates. On-duty officerswere shot by civilians most commonly when the officers responded to"person with a gun" or "shots fired" incidents. Suspected armed rob-
beries accounted for less than one on-duty officer victim per year (totalof four during the study period). In contrast, 33% (15) of all off-duty
officer victims were shot in connection with alleged armed robberies.This difference stems from the fact that in many of the off-duty robberyrelated shootings the officers were the robbery victims and thus were at
a tactical disadvantage. A relatively large percentage (20%) of the inci-dents in which off-duty officers were shot involved officers who were nottaking police action (e.g., officers shot during their own domesticquarrels).
The second explanation we can offer for the large number of off-
duty police who are shot by civilians leads once again to a considerationof race and police shootings, but this time in relation to officer victimiza-tion. The explanation is that the number of off-duty officer victims isswelled by the large number of off-duty black officer victims-who liveand spend most of their off-duty time in relatively high-crime areas ofthe city. Off-duty black officers encounter violent crime with some fre-
[Vol. 73
CHICAGO POLICE SHOOTINGS
TABLE 2
INCIDENTS OF OFFICERS SHOT BY CIVILIANS IN CHICAGO, 1974-1978: SITUATION TYPE BY OFFICER DUTY STATUS
SITUATION TYPEa DUTY STATUS OF VICTIM OFFICERS
On Off Total# % * % # %
Armed/strong arm robb. 4 7% 15 33% 19 18%
Person with a gun/shotsfired 19 32% 5 11% 24 23%
Handling prisoners 1 2% 0 - 1 1%
Burglary 2 3% 0 - 2 2%
Suspicious person 5 8% 2 4% 7 7%
Person shot/otherwiseinjured/screaming for help(includes rape) 3 5% 2 4% 5 5%
Nondomestic disturbance,riot, person with deadlyweapon other than gun 5 8% 5 11% 10 9%
Domestic disturbance 3 5% 1 2% 4 4%
Traffic offense, autopursuit/stop 2 3% 2 4% 4 4%
Assault or crime on officer(incl. ambush) 5 8% 2 4% 7 7%
Not police business 1 2% 9 20% 10 9%
Vice (drug or sex) offenses 10 17% 3 7% 13 12%
TOTAL 6 0 b 100% 46c 100% 10 6 d 100% e
a Based on the officers' initial perceptions, which almost invariably were reported tohave been accurate.
b Not ascertained = 1.C Not ascertained = 1.d Not ascertained = 2.C Does not total 100% due to rounding.
quency and, accordingly, are shot with some frequency, just as on-duty
officers of all races who regularly encounter serious crime suspects are
shot with some frequency. Table 3 offers evidence for this explanation.
It shows the distribution of on- and off-duty officer victims of different
7 See A. REISS, JR., THE POLICE AND THE PUBLIC (1971).8 Fyfe, supra note 1.
1982]

GELLER AND KARALES [Vol. 73
races, according to the crime level of the districts in which they wereshot by civilians.
Table 3 shows both the number of officer victims and the rates atwhich they were shot, based on the average annual number of officers ofa given race shot per 1,000 officers of that race on the Chicago policeforce. As indicated, shootings of black off-duty officers help account forthe large number of off-duty police victims. Black officers constituted51% of the forty-five off-duty officers who were shot by civilians, despitethe fact that only 17.4% of the Police Department's sworn personnel areblack. The reported residential pattern of black officers (mostly in me-dium- and high-crime districts) seems the most likely explanation for thedistribution of off-duty black officer victims, 91% of whom were shot bycivilians in such districts.9
TABLE 3
POLICE SHOT BY CIVILIANS IN CHICAGO, 1974-1978: OFFICER
VICTIMS' RACE AND DUTY STATUS, BY CRIME LEVEL OFSHOOTING LOCATION
CRIiME LEVEL RACE OF OFFICER VICTIMS
OF LOCATION White Black Hispanic TOTAL
Lowa N= 15 4 1 20Total Rateb= 0.3 0.3 0.8 0.3
Bjy Q Qff Qa Qff Qa Qff Qa QffDuy 8 7 2 2 1 0 11 9
0.2 0.1 0.2 0.2 0.8 - 0.2 0.1
Mediumc 25 12 0 37
Total 0.5 1.0 - 0.6
By Qa Qff Qa Qff Qa Qff Qa QffDuty 16 9 6 6 0 0 22 15
0.3 0.2 0.5 0.5 - - 0.3 0.2
Highd 23 22 1 46Total 0.4 1.9 0.8 0.7
B OQ off Qa off On Off On OffDuty 18 5 7 15 0 1 25 21
0.3 0.1 0.6 1.3 - 0.8 0.4 0.3
TOTAL 63 38 2 103eTotal 1.2 3.3 1.7 1.5
By on Off On Off On Off On offDuty 42 21 15 23 1 1 58 45
0.8 0.4 1.3 2.0 0.8 0.8 0.9 0.7a Low-crime districts are those with 200 or less forcible felonies (crimes of personal violence plus burgla-
ry) per 10,000 population per year.b All rates - average annual number of officers shot by civilians per 1,000 officers of the indicated race
on the Chicago police force.c Medium-crime districts are those with 201-300 forcible felonies per 10,000 population per year.d High-crime districts are those with more than 300 forcible felonies per 10,000 population per year.e Not ascertained = 5.
9 As is the case with much of the analysis in part I of this article, if multivariate analysishad been possible here, it might have yielded interesting results. In the future, it might be

CHICAGO POLICE SHOOTINGS
Besides helping to explain why police are shot while off-duty in rel-atively large numbers, Table 3 suggests some points about race andshootings of police officers. Without regard to duty status, black officersare nearly three times more likely than white officers to be shot by civil-ians (rates of 3.3 versus 1.2). (We indicated in part I of this article thatblack officers were also more likely than white officers to shoot civilians.)Taking duty status into account pinpoints the same difference we sawwith shootings of civilians. Among on-duty officers, black police are 1.6times more likely than their white colleagues to be shot by civilians(rates of 1.3 versus 0.8); but while off duty, black officers are five times aslikely as white officers to be shot by civilians (rates of 2.0 versus 0.4).Like the high rate of shooting by off-duty black officers, this phenome-non probably is the product of police officers' residential patterns.
TABLE 4
ON-DUTY POLICE SHOT BY CIVILIANS IN CHICAGO, 1974-1978:UNITS OF ASSIGNMENT OF OFFICER VICTIMS AND BLACK
REPRESENTATION IN UNITS
OFFICER VICTIMS' OFFICERS % OF PERSONNELUNITS OF SHOT BY IN UNIT WHO
ASSIGNMENT CIVILIANS ARE BLACK
Special #a 4Operations Group Rateb 12.3Tactical # 12
Rate 6.3
Gang Crimes # 4Rate 6.1
Robbery #1 10.3%Rate 0.9
Patrol Division # 26Rate 0.7
Other units # 10Rate -
TOTAL # 57a Number of on-duty officers shot by civilians.b All rates = average annual number of on-duty officers shot by civilians per 1,000
officers assigned to the indicated unit. Personnel figures were obtained from a Chi-cago Police Department computer printout for 1976.
fruitful to see how much of the variance in shootings of officers can be accounted for by thecrime rate of their residential area, and then to see if race can account for any additionalvariance (after controlling for residential area).
19821

GELLER AND KARALES
We digress for a moment from Table 3 to examine why on-dutywhite and black officers' chances of being shot by civilians are relativelysimilar despite the previously noted disproportionate assignment ofblack patrol division personnel to high hazard police districts. Table 4suggests -one explanation. It shows that black officers are under-represented in most of the units of the Department whose members beara high risk of being shot. by civilians.' 0
The units depicted in Table 4 in which black officers are "under-represented" (a lower percentage than the overall Departmental repre-sentation of 17.4%)-Special Operations Group, Tactical, andRobbery--experience an annual average of 5.1 on-duty officers shot bycivilians per 1,000 officers in those units. By contrast, the two unitsshown that have an "overrepresentation" of black officers-GangCrimes and the Patrol Division-have an annual average of 0.8 on-dutyofficers shot by civilians per 1,000 members of those units. These num-bers are fairly small but, if they are reliable indicators, they suggest thaton-duty officers in units with relatively few black officers are more thansix times as likely to be shot by civilians as officers in units with rela-tively large numbers of black officers."
Returning to Table 3, we can explore patterns associated with thecrime level of the area in which officers of different races were shot whileon and off duty. White officers are approximately three times morelikely to be shot in high-crime districts when they are on-duty than dur-ing their time off, largely because most white officers presumably do notspend much off-duty time in high-crime districts. But black officers,most of whom presumably spend a large amount of their off-duty timein such districts, are more likely to be shot in high-crime districts whileoqTdu y than during their working hours (rates of 1.3 versus 0.6). Com-paring officers of different races, black police are thirteen times morelikely than white police to be shot by civilians in high-crime districtswhile off duty (rates of 1.3 versus 0.1). By contrast, off-duty black of-ficers are only twice as likely as off-duty white officers to be shot bycivilians in low-crime districts (rates of 0.2 versus 0.1). In medium-crimedistricts, black officers are 2.5 times more likely than white officers to beshot by civilians while off duty. This difference may be accounted for bythe possibility that, while some officers of both races reportedly live inmedium-crime districts, a much higher percentage of black than whiteofficers reside in such areas.
10 See the similar finding regarding shootings by police in part I of this article.
11 Future research utilizing multivariate statistical analysis could examine the variance inthe shooting rate due to the "unit of assignment," the degree of "hazardous area assignment,"and the officers' race.
[Vol. 73

1982] CHICAGO POLICE SHOOTINGS
The relation between duty status and patterns of victimization forofficers of different races will be examined further since some notewor-thy associations have already appeared. Table 5 depicts the shootingtypes, duty status and race of the victim officers. The table permitscomparison between the patterns associated with shootings of police bycivilians, on the one hand, and shootings by fellow officers and self-in-flicted shootings, on the other hand.
Table 5 shows that white and black officers are equally as likely toshoot themselves accidentally while on duty (rates of 0.2) but that off-duty black officers are 1.8 times more likely than off-duty white officersto sustain self-inflicted wounds (rates of 0.9 versus 0.5). This differencedoes not seem to be explainable on the basis of the relatively more dan-gerous environment in which black officers spend their off-duty time,unless this hazardous environment causes black officers to handle theirguns more often, and hence to experience mishaps more often than theirwhite counterparts. The number of police shot by fellow officers is prob-
TABLE 5POLICE SHOT IN CHICAGO, 1974-1978: RACE AND DUTY
STATUS OF OFFICER VICTIMS, BY SHOOTING TYPE
SHOOTING TYPE RACE OF OFFICER VICTIMS
White Black Hispanic TOTAL
(1) By #- 64 39 2 105b
Civilian Total Ratea= 1.2 3.4 1.7 1.6
By On _Qf Qa Qif Qa Qif Qa QffDuty 42 22 16 23 1 1 59 46
0.8 0.4 1.4 2.0 0.8 0.8 0.9 0.7
(2) Self- 37 13 0 50 c
Inflicted Total 0.7 1.1 - 0.8
By Qa OQf Qa Qff Qa Qf Q QffDuty 8 29 2 11 0 0 10 40
0.2 0.5 0.2 0.9 - - 0.2 0.6
(3) By Other 10 6 1 17dOfficers Total 0.2 0.5 0.8 0.3
By Qa fl Q Qff Qa ff Qa offDuty 7 3 4 2 1 0 12 5
0.1 0.1 0.3 0.2 0.8 - 0.2 0.1
TOTAL 111 58 3 172cTotal 2.1 5.0 2.5 2.6
By Qa Qff Qa Qff Qa Qff On QffDuty 57 54 22 36 2 1 81 91
1.1 1.0 1.9 3.1 1.7 0.8 1.2 1.4
a All rates = average annual number of officers shot per 1,000 officers of the indicated race on theChicago police force.
b Not ascertained - 3.C Not ascertained - 1.d 'Not ascertained - 3.e Not ascertained = 15.

GELLER AND KARALES
ably too small to support generalizations, but if any conclusions can bedrawn, the data suggest that black officers are once again over-represented as victims in both on- and off-duty shootings (rates of 0.3and 0.2, respectively, versus white officer rates of 0.1 for both on- andoff-duty incidents).
Table 5 also reveals that white and black officers face differentchances of being shot when the categories of self-inflicted shootings andshootings by fellow officers are combined. One third of all black officervictims (19) were shot by themselves or fellow officers. For white of-ficers, however, the corresponding figure is 42%. These figures conceallarger differences based on the officers' duty status. Only 26% of the on-duty white officer victims are shot by themselves or other police, but59% of the off-duty white officer victims are injured by themselves ortheir co-workers. On-duty black officer victims are similar to on-dutywhite officer victims in this aspect (27% were shot by themselves or otherpolice) but are quite different when off duty. Only 36% shot themselvesor were shot by other officers, compared to 59% for off-duty white officervictims. These figures may reflect the fact adverted to earlier,,that black.officers presumably spend more of their off-duty time in high-crime dis-tricts thati:do their white colleagues. -
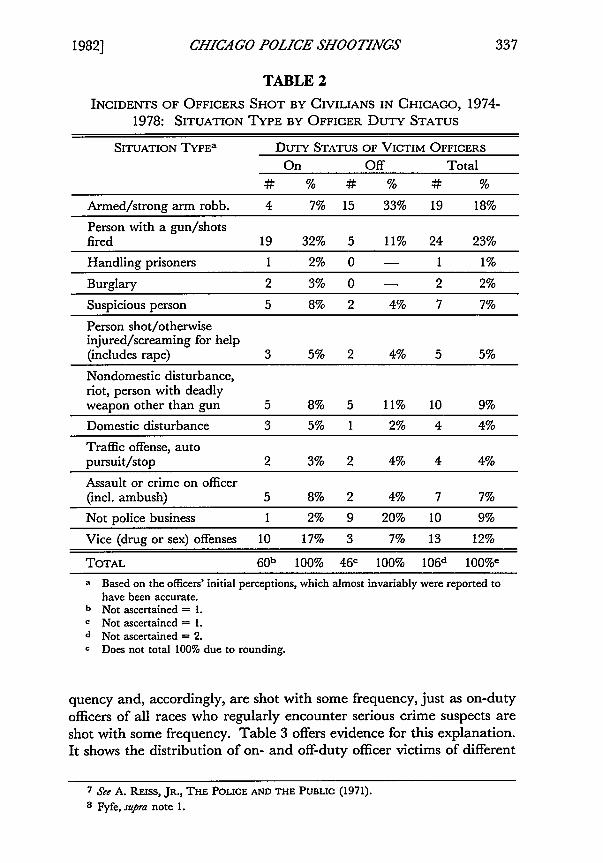
Table 6 considers the race of officer victims from a slightly, differentangle. It reveals their fatality rates, rather than their duty status, ac-cording to shooting type. The table, while based on small numbers,shows that a smaller percentage of the black officers who are shot arefatally injured (14%) than is true of white officers (20%). The percent-age of fatalities for black officers is lower regardless of whether the per-petrator is a civilian, the officer himself, or another officer. When theperpetrator is a civilian, white officers are five times as likely to surviveas they are to be killed (rates of 1.0 .versus 0.2), but black officers are tentimes as .likely to survive as they are to die (rates of 3.0 versus. 0.3)-
Combining officers of all races, a relatively high fatality rate (26%)is associated with self-inflicted shootings, the result of the inclusion ofofficer suicides among these incidents. If suicides are excluded, only 10%of the officers who shot themselves died. This low rate was anticipatedbecause accidental shootings normally involve a single, unaimed shot.Officers shot by civilians stand a better chance of survival (86% live)than civilians shot by police (only 74% live). This difference is probablydue to differences in the number of shots fired, caliber of weapons andtype of ammunition used, marksmanship of the shooters and defensivetactics employed by the victims.
Shootings of civilians by police and shootings of police by civilians
[Vol. 73
1982] CHICAGO POLICE SHOOTINGS 343
TABLE 6
POLICE SHOT IN CHICAGO, 1974-1978: SHOOTING TYPE BY
RACE AND INJURY OF OFFICER VICTIMS
SHOOTING TYPE RACE OF OFFICER VICTIMS
White Black Hispanic TOTAL
(1) By #= 64 39 2 105Civilian Total Ratea 1.2 3.4 1.7 1.6
Woundd- Wb _i W K V K 3y KKiled 54 10 35 4 1 1 90 15&ralown 1.0 0.2 3.0 0.3 0.8 0.8 1.4 0.2%W&K= 184% 16% 90% 10% 50% 50% 86% 14%
(2) Self- Total 37 13 0 50Inflicted 0.7 1.1 - 0.8
Wounded- 3y K W K W K W KKill'd 27 10 10 3 0 0 37 13breakewn 0.5 0.2 0.9 0.3 - - 0.6 0.2
73% 27% 77% 23% - - 74% 26%
(3) By Other 7otal 10 6 1 17Officers 0.2 0.5 0.8 0.3
Wounded- W K W K 3y K A KKilled 8 2 5 1 1 0 14 3lreakdown 0.2 0.04 0.4 0.1 0.8 - 0.2 0.1
80% 20% 83% 17% 100% - 82% 18%
TOTAL Total 111 58 3 172d
2.1 5.0 2.5 2.6
Woundd- W K K A K w KKilld 89 22 50 8 2 1 141 31&reakdeon 1.7 0.4 4.3 0.7 1.7 0.8 2.1 0.5
90% 20% 96% 14% 67% 33% 82% 18%
a All rates = average annual number of officers shot by civilians per 1,000 officers of the indicated race
on the Chicago police force.b "W" = wounded.c "K" killed.d Not ascertained = 15.
are similar in the patterns which emerge when considering the races ofboth the civilians and officers involved in shooting incidents. In part Iof this article, we indicated that shootings of civilians by police are in-traracial events more often than might be expected. This is true to aneven greater extent for shootings of police by civilians, as Table 7 shows.
Just as black officers and civilians are overrepresented (for the vari-ous reasons stated) in shootings of civilians by police, Table 7 shows thatblack officers are nine times more likely to be shot by black civiliansthan white officers are to be shot by white civilians (rates of 2.7 versus0.3). Further, black officers are five times more likely to be shot by blackcivilians than are white officers (rates of 2.7 versus 0.6). Conversely,black officers are far less likely to be shot by white civilians than aretheir.white colleagues (rates of 0.0 versus 0.3). Indeed, over the five

GELLER AND KARALES[Vl
TABLE 7
INCIDENTS OF POLICE SHOT BY CIVILIANS IN CHICAGO, 1974-1978: OFFICER RACE BY CIVILIAN RACE
RACE OF CIVILIAN RACE OF OFFICER VICTIMS
SHOOTERS White Black Hispanic Total
White Number 15 0 0 15Ratea 0.3 - - 0.2
Number 34 31 0 65Rate 0.6 2.7 - 1.0
Hispanic Number 9 1 2 12Rate 0.2 0.1 1.7 0.2
Number 58 32 2 92bRate 1.1 2.8 1.7 1.4
a All rates = average annual number of officers shot per 1,000 officers of the indicat-
ed race on the police force.b Not ascertained = 6 incidents.
years studied, white civilians shot fifteen white officers, but not a singleblack or Hispanic officer.1 2 Thus, as was the case with police who shotcivilians, it may be difficult to explain shootings of police in terms ofracial animosity by the shooter towards the victim, although again wecaution that our data are insufficient for drawing confident conclusionsabout racial motivation. This does not mean, of course, that an easingof racial tensions between police and the civilian population would notbenefit both police officers and civilians by reducing violent interactionsthat lead to serious injuries of each. Several avenues for attempting toreduce the number of police-involved shootings in years to come are dis-cussed later in this article.
II. FACTORS ASSOCIATED WITH VARIATIONS IN SHOOTINGS
OVER TIME
The analysis in part I and, thus far, in part II of this article hascombined the five years of shooting data rather than considered how thenumber and characteristics of shootings might differ from year to year.It is also important to examine changes over time. Such changes mayevidence progress or lack of progress in controlling shootings and maysuggest fruitful strategies for controlling shooting frequency.
In part I of this article, dramatic increases and decreases were noted
12 The fact that no black police officer was shot by a white civilian may be explained by a
number of factors, including limited assignment of black officers to white residential areas,fewer white than black civilians who shot officers, the units of assignment of black officers andthe low percentage of black officers in the Department.
[Vol. 73

CHICAGO POLICE SHOOTINGS
in the number of civilians shot by police from year to year. This sectionseeks possible explanations for those variations. If such explanations canbe found, they may facilitate the efforts of police administrators andothers to reduce the frequency of shootings in the future.
The pattern which this section will examine is depicted in Figure 2.The figure adds 1979 and 1980 shootings to the five years, 1974-1978,which are the primary focus of the preceding discussion. (Time con-straints precluded us from collecting data on the characteristics of the1979 and 1980 shootings, but we have no reason to believe these shoot-ings differed substantially in kind from shootings in the years studied.)
Some of the annual percentage changes reflected in Figure 2 aresubstantial: The drop from 148 shooting victims in 1975 to 79 in 1976 isa 47% decrease; shootings in 1978 were down 38% from 1977, but then
FIGURE 2
CIVILIANS SHOT BY POLICE IN CHICAGO, 1974-1980
# Shot
150(137
140
130
120
110
100 (98) (99)
90 (84)
80-
70
60 (61)
50
40
30
20
0 '-1974 1975 1976 1977 1978 1979 1980
1982]

GELLER AND KARALES
rose again by 38% percent in 1979. Despite this "roller coaster" pattern(some of which is to be expected when dealing with numbers as small,statistically speaking, as these), an overall decrease of 26% was registeredfrom 1974 to 1980; the endpoints of the series are presented in Figure 2.While some encouragement may be taken from this overall decrease, theincrease from 1978 to 1980 represents an upward movement of 62% inthe number of civilians shot by police. Even though we lack the requi-site data to examine the nature of the shootings in 1979 and 1980, anincrease as dramatic as this seems cause for concern.
Several possible explanations for changes in the annual number ofshootings will be considered below:
(1) changes in the opportunities for shootings, as indicated by variationsover time in the number of forcible felony arrests;(2) annual differences in the "accuracy" of police gunfire;(3) annual variations in the number of police officers shot by civilians;and(4) departmental initiatives relating to training, discipline, weaponry,and operations. In this context, variations in the "types" of shootingswhich occur from year to year will be examined.
A. FORCIBLE FELONY ARRESTS
As indicated in part I of this article, the theoretical connection be-tween shootings of civilians and forcible felony arrests is that such arrestsmay give some measure of the number of police-civilian encounters withthe potential of ending in shootings. Forcible felony arrests were usedfor analysis rather than other categories of arrest (e.g., Index Crimes orall offenses) because forcible felonies are offenses that justify shootingsunder Illinois law.' 3 One would expect the number of shootings overtime to reflect changes in the number of encounters which present "op-portunities" for shootings. To explore this point, we correlated thequarterly numbers of forcible felony arrests and civilian shooting victimsfrom 1974 through mid-1980.14 The figures used for this correlation areshown in Table 8.
Analysis of the figures in Table 8 shows a positive correlation of .64between the two events.' 5 The +.64 correlation coefficient suggests that
13 See discussion of Illinois law in part I of this article. Forcible felonies include crimes ofpersonal violence and burglary.
14 Forcible felony arrest data were not available beyond the second quarter of 1980.
Quarters were used instead of years in order to have more points for the correlation analysis.15 The range for a correlation is from -I to +1, with negative values suggesting inverse
relationships and positive values suggesting similar movement between two variables. Valuesclose to zero suggest a lack of relationship. The process of deriving quarterly counts for forci-ble felony arrests was unexpectedly complicated. The Police Department was not able tosupply records of arrests by months or quarters-only by its "police periods." Each year
[Vol. 73

CHICAGO POLICE SHOOTINGS
changes in the frequency of shootings are only partially the result ofchanges in the opportunity structure as indicated by the frequency offorcible felony arrests. Accordingly, other explanations must be soughtfor variations in shoo~ngs over time. Another way to put this is that thenumber of persons ar'rested for forcible felonies may not be a sufficientmeasure of the population at risk of being shot by police. This is not todeny that most of the shootings in our data set are out-growths of forci-ble felonies. Rather, the correlation suggests that the total number ofcivilians shot over time is not simply a function of the frequency withwhich forcible felony arrests occur.
Examining the annual changes in shootings and forcible felony ar-rests from 1974 through 1979 may help illustrate the association be-tween these two events in a somewhat less technical way. Table 9 showsthese data. The table shows a continual decrease in the number of forci-ble felony arrests every year until 1979, when such arrests were upslightly. (The continual decrease in arrests could be the result of popu-lation shifts from the city to the suburbs. Unfortunately, we were un-able to obtain annual population estimates for the city.) Against thisclear downward trend is the up-and-down pattern of shootings. If varia-tions in opportunities, as indicated by the frequency of arrests for seriouscrimes, were the key explanation for variations in the number of policeshootings, a clear downward trend would be evident in the number ofcivilians shot each year. Yet shootings were up in 1975 and 1977 despitedecreases in arrests. The parallel movement of shootings and arrests in1976, 1978 and 1979 is made much less significant than it might other-
contains 13 police periods, which are 28 days long and have an identical number of weekendsand weekdays. These periods are used by many police departments for research purposes sothat comparable units of time will be available for the analysis of crime and other events. Weelected to extrapolate quarterly arrest counts from these figures for police periods. We discov-ered, however, that twice during the seven year period for which we ran the correlation theDepartment let a week pass between the end of one year's 13th period and the beginning ofthe following year's first period. This is done, apparently, so that the first police period of ayear will always start near the beginning of that calendar year. To accomplish this result,however, adjustments in the police period calendar do not have to be made nearly as often asthe Department makes adjustments. It would take many years for the first police period toshift so much that it no longer fell in January. The adverse consequence of frequent adjust-ments is exemplified by our attempt to estimate the number of forcible felony arrests: twoweeks of arrests are missing from the compilations made by the Department. This is not amanipulation of arrest statistics for cosmetic purposes, because calendar year arrest totals aremaintained and are available from the Department, but the Department's practice with re-spect to police period arrest data does not seem ideally suited to its ostensible research goals.
1982]

GELLER AND KARALES
TABLE 8
DISTRIBUTION OF CIVILIANS SHOT BY POLICE & FORCIBLE
FELONY ARRESTS IN CHICAGO, BY QUARTER,
1974-MID-1980
YEAR # OF CIVIL- # OF FORCI- SHOOTINGSAND IANS SHOT BLE FELONY PER 1,000
QUARTER BY POLICEa ARRESTSb F.F. ARRESTS
1974 1 23 5,966 3.862 27 6,064 4.453 37 6,138 6.034 50 5,650 8.84
1975 1 42 6,763 6.212 40 6,531 6.123 36 5,357 6.724 30 5,965 5.03
1976 1 21 5,905 3.562 23 5,594 4.113 18 5,650 3.194 17 4,896 3.47
1977 1 24 4,639 5.172 27 4,823 5.603 23 5,053 4.554 24 4,352 5.51
1978 1 17 4,354 3.902 10 4,711 2.123 21 4,744 4.424 13 4,496 2.89
1979 1 21 4,243 4.952 24 4,677 5.133 18 4,919 3.664 21 4,824 4.35
1980 1 16 4,564 3.512 29 4,886 5.94
(r = +.64; r 2 = .41)a These are the total numbers of civilians shot by police, including accidental events.
While accidents are sometimes not related to criminal activity, the data display afairly consistent percentage of accidental shootings (approximately 10%) from yearto year.
b Estimated figures.
[Vol. 73

CHICA GO POLICE SHOOTINGS
TABLE 9
ANNUAL NUMBER OF CIVILIANS SHOT BY POLICE AND FORCIBLE
FELONY ARRESTS IN CHICAGO, 1974-1979
# OF % CHANGE # FORCIBLE % CHANGECIVILIANS FROM FELONY FROM
YEAR SHOT PRIOR YR ARRESTS PRIOR YR
1974 137 - 25,860 -
1975 148 + 8% 25,544 - 1%
1976 79 -47% 22,236 -13%
1977 98 +24% 18,980 -15%
1978 61 -38% 18,193 - 4%
1979 84 +38% 18,663 + 3%
TOTAL 607 -39%a 129,476 -28%a
a Change from 1974 to 1979.
wise be because of the 1975 and 1977 patterns. 16 Even in the years withparallel movement, the percentage change in shootings was considerablydifferent from the percentage change in arrests.
Thus, it seems that the frequency of forcible felony arrests is onlyone among many possible explanations for the frequency of police shoot-ings of civilians. Another explanation may be changes in the accuracyof police gunfire from year to year.
B. ACCURACY OF SHOTS FIRED BY POLICE
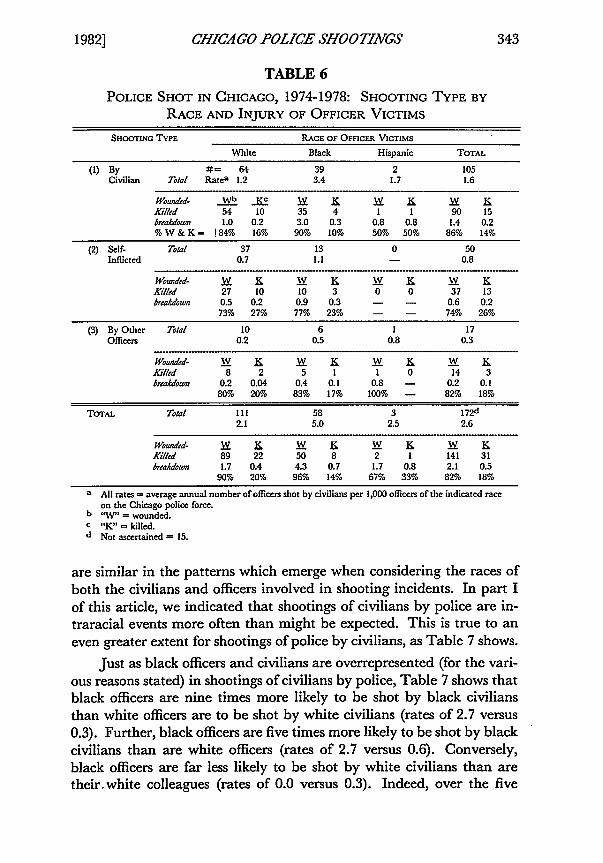
Data compiled but previously unreleased by the Chicago PoliceDepartment' 7 show the number of incidents in which Chicago policeofficers fired shots at criminal suspects, regardless of whether the in-tended victims were struck by the bullets. Unfortunately, these data areavailable only for three years, 1975-1977. But even this short time spanproves informative. Comparison of the Department's "shots fired" datawith our data on the number of incidents in which civilians were shot bypolice produces what might be called an "incident hit rate."' 8 This rate
16 The pattern of the first half of 1980 conforms to those of 1975 and 1977. That is,
comparison of the first two quarters of 1980 (shown in Table 8) with the last two quarters of1979 reveals that, in the first half of 1980, forcible felony arrests were down by 3% but shoot-ings of civilians were up by 15%.
17 An untitled statistical report compiled in 1978 at the direction of Acting Superinten-dent Michael Spiotto was the source of these data (hereinafter cited as SPIorTo REPORT).
18 This "hit rate" does not precisely address the question of accuracy of firing, but indi-
1982]
GELLER AND KARALES
TABLE 10
INCIDENTS OF SHOTS FIRED BY POLICE AND OF CIVILIANS
STRUCK BY POLICE BULLETS IN CHICAGO, 1975-1977
# OF SHOTS- # OF INCIDENTS % OF INCIDENTS
FIRED IN WHICH CIV- RESULTING IN
YEAR INCIDENTS ILIANS WERE SHOT "HITS"
1975 482 138 28.6%
1976 339 75 22.1%
1977 324 95 29.3%
TOTAL 1,145 308 26.9%
reflects the percentage of incidents reportedly involving shooting in whichone or more civilians were struck by police bullets. Table 10 shows theresults for the three years. The table shows a lower hit rate in 1976 than
appears in 1975 or 1977. We are uncertain why police gunfire in 1976
was less likely than in the preceding or subsequent years to strike civil-ians. One possible reason is that slightly fewer shots were fired per inci-dent in 1976 than in other years, as Table 11 shows.
According to Table 11, in 1976 an average of 2.7 bullets were firedper shooting incident, while a slightly higher average prevailed in 1975and 1977. This difference is so slight, however, that it is not much of anexplanation for a drop in the hit rate in 1976. Table 11 makes clear,however, that shooting accuracy was down in 1976, assuming that of-ficers were trying equally hard in all three years to strike civilians atwhom they fired. In 1976, only 11.3 bullets of every 100 bullets fired atcivilians hit their targets. The percentage of bullets that hit civilians in1975 was 14.7, and in 1977 it was 16.6. For the three years combined,an average of 14.3 of every 100 bullets fired struck someone. These datasuggest that an officer's ability to strike a civilian at whom he fires prob-ably is the result of factors other than aim (e.g., number of shots fired,shooting type, distance between shooter and opponent, etc.).19 In addi-tion, we may note in passing that whether an officer kills a civilian atwhom he shoots would seem to be more a matter of chance than ofsharpshooting; the marksmanship required for sharpshooting seems tobe lacking since 85.7% of all shots fired at civilians do not make contact.
cates how many of the encounters in which police fired bullets at civilians produced gunshotwounds. To examine accuracy more directly, one would need to compare the number ofbullets fired at civilians with the number of bullets that struck civilians. This comparison ismade later in the text.
19 An officer is likely to fire more shots the closer and more dangerous his opponent is.
[Vol. 73

CHICAGO POLICE SHOOTINGS
TABLE 11
HIT RATE OF BULLETS FIRED BY POLICE IN CHICAGO,
1975-1977
# OF BULLETS AVERAGE #
# OF BULLETS WHICH % RESULTING BULLETS
YEAR FIRED STRUCK IN HITS FIRED/INC.a
1975 1,481 217 14.7% 3.1
1976 918 104 11.3% 2.7
1977 959 159 16.6% 3.0
TOTAL 3,358 480 14.3% 2.9a In computing the average annual number of bullets fired per incident, the incident count
is taken from Table 10.
This does not necessarily mean that officers are incompetent or poorlytrained in the use of their weapons. Rather, it may simply indicate thatthe average shooting situation does not permit precise or accurateaiming.20
Another possible explanation for the low incident hit rate in 1976 isthat police officers, cognizant of the more deadly capacity of their newlyacquired "hollow point" ammunition-and of strong community objec-tions to its use-may have made greater use of warning shots in theseveral months after the ammunition was furnished. Data compiled bythe Police Department, however, tend to refute this hypothesis. They doindicate a slight, possibly random increase in 1976 in the percentage ofshots fired as warnings (21% in 1976 compared to 18% in 1975). But ajump of 27% is reported for 1977, when the hit rate improved and, con-sequently, one would have anticipated a lower percentage of warningshots.21 It is possible, however, that reports of warning shots are notparticularly accurate. It is possible that officers were criticized by super-iors for poor marksmanship in 1976 and that the officers responded in1977 partly by improving their accuracy and partly by reporting someof their misses as warning shots.
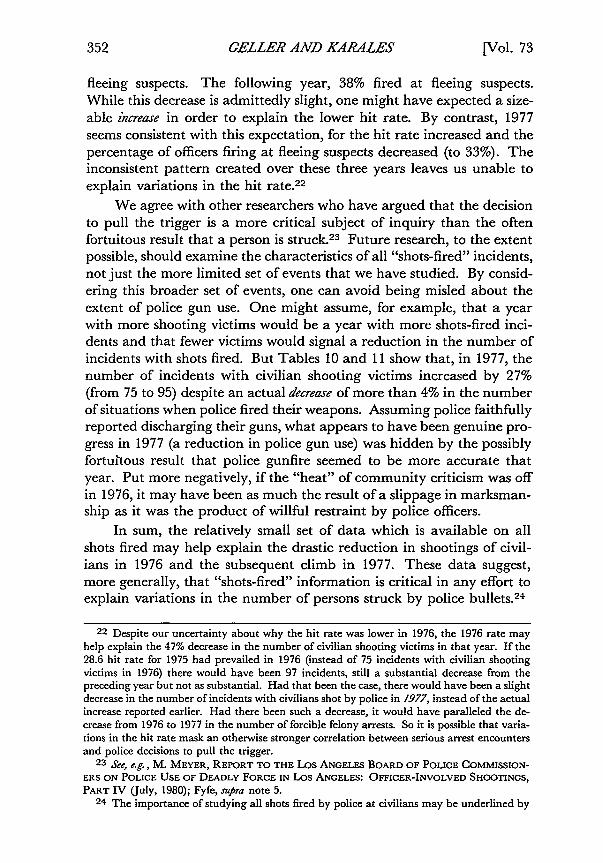
Yet another explanation for the lower hit rate in 1976 may befound if officers fired at a proportionally higher number of fleeing sus-pects that year, suspects whose motions made them harder to hit. Butagain the Department's research seems to point in the opposite direc-tion. In 1975, 40% of all officers who fired their weapons aimed them at
20 These data, along with empirical findings concerning New York and other cities, serve
to debunk the Hollywood-generated myth of the police officer who can shoot accurately
enough to "wing" rather than risk killing a fleeing suspect. See, e.g., Fyfe, supra note 5, at 129.21 See SPiorro REPORT, supra note 17, at 18.
1982]
GELLER AND KARALES
fleeing suspects. The following year, 38% fired at fleeing suspects.While this decrease is admittedly slight, one might have expected a size-able increase in order to explain the lower hit rate. By contrast, 1977seems consistent with this expectation, for the hit rate increased and thepercentage of officers firing at fleeing suspects decreased (to 33%). Theinconsistent pattern created over these three years leaves us unable toexplain variations in the hit rate.22
We agree with other researchers who have argued that the decisionto pull the trigger is a more critical subject of inquiry than the oftenfortuitous result that a person is struck. 23 Future research, to the extentpossible, should examine the characteristics of all "shots-fired" incidents,not just the more limited set of events that we have studied. By consid-ering this broader set of events, one can avoid being misled about theextent of police gun use. One might assume, for example, that a yearwith more shooting victims would be a year with more shots-fired inci-dents and that fewer victims would signal a reduction in the number ofincidents with shots fired. But Tables 10 and 11 show that, in 1977, thenumber of incidents with civilian shooting victims increased by 27%(from 75 to 95) despite an actual decrease of more than 4% in the numberof situations when police fired their weapons. Assuming police faithfullyreported discharging their guns, what appears to have been genuine pro-gress in 1977 (a reduction in police gun use) was hidden by the possiblyfortuitous result that police gunfire seemed to be more accurate thatyear. Put more negatively, if the "heat" of community criticism was offin 1976, it may have been as much the result of a slippage in marksman-ship as it was the product of willful restraint by police officers.
In sum, the relatively small set of data which is available on allshots fired may help explain the drastic reduction in shootings of civil-ians in 1976 and the subsequent climb in 1977. These data suggest,more generally, that "shots-fired" information is critical in any effort toexplain variations in the number of persons struck by police bullets.2 4
22 Despite our uncertainty about why the hit rate was lower in 1976, the 1976 rate may
help explain the 47% decrease in the number of civilian shooting victims in that year. If the28.6 hit rate for 1975 had prevailed in 1976 (instead of 75 incidents with civilian shootingvictims in 1976) there would have been 97 incidents, still a substantial decrease from thepreceding year but not as substantial. Had that been the case, there would have been a slightdecrease in the number of incidents with civilians shot by police in 1977, instead of the actualincrease reported earlier. Had there been such a decrease, it would have paralleled the de-crease from 1976 to 1977 in the number of forcible felony arrests. So it is possible that varia-tions in the hit rate mask an otherwise stronger correlation between serious arrest encountersand police decisions to pull the trigger.
23 See, e.g., M. MEYER, REPORT TO THE Los ANGELES BOARD OF POLICE COMMISSION-ERS ON POLICE USE OF DEADLY FORCE IN Los ANGELES: OFFICER-INVOLVED SHOOTINGS,PART IV (July, 1980); Fyfe, siira note 5.
24 The importance of studying all shots fired by police at civilians may be underlined by
[Vol. 73

CHICAGO POLICE SHOOTINGS
C. POLICE SHOT BY CIVILIANS
At the outset of this research, we were operating on the assumptionthat information on shootings of police officers by civilians was criticalfor an understanding of shootings of civilians. Our premise, formed af-ter literature review, was that the number of shootings of police officersby civilians provided a key index of the level of danger perceived bypolice and, accordingly, would be positively correlated with the numberof civilians shot by police. The data do not seem to support this notion.
The number of police officers shot by civilians during the five prin-cipal study years remained remarkably constant, at least after 1974: 31officers were shot by civilians victims in 1974, and 19, 18, 20, and 20were shot in the subsequent four years, respectively. A dramatic illustra-tion that shootings of police by civilians are only one among many indi-ces of police risk appears in the data for 1976, which show that 18officers were shot by civilians and that 17 officers suffered accidentalself-inflicted wounds. If shootings by fellow officers that year are added,police officers in 1976 actually were placed in greater jeopardy by them-selves and their colleagues than by armed criminal suspects.25
We tested the correlation between the relatively constant numberof officers shot by civilians and the widely fluctuating number of civil-ians shot by police and found, not surprisingly, virtually no relationship,positive or negative. Table 12 indicates the numbers used for the corre-lation. These numbers resulted in a correlation coefficient of +. 15,which suggests that the frequency with which civilians are shot by policein a given year does not vary with the number of officers shot by civil-ians.26 Thus, shootings of police by civilians do not seem to help explainchanges over time in the number of civilians shot by police. 27 Neither,then, does it appear that police shooting restraint is associated withchanges in the degree of danger to police from civilian gunfire.
considering the impression one might get of relative shooting levels in Chicago and Los Ange-les with less extensive information. From 1974 through 1978, Chicago police fired at an esti-mated 2,876 individuals, striking 523, killing 132 of them. Los Angeles police during thesame period fired at 611 persons, striking 377, killing 139 of them. MEYER, Mfpra note 23, at12, 15, 31. An examination of only "on-target" shots would be misleading as to the relativeamount of police gunfire in the two cities; a study which, like many studies, looked only atlevels offala/ shootings would be extremely misleading to the uncautious reader.
25 For some reason unknown to us, 1976 was an aberrant year for accidental self-inflictedpolice shootings, containing 43% of all such incidents that occurred during the five year studyperiod. The distribution of accidental self-inflicted shootings by police was as follows: 1974-10; 1975-7; 1976-17; 1977-2; 1978-4 (Total = 40).
26 A somewhat more sophisticated analysis could examine whether shootings of one type(either of or by police) may be a delayed reaction to the other type, as opposed to an immedi-ate reaction; that possibility appears to us to be remote.
27 While neither type of shooting is associated with the other on a systematic basis, for an
individual officer the risk of being shot may affect his likelihood of shooting a civilian.
1982]

GELLER AND KARALES[
TABLE 12
CIVILIANS SHOT BY POLICE AND POLICE SHOT BY CIVILIANS IN
CHICAGO, 1974-1978, PER QUARTER
YEAR AND CIVILIANS SHOT POLICE SHOT BY
QUARTER BY POLICE CIVILIANS
1974 1 23 72 27 123 37 44 50 8
1975 1 42 62 40 63 36 44 30 3
1976 1 21 22 23 53 18 74 17 4
1977 1 24 52 27 33 23 44 24 8
1978 1 17 42 10 73 21 54 13 4
TOTAL 523 108
D. DEPARTMENTAL INITIATIVES
Other researchers have demonstrated that restrictions in writtendeadly force policies have been followed by a marked, beneficial impacton the frequency of police-involved shootings. 28 We could not study theeffect of such policy change because the Chicago Police Department didnot change its written deadly force policy during the years studied. Tothe best of our knowledge, only two key initiatives were undertaken bythe Department during these years other than routine training on de-partmental policy and tactics, which were explicitly intended to controlshootings: (1) The creation, in the fall of 1974, of the Office of Profes-sional Standards; and (2) in-service classroom training in late 1977 and
28 See, e.g., C. MILTON, POLICE USE OF DEADLY FORCE (1977); Fyfe, supra note 5.
[Vol. 73

CHICAGO POLICE SHOOTINGS
early 1978 on departmental deadly force policy, shooting review proce-dures, and techniques for handling firearms. To the limited extent thatour data permit, we will attempt to identify the impact of these initia-tives and other departmental variables on the number and nature ofpolice shootings of civilians.
(1) Ojyie of Professional Standards
The Office of Professional Standards (O.P.S.) was established inlate 1974 in response to a protracted public debate about police brutal-ity in Chicago. The agency, under the authority of the Superintendentof Police, was given jurisdiction over police use of excessive force. O.P.S.investigates the use of non-deadly force only when someone (a civilianvictim or witness, police officer, O.P.S. staff) complains that the forcemay have been excessive. However, all police gunfire that hits someone(civilian or officer) is investigated by the agency, whether or not there isany initial doubt as to the justifiability of the shooting. Incidents inwhich police officers are shot by civilians are not automatically investi-gated by O.P.S. unless an officer also shoots someone during the sameencounter. The agency's staff2 9 gathers evidence about shootings fromthe involved officers, civilians, and witnesses and makes recommenda-tions to the Superintendent as to whether a shooting was justified or notunder applicable policy and rules. The O.P.S. is staffed by civilians,unlike its predecessor agency, the Internal Affairs Division of the De-partment. The I.A.D. continues in operation, but its jurisdiction encom-passes police conduct other than that involving use of force.
The ideal way to analyze the impact on shootings by police of theestablishment of O.P.S. would be to compare the number and types ofshootings that occurred over reasonably long periods of time prior toand after the creation of the agency. Unfortunately, we lack the requi-site data prior to the creation of O.P.S. The office was founded in 1974,and our data set commences in that year. Nevertheless, we note fromFigure 2, above, that shootings of civilians by police were at the highestpoint in any of the seven study years during 1975, the first full year ofO.P.S.' operation. One might argue that it took some time for O.P.S. toestablish a deterrent capability since shootings did fall off rather dra-matically a year later. We are not able to offer more than speculationon this point.
Since shooting frequencies before the creation of O.P.S. cannot beexamined, the best alternative is to measure the correlation over timebetween the number of O.P.S. decisions (explained below) and the
29 The number of investigators has grown from 33 in 1975 to 63 in 1981. Conversation
with O.P.S. Co-Administrator James Rosas (Jan. 12, 1981).
19821
GELLER AND KARALES
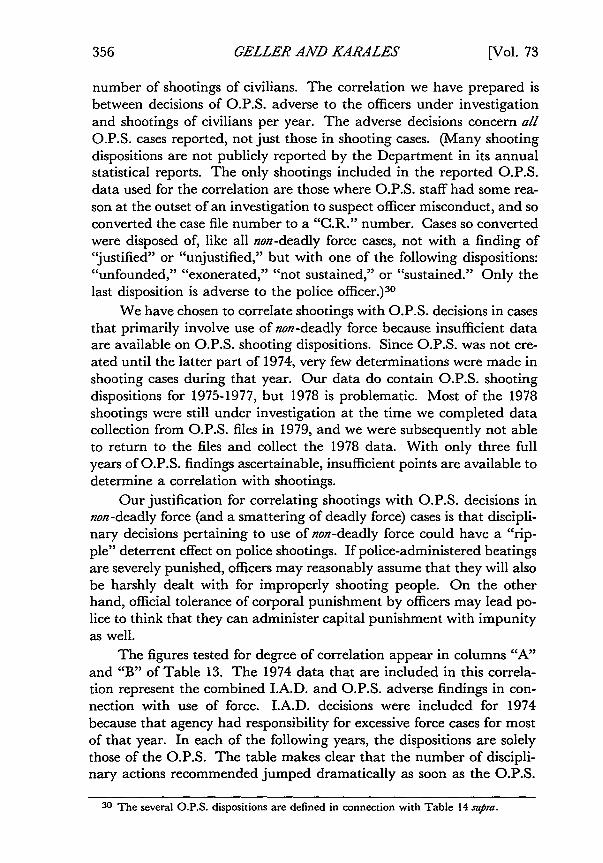
number of shootings of civilians. The correlation we have prepared isbetween decisions of O.P.S. adverse to the officers under investigationand shootings of civilians per year. The adverse decisions concern allO.P.S. cases reported, not just those in shooting cases. (Many shootingdispositions are not publicly reported by the Department in its annualstatistical reports. The only shootings included in the reported O.P.S.data used for the correlation are those where O.P.S. staff had some rea-son at the outset of an investigation to suspect officer misconduct, and soconverted the case file number to a "C.R." number. Cases so convertedwere disposed of, like all non-deadly force cases, not with a finding of"justified" or "unjustified," but with one of the following dispositions:"unfounded," "exonerated," "not sustained," or "sustained." Only thelast disposition is adverse to the police officer.)3 0
We have chosen to correlate shootings with O.P.S. decisions in casesthat primarily involve use of non-deadly force because insufficient dataare available on O.P.S. shooting dispositions. Since O.P.S. was not cre-ated until the latter part of 1974, very few determinations were made inshooting cases during that year. Our data do contain O.P.S. shootingdispositions for 1975-1977, but 1978 is problematic. Most of the 1978shootings were still under investigation at the time we completed datacollection from O.P.S. files in 1979, and we were subsequently not ableto return to the files and collect the 1978 data. With only three fullyears of O.P.S. findings ascertainable, insufficient points are available todetermine a correlation with shootings.
Our justification for correlating shootings with O.P.S. decisions innon-deadly force (and a smattering of deadly force) cases is that discipli-nary decisions pertaining to use of non-deadly force could have a "rip-ple" deterrent effect on police shootings. If police-administered beatingsare severely punished, officers may reasonably assume that they will alsobe harshly dealt with for improperly shooting people. On the otherhand, official tolerance of corporal punishment by officers may lead po-lice to think that they can administer capital punishment with impunityas well.
The figures tested for degree of correlation appear in columns "A"and "B" of Table 13. The 1974 data that are included in this correla-tion represent the combined I.A.D. and O.P.S. adverse findings in con-nection with use of force. I.A.D. decisions were included for 1974because that agency had responsibility for excessive force cases for mostof that year. In each of the following years, the dispositions are solelythose of the O.P.S. The table makes clear that the number of discipli-nary actions recommended jumped dramatically as soon as the O.P.S.
30 The several O.P.S. dispositions are defined in connection with Table 14 supra.
[Vol. 73

CHICAGO POLICE SHOOTINGS
was established. The increase from 32 in 1974 to 122 in 1975 representsa 281% jump in the number of adverse dispositions. Nevertheless, asindicated above, shootings were at a seven-year high in 1975. The corre-lation coefficient obtained for the figures in columns "A" and "B" ofTable 13 (ie., correlation between the number of civilians shot by policeand the number of findings of rule or policy violations) was -. 64. Thefact that the coefficient has a negative value suggests the existence of aninverse relationship between shootings and adverse decisions on excessiveforce complaints. The correlation is a moderately strong one. However,it was not possible for us to determine which event may have helpedcause the other, ie., whether changes in O.P.S. decisions affected thefrequency of shootings or changes in shootings affected the frequency ofO.P.S. adverse decisions. Nor could we determine whether the relation-ship might be a spurious one, with both shooting and adverse decisionsresponding to some other factor or factors. In any case, if either event is":causal," it is only one factor among several that may affect the fre-
TABLE 13CIVILIANS SHOT BY POLICE IN CHICAGO & O.P.S. DISPOSITIONS
OF EXCESSIVE FORCE INVESTIGATIONS, 1974-1979
"A" DISPOSITIONS
# OF CIVIL- "B"YEAR IANS SHOT ADVERSEa FOR OFFICERb TOTAL
1974 137 32c - 32c
1975 148 12 2 d (9%) 1,197 1,319
1976 79 123 (7%) 1,778 1,901
1977 98 174 (8%) 2,155 2,329
1978 61 166 (7%) 2,259 2,425
1979 84 154 (6%) 2,411 2,625
TOTAL 607 771 (7%) 9,860 10,631
Source: C.P.D., STATISTICAL SUMMARY (1974-1979).a Adverse = a violation of departmental rule or policy was found in connection with
officer's use of force.b For Officer = no violation of departmental rule or policy was found in connection
with officer's use of force.C Includes both I.A.D. and O.P.S. decisions on excessive force complaints. I.A.D.
statistics are reported for the period during 1974 (and holdover cases in 1975) whenI.A.D. handled charges of excessive force. Thereafter, all numbers are for O.P.S. Aportion of the complaints registered with O.P.S. are routed to the I.A.D. for investi-gation, since they fall within the jurisdiction which I.A.D. was given after the crea-tion of O.P.S. The only cases shown on this table, however, are those relating toO.P.S.' subject matter jurisdiction-use of force.
d -This number includes 15 holdover I.A.D. cases from 1974 and 107 O.P.S. cases.
1982]

GELLER AND KARALES [Vol. 73
quency of the other event. We may hypothesize, based on the -. 64 cor-relation coefficient, that, as adverse O.P.S. findings increase, shootingsdecrease and that, as such findings decrease, shootings increase. To theextent that this hypothesis is correct, O.P.S. excessive force determina-tions may help control police use of deadly force.
TABLE 14
O.P.S. DISPOSITIONS OF SHOOTINGS OF CIVILIANS AND POLICE
BY CHICAGO POLICE, 1975-1977
DISPOSITION YEAR
1975 1976 1977 Total
Adverse Findings:
Unjustifieda 1 2 3 6Sustainedb 8 7 2 17
............................................................................................................
Subtotal 9 9 5 23
Findings For Ofers:
Justifiedc 116 62 50 228Not Sustainedd 3 4 2 9
Exonerated" 14 3 23 40Unfounded f 1 1 1 3Accidental 0 6 6 12
............................................................................................................
Subtotal 134 76 82 292
TOTAL 143 85 87 3159
a Finding of rule or policy violation in a case where no misconduct was initially sus-
pected and hence the case was not converted to a "C.R." file number.b Allegation of misconduct was supported by sufficient evidence to justify disciplina-
ry action. Note: A considerable percentage of these findings was premised on ruleor policy violations during shootings deemed justified (e.g., use of unauthorized am-munition).
C Finding that shooting was within policy and rules in a case where O.P.S. had noreason at the outset to suspect misconduct and hence did not convert the investiga-tion to a "C.R." file.
d Allegation supported by insufficient evidence, which could not be used to prove ordisprove the allegation.
e Incident occurred, but action taken by officer(s) was deemed lawful, reasonable andproper.
f Complaint was not based on facts as shown by the investigation, or reported inci-dent did not occur.
g This total disagrees with total number of civilians shot in these three years (325)because the 315 figure includes some findings in cases where officers shot themselvesor fellow officers and excludes several dispositions of shootings of civilians where theresult was not ascertainable.
The O.P.S. decisions specifically dealing with shooting investiga-tions are indicated in Table 14. The number of adverse findings ascer-

CHICAGO POLICE SHOOTINGS
tained (total of 23, or 7% of all ascertained shooting dispositions for thethree years) is simply too small to work with for purposes of correlations.Thus, we cannot measure the relationship, if any, between rule and pol-icy violations found by O.P.S. in shooting cases, on the one hand, andshootings of civilians, on the other hand. Nevertheless, we would specu-late that well-publicized punishments of police officers for improperconduct during shootings could have a beneficial deterrent effect on po-lice shooting activity. This speculation could be tested in the future byanalysis of the frequency of shootings before and after well-publicizeddisciplinary measures taken by the Department against members forabuses of deadly force.31
(2) In-Service Deado Force Training
The other key initiative aimed at reduction of shootings by policethat was taken during our study period was a one-day, in-service, class-room training program on the use of deadly force. This program wasstarted in late 1977 and extended well into 1978. It was prompted by avariety of factors, principally community outcry after a series of late1977 shootings of teenagers, most of whom were black and were engagedin relatively minor misconduct or were the victims of unintentionalshootings.
For present purposes, the most important thing to note about thecontent of the training 32 is the key message which the Department at-tempted to convey to its members. Essentially, that message was thatofficers should, in accordance with departmental policy, shoot only as alast resort, to the extent possible without unduly jeopardizing them-selves. At roll call training, which supplemented the classroom instruc-tion, officers were explicitly told to exercise greater restraint in shootingfleeing burglary suspects, a type of shooting for which the Departmentwas receiving increasing public criticism.
A difficulty arises in testing the impact of this training. The diffi-culty is analagous to the obstacle we encountered in attempting to meas-
31 July 22, 1980, may provide an appropriate focal point for an interrupted time series
analysis. On this day, the Cook County State's Attorney and the Chicago Police Superinten-dent, in a joint press conference, announced murder indictments against three white Chicagopolice officers for the alleged beating death of a black man after an altercation on a subwayover the black man's reported refusal to obey the officers' orders to stop smoking. (In Decem-ber 1981, after a bench trial, one officer was acquitted of all charges and the other two werefound guilty of involuntary manslaughter and official misconduct.) Just hours after this pressconference, the Police Superintendent summoned the press again to announce suspension andthe filing of Police Board charges against another officer for allegedly accepting a $300 bribeto tamper with a pending case. See Chicago Tribune, July 23, 1980, § 1, at 1, col. 2, and § 4at 1, col. 3.
32 'For details of the training program, see W. GELLER & K. KARALEs, SPLIT-SEcOND
DECISIONS: SHOOTINGS OF & BY CHICAGO POLICE 244-47 (1981).
1982]

GELLER AND KARALES
ure the effect of O.P.S. decisions on shootings. Above, we lackedsufficient dataprior to the creation of O.P.S., here we lack sufficient dataafter the training was administered to conduct an adequate analysis ofimpact. We know the number of civilians shot by police in 1978, 1979and 1980, but we know the distribution of shooting types only from 1974through 1978.
Within these limitations, some speculations may still be possible.Considering only the number of civilians shot annually helps us to assessthe Police Department's suggestion 33 that the 1977-1978 training hadsome effect in reducing the number of shootings in 1978. (A 38% reduc-tion was experienced from 98 civilians shot in 1977 to 61 shot in 1978.)Whatever beneficial effect this training may have had was short-lived.As noted earlier, after the 1978 decrease the number of civilians shot bypolice has climbed steadily.
The annual distribution of shooting "types" provides another basisfor speculation about the effects of the re-training on shootings. Table15 depicts the types for the years 1974-1978, the only years for whichsuch data were available. This table shows that in 1978 shootings de-clined in nearly every category, except for Type 3. which had only oneshooting. A difficulty with simply crediting such reductions to the in-service training is that an even more dramatic, adross-the-board patternof reductions occurred in 1976, without the prompting, so far as weknow, of any special departmental initiative.3 4
Another way to examine the possible impact of the training pro-gram is to attempt to focus on the kinds of shootings that the trainingespecially discouraged: shootings that were not a last resort, shootings offleeing burglary suspects and shootings by off-duty officers who had
33 The Superintendent made the following points in his January 1979 report to the Chi-cago Police Board:
Deadly force statistics include all firearms uses by police officers when injury results,including firing at criminals, accidentally self-inflicted wounds, and suicides. In 1978 theChicago Police Department recorded a 22% decrease in these incidents from 1977, a 51%decrease from the number recorded in 1970. The 1978 experience represents the lowestnumber of these incidents since 1969. This decrease can be attributed to a combinationof factors; however, the marked decrease can be attributed to two prime factors: (1) theroll call training conducted by the command members of the Department on the subjectof deadly force and (2) the ongoing deadly force in-service seminar which is being re-quired for all sworn members of the Department. This full-day in-service course whichhas been reported to the Board since its inception is an intensive review of applicablestate law, Department General Orders, civil and criminal liability and a discussion ofpast incidents to surface and improve the attitudinal aspects for the participatingofficers.
REPORT OF THE SUPERINTENDENT TO THE PoucE BOARD OF CHicAGo 6 (Jan. 1979).34 One special patrol program which operated during 1975 was not repeated in 1976,
however, and this may help explain the 1976 decrease. The program was "Operation Satura-tion," an intensive patrol and arrest operation on public transit vehicles and other facilities.
[Vol. 73

1982] CHICAGO POLICE SHOOTINGS
TABLE 15
CIVILIANS SHOT BY POLICE IN CHICAGO, 1974-1978: SHOOTING
TYPES OVER TIME
SHOOTING TYPE YEAR
1974 1975 1976 1977 1978 Total
(1) Gun use/threat 80 61 41 51 31 264Col.% 58% 42% 52% 54% 51% 51%
(2) Other deadly weapon or phys- 14 26 11 11 10 72ical force use/threat
Col.% 10% 18% 14% 12% 16% 14%
(3) Other deadly weapon pos- 3 6 1 1 1 12sessed without threat
Col.% 2% 4% 1% 1% 2% 2%
(4) Flight without other resistance 21 25 18 15 10 89Col.% 15% 17% 23% 16% 16% 17%
(5) Other reasons for shooting in- 1 4 0 2 0 7tentionally
Col.% 1% 3% - 2% - 1%
(6) Accidental 10 18 8 10 6 52Col.% 7% 12% 10% 11% 10% 10%
(7) Mistaken Identity 2 1 0 1 0 4Col.% 2% 1% - 1% - 1%
(8) Stray Bullet 6 4 0 4 3 17Col.% 4% 3% - 4% 5% 3%
TOTAL 137 145 79 95 61 517aCol.% 100% 100% 100% 100% 100% 100%
a Not ascertained = 6.
been drinking. The training program discouraged such shootings in thesense that departmental officials indicated to the trainees that the De-partment would frown on such uses of police weapons. Our data, unfor-tunately, are not sensitive enough to respond to the question of "lastresort." Our inability to do so stems from the failure of the Depart-ment's firearms-use report or any other documented part of the reviewprocess to inquire routinely about the availability of other means ofresolving the situations short of deadly force.35
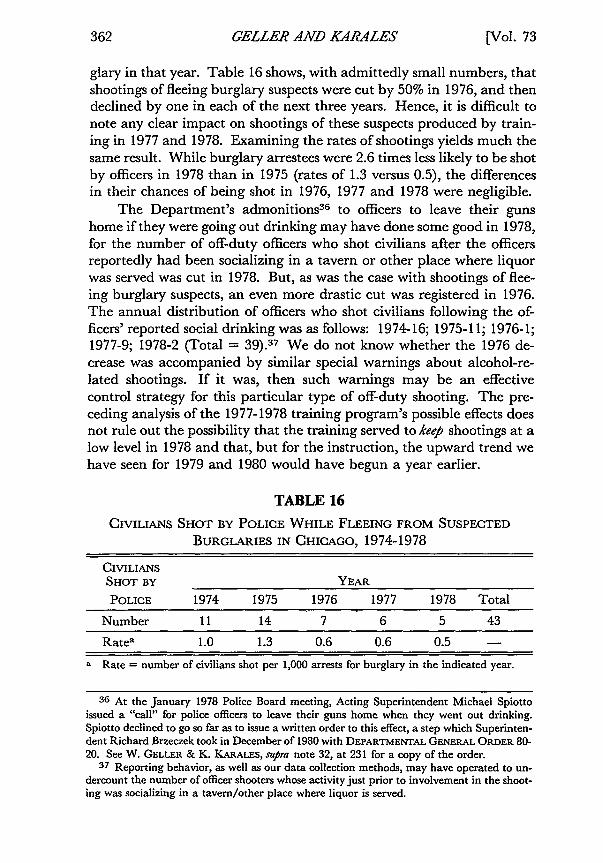
We can, however, address the question of how many fleeing bur-glary suspects were shot by police before and for a short period after thein-service training. Table 16 presents the number of fleeing burglarysuspects shot per year, as well as the rate at which they were shot. Therate represents the number of victims in a year per 1,000 arrests for bur-
35 Such questions should be included in an expanded firearms use report. This recom-mendation is made with an awareness that officers may be disinclined to answer such ques-tions and that incentives may need to be created to encourage truthful responses. Ste W.GELLER & K. KARALES, .sufra note 32, at 192-93.
GELLER AND KARALES
glary in that year. Table 16 shows, with admittedly small numbers, thatshootings of fleeing burglary suspects were cut by 50% in 1976, and thendeclined by one in each of the next three years. Hence, it is difficult tonote any clear impact on shootings of these suspects produced by train-ing in 1977 and 1978. Examining the rates of shootings yields much thesame result. While burglary arrestees were 2.6 times less likely to be shotby officers in 1978 than in 1975 (rates of 1.3 versus 0.5), the differencesin their chances of being shot in 1976, 1977 and 1978 were negligible.
The Department's admonitions36 to officers to leave their gunshome if they were going out drinking may have done some good in 1978,for the number of off-duty officers who shot civilians after the officersreportedly had been socializing in a tavern or other place where liquorwas served was cut in 1978. But, as was the case with shootings of flee-ing burglary suspects, an even more drastic cut was registered in 1976.The annual distribution of officers who shot civilians following the of-ficers' reported social drinking was as follows: 1974-16; 1975-11; 1976-1;1977-9; 1978-2 (Total = 39).37 We do not know whether the 1976 de-crease was accompanied by similar special warnings about alcohol-re-lated shootings. If it was, then such warnings may be an effectivecontrol strategy for this particular type of off-duty shooting. The pre-ceding analysis of the 1977-1978 training program's possible effects doesnot rule out the possibility that the training served to keep shootings at alow level in 1978 and that, but for the instruction, the upward trend wehave seen for 1979 and 1980 would have begun a year earlier.
TABLE 16
CIVILIANS SHOT BY POLICE WHILE FLEEING FROM SUSPECTED
BURGLARIES IN CHICAGO, 1974-1978
CIVILIANS
SHOT BY YEAR
POLICE 1974 1975 1976 1977 1978 Total
Number 11 14 7 6 5 43
Ratea 1.0 1.3 0.6 0.6 0.5 -
a Rate = number of civilians shot per 1,000 arrests for burglary in the indicated year.
36 At the January 1978 Police Board meeting, Acting Superintendent Michael Spiotto
issued a "call" for police officers to leave their guns home when they went out drinking.Spiotto declined to go so far as to issue a written order to this effect, a step which Superinten-dent Richard Brzeczek took in December of 1980 with DEPARTMENTAL GENERAL ORDER 80-20. See W. GELLER & K. KARALES, supra note 32, at 231 for a copy of the order.
37 Reporting behavior, as well as our data collection methods, may have operated to un-dercount the number of officer shooters whose activity just prior to involvement in the shoot-ing was socializing in a tavern/other place where liquor is served.
[Vol. 73

CHICAGO POLICE SHOOTINGS
Table 15 suggests in another way that variations in the number ofshootings from 1974 through 1978 were not highly influenced by depart-mental attempts to control shootings. If the Department had been ableto mount effective control strategies, the result presumably would bedisproportionate reductions in shootings which could be characterizedas "non-defense-of-life." The reason for this is that sincerely perceiveddefense-of-life situations would appear to be relatively unsusceptible tocontrol strategies, while situations perceived to be lower-risk encounterswould appear to be highly susceptible to regulation.3 8 But the patternof shootings reflected in Table 15 is inconsistent with this logic. The
FIGURE 3
CIVILIANS SHOT BY POLICE IN CHICAGO, 1974-1978:"DEFENSE-OF-LIFE" AND "NON-DEFENSE-OF-
LIFE" SHOOTINGS
# Shot
140--150. (148)
130-
120
110'
100('9) D,)(87)
90- enset,
80-
70-58)2 (61)
60 -e-C ot
50.( 43 0
40-- (33)
30' (27)
20- (20)
10
0 I I I1974 1975 1976 1977 1978
38 Following the New York City Police Department's adoption in 1972 of a restrictive
shooting policy which, as enforced, prohibited all but defense-of-life shootings, the Depart-
1982]

GELLER AND KARALES
pattern may be easier to see if shooting types are combined and depictedover time on a graph. Figure 3 does this. It combines shooting types 1and 2 from Table 15, which include the most serious civilian behav-iors-use of guns or other weapons against police officers or others-thatreportedly precipitated shootings. This group of shootings is called "de-fense-of-life" shootings for purposes of this graph. Figure 3 combinesinto a separate group the remaining six shooting types, which, with min-imal possible exceptions, are generally considerably less likely to placethe lives of the officer shooters in jeopardy. This group is referred to as"non-defense-of-life" shootings for present purposes.
Figure 3 shows that neither of the reductions in the total number ofshootings of civilians (1976 and 1978) was the result of reductionspn'ma-nily in "non-defense-of-life" shootings. In both cases, defense-of-lifeshootings decreased together with elective shootings. This parallel re-duction of both groups of shootings may suggest that fewer opportuni-ties for shootings presented themselves in 1976 and 1978 rather thanthat police avoided whatever shootings they could avoid.
It is interesting to note, as Figure 3 shows, that the increase from1974 to 1975 in the total number of civilians shot by police was pro-duced not by an increase in defense-of-life shooting (which actually de-clined slightly that year) but by a jump in the number of "non-defense-of-life" shootings. A fairly dramatic increase in the number of civiliansshot accidentally was registered in 1975, as Table 15 shows.
Calculations based on Table 15 also show, somewhat surprisingly,that in 1976, when shootings nose-dived 47% civilians shot for fleeingrepresented a larger percentage of total shootings (23% than they didduring any other year. As indicated earlier, one might well have ex-pected that a substantial overall decrease of the sort experienced in 1976would be attained by the virtual elimination of elective shootings of thiskind or at least a disproportionate reduction of them. Instead, there wasa lesser reduction of "flight" shootings in 1976 (28%) than there was ofdefense-of-life shootings (a combined decrease of 40% in shooting types 1and 2).
In sum, it is possible that departmental training in late 1977 and1978 may have done some short-range good in reducing the totalnumber of shootings of civilians; but it does not seem that specificallytargeted shooting types were reduced by that training. Additionally, itappears that, at most other times during the years for which we havedata, shootings of civilians by police officers drifted upward and down-
ment experienced a decrease of more than 80% in non-defense-of-life shootings. Fyfe, Adminis-trative Interventions on Police Shooting Discretion, 7 J. CRIM. JUST. 313 (1979).
[Vol. 73

CHICA GO POLICE SHOOTINGS
ward, sometimes dramatically, without significantly responding to anydepartmental shooting control strategies that may have been employed.
(3) Other Departmental Variables
This section has in no way exhausted the departmental factors thatmay affect the frequency of shootings, nor can it do so. Unlike someresearch efforts involving other police departments that have beenlaunched to study the impact on shootings of a specific, previously iden-tified departmental control strategy, this research has been primarily ex-ploratory. At the outset, neither the frequency of shootings nor theexistence of administrative efforts to reduce shootings was known to us.Aside from the two key initiatives just discussed-the creation of O.P.S.and the in-service training-the Department could not identify anyother measures that might have affected the frequency of shootings.Hence, we have searched through departmental documents for factorsthat could have some impact on shootings. These factors are not allcontrol strategies. Most of those over which the Department had con-trol were not designed with shootings in mind, but they may have theside effect of either increasing or decreasing the frequency of shootings.We have not tried to isolate specific factors and demonstrate a statisticalconnection between them and shooting rate changes, for the data andanalytic techniques necessary for such an undertaking were not avail-able as a result of various constraints. We have suggested, instead, con-ceptual connections between the various factors and shootingfrequencies. Identification of some of these departmental variables mayprove helpful to future researchers both within and outside theDepartment.
Programs like "Operation Saturation," a patrol operation notedearlier, could potentially increase the number of shootings by increasingthe number of police-civilian encounters. 39 In a similar vein, increaseduse of court summonses instead of arrests for minor offenses frees officersfor more "preventive patrol" and, potentially, for more contacts relatingto serious offenses. Moreover, the use of furloughed and off-duty officersunder special employment programs to compensate for the Depart-ment's reported shortage of personnel 4 can affect the number of police-
39 According to the Police Department, the program's "heavier and strategic police pa-trols on Chicago's public transportation system . . . resulted in a 50% decrease in C.T.A.crime during 1975. The unit challenged 127,000 persons regarded as suspicious, made 48,170arrests for various crimes, and confiscated 1,606 guns." CHICAGO POLICE DEPARTMENT,
STATISTICAL SUMMARY 15 (1975).40 Despite a reported shortage of 1,000 employees, the total number of sworn personnel
indicated by computer printouts supplied for this study by the Department remained remark-ably consistent from year to year. These numbers are as follows: 1974-13,203; 1975-13,149; 1976-13,363; 1977-13,443; 1978-13,309; 1979-13,203; 1980-12,730; 1981-
1982]

GELLER AND KARALES
civilian contacts by placing more officers on the streets. In addition,increased use of civilian employees for desk assignments also frees moresworn personnel for patrol. On the other hand, the deployment of un-armed Transit Safety Aides on the public transit system could decreasethe number of police-civilian contacts since the Aides are able to handleminor problems that otherwise may be referred to sworn police officers.
Not only the number of officers on the streets but the characteristicsof these officers may affect shootings. The return to street duty of of-ficers who had been in desk jobs for some time may help explain anincrease in the number of accidental shootings, shootings of fleeing sus-pects and shootings of suspects wielding weapons other than guns. (SeeTable 15.) More "street wise" officers, arguably, may keep their coolbetter in such situations and resolve them without resort to deadly force.In addition, the use of off-duty officers and those on furlough for activeduty may place on the streets a group of personnel who are more physi-cally and emotionally drained than is normally the case. Such officersmight not be as effective as other officers in avoiding shootings.
Just as the placement on the streets of tired officers or officers with-out current street experience could lead to an increase in shootings, pro-grams which enhance supervision of patrol officers may deter avoidableshootings. One such program, introduced by the Department in late1975, uses "patrol specialists," experienced police officers who work withrecruits during their advanced field training in the districts.41 Similarly,the appointment of large numbers of temporary or permanent sergeantscould reduce shootings through enhanced field supervision of both ex-perienced officers and inexperienced ones. The "supervisory sector con-cept of supervision," introduced in 1976, also provides additionaloversight and evaluation of patrol officers by sergeants. The appoint-ment of large numbers of sergeants also could have an impact on shoot-ings because such appointments would probably reduce the number ofpatrol officers and, thus, the number of officer-civilian encounters.
Other factors that may affect shooting frequencies by increasing or
12,340. Figures for 1979-1981 were quoted in an interview with Police Superintendent Rich-ard Brzeczek. Oberman hits police, fre items of budget, Chicago Sun-Times, Nov. 24, 1980, at 2,col. 1.
41 One announced goal of the patrol specialist program was to "help weed out any re-cruits who, in the opinion of the patrol specialists, won't be able to stand the stress." PatrickNeedham, Dep. Supt., Bureau of Administrative Services, C.P.D., quoted in Wattley, Vet Copsto Test Rookie Fitness, Chicago Tribune, July 29, 1977 § 3, at 4, col. 6. Then-SuperintendentJames Rochford, in announcing the completion of training for the patrol specialist job of 238veteran officers, indicated that this "training was designed to enable them to recognize anypsychological difficulty being experienced by probationary officers that might impede theirprogress toward becoming effective police officers." Rochford indicated that the specialistswould meet several nights a week with psychiatrists to discuss questions they may have aboutthe recruits. Id
[Vol. 73
CHICAGO POLICE SHOOTINGS
decreasing opportunities for shootings are variations in the number ofcalls for service and radio dispatches. Calls for service may provide notonly an indirect index of police-civilian contacts, but also a surrogatemeasure of the degree to which the community wants to involve policein the solution of its daily problems. Dispatches provide an alternativeto arrest figures for gauging the frequency of police-civilian contacts,although dispatches would not reflect officer-initiated contacts or en-counters that resulted from civlians flagging down police on the streets.
Increases or decreases in the relative accessibility of guns on thestreets, as reflected in the number of firearms homicides or gun confisca-tions in a given time period, may also impact on shooting frequencies.The more guns, the greater the perception of danger officers may have.Such differences in gun availability would probably have to be substan-tial, however, to have any effect on police shooting behavior. 42
Finally, changes in the frequency of range firing for sworn person-nel may have some impact on their confidence in and competence withtheir weapons. When the Department made its controversial switch to"hollow point" ammunition in 1975, officers began receiving twice-a-year range practice, instead of the annual practice which had prevailedfor some time. Extra instruction in the safe handling of sidearms andshotguns, which may be part of roll call training or in-service programsat the Police Academy, may also have a beneficial impact in reducingshootings, especially accidental ones.
Future research could explore the effect of these and other factorsthrough multivariate analysis and other appropriate statistical tech-niques. While none of these factors seems as dramatic as a change in awritten deadly force policy, they represent the kind of subtle opera-tional, supervisory and training initiatives which, collectively, could seta "tone" that will affect officer shooting discretion.
III. RECOMMENDATIONS-SHOOTING CONTROL STRATEGIES
The object of any control strategy is to limit the frequency of shoot-ings that are avoidable (a considerably larger group of incidents thanthose which are illegal or beyond departmental policy). Some shootingsby and of police simply do not seem avoidable, even with the benefit ofhindsight. Still, a great many of the incidents we studied might havebeen susceptible to nonlethal, safe solutions.43 The data in this studyand in other empirical research suggest that police-involved shootingsmay be amenable to a variety of control strategies. The data also sug-
42 See genera/(y S. BRILL, FIREARM ABUSE: A RESEARCH AND PoLIcY REPORT (1977).
43 For a listing of factors bearing on the avoidability of shootings, see W. GELLER & K.KARALEs, supra note 32, at 180-81.
1982]

GELLER AND KARALES
gests, however, that no single strategy seems suitable for the reduction ofall types of shootings.
The several control strategies set forth in this section are attemptsto prevent shootings that are avoidable for any of a variety of reasons.44
Most of the strategies presented are closely related to a number of keyfindings, which are summarized briefly now and developed more fully asnecessary in the course of presenting specific strategies. Of primary im-portance is the implication of the typology (depicted in Figure 1 in partI of this article and in Table 15 in this part) that at least a third of allshootings of civilians by police are prompted by civilian conduct thatdoes not immediately jeopardize the lives of responding officers or thepublic at large. Hence, rules prohibiting certain types of shootings havethe potential to save lives without imposing unreasonable 45 risks on po-lice or other innocent persons.
Although rule changes may fill a need with respect to reduction ofintentional shootings by police, they do not seem well-suited to correctingbad habits (e.g., carrying guns in the cocked position) which have led toa large number of accidental shootings-shootings in which both civil-ians and police have been the victims. Accordingly, strategies areneeded that show promise of controlling both "elective" and uninten-tional shootings. Rule changes also show little promise of providing of-ficers with the non-lethal tactical skills (e.g., techniques for approachingsuspects) that probably could help them avoid intentionaly shooting orbeing shot by a number of civilians. Tactical training and training inweapons handling, therefore, seem to be very important controlstrategies.
But the crime situations where the most tactical training may berequired are not necessarily those which are currently given the greatestemphasis in police academies. For example, considerable attention isdevoted (admirably) to the non-violent resolution of domestic disputes,but relatively little time is spent on techniques for approaching the sceneof a suspected robbery. These training priorities may be premised onthe belief, contradicted by our data, that police face greater hazardsfrom quarreling family members than from robbery suspects.
Just as the data suggest that police perceptions of police shootingsmay be incorrect on the dimension of the relative danger posed by dif-ferent crime situations, so our analysis, while inadequate to be conclu-sive, casts some doubt on the belief, widely held in some segments of thecommunity, that racism is responsible for a large proportion of police-
44See text accompanying note 50 infra.45 Value choices are involved in deciding whether the risks are reasonable or not, and we
recognize that fair-minded people can reach different conclusions on this point.
[Vol. 73
CHICA GO POLICE SHOOTINGS
involved shootings. While efforts to erase racial tensions between policeand the community are obviously desirable for many reasons, it is possi-ble such efforts may not produce a marked reduction in the frequency ofpolice shootings.
The data address another issue with important implications for cer-tain policy development proposals-specifically, those proposals whichrecommend shortening the list of felonies that justify use of deadly forceto capture fleeing suspects. Such proposals typically involve strikingburglary from the list. Our findings raise questions about whether sucha reform approach is ideal, although we concede that it would be prefer-able to leaving the current Chicago policy unchanged.46 Deadly forcepolicies which, like Chicago's, deal with the fleeing suspect situation bylisting specific offenses, are usually premised on one key generalization:that persons who may have committed these offenses are sufficiently vio-lence-prone that they are likely to inflict serious injury on someone inthe near future if not apprehended immediately. Whether or not thisgeneralization is accurate is open to debate. Our data do not addressthe point of fiture violence. What -the data do show, however, is thatamong the 523 civilians shot by police during our study period not allexhibited violent behavior even at the time they were shot. Indeed, theburglary suspects shot by police most often were shot for fleeing, andthere was little evidence in police records that the shooting officers hadany basis for suspecting that the alleged burglaries involved personalviolence.47 The probably accurate generalization that burglars typicallydo not inflict injury on crime victims underlies the reform proposals tostrike burglary as a shooting justification. The problem with any ap-proach that involves such generalizations is that these generalizationshave important exceptions.
Some of the burglary suspects shot by police in our study were firedupon after threatening officers with deadly weapons. Those who wouldeliminate burglary from the list of shooting justifications could accu-rately respond that such suspects could still be shot by police, even afterburglary was deleted, in light of the officer's right to defend his or an-other person's life. Generalizations about future dangerousness, we sub-mit, are likely to lead officers to unthinking, categorical responses tofleeing felony suspect cases. For example, if, as is the case in Chicago,robbery is among the deadly force policy's set of forcible felonies, then,we would argue, officers will be inclined to fire at fleeing robbery sus-
46 Burglary suspects constituted nearly half of all suspects shot by Chicago police for flee-ing, so the elimination of burglary from the set of forcible felonies which justify lethal capturecould dramatically affect the number of "fleeing felon" shootings.
47 See W. GELLER & K. KARALES, sufira note 32, at 30, for a discussion of the legislativeintent behind the Illinois deadly force statute.
1982]
GELLER AND KARALES
pects without stopping to think about the probable dangerousness of theindividual in flight. Our data have shown that a number of armed rob-bery suspects offered no resistance to police other than flight. Yet, onemay well expect from the threat of violence inherent in an armed rob-bery that the robbery suspect would violently confront responding po-lice officers. Because the relationship between the seriousness of thesuspected crime and future dangerousness has not been established, wewould prefer a deadly force guideline which made the immediate dan-ger posed by the suspect, rather than the nature of his possible criminaloffense, the justifying factor.48
Also important in devising control strategies is an awareness that asignificant number of shootings by police and a majority of shootings ofpolice take place while the participating officers are off duty. Preventivemeasures aimed at such shootings may need to address concerns whichwould be largely irrelevant to the reduction of on-duty shootings. Forexample, off-duty officers may be carrying their guns when they aredrinking alcohol; off-duty officers do not routinely carry police radiosand thus cannot depend on instant communication with the departmentin emergencies; and, like on-duty plainclothes police, off-duty officerstypically intervene on their own initiative and thus lack the "legiti-macy" and time for mental preparation that derive from a civilian callfor assistance and that may tend to deter forceful resistance to policeauthority.
49
Just as policy and training may need to be tailored to suit specialconsiderations associated with off-duty shootings, so control strategiesmay need to address different issues with respect to different units ofpolice departments-units which frequently are engaged in quite dispa-rate types of police work. Although police in nearly every major unit ofthe Chicago Police Department have been involved at one time or an-other in shootings, officers in a handful of units are far more likely thanother sworn personnel to shoot civilians and to be shot by civilians whileon duty.
Our analysis of police shooting files, coupled with a review of theliterature and consultation with police administrators and front-linepersonnel, suggests the need for control strategies that prohibit certaintypes of "elective" shootings, supplement officers' human relations andnon-lethal tactical skills, and correct bad gun handling habits. Suchstrategies should be framed with an awareness of particular require-ments for the regulation of off-duty shootings and shootings by officers
48 We say "immediate" danger because clinical research suggests that people are remarka-
bly inaccurate in predicting whether an individual will engage infuture violent behavior onthe basis of his past conduct. See id. at 187.
49 Se A. REiss, JR., supra note 7.
[Vol. 73
CHICAGO POLICE SHOOTINGS
in specialized units. Furthermore, deadly force policies should not bebased on generalizations about the relative dangerousness of suspects indifferent types of crimes.
The control strategies set forth briefly50 below are by no means theonly reasonable ways to work toward the reduction of "avoidable"shootings, but they seem to be promising ones. A number of these strat-egies or variations of them are already being used by some police depart-ments, including the Chicago Police Department. We urge policeadministrators to give serious consideration to employing all these tech-niques in their on-going efforts to control police shootings.
General considerations bearing on the avoidability of shootings bypolice include the following: (1) the degree to which the officer's or an-other person's life would be immediately endangered if the officer didnot shoot; (2) the availability of alternative, less violent means of cap-turing a suspect; (3) the extent to which the officer can obviate use ofdeadly force against a potentially violent suspect by using better searchand field interrogation techniques or by maintaining cover and control-ling the situation until a non-lethal capture can be accomplished;(4) the degree of risk to bystanders which might be posed by police useof deadly force; (5) the reliability of information upon which the of-ficer's irreversible decision to shoot is made; and (6) the extent to whichofficer carelessness, nervousness, bad gun handling habits or other "cor-rectable" factors were largely responsible for the shooting.
Applying these criteria to the data presented in this part and inpart I of this article leads to the conclusion that a sizeable number (atleast a third) of shootings by police officers are avoidable. Many suchshootings are prompted by civilian conduct that does not immediatelyjeopardize the lives of officers or the public (non-violent flight being aprime example). Others seem to be the result of poor gun handling hab-its (carrying cocked revolvers, carelessness in gun cleaning, etc.). Inmany cases, greater tactical and human relations skills could have givenofficers the "strategic edge" necessary to permit them to resolve a poten-tially violent encounter without firing their weapons or placing them-selves in grave danger.
The control strategies fall into four basic areas: policy develop-ment, policy enforcement, personnel practices, and training and weap-ons. The first area, policy development, is certainly the mostcontroversial. Nonetheless, we recommend the adoption of a "defense-of-life" shooting policy, with the following as its core message: 5' A police
50 For a fuller discussion of these strategies, see W. GELLER & K. KARALES, sufira note 32,
at 183-200.51 We recognize that amplification is required on a number of points, such as shooting as
1982]

GELLER AND KARALES
oftcer isjustified in using deadl force only when such force is intended to defeat apresent threat to the officer's or anotherperson-s life. This policy is justified on anumber of grounds, including the following: (1) It justifies shootingsbased on information easily and instantly available to officers in thefield-their honest perception of immediate danger-rather than ongeneralizations about the future dangerousness of persons suspected(rightly or wrongly) of having committed any one of a series of enumer-ated felonies; (2) the recommended policy, which admittedly is based toan important extent on value choices, would not inhibit police officersfrom shooting when they honestly felt it was necessary to protect theirown or someone else's life; (3) the shooting of a person who is not imme-diately jeopardizing someone's life may be discovered subsequently tohave been prompted by misinformation about the shooting victim'sprior or likely future conduct--even if predictions about the future"dangerousness" of a fleeing suspect are based on accurate informationabout past behavior, such predictions have been demonstrated byclinical experiments to be woefully inaccurate; (4) policies which do notrestrict shootings to defense-of-life situations permit the killing of peoplefor the possible commission of crimes that they would never be executedfor if convicted; and (5) very often, "lethal capture" of nonthreateningsuspects fails to accomplish its ostensible purpose-to take a criminalsuspect alive and bring him to trial. To the contrary, the use of deadlyforce without the necessity to defend life has engendered widespread re-sentment of police, especially in minority communities, making thebroad spectrum of police work that much more difficult.
The defense-of-life and other restrictive policies have been gainingincreasingly widespread support. They have been adopted by a numberof police departments 52 with considerable success. Such policies havehelped reduce the number of shootings of civilians andpolice ofters with-out adversely affecting arrest rates.53 For example, in New York City,fewer civilians and police were shot following the adoption in 1972 of apolicy which, as enforced, imposed a defense-of-life standard on of-
a last resort, the reasonableness of the officer's perception of danger and whether the policyshould be a matter of state law or departmental regulation.
52 For example, the defense-of-life policy is in use in New York City, Washington, D.C.,
New Orleans, Atlanta, Newark, Detroit, Oakland, Kansas City, Mo., Houston, San Jose,Reno, and a number of small-to-medium-size departments throughout California. In addi-tion, most federal law enforcement agencies employ the policy, including the FBI; SecretService; Alcohol, Tobacco and Firearms; Customs; IRS; Drug Enforcement Administration;and U.S. Postal Inspectors. Many departments impose other,, less stringent, 'restrictions, suchas prohibiting shooting at non-violent burglary suspects, prohibiting shots at or from movingvehicles, and prohibiting warning shots. See W. GELLER & K. KARALES, rupra note 32, at 20-52.
53 See id. at 39-41, 183-87.
[Vol. 73

CHICA GO POLICE SHO TINGS
ficers.54 In Kansas City, a marked reduction in shootings of young peo-ple followed the promulgation by that department of a rule forbiddingshots at juveniles, except in defense of life. 55 And in Oakland, the Chiefconcluded some years ago that a prohibition of shooting at nonviolentburglary suspects avoided much bloodshed and failed to affect adverselythe apprehension rate for such suspects.5 6 These and other positive ex-periences with restrictive policies have led to advocacy of the defense-of-life policy or very similar policies by many empirical researchers andlegal commentators, as well as public officials and community leadersand their agencies or organizations. 5 7
While the essence of a policy on when to shoot should not differ foron- and off-duty officers, we offer for consideration .everal recommenda-tions respecting off-duty shootings which could be a part of a compre-hensive deadly force guideline. Of prime importance are the following:
-Off-duty officers should generally be prohibited from carrying gunswhen they anticipate consuming alcoholic beverages. 58
-Greater restrictions should be imposed on the types of weapons that maybe carried by officers, and consideration should be given to tightening theminimum standards of proficiency required of officers with these weapons.A disproportionate number of accidental self-inflicted wounds were suf-fered by officers using weapons other than service revolvers (especially
54 Fyfe, supira note 38.55 C. MILTON, supra note 28.56 C. Gain, Discharge of Firearms Policy: Effecting Justice Through Administrative Reg-
ulation (Dec. 23, 1971) (unpublished statement). See also Tsimbinos, Thejusti&id Use of DeadForce, 4 CRIM. L. BULL. 3 (1968); Uelman, Varieties of Police Poi'y: A Study of Police PoliyRegarding the Use of Dead.1y Force in Los Angeles County, 6 Loy. L.A. L. REv. 1 (1973).
57 Included among these advocates are the U.S. Commission on Civil Rights; the NewYork State Division of Criminal Justice Services; Atlanta Public Safety Director Lee Brown;Newark Director of Public Safety Hubert Williams; San Jose Police Chief Joseph McNamara;Community Relations Service (of the U.S. Justice Department) Director Gilbert Pompa; Po-lice Foundation President Patrick V. Murphy; the National Organization of Black Law En-forcement Executives; the National Black Police Association; Police Executive ResearchForum Executive Director Gary Hayes; International Association of Chiefs of Police DeadlyForce Research Project author Kenneth Matulia; the National Urban League; the AmericanCivil Liberties Union; the N.A.A.C.P.; the National Minority Advisory Council on CriminalJustice to L.E.A.A.; the Chicago Law Enforcement Study Group; the Public Interest LawCenter of Philadelphia; the Chicago Council of Lawyers; former Cook County (II.) State'sAttorney Bernard Carey; and researchers Lawrence Sherman, James Fyfe, Kenneth Clark,Richard Harding, Richard Fahey, Ralph Knoohuizen, and Paul Takagi. For citations to theposition statements of these individuals and agencies, see W. GELLER & K. KARALEs, supranote 32, at 39-40, 183-85.
58 We have not taken a position on the broader question of whether off-duty police should
be permitted to carry guns at all because insufficient data exist on which to form an opinion.Research should be conducted on the productivity of off-duty police (number and quality ofarrests and other types of service, including deterrence, etc.) and the possible risks to off-dutyofficeis that may stem from their being unarmed. One of the leading commentators hastaken a position against the arming of off-duty officers. See Fyfe, supra note 1.
1982]

GELLER AND KARALES
semi-automatic handguns). (Several of these points relating to weaponsshould be considered for on-duty officers as well.)-Police officers may need additional guidance in the kinds of incidents towhich they should respond while off duty and special reminders about thedangers of resolving their own disputes by taking police action. The un-availability to off-duty officers of police radios with which they could in-stantly summon assistance and check information, such as automobileregistration, may make it inadvisable for off-duty police to intervene insituations which do not obviously require immediate police attention. Tosimilar effect are the reduced mental preparation time and legitimacy ofoff-duty officers as compared to on-duty officers. 59 As the Police Founda-tion urged in its 1977 report on police shootings, "off-duty officers shouldavoid becoming involved in minor incidents or fights and should be waryof using their police office to try to adjudicate disputes to which they them-selves are party."6°
A defense-of-life standard or any other policy is only as good as itsenforcement. A number of control strategies seem appropriate for pol-icy enforcement, some of which are already used and others of which arepresently under consideration by the Chicago Police Department.
A key mechanism for policy enforcement is investigation of everyreported shooting to determine the justifiability of the officer's conductand the degree of any punishment that may be warranted. Presently,the Chicago Police Department's civilian-staffed Office of ProfessionalStandards (O.P.S.) has prime responsibility for investigation of shoot-ings. The deterrent impact, if any, that O.P.S. findings have is difficultto determine from the data we have collected. 6 1 In theory, at least, itwould seem that a review system that meted out significant--or at leastconsistent-penalties to errant police officers and offered support to of-ficers who complied with relevant rules should help prevent other of-ficers from engaging in wrongful shootings.
Perhaps as important as review of a shooting case to determinewhether punishment is justified is review to determine whether, even ifjustified, the shooting was avoidable. Toward this end, we suggest thatthe Chicago Police Department seriously consider the creation of a"shooting review panel," in addition to the O.P.S., which would be com-posed both of senior police administrators (including some from thetraining division) and of officers of the same rank as the officer whoseshooting is under review. This panel would review all shots fired by
59 See text accompanying note 49 supra.60 C. MILTON, supra note 28.61 See text accompanying notes 29-31, for a discussion of the correlation over time be-
tween O.P.S. decisions and shootings by police. Also complicating the effort to assess theimpact of O.P.S. shootings is the consistent lack of public disclosure of the outcomes of O.P.S.shooting investigations. The Police Department's annual statistical report should include theresults of O.P.S.' shooting investigations, just as it currently reports O.P.S. dispositions of non-fatal force cases.
[Vol. 73

CHICA4 GO POLICE SHOOTINGS
police, whether or not anyone was struck by the bullets. Although juris-dictional details vis-a-vis the O.P.S. would have to be worked out, themain purposes of this panel would be different from those of O.P.S. Thepanel would debrief officers and others involved in shootings-bothshootings by and shootings of police; refer officers for any necessarycounseling or retraining (or for appropriate commendations); and iden-tify systemic methods of reducing shootings of and by police consistentwith officer and public safety.6 2 These systemic methods, which shouldbe referred for consideration to appropriate departmental officials,might include revision of all of the following elements, among others:the disciplinary system; classroom, range, and field training; the supervi-sion and accountability structures that apply to front-line personnel;psychiatric and family counseling; hiring and promotion criteria; de-ployment and dispatching techniques.
Such a panel would need to collect different kinds of informationon shootings than is currently collected for disciplinary purposes andwould need to treat police officers as "expert witnesses" on the questionof how to improve departmental policies, training, supervision and oper-ations so as to obviate shootings and ensure officer and public safety.Other promising policy enforcement techniques might include field su-pervision, communication by headquarters to district-level administra-tors of information about patrol officers who are "violence-prone," andreview of police shootings not only by the Police Department but bylocal and federal officials and, with appropriate safeguards, by privateentities.
A third control strategy concerns personnel practices. Officersshould be hired, promoted, and commended or disciplined with anawareness that, while "toughness" is critical to the police role, an impor-tant component of police work is nonviolent problem solving. Psycho-logical screening tests and routine monitoring of officer behavior should
62 The recommendation that a shooting review panel be considered raises some practicalissues which will need to be addressed in connection with the establishment of such a panel.For example, the possibility of expanded civil or criminal liability of individual officers andthe city based on information disclosed to the review panel would need to be considered.Research should be conducted to determine how other police departments (e.g., New YorkCity and Los Angeles), which have entities somewhat like the proposed review panel, haveresolved thesd liability questions. It is possible that legislation would be appropriate to pro-hibit in court use of information disclosed to the review panel. (The officers involved, how-ever, could still be subpoenaed to appear before a grand jury.) On the other hand, it may bethat other departments have found it appropriate and feasible to take the position that fulldisclosure of information pertaining to shootings is so important that it is worth increasing thechances of individual and municipal liability to get it. Police morale issues would need to beaddressed also, for a multiplicity of shooting reviews could prove counterproductive if policerespond by refusing to engage in appropriately aggressive police work. See W. GELLER & K.KARALEs, supra note 32, at 33-34.
1982]

GELLER AND KARALES
be used to the extent that they can help separate officers who wouldproperly exercise their discretion to use deadly force from those whowould not.
After identification of officers who need some special attention, anumber of options are available, such as supportive psychological coun-seling, reassignment to more appropriate duty, punishment, and re-training. The last option-and our fourth area of control strategies-isan essential control technique with as much promise as policy develop-ment for reducing the incidence of police shootings.
Police officers must be armed not only with the service revolver butwith a battery of nonviolent strategies to control and defuse dangeroussituations. If training does not provide officers with effective alterna-tives to the use of deadly force, policy statements demanding that suchforce be used only as a last resort will be of little benefit other than forpublic relations purposes. Training should encompass teaching depart-mental policy, human relations skills and tactical skills.
Policy should be taught in such a way that a department's positionis not simply a set of phrases, like a Miranda warning, to be memorizedby officers almost without regard to the meaning of its words. This sug-gests that policy should be explained, as it is currently by Chicago PoliceDepartment trainers, with the aid of realistic fact situations. Addition-ally, it would be very useful if policy could be applied by officers inmock role-playing sessions, which may not now be done to full advan-tage by the Department.
Human relations techniques should be given prominence at thetraining academy. In addition to teaching police officers about unfamil-iar cultural traditions of Hispanics and blacks, more attention mightprofitably be paid to teaching basic techniques for nonviolent persua-sion.6 3 Inevitably, police officers sometimes must resort to force if theyare to perform their job adequately, but the occasions when force is nec-essary could probably be decreased with the aid of creative human rela-tions training.
Skills for defusing potentially violent encounters and nonviolentlyresolving them with a minimum of risk to the officers and innocent by-standers are sorely needed. Our data suggest that the vast majority ofthe officers who shot civilians had no cover at the time of the shooting.We are unable to determine how many of these officers could have
63 A Chicago Tribune poll in late 1978 found that 45% of the sampled black residents of
Chicago agreed with the statement that police officers in their neighborhood "do not showrespect for people and use insulting language." Perhaps more important, 71% of the respon-dents aged 18-24, a group which has a disproportionate share of violent encounters with po-lice, answered this survey question affirmatively. Hartzell, Crime, Unemplopment, Blacks' TopProblems, Chicago Tribune, Oct. 16, 1978, at 1, col. 1.
[Vol. 73

CHICAGO POLICE SHOOTINGS
availed themselves of some protective barriers, but we assume that anintensive training cycle focused on maintaining cover and positioning"while dealing with potentially dangerous suspects would significantlyhelp reduce the number of shootings.
Other areas for improvement include: (1) training officers as towhen "heroic" action on their part is commendable and when it couldprove counterproductive; (2) developing new field decision-making ap-proaches that bring supervisors whenever possible into the decision ofwhether and when to shoot, so that use of deadly force need not so fre-quently be a "split-second decision;"' 65 and (3) providing an outdoortraining facility which would expand the capacity of departmentaltrainers to prepare police officers to be more effective with lessbloodshed.
Several recommendations can also be made concerning weapons,including: (1) increased range practice and instruction in the handlingof service revolvers and other guns; (2) greater restrictions on the types(and possibly the number) of handguns officers can carry; (3) modifica-tion of service revolvers to preclude "single-action firing," a method that
'involves cocking the weapon, which has been responsible for a numberof accidental shootings of civilians and police officers; and (4) explora-tion of the extent to which modern, "less-lethal weapons" can be used,as they are in several other departments, to facilitate effectively the non-lethal capture of certain kinds of criminal suspects.66
All of these control strategies depend for their effectiveness on accu-rate information about the nature and extent of the control needed andon feedback about the impact of the strategies on shootings. Future re-search,67 whether performed by outsiders, the Chicago Police Depart-ment's own researchers, or a combination of the two, would provideadditional information useful for further reducing police-involved shoot-ings. These inquiries will only be possible if the Police Department rou-tinely collects and analyzes or permits others to collect and analyze -thenecessary data on police-involved shootings.
This study has looked at phenomena known as "police shootings," asubject about which little has been known but much has been said.Widely disparate kinds of interactions are encompassed by the term-
64 By "positioning" we have in mind an expansion of the kind of training already given toChicago police officers on how to approach a driver in a traffic stop so that the officer is ableto see the suspect's hands and the suspect is not able to view easily the officer without turning.For a discussion of various "officer survival" techniques that facilitate non-violent resolutionof potentially serious police-civilian encounters, see Fyfe, supra note 1.
65 Reiss, Controlling Police Use of Deadty Force, 452 ANNALs 122 (1980).66 For more detail concerning several of these recommendations, see W. GELLER & K.
KARALEs, spra note 32, at 180-205.67 See id at 201-03, for a list of topics needing further empirical research.
1982]
378 GELLER AND KARALES [Vol. 73
from self-defense shootings to self-inflicted shootings. The differenttypes of shootings are susceptible to very different types of control, andno single strategy for reducing shootings is relevant to all types of events.Police and the public at large have a common interest in identifying andemploying the most effective control strategies possible, for the divisiveimpact that police-involved shootings can have on the community un-dermines all other efforts to combat crime and ensure public safety.More effective use of police policy, training and review processes canbetter equip officers to resolve creatively, deliberately and successfullymany potentially violent situations without resort to deadly force.