SHOCK-DARKENING IN ORDINARY CHONDRITES ...SHOCK-DARKENING IN ORDINARY CHONDRITES - NUMERICAL...
2
SHOCK-DARKENING IN ORDINARY CHONDRITES - NUMERICAL CALIBRATION OF SHOCK-RE- COVERY EXPERIMENTS. J. Moreau 1 , T. Kohout¹ , ² and K. Wünnemann 3 , 1 Department of Physics, University of Helsinki, Finland ([email protected] ), 2 Institute of Geology, The Czech Academy of Sciences, Prague, Czech Republic, ³Museum für Naturkunde, Leibniz Institute for Evolution and Biodiversity Science, Berlin, Germany. Introduction: Recently we studied shock-darken- ing in ordinary chondrites [1] and determined the re- quired shock pressure to be 40-50 GPa. To verify these results experimentally, we will carry out shock-recov- ery experiments [2,3] on real samples of ordinary chon- drites. Due to impedance contrasts, reflections and complex geometry, it is a complex task to estimate the maximum pressure achieved in the sample: 1., the shock wave is generated upon impact of the iron flyer plate on the iron casing surrounding the sample (see Fig. 1); 2., the shock wave is transmitted from high im- pedance iron into low impedance sample material after eventually traversing a thin layer of high impedance tantalum foil; 3., the shock pressure in sample is ramped up by reflections from the surrounding iron casing (reverberation) until the release wave comes in and unloads the sample from shock pressure. This study aims at constraining the setup of such a reverber- ation experiment to approximate the thermodynamic conditions as if the material was shocked by a single shock wave (no reverberation). In fact, although gener- ating high pressures, shock-recovery experiments can- not achieve temperatures as high as single shock wave scenarios and we address that issue in the study. Methods: We used a model similar to [4] using the shock physics code iSALE [5]. The model concept is shown in Fig. 1. By pressure reflexions inside the sam- ple we analyzed enhancements: E sample = (P P /P N ) (1), and peak impedances contrasts: I = P P /P NSt (2), where P N and P P are nominal (initial pressure) and peak shock pressure (final pressure) in sample (GPa). P NSt is the pressure at contact between steel and sample. The required shock pressure in steel to complete en- tropy equivalent to planar shock wave [1] is given by: P NSt = ((αP + β)-β')/α' (3), where P is the desired pressure from [1]. α/β and α'/β' are the slope and intercept of line functions that are numerical experiment linear fits: T N = f(P N ) (4), and: T P = f(P NSt ) (5), Fig 1. Numerical setup. 1 mm = 34 cells. Fig. 3. Peak impedance contrast ratios on input pressure in steel and peak shock pressure in sample. Same parameters as Fig. 2. Fig. 2. Enhancement of the peak shock pressures in olivine sam- ple after impacting a 1 mm flyer-plate in a shock-recovery nu- merical experiment setup. Sizes of samples are shown. 1558.pdf Lunar and Planetary Science XLVIII (2017)
Transcript of SHOCK-DARKENING IN ORDINARY CHONDRITES ...SHOCK-DARKENING IN ORDINARY CHONDRITES - NUMERICAL...
SHOCK-DARKENING IN ORDINARY CHONDRITES - NUMERICAL CALIBRATION OF SHOCK-RE-COVERY EXPERIMENTS. J. Moreau1, T. Kohout¹,² and K. Wünnemann3, 1Department of Physics, University ofHelsinki, Finland ([email protected]), 2Institute of Geology, The Czech Academy of Sciences, Prague, CzechRepublic, ³Museum für Naturkunde, Leibniz Institute for Evolution and Biodiversity Science, Berlin, Germany.
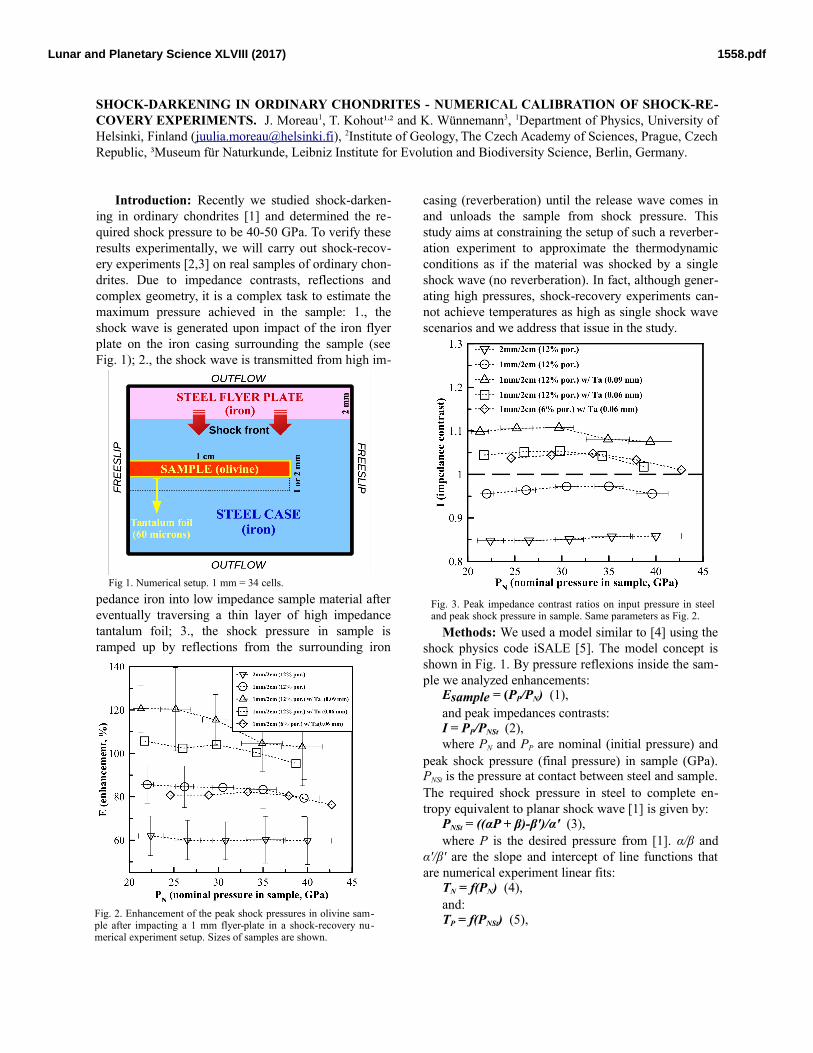
Introduction: Recently we studied shock-darken-ing in ordinary chondrites [1] and determined the re-quired shock pressure to be 40-50 GPa. To verify theseresults experimentally, we will carry out shock-recov-ery experiments [2,3] on real samples of ordinary chon-drites. Due to impedance contrasts, reflections andcomplex geometry, it is a complex task to estimate themaximum pressure achieved in the sample: 1., theshock wave is generated upon impact of the iron flyerplate on the iron casing surrounding the sample (seeFig. 1); 2., the shock wave is transmitted from high im-
pedance iron into low impedance sample material aftereventually traversing a thin layer of high impedancetantalum foil; 3., the shock pressure in sample isramped up by reflections from the surrounding iron
casing (reverberation) until the release wave comes inand unloads the sample from shock pressure. Thisstudy aims at constraining the setup of such a reverber-ation experiment to approximate the thermodynamicconditions as if the material was shocked by a singleshock wave (no reverberation). In fact, although gener-ating high pressures, shock-recovery experiments can-not achieve temperatures as high as single shock wavescenarios and we address that issue in the study.
Methods: We used a model similar to [4] using theshock physics code iSALE [5]. The model concept isshown in Fig. 1. By pressure reflexions inside the sam-ple we analyzed enhancements:
Esample = (PP/PN) (1),and peak impedances contrasts:I = PP/PNSt (2),where PN and PP are nominal (initial pressure) and
peak shock pressure (final pressure) in sample (GPa).PNSt is the pressure at contact between steel and sample.The required shock pressure in steel to complete en-tropy equivalent to planar shock wave [1] is given by:
PNSt = ((αP + β)-β')/α' (3),where P is the desired pressure from [1]. α/β and
α'/β' are the slope and intercept of line functions thatare numerical experiment linear fits:
TN = f(PN) (4),and:TP = f(PNSt) (5),
Fig 1. Numerical setup. 1 mm = 34 cells.
Fig. 3. Peak impedance contrast ratios on input pressure in steeland peak shock pressure in sample. Same parameters as Fig. 2.
Fig. 2. Enhancement of the peak shock pressures in olivine sam-ple after impacting a 1 mm flyer-plate in a shock-recovery nu-merical experiment setup. Sizes of samples are shown.
1558.pdfLunar and Planetary Science XLVIII (2017)
where TN and TP are temperatures (K) at nominaland peak shock pressure in the sample. We also definedthe dependencies:
(α,β,α',β') ~ f(DFP, DS, (DTa), I) (6),where DFP is the flyer plate thickness, DS is the sam-
ple thickness, DTa is tantalum thickness and consideringthat I is dependent on sample material, porosity andpresence of Ta foil or not.
Results: Using the setup from Fig. 1, we ran differ-ent models with varying parameters: DS, DTa, sampleporosity and with or without Ta foil of varying thick-ness (fixed at 0.05 mm in real experiments). Fig. 2shows the enhancement of the pressures inside the sam-ple as a function of the nominal pressure in the sample.The error bars are the standard deviations. Their largeerror may be explained by the geometry making thedistribution of pressures heterogeneous. Fig. 3 showsthe ratio (impedance) between PNSt and PP as a functionof PN. Fig. 4 depicts results of a specific scenario forwhich parameters from (4) and (5) are shown. FinallyFig. 5 shows the resulting values using (3) for each sce-nario where an additional high-resolution test (highercell number per distance unit in the numerical modelmesh) can be observed (red line) showing only weakvariation in the final results.
Discussion: Our results indicate that the pressuresare enhanced in cases for which the sample is thinnerand foiled in thick Ta. Fig. 4 suggests that peak temper-atures at nominal pressures and peak shock pressuresare following linear trends but the line parameters (4)and (5) are independent, which means that entropy, atnominal and peak shock pressures of same values, arenot equal. This is due to peak shock pressures achieved
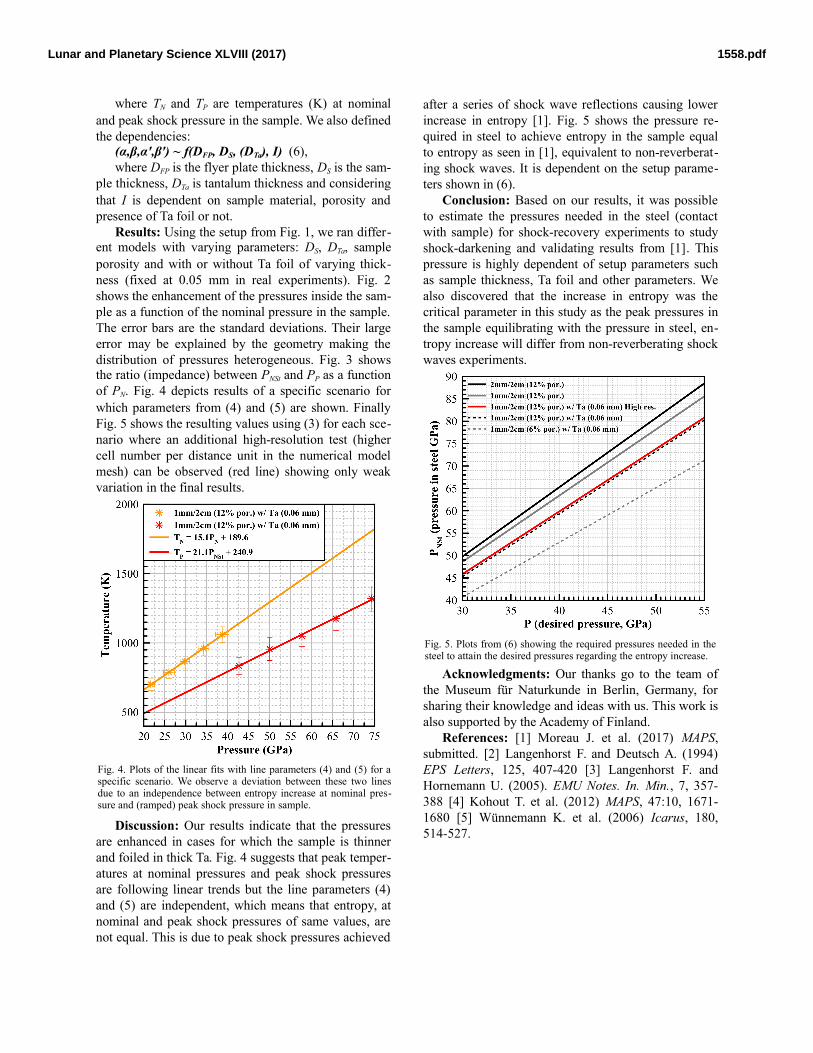
after a series of shock wave reflections causing lowerincrease in entropy [1]. Fig. 5 shows the pressure re-quired in steel to achieve entropy in the sample equalto entropy as seen in [1], equivalent to non-reverberat-ing shock waves. It is dependent on the setup parame-ters shown in (6).
Conclusion: Based on our results, it was possibleto estimate the pressures needed in the steel (contactwith sample) for shock-recovery experiments to studyshock-darkening and validating results from [1]. Thispressure is highly dependent of setup parameters suchas sample thickness, Ta foil and other parameters. Wealso discovered that the increase in entropy was thecritical parameter in this study as the peak pressures inthe sample equilibrating with the pressure in steel, en-tropy increase will differ from non-reverberating shockwaves experiments.
Acknowledgments: Our thanks go to the team ofthe Museum für Naturkunde in Berlin, Germany, forsharing their knowledge and ideas with us. This work isalso supported by the Academy of Finland.
References: [1] Moreau J. et al. (2017) MAPS,submitted. [2] Langenhorst F. and Deutsch A. (1994)EPS Letters, 125, 407-420 [3] Langenhorst F. andHornemann U. (2005). EMU Notes. In. Min., 7, 357-388 [4] Kohout T. et al. (2012) MAPS, 47:10, 1671-1680 [5] Wünnemann K. et al. (2006) Icarus, 180,514-527.
Fig. 5. Plots from (6) showing the required pressures needed in thesteel to attain the desired pressures regarding the entropy increase.
Fig. 4. Plots of the linear fits with line parameters (4) and (5) for aspecific scenario. We observe a deviation between these two linesdue to an independence between entropy increase at nominal pres-sure and (ramped) peak shock pressure in sample.
1558.pdfLunar and Planetary Science XLVIII (2017)