SHIPPING MARKET REVIEW...Shipping Market Review –November 2018 4 TABLE OF CONTENTS Shipping Market...
90
Shipping Market Review – November 2018 1 SHIPPING MARKET REVIEW NOVEMBER 2018
Transcript of SHIPPING MARKET REVIEW...Shipping Market Review –November 2018 4 TABLE OF CONTENTS Shipping Market...

Shipping Market Review – November 2018 1
SHIPPING MARKET REVIEWNOVEMBER 2018

Shipping Market Review – November 2018 2
DISCLAIMERShipping Market Review – November 2018
The persons named as the authors of this report hereby certify that: (i) all of the
views expressed in the research report accurately reflect the personal views of
the authors on the subjects; and (ii) no part of their compensation was, is, or will
be, directly or indirectly, related to the specific recommendations or views
expressed in the research report. This report has been prepared by Danish Ship
Finance A/S (“DSF”).
This report is provided to you for information purposes only. Whilst every effort
has been taken to make the information contained herein as reliable as possible,
DSF does not represent the information as accurate or complete, and it should
not be relied upon as such. Any opinions expressed reflect DSF’s judgment at the
time this report was prepared and are subject to change without notice. DSF will
not be responsible for the consequences of reliance upon any opinion or
statement contained in this report. This report is based on information obtained
from sources which DSF believes to be reliable, but DSF does not represent or
warrant such information’s accuracy, completeness, timeliness, merchantability
or fitness for a particular purpose. The information in this report is not intended to
predict actual results, and actual results may differ substantially from forecasts
and estimates provided in this report. This report may not be reproduced, in
whole or in part, without the prior written permission of DSF. To Non-Danish
residents: The contents hereof are intended for the use of non-private customers
and may not be issued or passed on to any person and/or institution without the
prior written consent of DSF. Additional information regarding this publication will
be furnished upon request.

Shipping Market Review – November 2018 3
HEAD OF RESEARCH
Henriette Brent-Petersen
ANALYTICAL TEAM
Shifei Liu
Jonas Munch Stenbjerg
Sara Møller Jensen
Caspar Wergeland
HEAD OF INNOVATION
Christopher Rex

Shipping Market Review – November 2018 4
TABLE OF CONTENTSShipping Market Review – November 2018
FOREWORD, 5
GENERAL REVIEW AND OUTLOOK, 6
SHIPBUILDING, 26
CONTAINER, 32
DRY BULK, 39
GLOBAL OIL MARKETS, 45
OFFSHORE SUPPORT VESSELS, 48
SUBSEA VESSELS, 54
CRUDE TANKER, 60
PRODUCT TANKER, 66
LPG TANKER, 72
LNG TANKER, 83

Shipping Market Review – November 2018 5
We have been analysing the dynamics that are shaping the shippingindustry for more than a decade. Most ship segments have beenburdened by surplus capacity for large parts of this period, and mosthave seen freight rates and ship prices come down to very low levels.Still, several segments have seen periods of recovery in freight ratesand secondhand prices, although few of these cycles have lasted long.
While not all our predictions have proved equally accurate, we havebeen promoting discussion of the challenges facing the shippingindustry and in highlighting some global perspectives that might serveas an outlook. We have in this process enjoyed the many bilateraldiscussions with our valued customers.
We have primarily approached our analysis of the shipping industryfrom a long-term perspective. This methodology has allowed us topresent and discuss some emerging changes but has also createdblind spots on the short-term industrial level. It is important to keepin mind that long-term trends only define the dynamics in play. Thesedynamics may easily be outgunned by temporary forces definingshort-term demand that can become sufficiently powerful to raisefreight rates or even secondhand prices for several months, orsometimes even longer.
The introduction of new technologies, not just to the global economy,energy supply and manufacturing, but also to the shipping industryhas been a recurring theme in our past eight reports. We have, overthe years, discussed how the introduction of 3D printers, artificialintelligence, smart materials and robotics are about to change thelong-term outlook for the Container industry, the emergingeconomies’ ability to create jobs, and the likely impact on urbanisationand future energy demand.
With our approach to shipping research, we have not previouslysought to identify short-term opportunities that enable sudden marketimprovements to materialise. However, we have decided to increaseour focus on these short- to medium-term dynamics, whilemaintaining a clear-eyed view on the emerging long-term risk andopportunities that are surfacing.
The market research team will continue to analyse the individual shipsegments, while a newly established Innovation team will focus on thelong-term digital perspectives.
The Innovation team’s aim is to identify how to unlock the next levelof value in the shipping industry. We will identify and assess newbusiness models, potential new technologies or startups that canupgrade parts of our customers’ operations. In essence, we aim tosupport the creation of value by moving beyond the vessel in an effortto reinvent operating models.
In addition to this edition of our Shipping Market Review – November2018, we are publishing a Maritime Trend Report in collaboration withRainmaking. We have partnered to publish a report for the maritimeindustry, in which we look at current trends through the lens of globalstartups. These findings are flanked by a ‘digital 2030 scenario’ for theshipping industry, in which Danish Ship Finance presents possiblefuture directions for the industry in terms of business modelinnovation and value creation.
We see a clear trend of increased digital adaptation in the shippingindustry taking off dramatically in 2018. In our digital 2030 vision, weconclude that some of the basic mechanisms for value creation in theshipping industry could be redefined within the next ten to 15 years,even though most of the 160 startups we have analysed are enablersof innovation, rather than disruptors of the traditional businessmodels.
Enjoy reading!
Danish Ship Finance
FOREWORDShipping Market Review – November 2018
Shipping Market Review – November 2018 6
GENERAL REVIEW AND OUTLOOK
SHIPPING MARKET REVIEW – NOVEMBER 2018

Shipping Market Review – November 2018 7
THE DIGITAL TRANSFORMATIONThis section is an extract from another report that we are publishing together with Rainmaking. To read the full report – “Maritime Trend Report” – please visit www.nextgenmaritime.io

Shipping Market Review – November 2018 8
2018 PHASE 1 PHASE 2 2030+
INDUSTRY INNOVATION
The introduction of new technologies iscausing existing business models to beupgraded. We take a look at the globalstartup scene to understand how theindustry may innovate in the years tocome.
INDUSTRY TRANSFORMATION
The new business models will begin totransform value creation in theshipping industry. The role of thevessel will change and newcompetitors will emerge.
INDUSTRY REDEFINED
Most of the traditional business modelswill find it increasingly difficult tocompete with ecosystem players whofundamentally change how value iscreated and distributed across thesupply chain.
EXPANDING MARKETSIntegrating the global supply chain

Shipping Market Review – November 2018 9
THE DIGITAL TRANSFORMATION OF THE SHIPPING INDUSTRYThe role of the vessels will change
The transport and logistics industry has been slower to introducedigital innovations than many other industries, which is puttingseveral of the industry’s established players’ business models atconsiderable risk. As other industries with close links to logistics, suchas retail, become revolutionised by digital technology, the chances ofdigital disruption engulfing the shipping industry increase. Whiledigitalisation threatens to fundamentally disrupt vital parts of businessmodels, it could also help unlock enormous untapped potential.
THE ROLE OF THE VESSEL WILL CHANGEWe argue that the shipping industry is currently being influenced by anumber of leading technologies and trends across sectors that in timewill redefine significant parts of the industry. The role of a vessel willchange: from being central to value creation to becoming an enablerof additional streams of revenue. This shift will reflect the introductionof new technologies, and changes in customer behaviour and industrypractices.
The emergence of ‘digital native’ companies (e.g. Amazon, Google,Alibaba, Tencent) has transformed modern industry. Once bound bygeography or sector, companies are now leveraging digital technologyto build ‘borderless entities’ – companies that cross over intoseemingly unrelated industries and reach global scale in record time.Rather than conforming to traditional industry structures, thesecompanies have created an ecosystem of products and services thatfulfil customers’ needs globally.
NEW BUSINESS MODELS ARE BEING DEVELOPEDThe introduction of new technology in the shipping industry will attractnew market entrants and create new expectations among customers,in turn opening up for new business models. The introduction of digitalplatforms is one such example, and these are likely to becomeincreasingly important across the logistics industry. Over the next fiveto ten years, the race to build a dominant global platform willtransform the customer’s experience of logistics and will be crucial indetermining which companies are the winners and losers in a trulydigital logistics industry.
An increasingly competitive environment is emerging. New andexisting players are finding ways to carve out the more lucrativeelements of the value chain by exploiting digital technology anddeveloping new business models. Their aim is to gain control ofcustomer touchpoints and create synergies with their existingbusinesses. They are forming new entities which, when successfullyapplied, may be a game changer by redefining the borders ofindustries, the role of assets and the types of competitor.
SHIPOWNERS DO NOT HAVE AN EXCLUSIVE RUNWAYThe shipping industry is only part of the picture. Shipowners do nothave an exclusive runway in the race for future value creation.Multiple players from various industries are investing to obtain a shareof the future value. We expect to see a shift in the ownershipstructure of vessels and profound changes to operating models whenecosystem players move beyond the vessels and integrate across theglobal supply chain.
The vessels themselves will continue to be central to the operation ofmoving cargo from port to port. But the data they generate will beintegrated into the range of services that customers require and beginto drive future value creation far beyond freight rates. Ecosystemplayers tend to build strong customer bases in one industry, and thenmove laterally into others to be able to cater for all their customers'needs from origin to destination.

Shipping Market Review – November 2018 10
THE CASE FOR DIGITAL DISRUPTION IN THE SHIPPING INDUSTRYFreight rates may decouple from supply and demand
The global supply chain will still require vessels in the future, but theirdirect contribution to value creation could be marginalised. Freightrates could decouple both from the supply and demand balance andfrom vessels’ operating expenses. A possible scenario is that freightrates approach zero or stabilise at transaction-based low levels. In theevent of this, secondhand prices of vessels will leave little room forthe asset play that currently represents a large part of value creationfor many shipowners.
Experience from other industries shows that any industry thatbecomes digitalised is likely to enter the world of exponential growthand exponential change. Digital information is easy to access, share,and distribute within and across industries. Once something can berepresented in ones and zeros – from containerised trade to smartmaterials – it becomes an information-based technology that canchain react with other technological progressions and disrupt existingindustries and business models, as well as unlocking new layers ofuntapped potential. We argue that the business models of assetowners and ship operators are as likely as those of shipowners (i.e.who run an integrated business where either technical management,commercial management or both are managed internally) to bedisrupted, but for very different reasons.
Many people will disagree with us, but we urge them to recall thefollowing example: when something starts being digitalised, its initialperiod of growth and change is deceptive, because exponential trendsdo not increase very fast at first. Let us illustrate the point with aMoore’s law example. Starting with a market share of 0.01% anddoubling each year, it will take seven years to pass 1% but onlyanother seven to reach 100%. The market changes that are currentlyemerging are clearly at a very early stage, but this is no reason toconclude that they do not have the potential to be massive within thenext decade.
The core services in traditional business models (i.e. transportinggoods from port to port) will be losing their value in a digital industry,and risk being usurped by other services. Vessels will still be needed
to perform the task of moving cargo from port to port, but it is thedata this generates rather than the cargo itself that will start to bemonetised, not only from port to port but through the entire valuechain from origin to destination.
The problem is, though, that once something has been digitalised,more people are able to access the information without owning theasset (e.g. warehouses, ports, vessels, etc.). This constitutes a realproblem for traditional players, since a new type of player may entervarious parts of the global supply chain. These newcomers may startto upgrade specific parts of the supply chain or the entire customerjourney without owning a single asset. The separation of data fromthe asset opens up a wide range of new possibilities in terms ofbusiness models and value creation. This will change the borders ofindustries and the role of assets, and introduce new groups ofcompetitors that are not normally seen in this setting.

Shipping Market Review – November 2018 11
WHAT DIGITALISATION MEANS FOR THE SHIPPING INDUSTRYShipping 2030: Where will the most interesting digital opportunities and threats emerge?
Most shipping companies today are scrambling to become moredigital. But what does digitalisation really mean? And what changesshould we prepare for?
For some, it is about technology (e.g. digital ships). For others,digitalisation offers a new way of engaging with customers (e.g.trading platforms). And for others still, it represents an entirely newway of doing business (digital operation, ship-as-a-service, valuebeyond the vessel). We consider digitalisation less a thing andmore a new way of doing things.
To capture the potential and not simply fall victim to the emergingchanges, the industry needs to upgrade its foundations. This is aboutdigital ships (or vessels being upgraded to higher digital standards),digital operations and trading platforms. Some parts are already underconstruction, while other elements are still prototype concepts thatneed to be tested and validated.
The shipping industry’s digital transformation is part of a broaderjourney whereby all components of the global supply chain have beenor are in the process of being digitalised and integrated together. Eachof the individual industries or sectors along the global supply chain isbeing challenged by new players – ecosystem players – which areoptimising customers’ journeys from origin to destination rather thanoperating within that particular industry.
IT WILL NO LONGER BE ALL ABOUT THE VESSELSSo, we have argued that the traditional business model in the shippingindustry will undergo a significant transformation within the nextdecade and could be outright disrupted over the following decade.Today, most shipowners earn their money by transporting cargo fromport to port while others are playing the volatility (i.e. the asset play).In the future, value creation will focus less on the vessel but more onthe customer journey.
Imagine a situation where access to consumers is consolidated acrossthe global supply chain on a handful of trading platforms. Only vesselswith access to these trading platforms can gain access to cargo.
In this scenario, ownership of the fleets becomes less important andscale becomes less important. The very role of the shipowner isthrown into question.
The largest threat may come not from the traditional competitors –other shipowners – but from structural changes that are not even onour radar today.
We argue that the industry could soon be subject to considerableinfluence from ecosystem players that do not own or control anyvessels. From a value creation perspective, it may no longer beenough to move cargo from port to port in a cost-competitive andtrading-efficient way, and the next upswing in secondhand prices maynot be sufficient to ensure a proper risk-adjusted return on investedcapital
TRADING PLATFORMS
DIGITALSHIPS
DIGITAL OPERATION
DIGITAL FOUNDATION

Shipping Market Review – November 2018 12
THE COMPETITIVE PLAYING FIELDThe transformation process
Our aim is to help create a roadmap for the shipping industry’stransformation towards a digital future. When companies begin toacquire end-to-end visibility into the data exhaust from theiroperations, they can begin to experiment with new business modelsand more integrated customer experiences. In time, the data fromtheir operations could prove at least as valuable as the transactionsthemselves. But we are not there yet. How will the short and mediumterm play out?
The low freight rate environment, which has persisted for large partsof the past decade, has spurred a consolidation process on the vessel-owning side. This trend seems to be continuing, and we are alsobeginning to see a clear trend towards increasing digital investments.
Shipowners who run integrated businesses, where both technical andcommercial management of their fleets are handled internally, aremost likely to invest in initiatives to upgrade both the cost and therevenue side of their operations. These investments could be made insequence or in parallel, or perhaps by merging with others or simplyacquiring candidates that have already mastered the requisite skills.But not all players are running operations that would offer more thanoperational scale in a consolidation.
The early stages of the digital transformation will see a push towardscost leadership. This is about the introduction of remote predictivediagnostics and automated processes powered by big data analyticsand artificial intelligence. These new tools will be used to enhance theperformance management of the industry, drive down costs andincrease the uptime of vessels. Existing vessels will be given digitalmakeovers to enable significant improvements in their operationalperformance. The next generation of ships will be super-connectedassets, with all systems monitored and integrated on unified platformsin real time.
The next step, or a parallel step, is capacity optimisation, which willlead to trading leadership. By applying artificial intelligence tosatellite, AIS and other geospatial data sources, algorithms will seekto discover and quantify trading opportunities, and to optimise vessel
deployment, cargo routing, repositioning and much more. Theseinvestments can be made by both shipowners and operators.
Asset owners that simply supply their fleets to the market on long-term contracts have little incentive to invest heavily in digitalinitiatives that upgrade the performance management of their vesselsor optimise capacity, unless they are rewarded by charterers.
Still, there is a clear limit to the potential for both cost and tradingleadership, since the journey from port to port can only be optimisedup to a certain point. In time, mastering these disciplines will becomemerely a licence to operate rather than a competitive advantage.When that happens, we will need to turn our attention to what willelevate a well-performing shipowner to an excellent one.
TECHNICAL MANAGEMENT
ASSET OWNERSHIP
COMMERCIALMANAGEMENT
A SIMPLIFIED BUSINESS MODEL
POOL

Shipping Market Review – November 2018 13
THE NEXT GENERATIONShipping 2030 – a scenario
The digital transformation of the shipping industry does notnecessarily mean a sea change for every company in every part of theindustry at the same time. Different business models will be affectedin different ways, although all players in all ship segments areexpected to be impacted by digitalisation at some point.
MIDDLE MAN AMONG MIDDLE MEN WILL DISAPPEARShipowners that simply play the role of middle man among middlemen may eventually disappear, since traditional shipowners andecosystem players will not be competing on equal terms. Theirrevenue streams will be significantly different. Traditional shipownerstrade cargo from port to port and earn freight rates (asset owners rentout ships). Ecosystem players may operate vessels, but they will viewthese as little more than the infrastructure enabling them to servetheir customers throughout a journey that includes seabornetransportation. Their primary income will not be freight rates, butincome generated by the services they offer throughout the entirecustomer journey – from origin to destination. We acknowledge,though, that traditional shipowners may earn additional profit from asuccessful asset play.
DIGITALISATION WILL TRANSFORM ALL SHIP SEGMENTSThe more standardised cargo types (e.g. container, iron ore, coal, oiland LNG) are widely considered the most likely to be digitalised first.The more fragmented parts of the industry are then expected to bedigitalised as the potential from trading platforms is revealed. In thisscenario, the digitalisation process will be gradual, but even nichemarkets will eventually be impacted, since digital platforms willprovide a benchmark for all cargo types even before most of the cargois handled digitally.
TAKING A NEW APPROACH TO DIGITAL TRANSFORMATIONHowever, the focus in this scenario is on seaborne trade where cargois transported from port to port. It fails to consider the journey fromorigin to destination, which crosses seemingly unrelated industries.The journey spans activities that take place before, during and afterthe cargo has been shipped, and can be long, stretching across
multiple channels and touchpoints, and often lasting days, weeks oreven months.
UNLOCKING VALUE BY REDUCING INEFFICIENCIESThe global economy is an interconnected ecosystem that drives globaltrade. Global trade is likewise an interconnected structure, but wetend to look at it in silos (i.e. Container, Dry Bulk, Crude Tanker,Offshore Supply Vessels, etc.). In a future where the global supplychain has been digitalised, we need to identify and commercialise thevalue potential. Value can be unlocked by removing inefficienciesacross the global supply chain by, for example, reducing the need forinventories, optimising local price campaigns or increasing thetransparency of the availability of goods. But it may likewise bepossible to create new streams of revenue by understanding how achange in manufacturing location impacts local demand forpetrochemicals, energy, trucking and labour, not to mention howthese changes impact the trading patterns of feedstocks. Thesecausalities may not evolve in sequence, but it seems clear that thereis a close relationship between them that can be identified andcommercialised.
WINNER TAKES MOSTThe most successful business models will remove costs from thesystem and simplify the industry. By pooling relevant content andcreating ‘one-click’ solutions (e.g. trading platforms integrating thejourney from origin to destination), the ecosystem players will beginto shape next-generation business models.

Shipping Market Review – November 2018 14
A DIGITAL TRANSFORMATION ROADMAPThree business models are likely to shape the shipping industry towards 2030
The digitalisation of the shipping industry is about to separate accessto data from ownership of vessels. This may introduce a new type ofcompetitor that works to upgrade specific parts of the supply chain.These ecosystem players are unlikely to own any vessels but maybegin to change the borders of industries and the sources of valuecreation in shipping.
We do not know how the shipping industry will adapt to the emergingchanges over the next decade. However, we have tried to combineelements in a logical ways and then deduced the implications. Our
hope is for this to be a useful thought exercise. We present twoscenarios: ‘value beyond the vessel’ and ‘reinventing the operatingmodel’.
These are certainly not the only ones that may transpire, but theyillustrate some fundamental changes to the existing businesslandscape. The future may instead reveal a combination of these orsurprise us with something entirely unexpected – or the status quowill prevail for longer.

Shipping Market Review – November 2018 15
VALUE BEYOND THE VESSELThe winners of tomorrow will create and lead an entire digital ecosystem
Digital destroys economic rent – creating more value for customersthan for traditional players. It steepens the power curve by creatingbig winners and losers at the top and bottom, respectively. Digitalrewards first movers and some superfast followers, but the top prizesare only available for the few. The behemoths of the future shippingindustry (from 2030 onwards) are expected to share keycharacteristics; each will work to create and lead an entire digitalecosystem.
Digitalisation of supply chains has a more powerful impact onindividual companies’ performances than any other strategic challengeseen in recent decades. The reason is that a fully digital supply chainoften involves the creation of new ecosystems, which leads to afundamental reshuffle of how value is distributed among industryplayers. The traditional players’ ability to sustain their revenue isunder attack, and in time, their business models may be outrightdisrupted. To stay in operation, they will need to change theirbusiness models dramatically.
Digital attackers often combine digital supply chain play with platform-based business models. Companies like Tencent, Alibaba and Googleare blurring traditional industry definitions by spanning productcategories and customer segments. Owners of such hyperscaleplatforms enjoy massive operating leverage from process automation,algorithms and network effects created by the interactions of manyusers, customers and devices.
Vessels will continue to be vital for the global supply chain, butecosystem players will monetise the data from operations rather thanthe cargo or the vessels themselves. Or maybe more precisely, someplayers will reinvent the business models of vessel ownership (e.g.vessel network subscriptions, also known as ship-as-a-service), whileothers will learn how they can monetise the broader customer journeyfrom origin to destination (value beyond the vessel). These twobusiness models, taking a variety of forms, are likely to shape largeparts of the competitive landscape towards 2030, but it is important torecognise that a third alternative may also emerge.
A group of traditional shipowners will continue to operate. Some willinvest heavily to challenge the often asset-light ecosystem players,while others could transform into super-large entities that supply shipsas network subscriptions to the ecosystem players. We expect only asmall group of traditional players to renew their fleets after 2030, aswe believe that new and potentially more attractive business modelalternatives will be introduced (see example on the next page).
The next battleground for ecosystem players, after they master valuebeyond the vessel (after 2030), may then be moving offline (e.g.investing in vessels, ports, or other vital infrastructure that facilitatesglobal trade). The aim is to tie more and more businesses into theirever-expanding ecosystem of global trade.

Shipping Market Review – November 2018 16
REINVENTING THE OPERATING MODELThe next generation of vessel ownership?
For all the fundamental change that digital reinvention demands, it isworth emphasising that it does not call for throwing the baby out withthe bath water. For example, John Deere created a whole series ofonline services for farmers even as it continued to sell tractors andfarm equipment.
The digital transformation of the shipping industry requires reinventionof the business models for vessel ownership. It makes little sense tospeculate in assets that do not generate much direct income, offer fewopportunities for differentiation and remain empty for prolongedperiods. Vessel ownership needs to be transformed into a utility – astable, low-risk business that harnesses all the benefits ofstandardisation, digitalisation and scale. We may see the introductionof a new type of ownership that supplements traditional types ofvessel ownership and leasing structure.
We envisage the introduction of a vessel network subscription(ship-as-a-service). This will be a new ecosystem play that couldfundamentally change how value is distributed among all parties thatcontribute to the design of a vessel, its construction and equipment,its operation and maintenance, and eventually also its demolition. Itcan be a new product offered by a few super-large owners. The fleetsof new digital vessels will be standardised to the highest levels ofexcellence possible to supercharge network effects and economics ofscales. The vessels will be designed, built, maintained and recycled(i.e. cradle to cradle) by the same owner but could trade forecosystem players (value beyond the vessel) who create value acrossthe entire supply chain.
A network subscription will have a simplified payment structure and aguaranteed performance, plus benefits such as vessel swapping, peer-to-peer loans and insurance products embedded. The owner of thenetwork subscription will be able to unleash significant cost-of-ownership tailwind throughout the lifetime of the vessel. The owner ofthe vessel will presumably be an investment-grade entity that willaccept a low but stable return on equity.
The introduction of vessel network subscriptions will not revolutionisethe shipping industry initially. In the early stages, owners offeringvessels to the market through network subscriptions will simply beviewed as a new type of tonnage provider supplying vessel capacity ata low fixed cost and with a guaranteed vessel performance. To acertain extent, a vessel network subscription can be viewed as a newproduct available for traditional owners working to further optimisetheir capital structures.
The role of the traditional shipowners will change, since their marginswill come under attack from the ecosystem players that generatesmost of their revenue outside the freight market. The market share ofthe traditional players will diminish over time, since they will becomeless able to yield a return on invested capital if they do not innovatetheir business models.

Shipping Market Review – November 2018 17
THE PACE OF CHANGELessons from other industries
We have discussed the emerging digital transformation in the shippingindustry and highlighted that shipowners may gain a short-termadvantage if they achieve both cost leadership and trading leadership.These capabilities are the prerequisites for serving a truly digitalglobal supply chain, but at some point in time they may prove to belittle more than a licence to operate. We argue that additionalbusiness model innovation will be necessary to unlock new streams ofrevenue.
How quickly and on what scale is the digital transformation likely tooccur? We do not know. But it seems fair to assume that the potentialconsolidation of access to customers could happen relatively soon.Take the Chinese mobile payment market as an example. WeChat Paywas launched in 2013, while AliPay was launched back in 2009. Thesetwo services have reached a dominant position (a combined marketshare of more than 90%) in a major market in less than a decade. Thesame could happen in the shipping industry.
It remains to be seen whether the digital transformation will dominatecertain ship segments (e.g. Container ships) before others, but if theindustry prepares itself for full-scale penetration, it may only end upwith a competitive advantage if some niche markets continue tooperate in the shadows for a little longer.
We find it unlikely that regulators would allow any platform to reach amarket share close to what has been seen in China. But that does notchange our key conclusion that the digital transformation will impacthow the industry does business, who gains access to customers andhow the industry makes money.
We conclude that some of the basic mechanisms for value creation inthe shipping industry will be redefined within the next ten to 15 years,although most of the innovation we are currently seeing is optimisingcurrent business models, rather than disrupting existing ones.

Shipping Market Review – November 2018 18
SHIPPING MARKETS AT A GLANCE

Shipping Market Review – November 2018 19
The shipping industry is in the midst of a described digital transitionwhile simultaneously facing a changing regulatory landscape,persistent surplus capacity across several segments, and structuralchanges that are impacting the demand-side drivers in different waysin different segments. These are all individual challenges with diversestrategic implications for the industry. The increasing complexity thisbrings makes it almost impossible to simply extrapolate the past topredict the future.
Most of the shipping segments have been burdened by surpluscapacity for much of the past decade. Freight rates and ship priceshave come down to low levels for most segments, although severalhave seen volatility and seasonality driven periods of recovery infreight rates and secondhand prices.
This is not a new phenomenon in the shipping industry, even thoughtoday’s markets are facing the additional challenges of very young
fleets and periods of very low demand growth.
After China’s entry into the shipbuilding arena, we are slowly adjustingto a reality of persistent over capacity pressure due to an abundanceof shipyard capacity. The shipping cycle adjustment process will nolonger be driven by increasing newbuilding prices (historically due toscarce shipyard capacity and increasing lead time), but managed byadjusted expectations of less extreme peaks and shorter cyclicalityand underlying true demand. With automation of shipyards and thedevelopment of future smart yards, shipyard capacity is no longerexpected to be a constraint and as such the importance of thishistorically important variable has diminished, leading to shortercycles and less extreme peaks.
A wave of environmentally driven regulations is likewise impactingshipping market dynamics and putting pressure on the economiclifetimes of vessels in most shipping sectors.
SHIPPING MARKETS AT A GLANCEUp to 2030 – Structural changes, changing regulatory landscape and surplus capacity overshadow the outlook
Source: Clarksons, Danish Ship Finance
SHIPPING CYCLE FREIGHT RATES AT LOWER LEVELS (‘000 USD PER DAY)
Dry Bulk
Crude Tanker
Product Tanker
Container
LPG
LNG
Offshore
USD 23,000 per day
USD 12,000 per day
201420062002
45
20162004 2008 2010 2012 20180
15
30
60

Shipping Market Review – November 2018 20
Over the last decade, since the financial crisis in 2008, emergingmarket and developing countries (EMDC) have seen GDP growthaccelerate strongly – and become increasingly decoupled fromadvanced economies GDP growth (see chart below). Initially, thisdecoupling was primarily driven by China’s GDP growth rates of above9% until 2012, but in recent years to a lesser extent driven by Chinaand by more even contribution from EMDC. China increased its shareof global GDP from 4% in 2000 to 9% in 2010 and its share isestimated at 16% in 2018. In comparison, the USA decreased itsshare from 30% in 2000 to 23% in 2010 and expected 24% in 2018.
The IMF is arguing that many EMDC’s has acted on lessons learnedfrom the historical crisises in the world’s ‘model markets’ – more sothan the advanced economies themselves – by taking on inflationtargeting, adopting more flexible exchange rate regimes,implementing macroprudential policies, and embracing trade. Thus,they have also become less dependent on inbound foreign directinvestments (FDI) as a key driver of growth.
From 2010 to 2017, we experienced strong growth in global trade ingoods and services with a CAGR of 5.1%; global seaborne trade grewat a CAGR of 4.3% during the same period. But with reshoring beingdriven by new technologies and trade increasingly being driven bytrade in services, the decoupling is not only restricted to GDP versusglobal trade but also a decoupling of growth in total global trade ingoods and services versus global seaborne trade. Consequently, globaltrade in goods and services is expected to grow by a expected CAGRfor of 3.9% in 2018-2023, while global seaborne trade is expected toincrease by a lower CAGR of 3.4%.
National protectionist trade policies and bilateral trade wars has led touncertainty and recent weakening in global trade, manufacturing andinvestment. However, the development of existing trade agreements,the establishment of new regional and bilateral trade agreements areexpected to continue. Thus, to some extent, the heighteneduncertainty will increase regional cooperation and a shift in globaltrade power.
THE GLOBAL ECONOMY AND SEABORNE TRADEGlobal economy and trade
Source: OECD, IMF, World Bank, IHS, Danish Ship Finance
GDP GROWTH AND TRADE (ANNUAL %-AGE GROWTH) INVESTMENT SHARE OF GDP AND FDI
-15
10
-10
5
-5
0
15
20072001 2003 2005 2009 2011 2013 2015 2017 2019 2021 2023
WorldChina
United States Advanced economies
total trade
seaborne trade
Trade volume of goods and services
300
0
150
60
45
15
600
30
0
450
2011 20172001 2003 20132005 2007 2009 2015 2019
China - FDI United States - FDI
Billion USDPercentage of GDP

Shipping Market Review – November 2018 21
THE GLOBAL ECONOMY AND SEABORNE TRADERegional trade agreements - One Belt One Road
In the autumn of 2013, Chinese President Xi Jinping presented theinitial idea of jointly building the Silk Road Economic Belt, and the 21stCentury Maritime Silk Road – also called the One Belt One Road(OBOR). The vision of OBOR is to promote economic prosperity, greendevelopment and regional economic cooperation, to strengthenexchanges and mutual learning between different civilisations, and topromote world peace and development via new models ofinternational cooperation and global governance connecting Asian,European and African countries. In 2015, further elaboration wasprovided, suggesting promotion of policy coordination, connectivity ofinfrastructure and facilities, unimpeded trade, financial integration andpeople-to-people bonds.
Thus, OBOR is much more than a trade union. And within Asia, it isperceived as a development programme with far-reaching implicationsfor East Asia and China. If implemented in its full extent, it will providefurther momentum for intra-Asia investment and trade flows, secureChina access to regional M&A activity within infrastructure, logisticsand tourism, and support the use of the RMB internationally viaconditioned infrastructure financing, thereby enabling it to becomeless dependent on the US relations.
A large share of the OBOR financing is expected to continuously comefrom Chinese financial institutions. Chinese investments related toOBOR totalled USD 60 billion in the years 2013-2017 and are expectedto increase to USD 600-800 billion in 2018-2022. With the AsianDevelopment Bank (ADB) estimating an infrastructure investmentneed in Asia Pacific of USD 1.7 trillion per year to maintain growthmomentum, the projected OBOR investments only represent a fractionof the future need. Actual annual spending in the region totals an
estimated USD 881 billion, leading to a gap between actual spendingand the estimated infrastructure spending requirement of around2.4% of regional GDP. Various sources that have mapped the currentOBOR project list indicate total investments of an estimated USD1,281 billion. With power, pipelines and other transport projectsaccounting for around 70% of the current project list, a minimum ofan extra 150 million tonnes of steel will be required over a ten-yearperiod, which implies incremental demand growth for steel in OBORregions of 3-4%. This represents a significant driver of future Dry Bulkdemand growth and is expected to some extent to mitigate theenvironmentally driven trend towards less use of iron ore in steelproduction. This estimate is only based on the existing project list andnot estimations of future projects.
OBOR is being met with significant regional resistance, and whetherthe full scope of the development programme will be implementedremains to be seen. But the existing project pipeline in infrastructureinvestments in power, railways, pipelines, ports and other transportprojects will continuously drive transport of the raw materials to beused in the actual construction. The expansion of ports and furtherdevelopment of hinterland infrastructure also means that OBOR willcontinue to drive changes in trading patterns and cascading withinshipping sectors.
The ongoing trade disputes between China and the US are notexpected to slow OBOR down – on the contrary, global trade andpolicy disputes are expected to support and further strengthenregional cooperation in various forms and with different targets andvisions (below table compares OBOR region and RCEP and TPPregions).
Indicator TPP TPP (excl. US) One Belt, One Road One Belt, One Road (excl. China) RCEP1 FTAAP1
No. of economies 12 11 65 64 16 21
Population 800 million 490 million 4.5 billion 3.2 billion 3.5 billion 2.9 billion
Nominal GDP (USD trillion) 27.5 9.4 29.8 12.0 22.6 43.8
% of global GDP 40 13 40 16 30 60
% Share of global trade 26 15 34 22 29 501 RECP refers Regional Comprehensive Economic Partnership. FTAAP refers to Free Trade Area of the Asia-Pacific Source: OECD, IMF, WTO, UOB Bank, The Copenhagen Journal of Asian Studies 35(2), Danish Ship Finance
Shipping Market Review – November 2018 22
MARPOL Annex VI - IMO 2020
REGULATORY CHALLENGES
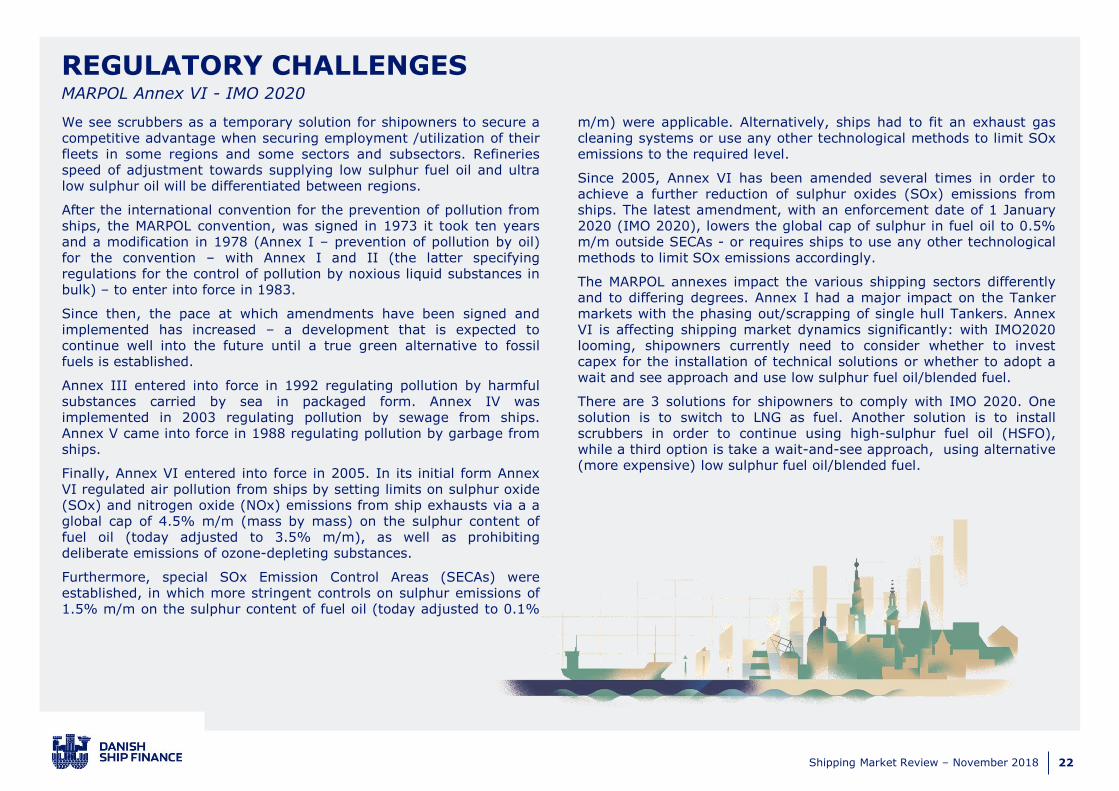
We see scrubbers as a temporary solution for shipowners to secure acompetitive advantage when securing employment /utilization of theirfleets in some regions and some sectors and subsectors. Refineriesspeed of adjustment towards supplying low sulphur fuel oil and ultralow sulphur oil will be differentiated between regions.
After the international convention for the prevention of pollution fromships, the MARPOL convention, was signed in 1973 it took ten yearsand a modification in 1978 (Annex I – prevention of pollution by oil)for the convention – with Annex I and II (the latter specifyingregulations for the control of pollution by noxious liquid substances inbulk) – to enter into force in 1983.
Since then, the pace at which amendments have been signed andimplemented has increased – a development that is expected tocontinue well into the future until a true green alternative to fossilfuels is established.
Annex III entered into force in 1992 regulating pollution by harmfulsubstances carried by sea in packaged form. Annex IV wasimplemented in 2003 regulating pollution by sewage from ships.Annex V came into force in 1988 regulating pollution by garbage fromships.
Finally, Annex VI entered into force in 2005. In its initial form AnnexVI regulated air pollution from ships by setting limits on sulphur oxide(SOx) and nitrogen oxide (NOx) emissions from ship exhausts via a aglobal cap of 4.5% m/m (mass by mass) on the sulphur content offuel oil (today adjusted to 3.5% m/m), as well as prohibitingdeliberate emissions of ozone-depleting substances.
Furthermore, special SOx Emission Control Areas (SECAs) wereestablished, in which more stringent controls on sulphur emissions of1.5% m/m on the sulphur content of fuel oil (today adjusted to 0.1%
m/m) were applicable. Alternatively, ships had to fit an exhaust gascleaning systems or use any other technological methods to limit SOxemissions to the required level.
Since 2005, Annex VI has been amended several times in order toachieve a further reduction of sulphur oxides (SOx) emissions fromships. The latest amendment, with an enforcement date of 1 January2020 (IMO 2020), lowers the global cap of sulphur in fuel oil to 0.5%m/m outside SECAs - or requires ships to use any other technologicalmethods to limit SOx emissions accordingly.
The MARPOL annexes impact the various shipping sectors differentlyand to differing degrees. Annex I had a major impact on the Tankermarkets with the phasing out/scrapping of single hull Tankers. AnnexVI is affecting shipping market dynamics significantly: with IMO2020looming, shipowners currently need to consider whether to investcapex for the installation of technical solutions or whether to adopt await and see approach and use low sulphur fuel oil/blended fuel.
There are 3 solutions for shipowners to comply with IMO 2020. Onesolution is to switch to LNG as fuel. Another solution is to installscrubbers in order to continue using high-sulphur fuel oil (HSFO),while a third option is take a wait-and-see approach, using alternative(more expensive) low sulphur fuel oil/blended fuel.

Shipping Market Review – November 2018 23
One solution for compliance with IMO 2020 could be to switch to LNGas fuel. However, significant capex is required for a complexretrofitting which ultimately reduces cargo capacity. Moreover thereare significant infrastructure limitations as LNG fuel is only available ata limited number of ports. This solution is therefore most suited tovessels with predictable operating patterns throughout their lifetimes(f.ex. the cruise industry, ferries etc).
Another option is to install scrubbers. In general, installation of ascrubber solution requires a significant capex for retrofitting rangingbetween USD 2 million to USD 6 million depending on ship type andscrubber type. In addition, a scrubber installation adds weight,reduces cargo capacity and generates additional operational costs, butit does allow for a continued use of HSFO. Depending on the fuel pricespread between HSFO and low sulphur oil/blended fuel (as illustrated),payback period could be relatively short, especially for the larger
vessels and those that consume more fuel (as illustrated).Furthermore, there are various types of scrubber installation. While allwill comply with IMO 2020 initially, some are expected to requirefurther environmentally driven amendments/adjustments in the nearfuture. For example, the cheaper open-loop scrubbers dispose thewaste directly into the ocean, whereas closed loop scrubbers collectthe waste for disposal at port.
Given, especially China’s increasing environmental focus, we believe itis likely that even stricter regulations than IMO 2020 will be imposedon national levels, for example restricting the disposal of wastedirectly in the ocean, further Nox regulations and creating new SECAsand expanding/enlarging existing SECAs, in which the current SECAlimit of 0.1% m/m would apply.
REGULATORY CHALLENGESIMO 2020 – compliance solutions
Source: Clarksosn, SEB, Jefferies, Danish Ship Finance
FUEL CONSUMPTION FOR VESSELS <15 YEARS (‘000 TONNES PER YEAR) SCRUBBER PAYBACK PERIOD – A SOLUTION FOR SOME BUT NOT FOR ALL
0
20
40
60
80
Capesi
ze
Panam
ax
Handysiz
e
8-1
1,9
99 t
eu
6-7
,999 t
eu
Feeder
VLCC
Suezm
ax
Afr
am
ax
LR2
LR1
MR
Dry Bulk Container Crude Tanker Products Tanker
Top 20%
Majority 60%
Bottom 20%
0.0
1.5
3.0
4.5
6.0
Capesiz
e
Panam
ax
Handysi
ze
8-1
1,9
99 t
eu
6-7
,999 t
eu
Feeder
VLCC
Suezm
ax
Afr
am
ax
LR2
LR1
MR
Dry Bulk Container Crude Tanker Products Tanker
Years
Fuel Spread - $100
Fuel Spread - $200
Fuel Spread - $300
Shipping Market Review – November 2018 24
IMO 2020 – compliance solutions
REGULATORY CHALLENGES
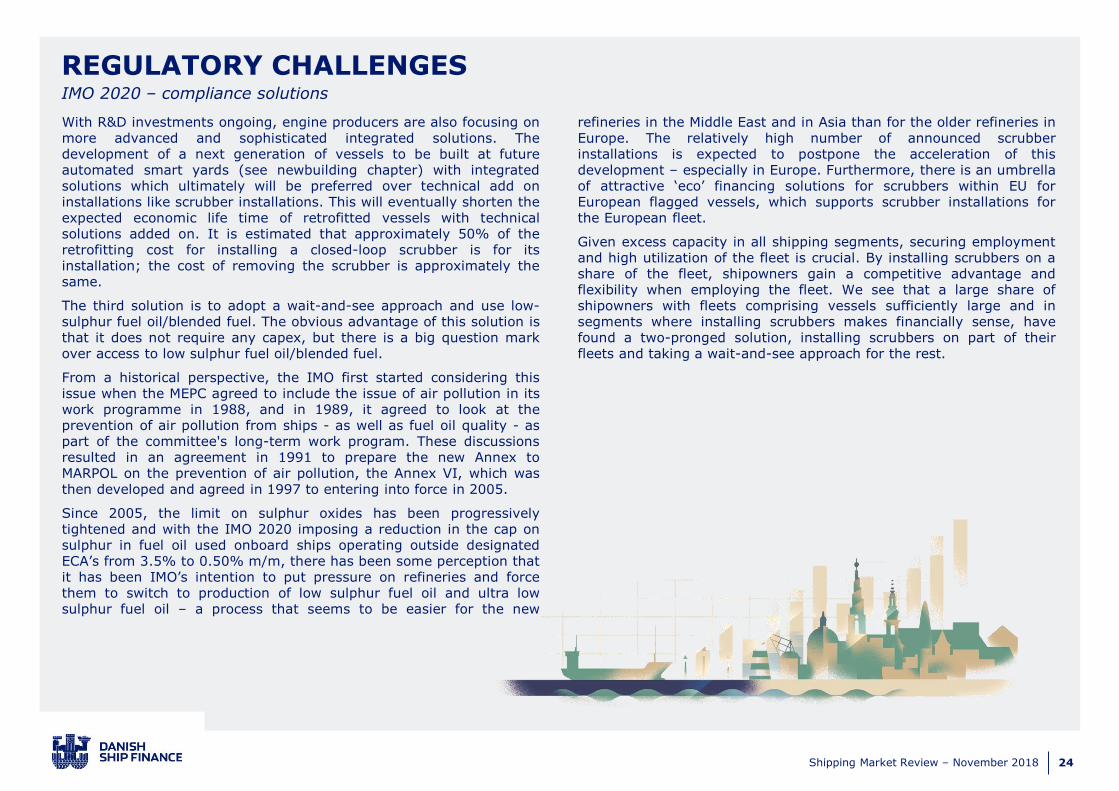
With R&D investments ongoing, engine producers are also focusing onmore advanced and sophisticated integrated solutions. Thedevelopment of a next generation of vessels to be built at futureautomated smart yards (see newbuilding chapter) with integratedsolutions which ultimately will be preferred over technical add oninstallations like scrubber installations. This will eventually shorten theexpected economic life time of retrofitted vessels with technicalsolutions added on. It is estimated that approximately 50% of theretrofitting cost for installing a closed-loop scrubber is for itsinstallation; the cost of removing the scrubber is approximately thesame.
The third solution is to adopt a wait-and-see approach and use low-sulphur fuel oil/blended fuel. The obvious advantage of this solution isthat it does not require any capex, but there is a big question markover access to low sulphur fuel oil/blended fuel.
From a historical perspective, the IMO first started considering thisissue when the MEPC agreed to include the issue of air pollution in itswork programme in 1988, and in 1989, it agreed to look at theprevention of air pollution from ships - as well as fuel oil quality - aspart of the committee's long-term work program. These discussionsresulted in an agreement in 1991 to prepare the new Annex toMARPOL on the prevention of air pollution, the Annex VI, which wasthen developed and agreed in 1997 to entering into force in 2005.
Since 2005, the limit on sulphur oxides has been progressivelytightened and with the IMO 2020 imposing a reduction in the cap onsulphur in fuel oil used onboard ships operating outside designatedECA’s from 3.5% to 0.50% m/m, there has been some perception thatit has been IMO’s intention to put pressure on refineries and forcethem to switch to production of low sulphur fuel oil and ultra lowsulphur fuel oil – a process that seems to be easier for the new
refineries in the Middle East and in Asia than for the older refineries inEurope. The relatively high number of announced scrubberinstallations is expected to postpone the acceleration of thisdevelopment – especially in Europe. Furthermore, there is an umbrellaof attractive ‘eco’ financing solutions for scrubbers within EU forEuropean flagged vessels, which supports scrubber installations forthe European fleet.
Given excess capacity in all shipping segments, securing employmentand high utilization of the fleet is crucial. By installing scrubbers on ashare of the fleet, shipowners gain a competitive advantage andflexibility when employing the fleet. We see that a large share ofshipowners with fleets comprising vessels sufficiently large and insegments where installing scrubbers makes financially sense, havefound a two-pronged solution, installing scrubbers on part of theirfleets and taking a wait-and-see approach for the rest.
Shipping Market Review – November 2018 25
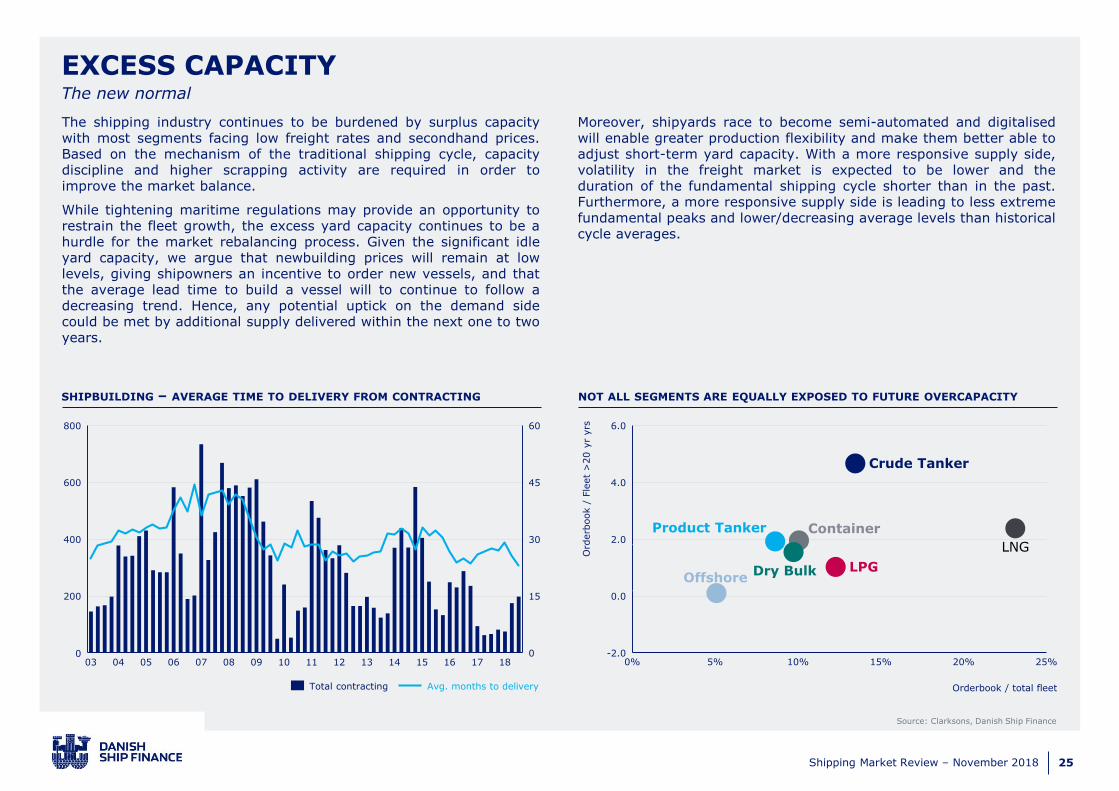
The shipping industry continues to be burdened by surplus capacitywith most segments facing low freight rates and secondhand prices.Based on the mechanism of the traditional shipping cycle, capacitydiscipline and higher scrapping activity are required in order toimprove the market balance.
While tightening maritime regulations may provide an opportunity torestrain the fleet growth, the excess yard capacity continues to be ahurdle for the market rebalancing process. Given the significant idleyard capacity, we argue that newbuilding prices will remain at lowlevels, giving shipowners an incentive to order new vessels, and thatthe average lead time to build a vessel will to continue to follow adecreasing trend. Hence, any potential uptick on the demand sidecould be met by additional supply delivered within the next one to twoyears.
Moreover, shipyards race to become semi-automated and digitalisedwill enable greater production flexibility and make them better able toadjust short-term yard capacity. With a more responsive supply side,volatility in the freight market is expected to be lower and theduration of the fundamental shipping cycle shorter than in the past.Furthermore, a more responsive supply side is leading to less extremefundamental peaks and lower/decreasing average levels than historicalcycle averages.
EXCESS CAPACITYThe new normal
Source: Clarksons, Danish Ship Finance
SHIPBUILDING – AVERAGE TIME TO DELIVERY FROM CONTRACTING NOT ALL SEGMENTS ARE EQUALLY EXPOSED TO FUTURE OVERCAPACITY
15200
0
400
600
800
0
30
45
60
130503 04 06 07 08 1809 10 11 12 14 15 16 17
Total contracting Avg. months to delivery
0% 25%5%-2.0
10% 20%15%
6.0
0.0
2.0
4.0
Orderbook / total fleet
Ord
erb
ook /
Fle
et
>20 y
ryrs
Dry Bulk
Crude Tanker
ContainerProduct Tanker
LNG
LPGOffshore

Shipping Market Review – November 2018 26
THE SHIPBUILDING MARKET
SHIPPING MARKET REVIEW – NOVEMBER 2018

Shipping Market Review – November 2018 27
OU
TLO
OK
SU
MM
AR
Y
POSITIVE
NEUTRAL
NEGATIVE
THE SHIPBUILDING MARKETPerspectives and key takeaways
The Shipbuilding industry continues to be burdened by surplus capacityand the yards’ orderbooks are thinning quickly. Most of ship segmentsare facing low freight rates and deteriorating secondhand prices. Theoutlook for most of the yards remains shrouded in uncertainty. Amidgeopolitical tensions, the risk of seaborne demand stalling, newenvironmental regulations, and new standards for digital ships,shipowners are putting plans to order new vessels on hold. This trendis unlikely to change until freight rates recover and the risk of buildingvessels that quickly become outdated seems more manageable.
The harsh market conditions are continuing to drive a consolidationprocess whereby some yards are closing, others are merging and someare simply reducing active capacity. There are currently 590 yardsglobally with a combined capacity of approximately 45 million cgt, butonly 150 yards have received new orders in 2018. These orders haverestocked approximately 46% of the active global yard capacity, butthey are unevenly distributed, with ten yards accounting for 57% ofthe orders (cgt). More than 290 yards, representing 28% of globalyard capacity, will run out of orders within the next 12 months.
The Shipbuilding industry is scheduled to utilise approximately 79% ofits capacity in 2018 but is rapidly losing steam. The orderbook isheavily front-loaded and contains only 3,000 vessels with a combinedcapacity of 78 million cgt (approximately 10% of the current fleet).
Yards are reducing capacity or exiting themarket helping to restore the marketbalance. Still, many yards are running outof orders while just a few are attractingthe lion’s share of new contracts. Weexpect that the number of active yards tocontinue to decline, but the active yardcapacity remains more resilient.Competition in the industry is intensifying.The shipyards of the future will upgradeproduction and potentially begin to buildsmarter ships.
We expect that many shipyards will go out of business in the comingyears, while active yard capacity may remain relatively stable. Webelieve some yards will reactivate idled capacity when smaller or moreinefficient yards exit the market. Still, the strong state interests are inmany countries reducing the industry’s ability to balance the capacitysince government support or debt guarantees are allowing localshipyards to stay in operation even if they are loss-making. TheShipbuilding industry will continue to consolidate in the years to come,but we anticipate a bumpy road ahead.
The shipyards of the future will aspire to become ‘smart’ yards – semi-automated and digitalised yards (beyond welding, robots etc.) –capable of building the next generation of vessels. Digitalisation willnot be for everyone, though: many shipyards will be forced to make adecision, since the transformation into a smart yard will requiremassive investments in a period where many yards are already debtburdened.
The next generation of ships are likely to be highly standardised, notjust in terms of vessel and engine design, but equally importantly interms of connected digital infrastructures. The role of the yards couldexpand into maintenance with the ambition of becoming a single-point-of-contact for the shipowner. This could allow multiple streamsof revenue to be developed. The challenge will be to integrate into anetwork of third-party players that will allow the creation of valuebeyond building the vessels. It remains to be seen whether this willhappen, but these dynamics will add new dimensions to thecompetitive landscape in the Shipbuilding industry.

Shipping Market Review – November 2018 28
Since the beginning of 2017, contracting activity has increased forfour consecutive quarters, and it peaked in the first quarter of 2018with nine million cgt contracted, equivalent to the industry restocking80% of its quarterly active yard capacity. However, the Shipbuildingindustry seems to have harvested most of the positive sentiment fromthe new environmental regulations, and the appetite for new ordershas levelled off since the second quarter of this year. Shipowners havebecome more cautious amid regulatory uncertainty, trade tensionsbetween the US and China, and the existing overcapacity concerns.
Orders for new vessels continue to be concentrated at fewer yards.The 21 million cgt contracted during the first three quarters of 2018was distributed among 150 different yards, with 57% of the contractsplaced at ten yards across China, Japan and South Korea. WhileChinese and Japanese yards have struggled to restock their activeyard capacity during 2018, South Korean yards have benefited fromthe uptick in Gas and Tanker orders and have managed to cover 80%
of their active yard capacity. Overall contracting activity continues tobe insufficient for the Shipbuilding industry as the aggregated cgtcontracted only represents 46% of global active yard capacity.
With a subdued level of new orders and on-time deliveries, the globalorderbook has continued to show a declining trend. As of October2018, the orderbook stood close to 78 million cgt, a 3% decreasesince the end of 2017. The orderbook remains dominated by the top-three Shipbuilding nations in Asia, which together claim a 80% marketshare. While South Korean yards have managed to attract moreorders than vessels delivered, the aggregated orderbook for Japaneseyards has decreased significantly by 3.8 million cgt and stood at 13.5million cgt as of October 2018, the lowest level recorded since the endof 2002. Should the orderbook for Japanese yards continue to decline,aid initiatives from the government are not out of the question.
THE SHIPBUILDING MARKETThe orderbook and contracting activity
Source: Clarksons, Danish Ship Finance
CONTRACTING – 2018 Q3 (MILLION CGT) SHIPBUILDING ORDERBOOK - STOCK AND FLOWS (MILLION CGT)
0
3
12
9
6
EuropeSouth Korea
38%
China
80% 27%
Japan
55% 15%
RoW
Bulk Others ex. CruiseGas OffshoreContainer Cruise Tanker
80
30
120
-80
-40
0
40
60
90
150
201720152012 2013 2014 2016 2018
Orderbook China JapanSouth Korea Europe RoW
Orderbook >><< Contracting
<< Deliveries
Share of annual active capacity-

Shipping Market Review – November 2018 29
THE SHIPBUILDING MARKETOrder cover and yard capacity
The persistent excess capacity in major shipping segments continuesto exert a drag on demand for Shipbuilding capacity. Currently, morethan 85% of the vessels on order are scheduled to be delivered by2020. The front-loaded nature of the orderbook presents an inevitablechallenge for the sustainability of the global Shipbuilding industry.Over the past six months, average order cover has continued todecline for most Shipbuilding nations. South Korea appears to be anexception, with order cover at yards there having increased steadilysince the end of 2017. This is explained by a 20% increase in theorderbook combined with a 20% reduction in active yard capacity.
Despite the ongoing consolidation process in both the Chinese andSouth Korean Shipbuilding industries, total active yard capacity hasbeen more resilient than expected. Since the previous edition of thisreport, 15 yards with a total capacity of two million cgt have closed.However, the reduction in capacity has been offset by the reactivation
of 115 small and insignificant yards, equivalent to 1.4 million cgt or3% in active yard capacity. Consequently, the number of active yardshas increased by 100 units from 490 to 590, while the projectedglobal active yard capacity for 2018 remains close to 45 million cgt.This is in line with our estimate in the May 2018 edition of this report.
With limited capacity discipline, an increasing number of active yardsare competing for a subdued level of new orders. As a result, manyyards are struggling to restock their active yard capacity. In fact, only36% of the active yard capacity has order cover of more than twoyears, while 290 yards, equivalent to 28% of total yard capacity, haveless than one year of order cover. Moreover, 140 of these 290 yardsare at risk of their business being discontinued, as they have deliveredtheir last recorded orders.
Source: Clarksons, Danish Ship Finance
DEVELOPMENT IN ORDER COVERS ACTIVE YARD CAPACITY IN 2018 (MILLION CGT)ORDERBOOK BY DELIVERY YEAR (MILLION CGT)
No. of yards-
201920162012 2013 2014 20172015 20180
1
2
3
4
China
Europe
Global
South Korea
Japan
<< Order cover (years)
Years of order cover
0
10
20
30
40
2018 Q3
40%
15%
2019
30%
2020
9%
2021
3%
2022
China South Korea Japan RoWEurope
Share of orderbook-290
230
50
30
20
15
0
5
10
3+1-20-1 2-3
RoWJapanChina EuropeSouth Korea

Shipping Market Review – November 2018 30
Global active yard capacity in 2018 is projected to decrease by 3%from the 2017 level. This is primarily due to a significant reduction of4.5 million cgt from second-tier1 yards, while active capacity at first-tier yards has increased by 2.9 million cgt. Consequently, the two-tierstructure is becoming more pronounced, as first-tier yards account formore than 80% of the global active capacity measured in cgt terms.
Based on currently scheduled deliveries, global yard utilisation isestimated to reach a five-year high of 79% in 2018 before dropping to73% in 2019. Moreover, should no new orders be placed at yards withorder cover of less than a year, the number of active yards isestimated to shrink by 250 units to 340 by the end of 2019. Despitethe significant contraction in the number of active yards, total activecapacity is estimated to decrease by 7%, indicating a higherconcentration of capacity at fewer and larger yards. This is in line withguidelines issued by China’s Ministry of Industry and Information
Technology in January 2017, with a target for the top-ten domesticShipbuilding companies to account for more than 70% of the nationaloutput by 2020.
With political interests interfering with market fundamentals, it maytake years before the market balance is restored. It will be interestingto monitor how the political agenda will impact the ongoingconsolidation process. Hence, in order to survive the prolongeddownturn, Shipbuilding companies will have to seek a competitiveedge to become tomorrow’s leaders.
THE SHIPBUILDING MARKETThe market outlook
Source: Clarksons, Danish Ship Finance
FIRST AND SECOND-TIER YARD CAPACITY DEVELOPMENT IN ACTIVE YARD CAPACITY (MILLION CGT)
20
60
40
0
80
2006 2007 2008 2009 2010 2011 2012 2013 2014 2015 2016 2017 2018 2019
First-tier capacity Second-tier capacity
900960
1.050
1.180 1.1901.150
1.080
990
900
790720
640590
340
OrderbookNo. of yards Deliveries
0
5
10
15
20
South Korea
83%
China
100% 76%
Japan
72% 68%
Europe RoW
First-tier capacity Second-tier Capacity
Active yard capacity utilisation-

Shipping Market Review – November 2018 31
Shipbuilding has been classified as a strategically importantindustry for China, Japan and South Korea. In order tobecoming the leading Shipbuilding nation, shipyards in thesecountries are embracing innovation in the upcoming efficiencyrace. However, the new technology will not only lead to apotential cost advantage, but also productivity gains, whichmay result in an increase in yard capacity.
While deleveraging and consolidation of excess yard capacity havebeen and are still the main focus, the global Shipbuilding industry issimultaneously facing challenges arising from a deterioration inoperating profitability. A subdued level of contracting activity andincreasing input prices are forcing shipyards to reconsider theircurrent business models.
In the search for cost leadership and timely construction, the majorshipyards are tackling the profitability equation by further increasingproductivity and working towards a “smart yard” model, which entailsan increasing degree of collaborative robotics, digitalisation of yardmachineries, and automated plants. However, not all yards are at thesame stage in their business model transformation. With an averageautomation rate close to 70%, the largest Japanese and South Koreanyards are likely to be the first to approach the smart yard model. Incomparison, the average automation rate for Chinese yards isestimated to be significantly lower at 25-30%.
Even though the share of total output delivered from Chinese yardscontinues to increase, average productivity (measured in hours/cgtproduced) at Chinese yards is only one-third of the average levelachieved by Japanese and South Korean yards. In the race to becometomorrow’s leading Shipbuilding nation, the Chinese government hasset a target for white-listed yards to improve their productivity froman average of 30 hours/cgt to 15-20 hours/cgt by 2020, hence movingcloser to the standard of South Korean yards of 15 hours/cgt.Currently, the white-listed yards account for 65% of total active yardcapacity in China, which is equivalent to 11 million cgt. Should these
yards meet the target by 2020, active capacity for Chinese yards couldpotentially increase by 50% or more.
Not all shipyards will opt for digitalisation, though, since thetransformation into a smart yard will require massive investments in aperiod when many are already debt burdened. Some yards willpresumably take a wait-and-see approach, although this runs the riskof being left behind.
The next generation of yards will undoubtedly provide greaterproduction flexibility and a greater ability to adjust short-term yardcapacity. Many yards will close, and active yard capacity will mostlikely be consolidated at just a few yards. Newbuilding prices couldstay relatively stable, since additional demand could be met by ashort-term increase in yard capacity.
SHIPBUILDING DEEP DIVE: EFFICIENCY RACEThe double-edged sword of yard capacity optimisation
Source: Clarksons, Danish Ship Finance
DEVELOPMENT IN DELIVERY ACTIVITY (MILLION CGT)
80%
0%
60%
20%
40%
100%
2006 2012 201420082005 2007 2009 2010 2011 2013 2015 2016 2017 2018e
EuropeChina Rest of the worldSouth Korea Japan

Shipping Market Review – November 2018 32
THE CONTAINER MARKET
SHIPPING MARKET REVIEW – NOVEMBER 2018

Shipping Market Review – November 2018 33
OU
TLO
OK
SU
MM
AR
Y
POSITIVE
NEUTRAL
NEGATIVE
THE CONTAINER MARKETPerspectives and key takeaways
Demand in the Container industry is shifting towards more regionalisedtrading networks, which is expected to have a negative impact ondemand growth for large Container vessels, while it could increasedemand for the smaller vessels. Nevertheless, the supply sidecontinues to pursue a strategy of cost leadership by ordering largerand more efficient vessels.
The current orderbook is split between 252 small vessels (<4,000 teu)and 144 large units (>8,000 teu). Whereas the orderbook for smallervessels can be absorbed by scrapping of units older than 20 years, theage profile of the fleet above 8,000 teu includes limited demolitionopportunities. Consequently, composition of the Container fleet isprojected to remain skewed upon delivery of the orderbook.
Over the coming years, the Container industry will continue to strugglewith overcapacity, notably for the larger vessel segments. The inflowof Ultra Large Container vessels (ULCV) will exert significant downwardpressure on the midsize segment (3,000-9,999 teu), while we arguethat he Feeder segment will remain protected in the short to mediumterm due to infrastructural constraints. With tonnage providers owningtwo-third of the midsize segment currently, they are expected to sufferthe most from the cascading pressure, as reemployment risk remainssignificant due to the growing oversupply.
While the short-term outlook is reliant onthe timing of deliveries, the medium-termoutlook is clouded by macroeconomicuncertainties. Delivery of large vessels willcontinue to exert a downward pressure onthe midsize segment where reemploymentrisks are mounting for vessels owned bytonnage providers. Capacity managementwill remain the focus for liner operators inan oversupplied market, while impendingregulatory initiatives are set to increasethe complexity of liner business.
WHERE WE ARE IN THE FREIGHT RATE CYCLE
A combination of overcapacity, low box rates and surging fuel costs iscurrently depressing the profitability of liner operators significantly.Moreover, the upcoming regulatory initiatives will further add to theuncertainties involved in running a liner business.
Although the deadline to ensure the IMO 2020 compliance is closing in,no uniform strategy has emerged. Owners are considering solutionsthat each have their pros and cons. Irrespective of which solution ischosen, we expect slow steaming to be a central element of fuelcompliance strategies, as past experience suggests that this is anefficient way of achieving lower fuel consumption and emissionsrapidly, at the same time as reducing the overall effective fleetcapacity. However, the practice of slow steaming remains subject toreversal and will be determined by the supply and demand balance.
The next challenge for the industry could be the upcoming review ofthe maritime consortia block exemption regulation, which allows lineroperators with a combined market share of less than 30% to enter intoalliances up to April 2020. Should the exemption not be granted in theupcoming review, additional capacity would be required in order tomaintain existing service coverage of liner operators. This could triggera new wave of newbuilding orders. Consequently, the competitivelandscape for liner operators would intensify and the industry couldspiral into severe overcapacity.
Source: Danish Ship Finance
Tonnage providers
Liner operators

Shipping Market Review – November 2018 34
With a broad based recovery in demand and more stringent capacitycontrol, box rates exhibited an overall positive performance during2017, with the CCFI index up by an average of 15% compared withthe average 2016 level. However, the rising trend in box rates stalledand rates have become more volatile during 2018, which is explainedby supply pressure from deliveries of large vessels.
While box rates have continued to be volatile, timecharter rateshave maintained the positive momentum from 2017, backed by a firmdemand outlook and an idle fleet that remains below 3% across theboard. As of September 2018, timecharter rates were up by anaverage of 20% from the end of 2017. Thanks to the improvingsupply-demand balance on both North-South and Intra-Asian trade,the short-term timecharter rate for Old Panamax vessels (4,400 teuwith narrow beam) showed the most significant uptick of 49%, albeitfrom a low level of USD 8,000/day by the end of 2017.
The newbuilding price for Feeder containers (<3,000 teu) has risenby 16% since the end of 2017. It continues to be the main contributorto the steady increase in the average Container newbuilding pricewhich rose by 10% during the first three quarters of 2018.
After a record year of secondhand sales in 2017, activity has lostmomentum during 2018. With 149 vessels changing hands, thenumber of transactions declined by 38% year-on-year during the firstthree quarters of the year. Nevertheless, the average secondhandprice for a five-year-old Container vessel increased by 16% during theperiod, reflecting the market optimism. Despite the fact that 66% ofthe recorded transactions involved Feeder vessels, the largestsecondhand price increase, 35% on average, was observed for OldPanamax vessels, albeit from a very low level. The increase insecondhand values is in line with the development in timecharterrates.
THE CONTAINER MARKETFreight rates and ship prices
Source: Clarksons, Danish Ship Finance
AVERAGE BOX RATE OUT OF CHINA (INDEX) SECONDHAND PRICES – 5 YEARS (USD MILLION)
2014
1,600
201920152013 2016 2017 20180
400
800
1,200
+4%
90
20182013 201720140
2015 20192016
30
120
60
13,000 teu1,700 teu 3,400 teu 8,800 teuCCFI

Shipping Market Review – November 2018 35
THE CONTAINER MARKETSupply-side development
The performance of freight market continues to be determined bychanges in the supply-demand balance, notably for the larger unitswhich are currently suffering from overcapacity. Consequently, 0.27million teu, or 21% of deliveries scheduled for this year, has beenpostponed into 2019. These are mainly vessels larger than 10,000teu.
Since the beginning of the year, one million teu has been delivered,equivalent to a delivery performance of 79%. Based on this, totaldeliveries in 2018 are expected to amount to 1.2 million teu, similarto the level seen in 2017, and the capacity inflow will continue to bedominated by vessels above 8,000 teu. Assuming no furthercancellations, postponements and demolition, the total Container fleetis projected to increase by 6% in 2018. However, fleet growth varieswithin subsegments: the Feeder fleet and the fleet of vessels above8,000 teu are expected to expand by 5% and 11%, respectively, while
the fleet of vessels between 3,000-8,000 will remain stable.
Contracting activity has remained subdued during 2018, with onemillion teu contracted, split between 20 ULVC (>15,000 teu), 38 largeContainer vessels (10,000-15,000 teu) and 90 Feeders (below 3,000teu). Contracting of large Container vessels has been led by tonnageproviders, which have ordered 30 vessels to be delivered from 2020onwards. This is expected to put further cascading pressure on themarket for midsize Container vessels even though the currentorderbook for this segment is non-existing.
An upward trajectory in the timecharter market has reduced theincentive for owners to retire ageing tonnage. Scrapping activityremains insignificant with 0.04 million teu demolished during the firstthree quarters. The lower scrapping level has caused the averagescrapping age to rise from 21 years in 2017 to 24 years in 2018.
Source: Clarksons, Danish Ship Finance
FLEET DEVELOPMENT (MILLION TEU) ORDERBOOK BY DELIVERY YEAR (MILLION TEU)AGE DISTRIBUTION OF FLEET (MILLION TEU)
2.5
0.0
7.5
5.0
10.0
5-100-5 10-15
35%
30%
22%
9%
15-20
3%
20-25
1%
25+
13%
Orderbook-1
0
1
2
3
2014 2020
7%
8%
2013
5%
2015
1%
2016
4%
2017
6%
2018
5%
2019
5%
Percentage of fleet Annual fleet growth Deliveries
Scrapping
Feeder+15,000 teu 12-14,999 teu 8-11,999 teu 6-7,999 teu 3-5,999 teu Old Panamax
0.0
0.8
0.4
1.2
1.6
2019
1%
2018
5%5%
2020
2%
2021
Percentage of fleet
Orderbook
Shipping Market Review – November 2018 36
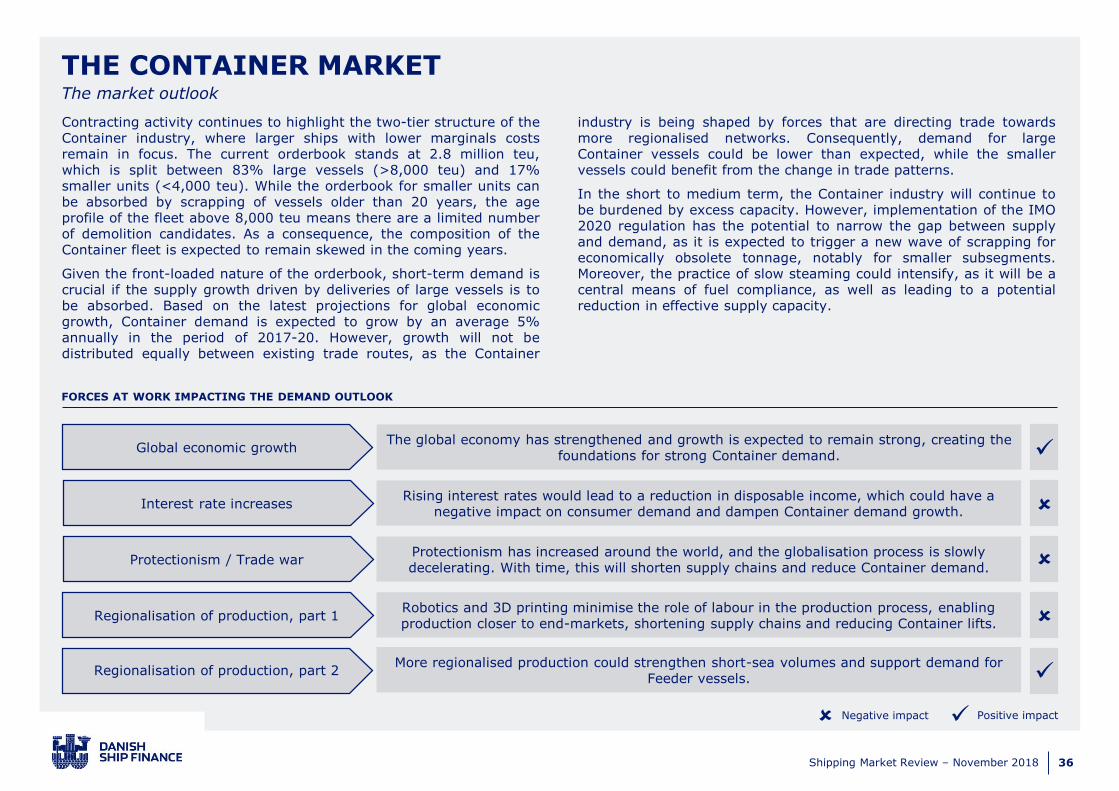
Positive impactNegative impact ✓
Contracting activity continues to highlight the two-tier structure of theContainer industry, where larger ships with lower marginals costsremain in focus. The current orderbook stands at 2.8 million teu,which is split between 83% large vessels (>8,000 teu) and 17%smaller units (<4,000 teu). While the orderbook for smaller units canbe absorbed by scrapping of vessels older than 20 years, the ageprofile of the fleet above 8,000 teu means there are a limited numberof demolition candidates. As a consequence, the composition of theContainer fleet is expected to remain skewed in the coming years.
Given the front-loaded nature of the orderbook, short-term demand iscrucial if the supply growth driven by deliveries of large vessels is tobe absorbed. Based on the latest projections for global economicgrowth, Container demand is expected to grow by an average 5%annually in the period of 2017-20. However, growth will not bedistributed equally between existing trade routes, as the Container
industry is being shaped by forces that are directing trade towardsmore regionalised networks. Consequently, demand for largeContainer vessels could be lower than expected, while the smallervessels could benefit from the change in trade patterns.
In the short to medium term, the Container industry will continue tobe burdened by excess capacity. However, implementation of the IMO2020 regulation has the potential to narrow the gap between supplyand demand, as it is expected to trigger a new wave of scrapping foreconomically obsolete tonnage, notably for smaller subsegments.Moreover, the practice of slow steaming could intensify, as it will be acentral means of fuel compliance, as well as leading to a potentialreduction in effective supply capacity.
THE CONTAINER MARKETThe market outlook
FORCES AT WORK IMPACTING THE DEMAND OUTLOOK
The global economy has strengthened and growth is expected to remain strong, creating the foundations for strong Container demand.
Rising interest rates would lead to a reduction in disposable income, which could have a negative impact on consumer demand and dampen Container demand growth.
Protectionism has increased around the world, and the globalisation process is slowly decelerating. With time, this will shorten supply chains and reduce Container demand.
Robotics and 3D printing minimise the role of labour in the production process, enabling production closer to end-markets, shortening supply chains and reducing Container lifts.
Global economic growth
Interest rate increases
Protectionism / Trade war
Regionalisation of production, part 1
✓More regionalised production could strengthen short-sea volumes and support demand for
Feeder vessels.Regionalisation of production, part 2
✓

Shipping Market Review – November 2018 37
The Container industry is struggling with excess capacity, lowfreight rates, increasing fuel costs, and the impending IMO2020 regulation is adding further to the burden. Moreover, theupcoming review of the consortia block exemption regulationcould rattle the industry dynamics, notably on the supply side.
Bunker costs constitute a considerable share of expenses for linercompanies. Rising bunker costs are only partially compensated for bya surcharge to freight rates. The recent surge in bunker costs isexpected to have a negative impact on profit margins for Containeroperators. Moreover, the IMO 2020 legislation is expected to put afurther upward pressure on bunker costs.
Although the deadline for ensuring compliance is closing in, nouniform strategy has emerged. Owners are considering solutionsranging from newbuilding units equipped with LNG engines, to utilisingblended low-sulphur fuel or retrofitting existing vessels withscrubbers. Each option has its pros and cons. While the first twooptions are applicable for all vessels sizes, retrofitting with scrubbersmakes more economic sense for larger and younger vessels, assumingsignificant fuels price spreads from 2020 onward.
There is no doubt that IMO 2020 sulphur regulation is causingadditional operational uncertainty for liner business, but it issimultaneously creating an incentive for owners to demolish ageingand economically obsolete tonnage. However, vessels above 20 yearsold are predominately Feeders, while vessels larger than 8,000 teuonly represent 2% of the one million teu of potential scrappingcandidates. Hence, demolition of these units will do little to mitigatethe existing overcapacity concerns caused by the inflow of largevessels
While scrapping of ageing units will not do much to help either IMO2020 fuel compliance or the oversupply in the market, past experiencesuggests that slow steaming is an efficient way to lower fuelconsumption and emissions quickly, while reducing the overalleffective fleet capacity at the same time. Hence, the practice of slowsteaming is expected to continue and it will bring significant relief for
the Container industry. However, we believe that slow steamingremains subject to reversal and will be determined by the supply anddemand balance.
As a consequence of the excess capacity, consolidation and networkoptimisation have been the main themes in the Container industryover the past few years. Consequently, liner operators have mergedand established alliances in order to increase utilisation in anoversupplied market. This has been possible under the maritimeconsortia block exemption regulation, which remains valid until April2020. The first exemption was adopted in 1995 and has beenextended several times. Should the exemption not be granted in theupcoming review, additional capacity would be required in order tomaintain existing service coverage of liner operators. This couldtrigger a new wave of newbuilding orders. As a consequence, thecompetitive landscape in the Container industry could intensify andliner operators would come under further pressure.
CONTAINER MARKET DEEP DIVE: REGULATORY INTERRUPTIONS The industry is embattled by regulatory threats
Source: Clarksons, Danish Ship Finance
FUEL CONSUMPTION (TONNES PER YEAR)1
80,000
60,000
40,000
0
20,000
12-14,999 teu 8-11,999 teu 6-7,999 teu 3-5,999 teu Feeder
Top 20% Majority 60% Bottom 20% Median
1 For vessels younger than 15 years of age

Shipping Market Review – November 2018 38
Many liner operators continue to pursue a strategy of cost leadership,ordering larger vessels to cut unit costs. Currently, vessels larger than10,000 teu account for more than 80% of the orderbook in capacityterms. Half of these newbuilds are Ultra Large Container vessels(ULCVs) of above 15,000 teu, and are scheduled to be delivered bythe end of 2020. Delivery of these ULCVs is expected to set off a newwave of cascading, with smaller units (<15,000 teu) on the Asia-Europe trade pushed out and redeployed to other trade routes.
While we argue that the Feeder segment remains protected from thecascading pressure in the short to medium term due to infrastructuralconstraints, the midsize segment (3,000-9,999 teu) will continue to beexposed to intensified competition due to the inflow of ULCVs andexisting vessels coming off long-term charters.
With an uncertain medium-term demand outlook, liner operators arereluctant to employ vessels on long-term charters. This is reflected in
fixture activity: the average duration for fixtures concluded during2018 remains below 12 months. The sharpest decline in charterduration has been seen for the 8,000-9,999 teu segment, where theaverage decreased from 45 months (based on 28 fixtures reported in2015) to ten months (based on 54 fixtures recorded in 2018). Thetrend towards shorter average contract duration for the midsizesegment is expected to continue in the coming years.
Given the growing oversupply concerns, we believe that lineroperators will favour the flexibility that can be achieved by capacitymanagement, which implies a higher frequency of contract renewalsbut shorter contract duration, for the midsize segment. With two-thirds of the midsize fleet currently owned by tonnage providers,reemployment risk for these units remains significant in the comingyears, as the main priority of liner operators is to optimise theutilisation of owned capacity.
CONTAINER MARKET DEEP DIVE: SEGMENT DYNAMICSCascading pressure leaves the mid-size segment (3-9,999 teu) vulnerable
Source: Clarksons, Danish Ship Finance
CONTAINER AVERAGE FIXTURE LENGTH (MONTHS) CONTAINER AVERAGE FIXTURE RATES (USD PER DAY)
0
24
12
48
36
3-5,999 teuFeeder 6-7,999 teu 8-9,999 teu
2015 2017 2018 YTD2016
0
10,000
30,000
20,000
40,000
Feeder 3-5,999 teu 6-7,999 teu 8-9,999 teu
2015 2016 2017 2018 YTD

Shipping Market Review – November 2018 39
THE DRY BULK MARKET
SHIPPING MARKET REVIEW – NOVEMBER 2018

Shipping Market Review – November 2018 40
OU
TLO
OK
SU
MM
AR
Y
POSITIVE
NEUTRAL
NEGATIVE
THE DRY BULK MARKETPerspectives and key takeaways
The Dry Bulk market continued to strengthen during the first threequarters of 2018, backed by slower fleet growth of 2% and robustdemand growth driven by strong Chinese import growth.Consequently, the Baltic Dry Index (BDI) surpassed the long-termmedian index value of 1,600 and reached a four-year high index valueof 1,774 in July 2018, however down to 1,555 in October 2018.
Despite improving market sentiments and relative low newbuildingprices, only 185 new orders had been placed by the end of September2018, equivalent to a 14% decrease year-on-year. Dry Bulk investorsare approaching investments in new vessels with caution due touncertainty over the IMO’s 2020 regulation, escalation trade tensions,and China’s economic transition.
With a relatively small orderbook and realistic demand expectations forthe coming years, a fundamentally supported rebound in the Dry Bulkmarket is expected to continue in the short term. However, thesustainability of the rebound is contingent on a robust demand fromChina over the medium to long term. Chinese seaborn demand for rawmaterials remains strong in 2018, but this trend could rapidly changefrom 2019 onwards.
As part of its ongoing reform agenda, China is attempting to cut idlecapacity in the steel and coal industries, for both financial andenvironmental reasons. The increasing focus on building a greener
In the short term, the Dry Bulk market isexpected to continue to strengthen thanksto an improving supply and demandbalance. However, we stay cautious aboutthe outlook from 2020 and beyond giventhe Dry Bulk market’s dependency onChina, notably for the larger segments.The ongoing reform agenda andenvironmental campaigns will reshape thedynamics of Chinese demand for rawmaterials, potentially reducing demandgrowth for Dry Bulk.
WHERE WE ARE IN THE FREIGHT RATE CYCLE
country is leading to tougher environmental regulations, which areexpected to pave the way for circular economic principles, notably inthe steel industry. China aims to increase the ratio of steel scrap usedin steelmaking from 11% in 2016 to 20% by 2020 and 30% by 2025,could potentially replace 20% of China’s iron ore import in 2017.
Steel scrap is essentially a more environmentally friendly substitute foriron ore and coking coal consumed in the steelmaking process, andconsumption is determined by the price differential between steelscrap and the raw material basket. From an economic point of view,steel mills should only increase the ratio of steel scrap if it proves tobe the most cost-effective raw material. However, we expectgovernment influence to outweigh the economic incentives of domesticsteel mills. It is therefore more a question of when rather than if Chinawill reach the targets.
A successful structural shift in the Chinese steel industry will result inlower demand in absolute volume for iron ore and coking coal. This isexpected to put further downward pressure on the Dry Bulk market.While we argue that the smaller segments are less vulnerable to lowerdemand growth owing to their ability to offset the existing orderbookby scrapping ageing units, the same option is not available to thelarger segments. The Capesize and Panamax segments remain themost at risk in the event of lower Chinese imports of Dry Bulk.
Source: Danish Ship Finance
Panamax
HandymaxHandysize
Capesize

Shipping Market Review – November 2018 41
After Dry Bulk demand showed signs of weakness in the seasonallylow first quarter, spot rates continued to follow an upward trend.Backed by a strong Chinese demand for coal and iron ore, the BDIreached its 4-year high at index 1,774 in July 2018, which is 89%above the level seen in July 2017. Timecharter rates for most of thesegments have remained stable over the past few months, althoughCapesize rates have continued to increase. As of September 2018,timecharter rates on average were 15% higher than at the end of2017.
By September 2018, the average newbuilding price for Dry Bulkvessels had increased by 11% since end of 2017. The increase innewbuilding prices for the Dry Bulk segments had been moresynchronised with the development in secondhand prices. Theaverage secondhand price has increased by 9% since start of theyear, led by Handysize and Capesize vessels across all age segments,
while a moderated decline in secondhand prices have been observedfor Handymax and Panamax vessels older than 15 years. For vesselsyounger than ten years, the Capesize segment has experienced themost significant value appreciation, of an average of 15%, supportedby the development in timecharter rates.
Backed by rising freight rates and relatively low secondhand prices,sales activity remains firm, with 428 vessels having changed handsduring the first three quarters of 2018. Sales activity continues to bedominated by smaller units, as transactions with Handymax andHandysize vessels accounted for 62% of the total number ofsecondhand sales during the period. Although the secondhand marketcontinues to be active, the flattening prices for younger vesselsindicate that Dry Bulk investors remain cautious given the uncertaintyover the short- to medium-term market outlook.
THE DRY BULK MARKETFreight rates and ship prices
Source: Clarksons, Danish Ship Finance
1-YEAR TIMECHARTER RATE (USD PER DAY) SECONDHAND PRICES – 5 YEARS (USD MILLION)
20172013 2014 2015 2016 20180
2019
8,000
16,000
24,000
32,000
+29%
2015 20172013 2014
15
2019
45
20160
30
2018
60
+7%
Capesize Panamax HandysizeHandymax

Shipping Market Review – November 2018 42
THE DRY BULK MARKETSupply-side development
Owing to an improving market balance, only three million dwt wasscrapped during the first three quarters of 2018, which is the lowestlevel of demolition recorded for ten years. This has supported anincrease in the average demolition age, which has increased from 24.5years in 2017 to 28.5 years in 2018. The increasing demolition age isto be expected at the current stage of the freight rate cycle.
Delivery performance has continued to improve during 2018, with72% of vessels scheduled for delivery this year actually having beendelivered, compared with 67% in 2017. Based on the deliveryperformance and the remaining orderbook for 2018, total deliveriesfor 2018 are projected to reach 29.7 million dwt, 22% lower than in2017. Assuming no further cancellations, postponements or scrapping,the Dry Bulk fleet is set to increase by 4% in 2018.
Contracting activity reached 20.9 million dwt during the first nine
months of the 2018, with Panamax and Capesize vessels representing85% of the total contracted capacity. However, contracting activityhas slowed down significantly over the past two quarters with only sixmillion dwt ordered, reflecting Dry Bulk investors’ caution.
The fleet renewal potential, reflecting the relationship between theorderbook and the number of scrapping candidates in the fleet,continues to deteriorate for the Panamax and Capesize segments, astheir respective orderbooks are significantly larger than the numberof natural scrapping candidates in their fleets. The Capesize segmentremains vulnerable to additional contracting, as there are 2.7 vesselson order for each ship in the fleet above 20 years of age. In contrast,the fleet renewal potential has improved in the Handysize andHandymax segments, and their respective orderbook can now beabsorbed by scrapping of vessels older than 20 years.
Source: Clarksons, Danish Ship Finance
FLEET DEVELOPMENT (MILLION DWT) FLEET RENEWAL POTENTIAL (DWT)AGE DISTRIBUTION OF FLEET (MILLION DWT)
0
100
400
200
30032%
10-150-5 20-25
7%
42%
5-10
13%
15-20
4%
2%
25+ Orderbook
10%
HandysizeHandymaxPanamax OrderbookCapesize
Orderbook / total fleet
0% 3% 12%6%0.0
9% 15%
0.8
1.6
2.4
3.2
Capesize
Panamax
Handymax
Handysize
40
-40
80
0
2013
6%
4%
2014
2%
2015
2%
3%
2016 2017
4%
2018
4%
2019
3%
2020
Percentage of fleet
Annual fleet growth Deliveries
Scrapping
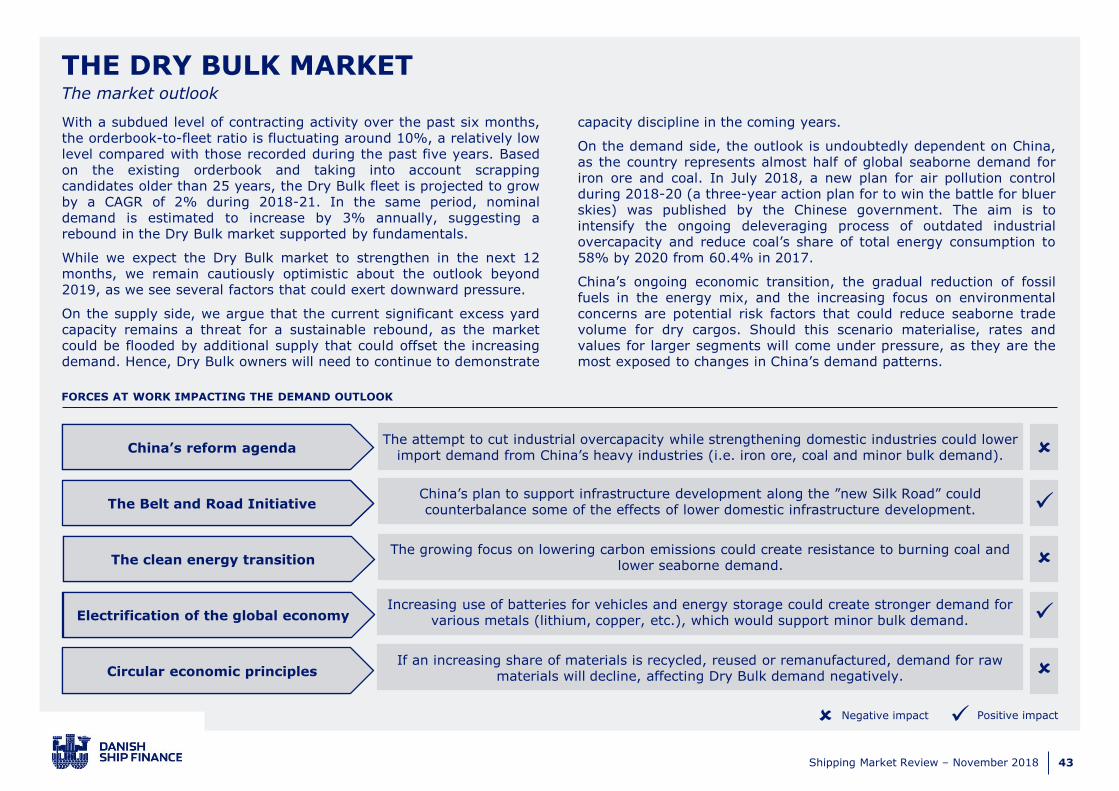
Shipping Market Review – November 2018 43
Positive impactNegative impact ✓
With a subdued level of contracting activity over the past six months,the orderbook-to-fleet ratio is fluctuating around 10%, a relatively lowlevel compared with those recorded during the past five years. Basedon the existing orderbook and taking into account scrappingcandidates older than 25 years, the Dry Bulk fleet is projected to growby a CAGR of 2% during 2018-21. In the same period, nominaldemand is estimated to increase by 3% annually, suggesting arebound in the Dry Bulk market supported by fundamentals.
While we expect the Dry Bulk market to strengthen in the next 12months, we remain cautiously optimistic about the outlook beyond2019, as we see several factors that could exert downward pressure.
On the supply side, we argue that the current significant excess yardcapacity remains a threat for a sustainable rebound, as the marketcould be flooded by additional supply that could offset the increasingdemand. Hence, Dry Bulk owners will need to continue to demonstrate
capacity discipline in the coming years.
On the demand side, the outlook is undoubtedly dependent on China,as the country represents almost half of global seaborne demand foriron ore and coal. In July 2018, a new plan for air pollution controlduring 2018-20 (a three-year action plan for to win the battle for bluerskies) was published by the Chinese government. The aim is tointensify the ongoing deleveraging process of outdated industrialovercapacity and reduce coal’s share of total energy consumption to58% by 2020 from 60.4% in 2017.
China’s ongoing economic transition, the gradual reduction of fossilfuels in the energy mix, and the increasing focus on environmentalconcerns are potential risk factors that could reduce seaborne tradevolume for dry cargos. Should this scenario materialise, rates andvalues for larger segments will come under pressure, as they are themost exposed to changes in China’s demand patterns.
THE DRY BULK MARKETThe market outlook
FORCES AT WORK IMPACTING THE DEMAND OUTLOOK
China’s reform agenda
The Belt and Road Initiative
The clean energy transition
The attempt to cut industrial overcapacity while strengthening domestic industries could lower import demand from China’s heavy industries (i.e. iron ore, coal and minor bulk demand).
China’s plan to support infrastructure development along the ”new Silk Road” could counterbalance some of the effects of lower domestic infrastructure development.
The growing focus on lowering carbon emissions could create resistance to burning coal and lower seaborne demand.
Electrification of the global economy
Circular economic principles
Increasing use of batteries for vehicles and energy storage could create stronger demand for various metals (lithium, copper, etc.), which would support minor bulk demand.
If an increasing share of materials is recycled, reused or remanufactured, demand for raw materials will decline, affecting Dry Bulk demand negatively.
✓
✓

Shipping Market Review – November 2018 44
China’s introduction of tougher environmental regulations ispaving the way for circular economic principles. The supply-side structural reform (SSSR) combined with the plan for the“battle for bluer skies” is expected to change steelmakingdynamics and push for a greener steel industry in China. This isexpected to have a negative impact on iron ore demand, withlower-grade iron ore producers being the most exposed.
China’s steelmaking capacity utilisation deteriorated from 79% to 70%in the period 2010-2015, reflecting severe industry overcapacity.Consequently, capacity reduction in the steel industry became one ofthe main targets under SSSR due to both financial and environmentalconcerns. In China’s 13th five-year plan (2016-20), the governmentaims to reduce total production capacity from 1.13 billion tonnes toless than one billion tonnes, while lifting capacity utilisation to 80% by2020.
Alongside the capacity reduction process, the growing focus onbuilding a cleaner economy is promoting recycling as part of thegovernment’s push to improve the quality and efficiency of steelproduction. In fact, the government is aiming to increase the usage ofsteel scrap in the steelmaking process from 11% in 2016 to 20% by2020 and 30% by 2025.
Steel scrap is the primary input to steel production based on electricarc furnace (EAF) technology, which offers energy saving and emissionreduction compared to the basic oxygen furnace (BOF) technology,where pig iron is the main input. Based on market estimates,production of one tonnes pig iron requires on average 1.5-1.6 tonnesof iron ore and 0.5-0.6 tonnes of coking coal. As a raw material, steelscrap is essentially a substitute for iron ore and coking coal in thesteelmaking process. With government incentives pushing for a higherratio of steel scrap usage in the manufacturing process, downwardpressure on pig iron production is expected over the coming years.
Although the nominal output of pig iron increased in both 2016 and2017, its share of total crude steel output continues to follow a
declining trend, reflecting the fact that a growing share of steelmakinguses steel scrap. If the Chinese government manages to reach thetarget set for steel scrap usage, and assuming available steelproduction capacity of one billion tonnes operating with an 80%utilisation rate, pig iron demand in 2025 is estimated to be 21% lowerthan in 2017. This implies that more than 230 million tonnes of ironore will be substituted by steel scrap, equivalent to one-fifth of China’sseaborne imports of iron ore in 2017.
While producers with lower-grade ore will come under pressure in theevent of a successful structural shift in the Chinese steel industry, weexpect higher-grade ore producers to continue to benefit from anupgraded Chinese steel industry due to both environmental andefficiency factors. Nevertheless, it is clear that China’s increasing focuson building a greener country will reshape the demand dynamics foriron ore.
DRY BULK MARKET DEEP DIVE: CHINESE IRON ORE DEMANDEnvironmental focus is reshaping the Chinese steel industry
Source: Worldsteel, MIIT, Danish Ship Finance
CHINESE CRUDE STEEL AND PIG IRON OUTPUT (MILLION TONNES)
400
0
1,200
1,600
800
92% 86%
2012
86%92% 80%99%
2009 2010
92%
20172011 2013
87%
2014 2015 2016
85%
2020e
70%
2025e
93%
Crude steel Pig iron Implied iron ore demand
Pig iron’s share of total steel production

Shipping Market Review – November 2018 45
GLOBAL OIL MARKETS
SHIPPING MARKET REVIEW – NOVEMBER 2018

Shipping Market Review – November 2018 46
Geopolitical risk is on the rise in oil markets, but the glut of US shalehas inoculated the oil market against instability and unrest for thetime being. The geopolitical flashpoints – including an escalating tradewar between China and the US, and the newly imposed sanctions onIran –could provoke future supply problems, but actual productionoutages have remained minor, except for in Venezuela. Iranian oilexports could be reduced by approximately 1.3 million barrels per dayover the next year, and Venezuelan production is forecast to declineby 800,000 barrels by the end of 2019. OPEC is expected to partiallybridge the gap in the short term, with an increase in production of700,000 barrels from Saudi Arabia offsetting the production cut. Totalestimated output from OPEC will be 300,000 barrels lower at year-end, and 500,000 barrels lower in 2019. Still, it is projected that OPECspare capacity could be larger than the expected two million barrels.
Expansion of US and Canadian unconventional production is likely to
ensure that global oil markets stay sufficiently supplied in the next twoyears, despite temporarily infrastructure constraints. Growth is likelyto exceed two million barrels in 2018 and 2019, thus outpacing growthin demand by more than 100%. Oil produced in North America is forthe most part light sweet oil, and is expected to be exported to Asianmarkets, for reasons of refinery capacity and domestic demand.
Net production growth outside OPEC will be 2.3 and 2.5 million barrelsper day, and the US accounts for roughly 90% of this growth for bothyears. Offshore production will increase marginally over the course of2018 and 2019. Declining production in Mexico and China will be offsetby increased production from mainly Brazil, Canada and Norway.Offshore is expected to maintain its market share of one-third ofglobal oil supply in the coming years.
GLOBAL OIL MARKETSNo shortage of oil in the medium term
Source: IHS Markit, Danish Ship Finance
GLOBAL SUPPLY AND DEMAND OUTLOOK CRUDE OIL 2018 (MMBD) GLOBAL SUPPLY AND DEMAND OUTLOOK CRUDE OIL 2019 (MMBD)
0
3
2
1
Non-OPEC production growth
-0,3
Global inventoriesNon-OPEC production declines
-0,5
OPEC production decline/disruptions
-1,5
Demand growth
2,8
0,6
2,7
0,4
0
1
2
3
-1.6
Non-OPEC production growth
-0.4
Non-OPEC production declines
-0.3
OPEC production decline/disruptions
Demand growth Global inventories

Shipping Market Review – November 2018 47
The continuous focus on cost optimisation and higher oil pricescontinue to push oil companies into profitability, both onshore andoffshore. Oil companies still have the choice whether to invest inshort-cycle projects onshore or longer-cycle, potentially moreprofitable, offshore projects. In the US unconventional sector, theprocess of drilling is becoming commoditised. Every drilling process isrepeated and improved, resembling a factory production line. Becauseunconventional oil is not resource constrained, infrastructure andorganisational limitations are the main factors holding back newgrowth. New pipelines under construction will add four to six millionbarrels per day of capacity by 2020, and support the US in becomingone of the world’s largest oil exporters. The US is expected to trebleexport volumes to three to four million barrels per day within the nexttwo years.
The continuous focus on cost reductions and fast payback in theoffshore sector means that most projects being sanctioned are near-field developments and tie-back projects. This trend is likely tocontinue, with the exception of some large-scale projects mainly inBrazil and Guyana, which also have very favourable break-even rates.Brazil, in particular, is becoming an international hotspot fordeepwater large-scale operations, thanks to new regulations that allowinternational oil companies (NOCs) to have operatorship on its fields.Brazil has large proven reserves of oil (90 billion barrels), which hasled several of the largest deepwater companies to make Brazil theircore growth area. The pre-salt area in Brazil consists predominantly ofultra-deepwater fields with large reservoirs. Depending on the level ofsuccess for foreign companies in Brazil in the coming years, thecountry could once again become the premier location for offshore andultra-deepwater drilling.
Despite the positive developments in Brazil, offshore E&P spending isexpected to rise moderately in the years to come. The oil price haslimited short-term effects on E&P spending. Oil companies are pushingthemselves and their supply chains to extract more oil for less capital.
Technology is one of the largest drivers of the cost reductions and is akey factor for companies to achieve enhanced recovery rates (EOR).Digitalisation in the oil and gas industry is not a distant dream; oilcompanies have come a long way in digitalising their operations.Predictive analytics have made huge strides in predictive maintenance.
For instance, one company is using algorithms to predict valvefailures. In both the onshore and offshore sectors, automated drillingoperations and the introduction of artificial intelligence are making theproduction of oil less labour-intensive. For example, in Norway, anunmanned production platform, which will be controlled remotely, isbeing constructed. This will reduce operating expenses significantly.This shift in operations will likely accelerate in the future. The new oilindustry is leaner and more efficient than a few years ago.Competition between offshore and onshore will likely intensify in thecoming years, as oil companies will continue to target projects withthe highest returns and shortest payback times.
GLOBAL OIL MARKETSCost pressure and adoption of new technologies are keeping E&P spending in check
Source: Danish Ship Finance, Clarksons
GLOBAL E&P SPENDING CAPEX FORECAST (USD BILLION)
6881
107121121
112 115121
0
50
150
100
20192016 2017 2018
Unconventional Offshore

Shipping Market Review – November 2018 48
THE OSV MARKET
SHIPPING MARKET REVIEW – NOVEMBER 2018

Shipping Market Review – November 2018 49
OU
TLO
OK
SU
MM
AR
Y
POSITIVE
NEUTRAL
NEGATIVE
THE OFFSHORE SUPPORT VESSEL MARKETPerspectives and key takeaways
The strong growth in production and capital spending in theunconventional sector is keeping investments in the offshore sectorunder constant pressure. The option to invest in shorter-cycle projectsonshore is clouding the demand outlook for OSV vessels.
Offshore Support Vessels (OSVs) continue to struggle withovercapacity, as owners faced mediocre day rates over the summerafter positive sentiment led to too many vessels being reactivated.This has resulted in a situation where shipowners are unable to getreturns above their opex over time. The large number of laid-upvessels will keep a lid on earnings in the medium term. The industry isstill trying to find solutions for how to handle the oversupply.
Some owners are upgrading their vessels to a higher digital standard,while others are focusing solely on cost leadership and operatingperformance. The large debt loads in the sector continue to pressuremost shipowners. This is in stark contrast to their counterparts in theUS, who have undergone major restructuring and cleared their balancesheets. European owners are somewhat shielded, though, becausemuch of US tonnage is of a lower standard than the majority ofEuropean vessels.
The Offshore Support Vessel marketcontinues to be burdened by overcapacityand low earnings. E&P spending is at astructurally low level, and is expected toincrease moderately in the next few years.We reiterate our view that we could bepast the bottom of the cycle, but arecovery will likely be very slow, and manyvessels will have to exit the market ifmarket equilibrium is to be reinstated.
WHERE WE ARE IN THE FREIGHT RATE CYCLE
It is becoming clear that many vessels in lay-up will not return to thecompetitive fleet. In the large OSV segments (PSV >3,000 dwt, AHTS>12,000 bhp), 26% of the fleet is laid up, but 9% of vessels (117) aremore than 15 years old. These vessels are unlikely to return to thesector. Still, given the severity of the overcapacity, even if vessels inlay-up will not return to the competitive market it may not be enoughto push rates up.
Offshore exploration and drilling is becoming ever more competitive,with declining break-even rates. The increased competitiveness ofoffshore projects comes at the expense of the profitability of the entiresupply chain, including OSV vessels. It is still very profitable toproduce offshore oil, but further down the value chain it is still lowerprofit margins.
Source: Danish Ship Finance
OSV

Shipping Market Review – November 2018 50
Charter rates continue to be challenged, but there are signs ofimprovement. For long-term charters, there have been PSV fixtures atNOK 150,000 per day, approximately NOK 75,000 per day aboveopex. And for AHTS vessels in particular, there have been periodicspikes in rates in the spot market, but there are too many idle daysfor earnings to be meaningful in the longer run. Large AHTS vessels(12,000 bhp-plus) are more expensive to operate, and there is littledemand outside the oil and gas sector for these vessels.
Consolidation could lead to increased scrapping of vessels, as we haveseen some of the larger shipowners do. The OSV market is still toofragmented to give shipowners any meaningful pricing power. Webelieve this is unlikely to change in the foreseeable future, even withmore M&A activity.
Secondhand prices remain under pressure, but most vessels beingput up for sale are ten years or older. Owners continue to reduce their
fleets of non-core assets; values for these vessels are in the USD 1-5million range. Prices for newer and more advanced tonnage continueto be relatively untested, as few vessels are being sold, and aremainly being held up by the low level of market liquidity.
Newbuilding prices for OSV vessels are highly uncertain, as onlynine OSV vessels have been ordered since 2014. The currentovercapacity in the market and the fact that owners are cash-strappedwill likely keep contracting low in the coming years. Newbuilding pricesdo not reflect vessels’ earnings potential currently, which means novessels are likely to be ordered on speculation.
THE OFFSHORE SUPPORT VESSEL MARKETFreight rates and ship prices
TIMECHARTER RATES OSV VESSELS – GLOBAL INDICATOR (USD PER DAY) SECONDHAND PRICES LARGE OSV VESSELS – 5 YEARS (USD MILLION)
0
32,000
16,000
8,000
20152013 2014 20192016 2017 2018
24,000
40,000
48,000
+8,450
AHTS 24,000 bhp + AHTS 20,000 bhp + PSV 4,000 dwt PSV 3,200 dwt
20172016 201820130
20152014
60
2019
15
30
45
75
90
105
-17
Source: Clarksons, Danish Ship Finance

Shipping Market Review – November 2018 51
THE OFFSHORE SUPPORT VESSEL MARKETSupply-side development
The OSV market is still characterised by oversupply of vessels, inevery segment. Globally, one-third of the fleet is laid up, but thelarger segments are faring better, with only one out of four vessels inlay-up. A recovery still hinges on a reduction in supply. Of the largevessels (PSV >3,000 dwt and AHTS >12,000 bhp), 47 are out of class,older than 15 years old and have been laid up since 2016 or earlier. Intotal, there are 117 large vessels (9% of the fleet) laid up and olderthan 15 years. These vessels are unlikely to return to active duty.
The orderbook contains 135 vessels. Of these, 96 are ordered atChinese yards, and 127 have been on order since 2014. It is uncertainhow many of these vessels will be delivered. Several vessels arethought to be sitting in yards either completed or nearly completed,primarily in Chinese yards. Since the start of the year, 25 vessels havebeen delivered. Still, only eight new orders for OSV vessels have beenplaced since 2015.
Since the start of 2018, 48 vessels have been scrapped, an increaseof 12 since our last report. The real number could be significantlyhigher, as vessels in lay-up with no maintenance or those with theirtransmitters turned off could have been demolished in situ. So far thisis estimated to be 1,000 vessels globally. The oversupply of vesselshas resulted in a few larger OSV players opting to scrap vesselsinstead of selling them, to keep them from returning to the activemarket. This trend is mainly being seen among the larger players,which have the capacity to dispose of vessels. Reactivation costs aredifficult to pin down; vessels laid up in a cold, northern climate oftenonly cost USD 50-100,000 to reactivate if they are in class, whilereactivation costs for vessels out of class are likely in the region ofUSD 1-4 million, depending on maintenance. It is very difficult toestimate precisely how many vessels will return to the market ifcharter rates increase, the variables are just too many.
Source: Clarksons, Danish Ship Finance
LAID-UP OSV VESSELS – NORTH SEA PSV >3,000 DWT AND AHTS >12,000 BHPAGE DISTRIBUTION FLEET (NO. OF VESSELS)
0
200
600
400
5-10
37%
15-200-5
31%
16%
10-15
10%
2%
20-25
4%
25+
10%
Orderbook
AHTS 12-16,000 BHP
AHTS >16,000 BHP
PSV/Supply 3-4,000 DWT
PSV/Supply 4,000 DWT+
20182013
50
20140
2015 201920172016
100
150
200
-42
OSV - Laid Up North Sea
75
0
25
50
10-15 20-25
25%
23%
9%
0-5
13%
5-10
38%
15-20 25+
8%
Laid up - 2015 Laid up - 2017
Laid up - 2016 Laid up -2018
Percentage of fleetPercentage of age group laid-up

Shipping Market Review – November 2018 52
Positive impactNegative impact ✓
The Offshore Support Vessel market is still very challenged. While it ispositive that offshore activity levels are increasing, this will not besufficient to employ the OSV fleet. There are still too many ownerswho believe the market will turn in their favour. However, thoseholding out for a rapid recovery are likely to be disappointed.Increased E&P spending is not a guarantee of higher day rates; muchdepends on how this capital is spent and how much of it is relevant forvessels. Increased tie-back spending and near-field development donot require as many vessel days as exploration drilling in distantwaters, because vessels have shorter sailing distances. This trend hasbecome apparent for many projects. The forces currently at work arechallenging the expected economic lifetime of vessels and thetraditional OSV business model. A new business model being proposedis to make OSV vessels trade in a similar way to Container vessels.Fixed routes offered by OSV companies could service severalcompanies on the same route, lowering costs and possibly increasingtheir market shares. Still, a model such as this would likely be adoptedby one of the larger OSV companies with a significant fleet size.
Most OSV markets are expected to recover slowly over time. Brazilstands out as the market with the greatest potential for employmentof the largest vessels.
Brazil has taken major steps to reform its offshore sector, making it
easier for foreign companies to operate. In July 2016, Petrobras soldits operatorship in the Carcará field, which is the first time it hasceded operatorship to a foreign company. Field developments inmainly pre-salt areas must be successful, both in an operational and apolitical context, if demand for OSV vessels are to increase. Petrobrashas deleveraged by 6% in recent years, and its partnerships have sofar proved successful. Local content requirements have been reducedsignificantly, and range from 18% to 40%. This summer, the partneroutlined plans to invest USD 15 billion in the country over the next tenyears. This is a big shift: as well as signalling that Petrobras needs todeleverage further, it also lays the foundations for other foreigncompanies to enter the Brazilian market.
Still, due to political reasons there is uncertainty over how the nextsanctioning rounds will unfold. Principally, Brazil needs to offer goodterms and avoid political turmoil in the years to come. If oil productionbecomes as profitable as oil companies expect, a large part of the OSVfleet could over time find itself in Brazilian waters. In the rest of theworld, there are also positive signs. West Africa is looking morepromising, and drilling activity is expected to increase over the nextcouple of years. We are seeing similar trends in other markets, butthese surges in activity are from very low levels and are unlikely toemploy the entire fleet of OSV vessels.
THE OFFSHORE SUPPORT VESSEL MARKETMarket outlook
Exploration spending is determined by oil companies but is only based on estimates. If large oil companies increase spending, this could boost demand.
The US unconventional industry is competing with the offshore industry for capital investments. For oil companies with the option to invest in either onshore or offshore,
projects must have very high returns to compensate for longer payback times.
With some projections putting it as early as 2023, peak oil demand will change how oil investments are made, and is likely to shift the focus to short-term investments.
Exploration spending
US unconventional sector
Peak oil demand
FORCES AT WORK IMPACTING THE LONG-TERM DEMAND OUTLOOK
✓
✓

Shipping Market Review – November 2018 53
With one-third of the worldwide OSV fleet in lay-up, the situation isclearly not sustainable. The question for the industry is how manyvessels will exit the sector. In other shipping segments, such a degreeof oversupply would likely warrant increased scrapping of oldertonnage, at the expense of the economic lifetime of vessels. Becausethere are almost 900 owners worldwide, each with an average of fivevessels, many are unlikely to be willing to scrap their last vessels.Additionally, the vessels have very little steel value, making iteconomically unfeasible to scrap them. Scrap values can even benegative if transportation costs are factored into the calculation.
Every market participant knows that there must be a significantreduction in supply if day rates are to exceed the cost of capital. Still,shipping is not a charity and owners are reluctant to sacrifice theirvessels when they can instead opt to keep them in lay-up and hopefor a market improvement until the vessel is effectively scrapped insitu. Approximately 1,000 vessels have already been scrapped in situ,but there is need for more. This scenario is dependent on shipownershaving the capital and/or intention to maintain their vessels combinedwith possible new regulations from state authorities and oilcompanies. We have looked at the entire fleet of OSV vessels, whichnumbers 4,600 vessels globally. We identify 1,212 vessels older than15 years (26% of the fleet) as being at risk of reaching the end oftheir economic lifetimes. Depending on the condition of the assets andthe status of their class certificates, many of these could be scrapped.Costs for class renewals of vessels are high and typically range fromUSD 500,000 to USD 3,000,000.
It is therefore unlikely that owners will reactivate vessels withoutcontracts being in place. And contracts long enough to justifyreactivation costs are presently not existing. As the graph shows, 237vessels older than ten years have been laid up for more than twoyears and are out of class. In total, we identify 803 vessels (17% ofthe entire fleet) as likely scrapping candidates.
If day rates do not improve in the next couple of years, vessels willrequire a higher premium to reactivate. Owners with few vesselsoperating in regional markets, where there are no stringentenvironmental regulations, could potentially find other employment fortheir vessels. In the high-end sector, shipowners will likely scrap orsell non-core vessels out of the market. Even though many vesselswere state-of-the-art when they were built, in today’s market they areconsidered “over-engineered”, meaning that their capabilities farexceed their work scope. However, we believe the more sophisticatedunits are more likely to return, as scrapping these vessels would makelittle economic sense.
OSV MARKET DEEP DIVE: OSV FLEET REDUCTIONThe large number of owners and low scrap values continue to stand in the way of a market recovery
Source: Clarksons, Danish Ship Finance
OSV FLEET OLDER THAN 10 YEARS
1.212
638
755
151
169
190
526
86
0
500
1,000
1,500
2,000
Laid up 2017Laid up before 2017 out of class
Fleet
24
54
Laid up before 2017 in class
65
64
Laid up 2018 Potential Supply
10-15 years >15 years

Shipping Market Review – November 2018 54
THE SUBSEA VESSEL MARKET
SHIPPING MARKET REVIEW – NOVEMBER 2018

Shipping Market Review – November 2018 55
OU
TLO
OK
SU
MM
AR
Y
POSITIVE
NEUTRAL
NEGATIVE
THE SUBSEA VESSEL MARKETPerspectives and key takeaways
The Subsea market is still challenged, but prospects have improvedthroughout 2018. Because offshore projects have become leaner andmore standardised, offshore sanctioning has picked up. Yet theindustry is still not employing its vessels, and contracts are for themost part restricted to the largest players; for the majority, they willremain at low levels in the short term.
The extensive ordering activity in the period 2010-14 is still weighingheavily on the industry, with many shipowners unable to findemployment for their vessels. The reduction in E&P spending,combined with delivery of several large Subsea vessels, has left themarket struggling with overcapacity. Smaller shipowners are caught ina negative spiral: pricing power in the sector is restricted to largercompanies, and they are bidding for projects under significant marginpressure. The largest share of projects being sanctioned are stillsmaller projects, tie-backs and other forms of near-field development.As there is a relatively short time between project sanctioning (FID)and first production of oil, payback for these projects is shorter.Looking at conventional standalone projects that have beensanctioned, these have been significantly scaled back in terms of costand size. The most obvious example is Johan Sverdrup full fielddevelopment, for which the estimated investment has been reduced bymore than NOK 80 billion.
The Subsea industry continues to headslowly but surely towards a recovery.Marginally higher E&P spending in thecoming years, combined with significantefficiency gains, has resulted in moreprojects receiving FIDs (final investmentdecisions). The largest companies continueto take market share, and tonnageproviders’ pricing power is under pressure.Still, we believe the market is recovering,but it will be a slow process.
WHERE WE ARE IN THE FREIGHT RATE CYCLE
It now has a break-even price of less than USD 20 per barrel,compared with USD 40-plus previously. Offshore has thus become amuch more competitive industry. This is partially due to Subseaowners and engineering companies teaming up with oil companies andother suppliers to find new solutions. All the largest companies in theSubsea sector have either merged or entered into alliances with othercompanies. Alliances have proved fruitful, and have been a majorcontributing factor to contract awards, as they offer oil companiessignificant value.
Still, the Subsea industry is a backlog industry, and backlogs arestarting to increase. This means that companies’ book-to-bill ratios oforders received to the amount billed are now above 1. This is resultingin more vessel days for Subsea owners and higher utilisation for vesselowners. The backlog increases are still not high enough to providetonnage providers with significant pricing power, but things aremoving in the right direction.
Source: Danish Ship Finance
Subsea vessels
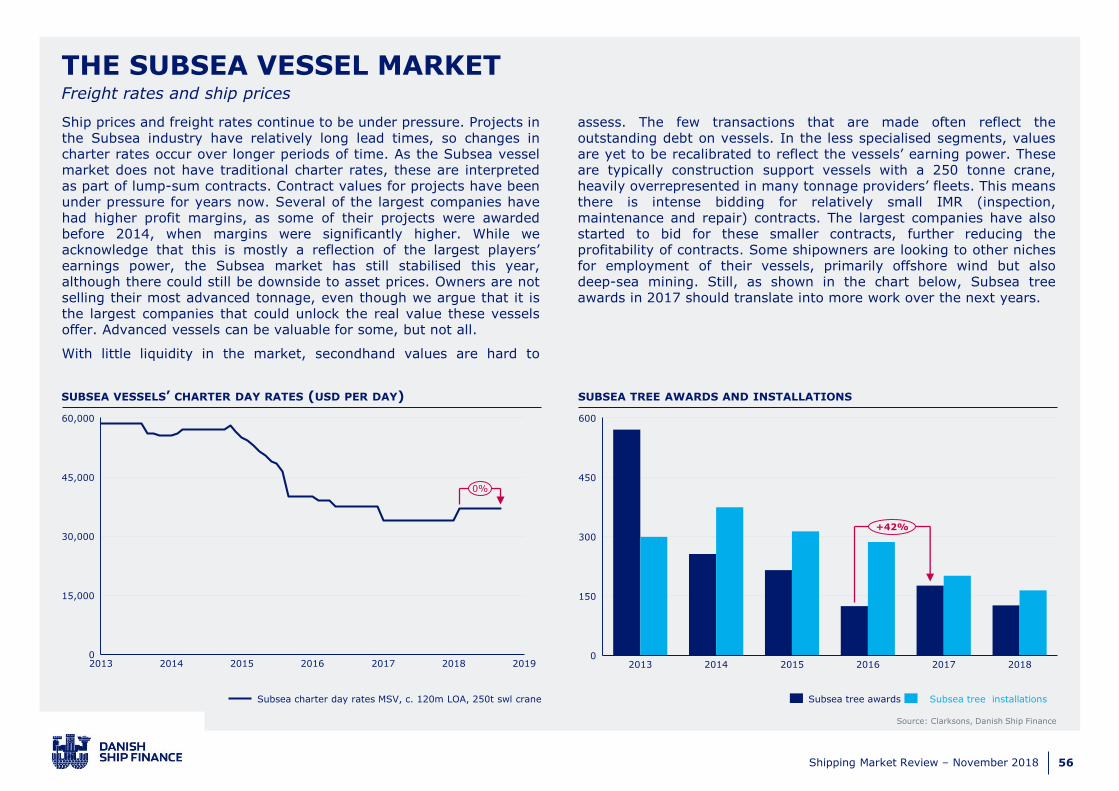
Shipping Market Review – November 2018 56
Ship prices and freight rates continue to be under pressure. Projects inthe Subsea industry have relatively long lead times, so changes incharter rates occur over longer periods of time. As the Subsea vesselmarket does not have traditional charter rates, these are interpretedas part of lump-sum contracts. Contract values for projects have beenunder pressure for years now. Several of the largest companies havehad higher profit margins, as some of their projects were awardedbefore 2014, when margins were significantly higher. While weacknowledge that this is mostly a reflection of the largest players’earnings power, the Subsea market has still stabilised this year,although there could still be downside to asset prices. Owners are notselling their most advanced tonnage, even though we argue that it isthe largest companies that could unlock the real value these vesselsoffer. Advanced vessels can be valuable for some, but not all.
With little liquidity in the market, secondhand values are hard to
assess. The few transactions that are made often reflect theoutstanding debt on vessels. In the less specialised segments, valuesare yet to be recalibrated to reflect the vessels’ earning power. Theseare typically construction support vessels with a 250 tonne crane,heavily overrepresented in many tonnage providers’ fleets. This meansthere is intense bidding for relatively small IMR (inspection,maintenance and repair) contracts. The largest companies have alsostarted to bid for these smaller contracts, further reducing theprofitability of contracts. Some shipowners are looking to other nichesfor employment of their vessels, primarily offshore wind but alsodeep-sea mining. Still, as shown in the chart below, Subsea treeawards in 2017 should translate into more work over the next years.
THE SUBSEA VESSEL MARKETFreight rates and ship prices
Source: Clarksons, Danish Ship Finance
SUBSEA VESSELS’ CHARTER DAY RATES (USD PER DAY) SUBSEA TREE AWARDS AND INSTALLATIONS
2013 2014 2015 20160
30,000
201920182017
15,000
45,000
60,000
0%
Subsea charter day rates MSV, c. 120m LOA, 250t swl crane
0
150
300
450
600
20152013 2014 2016 2017 2018
+42%
Subsea tree awards Subsea tree installations

Shipping Market Review – November 2018 57
THE SUBSEA VESSEL MARKETSupply-side development
The Subsea fleet comprises many different types of vessels, all withmany different purposes. Thus, the level of supply depends on whichsegment we are looking at. The industry as a whole is characterisedby oversupply, but the multi-functional support segment and pipelayers have the most excess capacity. Pipe layers were ordered inanticipation of several ultra-deepwater projects being sanctioned inWest Africa and Brazil, but this has only partially materialised.
Nine vessels have been delivered since our last report, and seven ofthese were contracted after 2014, for a very specific scope of work.For example, one advanced pipe-layer has been ordered, similar toone ordered in 2017, built specifically for very long tie-backs,highlighting the need for specialised vessels for select owners.
Only six vessels have been scrapped in 2018. The reason for this lowlevel is that owners have very little economic incentive to demolishvessels, and if they do so, it is often for strategic reasons. This is
reflected in the high average age of the scrapped vessels of 40 years.
As Subsea vessels are expensive, they offer relatively little scrap valuecompared with other ship segments. They are often either used forparts, or sold out of the sector.
The orderbook consists of 44 vessels, but more than 50% of theorders are at Asian yards. More than half of the orderbook dates backto 2014 or earlier, and thus vessels are awaiting delivery in yards.One high-specification Norwegian-built vessel has reportedly been soldto one of the large integrated Subsea companies. Still, both theorderbook and the fleet are significantly oversupplied with multi-functional support vessels, and we do not see this changing for thetime being.
Source: Clarksons, Danish Ship Finance
STATUS OF SUBSEA FLEET SUBSEA PRODUCTION SPENDING (USD BILLION)AGE DISTRIBUTION OF FLEET (NO. OF VESSELS)
0
200
50
100
150
250
25+
11%
22%
10-150-5
25%
5-10
11%
3%
15-20 20-25
28%
6%
Orderbook
Laid UpIn Service
300
150
0
600
450
750
Laid Up On orderIn Service
Diving Support
Cable Layers
Multi Functional Support
Heavy Lift
Well stimulation
14
11
45
67
9
0
4
16
8
12
202020162013 2014 2015 2017 2018 2019
3
Subsea production systems spending
Percentage of fleet

Shipping Market Review – November 2018 58
Positive impactNegative impact ✓
The Subsea market will remain challenging, but we believe it haspassed the bottom of the cycle. As we expect offshore E&P spendingto stabilise and become more Subsea intensive, Subsea owners shouldsee a larger share of capital spending coming their way. In tandemwith this, we expect demand for renewables and decommissioningservices to increase over time. We continue to believe that those thatwill be the first to reap the benefits of a recovery will be the largestintegrated companies with engineering services. When they haveachieved full utilisation of their own vessels, they will once again startchartering vessels from tonnage providers on longer-term contracts.As the addressable market is now smaller, and will likely remain so inthe coming years, it is to be expected that some owners will leave theindustry. There have been several failed attempts by owners topenetrate the tier one group of players; the entry barriers haveproved too large, due to the highly complex nature of the industry.
Despite the improving market outlook, the Subsea industry needs to
improve its operational models further in order to get projectssanctioned. As we discussed in the previous edition of this report,digitalisation will play an even greater role in the oil and gas industryin the future. Integrated alliances will reduce costs and potentiallyincrease profitability for all parties involved. Reduced time to first oil,through widespread use of standardised components, earlyinvolvement in front-end design, and a leaner approach to every partof the project will be key elements in this. As testament to this, book-to-bill ratios (orders received to the amount billed for a period) havestarted to exceed 1, and thus the largest companies are finallyincreasing their backlogs. This is a very positive signal, because itsecures utilisation of vessels typically for two to four years. Theoversupply of vessels is still expected to persist for some years,however, as is the trend whereby the largest companies withengineering capabilities are using their own vessels at the expense oftonnage providers.
THE SUBSEA VESSEL MARKETThe market outlook
Offshore wind is expected to grow in the coming years. This segment is not as profitable as offshore oil, but it could employ many Subsea vessels.
The onshore plays in the US continue to attract capital that otherwise would have been directed offshore. How large oil majors choose to invest their capital in the coming years will
dictate the pace of growth offshore.
Automated ROVs are in the process of being developed, and pose a threat to the entire IMR market for Subsea vessels.
Decommissioning of non-producing oil and gas assets is expected to increase significantly in the next ten years. This represents a cost for oil companies and governments, but
worldwide this market is estimated to be worth over USD 32 billion in the period 2018-23.
Oil demand
Offshore wind
US conventional oil
Robotics and automation
Decommissioning of older assets
FORCES AT WORK IMPACTING THE LONG-TERM DEMAND OUTLOOK
There is high uncertainty as to when oil demand will peak. Oil and gas investments will likely still be needed even the peak, due to depleting production, but the uncertainty could
potentially cause large oil and gas projects with longer payback to be postponed.
✓
✓
✓
✓

Shipping Market Review – November 2018 59
The three largest players have a combined backlog of USD 17 billion,down sharply from a peak of USD 35 billion in 2014. With a smalleraddressable market, many companies have either exited the industryor restructured. The average lead time for a Subsea project fromaward to execution is approximately 3.5 years, which means we haverelatively strong visibility into Subsea projects for the coming years.There are fewer complex projects, thus there is less demand forchartering vessels from second and third tier clients. These companiesare therefore competing intensively for IMR contracts and other moresimple engineering contracts.
We define tier one contractors as fully-integrated companies withadvanced engineering capabilities. They are leaders in the SURF andengineering, procurement, construction and installation (EPCI)segment, as well as construction specialists. What these tier oneplayers have in common is that their organisations are complex, and itis difficult to replicate their business models. We classify tier twocompanies as owners with IMR capabilities and other forms of lightconstruction and engineering work.
Tier two companies charter in vessels from tier three companies, aswell as owning vessels themselves. Entry barriers are low, whichmeans that these players are often competing with smaller localplayers for contracts. The last group is tier three companies. Theseare companies with no or very limited engineering experience. Theycan own very advanced assets, but these are chartered out to tier oneor tier two companies. There are too many owners competing for thesame IMR contracts globally. Capital investments in offshore haveremained relatively flat and are expected to increase modestly nextyear. Tier one and two owners are relying on a surge in IMR spending.While IMR spending is widely expected to increase, as maintenancework is resumed, this has yet to be realised. Maintenance spendinghas remained stable at USD 53 billion since 2015.
We believe there are several reasons for this. Firstly, shipownersoperating at the high end of the market work with oil companies,
which have stringent regulations to follow, postponing maintenancework entails high financial and reputational risk. It is therefore unlikelythat oil companies risks-this over time. Secondly, new digitalinitiatives such as predictive maintenance (discussed in the previousedition of this report) are reducing costs further. Adding to this, thereare approximately 10% (400) fewer offshore wells online today than in2014, implying fewer wells that needs maintenance.
Finally, efficiency gains have been substantial across the value chain,and oil companies are adamant they will keep these in place. TheSubsea market is therefore left with a small group of advancedcompanies that have gained a sustained competitive advantage overthe rest. Tier one and two companies will continue to face heavycompetition for contracts in the next years.
SUBSEA MARKET DEEP DIVE: PROFITABILITY THROUGH COMPLEXITYTier-one companies have gained a sustained competitive advantage
Source: Clarksons, Danish Ship Finance
NUMBER OF VESSELS IN DIFFERENT TIER GROUPS
86
218
476
300
0
600
900
29
Tier-1 Tier-3Tier-2 Other/Yards/Bankrupt

Shipping Market Review – November 2018 60
THE CRUDE TANKER MARKET
SHIPPING MARKET REVIEW – NOVEMBER 2018

Shipping Market Review – November 2018 61
OU
TLO
OK
SU
MM
AR
Y
POSITIVE
NEUTRAL
NEGATIVE
THE CRUDE TANKER MARKETPerspectives and key takeaways
The Crude Tanker market continues to be burdened by surpluscapacity and freight rates are declining. Shipowners have kept the fleetstable, since a strong inflow of new vessels has been counterbalancedby very high demolition activity. The average age of vessels scrappedhas declined by two years to 19 years. The orderbook remains front-loaded and accounts for 14% of the fleet, while only 3% of the fleet isolder than 20 years. There is little indication that fleet utilisation willimprove much before 2020, unless travel speeds are reducedsignificantly and many vessels are demolished prematurely.
Inventory drawdowns have lowered short-term demand for CrudeTankers, but distance-adjusted demand is expected to increase fromapproximately 1% this year to 2.5% in 2019. That said, the escalatingtrade tensions between the US and China are creating uncertainty inthe global economy, which could ultimately dampen growth in globaloil demand.
In the long-term, the VLCC demand outlook seems relatively robust,while the outlook for Suezmax and Aframax demand looks moredifficult. Asia-bound exports are mainly traded on VLCCs, whileEuropean imports from West Africa and US imports from SouthAmerica are Suezmax and Aframax trades. Due to structurallydeclining import demand in these regions, demand for the smaller shiptypes is expected to become increasingly squeezed.
Oversupply continues to burden the mar-ket, despite a significant increase in demo-lition. Freight rates remain low, in spite ofseasonal gains. Secondhand prices foryounger vessels are stabilising, but pricesof older vessels are starting to see theimpact of a reduced average scrappingage. The long-term outlook for the smallersegments is clouded by structurally de-clining demand in key regions. The outlookfor VLCCs is robust but highly reliant onsustained growth in US crude oil exports.
WHERE WE ARE IN THE FREIGHT RATE CYCLE
The imbalance between supply and demand seems unlikely to narrowin the short term without further premature scrapping of older vessels.But the young age profile of the fleet means that further demolitionwill inevitably lower the economic lifetime of vessels. Today, the VLCCfleet only has 20 vessels older than 20 years, while 112 are on order.This indicates that there is a significant risk of further reductions in thesecondhand prices of vessels during the next year or two.
We expect that many shipowners will begin to slow steam vesselswithout scrubbers installed after the implementation of the IMO 2020regulation in order to reduce fuel consumption and lower costs. Thiswill reduce the supply of available tonnage, increase overall fleetutilisation and help freight rates towards a recovery. However, there isa risk that the market may become increasingly divided until the fuelspread narrows. More and more owners are voicing plans to equiptheir fleets with scrubbers, and estimates suggest that 59% of thecurrent VLCC orderbook will be fitted with scrubbers by 2020. Thesevessels are more likely to continue to sail at full speed, and thuscounterbalance the effects of stow steaming.
Source: Danish Ship Finance
VLCC
Suezmax
Aframax

Shipping Market Review – November 2018 62
Spot rates remain very low, but for Suezmax and Aframax vesselsthe downward pressure seems to have eased somewhat since thebeginning of 2018. For VLCCs, however, the headwind remains strongand the market reached a new historical low of USD 3,185 per day inMay 2018. The same trend can be seen for timecharter rates:Suezmax and Aframax freight rates have stabilised since the secondquarter, yet despite a net fleet reduction, VLCC timecharter rates havedropped a further 13% the last 12 months year. We note that fewvessels have been fixed on timecharters in 2018, which means thetimecharter rates shown below may not be entirely representative.There are typically few fixtures when freight rates are low, but theimpending IMO 2020 regulation could be exacerbating the situation,as charterers are reluctant to fix vessels without scrubbers.
Newbuilding prices continue to inch upwards and have increased by11% on average year-to-date, as owners’ appetite for newbuilds doesnot seem to be abating. Shipowners are concentrating orders to fewer
yards and this appears to be pushing prices upwards.
Secondhand prices for five-year-old vessels have been more or lessconstant since the beginning of the second quarter of 2018. In light ofthe depressed freight rate market, this suggest to us that demand formodern tonnage that can be retrofitted with scrubbers is currentlyrelatively high, but few sales candidates meet these criteria. For oldervessels, average secondhand prices have decreased at the same rateas scrap prices have increased. This indicates that the subduedinterest in older tonnage along with reduced economic lifetimes ofvessels has started to impact prices.
The VLCC and Aframax segments remain the most active in terms ofsales in the secondhand market. During the first nine months of2018, 3% of each of these fleets changed hands, equivalent to 27VLCCs and 16 Aframaxes, while only three Suezmax vessel was sold.
THE CRUDE TANKER MARKETFreight rates and ship prices
Source: Clarksons, Danish Ship Finance
1-YEAR TIMECHARTER RATE (USD PER DAY) SECONDHAND PRICES – 5 YEARS (USD MILLION)
02013 2014 2015 201920172016 2018
45,000
15,000
30,000
60,000
-13%
AframaxVLCC Suezmax
25
2018
100
2013 20192014 2015 2016 20170
50
75 +2%

Shipping Market Review – November 2018 63
THE CRUDE TANKER MARKETSupply-side development
Contracting continues unabated in 2018, as newbuild prices are stilllow and owners’ confidence in a market recovery is still strong.Interest in VLCCs remains dominant. In the first nine months of 2018,15.7 million dwt was contracted, equivalent to 73 vessels, which is 1.8million dwt less than in the same period in 2017. VLCCs account forapproximately three out of four new orders.
Deliveries have remained high with 16.1 million dwt, equivalent to 82vessels, delivered in the first nine months of 2018. Of these, 29 wereVLCCs. However, this was 7 million dwt less than in the same period in2017. Order postponements have increased compared to 2017,possibly due to uncertainty about whether newbuilds should be fittedwith scrubbers or not, and amounted to 4.7 million dwt in the firstnine months of this year. This seems to partly explain the slowdown indeliveries. It is demolition that have stolen the limelight in 2018,however. In the first nine months of 2018, 16.9 million dwt,equivalent to 89 vessels, was demolished. This is 88% more, in dwt
terms, than in the whole of 2017. VLCCs are leading the charge with36 vessels scrapped in the first eight months of 2018. The significantincrease in demolition for the second year in a row brought fleetgrowth down to -0.2% in the first nine months of the year. Theparticularly aggressive scrapping of VLCCs caused the VLCC fleet tocontract by -0.7%.
A counter effect of the aggressive scrapping is that the fleet renewalpotential has worsened in all segments. The number of availablescrapping candidates continues to decrease in tandem withdemolition. The VLCC orderbook has grown to 15% of the fleet andthere are now almost six VLCCs on order for every vessel in the fleetolder than 20 years – 12 months ago, this number was 3.5. In short,VLCC owners continue to up the stakes, making the market morevulnerable if demand fails to employ the new vessels entering thefleet.
Source: Clarksons, Danish Ship Finance
AGE DISTRIBUTION OF FLEET (MILLION DWT) FLEET DEVELOPMENT (MILLION DWT) FLEET RENEWAL POTENTIAL (DWT)
0
30
60
90
120
150
15-200-5 10-15
25%
35%
5-10
23%
14%
3%
20-25
0%
Orderbook25+
13%
Percentage of fleet
15
-30
-15
0
30
45
20182014
3%
2013
2%
1%
2015
7%
2016
6%
2017
3%
6%
2019
3%
2020
VLCC Suezmax Aframax Orderbook
0% 16%8%4%
2
12% 20%0
4
6
8
Aframax
Ord
erb
ook /
fle
et
>20 y
rs
VLCC
SuezmaxVLCC 2017
Suezmax 2017
Aframax 2017
Deliveries
Demolition
The smaller circles represent the fleetrenewal potential as it looked 12 months ago
Fleet growth

Shipping Market Review – November 2018 64
Positive impactNegative impact ✓
The significant demolition activity in the first seven months of the yearbrought fleet growth down to -0.2% and improved marketfundamentals. There are several factors that could curb scrapping andcause fleet growth to increase during the rest of the year, however:the dearth of older vessels left in the fleet, the Indian and Pakistanirupees weakening against the dollar, the usual slowdown caused bymonsoon season, severe economic difficulties in Turkey, andupcoming restrictions on imported vessels in China. Despite this,demolition activity remains substantial, which is positive for the short-to medium-term outlook, and we believe freight rates could begin toimprove going into 2020. After 2019, many shipowners may beginslow steaming to reduce fuel consumption, which will shrink thetrading fleet and improve utilisation, further boosting freight rates.
The outlook for Crude Tanker demand remains challenging, however.Tonne-mile demand is expected to grow by around 1% in 2018 and2.5% in 2019, but is then expected to begin decelerating. Therefore,
anything more than a brief recovery in freight rates while the markettransitions to the new normal after 2020 and the price spread betweenbunker and low-sulphur fuel oil narrows, is contingent on shipowners’ability to control ordering.
The long-term deceleration in seaborne crude oil demand growth willbe driven by an expected slowdown in seaborne imports in all regionsexcept Asia. The vast majority of trade growth is expected to be onlong-haul routes, which are dominated by VLCCs. This means thelong-term outlook for Suezmax and Aframax vessels is relativelybleak, with a few bright spots such as the newly developed US-Europetrade and intra-Asia trade as a result of increased pipeline exportsfrom Russia to East Asian markets. However, by and large, we expectany market recovery in the Suezmax and Aframax segments to bedependent on fleet growth being very controlled. For VLCCs, thedownside risks appear to be material when trade growth on the US-Asia route eventually – or quite quickly due to the US-China trade war– subsides.
THE CRUDE TANKER MARKETThe market outlook
The worsening conditions for free trade globally and the ongoing US and China trade war could impact the global economy and eventually crude oil demand negatively.
A continued increase in US oil exports to growth markets east of Suez could create stronger demand for large Crude Tankers, which would support tonne-mile demand.
Nearly half of new refinery capacity added up to 2023 will be in the Middle East and Africa. More capacity near the wellheads could reduce crude oil exports and Crude Tanker demand.
Substitution of crude oil, gas oil and fuel oil with natural gas and renewable energy in the power generation and transport sectors is likely to affect Crude Tanker demand negatively.
Growth in manufacturing and industry and increased living standards could mitigate the impact of structurally declining oil demand in OECD and thus seaborne demand for crude oil.
Geopolitical tensions
US oil exports
Refinery capacity growth in the Middle East and Africa
The clean energy transition
Economic growth in emerging markets
FORCES AT WORK IMPACTING THE DEMAND OUTLOOK
✓
✓

Shipping Market Review – November 2018 65
CRUDE TANKER MARKET DEEP DIVE: VLCC SECONDHAND PRICESExpectations about the effects of IMO 2020 implementation are running high
Investors in the oversupplied VLCC market seem to believe thatmarket fundamentals are about to bottom out. The newbuildingprice of a VLCC has increased by 12% during the past 12months, while the secondhand prices of five-, ten- and 15-year-old vessels have risen by approximately 10%, or USD 4million each. The scrap price is relatively high at USD 18million, having increased by USD 1.25 million during the past12 months.
Yet, the balance between supply and demand continues to deteriorate.Owners have scrapped a large number of older vessels, but for eachvessel scrapped, 1.2 have been ordered, and thus the fleet remainsset to grow. The value of a one-year timecharter contract (equivalent)has declined by approximately 30% (USD 2.5 million) over the past 12months and is now only USD 2,500 per day above the all-time low.This indicates that the increase in secondhand prices reflectsinvestors’ expectations rather than a fundamental market recovery.
To try to understand investors’ expectations for future earnings, wehave constructed a staircase graph, where each step represents the
price of buying access to an additional five years of cash flow. Atcurrent prices, a ten-year-old vessel costs USD 16 million more than a15-year-old vessel. This indicates that investors expect to earn atleast USD 16 million between 2023 and 2028.
We have translated these findings into a forward curve (a floor), basedon secondhand prices and an expected economic lifetime of 20 years.We find that investors currently expect the VLCC market to recoverfrom today’s level of an approximate timecharter rate equivalent ofUSD 20,500 per day to USD 36,500 per day in 2038. Most of thisgrowth, USD 8,000 per day, is expected to materialise before 2023,which we attribute to be due to the implementation of the IMO 2020regulation. While vessels may slow steam and remove some capacityfrom the market, we find a USD 8,000 per day premium hard tojustify.
We see additional downside risk to secondhand prices from anexpected reduction in the economic lifetime of vessels, vessels notslow steaming as expected, or demand failing to meet investors’current expectations.
VLCC SECONDHAND PRICES (USD MILLION) 1-YEAR TIMECHARTER RATE AND FORWARD CURVE (USD PER DAY)
18
7
16
25
2680
20
0
40
60
100
15YRScrap
65
10YR 5YR NB
18
25
41
91
Cost of accessing additional years of cash flow Current price
Sources: Clarksons, Danish Ship Finance
20.500
28.000 28.00032.000
36.500
20202005 20302000 20352010
20,000
2015 204020250
40,000
60,000
80,000
1-year timecharter rate (equivalent) Forward floor (TCE)

Shipping Market Review – November 2018 66
THE PRODUCT TANKER MARKET
SHIPPING MARKET REVIEW – NOVEMBER 2018

Shipping Market Review – November 2018 67
OU
TLO
OK
SU
MM
AR
Y
POSITIVE
NEUTRAL
NEGATIVE
THE PRODUCT TANKER MARKETPerspectives and key takeaways
The Product Tanker market remains burdened by overcapacity. Freightrates are under pressure and have dropped to the lowest levels foralmost ten years. Some excess capacity in the similarly depressedCrude Tanker market is gravitating into the Product Tanker market andreducing employment opportunities for the latter. Shipowners areworking to dampen fleet growth with increased demolition activity andless contracting activity. The orderbook, at 9% of the fleet currently, isslimming down, but it is very front-loaded: more than 70% of ordersare expected to be delivered before the end of 2019.
The firming global economy has supported consumption of oil productsin 2018, and demand for Product Tankers is expected to show growthof around 2% this year, a deceleration from the last few years. Mostanalysts are currently expecting Product Tanker demand to grow by 3-4% in 2019 and 2020, but downside risk is building. We are morecautious, as we believe the combination of rising oil prices, astrengthening US dollar, higher interest rates and escalatinggeopolitical risks pose a growing challenge for steady growth,particularly in emerging markets.
We expect the IMO 2020 regulation to boost Product Tanker demand inthe short term and improve fleet utilisation. Freight rates may riseaccordingly. However, we expect the uptick in demand to be tempo-rary.
Oversupply is keeping the Product Tankermarket depressed with low freight ratesand secondhand prices. Supply-sidepressure is easing, but downside risk tothe demand outlook is building.Implementation of the IMO 2020regulation may spark a temporaryrecovery in freight rates, but the ageprofile of the fleet continues to hold backsecondhand prices of older vessels. The MRsegment is better positioned than the LRs,as it contains more older vessels.
WHERE WE ARE IN THE FREIGHT RATE CYCLE
The surplus capacity may begin to shrink in 2020, but much willdepend on the high level of demolition activity continuing. In the LR2segment, only 11 vessels are 20 years or older and in the LR1segment there is only one vessel left in fleet older than 20 years.Most, if not all, of these older vessels can be expected to be scrappedrather than upgraded for compliance with the upcoming regulation.This would bring the economic lifetime of LRs under significantpressure. It appears that some of this pressure is already being felt insecondhand prices of older vessels, which have seen a significantdecline of 20% in 2018.
The MR segment remains much more robust. The large number ofolder vessels in the MR fleet means that its orderbook can be almostfully absorbed if these older vessels are scrapped accordingly.Furthermore, the smaller vessels are enjoying more employmentopportunities, which makes them more flexible. The average scrappingage has also declined for MRs but has settled at around 25 years,which means that there has been little structural pressure onsecondhand values.
Source: Danish Ship Finance
LR1 LR2 MR

Shipping Market Review – November 2018 68
Surplus capacity in the Product Tanker market has grown further in2018. A decline in import volumes to Brazil and a number of SouthEast Asian countries have increased vessel availability. Moreover, anumber of Crude Tankers are diverting to the Product Tanker marketon their maiden voyages and taking cargoes from the Product Tankerfleet. A VLCC is equivalent to about six MRs, and hence this has arelatively large impact on the employment opportunities for ProductTankers. The downward trajectory of spot rates continued in the firstnine months of 2018, with a 60% decline from USD 11,800 per day toUSD 4,500 per day on average. The market has not seen spot ratesthis low since August 2009. Timecharter rates also remain low buthave been more stable, declining by an average of 8% in the first ninemonths of 2018.
As we have emphasised previously, modern tonnage is more attractivethan older vessels, and this trend appears to have become entrenchedin secondhand prices. Despite the low freight rates, the price for a
five-year-old vessel has increased by an average of 5% in 2018. Incontrast, the secondhand price for a ten-year-old vessel has comedown by 20%. This is a reflection of the increased costs associatedwith making older vessels compliant with upcoming regulations, theirlower fuel efficiency and their declining economic lifetimes being takeninto account. Newbuilding prices have risen by an average of 5% in2018, but of the 62 orders placed in the first nine months of 2018,66% in dwt terms were placed at only four shipyards. The pricedevelopment is therefore more an indication of the bargaining powerof these yards than of a fundamental market improvement.
Sales activity has been high, with nearly the same amount of vesselschanging hands in the first nine months of 2018 as in the whole of2017. In line with the market preference for newer ships, we see that60% of tonnage sold so far in 2018 has been vessels younger than tenyears old. In 2017, only 43% of vessels sold in the secondhandmarket were younger than ten years.
THE PRODUCT TANKER MARKETFreight rates and ship prices
Source: Clarksons, Danish Ship Finance
1-YEAR TIMECHARTER RATE (USD PER DAY) SECONDHAND PRICES – 5 YEARS (USD MILLION)
201520130
201720162014
21,000
20192018
7,000
14,000
28,000
35,000
20142013 20182015 2016 2017 20190
15
45
30
60
LR2 MRLR1

Shipping Market Review – November 2018 69
THE PRODUCT TANKER MARKETSupply-side development
In 2018, appetite for newbuilds has waned again from last year’s high,but contracting is still above the low levels from 2016. In the firstnine months of 2018, 3.2 million dwt, or 62 new vessels, wascontracted, which is 38% less than in the same period in 2017. Thereduced contracting activity has had a positive impact on theorderbook, which has shrunk in dwt terms to a low not seen since thebeginning of 2013.
In line with contracting, deliveries have also declined this year. Inthe first nine months, 4.5 millions dwt was delivered, a 34% declinecompared with the 6.7 million dwt delivered in the same period lastyear. Thus, for the second year in a row, deliveries are declining. In2017, only MR deliveries slowed down, but in the first nine months ofthis year, deliveries are down in all three segments, most notably forLR2s with a 46% drop. Demolition continues at a rapid pace. In thefirst nine months of this year, 2.0 million dwt was demolished, a littlemore than in the whole of 2017. This resulted in net fleet growth of
1.6% in the period. The MR segment accounted for the majority ofscrapped vessels, with 1.4 million dwt demolished in the first ninemonths of the year. However, this segment also had the largestnumber of candidates for scrapping.
The fleet renewal potential graph, which shows the relationshipbetween the orderbook and the number of available scrappingcandidates, clearly illustrates the shrinking orderbook in the LRsegments. The MR segment is looking robust, as there are only 1.3vessels on order for every vessel over 20 years in the fleet. At theother extreme, the LR1 segment has 22 vessels on order for everyvessel over 20 years in the fleet. This indicates that if trade routesshorten or demand is otherwise adversely affected, the LR1 fleet willbe unable to address the potentially massive oversupply throughscrapping, without reducing the economic life of the fleet when vesselsyounger than 20 years become natural scrapping candidates.
Source: Clarksons, Danish Ship Finance
FLEET DEVELOPMENT (MILLION DWT) FLEET RENEWAL POTENTIAL (DWT)AGE DISTRIBUTION OF FLEET (MILLION DWT)
45
0
15
60
30
Orderbook
9%
27%
0-5
27%
34%
5-10 10-15
8%
15-20
2%
20-25
2%
25+
3
9
-3
0
6
12
4%
3%
2013
4%
2014
6%
2015
6%
2016 2017
3%
2018
4%
2019 2020
2%
LR2 LR1 OrderbookMR
0%0
12%3% 6% 9% 15%
7
14
21
28
Ord
erb
ook /
fle
et
>20 y
rs
MR
LR2
LR1
Orderbook / total fleet
Deliveries(excl. postponements)
Demolition
The smaller circles representthe fleet renewal potential asit looked 12 months ago
Percentage of fleetFleet growth

Shipping Market Review – November 2018 70
Positive impactNegative impact ✓
The thinning orderbook and continued strong demolition activityindicates that fleet growth will slow down in the coming years.Demand growth is expected to decelerate from the higher levels seenin recent years to around 2% in 2018, but then increase some toaround 3-4% in 2019 and 2020. This means that the vessel surpluscould begin to narrow.
In the short term, the biggest uncertainty surrounding Product Tankerdemand is the approaching IMO 2020 sulphur cap regulation. Weexpect demand for Product Tankers to accelerate in the run-up toimplementation of the regulation and to stay at an elevated level inthe ensuing period, but eventually we expect demand growth tonormalise, although how long this will take is uncertain. Thus, in theshort term, we expect the IMO 2020 regulation to be positive fordemand for Product Tankers, and not just add costs for owners.
End-user demand is projected to remain strong in the medium term,
but Product Tanker tonnes-mile demand may face challenges. Asianrefinery capacity continues to increase, and refineries are beingupgraded, which means that they will begin to cater for a larger shareof domestic demand. Hence, travel distances are likely to shorten andfewer long-haul cargoes will be moved across regions.
Intra-Asian short-haul trades are supporting MR demand, but trans-Atlantic and intra-regional trades in Europe are also contributing.Petrochemical demand in Asia is supporting LR1 trade on thebenchmark Arabian Gulf-Far East routes. Firm oil product demand inWest Africa is underpinning imports from European refineries, as nomajor refinery capacity additions are planned in West Africa. Dieselexports to Europe from the Middle East are also likely to continue tosupport LR1 trade. Asian imports of naphtha and jet fuel, from theexpanded refinery capacity in the Middle East, are driving demandgrowth in the LR2 segment. Furthermore, high refinery runs in Chinashould support inter-regional trade in Asia for LR2 tankers.
THE PRODUCT TANKER MARKETMarket outlook
FORCES AT WORK IMPACTING THE DEMAND OUTLOOK
In Latin America, particularly Mexico and Brazil, governments have voiced plans to expand the domestic refinery industries. Oil product imports from the US could decline as a result.
Low-sulphur fuel will be transported to various bunkering ports by Product Tankers, which could create new trading routes and increase demand.
Seaborne demand will be positively impacted if the petrochemical sector continues to increase its demand for naphtha as a feedstock, as is currently expected.
Rapid advances in fuel efficiency gains are expected to curb the pace of growth in demand for oil products, which will also curb growth in seaborne demand for Product Tankers.
Decarbonisation of the global economy as cost competitiveness of green technologies, energy storage and infrastructure improves will affect demand negatively in the long run.
Growth in domestic refinery capacity in Latin America
IMO 2020 low-sulphur fuel regulation
Strong growth in the petrochemical sector
Vehicle fuel efficiency gains
Decarbonisation of the economy
✓
✓

Shipping Market Review – November 2018 71
The global middle class is expanding fast, a trend that is expected tocontinue as the global economy keeps growing. Each year up to 2025,160 million people are projected to join the middle class, the vastmajority from developing economies. The expanding middle class will,among other things, drive steady growth in demand for jet fuel in the2020s.
According to IHS Markit, air passenger traffic in developing economieswill be larger than in developed economies by 2022. Asian air travel,in particular, is ramping up, mainly due to growing competition fromlow-cost carriers, which are increasingly challenging legacy operators.The largest low-cost carrier markets in the world are now India,Indonesia and China.
As the global economy grows and the global middle class expandsfurther, jet fuel demand is projected to continue to increase, by over2% annually up to 2025. Over the next five years this means thatgrowth in seaborne jet fuel is expected to grow by 80 billion tonne-miles, and account for 25% of total expected growth in seaborne tradeof oil products.
Even in the longer term, jet fuel demand will continue to grow.However, the pace of growth is expected to begin subsiding from themid-2020s onwards to a level closer to 1% growth annually due toefficiency gains. Overall, fuel efficiency gains pose the biggest risk fordemand growth, together with higher oil prices, as jet fuel demand ishighly price elastic. Eventually, new fuel and engine technologiescould threaten demand for jet fuel, but unlike for road transport, thisdoes not appear to be imminent.
Growing refinery capacity in Northeast Asia means that this region willremain a key exporter, as excess supply of jet fuel is likely to bringprices down and support arbitrage trade. The biggest demand growthis also expected to be seen in this region, and intra-Asia trade isexpected to be boosted, supporting demand for MR vessels. NortheastAsian exports to North America, a long-distance trade, are forecast toremain the biggest trade for jet fuel, in terms of volumes transported,
which will support tonne-mile demand and demand for LRs. TheMiddle East is also expanding its domestic refinery capacity to capturea higher share of the lucrative downstream refining market. Thismeans that jet fuel demand growth in the Middle East is unlikely tocontribute much to seaborne trade growth. However, Europe isincreasingly expected to source its jet fuel demand from the MiddleEast, at the expense of longer-distance imports from Asia. Meanwhile,Australian demand is also growing and the additional volumes areexpected to be sourced primarily from Northeast Asia.
Today, jet fuel only represents about 8% of total oil product demand,but the expected strong growth in jet fuel demand in the short termand the steady increase expected in the longer term will ensure it is asteady factor underpinning growth in Product Tanker demand.
PRODUCT TANKER MARKET DEEP DIVE: JET FUEL DEMANDJet fuel demand is expected to continue to grow as global living standards improve
Source: IHS Markit, Danish Ship Finance
JET FUEL DEMAND GROWTH (THOUSAND BARRELS PER DAY)
558
251191
68123
54 43
327
88
92
9958
200
0
1,000
800
600
400
29
Asia Middle East Europe Africa CISNorth America
Latin America
2017-2027 2027-2037

Shipping Market Review – November 2018 72
THE LPG TANKER MARKET
SHIPPING MARKET REVIEW – NOVEMBER 2018

Shipping Market Review – November 2018 73
OU
TLO
OK
SU
MM
AR
Y
POSITIVE
NEUTRAL
NEGATIVE
THE LPG TANKER MARKETPerspective and key takeaways
In the first nine months of 2018, seaborne LPG demand increasedmore strongly than supply. Demand expanded by 2-4%, while the fleetonly grew by around 0.5%. However, the positive effect of this wassubdued by the oversupply of vessels.
Only VLGCs benefited from the positive market development in thefirst nine months of the year. Increasing vessel demand was driven bylong-haul spot trade from the Middle East and the US to Asia region,which supported VLGC utilisation and boosted freight rates. In spite ofthis, the VLGC market remains oversupplied. In the MGC and SGCsegments, freight rates and secondhand values are still close to all-time low levels. For conditions to improve in these segments,competition from the oversupplied VLGC market needs to subside. Inthe Coastal Carrier segment, freight rates remain high due to low fleetgrowth and steady demand.
The general interpretation of the LPG market seems to be that it isheading for a recovery in 2019 and 2020, propelled by a slowdown indeliveries, high demolition activity, longer travel distances and robustdemand growth. Despite the positive development in the supply anddemand balance during the first nine months of 2018, we believe anymarket recovery will be slow. We do not expect conditions in the LPGmarket to change markedly before 2021.
Although deliveries slowed in 2018, they are set to increase in 2019
The LPG market is at a cyclical low, withfreight rates, newbuilding and secondhandprices close to all-time low levels. Marketfundamentals are expected to improve in2019, driven by demolition activity andincreasing Asian LPG demand powered byChina and India. However, the currentoversupply is likely to mute the positiveeffects on freight rates in 2019. Shortertravel distances could further dampen themarket upswing as the US-China trade warlimits long-haul US exports to Asia.
WHERE WE ARE IN THE FREIGHT RATE CYCLE
and to outpace demand in 2020. One way for fleet growth to be keptin check over the next two years is demolition. Shipowners’ willingnessto scrap older vessels did increase significantly in the first eightmonths of 2018. However, sustaining this level of demolition activitywould likely lower secondhand prices, specifically for older vessels, asthe economic lifetime of vessels would continue to decline. Anotherway for the market to absorb deliveries is increasing travel distances.Yet, longer travel distances are primarily driven by US exports to Asia,and the US-China trade war is expected to limit long-haul US exportsto Asia. Declining volumes of US LPG to the Asian market will raiseAsian LPG prices, which could result in lower than expected demandgrowth in 2019 and 2020.
In our view, these challenges, coupled with the current oversupply ofvessels, are likely to delay the recovery.
The outlook for seaborne LPG over the lifetime of a newbuild vessel(20-plus years) remains challenging. Competition from solar powerand natural gas is expected to lower demand growth from householdsin the long term. This is already happening in Europe and some Asiancountries. The growing focus on reducing the use of plastic and onplastic recycling could likewise reduce long term LPG demand growthfrom the petrochemical sector. The household and petrochemicalsectors together account for around 70% of global LPG consumption.
Source: Danish Ship Finance
SGC
MGC VLGC

Shipping Market Review – November 2018 74
The VLGC timecharter rate reached round USD 25,500 per day inSeptember 2018 following an increase around 60% from its May 2018value of around USD 16,100 per day, which was close to an all-timelow. The uptick in the VLGC rate was driven by increasing vesseldemand in the spot market and an early start to winter stockpiling.
The slump in the MGC segment continues, as the timecharter rate hita new all-time low in April 2018 of around USD 13,500 per day. TheMGC rate has since recovered to around USD 16,000 per day at endOctober. The segment remains oversupplied as competition from thelarger VLGC ships limits demand growth for MGC ships. The SGCtimecharter rate was stable during the first ten months of 2018 ataround USD 14,600 per day. Even though SGC fleet growth was justbelow zero in the period, this did not translate into increasing rates.Competition for SGC cargoes has intensified, as an increasing numberof vessels from the oversupplied MGC market are operating in the SGCmarket. Clarksons spot fixture data shows a decline in the average
SGC LPG spot cargo size of around 12% from 2016 to 2018 year-to-date.
Newbuilding and secondhand prices remain close to all-time lowlevels, although some segments have seen marginal improvements.Secondhand prices for five-year-old VLGCs and MGCs increased byUSD 1 million each during the first half of 2018, to USD 56 millionand USD 32 million, respectively. In the same period, the SGC pricedeclined by USD 2 million to USD 31 million.
Activity in the secondhand market reached a five-year high in thefirst eight months of 2018. A total of 23 ships changed hands – 14VLGCs, three MGCs and six SGCs – indicating a turnover rate ofaround 3%, measured by number of vessels. The increased activityindicates that some shipowners believe a market recovery is relativelyclose and are positioning themselves for the next upswing in freightrates.
THE LPG TANKER MARKETFreight rates and ship prices
Source: Clarksons, Danish Ship Finance
1-YEAR TIMECHARTER RATE (USD PER DAY) SECONDHAND PRICES – 5 YEARS (USD MILLION)
2013 2014
60,000
2015 2016 20170
20192018
20,000
40,000
80,000
+9,267
VLGC 65k+ cbm MGC 20-45k cbm SGC 5-20k cbm
20201820142013 2015 2016 2017 2019
40
60
80
100
-2
+1

Shipping Market Review – November 2018 75
THE LPG TANKER MARKETSupply-side development
The LPG fleet consists of 267 VLGCs, 23 LGCs, 193 MGCs and 361SGCs, of which 28 MGCs and 124 SGCs make up the ethylene nichesegment. The huge number of deliveries from 2015 to 2017 had asignificant impact on the age distribution of the fleet, and around 70%of the fleet is ten years or younger. The orderbook contains 62 ships:39 VLGCs, 11 MGCs and 12 SGCs, with a combined cargo capacity of3.5 million cubic metres, equalling 11% of the fleet. The LPG fleet haslimited scrapping potential, as only 6% of the fleet is older than 25years. The capacity in the orderbook cannot be absorbed by olderships exiting the fleet without the economic lifetime of the vesselsbeing lowered to at least 24 years by 2020.
In the first eight months of 2018, contracting kept pace withdeliveries and the orderbook did not decline, measured by capacity.A total of six VLGCs, 13 MGCs and nine SGCs were delivered duringthe period and 17 VLGCs, three MGCs and six SGCs were ordered.
Accelerated demolition activity significantly lowered fleet growth inthe first eight months of 2018, with five VLGCs, one LGC, eight MGCsand nine SGCs, corresponding to around 2.5% of the fleet, scrapped.The increasing number of vessels exiting the fleet has loweredexpected net fleet growth for 2018 to around 2%. However, it has alsopushed the average demolition age below 30 years and left the fleetwith very few remaining scrapping candidates. Only 23 VLGCs, twoLGCs, seven MGCs and 20 SGCs are 25 years or older. In 2017, theaverage scrapping age was around 31 years.
The fleet renewal potential chart below illustrates that both theMGC and SGC segments will be able to absorb the capacity in theorderbook without the vessels’ economic lifetime dipping below 25years. Yet, the VLGC and the ethylene segments only have around oneship over 25 years for every two ships in the orderbook. For thesesegments, absorbing the orderbook will result in value destruction asthe vessels’ economic lifetime would be reduced to around 20 years.
Source: Clarksons, Danish Ship Finance
FLEET DEVELOPMENT (MILLION CBM) FLEET RENEWAL POTENTIAL (CBM)AGE DISTRIBUTION OF FLEET (MILLION CBM)
12
8
0
4
1647%
0-5 15-20
21%
5-10
13% 13%
25-3020-2510-15
7%6% 5%
1%
30+ Orderbook
4
-2
2
0
6
9%
2013
5%
7%
2014
17%
2015
18%
2016 2017
2%
2018
6%
2019
6%
2020
VLGC OrderbookLGC SGCMGC
Deliveries
Scrapping
6%3% 15%12%0% 9% 18%0
1
2
3
VLGC
MGC
SGC
Ethylene
Orderbook / fleet
Ord
erb
ook /
fle
et
>25 y
rs
Net fleet growth

Shipping Market Review – November 2018 76
Positive impactNegative impact ✓
The short-term outlook (one to two years) for the LPG market isbeing depressed by the US-China trade war. In June 2018, Chinaimposed a 25% tariff on LPG imports from the US, a move whichimmediately caused a change in trade patterns. China has shiftedtowards Middle Eastern supply and US exports have been diverted toother Asian countries. A prolonged trade war between China and theUS would be damaging for the LPG market. Without access to the fast-growing Chinese market, US LPG exports would expand at a slowerrate and the added demand for Middle Eastern LPG could increaseAsian LPG prices and lower demand growth.
Low growth in US exports, specifically long-haul exports to Asia, wouldprolong the recovery period for the LPG market. Long-haul trade is themain driver for the VLGC segment, and without increased utilisationthe large ships will continue to compete against smaller segments onshorter routes. This will sustain the intense competition among thesegments.
Not accounting for demolition, we expect both supply and demand togrow by roughly 6% in 2019. Demand should to be boosted by newcapacity coming online in the Chinese petrochemical sector in 2019. In2020, supply is expected to continue to grow by around 6%, whilegrowth in demand is expected to decline to around 4%. From 2021,the current orderbook runs out and we expect market conditions tochange markedly if the pace of future newbuild orders stays belowdemand growth.
Over the next five-year period, we expect demand growth toaverage around 4% per year. Growth will continue to be driven by theAsian region, with China and India expected to be the main growthmarkets. Currently, China and India account for around 24% and 14%of global LPG imports, respectively, and imports are expected to growat a CAGR of around 9% over the next five years. Given this growthrate, the two countries will account for around 50% of the globalmarket by 2023.
THE LPG TANKER MARKETMarket outlook
FORCES AT WORK IMPACTING THE DEMAND OUTLOOK
US-China trade war
Asian demand
Emerging economics
Changing consumer habits
Circular economy
Trade flows are changing. A prolonged trade war could increase Asian LPG prices and lower global demand growth.
In the long run, Asian demand is expected to continue to drive long-haul US supply, boosting distance-adjusted demand.
Replacing dirty-burning fuels like charcoal with LPG in households could spark higher LPG demand. However, the downside risk from solar-powered cooking stoves persists.
Governments are banning plastic products like straws, cutlery and cotton buds and adding taxes to plastic bags. This will lower consumer demand for petrochemical products.
Applying circular economy principles to the plastics industry could reduce the growth rate of new plastic production.
✓
✓

Shipping Market Review – November 2018 77
LPG DEEP DIVE: THE ETHYLENE TANKER MARKETPerspectives and key takeaways
The seaborne ethylene market is set for a boom, driven by massiveexpansion of US ethylene production, although the upswing could bemuted by the accelerating use of ethylene in the US petrochemicalindustry and by the current oversupply of ethylene vessels. However,US ethylene exports are almost guaranteed to increase, as a newfacility currently under construction will expand US seaborne exportcapacity from 0.3 to 1.3 million tonnes per year around 2020.
Ethylene is a niche segment in the LPG market. There are 179ethylene ships, divided into three segments: 27 Very Small GasCarriers (VSGC, <5,000 cbm), 124 Small Gas Carriers (SGC, 5,000-20,000 cbm) and 28 Medium Gas Carriers (MGC, 20,000-40,000 cbm).Ethylene ships are the most sophisticated and diverse ships in the LPGmarket, capable of handling all cargo types in LPG market.
Ethylene can be produced from the crude oil derivative naphtha andfrom ethane gas1. Of the two feedstocks, ethane has the lowest costand yields the highest quantity of ethylene. Ethylene is used asfeedstock for polyethylene (PE) production. PE is the most widely usedplastic in the world. In its raw state, PE takes the form of small plasticpellets, which are shipped on Container ships. Seaborne ethylene tradeis driven by relatively small imbalances in supply and demand. Onlyaround 3% of global ethylene production enters the seaborne market.
The seaborne ethylene market is centred around short and medium-haul trade in Asia. The Asian region accounts for around 90% ofimports and around 65% of exports. Asia is a high-cost ethyleneproduction region, which creates long-haul arbitrage opportunities, asimports from low-cost ethylene regions like the Middle East and the UScan compete with regional production in Asia.
The enabler of long-haul arbitrage trade is a regional surplus of low-cost ethylene resulting from an expansion of regional ethylene capacitytypically in the Middle East. However, arbitrage opportunities can beshort-lived, as surplus ethylene usually stimulates an expansion ofpolyethylene (PE) production. Once new PE capacity comes online, thesupply of ethylene shrinks and seaborne arbitrage volumes declinesignificantly. New PE capacity takes around one to two years to installand PE capacity can be expanded more quickly than ethylene capacity.
PRODUCTION LINE AND SHIPPING SEGMENT
The current expansion of ethylene capacity in the US follows thispattern. The construction of a new seaborne export facility has begunand two more facilities are awaiting final investment decisions. Thenew facilities could potentially increase seaborne ethylene volumes by20-50% and consume up to 7% of US ethylene in 2021. However, USPE capacity has already started to expand and is expected to continuegrowing over the next three years. The increasing demand forethylene could potentially limit the volumes available for export andincrease US prices. This could make US ethylene exports unable tocompete with domestic ethylene production in places like Asia andEurope. The outlook for US ethylene exports is therefore highlyuncertain and the effect on seaborne trade is far from clear.
The current seaborne ethylene market is struggling with an oversupplyof ships and the market is at a periodic low. From 2013 to 2018, thefleet expanded at a CAGR of 6.5% – driven by the purpose-built long-haul MGC ships – while demand grew at a CAGR of 4%. A marketrecovery depends on whether long-haul trade can increase sufficientlyto absorb the surplus vessel capacity. Over the next three-year period,seaborne supply and demand is expected to increase at roughly thesame rate of around 3-4% per year. If long-haul US exports to Asiaincrease, travel distances will increase too, which will support fleetutilisation beyond growth in cargo volumes and could push demandbeyond supply.
Source: Danish Ship Finance1 Ethylene can also be produced from other feedstocks.

Shipping Market Review – November 2018 78
One-year timecharter rates for ethylene ships have been underpressure since 2016 due to vessel oversupply. Nevertheless, rateshave been relatively stable over the past 12 months. In September2018, the rate for a 8,200 cbm ship was around USD 15,500 per dayand for a 12,000 cbm ship around USD 17,000 per day. Compared to2016, the 8,200 and 12,000 rates have declined around 6% and 17%,respectively. Ethylene timecharter rates have been under pressure, asvessel supply has been outpacing demand since 2014. The 17,000cbm rate has seen the steepest decline, as fleet growth has beendriven by the MGC (>20,000 cbm) segment. Rates for the largersegments are also more volatile because these vessels are moreexposed to long-haul arbitrage trade.
Secondhand and newbuilding prices for a 7,500 cbm ship are at acyclical low. Prices have been at their cyclical low for almost two yearsand we believe newbuilding prices could be close to shipyard
production costs.
The secondhand market for ethylene vessels is illiquid. In 2017,three MGCs and two SGCs changed hands, indicating a turnover rateof around 3%, measured by number of vessels. The secondhandmarket reached a periodic high in 2013, when nine ships changedhands, representing turnover of around 6%, measured by number ofvessels. From 2013 to 2017, the average turnover rate for theethylene fleet was around 3%. With an unknown number ofundisclosed sales, however, the turnover rate could be higher.
LPG DEEP DIVE: THE ETHYLENE TANKER MARKETFreight rates and ship prices
Source: Clarksons, Danish Ship Finance
1-YEAR TIMECHARTER RATE (USD PER DAY) PRICES FOR A 7,500 CBM VESSEL (USD MILLION)
2008 20152009 20172010 20132011 2012 2014 2016 2018 201910,000
15,000
20,000
25,000
30,000
8.2k cbm6.5k cbm 12k cbm 17k cbm
2008 2011 20152009 201620122010 2013 2014 2017 2018 20190
12
24
36
48
10YRNB 5YR 15YR 20YR Scrap

Shipping Market Review – November 2018 79
LPG DEEP DIVE: THE ETHYLENE TANKER MARKETSupply-side development
The ethylene fleet consists of 179 ships with a combined cargocapacity of just over two million cubic metres. The fleet has anaverage age of around ten years. The age distribution, measured incapacity, is dominated by the high growth in the MGC segment overthe past five years. The orderbook contains ten ships: seven MGCs,two SGCs and one VSGC with a combined cargo capacity of 175,000cubic metres, equalling 9% of the fleet. The current orderbook isexpected to be delivered by the end of 2020. The ethylene fleet haslimited scrapping potential, as only 7% of the fleet is older than 20years. The capacity in the orderbook cannot be absorbed by olderships exiting the fleet without economic lifetime being lowered toaround 20 years. If we look just at the SGC segment, the average ageof the fleet is around 12 years, the orderbook is at 2% of the fleet,and the orderbook being absorbed by premature scrapping wouldreduce the economic lifetime of the SGC fleet to around 23 years.
Over the past five years, deliveries have been dominated by the MGC
segment. These large ethylene vessels are built for long-haul trade,and some of them were constructed as part of newbuild programmesbacked by long-term charter contracts. In the same period, SGC fleetgrowth has also been relatively strong at around a 4% CAGR.Deliveries and subsequently fleet growth have been driven by therelatively high freight rates during 2013-16, especially for larger ships.
A consequence of the strong fleet growth has been an increase incascading. The large MGC ships are increasingly competing against thesmaller SGC ships for small-volume long-haul trades.
Demolition has increased markedly in 2018. In the first eight monthsof the year, six SGCs and three VSGCs, corresponding to around 3%of the fleet were demolished. However, the increase in demolition hasleft the fleet with very few scrapping candidates. Only nine SGCs and19 VSGCs are 20 years or older. If we include demolition in theturnover rate, the average turnover rate for 2013 to 2017 was 5%.
Source: Clarksons, Danish Ship Finance
FLEET DEVELOPMENT (THOUSAND CBM) ETHYLENE SGC PETCHEM GAS SPOT TRADESAGE DISTRIBUTION OF FLEET (THOUSAND CBM)
900
600
0
300
1,200
Orderbook
47%
25-300-5
23%
5-10
12%
10-15
11%
15-20
3%
20-25
3%1%
30+
9%
400
-200
0
200
1%
0.3%
20172013 2014
8%
11%
2015
12%
2016
16%
1%
2018
7%
2019 2020
MGC > 20k cbm OrderbookSGC 5-20k cbm VSGC < 5k cbm
71%79%
68%
58%
29%21%
32%
42%
100%
50%
0%
25%
75%
2015 20172016 2018
Long haul Short haul
An average number of 180 spot trades per year were available for analysis.
Demolitions
Deliveries Net fleet growth

Shipping Market Review – November 2018 80
LPG DEEP DIVE: THE ETHYLENE TANKER MARKETDemand side development
Seaborne ethylene trade reached around five million tonnes in 2017,following strong growth in 2016 and 2017 powered by Asia.
Asia accounts for around 90% of imports and around 65% of exports.Imports are being driven by China, which accounted for 50% of globalimports in 2017. China is expected to increase domestic ethylenesupply by around eight million tonnes per year by 2022. Nevertheless,Chinese ethylene demand is expected to increase even more stronglythroughout the period, and hence China should continue to driveglobal seaborne ethylene demand. The region’s main exporters areJapan and South Korea, accounting for around 25% of global exports.Other Asian countries, like Malaysia and Thailand, are planning toexpand their ethylene production, adding to the region’s exportcapacity. Asian ethylene is produced from crude oil and productioncosts are high compared to ethylene produced from ethane gas. Asiandemand is therefore expected to continue creating arbitrageopportunities from low-cost regions such as the Middle East, the US
and Russia.
The US is expected to increase its seaborne export capacity by asmuch as 2.6 million tonnes per year by 2021. Russia and Iran areexpected to increase ethylene production by around two million tonnesand 1.5 million tonnes per year, respectively, although it is stilluncertain how much of these countries’ new capacity will be exported.Given the current US sanctions, it is unlikely that Iran will be able toincrease ethylene exports significantly. In 2017, Iranian ethylenecomprised around 6% of the total seaborne market.
Chinese owners control 6% of the global ethylene fleet. This couldenable China to profit from US sanctions against Iran by accessingstranded volumes of Iranian ethylene. If most of the Chinese fleet isemployed in this trade, Iran could potentially cover around 12% ofChinese imports. This means that in order to meet importrequirements, China will dependent on the global ethylene market.
Source: Drewry, IHS Markit, Clarksons, Danish Ship Finance
ETHYLENE EXPORTS (MILLION TONNES) FLEET OWNERSHIP (THOUSAND CBM)ETHYLENE IMPORTS (MILLION TONNES)
6
0
2
4
11%
39%
201520132012 2014 2016
50%
2017
+1%
+9%
China Rest of the worldOther Asia
6
0
4
2
2012 20172013 20152014 2016
65%
19%
16%
+4%
Asia Middle East Rest of the world
Compounded annual growth rate
Compounded annual growth rate
0
800
400
1,200
1,600
Other Asia
1%
Europe
65%
22%
America China
6% 6%
Rest of the world
Percentage of fleet
MGC SCG VSGC

Shipping Market Review – November 2018 81
The trade war between China and the US is not expected to impactthe seaborne ethylene market significantly. Ethylene is not yet amongthe products targeted by the Chinese tariffs, but, specific grades ofthe ethylene derivative polyethylene are. This could have a secondaryeffect on the seaborne ethylene market. If demand for USpolyethylene products decline US ethylene prices will decline too,making US ethylene more competitive compared with domesticethylene production in regions like Asia and Europe. However, Chinesetrade tariffs on US polyethylene are most likely to cause changes topolyethylene trade flows and the impact on the ethylene market isexpected to be minimal.
LPG DEEP DIVE: THE ETHYLENE TANKER MARKETChina-US trade war

Shipping Market Review – November 2018 82
LPG DEEP DIVE: THE ETHYLENE TANKER MARKETUS ethylene
At the start of 2018, US ethylene production capacity was around 31million tonnes per year. Over the next five years, production capacityis expected to increase by 34% to around 42 million tonnes per yearin 2023. Most US ethylene is consumed by the domestic downstreampetrochemical sector in the production of polyethylene (PE). The UScurrently has only one seaborne ethylene export facility with acapacity of 0.3 million tonnes per year, but export capacity is set toincrease to 1.3 million tonnes per year by 2020 as one new facilitycomes online. Capacity could potentially increase to 2.1 million tonnesper year by 2020 and 2.9 million tonnes per year by 2021 if proposedcapacity is build. When the new export capacity comes online, it isexpected to create added demand for ships and boost travel distances,as US exports to Asia are expected to increase. The new exportcapacity could potentially increase seaborne trade by 20-50%.
However, cost economics currently favour exports of polyethylene(PE), rather than ethylene, and the US downstream petrochemical
sector is investing heavily in new PE capacity. The increasing ethylenedemand from PE producers could limit the volumes of ethyleneavailable for export and increase domestic ethylene prices. This couldin turn lower global demand for US ethylene if ethylene imports fromthe US become too expensive to compete with domestic production.
Furthermore, the domestic US PE market is already saturated and allincremental PE capacity will have to be exported. Increasing global PEvolumes could erode some of the global demand for US ethylene.Building or expanding a petrochemical industry in order to increaseproduction of ethylene and polyethylene is expensive. One alternativewould be to take advantage of the rising global PE volumes to increaseplastic production without expanding the petrochemical industry.
A positive scenario for US ethylene exports could be declining US PEprices. This would soften domestic US ethylene demand and lowerprices, ensuring the competitiveness of US ethylene exports.
Source: Clarksons, Drewry, Danish Ship Finance
US EXPORT CAPACITY (MILLION TONNES) US PRICES (USD PER TONNE)US ETHYLENE CAPACITY (MILLION TONNES)
31
3839
4042 42
12
0
36
24
48
4%
1%
20192018
21%
3% 3%
2020 2021 2022 2023
Annual growth rate
16 16
151
1
3
0
4
2
2020 2021
0,3
2018 2019
109*
0,3
1,3
0,8
1,3
1,6
Current and expected capacity Proposed capacity
Expected online year of new export capacity
Export capacity converted to number of ships (18k cbm). Given a 55% utilisation of export capacity (historical average)
*If proposed capacity is not build, the estimated number of cargos in 2020 will be around 70
500
20190
20182014 20172015 2016
1,000
1,500
2,000
375
696
Ethane Ethylene Polyethylene
Prices increase from moving up the value
chain

Shipping Market Review – November 2018 83
THE LNG TANKER MARKET
SHIPPING MARKET REVIEW – NOVEMBER 2018

Shipping Market Review – November 2018 84
OU
TLO
OK
SU
MM
AR
Y
POSITIVE
NEUTRAL
NEGATIVE
THE LNG TANKER MARKETPerspectives and key takeaways
Market fundamentals remain strong for LNG. Current spot rates are ata five-year high, driven by a surge in Asian demand. Strong heatingdemand in the northern hemisphere during the winter months couldpush freight rates even higher.
In the first nine months of 2018, market fundamentals were supportedby stronger-than-expected demand growth from China, India andSouth Korea. At the same time, new liquefaction capacity comingonline in Australia, the US and Russia boosted LNG supply. Seabornevolumes increased by around 8% in the first nine months of 2018 andstrong growth in long-haul exports from the US and Trinidad & Tobagoboosted distance-adjusted demand by around 14%.
The majority of LNG volumes are still traded on long-term contracts.However, spot trade continues to increase and the number of newlong-term contracts is steadily declining. In the first nine months ofthis year, 26% of LNG volumes were spot purchases and 15 milliontonnes per annum (mtpa) of long-term contracts were signedcompared with an average of 34 mtpa from 2011 to 2015. This showsthat flexibility is taking priority in the LNG market.
This shift towards greater flexibility in the vessel market has led theaverage timecharter contract to decline from around 12 years toaround seven since 2014. More vessels are expected to enter the spotmarket, as the number of newbuild orders without long-term contract
The short-term outlook for the LNG marketis positive. Massive expansion inliquefaction capacity in 2019 is expected tosupport vessel demand and could pushfreight rates higher. Demand is set toremain relatively strong in 2020, butgrowth in LNG supply will stagnate andcould decline to 1% in 2021. Unless newliquefaction projects are sanctioned withinthe next few years, the LNG market willexperience a major slowdown in the firsthalf of the 2020s.
WHERE WE ARE IN THE FREIGHT RATE CYCLE
is growing. This development increases the investment risk, as vesselearnings become more exposed to freight rate volatility.
The outlook from 2019 and 2020 remains positive. In 2021, however,demand growth could slow significantly due to stagnating LNG supply.In 2019, 2020 and 2021, liquefaction capacity is expected to grow by12%, 3% and 1%, respectively. The majority of the new capacity willbe added in the US, which should increase travel distances. Therecould be periods of vessel oversupply if liquefaction projects aredelayed.
The outlook after 2021 is weakening, as there are no liquefactionprojects with startup dates beyond 2021 under construction currently.Unless several new projects are sanctioned within the next few years,growth in cargo volumes will decline significantly and the LNG marketwill experience a major slowdown in the first half of the 2020s.
The long-term outlook is weighed down by growing investment riskand competition from renewable energy. A large portion of futuregrowth in the LNG market is expected to be driven by emergingeconomies with high credit risk. It is uncertain whether these countriescan reach their demand potential, as massive investment is needed todevelop the markets. Furthermore, we remain convinced thatrenewable energy will impact the growth potential of the LNG marketmore than most of the current long-term forecasts suggest.
Source: Danish Ship Finance
LNG

Shipping Market Review – November 2018 85
Freight rates in the LNG market follow a seasonal pattern. In winter,rates are driven by heating demand and in summer by the need forcooling. In December 2017 and January 2018, cold winter weather,specifically in China, drove LNG spot rates to a three-year high. Afterthe slowdown in the spring months, spot rates rebounded to this levelagain in July and increased further to a six-year high in September.The rate for a 140,000 cbm Steam Turbine (ST) vessel reached USD85,000 per day, while the rate for a 160,000 cbm Tri-Fuel DieselElectric (TFDE) vessel reached USD 150,000 per day. From July,freight rates were supported by Atlantic-Pacific arbitrage and bySeptember the start of winter stockpiling further increased rates.
The spread between TFDE and ST spot rates is not only related tovessel size. The TFDE engine has better fuel consumption and vesselswith TFDE engines are generally younger with better isolated cargotanks. This lowers the amount of fuel used for propulsion and to re-cool the cargo, allowing for longer and cheaper transportation. The
most modern newbuild vessels (ME-GI and XDF) consume even lessfuel.
Even though most LNG vessels trade on long-term charter contracts,commodity traders and oil companies are increasingly fixing vesselsfor spot voyages. According to the IGU, there were around 370 spotfixtures in 2017, a 36% increase from 2016, and according to IHSMarkit, around 10% of the fleet operated in the spot market in August2018. The growing spot activity underlines the shift towards greaterflexibility in the LNG market.
On the back of the positive sentiment in the freight rate market,activity in the newbuild market picked up during the first nine monthsof 2018. The renewed interest in the market lifted the newbuildprice of a 170,000 cbm vessel to around USD 182 million, USD 1million higher than in January 2018. The secondhand market isilliquid, and only two vessels have changed hands so far in 2018.
THE LNG TANKER MARKETFreight rates and ship prices
Source: Clarksons, Danish Ship Finance
FREIGHT RATES (USD PER DAY) NEWBUILDING PRICES (USD MILLION)
02013 2014 20162015
100,000
2017 2018 2019
50,000
200,000
150,000
+108,000
TC 160k cbm Spot 160k cbm TFDE Spot 140k cbm ST NB price 174k cbm
2013
210
20172014165
20162015 2018 2019
180
195
225
+1

Shipping Market Review – November 2018 86
THE LNG TANKER MARKETSupply-side development
The LNG fleet consists of around 500 vessels with a combinedcapacity of around 75 million cubic metres. The fleet is relativelyyoung with around 65% of capacity younger than ten years. As ofSeptember 2018, the orderbook contained 123 vessels equalling 24%of the fleet, measured in capacity.
Contracting has picked up this year, driven by a rise in speculativeordering from new entrants and existing small shipowners in the LNGCarrier market. A total of 43 vessels were ordered in the first ninemonths of 2018. This compares with 13 vessels in the whole of 2017.In total, 16 vessels were ordered by new entrants and 12 by existingshipowners with fewer then ten ships.
In the first nine months of the year, deliveries reached a five-yearhigh and the fleet grew by around 8%. Around 70% of all scheduleddeliveries entered the market in the period. Most of those that werepostponed in 2017 due to poor market conditions entered the fleet
during the spring. If all deliveries scheduled for 2018 enter themarket, fleet growth is set to reach around 13% for the year. Given a70% delivery ratio, fleet growth will be around 11%.
Demolition remains limited in the LNG market. Only four vesselshave been demolished so far in 2018.
The orderbook by delivery year chart below shows the number ofvessels in the orderbook with and without long-term charter contracts(term contracts). Even though some of the available vessels willsecure term contracts before joining the fleet, an increasing number ofnewbuild vessels will enter the spot market in the coming years. Thiswill intensify competition for both spot and term charters. Older, lessefficient vessels will gradually be pushed out of the long-term chartermarket as their current contracts end.
Source: Clarksons, IHS Markit, Danish Ship Finance
FLEET DEVELOPMENT (MILLION CBM) ORDERBOOK BY DELIVERY YEAR (# OF VESSELS)AGE DISTRIBUTION (MILLION CBM)
24
16
0
32
8
36%
0-5
29%
24%
5-10
20%
5%
10-15
6%
15-20 20-25
1%
25-30
4%
30+ Orderbook
4
-4
0
8
12
9%
7%
2013 2020
4%
2014
7%
2015
8%
2016
6%
2017
13%
2018 2019
8%
100-140k cbm>140k cbm <100k cbm Orderbook
Net fleet growthDeliveries
Scrapping
24 23
9 9
3
8
23
24
0
16
8
32
20222018 2019 2020 2021
Term contracts Available
Orderbook as of August 2018. Vessels >60,000 cbm

Shipping Market Review – November 2018 87
Positive impactNegative impact ✓
The short-term outlook (two years) for the LNG market is positive.LNG trade is expected to grow by around 10% in 2018, depending ondemand from the northern hemisphere in the winter months. In 2019and 2020, the market will be supported by liquefaction projectscurrently under construction coming online. Capacity is set to expandby around 12% in 2019 and 3% in 2020. In 2021, projected growthdeclines to 1%, as any new liquefaction projects for whichconstruction has not yet begun will not be finished by then. Around110 vessels will be required to service the new liquefaction capacity.Given that 118 vessels are expected to enter the fleet, utilisationshould be fairly balanced until the end of 2021. There could be periodsof oversupply if liquefaction projects are delayed, although any projectslippage will help smooth the growth rate by pushing liquefactionstartup from 2019 to 2020 and 2021.
From 2019 to 2021, growth in liquefaction capacity will be driven bythe US (62%), Russia (18%), Australia (18%) and others (2%).
Asia is expected to be the main demand driver, while Europe isexpected to absorb any excess LNG supply. However, Asian demand isexpanding ahead of expectations, propelled by China’s coal-to-gasswitch, and so far no excess LNG volumes have accumulated. In theperiod, US and Russian LNG volumes heading for Asia are expected toincrease, which will result in longer travel distances creatingemployment for many of the vessels in the current orderbook.
Growth in liquefaction capacity from 2022 to 2025 is contingent onsanctioning of new liquefaction projects over the next three years.However, project sanctioning has slowed significantly since 2016following general cutbacks of capacity expenditure in the oil industry.Project sanctioning will be further limited by the massive expansion ofliquefaction capacity expected in 2019. LNG buyers are reluctant toenter into new long-term contracts amid prospects of plentiful supplyin the coming years. If project sanctioning does not increase in thecoming years, the LNG market will experience a major slowdown inthe first half of the 2020s.
THE LNG TANKER MARKETMarket outlook
FORCES AT WORK IMPACTING THE DEMAND OUTLOOK
Strong Asian demand, driven by the Chinese coal-to-gas switch, is expected to power short-term growth. US and Russia supply is expected to lead to longer travel distances.
If speculative newbuild orders continue to increase, the market could be pushed into oversupply when growth in liquefaction capacity starts to decline in 2020 and 2021.
Vessel demand could be structurally reduced. Laden vessels cross each other going from one basin to another. Rethinking trade flows could optimise supply.
Decarbonisation of power generation will generate increasing gas demand. However, by 2040 power generation from gas will be limited by the climate goals of the Paris Agreement.
Accelerating cost reductions for renewable energy mean there will be less room for LNG in the future energy mix.
Short-term demand
Speculation
Optimisation
Energy transition
Cost of energy
✓
✓

Shipping Market Review – November 2018 88
The market for Floating Storage Regasification Units is enticingshipowners with long-term charter contracts and impressivegrowth rates. However, the risks associated with investing inthese vessels is higher than for a conventional LNG Carrier.Furthermore, as the market expends, investment risk isexpected to increase.
A Floating Storage Regasification Unit (FSRU) is a LNG vessel thatfunctions as an import terminal. The FSRU receives LNG from aconventional LNG Carrier via ship-to-ship transfer. The LNG is storedin the FSRU’s cargo tanks and is then supplied to the shore as gas. AFSRU has two major advantages over onshore import terminals. It canbe brought online faster and an FSRU on a long-term charter contractis less capital-intensive than an onshore terminal.
Over the past five years, operating FSRU capacity has grown at aCAGR of around 19%. In the same period, seaborne LNG trade hasincreased at a CAGR of around 4%. A total of 16 countries import LNGvia FSRUs. However, ten of these countries, representing around 75%of operating FSRU capacity, are developing economies in Asia, SouthAmerica, the Middle East and Europe.
The large share of developing economies in the FSRU market raisesthe investment risk. The lower credit quality of utility companies andother end-users makes the probability of credit default higher than inthe LNG Carrier market. Even though the FSRU market is growingrapidly, liquidity in long-term charter contracts is low, which meansthe likelihood of a vessel securing a new contract quickly if its existingcharterer defaults is low. On top of this, capital expenditure for anFSRU is higher than for an LNG Carrier. This risk can partly bemitigated by looking to the LNG Carrier market for alternativeemployment. However, this would expose the FSRU to the volatility inthe LNG Carrier market, which could result in markedly lower rates.Moreover, this option is only applicable to purpose-built FSRUs.
FSRUs will to continue to play an important role in bringing LNGimports to new countries. The market is expected to grow at a CAGR
of around 8% until 2021. In this period, market growth will largely beachieved by utilising existing downstream gas infrastructure in importcountries, i.e. pipelines and power plants. However, long-term growthneeds to be underpinned by new investment in downstreaminfrastructure. Many of the potential future markets are in low-income,high-credit-risk countries. These countries may struggle to securefinancing for the investments needed to support gas demand.Furthermore, the increase in capital expenditure across the gas supplychain will cause the level of investment risk to rise if the FSRU marketis to reach its future potential.
The FSRU fleet consists of 28 vessels with a combined import capacityof around 100 million tonnes per year. The orderbook holds a total of11 vessels and three old LNG Carriers are awaiting FSRU conversion.The average charter length is around eight years. Currently, around80% of the fleet have charter contracts. However, this number isexpected to decline, as fleet growth is set to outpace demand.
LNG TANKER MARKET DEEP DIVE: THE FSRU MARKETFloating Storage Regasification Units are unlocking new demand, but investment risk will increase as the market expands
Source: IHS Markit, Danish Ship Finance
FSRU DEMAND, FLEET AND ORDERBOOK (NUMBER OF VESSELS)
28
3235
38
4
3
3
2
2628
3032
20
30
0
10
40
20202018 2019 2021
FSRU demand FSRU fleet Orderbook by delivery year
Vessels awaiting conversion are not included

Shipping Market Review – November 2018 89
THIS PAGE IS INTENTIONALLY LEFT BLANK

Shipping Market Review – November 2018 90
FOR FURTHER INFORMATION
PLEASE VISIT WWW.SHIPFINANCE.DK