
Shining light on the Photoactive Yellow Protein from ... · Shining light on the photoactive yellow...
132
UvA-DARE is a service provided by the library of the University of Amsterdam (http://dare.uva.nl) UvA-DARE (Digital Academic Repository) Shining light on the photoactive yellow protein from halorhodospira halophila Hendriks, J.C. Link to publication Citation for published version (APA): Hendriks, J. C. (2002). Shining light on the photoactive yellow protein from halorhodospira halophila. General rights It is not permitted to download or to forward/distribute the text or part of it without the consent of the author(s) and/or copyright holder(s), other than for strictly personal, individual use, unless the work is under an open content license (like Creative Commons). Disclaimer/Complaints regulations If you believe that digital publication of certain material infringes any of your rights or (privacy) interests, please let the Library know, stating your reasons. In case of a legitimate complaint, the Library will make the material inaccessible and/or remove it from the website. Please Ask the Library: https://uba.uva.nl/en/contact, or a letter to: Library of the University of Amsterdam, Secretariat, Singel 425, 1012 WP Amsterdam, The Netherlands. You will be contacted as soon as possible. Download date: 18 Jun 2020
Transcript of Shining light on the Photoactive Yellow Protein from ... · Shining light on the photoactive yellow...

UvA-DARE is a service provided by the library of the University of Amsterdam (http://dare.uva.nl)
UvA-DARE (Digital Academic Repository)
Shining light on the photoactive yellow protein from halorhodospira halophila
Hendriks, J.C.
Link to publication
Citation for published version (APA):Hendriks, J. C. (2002). Shining light on the photoactive yellow protein from halorhodospira halophila.
General rightsIt is not permitted to download or to forward/distribute the text or part of it without the consent of the author(s) and/or copyright holder(s),other than for strictly personal, individual use, unless the work is under an open content license (like Creative Commons).
Disclaimer/Complaints regulationsIf you believe that digital publication of certain material infringes any of your rights or (privacy) interests, please let the Library know, statingyour reasons. In case of a legitimate complaint, the Library will make the material inaccessible and/or remove it from the website. Please Askthe Library: https://uba.uva.nl/en/contact, or a letter to: Library of the University of Amsterdam, Secretariat, Singel 425, 1012 WP Amsterdam,The Netherlands. You will be contacted as soon as possible.
Download date: 18 Jun 2020

Shining light on
the Photoactive Yellow Proteinfrom Halorhodospira halophila
Johnny Hendriks
Shining light onth
e P
ho
toactiv
e Y
ello
w P
rote
infrom
Halorhodospira halophila
Johnny Hendriks
Over the past few years I have thoroughly enjoyed the investigation of the Photoactive Yellow Protein from Halorhodospira halophila. Having shed light on important aspects of this protein by shining light on it, raising new and interesting questions in the process, it is with pain in my hart that I bid the study of this protein farewell (for the time being). The time has come to spread my wings and fly of to new adventures in science. Meet you further on up the road.
Johnny
Uitnodigingvoor het bijwonen van de
openbare verdediging van het proefschrift van
Johnny Hendriks
op vrijdag6 December 2002om 11:00 precies
in de Doelenzaalvan de Aula van de
Universiteit van Amsterdam
Oude Lutherse KerkSingel 411 (hoek Spui)
Amsterdam
Receptiena afloop van de promotie
Johnny HendriksHuigenbos 621
1102 KA Amsterdam020-6911715
Paranimfen
Henk [email protected]
Levi [email protected]
Het Spui is goed bereikbaar met de tram (lijn 1,2,5 of 9)

Shining light on the Photoactive Yellow Protein
from Halorhodospira halophila
ACADEMISCH PROEFSCHRIFT
ter verkrijging van de graad van doctor aan de Universiteit van Amsterdam op gezag van
de Rector Magnificus prof. mr. P.F. van der Heijden ten overstaan van een door het college voor promoties ingestelde commissie, in het openbaar te verdedigen
in de Aula der Universiteit
op vrijdag 6 december 2002, te 11:00 uur
door
Johnny Hendriks
geboren te ‘s-Hertogenbosch

Promotiecommissie Promotor : prof. dr. K.J. Hellingwerf
Co-promotor : dr. W. Crielaard
Overige leden : prof. dr. R. Boelens prof. dr. L. De Cola prof. dr. J.W. Verhoeven dr. I.H.M. van Stokkum dr. A. Xie
Faculteit der Natuurwetenschappen, Wiskunde en Informatica
The research presented in this thesis was carried out at the Laboratory for Microbiology, Swammerdam Institute for Life Sciences (SILS, formerly E.C. Slater Institute), BioCentrum, Faculty of Science, University of Amsterdam. The work was financially supported by the Netherlands Organization for Scientific Research (NWO), through the division for Chemical Sciences (CW).
Printed by PrintPartners Ipskamp, Enschede

i
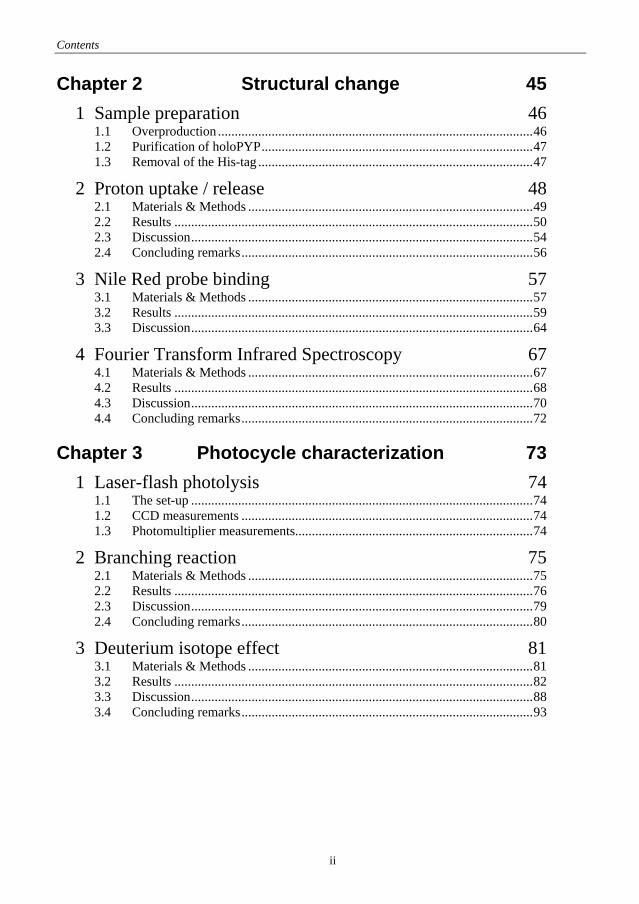
Contents
Preface iv
List of publications v
Chapter 1 Comprehensive Review 1
1 Introduction 2 1.1 The roots of the Photoactive Yellow Protein ...................................................2 1.2 Xanthopsins: the Photoactive Yellow Protein in other organisms...................3 1.3 Photoactive Yellow Protein: the prototypical PAS domain .............................3
2 Structure 5 2.1 Primary, secondary, and tertiary structure .......................................................5 2.2 Solution structure vs. crystal structure.............................................................9 2.3 The Xanthopsins compared ...........................................................................10
3 Photocycle: basics 13 3.1 How the photocycle is measured ...................................................................13 3.2 The basic photocycle .....................................................................................14 3.3 Photocycle nomenclature...............................................................................15 3.4 Experimental context .....................................................................................15 3.5 Mutants and hybrids ......................................................................................16
4 Photocycle: initial events 19 4.1 Fluorescence spectroscopy ............................................................................20 4.2 Absorption spectroscopy................................................................................22 4.3 Photoacoustic and photothermal methods......................................................23 4.4 Low temperature............................................................................................24 4.5 Structure.........................................................................................................26 4.6 Modeling........................................................................................................27 4.7 Summary........................................................................................................29
5 Photocycle: signaling state 30 5.1 The photocycle model....................................................................................30 5.2 Influence of experimental conditions.............................................................31 5.3 Structural relaxation of pR.............................................................................32 5.4 Protonation change upon pB’ formation........................................................33 5.5 Structural change upon pB formation ............................................................33 5.6 Recovery of the ground state .........................................................................37 5.7 Summary........................................................................................................38
6 Tuning 40 6.1 Ground state tuning........................................................................................40 6.2 Tuning in photocycle intermediates...............................................................41
7 Final remarks 43
Contents
Chapter 2 Structural change 45
1 Sample preparation 46 1.1 Overproduction ..............................................................................................46 1.2 Purification of holoPYP.................................................................................47 1.3 Removal of the His-tag ..................................................................................47
2 Proton uptake / release 48 2.1 Materials & Methods .....................................................................................49 2.2 Results ...........................................................................................................50 2.3 Discussion......................................................................................................54 2.4 Concluding remarks.......................................................................................56
3 Nile Red probe binding 57 3.1 Materials & Methods .....................................................................................57 3.2 Results ...........................................................................................................59 3.3 Discussion......................................................................................................64
4 Fourier Transform Infrared Spectroscopy 67 4.1 Materials & Methods .....................................................................................67 4.2 Results ...........................................................................................................68 4.3 Discussion......................................................................................................70 4.4 Concluding remarks.......................................................................................72
Chapter 3 Photocycle characterization 73
1 Laser-flash photolysis 74 1.1 The set-up ......................................................................................................74 1.2 CCD measurements .......................................................................................74 1.3 Photomultiplier measurements.......................................................................74
2 Branching reaction 75 2.1 Materials & Methods .....................................................................................75 2.2 Results ...........................................................................................................76 2.3 Discussion......................................................................................................79 2.4 Concluding remarks.......................................................................................80
3 Deuterium isotope effect 81 3.1 Materials & Methods .....................................................................................81 3.2 Results ...........................................................................................................82 3.3 Discussion......................................................................................................88 3.4 Concluding remarks.......................................................................................93
ii

Contents
iii
Chapter 4 Loose ends 95
1 Hybrids 96 1.1 Introduction....................................................................................................96 1.2 Materials & Methods .....................................................................................96 1.3 Results ...........................................................................................................96 1.4 Discussion......................................................................................................99
2 Observations 101 2.1 Protein (photo)stability ................................................................................101 2.2 Time resolved Small Angle X-ray/Neutron Scattering ................................101
3 Concluding discussion 102
References 105
Summary 112
Samenvatting 115
Dankwoord (Acknowledgements) 119

iv
Preface
Work on the Photoactive Yellow Protein (PYP) has increased significantly over the last few years. Many new insights have been obtained and the protein has arisen from one of the many proteins that are studied, to one of the few proteins that serve as model / reference systems of a (much) larger group of proteins. I am proud to have been part of PYP research in this exciting time where we have seen the rise of PYP. Though I have been involved in many collaborations, I have chosen to only present that work in this thesis for which I contributed the majority of the labor. Chapter 1 is a comprehensive review on the subject of PYP and consists mostly of original text not previously published in other reviews I have been involved with. However, an adopted form of this chapter may soon be published as part of a ‘CRC Handbook of Organic Photochemistry and Photobiology’. In Chapter 2 three lines of research are collected that have been used to elucidate structural changes during the photocycle of PYP. Two of these have been published where I am first author, the third is partly published as part of a collaboration and partly a work in progress (part of the same collaboration). In Chapter 3 two lines of research are collected that have been used to increase our understanding of the details of the photocycle of PYP. One is already published, the other has been accepted for publication, for both I am the first author. In Chapter 4 several lines of research are presented that are basically works in progress. Also, a concluding overall discussion is given in this chapter.
Next all the publication I have been involved in are listed. I hope you enjoy this thesis and that it may prove useful to you.
Johnny Hendriks.

v
List of publications
K.J. Hellingwerf, J.J. van Thor, W.D. Hoff and J. Hendriks, ‘Nanothechnology: Towards a molecular construction kit’, Arthur ten Wolde, STT Netherlands Study Centre for Technology Trends, STT 60, ISBN 90-804496-1-x, (1998), chapter 4.12, pp. 265-272, ‘Nanodevices from photobiological materials’.
J. Hendriks, W.D. Hoff, W. Crielaard, K.J. Hellingwerf, ‘Protonation/deprotonation reactions triggered by photoactivation of photoactive yellow protein from Ectothiorhodospira halophila’, The Journal of Biological Chemistry, (1999), 274(25), 17655-17660.
J. Hendriks, I.H. van Stokkum, W. Crielaard, K.J. Hellingwerf, ‘Kinetics of and intermediates in a photocycle branching reaction of the photoactive yellow protein from Ectothiorhodospira halophila’, FEBS Letters, (1999), 458(2), 252-256.
C.J. Craven, N. M. Derix, J. Hendriks, R. Boelens, K. J. Hellingwerf, and R. Kaptein, ‘Probing the nature of the blue-shifted intermediate of photoactive yellow protein in solation by NMR: Hydrogen- deuterium exchange data and pH studies’, Biochemistry, (2000), 39(47), 14392-14399.
A. Haker, J. Hendriks, T. Gensch, K. Hellingwerf, and W. Crielaard, ‘Isolation, reconstitution and functional characterisation of the Rhodobacter sphaeroides photoactive yellow protein’, FEBS Letters, (2000), 486(1), 52-56.
H. Kandori, T. Iwata, J. Hendriks, A. Maeda, and K. J. Hellingwerf, ‘Water structural changes involved in the activation process of photoactive yellow protein’, Biochemistry, (2000), 39(27), 7902-7909.
A. Xie, L. Kelemen, J. Hendriks, B. J. White, K. J. Hellingwerf, and W. D. Hoff, ‘Formation of a new buried charge drives a large-amplitude protein quake in photoreceptor activation’, Biochemistry, (2001), 40(6), 1510-1517.
D.M.F. van Aalten, A. Haker, J. Hendriks, K.J. Hellingwerf, L. Joshua-Tor, W. Crielaard, 'Engineering photocycle dynamics - Crystal structures and kinetics of three photoactive yellow protein hinge-bending mutants', The Journal of Biological Chemistry, (2002), 277(8), 6463-6468.
J. Hendriks, T. Gensch, L. Hviid, M.A. van der Horst, K.J. Hellingwerf, and J.J. van Thor, ‘Transient exposure of hydrophobic surface in the photoactive yellow protein monitored with Nile Red’, Biophysical Journal, (2002), 82(3), 1632-1643.
T. Gensch, C.C. Gradinaru, I.H.M. van Stokkum, J. Hendriks, K.J. Hellingwerf, and R. van Grondelle, ‘The primary photoreaction of photoactive yellow protein (PYP): Anisotropy changes and excitation wavelength dependence.’, Chemical Physics Letters, (2002), 356(3-4), 347-354.
J. Hendriks, I.H.M. van Stokkum, K.J. Hellingwerf, 'Deuterium isotope effects in the photocycle transitions of the Photoactive Yellow Protein', Biophysical Journal, (2002), in Press.
K.J. Hellingwerf, J. Hendriks, M. van der Horst, A. Haker, W. Crielaard and T. Gensch, ‘The family of Photoactive Yellow Proteins, the Xanthopsins: From structure and mechanism to biological function’, D.P. Häder and G. Jori, Royal Society of Chemistry, ‘Comprehensive series in Photochemical and Photobiological Sciences’, in Press.
K.J. Hellingwerf, J. Hendriks and T. Gensch, ’The ’Yellow Lab’: Will it bring us where we want to go?’, The Journal of Biological Chemistry, submitted
E. Chen, T. Gensch, A.B. Gross, J. Hendriks, K.J. Hellingwerf and D.S. Kliger, ‘Dynamics of Protein and Chromophore Structural Changes in the Photocycle of Photoactive Yellow Protein Monitored by Time-Resolved Optical Rotatory Dispersion.’, Biochemistry, submitted.
A. Haker, J. Hendriks, I.H.M. van Stokkum, J. Heberle,K.J. Hellingwerf, W. Crielaard, and T. Gensch, ‘The Two Photocycles of Photoactive Yellow Protein from Rhodobacter sphaeroides’. The Journal of Biological Chemistry, submitted.

This page was left blank intentionally
vi
1
Chapter 1
Comprehensive Review
When I take a little time to think about all that is around us, I’m always amazed at it. To think that billions of years ago earth was only a lifeless uninhabitable planet circling the sun and now we have a planet booming with life. Mother Nature has done an amazing job and created a system where everything is dependent on everything else, from viruses to mammals. It is dazzling to think about the complex nature of the ties that bind all life on earth together. ‘The ties that bind’ is a concept that can be applied to just about everything in nature, from the interactions between organisms, to the interactions between organs, to the interactions between cells, to the interactions between molecules in and around cells. It is impossible for one person to study life in all of its magnificent splendor in detail. Therefore choices are made and many people pick a very small part in this study of life and make it their own, hoping to be able to contribute their small piece to the great puzzle that is life. For my small piece I crossed paths with the ‘Photoactive Yellow Protein’ and made part of its study my own.
This chapter is composed of a comprehensive review of the Photoactive Yellow Protein. With all the recent developments in the study of this protein, the time seems right for such a review.
Chapter 1 Introduction
1 Introduction
All life forms react to each other and/or their environment in one way or another. This means signals have to be detected and relayed to make this possible. One could argue that the gathering and the subsequent relay of information is vital to life on earth. Also, most life forms on earth are dependent on electromagnetic radiation for energy and information (with the exception of organisms thriving in extreme environments, such as thermal vents on the bottom of the ocean). The ‘Photoactive Yellow Protein’ can be seen as an information gatherer that detects blue light. Additionally, it has characteristics that are similar to many other proteins that are part of the greater whole that gathers and relays information, not necessarily limited to those that detect electromagnetic radiation, nor limited to specific life forms.
In a world where economics seems to rule, the first question from many people is what is the relevance of your research for ‘real life’ applications and how can it benefit Homo sapiens. Though it is possible to think of interesting applications for the ‘Photoactive Yellow Protein’ in the ‘real’ world, those are still far away, and most likely economically uninteresting. Also the ‘Photoactive Yellow Protein’ is not a cure for some disease. This does in no way mean that this research is obsolete and a waste of time and money. It should be conceived as fundamental research. Research that generates knowledge, knowledge that can lead to new ideas and insights that in turn can lead to ‘real life’ applications or cures for diseases.
1.1 The roots of the Photoactive Yellow Protein
In 1985 Terry E. Meyer published an article with the title ‘Isolation and characterization of soluble cytochromes, ferredoxins and other chromophoric proteins from the halophilic phototrophic bacterium Ectothiorhodospira halophila’ (Meyer 1985). One of the ‘other chromophoric proteins’ was yellow and was named ‘Photoactive Yellow Protein’ in a subsequent study (McRee et al. 1986). The organism from which the Photoactive Yellow Protein was purified was reclassified in 1996 and is now named Halorhodospira halophila (Imhoff and Suling 1996). H. halophila is a unicellular prokaryotic organism, or more specifically, a phototrophic purple sulfur spirillum that deposits sulfur extracellularly. It was first isolated and classified from salt-encrusted mud taken from the shores of Summer Lake, Lake County, Oregon (Raymond and Sistrom 1967, 1969). Later it was also isolated from the extremely saline lakes of the Wadi el Natrun in Egypt (Imhoff et al. 1978). Both locations are salt lakes and indeed H. halophila only thrives in a halophilic environment. In the lab environment H. halophila requires a minimum of 9% sodium chloride in its medium to grow and is still able to grow with 30% sodium chloride (Raymond and Sistrom 1969). Compared for example to sea water, which has a salinity of 3-4%, that is very extreme. It is however necessary to have such a high salt tolerance to be able to survive in an environment like the salt lakes of Wadi el Natrun, which can have a total salinity of up to 40%.
As a phototrophic organism H. halophila requires light to survive, and there is more than enough at the salt lakes where it thrives. Like most organisms H. halophila is not immune to the effects of UV-radiation, of which there is also more than enough at salt lakes. It is therefore essential for H. halophila to find a place to live where there is enough light to live, but where the amount of UV-radiation is at a minimum. Like most phototrophic organisms H. halophila has mechanisms to perceive the available light climate. It is not only attracted by (infra)red (i.e. photosynthetic) light, but it also has a blue-light response which steers it away from potentially harmful places rich in blue light. This blue-light response has a wavelength dependence that fits the absorption spectrum of the Photoactive Yellow Protein (Sprenger et al. 1993). This is the first evidence that the Photoactive Yellow Protein is the sensor in the blue-light response of H. halophila. Further evidence for the function of the Photoactive Yellow Protein in H. halophila can be provided via genetic techniques. However, their application in extremophilic prokaryotes like H. halophila is not well developed, which is why clear genetic proof for the function of the Photoactive Yellow Protein is not yet available.
Interestingly, the function of the Photoactive Yellow Protein seems to be similar to that of the sensory rhodopsins, and in particular to sensory rhodopsin II, which is also a sensor for a negative tactile response to blue light. The family of the rhodopsins is a large family. Its members are found in all kingdoms of life, from unicellular organisms to complex organisms such as Homo sapiens sapiens. It is the most extensively studied family of photoactive proteins around. The most famous members of the family are the eye rhodopsins, which allow us to see, and bacteriorhodopsin, which is a light-activated proton pump found in Halobacterium salinarum, an archaebacterium that can also be found in salt lakes. Sensory rhodopsins are close relatives to bacteriorhodopsin and can be found in the same organism. In fact, the most notable difference between
2

Chapter 1 Introduction
bacteriorhodopsin and the sensory rhodopsins is their function. Bacteriorhodopsin provides the cell with means of harvesting light energy, whereas the sensory rhodopsins are light detectors that make sure the organisms can find a location where bacteriorhodopsin can do its work safely. The possible similarity between the Photoactive Yellow Protein and the sensory rhodopsins was already noted after the first characterization of the Photoactive Yellow Protein (McRee et al. 1986). There is however one major difference with the sensory rhodopsins which has boosted the study of the Photoactive Yellow Protein. The Photoactive Yellow Protein is highly water soluble, whereas the rhodopsins, being membrane proteins, are not. As we shall see later, the Photoactive Yellow Protein and the sensory rhodopsins are structurally two completely different proteins, which are only similar in function. For more information on the rhodopsins the reader is referred to several excellent reviews on this topic (Balashov 1995; Hoff et al. 1997b; Spudich et al. 2000).
1.2 Xanthopsins: the Photoactive Yellow Protein in other organisms
Halorhodospira halophila is not the only organism in which a photoactive yellow protein has been discovered. There are five other organisms, all purple bacteria, that also contain a protein that is similar to the Photoactive Yellow Protein from H. halophila. This family of photoactive yellow proteins has been named the Xanthopsin family (Kort et al. 1996b). Presently, the six known Xanthopsins can be divided into three sub-groups, according to their mutual similarity in primary structure. The first group is formed by proteins found in Halorhodospira halophila (synonymous to Ectothiorhodospira halophila) (Meyer 1985), Rhodothalassium salexigens (synonymous to Rhodospirillum salexigens) (Meyer et al. 1990), and Halochromatium salexigens (synonymous to Chromatium salexigens) (Koh et al. 1996). The second group is formed by proteins found in Rhodobacter sphaeroides (Kort et al. 1996b), and Rhodobacter capsulatus (Jiang and Bauer 1998). The third group consists of a single protein found in Rhodospirillum centenum (Jiang et al. 1999). In the latter the Xanthopsin is the amino-terminal domain of a larger phytochrome-like protein.
Though all these Xanthopsins can absorb blue-light, their role in the various organisms differs. In H. halophila it is accepted that the Photoactive Yellow Protein induces a photophobic tactile response (Sprenger et al. 1993). However, for the Xanthopsin found in Rb. sphaeroides genetic evidence is available that indicates that the photophobic tactile response in that organism is not mediated by a Xanthopsin, provided a genetic redundancy does not exists (Kort et al. 2000). The Xanthopsin found in Rs. centenum regulates chalcone synthase gene expression (Jiang et al. 1999). These different functions of the Xanthopsin members coincide with the sub-group assignments. Though the function of all the known Xanthopsins has not been elucidated yet, it is likely that the members within the different sub-groups of Xanthopsins, distinguished based on sequence similarity, have the same function, while these functions differ between the sub-groups.
Generally, to produce a desired function, a sensor has to interact with a transducer protein. As of yet, a transducer protein has not been found for the stand alone Xanthopsins (i.e. Xanthopsins that are not part of a larger protein). Such a transducer protein can influence the characteristics of the protein it interacts with. E.g. it is known that the characteristics of Sensory Rhodopsin I change once its transducer protein interacts with it (Spudich and Spudich 1993). Though it is important to keep this in mind, the information obtained on purified Xanthopsins, that do not interact with a transducer, is very valuable.
1.3 Photoactive Yellow Protein: the prototypical PAS domain
As described above, the Photoactive Yellow Protein is part of a family of proteins named Xanthopsins, which thus far have only been identified in proteobacteria. However, the Photoactive Yellow Protein also shows similarities with PAS domains. These PAS domains have been identified in proteins from all three kingdoms of life, i.e. in the Bacteria, the Archaea, and the Eucarya. PAS is an acronym formed from the names of the proteins in which the PAS motive was first recognized: the Drosophila period clock protein (PER), the vertebrate aryl hydrocarbon receptor nuclear translocator (ARNT), and the Drosophila single-minded protein (SIM).
Proteins containing PAS domains are predominantly involved in signal transduction. Over 200 proteins have been identified that contain (a) PAS domain(s) (Taylor and Zhulin 1999). Most of the PAS domain containing proteins, for which a function is either known or suggested, are receptors, signal transducers, or transcriptional regulators. At present PAS domains have only been identified in cytoplasmic proteins and in
3

Chapter 1 Introduction
4
the cytoplasmic domain of membrane proteins. Although the PAS domain has been found in organisms from all three kingdoms of life, not all organisms in these kingdoms contain proteins with a PAS domain.
PAS domains are usually present in proteins with a multidomain architecture. Furthermore, a single protein can have more than one PAS domain. In fact, proteins have been identified containing up to six PAS domains. In contrast, the entire Photoactive Yellow Protein from H. halophila can be considered a single PAS domain. It also is the first protein from the PAS domain family for which the 3D structure was elucidated. Consequently, it was proposed that the Photoactive Yellow Protein is the structural prototype of the PAS domain fold in PAS domain containing proteins (Pellequer et al. 1998).

Chapter 1 Structure
2 Structure
In photoactive proteins the chromophore is usually at the heart of the functional characteristics that have to do with the absorption of photons. The chromophore is usually – the green fluorescent protein is an exception – a prosthetic group which is bound to the apo-protein to form the holo-protein. The type of chromophore in a photoactive protein is dependent on the wavelength range in which the holo-protein needs to be active. With activity in the red and infrared part of the spectrum, tetrapyrroles are found as chromophore. With activity in the green part of the spectrum polyenes (and to a certain extent, flavines) are found as chromophore. With activity in the blue and UV part of the spectrum aromatic chromophores are found (Hellingwerf et al. 1996). The Xanthopsins are active in the blue part of the spectrum and, in agreement with the above, use an aromatic chromophore. This chromophore was identified for the Photoactive Yellow Protein from Halorhodospira halophila in 1994. By using a combination of techniques, it was shown that this chromophore is a 4-hydroxycinnamic acid moiety that is covalently bound to the protein in a thiol ester linkage with Cys69 (Baca et al. 1994; Hoff et al. 1994b).
A high resolution structure of the Photoactive Yellow Protein from Halorhodospira halophila became available in 1995 (Borgstahl et al. 1995) and has proven to be an important tool in the study of this protein. A thorough understanding of this structure is an asset that allows unique insights into experimental results. As such, the structure of the Photoactive Yellow Protein will be discussed first.
2.1 Primary, secondary, and tertiary structure
It is impossible to show all important features of the structure in a single picture. Therefore, several views of the structure are presented here, each with its own strengths. The schematic drawing shown in Figure 1 contains the full primary structure, shows the position of the main secondary structural elements (the α-helices and β-strands), and reflects the tertiary structure as well. A complete list of secondary structural elements can be found in Table 1. The Photoactive Yellow Protein has an α/β-fold containing a six stranded anti-parallel β-sheet as a scaffold, which is flanked by several helices. The loop containing helices α3 and α4, and the loop containing helix α5, fold on top of the central β-sheet to form a hydrophobic core and a pocket in which the chromophore resides. The N-terminal segment, containing helices α1 and α2, folds behind the central β-sheet to form a smaller hydrophobic core. The tertiary structure is shown more clearly in Figure 2, where in panel a the structure is oriented such that the β-sheet is oriented similar to the schematic drawing shown in Figure 1. The view in panel b of Figure 2 shows how the different α-helix containing loops fold around the β-sheet.
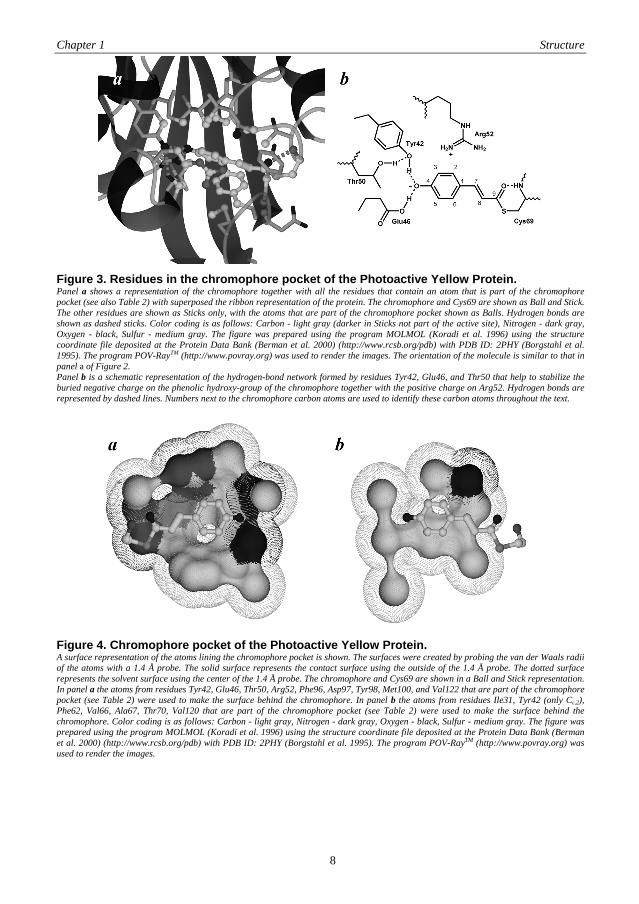
The chromophore plays a crucial role in the activity of the Photoactive Yellow Protein. In panel a of Figure 3 the residues that contain atoms that line the chromophore pocket are shown (see also Table 2). A superposition of a ribbon representation of the protein is added for reference. The chromophore pocket that is formed by the atoms listed in Table 2 is completely buried and has no direct contact with solvent. Figure 4 provides a view of the walls of the chromophore pocket in two panels, where in panel a the surface of atoms that lie above the plane of the chromophore, as presented in Figure 2, is shown and in panel b the surface of atoms that lie below the plane of the chromophore is shown. In the ground state of the Photoactive Yellow Protein the hydroxy-group of the chromophore is deprotonated (Baca et al. 1994; Kim et al. 1995). The resulting negative charge is completely buried in the protein and is stabilized via a hydrogen-bonding network and by the positive charge of the nearby Arg52 (Borgstahl et al. 1995; Yoda et al. 2001; Groenhof et al. 2002a) as is schematically shown in panel b of Figure 3. Additionally, the negative charge is delocalized over the chromophore via an extensive π-orbital system. The hydrogen-bonding network is made up of the residues Tyr42, Glu46, and Thr50, where Oη from Tyr42 and Oε,2 from Glu46 form a direct hydrogen bond with the chromophore, which is also inferred in panel a of Figure 4. Oγ,1 from Thr50 hydrogen-bonds with Oη from Tyr42 but does not line the chromophore pocket.
The chromophore pocket is probably the most important part of the Photoactive Yellow Protein and is consequently also its best studied part. E.g. the optical tuning of the protein, certain pH dependent behavior, and global structural changes of the protein can all be traced back to events that occur in and around the chromophore pocket as will become clear later.
5

Chapter 1 Structure
Figure 1. Schematic representation of the sequence and structure of the Photoactive Yellow Protein. The amino acid sequence of PYP from Halorhodospira halophila is represented schematically, reflecting secondary and tertiary structural elements. This figure was prepared using the information contained within the structure coordinate file deposited at the Protein Data Bank (Berman et al. 2000) (http://www.rcsb.org/pdb/) with PDB ID: 2PHY (Borgstahl et al. 1995). β-strands are indicated in dark gray arrows, where the dotted lines represent hydrogen bonds between residues within the β-sheet. α-helices are indicated in light gray rods, where the line type (solid, dotted, dashed, dot-dashed) of the circle encompassing the residue name and number indicates which residues hydrogen bond with each other, i.e. a residue hydrogen bonds with the closest residue(s) with the same line type that is (are) within the same α-helical element. Other structural elements (π-helix; Type I and II turns) are not depicted. A summary of all secondary structural elements is presented in Table 1.
6

Chapter 1 Structure
Figure 2. Tertiary structure of the Photoactive Yellow Protein. Two orientations of a ribbon representation of the Photoactive Yellow Protein from Halorhodospira halophila are presented. Panel a has the β-sheet oriented similar to the schematic representation in Figure 1. Panel b is a side view, of the orientation in panel a, visualizing both sides of the β-sheet. The figure was prepared using the program MOLMOL (Koradi et al. 1996) using the structure coordinate file deposited at the Protein Data Bank (Berman et al. 2000) (http://www.rcsb.org/pdb) with PDB ID: 2PHY (Borgstahl et al. 1995). The program POV-RayTM (http://www.povray.org) was used to render the images.
Table 1. Secondary structural elements of PYP in crystal and solution. The secondary structural elements of PYP from Halorhodospira halophila were obtained from the structure coordinate files as deposited in the Protein Data Bank (Berman et al. 2000) (http://www.rcsb.org/pdb/). For the structural information in the crystal the file with PDB ID: 2PHY (Borgstahl et al. 1995), based on X-ray diffraction data, was used. For the structural information in solution the file with PDB ID: 3PHY (Dux et al. 1998), based on NMR data, was used.
crystal solution name type start end name type start end
helices helices α1 α-helix Ile11 Leu15 α1 α-helix Ile11 Leu15 α2 α-helix Asp19 Leu23 not defined in PDB ID: 3PHY α3 α-helix Asn43 Thr50 α3 α-helix Asn43 Thr50 α4 α-helix Asp53 Val57 α4 α-helix Asp53 Ile58 α5 α-helix Phe75 Gly86 α5 α-helix Phe75 Gly86
π-helix Asn61 Ala67 not defined in PDB ID: 3PHY
β-strands β-strands β1 β-strand Lys60 Phe62 β1 β-strand Lys60 Phe62 β2 β-strand Gly37 Gln41 β2 β-strand Asn38 Leu40 β3 β-strand Gly29 Asp34 β3 β-strand Ala27 Asp34 β4 β-strand Ser117 Val125 β4 β-strand Trp119 Val125 β5 β-strand Thr103 Ala112 β5 β-strand Thr103 Lys111 β6 β-strand Leu88 Phe96 β6 β-strand Leu88 Phe96
Turns Turns T1 Type II Ala5 Ser8 T2 Type I Ser8 Ile11 T3 Type I Leu15 Met18 T4 Type I Leu23 Leu26 T5 Type I Asp34 Gly37 T6
no turns defined in PDB ID: 3PHY Type II Val57 Lys60
T7 Type I Ala67 Thr70 T8 Type I Pro68 Asp71 T9 Type I Ser72 Phe75 T10 Type II Asp97 Met100
7
Chapter 1 Structure
Figure 3. Residues in the chromophore pocket of the Photoactive Yellow Protein. Panel a shows a representation of the chromophore together with all the residues that contain an atom that is part of the chromophore pocket (see also Table 2) with superposed the ribbon representation of the protein. The chromophore and Cys69 are shown as Ball and Stick. The other residues are shown as Sticks only, with the atoms that are part of the chromophore pocket shown as Balls. Hydrogen bonds are shown as dashed sticks. Color coding is as follows: Carbon - light gray (darker in Sticks not part of the active site), Nitrogen - dark gray, Oxygen - black, Sulfur - medium gray. The figure was prepared using the program MOLMOL (Koradi et al. 1996) using the structure coordinate file deposited at the Protein Data Bank (Berman et al. 2000) (http://www.rcsb.org/pdb) with PDB ID: 2PHY (Borgstahl et al. 1995). The program POV-RayTM (http://www.povray.org) was used to render the images. The orientation of the molecule is similar to that in panel a of Figure 2. Panel b is a schematic representation of the hydrogen-bond network formed by residues Tyr42, Glu46, and Thr50 that help to stabilize the buried negative charge on the phenolic hydroxy-group of the chromophore together with the positive charge on Arg52. Hydrogen bonds are represented by dashed lines. Numbers next to the chromophore carbon atoms are used to identify these carbon atoms throughout the text.
Figure 4. Chromophore pocket of the Photoactive Yellow Protein. A surface representation of the atoms lining the chromophore pocket is shown. The surfaces were created by probing the van der Waals radii of the atoms with a 1.4 Å probe. The solid surface represents the contact surface using the outside of the 1.4 Å probe. The dotted surface represents the solvent surface using the center of the 1.4 Å probe. The chromophore and Cys69 are shown in a Ball and Stick representation. In panel a the atoms from residues Tyr42, Glu46, Thr50, Arg52, Phe96, Asp97, Tyr98, Met100, and Val122 that are part of the chromophore pocket (see Table 2) were used to make the surface behind the chromophore. In panel b the atoms from residues Ile31, Tyr42 (only Cε,2), Phe62, Val66, Ala67, Thr70, Val120 that are part of the chromophore pocket (see Table 2) were used to make the surface behind the chromophore. Color coding is as follows: Carbon - light gray, Nitrogen - dark gray, Oxygen - black, Sulfur - medium gray. The figure was prepared using the program MOLMOL (Koradi et al. 1996) using the structure coordinate file deposited at the Protein Data Bank (Berman et al. 2000) (http://www.rcsb.org/pdb) with PDB ID: 2PHY (Borgstahl et al. 1995). The program POV-RayTM (http://www.povray.org) was used to render the images.
8

Chapter 1 Structure
Table 2. Chromophore pocket. The atoms that line the chromophore pocket were determined via a CASTp analysis (Liang et al. 1998) (http://cast.engr.uic.edu/cast/). The analysis was performed on the structure coordinate file deposited at the Protein Data Bank (Berman et al. 2000) (http://www.rcsb.org/pdb/) with PDB ID: 2PHY (Borgstahl et al. 1995). In the CASTp analysis the chromophore pocket received the pocket/cavity ID 13. This pocket has no mouth openings and has a solvent accessible surface volume of 27.164 Å3 (molecular surface volume is 226.54 Å3).
Residue Atoms Residue Atoms Ile31 Cδ,1 Cys69 Sγ
Tyr42 Cε,2 ; Oη Thr70 Cγ,2 Glu46 Oε,2 Phe96 Cβ ; Cγ ; Cδ,1 ; Cδ,2 ; Cε,1 ; Cε,2 ; Cζ Thr50 Cβ ; Cγ,2 Asp97 N Arg52 Cγ ; Cδ ; Nε ; Cζ ; Nη,1 ; Nη,2 Tyr98 N ; Cβ Phe62 Cε,1 ; Cζ Met100 Sδ ; Cε Val66 O ; Cγ,1 Val120 Cγ,1 Ala67 Cα ; Cβ Val122 Cγ,2
2.2 Solution structure vs. crystal structure
Up till now we have only looked at the structure of the Photoactive Yellow Protein in the confines of a crystal lattice. In vivo the protein is located in the cytoplasm, where it may have more freedom to move, and which is more like the conditions used for most in vitro experiments. It is therefore important to know what the differences are between the crystal structure and the solution structure of the Photoactive Yellow Protein. On the other hand, the protein may still be confined or partly constrained in its movement in vivo by e.g. a transducer protein. The in vivo situation may therefore be a situation that is a hybrid of the situation in the crystal lattice and the situation in solution.
The ground state structure of the Photoactive Yellow Protein has also been determined via multi-dimensional NMR spectroscopy (Dux et al. 1998). The NMR structure of the Photoactive Yellow Protein may be considered to be the solution structure of the Photoactive Yellow Protein. This solution structure is very similar to the structure found with X-ray crystallography. Where with X-ray crystallography usually one structure is generated from the data, with NMR usually an ensemble of structures is generated that are all compatible with the NMR data (see Figure 5). In Table 1 the secondary structural elements from the crystal structure and the solution structure are compared. Most are present in both structures though they may start/end 1 to 2 residues earlier or later. Notable are the helix α2 and the π-helix, which are not defined in the solution structure. There are three poorly defined regions in the solution structure comprising of residues 1-5, 17-23, and 113-117. In Figure 5 this is characterized by a bad overlap of the different structures, most notable on the left side of the structure. This is caused by lack of structural constraints in the NMR dataset, which might be brought about by fast internal motions in those regions, or in other words, by high mobility in those regions (Dux et al. 1998). In the crystal structure the same regions also have higher values for the B-factor, which is related to mean-square fluctuations of the atoms from their average position.
Figure 5. NMR structures A representation of the 26 NMR structures of Photoactive Yellow Protein from Halorhodospira halophila is presented. Shown are the backbone, chromophore and Arg52 side chain of the 26 NMR structures. Just bonds are shown which are colored according to the atoms they connect. For the backbone and the Tyr98 side chain, carbon is coded gray, for the chromophore the carbons are coded white, nitrogen is coded dark gray, and oxygen is coded black. For Arg52 the color code is split into two, reflecting the two orientations that Arg52 is found in. The carbons of models 1,3,4,5,7,8,9,17,18,23,24, and 25, from the structure coordinate file deposited at the Protein Data Bank (Berman et al. 2000) (http://www.rcsb.org/pdb) with PDB ID: 3PHY (Dux et al. 1998), are colored black. These Arg52 side chains are clustered with the guanidinium group above the aromatic ring of Tyr98. The carbons of Arg52 of the remaining models are colored gray. These Arg52 side chains are clustered above the chromophore ring. The bonds of Arg52, Tyr98 and the chromophore are shown with a larger radius than the other bonds. The figure was prepared using the program MOLMOL (Koradi et al. 1996). The program POV-RayTM (http://www.povray.org) was used to render the image.
9

Chapter 1 Structure
From an ensemble of structures, such as obtained with NMR or via molecular dynamics, it is possible to determine eigenvectors that describe the path along which the different protein elements move (van Aalten et al. 1998; Van Aalten et al. 2000). Using these eigenvectors, or modes of flexibility, it is possible to transform the solution structure into the crystal structure, indicating that the observed differences are within the confines of the natural movement (or intrinsic flexibility) of the protein. This is further corroborated by the fact that when the Photoactive Yellow Protein is crystallized in the P65 space group (Van Aalten et al. 2000), instead of the P63 space group (Borgstahl et al. 1995), its structure is different, but within the confines of the intrinsic modes of flexibility of the protein.
The structure determined with NMR confirms the presence of the hydrogen-bonding network in the chromophore pocket. However, there is one striking difference with the crystal structure. Residue Arg52 is present in two conformations (see Figure 5). One where Arg52 is clustered about 4 Å above the aromatic chromophore ring, which is indicated by the gray colored Arg52 side chains in Figure 5. The other conformation has the guanidinium group of Arg52 positioned about 4 Å above the aromatic ring of Tyr98, which is indicated by the black colored Arg52 side chains in Figure 5. This is in line with the observation that positively charged amino groups like to pack within 3.4 to 6 Å of the centroids of aromatic rings (Scrutton and Raine 1996). The conformation for Arg52 and Tyr98 found in the crystal is different from the two conformations for Arg52 and the conformation of Tyr98 found in solution.
2.3 The Xanthopsins compared
In section 1.2 it was noted that the Xanthopsins can be divided into three sub-groups based on their primary structure. Sub-group I contains Xanthopsins found in Halorhodospira halophila, Rhodothalassium salexigens, and Halochromatium salexigens. Sub-group II contains Xanthopsins found in Rhodobacter sphaeroides and Rhodobacter capsulatus. Sub-group III contains the Xanthopsin found in Rhodospirillum centenum. In Figure 6 the primary structures of all Xanthopsins currently known are shown in an alignment. Table 3 list the percentages of conserved residues between the different Xanthopsins. The primary structures within the sub-groups are indeed very similar with identities around 75% (87% similarity, i.e. including conserved substitutions) in pair wise alignments. In a comparison of Xanthopsins from sub-group I with Xanthopsins from other groups the alignments become worse with identities around 45% (67% similarity). Comparison of Xanthopsins from sub-group II with the one from sub-group III provides even poorer results with identities around 33% (57% similarity). When all currently known Xanthopsins are aligned an identity of 23% (46% similarity) is obtained.
Since, the Xanthopsin sub-groups were defined based on sequence similarity these results should not be very surprising. However, by looking at sub-domains of the sequence alignments, better insight is obtained on which domains make a Xanthopsin a Xanthopsin, and which domains are important for the function the Xanthopsin has in the organism it resides in. In section 1.3 the Photoactive Yellow Protein was proposed to be a prototype for the PAS domain. The family of PAS domains is a very large one that spans all three kingdoms of life. A PAS domain is not so much defined by its primary structure, but more by its secondary and tertiary structural elements. The PAS domain can be divided into four sub-domains, the N-terminal cap, the PAS core, the helical connector, and the β-scaffold. In the Photoactive Yellow Protein from Halorhodospira halophila these sub-domains comprise residues 1-28, 29-69, 70-87, and 88-125 respectively (Pellequer et al. 1998). Thus the N-terminal cap contains helices α1 and α2, the PAS core contains the β-strands β1, β2 and β3, and the helices α3 and α4, the helical connector contains helix α5, and the β-scaffold contains the β-strands β4, β5 and β6 (see also Figure 6). The residues that form the chromophore pocket are all contained within the PAS core and β-scaffold, which are sandwiched together. Table 4 list the percentages of conserved residues in the different PAS sub-domains of the Xanthopsins. Within the Xanthopsin sub-groups no real distinction can be made between the different PAS sub-groups, indicating that the mutations are spread evenly over the entire protein. However, in a comparison of all Xanthopsins a clear distinction can be made between the PAS sub-groups, when looking at the percentage of similarity. The PAS-core and β-scaffold have a similarity of 66 % and 50% respectively, whereas the N-terminal cap and helical connector only have a similarity of 25% and 34% respectively. This suggest that the PAS-core and β-scaffold are what a Xanthopsin makes a Xanthopsin and that the N-terminal cap and the Helical connector determine the function the Xanthopsin has in the organism it resides in. When the same analysis is done with only the Xanthopsin sub-groups I and II, the picture becomes slightly different. The PAS-core is best conserved with a similarity of 71%, the N-terminal cap and β-scaffold have a similarity of 50% and 53% respectively, and the Helical connector has a similarity of 33%. The most remarkable difference here is that the N-terminal cap has a
10

Chapter 1 Structure
considerably increased similarity that has become similar to the one of the β-scaffold. This difference can be explained by the fact that Xanthopsins from both sub-group I and II are complete proteins whereas the Xanthopsin from sub-group III is a sub-domain of a larger protein. This could indicate that the N-terminal cap may play an important part in signal transduction, since this is probably one of the biggest differences between Xanthopsins from sub-group I and II, and the Xanthopsin from sub-group III.
1 2 3 4 5 6 ---1234567--89012345678901234567890123456789012345678901234567890
Hrh_hal ---MEHVAFG--SEDIENTLAKMDDGQLDGLAFGAIQLDGDGNILQYNAAEGDITGRDPKQVIGK Hch_sal ---MDIVHFG--SDDIENSLANMSDQDLDQLAFGAIQLDASGKVLQYNAAEGGITGRDPKSVIGK Rth_sal ---MEMIKFG--QDDIENAMADMGDAQIDDLAFGAIQLDETGTILAYNAAEGELTGRSPQDVIGK Rba_sph ---MEIIPFG--SADLDNILARE-PQRAEYLPFGAVLLDRTGTILKYNRAEGGIANRNPADVIGK Rba_cap ---MEIIPFG--TNDIDNILARE-PARAESLPFGAVLLDRMGRIAKYNKAEGLIAGRDPSTVIGR Rsp_cen MPDRTTDDFGPFTEQIRGTIDGMGTAEFDALPVGAIQVDGSGVIHRYNRTESRLSGRIPERVIGR
α1 α2 β1 β2 α3 α4 N-terminal cap | PAS core
1 1 1 7 8 9 0 1 2 12345678901234567890123456789012345678901234567890123456789012345
Hrh_hal NFFKDVAPCTDSPEFYGKFKEGVASGNLNTMFEYTFDYQMTPTKVKVHMKKALSGDSYWVFVKRV Hch_sal NFFEDVAPCTKSQEFQGRFKEGVANGNLATMFEYVFDYQMKPTKVKVHMKKALVDDSYWIFVKRL Rth_sal NFFKDIAPCTDTEEFGGRFREGVANGDLNAMFEYVFDYQMQPTKVKVHMKRAITGDSYWIFVKRV Rba_sph NFFNEIAPCAKGKRFHGEFLRFHQTGQVNVMFDYKFAYKGANVGVKIHMKSQPDGQSCWLFVKRV Rba_cap DFFNEIAPCAKGKRFHGEFLKFNRTGQANVMLDYKFNYKGAEVAVKIHLKSQPDGQFCWLFVKRA Rsp_cen NFFTEVAPCTNIPAFSGRFMDGVTSGTLDARFDFVFDFQMAPVRVQIRMQNAGVPDRYWIFVRKL
β3 α5 β4 β5 β6 | helical connector | β-scaffold
Figure 6. Sequence alignment of the Xanthopsins An alignment of all currently known Xanthopsins is presented where the following abbreviations stand for the organism in which the Xanthopsin was found with in parentheses the accession number for the primary sequence: Hrh_hal, Halorhodospira halophila (X98887); Hch_sal, Halochromatium salexigens (P81046); Rth_sal, Rhodothalassium salexigens (X98888); Rba_sph, Rhodobacter sphaeroides (AJ002398); Rba_cap, Rhodobacter capsulatus (AF064095); Rsp_cen, Rhodospirillum centenum (AF064527). Only the residues from Hrh_hal, Hch_sal and Rth_sal are correctly numbered, for the correct numbering of the other sequences you need to correct for deletions (residue 19 in Rba_sph and Rba_cap) and insertions (up to residue 8 in Rsp_cen) in the sequence. The location of the α-helices and β-strands for the Hrh_hal sequence are shown via cartoons below the sequence alignment (see also Figure 1 and Table 1) together with the names of the PAS-domain, sub-domains. The color code for the alignment is as follows. The base color is a white highlight with black letter, any other color has a special meaning for the alignment. Residues that are conserved throughout the currently known Xanthopsins have a black highlight and white letter. Residues that have conserved substitutions are shown with a light gray highlight. Residues that are conserved for the Xanthopsin sub-group containing Hrh_hal, Hch_sal and Rth_sal, but are not conserved in all currently known Xanthopsins, have a medium dark gray highlight with white letter or if they are part of a conserved substitutions for all Xanthopsins have a light gray highlight with medium dark gray letter. Conserved substitutions in this sub-group are given a medium gray highlight. Residues that are conserved for the Xanthopsin sub-group containing Rba_sph and Rba_cap, but are not conserved in all currently known Xanthopsins, have a dark gray highlight with white letter or if they are part of a conserved substitutions for all Xanthopsins have a light gray highlight with dark gray letter. Conserved substitutions in this sub-group are given a medium light gray highlight. This figure was prepared using information obtained from several alignments performed with ClustalW (Thompson et al. 1994) (http://www.ebi.ac.uk/clustalw/).
11

Chapter 1 Structure
12
Table 3. Xanthopsin alignments The percentage of conserved residues (straight numbers) and percentage of conserved residues together with conserved substitutions (italic numbers) is listed for alignments between all currently known Xanthopsins. The following abbreviations stand for the organism in which the Xanthopsin was found with in parentheses the accession number for the primary sequence and the number of amino acids in the sequence: Hrh_hal, Halorhodospira halophila (X98887; 125 aa); Hch_sal, Halochromatium salexigens (P81046; 125 aa); Rth_sal, Rhodothalassium salexigens (X98888; 125 aa); Rba_sph, Rhodobacter sphaeroides (AJ002398; 124 aa); Rba_cap, Rhodobacter capsulatus (AF064095; 124 aa); Rsp_cen, Rhodospirillum centenum (AF064527; 130 aa). The results from pair wise alignments are shown, where the sequence indicated in the left column was used as reference in the comparison with the sequence indicated in the top row. This induces a small difference in the obtained percentages for the comparison of the same two sequences, depending on which sequence was used as reference, when these sequences have a different length. Alignments within the Xanthopsin sub-group containing Hrh_hal, Hch_sal, and Rth_sal are shown with a light gray highlight. Alignments within the Xanthopsin sub-group containing Rba_sph, and Rba_cap are shown with a dark gray highlight. The last column list the alignment percentages of all sequences in a sub-group of the Xanthopsins. The percentages for the alignment of all Xanthopsins is presented on the bottom right of the table and is highlighted black with white text. This table was prepared using information obtained from several alignments performed with ClustalW (Thompson et al. 1994) (http://www.ebi.ac.uk/clustalw/).
Hrh_hal Hch_sal Rth_sal Rba_sph Rba_cap Rsp_cen 100 % 76.80 % 71.20 % 47.20 % 43.20 % 43.20 % Hrh_hal 100 % 85.60 % 86.40 % 68.80 % 67.20 % 71.20 %
76.80 % 100 % 68.80 % 46.40 % 41.60 % 44.00 % 64.80 %
Hch_sal 85.60 % 100 % 88.80 % 66.40 % 66.40 % 68.80 % 71.20 % 68.80 % 100 % 48.80 % 43.20 % 44.00 % Rth_sal 86.40 % 88.80 % 100 % 64.80 % 63.20 % 68.80 %
81.60 %
47.58 % 46.77 % 49.19 % 100 % 78.23 % 33.06 % Rba_sph 69.35 % 66.94 % 65.32 % 100 % 88.71 % 56.45%
78.23 %
43.55 % 41.94 % 43.55 % 78.23 % 100 % 32.26 % Rba_cap 67.74 % 66.94 % 63.71 % 88.71 % 100 % 58.06 %
88.71 %
41.54 % 42.31 % 42.31 % 31.54 % 30.77 % 100 % 23.20 % Rsp_cen
68.46 % 66.15 % 66.15 % 53.85 % 55.38 % 100 % 46.40 %
Table 4. PAS sub-domain alignment of the Xanthopsins The percentage of conserved residues (straight numbers) and percentage of conserved residues together with conserved substitutions (italic numbers) is listed for alignments between the PAS sub-domains of all currently known Xanthopsins. Here group I (highlighted light gray) contains Xanthopsins found in Halorhodospira halophila, Halochromatium salexigens, and Rhodothalassium salexigens; group II (highlighted dark gray) contains Xanthopsins found in Rhodobacter sphaeroides, and Rhodobacter capsulatus; group III contains the Xanthopsin found in Rhodospirillum centenum. Alignments of all currently known Xanthopsins are highlighted black with white text. Based on the situation in the Xanthopsin found in Halorhodospira halophila the N-terminal cap consists of residues 1-28, the PAS core consists of residues 29-69, the Helical connector consists of residues 70-87, and the β-scaffold consists of residues 88-125 (see also Figure 6). This table was prepared using information obtained from several alignments performed with ClustalW (Thompson et al. 1994) (http://www.ebi.ac.uk/clustalw/).
Group N-terminal
cap PAS core
Helical connector
β-scaffold complete sequence
50.00 % 70.73 % 55.56 % 73.68 % 64.80 % I 75.00 % 82.93 % 77.78 % 86.84 % 81.60 % 81.48 % 73.17 % 83.33 % 78.95 % 78.23 % II 88.89 % 85.37 % 100.00 % 86.84 % 88.71 % 28.57 % 48.78 % 22.22 % 34.21 % 36.00 % I & II 50.00 % 70.73 % 33.33% 52.63 % 55.20 % 10.71 % 41.46 % 22.22 % 13.16 % 23.20 % I-III 25.00 % 65.85 % 34.21 % 50.00 % 46.40 %

Chapter 1 Photocycle: basics
3 Photocycle: basics
The photoactivity of the Xanthopsins expresses itself via a photocycle. When a Xanthopsin in a dark adapted state absorbs a photon of the proper wavelength, structural changes occur in the protein that lead to a signaling state that can be read by the organism it resides in. Next the Xanthopsin returns to its dark adapted state, which brings the cycle full circle. This self regenerative cycle only requires for the holo-protein to be in a hydrated form, and does not require the presence of a membrane, additional proteins, or co-factors, for the photocycle to be completed successfully. Most Xanthopsin research is focused on this photocycle or a part of it. The best studied Xanthopsin by far is the Photoactive Yellow Protein from Halorhodospira halophila, which is also the focus of this thesis. Therefore the photocycle of this protein will be discussed here in detail.
3.1 How the photocycle is measured
The techniques that are discussed here have all been used on the Photoactive Yellow Protein from Halorhodospira halophila, but can usually also be used on other photoactive proteins. One of the most attractive features of a photoactive protein is that it can be activated by light, which can be administered to the sample in a very controlled way, and with femtosecond precision if necessary. The characteristics of the light source used to excite the sample differs from experiment to experiment and is dependent on the type of experiment performed and type of light source available to the researchers performing the experiment. When comparing different experiments it is therefore also important to check if the light sources used to excite the sample are equivalent.
Since the function of the chromophore in the Photoactive Yellow Protein is to catch photons from the visible region of the electromagnetic spectrum, UV/Vis absorption spectroscopy is one of the first techniques that comes to mind when studying this protein. Mostly the absorption features that are caused by the chromophore are the target for study. Any changes that are monitored in this way therefore are changes that occur in the chromophore itself and/or in the interaction of the protein with the chromophore. Kinetic studies are important and abundant, where the time scale of these studies ranges from femtoseconds to minutes (an hours to days time scale is also possible, but not common). What is often neglected in these kind of studies is that when absorption is observed it means that a population of the photoactive protein in the sample has absorbed a photon that may allow it to go into its photo activated state. Usually a separate high intensity light source or laser is used to activate the sample, before, during, and after which a low intensity probe light is used to monitor absorption changes. Usually the effect of the probe light can be neglected, but this is not always the case. It should therefore always be kept in mind that the light used to monitor changes in the protein, or characterize a specific state of the protein, may influence the data.
Where there is absorption of photons, there is also a non-zero probability for emission of photons. Therefore, fluorescence spectroscopy is also one of the techniques that can tell us more about the chromophore, which is a photon absorbing part of the holo-protein. Fluorescence is a short lived phenomenon and is associated with relaxation of an excited state (usually caused by absorption of a photon) back to a non-excited state (or ground state). The molecules that do fluoresce usually do not enter the photocycle, but emit most of the absorbed energy in the form of a photon. Non fluorescing molecules can use the absorbed energy to power the photocycle. Therefore when looking at the emission characteristics of the holo-protein only information on the initial photocycle events related to the excited state can be obtained. The processes monitored by fluorescence spectroscopy are therefore restricted to the time range of femtoseconds to nanoseconds.
Other techniques that can provide/have provided information on photocycle events of the Photoactive Yellow Protein are Raman Spectroscopy, Fourier Transform Infrared Spectroscopy (FTIR), Photoacoustic Spectroscopy (PAS), Nuclear Magnetic Resonance Spectroscopy (NMR), and X-Ray diffraction spectroscopy. These techniques can not only provide structural information on the chromophore, but also on other parts in the holo-protein, which are usually not observable via UV/Vis spectroscopy.
13

Chapter 1 Photocycle: basics
Irrespective of the technique used to measure photocycle events, they all use information obtained on the protein in the ground state as a reference. In Figure 7 several basic characteristics of the protein in the ground state are collected that are used in many experiments, either as reference or as a control for the quality of the used sample. The most notable characteristics are the absorption maximum at 446 nm (Meyer 1985) and the purity index, which is the ratio between the peak height at 278 and 446 nm. The latter is a measure for the purity of the protein, where a value lower than 0.50 is considered pure.
3.2 The basic photocycle The photocycle of the Photoactive Yellow Protein has
become more and more complex over the years. Nonetheless it can still be depicted as a simple scheme with only three species when put into terms of the essential chromophore events, as is shown in Figure 8. In the ground state or dark adapted state, pG, the chromophore is deprotonated and the isomerization state of the chromophore is trans, as explained in section 2.1. The second species, pR, is spectrally red-shifted with respect to the ground state and is formed on a nanosecond time scale. Here the chromophore is still deprotonated but its isomerization state has changed to cis. The third species, pB, is spectrally blue-shifted with respect to the ground state, and is formed on a microsecond time scale. This species is presumed to be the signaling state of the photoreceptor and can be considered as relatively stable (i.e. stable enough to allow for a signal to be processed by the organism). Here the chromophore has become protonated while its isomerization state remains cis. The holo-protein subsequently recovers to its ground state on a millisecond timescale.
Property Value
UV/Vis Absorption maxima 278; 446 nm
Emission maximum† 495 nm
Molar extinction coefficient 45,500 M−1·cm−1
Purity index‡, pure sample ≤ 0.5
† Excitation at 446 nm ‡ ratio of peak maxima: OD278 / OD446
Figure 7. Characteristic properties of the Photoactive Yellow Protein ground state In the graph the absorption spectrum (solid line) and the emission spectrum (excitation at 446 nm, dashed line) of the ground state form of the Photoactive Yellow Protein are shown. The absorption and emission spectrum were normalized to 1 at 446 and 495 nm respectively. Specific characteristics are listed in the table below the graph.
These three major steps, isomerization, protonation change, and recovery are also observed in the sensory rhodopsins, which have a similar cellular function as the Photoactive Yellow Protein, but are structurally very different (see also section 1.1). It is interesting to note that though the Xanthopsins and the sensory rhodopsins have evolved separately, the mechanism they use to generate a signal from an absorbed photon is essentially the same.
Figure 8. Basic photocycle of the Photoactive Yellow Protein Representation of the key intermediates and events in thephotocycle of the Photoactive Yellow Protein. The firstbasic step represents the initial photocycle events, in which the chromophore undergoes photoisomerization. At the endof this step the intermediate pR is formed. The second basicstep represents formation of the signaling state, in which thechromophore is protonated, and the protein structure changes. At the end of this step the intermediate pB isformed. The third basic step represents the recovery of theground state (pG), which completes the photocycle.
14

Chapter 1 Photocycle: basics
3.3 Photocycle nomenclature
Over the years several nomenclatures for the photocycle intermediates have been created and are now used. As the photocycle is becoming more and more complex also the nomenclature is becoming more and more complex. There is not one nomenclature that is really able to handle all the new intermediates that are being discovered. Also, not all intermediates are related to changes of the chromophore and can only confidently be observed by a specific technique while there is very little or no detectable associated change in the UV/vis absorption spectrum. All the different nomenclatures contain the three basic photocycle species and can therefore be compared using these three species as reference. Originally, the ground, red-shifted, and blue-shifted state were called P, I1, and I2 by Meyer et al. (Meyer et al. 1989). In 1995 the names pG, pB, and pR were introduced by Hoff et al. (Hoff et al. 1995). Yet another nomenclature (Imamoto et al. 1996) was introduced in 1996, in which these species are called PYP, PYPL, and PYPM, a nomenclature that is borrowed from the photocycle nomenclature of bacteriorhodopsin. In order to be able to make sense of all these different nomenclatures, the photocycles depicted in Figure 9, Figure 10 and Figure 12 have the name of the intermediate that is used in the text in bold and the equivalent nomenclature, that has also been used in literature, below it in brackets.
As if the use of three different nomenclatures is not enough, the nomenclature is made even more complicated by the use of additional subscripts that state a specific property of the species (e.g. the absorption maximum). Such a property can be dependent on the measurement conditions used, with as result that different subscripts are used for the same species. Additionally, more and more techniques are utilized to analyze the photocycle. As a result more and more photocycle species are discovered that were undetectable with previously used techniques. To provide these new intermediates a new name that fits logically within one of the existing nomenclatures is close to impossible. However, until a new nomenclature is created that is adopted by everyone in the field, the nomenclature confusion will remain.
3.4 Experimental context
The experimental context or conditions that are used in measurements can have pronounced effects on the data. It is therefore important to take the experimental context of an experiment in consideration when comparing different experiments. There are basically four different experimental parameters that are important: Temperature, Solvent, mesoscopic context (or phase), and illumination conditions.
The first one, temperature, is obviously especially important when comparing kinetic experiments. But temperature may also allow one to trap certain photocycle species (Hoff et al. 1992; Imamoto et al. 1996) and prevent other photocycle species from being formed. The second one, solvent, is very important, and is usually different between experiments. Though pH is probably the most important solvent feature that has an effect on e.g. the kinetics of the photocycle (see Chapter 3 section 3 and (Genick et al. 1997a)), other solvent features such as hydrophobicity of the solvent (Meyer et al. 1989), type and concentration of solutes present (Meyer et al. 1987; Meyer et al. 1989), and the nature of the solvent itself (e.g. water vs. deuterium oxide (see Chapter 3 section 3)) also can have an effect on the data. The third experimental parameter, mesoscopic context or phase, also has an important effect on the protein under study. E.g. when the Photoactive Yellow Protein is in the crystal phase no significantly large overall structural change is observed in the protein upon formation of the signaling state, whereas when the protein is in solution such a significant overall structural change is observed (Xie et al. 2001). Also more and more data is becoming available from computer simulations, where for practical reasons the effect of solvent is either not incorporated at all (simulation in vacuum) or is limited to a small amount of solvent molecules (usually water). When a solvent is used in the simulation it is usually in the absence of other molecules that are present in the solvent in real life experiments (e.g. buffer ions). With the steady increase in computer power the models that are used in simulations are becoming more and more complex though, and become better at representing the real world. The last of the four experimental parameters, illumination conditions, can also have pronounced effects on the data. Mostly the illumination conditions used to initiate the photocycle are important. The choice of wavelength can already have an effect on which photocycle species are formed (Hoff et al. 1992; Imamoto et al. 1996). Also the duration of the excitation pulse can have an effect. Longer illumination allows the possibility of photoactive events with photocycle species other than the ground state (Gensch et al. 1998). But also light intended to probe changes in absorption can influence the data (see section 3.1).
15

Chapter 1 Photocycle: basics
These experimental parameters have to be taken into account when comparing data, but are also extremely useful tools to get better insight into the protein under study. In other words, seemingly contradictory results may provide a greater understanding of the protein when the experimental context is taken into account.
3.5 Mutants and hybrids
Besides changing experimental parameters it is also possible to make changes to the holo-protein itself to obtain information on how the holo-protein works. There are two distinctive parts in a holo-protein, the protein part and the chromophore part. When a change is made in the protein part (the apo-protein) the resulting holo-protein is called a mutant. When a change is made in the chromophore part the resulting holo-protein is called a hybrid. Lots of valuable information can be obtained via mutants and hybrids. Nonetheless, a change is made to the wild type holo-protein that can have unpredicted side effects, that can be useful, but also misleading. Proper control experiments are therefore essential when dealing with mutants and hybrids. E.g. when studying protonation changes within the holo-protein, there is usually more than one possibility to accomplish the protonation change on a specific group. When one possibility is taken away via a mutation other possibilities may take over. This may imply that the mutated residue has nothing to do with the observed protonation change, when in actuality it may be the main cause in the wild type holo-protein.
Table 5. Mutants of the Photoactive Yellow Protein A list of all mutants of the Photoactive Yellow Protein together with references to literature. The absorption maximum (maxima) of each mutant is also presented. Background shading depict which PAS sub-domain (see section 2.3) of the Photoactive Yellow Protein contains the mutation. Light gray - N-terminal cap (residues 1-28). White - the PAS core (residues 29-69). Drak gray - the β-scaffold (residues 88-125). No mutations have been made to the Helical connector (residues 70-87).
mutation λmax (nm) references Δ25 444 (van der Horst et al. 2001; Hendriks et al. 2002b) Δ27 444 (van der Horst et al. 2001)
Tyr42Phe 391 / 458 (Mihara et al. 1997; Brudler et al. 2000; Demchuk et al. 2000; Devanathan et
al. 2001; Imamoto et al. 2001c) Tyr42Ala 375 / 438 (Imamoto et al. 2001c) Glu46Asp 444 (Devanathan et al. 1999a)
Glu46Gln 462
(Genick et al. 1997a; Imamoto et al. 1997; Mihara et al. 1997; Chosrowjan et al. 1998; Demchuk et al. 2000; Devanathan et al. 2000; Mataga et al. 2000; Brudler et al. 2001; Imamoto et al. 2001c; Imamoto et al. 2001d; Xie et al.
2001; Zhou et al. 2001; Borucki et al. 2002; Mataga et al. 2002)
Glu46Ala 365 / 465 (Devanathan et al. 1999a; Devanathan et al. 2001; Imamoto et al. 2001c;
Borucki et al. 2002) Gly47Ser 446 (van Aalten et al. 2002a) Thr50Ala 454 (Mataga et al. 2000; Imamoto et al. 2001c)
Thr50Val 457 (Mihara et al. 1997; Chosrowjan et al. 1998; Brudler et al. 2000; Mataga et al.
2000; Imamoto et al. 2001c; Imamoto et al. 2001d) Glu46Gln / Thr50Val 472 (Chosrowjan et al. 1998; Mataga et al. 2000; Imamoto et al. 2001c) Glu46Gln / Arg52Gln ? (Mataga et al. 2002)
Gly51Ser 446 (van Aalten et al. 2002a) Gly47Ser / Gly51Ser 446 (van Aalten et al. 2002a)
Arg52Ala 452 (Genick et al. 1997a; Demchuk et al. 2000)
Arg52Gln 447 (Mihara et al. 1997; Chosrowjan et al. 1998; Mataga et al. 2000; Imamoto et al. 2001c; Imamoto et al. 2001d; Mataga et al. 2002; Takeshita et al. 2002a)
Pro68Ala 446 (Mataga et al. 2002; Takeshita et al. 2002a) Cys69Ser - (Mihara et al. 1997)
Met100Ala 446 (Devanathan et al. 1998; Kumauchi et al. 2002) Met100Glu 446 (Kumauchi et al. 2002) Met100Leu 446 (Kumauchi et al. 2002; Sasaki et al. 2002) Met100Lys 446 (Kumauchi et al. 2002) His108Phe 446 (Hendriks et al. 1999b; Kandori et al. 2000) Trp119Gly 445 (Mataga et al. 2002; Takeshita et al. 2002a)
16

Chapter 1 Photocycle: basics
In the study of the Photoactive Yellow Protein from Halorhodospira halophila many mutants and hybrids have been studied with variable success. A list of all mutants that have been studied is presented in Table 5. A list of all hybrids that have been studied is presented in Table 6. These mutants and hybrids provide information on different aspects of the Photoactive Yellow Protein and are therefore discussed in more detail in the sections that reflect those specific aspects of the Photoactive Yellow Protein.
Table 6. Hybrids of the Photoactive Yellow Protein A list of all hybrids of the Photoactive Yellow Protein together with references to literature. When a hybrid protein has been proven to contain a photocycle similar to that of the wild type protein, it has been awarded the property photoactive.
no. Name and properties Structure of free acid
O
HO
OH
4-hydroxy cinnamic acid λmax 446 nm photoactive I
(Baca et al. 1994; Hoff et al. 1994b; Imamoto et al. 1995; Kim et al. 1995; Hoff et al. 1996; Kort et al. 1996a; He et al. 2000; Sergi et al. 2001; Yoda et al. 2001)
O
HO
OH
OH
3,4-dihydroxy cinnamic acid λmax 457 nm photoactive
II
Chapter 4 section 1; (Kroon et al. 1996; Devanathan et al. 1997; van Aalten et al. 2002b)
O
HO
OH
OCH3
3-methoxy-4-hydroxy cinnamic acid λmax 460 nm photoactive
III
(Kroon et al. 1996)
O
HO
OH
OCH3
OCH3
3,5-dimethoxy-4-hydroxy cinnamic acid IV λmax 488 nm
Chapter 4 section 1; (Kroon et al. 1996)
O
HO
NH2
4-amino cinnamic acid V λmax 405 nm (353 nm (Kroon et al. 1996))
Chapter 4 section 1; (Kroon et al. 1996)
O
HO
N(CH3)2
4-dimethyl amino cinnamic acid VI λmax 436 nm
(Kroon et al. 1996)
O
HO
OCH3
4-methoxy cinnamic acid VII λmax 355 nm
(Kroon et al. 1996)
O
HO
F
4-fluoro cinnamic acid VIII λmax 317 nm
Chapter 4 section 1
O
HO
Cinnamic acid IX λmax 317 nm
Chapter 4 section 1
17

Chapter 1 Photocycle: basics Table 6 continued
no. Name and properties Structure of free acid
O
HO
OH
O
O
7-hydroxy-coumarin-3-carboxilic acid X λmax 443 nm
(Cordfunke et al. 1998) O
HO
OH
4-hydroxyphenylpropiolic acid XI λmax 404 nm
Chapter 4 section 1; (Cordfunke et al. 1998)
O
HO
OH
Br
4-hydroxy-α-bromocinnamic acid λmax 447 nm photoactive
XII
Chapter 4 section 1; (van der Meer 2000)
O
HO
OH
D
D
4-hydroxy-α,β-dideuterocinnamic acid λmax 446 nm photoactive
XIII
(van der Meer 2000)
O
HO
N
NH
Imidazole-4-acrylic acid XIV λmax 343 nm
Chapter 4 section 1
O
HO
OH
D
D
3,5-dideutero-4-hydroxy cinnamic acid λmax ?
photoactive XV
(Imamoto et al. 2001a)
O
HO
OH
D
4-hydroxy-α-deuterocinnamic acid λmax ?
photoactive XVI
(Imamoto et al. 2001a)
13C
O
HO
OH
13C9-4-hydroxycinnamic acid λmax ? XVII photoactive
(Unno et al. 2002)
18

Chapter 1 Photocycle: initial events
4 Photocycle: initial events
The initial photocycle events discussed in this section describe the first basic step in the photocycle (see Figure 9), i.e. photoisomerization of the chromophore. This first basic photocycle step takes place on a sub-picosecond to nanosecond time scale. Several techniques have been utilized to study this part of the photocycle. The very first event of the photocycle is absorption of a photon and the subsequent excitation of the holo-protein. From this point on there are two basic routes the excited holo-protein can take. It can either return to its ground state, or it can enter the photocycle. A return to the ground state is possibly accompanied by the emission of a photon. Therefore fluorescence spectroscopy is ideally suited to obtain more information on the initial events of the photocycle, but is less well suited to obtain information on the remainder of the photocycle. However, after excitation of the holo-protein, the electronic environment of the absorbing part of the holo-protein (the chromophore) is changed. Furthermore, during the photocycle this electronic environment keeps changing. Absorption spectroscopy is ideally suited to monitor these changes and therefore complements the fluorescence spectroscopic data. Due to the high time-resolution needed to look at the initial photocycle events, measurements are complicated and one has to be very careful analyzing the results. Also, many aspects that are taken for granted or have no influence when measuring at lower time resolutions, start to become aspects that have to be taken into consideration. The most important limiting factor at high time resolutions is the speed of light. The distance traveled by a photon in 1 fs is only 300 nm. This is shorter than the wavelength of light in the visible region of the electromagnetic spectrum. This introduces challenges not only on the instrumentation side of the experiment, but also on the side of data interpretation, since classical mechanics is not always able to describe the observed events anymore.
Figure 9. Primary photocycle events. The primary photocycle events of the Photoactive Yellow Protein at room temperature are depicted. For this, the basic photocycle was extended to include the photocycle intermediates of the first basic photocycle step. Alternative names of intermediates that are not used in the text, but can be found in literature, are depicted smaller and below the names used in the text. Only one excited state is shown for pG, however it has been shown that there are at least two different excited states. As probably only one of these results in induction of the photocycle, only one is shown. The existence of the PYPH intermediate at room temperature is under debate, therefore this intermediate is not depicted.
19

Chapter 1 Photocycle: initial events
For many techniques the time resolution required to look at the initial photocycle events is either not practical, not obtainable yet, or not possible. An alternative way to obtain information on the initial events in the photocycle is via cryotrapping of photocycle intermediates. These cryotrapped species can be characterized with many different techniques, where the time-resolution obtainable with these techniques is no longer an issue. However, working at the extremely low temperatures necessary to trap early photocycle intermediates introduces new challenges and limitations. Cryotrapping in combination with X-ray crystallography has made it possible to obtain the crystal structure of an early photocycle intermediate. Recent developments should make it possible however, to obtain similar information in a time resolved manner also using X-ray crystallography.
Besides these almost tangible characteristics (absorption/emission of photons, movement of atoms), the less tangible characteristic of change in energy (non-radiative deactivation, enthalpy change) can also be measured in a time resolved manner using photoacoustic and photothermal techniques. These techniques provide information not, or not easily, attainable with other techniques. Therefore, only by using the information obtained by many different techniques is it possible to create an accurate model of what occurs during the initial stages of the photocycle.
Besides experiments on actual protein samples, it is also possible to perform in silico experiments, where real world events are modeled/predicted via quantum mechanical or other mathematical methods. The current state of computer technology only allows ab initio simulations of a system up to a few nanoseconds, which is also the time it takes for the initial photocycle events to take place. However, it is usually not possible to model the full complexity of the real world situation under study. As a consequence, simplifications are introduced that in turn can introduce a certain degree of inaccuracy. With computers becoming faster all the time, and the mathematical algorithms used becoming more accurate and/or faster as well, the use of these in silico experiments is received with less skepticism and is more and more seen as a real experiment. The barrier to use in silico experiments, as a valuable tool to gain more insight into the system under study, is becoming lower as well. In some cases it is even invaluable to be able to make sense of extremely complex data (e.g. X-ray crystallography, and NMR spectroscopy).
4.1 Fluorescence spectroscopy
The Photoactive Yellow Protein has an emission maximum of 495 nm (Meyer et al. 1991). This emission maximum is independent of excitation wavelength, while the excitation spectrum fits the absorption spectrum and is independent of detection wavelength (Changenet et al. 1998). The fluorescence quantum yield of the Photoactive Yellow Protein has been reported as 1.4·10−3 (Meyer et al. 1991), 3.5·10−3 (Hoff et al. 1992), and 2·10−3 (Kroon et al. 1996) respectively. This low fluorescence quantum yield is not surprising for a protein that acts as a light sensor, however it is an additional complication for time-resolved measurement of the fluorescence signal.
The fluorescence decay kinetics of the Photoactive Yellow Protein have been determined via time-correlated single photon counting (Meyer et al. 1991; Changenet et al. 1998), and fluorescence upconversion (Chosrowjan et al. 1997; Changenet et al. 1998). The former is limited to a time-resolution around 16 ps, while with the latter a time-resolution in the order of 100 fs can be achieved. In practice these two techniques are complementary, since to get information up to the nanoseconds time range, the use of time-correlated single photon counting is more convenient than fluorescence upconversion. Using these techniques about 5 kinetic components have been observed for the fluorescence decay kinetics of the Photoactive Yellow Protein. Two fast components with τ values around 0.8 and 4 ps (Chosrowjan et al. 1997; Changenet et al. 1998), contribute around 80 % to the decay. A slower component with a τ value around 80 ps contributes around 20% to the decay (Meyer et al. 1991; Changenet et al. 1998), while the remaining two slow components, with τ values around 0.4 and 2.5 ns, jointly contribute around 7% (Changenet et al. 1998). The values presented here are averages from different sources, and serve only as an indication of the fluorescence decay kinetics of the Photoactive Yellow Protein. In a temperature dependent study using the fluorescence upconversion technique (Mataga et al. 2000), the activation energy of decay components in the 100 fs to 10 ps time range was determined. Within the temperature range that was measured (274 to 308 K) normal Arrhenius behavior was observed. Here the fastest component (τ1 ≈ 430 fs) was found to have an activation energy of 0. The other fast component has an activation energy of 1.92 kcal·mol−1 (τ2 ~ 1 to 3 ps). For the third component observable in the 100 fs to 10 ps time range an activation energy of 6.8 kcal·mol−1 (τ3 ~ 10 to
20
Chapter 1 Photocycle: initial events
30 ps) was observed. Though the relaxation time for this third component is most likely erroneous due to the limited measured time range, it is clear that the slower component(s) have an activation energy.
Recently, time-resolved fluorescence spectroscopy based on the optical Kerr shutter technique was utilized to monitor the primary events in the photocycle of the Photoactive Yellow Protein (Hanada et al. 2001). Here a time-resolution of 300 fs was achieved. The advantage of this technique is that whole spectra are recorded. Therefore the fluorescence spectra do not have to be reconstructed from individual single wavelength time-traces. The observed kinetics are similar to those observed with the fluorescence upconversion technique. The most interesting result from these experiments is that the spectral narrowing in the picoseconds time range is clearly shown. This effect was already noted in the fluorescence upconversion experiments, where faster decay kinetics were observed on both sides of the fluorescence peak (Chosrowjan et al. 1997). The spectral narrowing cannot (solely) be explained by a dynamic Stokes shift (Chosrowjan et al. 1997; Changenet et al. 1998; Hanada et al. 2001). It is therefore still unclear what exactly causes this spectral narrowing.
The question now is, what do these results tell us about the primary events of the photocycle of the Photoactive Yellow Protein. Upon photo-activation of the Photoactive Yellow Protein, first the Franck-Condon state is formed. Vibrational relaxation of the excited protein can either bring it to a fluorescent state, into the photocycle, or back to the ground state. The experiments described in this section only provide information of the instances when a fluorescent state is formed. The fluorescent state may be an intermediate on the route into the photocycle, and/or back to the ground state. Thus the observed fluorescence decay can be due to loss of the fluorescent state via vibrational relaxation, emission of photons, and internal reactions (e.g. isomerization). Thus far. only the 2 fast components have been confidently linked to pathways that lead the protein either into the photocycle or back to the ground state. One line of evidence comes from the study of a hybrid of the Photoactive Yellow Protein where the wild type chromophore, thiol ester linked 4-hydroxycinnamic acid, is replaced by thiol ester linked 7-hydroxy-coumarin-3-carboxilic acid (see Table 6), a chromophore which is unable to isomerize. In this hybrid the two fast components are no longer present, while the three slower components are (Changenet et al. 1998). More evidence comes from comparison with studies using different techniques, which will be discussed later. It has been suggested that these fast fluorescent decay components are linked to the formation of a chromophore twisted state (Chosrowjan et al. 1997; Changenet et al. 1998), which is an intermediate on the route to full trans to cis isomerization of the chromophore. It is still possible though that the protein relaxes to the ground state from this twisted state.
The role of the protein environment or protein nanospace structure (Chosrowjan et al. 1998) on these primary events has been studied using mutant, hybrid, and denatured wild type holo-protein. For the denatured wild type holo-protein the influence of the protein nanospace structure is eliminated, and the two fast fluorescence decay components are not observed. Only a single decay component of 11 ps was observed in the measured 100 fs to 10 ps time range (Chosrowjan et al. 1998; Mataga et al. 2000). Several mutants, with mutations of residues that interact with or are near the chromophore, were also tested (Glu46Gln, Thr50Ala, Thr50Val, Glu46Gln/Thr50Val, and Arg52Gln). In none of these mutants the fastest component is present (Chosrowjan et al. 1998; Mataga et al. 2000). For the hybrid holo-protein with thiol ester linked 3-methoxy-4-hydroxycinnamic acid (see Table 6), which has a more bulky chromophore with respect to wild type, the presence of the fast components is emission wavelength dependent, i.e. they are absent for wavelengths longer than 530 nm (Changenet et al. 1998). The hybrid holo-protein with thiol ester linked 3,4-dihydroxycinnamic acid (see Table 6) shows similar behavior (van der Meer 2000). It thus seems that the protein nanospace is extremely important for the fastest fluorescent decay component, where any small change can have a destructive influence. The other fast component also depends on the protein nanospace, but is able to survive minor changes to the protein nanospace. The slow components hardly seem effected by the changes to the protein nanospace. These could then reflect relaxation routes back to the ground state, or alternative routes for chromophore isomerization that are more or less independent on the protein nanospace.
The nature of the twisting motion required for the postulated formation of the twisted state has been studied using hybrid holo-proteins where the hydrogen atoms of the chromophore C7=C8 double bond are exchanged for heavier and more bulky atoms. Both in the thiol ester linked 4-hydroxy-α,β-dideuterocinnamic acid and 4-hydroxy-α-bromocinnamic acid (see Table 6) holo-protein, the fluorescence decay kinetics are similar to those of the wild type holo-protein (van der Meer 2000). This indicates that upon formation of the postulated twisted state, there is little or no rotation around the C7=C8 double bond, since such a rotation is expected to be slowed down in the presence of the deuterium and bromine atoms.
21

Chapter 1 Photocycle: initial events
4.2 Absorption spectroscopy
Ultra-fast absorption spectroscopy has been used extensively to monitor the primary steps in the photocycle of the Photoactive Yellow Protein. The first measurements done only monitored the first 14 ps of the photocycle. Here three relaxation times could be extracted from the data, i.e. the τ values 0.70 ps, 3.6 ps, and infinite (on the time-scale of the experiment) (Baltuška et al. 1997). Stimulated emission complicates the analysis of the observed absorption changes. The most concrete information from these measurements are the relaxation times, which are more or less identical to relaxation times observed with fluorescence upconversion, as discussed in section 4.1. The first 14 ps of the photocycle are not sufficient to monitor formation of the final product in the first basic step in the photocycle (pR). An experiment with picosecond time-resolution covering the first 4 ns of the photocycle, was able to provide this information. Two intermediates, I0, and I0
‡, were identified in this experiment. I0 is formed with a relaxation time of ≤ 3 ps, and decays with a relaxation time of ~220 ps to form I0
‡, which in turn decays with a relaxation time of 3.0 ns to form pR (Ujj et al. 1998). The absorption band of I0 has its maximum around 510 nm. The absorption band of I0
‡ is similar to that of I0, except that it is broader and has about 20 % less absorbtivity. The characteristics of the I0
‡ intermediate make it difficult to detect confidently. In a subsequent study the I0‡ intermediate was not
observed (Imamoto et al. 2001d). Yet another study did detect the I0‡ intermediate, only here the absorbtivity
of I0‡ was found to be greater as that of I0 (Gensch et al. 2002).
It is now clear that in order to study the events in the first step of the photocycle of the Photoactive Yellow Protein, it is necessary to study the complete femtoseconds to nanoseconds time range and not just a part of it. The complexity of the events in the first step have led to the proposition of several different models. In a study complementing the picosecond to nanosecond data described above (Ujj et al. 1998), the formation of the I0 intermediate was studied further (Devanathan et al. 1999b). Essentially, this study repeats the study on the first few picoseconds of the photocycle that was discussed earlier (Baltuška et al. 1997). The major difference is the analysis and interpretation of the data. In their model two different excited states exist from which either the ground state (τ ~ 3.4 ps), or the intermediate I0 (τ ~ 1.9 ps) is formed (Devanathan et al. 1999b). However, more detailed analysis is necessary to confirm this hypothesis.
A different model of the first step of the photocycle was obtained in a separate study spanning the femtosecond to nanosecond time domain (Imamoto et al. 2001b). In this study a multichannel spectrometer was used, allowing for a more precise spectral analysis not possible in previous studies. Also in this model two different excited states are postulated. One decays with a relaxation time of 7.1 ps back to the ground state, the other decays with a relaxation time of 950 fs to the photocycle intermediate I0. It is unclear if these two excited states are in thermal equilibrium with each other. I0 subsequently decays with a relaxation time of 1.3 ns to form pR. Via a discrepancy between the amount of bleached ground state and formation of the amount of pR, the authors further claim the existence of a branched pathway between the excited state and pR, also observed at low temperature (Imamoto et al. 1996). In the other branch the intermediate PYPH (or PYPHL) is formed instead of I0, and subsequently decays to pR with a relaxation time of >5 ns.
In a recent study where polarized transient absorption spectroscopy was used to investigate the primary photocycle events, two excited states were identified as well as the intermediates I0 and I0
‡ (Gensch et al. 2002). The used observation time window was not large enough to confidently monitor pR formation. Anisotropy changes relative to the ground state were also monitored. An anisotropy change indicates a change in direction of the transition dipole moment, which can be interpreted as a sign that isomerization has occurred or is under way. Of the two observed excited states, only the second shows anisotropy changes with respect to the ground state. Anisotropy changes were also observed for the I0 and I0
‡ intermediates. In the model used to fit the data I0 is formed via the first excited state, while the second excited state is a photocycle dead end. From this same model it is evident that the formation of I0
‡ has a low quantum efficiency. As a result the spectrum of I0
‡ has a higher absorbtivity than I0 in this model, not a lower as described earlier (Ujj et al. 1998). Additionally, the wavelength dependence of photo-excitation was determined by comparing excitation at 400 and 485 nm. Other than some kinetic differences, no dramatic differences, such as a different pathway, was observed. However, due to limitations in the monitored wavelength range, any blue-shifted intermediates, would not be observed. It is thus still possible that differences are present with respect to possible blue-shifted intermediates.
To help understand what is going on in the first step of the photocycle, additional measurements on the free chromophore, and on mutants were performed. To obtain a good reference for the effect the protein nanospace has on the isomerization event, information on the isomerization event in the absence of the
22

Chapter 1 Photocycle: initial events
protein nanospace is necessary. This reference is provided by a study on fully deprotonated 4-hydroxycinnamic acid (Changenet-Barret et al. 2001). The photo-isomerization of fully deprotonated 4-hydroxycinnamic acid is a kinetically simple event, where the trans excited state form decays to the cis form without a detectable intermediate with a relaxation time of 10 ps. This is very similar to the relaxation time of 11 ps (Chosrowjan et al. 1998; Mataga et al. 2000) reported for chromophore trans to cis isomerization in the denatured protein, as described in section 4.1. This similarity validates the choice to take fully deprotonated 4-hydroxycinnamic acid as a model compound for the chromophore of the Photoactive Yellow Protein in the absence of the protein nanospace.
Several mutants of the Photoactive Yellow Protein have been studied with respect to the initial photocycle events, Glu46Gln (Devanathan et al. 2000; Zhou et al. 2001), Glu46Ala and Tyr42Phe (Devanathan et al. 2001). All these mutants have been analyzed with the model including the I0
‡ intermediate. For all these mutants the formation of pR is considerably faster (5 times for Glu46Gln, 100 times for Glu46Ala and Tyr42Phe). Formation of the I0 intermediate is similar to the wild type situation in the Glu46Gln mutant, but about a factor of 2 slower in the Glu46Ala and Tyr42Phe mutants. The I0
‡ intermediate was only barely detectable (i.e. distinguishable from the I0 intermediate) in the Glu46Gln mutant, and not detectable at all in the Glu46Ala and Tyr42Phe mutants. A possible reason for this difficulty is that rate of formation of the I0 and I0
‡ intermediates is similar in the mutants, while they are much further apart in the wild type situation. Another reason might be that the I0
‡ intermediate is not formed in the mutants. Nonetheless, it is clear that disruption of the hydrogen-bonding network either by weakening one of the hydrogen bonds (Glu46Gln mutant), or removing one of the hydrogen bonds (Glu46Ala and Tyr42Phe mutants) has a pronounced effect on the formation of pR. This is possibly caused by an increase in translational and vibrational freedom within the active site allowing the initial photocycle events to be faster (Devanathan et al. 2000).
4.3 Photoacoustic and photothermal methods
Non-radiative processes are not easily followed via absorption or emission techniques. Though they may coincide with events observed via absorption and emission techniques, this is not necessarily the case. These non-radiative processes can be followed in a time-resolved manner by photoacoustic and photothermal methods (Braslavsky and Heibel 1992; Gensch et al. 1999; Schulenberg and Braslavski 2001), that record among other phenomena the amount of heat released, i.e. changes in enthalpy. The time resolution in these techniques spans from picoseconds to seconds, depending on the particular method selected. These methods can be very sensitive since the energy released in non-radiative deactivation processes can easily amount to 50 to 95 % of the absorbed energy. Although this principle has been known for a long time only a few experimental set-ups have been established in the past thirty years. Two of them have been used to characterize the enthalpy changes during the PYP photocycle, in the pG to pR transition, i.e. photoacoustic spectroscopy (PAS, also named light-induced optoacoustic spectroscopy (LIOAS)) and thermal grating (TG). Both methods suffer from the fact that processes other than heat release contribute to the signal generated, such as structural volume changes (PAS, TG) and absorption changes (TG). One can, however, separate the different contributions to the signal and obtain additional information about the structural volume changes. They reflect alterations of bond length, solvation, protonation state, and interactions of the chromophore with surrounding amino acid side chains. Under certain circumstances the structural volume change can be related to the difference in entropy between two photocycle intermediates (Borsarelli and Braslavsky 1998; Losi et al. 2001). The PAS and TG studies performed on the Photoactive Yellow Protein used nanosecond time-resolution. Therefore, only information about the pR intermediate was obtained, with regard to the first basic step of the photocycle. Information on intermediates between the ground state and pR will require the use of picosecond time-resolution.
In the first photoacoustic investigation the energy content of the pR intermediate was determined as 120 kJ·mol−1. The formation of pR is accompanied by a large negative volume change (– 23 Å3) (van Brederode et al. 1995). For the estimation of the two values it was assumed that the photocycle quantum yield, enthalpy and structural volume changes are temperature independent. This is the standard procedure in PAS studies (Braslavsky and Heibel 1992) and was found valid for a vast amount of molecules. In a second study, PAS was applied in combination with TG (Takeshita et al. 2000b). With the TG technique it is possible to separate the heat dissipation in the first step of a reaction (pG to pR in this study) from the other contributions to the TG signal, due to the orders of magnitude faster heat diffusion compared to the sample molecule diffusion (Hara et al. 1996). In this way the structural volume change could be determined without the necessity to assume its temperature independence. A value of – 12 Å3 was found at 293 K, which is also a contraction but
23

Chapter 1 Photocycle: initial events
only half the value calculated from the results obtained with PAS (van Brederode et al. 1995). An energy content of 160 kJ·mol−1 was obtained for pR at this temperature. Furthermore, the structural volume change of pR formation was found to be temperature dependent. With decreasing temperature the magnitude of the contraction increases. At 273 K it amounts to –25 Å3, a value very similar to the one measured with PAS only (van Brederode et al. 1995). The TG signal was not large enough at temperatures lower than 293 K to decide whether or not the energy content of pR is temperature dependent as well. The unusual and strong temperature dependence of the structural volume change is attributed to changes in the void volume of the protein or a change in interactions of certain residues with the chromophore and/or the solvent in the pG to pR transition (Hara et al. 1996).
TG and PAS measurements have also been performed on the free chromophore, 4-hydroxycinnamic acid (Takeshita et al. 2000a). It was revealed that the cis configuration has about 50 kJ·mol−1 more energy content than the trans configuration. Also a volume change of −1.2 Å3 was observed upon trans to cis isomerization. This is much smaller than the volume change observed in the Photoactive Yellow Protein. However, a direct comparison between the free chromophore and the protein is difficult, since the free chromophore was protonated, whereas it is deprotonated in the protein. Also, interactions of the protein with the chromophore, which most probably change the energetics and structural features of the chromophore, are absent in the free chromophore.
So far, only results on the pG to pR transition as studied with photothermal methods have been published. New, results about the time scale of pR formation have been obtained recently. While pR formation is completed within 10 ns according to time-resolved absorption spectroscopy (Ujj et al. 1998), its rate of formation extends to several μs as measured with opto-acoustic methods (see section 5.3, Chapter 3 section 3, and (Takeshita et al. 2002a; Takeshita et al. 2002b)).
4.4 Low temperature
At low temperatures photocycle intermediates can be trapped. Assigning such trapped intermediates to intermediates observed at room temperature can be tricky. In several early studies assumptions were made about certain trapped intermediates that in later studies were found to be erroneous. Results from those early studies may therefore need to be reinterpreted. Most experiments were performed in the presence of 67% (v/v) glycerol, in order to obtain clear, crack free, glasses at the low temperatures. However, it is also possible to perform low temperature experiments on hydrated films of the Photoactive Yellow Protein. The presence of glycerol does have an influence on the characteristics of the Photoactive Yellow Protein (Meyer et al. 1989; Hoff et al. 1992), this should be kept in mind when comparing results. At low temperatures the absorption spectrum of the Photoactive Yellow Protein narrows and a shoulder, on the short wavelength side of the absorption band, becomes clearly visible.
In Figure 10 the low temperature photocycle of the Photoactive Yellow Protein is represented. Here we see that the first basic step of the photocycle proceeds via a branched pathway. A bias for one of the branches can be obtained via adjustment of the excitation wavelength. The branch with the I0 intermediate is preferred when shorter wavelengths are used for excitation (Hoff et al. 1992; Masciangioli et al. 2000). It is however unclear if this is caused by the characteristics of the Photoactive Yellow Protein or by the fact that the I0 intermediate can be photo converted back to pG, which occurs at higher wavelengths. Similarly the PYPH intermediate can be photo converted back to pG, which occurs at lower wavelengths (Imamoto et al. 1996). Here we are confronted with one of the pitfalls of cryotrapping photocycle intermediates. The photoactivity of the protein is not limited to its ground state. Photocycle intermediates are also photoactive. To accumulate a cryotrapped intermediate the sample is usually illuminated for an extended period of time. As a result, the intermediate being cryotrapped is also illuminated and can thus be photoactively converted as well. In this case the intermediate is photoactively returned to the ground state. However, it is also possible that other intermediates, that normally are not part of the photocycle, are formed. Such an intermediate may be the fluorescent species F430, which possibly is formed from the PYPH intermediate (Hoff et al. 1992).
24

Chapter 1 Photocycle: initial events
Figure 10. Low temperature photocycle The photocycle of the Photoactive Yellow Protein at low temperature. Alternative names of intermediates that are not used in the text, but can be found in literature, are depicted smaller and below the names used in the text. Temperatures at which reactions can occur are depicted next to the relevant arrow.
From the two intermediates that are cryotrapped below 93 K, PYPH is slightly blue-shifted with respect to pG but still overlaps the pG spectrum considerably. The I0 intermediate is considerably red-shifted with respect to pG. It is therefore more easy to obtain a sample containing just pG and PYPH than a sample containing just pG and I0, since I0 can be photo converted back to pG selectively without exciting pG. With PYPH this is not possible, thus any cryotrapped pG/I0 sample will also contain a certain amount of PYPH. If one has cryotrapped I0 and/or PYPH and slowly heats up the sample to above 93/123 K, the intermediates PYPBL and PYPHL are trapped respectively. The PYPBL intermediate, formed from I0, is blue-shifted with respect to pG. The PYPHL intermediate, formed from PYPH, overlaps with pG. It is however very difficult to obtain samples containing pG and just one of these first thermal photocycle products (Imamoto et al. 1996; Imamoto et al. 2001a). When the sample temperature is subsequently brought above 183/193 K the two branches join and the intermediate pR is formed (Imamoto et al. 1996). Though it does not seem possible to trap pB in the presence of 67% (v/v) glycerol, it is possible to trap pB in a hydrated film of the Photoactive Yellow Protein at 233 K (Imamoto et al. 1997). Cryo-trapped pB is discussed in section 5.5.
Low-Temperature FTIR measurements on the intermediates in the first basic step of the photocycle, show only minor differences between these intermediates (Imamoto et al. 2001a). These differences were attributed to the ethylene bond of the chromophore, by determining the deuterium isotope effect of two Photoactive Yellow Protein hybrids that contain differently deuterium labeled chromophores, 3,5-dideutero-4-hydroxycinnamic acid, and 4-hydroxy-α-deuterocinnamic acid (see Table 6). Here only the latter hybrid showed a deuterium isotope effect in the characteristic bands in the 1020 - 960 cm−1 range, which distinguish the different intermediates in the first basic step of the photocycle. Furthermore, all these intermediates were shown to have the chromophore in the cis configuration.
25
Chapter 1 Photocycle: initial events
Two more hybrids of the Photoactive Yellow Protein have been studied. In these hybrids the isomerizable bond of the chromophore is blocked by a ring structure, 7-hydroxy-coumarin-3-carboxilic acid, or by the exchange of the double bond by a triple bond, 4-hydroxyphenylpropiolic acid (see Table 6) (Cordfunke et al. 1998). Unfortunately, we have since then discovered that the free acid of the latter chromophore was altered during the reconstitution procedure, which resulted in a hybrid holo-protein with an as of yet unknown chromophore (see Chapter 4 section 1). Analysis of the 7-hydroxy-coumarin-3-carboxilic acid hybrid of the Photoactive Yellow Protein revealed that illumination of this hybrid at 77 K with 460 nm light results only in depletion of the ground state absorption band. At 77 K the intermediates PYPH and I0 are cryotrapped with wild type protein, where the illumination conditions suggest a bias towards PYPH. It is clear that an I0 like intermediate is not formed in the hybrid. However, a PYPH like intermediate is possibly formed. At room temperature no photocycle has been observed for this hybrid, not with ms time-resolution (Cordfunke et al. 1998), nor with nanosecond time-resolution (Hendriks et al., unpublished results). Further analysis is necessary to determine the exact nature of the cryotrapped intermediate of this hybrid to see if it actually resembles one of the wild type protein early intermediates, or if it is unique to this hybrid.
For several mutants the absorption spectra of cryo-trapped PYPH, I0 an pR intermediates have been reported, i.e. Glu46Gln, Thr50Val, and Arg52Gln (Imamoto et al. 2001d). The absorption spectra of the intermediates for the Arg52Gln mutant are identical to those in wild type protein. The absorption spectra of the intermediates for the other two mutants were similarly red-shifted with respect to the wild type protein as is the case for these mutants in the ground state form. Though these results by themselves do not yet allow any definitive conclusions to be drawn, they do support the idea that during the first step of the photocycle any structural changes, linked to or around the phenolate oxygen of the chromophore, are minor ones.
4.5 Structure
The Photoactive Yellow Protein is the first protein for which the structure of photocycle intermediates has been determined with X-ray crystallography. Two intermediates from the first step in the photocycle have been determined, PYPBL and pR. For both intermediates the structural changes are limited to the immediate surroundings of the chromophore. The structure of the PYPBL intermediate was obtained via cryotrapping and resolved with a resolution of 0.85 Å. Based on the used temperature and illumination conditions, together with determination of the absorption spectrum of the cryotrapped sample, it was concluded that PYPBL was the cryotrapped intermediate (Genick et al. 1998). However, it can not be excluded that PYPHL is also formed and thus a mixture of intermediates was present. From this structure it is evident that the chromophore is in a cis configuration, be it a distorted one that has barely crossed the trans to cis transition point. The most important conclusion from this structure is that the chromophore is isomerized in such a way as to cause as little as possible movement of the chromophore within the chromophore pocket. As a result, the aromatic ring is almost exactly at the same position relative to the situation in pG (see Figure 11 e). This is achieved by rotating the carbonyl function 166.5°, with respect to the aromatic ring, breaking the hydrogen bond between the carbonyl function and the backbone amide group of Cys69 (see Figure 11 a, b, d).
The structure of the pR intermediate was obtained via time-resolved X-ray crystallography, with 1.9 Å resolution (Perman et al. 1998). The structure was determined from the 1 ns time-slice of a dataset encompassing time-slices up to 1 ms. Though initially the obtained structure was assigned to pR, this was revised in a subsequent paper describing the full obtained dataset of the time-resolved X-ray diffraction experiment (Ren et al. 2001). The recorded 1 ns time-slice overlapped with the excitation laser pulse, which would/could result in the presence of multiple intermediates that are in photo-equilibrium. Besides pG and pR, intermediates that occur between these two in the photocycle could also be present. The structure deposited at the Protein Data Bank (Berman et al. 2000) (http://www.rcsb.org/pdb) with PDB ID: 2PYR (Perman et al. 1998) has since been refined, but has not been updated or replaced yet. In the refined structure the hydrogen bonding network stays intact. However, the position of the chromophore carbonyl function remains very similar. From the deposited pR structure one can see that the chromophore is no longer in a highly distorted cis configuration, but existing with a chromophore that has completed the isomerization of the C7=C8 double bond. In this structure the carbonyl function has rotated an additional 108.5° with respect to the cryo-trapped intermediate PYPBL (see Figure 11 b-d). This would allow a hydrogen bond to be formed between the carbonyl and the backbone amide of Tyr98.
26

Chapter 1 Photocycle: initial events
What is clear from these results is that in the first basic step of the photocycle the chromophore is isomerized via a carbonyl flip which allows as little movement of the position of the chromophore as possible. This was already suggested from results obtained via FTIR spectroscopy on a mixture of cryo-trapped early photocycle intermediates (Xie et al. 1996), which was, at that time, erroneously assigned to the pR intermediate. Here the hydrogen bond between the chromophore and Glu46 stays intact upon isomerization. Later this result was also obtained for the actual cryo-trapped pR intermediate (Imamoto et al. 2001a) and the room temperature pR intermediate (Brudler et al. 2001; Xie et al. 2001). The carbonyl flip can be interpreted as a double isomerization around the C7=C8 double bond and C9-Sγ single bond, i.e. C7=C8-trans C9-Sγ-cis to C7=C8-cis C9-Sγ-trans (Xie et al. 1996).
Figure 11. Carbonyl rotation in first step of the photocycle Several representations of pG, PYPBL, and pR are shown that illustrate the manner in which the chromophore is isomerized during the first step of the photocycle of the Photoactive Yellow Protein. The chromophore, Cys69 and the backbone of Tyr98 are shown as Ball and Stick for the different structures. Hydrogen bonds are shown as dashed Sticks. Panel a: view of pG from behind the chromophore. Panel b: view of PYPBL from behind the chromophore. Panel c: view of pR from behind the chromophore. Panel d: view of the atoms O1 and C9 including bond (the carbonyl function) from behind the chromophore. The rotation of the carbonyl function, relative to the plane of the aromatic ring, was determined by comparing the angles between a plane through the aromatic ring atoms C1, C2 and C3, and a plane though the atoms O1, C9 and C1, which contains the carbonyl function (note: atoms C9 and C1 are not bonded to each other. Also C1, C2, C3 and C9 correspond to C1’, C2’, C3’ and C1 respectively in the structure coordinate files). Panel e: side view of all three structures overlaid. Color coding is as follows: Carbon light gray (three shades of light gray are used with the lighter of these used in pG, medium in PYPBL and Tyr98, the darker in pR), Nitrogen - dark gray, Oxygen - black, Sulfur - medium gray. The figure was prepared using the program MOLMOL (Koradi et al. 1996) using the structure coordinate file deposited at the Protein Data Bank (Berman et al. 2000) (http://www.rcsb.org/pdb) with PDB ID: 2PHY (Borgstahl et al. 1995), 3PYP (Genick et al. 1998), 2PYR (Perman et al. 1998). The program POV-RayTM (http://www.povray.org) was used to render the images.
4.6 Modeling
Besides information from measurements performed on the Photoactive Yellow Protein itself, information obtained via modeling of this protein has also become available. The first study reported the effect of photo excitation on the movement of amino acid residues via a molecular dynamics simulation of the complete protein in a box of water (Yamato et al. 1998). To achieve this, the partial charges on the chromophore in the ground state and the excited state were determined via semi-empirical quantum mechanical calculations. During the molecular dynamics simulation, encompassing 180 fs (excitation after 120 fs), the shape of the chromophore was fixed. Photo excitation was simulated by exchanging the partial charges of the chromophore in the ground state by those for the excited state. The result from this calculation is that only amino acid residues in proximity to the chromophore moved significantly.
Unlike this first study, other modeling studies have used models limited to the chromophore and its immediate surroundings. The protein environment is then modeled via point charges and/or small molecules. This simplification allows ab initio calculations to be performed. The complexity of modeling is illustrated by a pilot study to determine the best algorithms and conditions to use to study the photo isomerization event (He et al. 2000). As this study is not complete yet, few answers were obtained save the algorithms and conditions to use. However, evidence was obtained that suggest that the electrostatic environment of the
27

Chapter 1 Photocycle: initial events
Photoactive Yellow Protein is essential in stabilizing the lowest singlet excited state. Also, hydrogen bonds of the chromophore with Tyr42 and Glu46 exert minor influence on the lower excited states.
The effect of deprotonation of the chromophore on bond lengths and angles, as well as the energy differences between the trans and cis isomeric forms, are other problems that lend themselves well for study via modeling. Such a study (Sergi et al. 2001) shows that deprotonation of the chromophore weakens the C7=C8 double bond, both for the trans and cis conformation. This effectively lowers the barrier for isomerization. It is also clear that the negative charge on the chromophore is delocalized over the entire chromophore, but it does not propagate past the sulfur atom of the thiol ester bond. Furthermore, it was shown that the chromophore model compounds are essentially planar in the trans configuration, but show a slight out of plane distortion in the cis conformation due to steric hindrance between the carbonyl oxygen and the hydrogen of the C6 ring carbon. Besides calculations on chromophore model compounds in vacuum, a more complex model incorporating modeled interactions with the protein environment was also tested in this study. A comparison was made between the ground state situation and a situation where isomerization has occurred. Here the available information from the crystal structures of the ground state and the PYPBL intermediate were used as starting points. Notably, after geometry optimization of the PYPBL configuration, the chromophore no longer shows a strong out of plane distortion, as it does in the PYPBL crystal structure. However, it is still slightly more distorted with respect to the model compound in vacuum. It is likely that the obtained model is similar to the situation in the pR intermediate and no longer resembles the situation in PYPBL. Since the possible hydrogen bond of the carbonyl with the Tyr98 backbone amide in pR was not part of the model it is not known what influence such a feature would have in such a model. The energy calculated for the pR-like model was 105 kJ·mol−1 higher than in the ground state model. This is similar to the value of 120 kJ·mol−1 obtained via photoacoustic spectroscopy, which is associated with the energy storage in the pR intermediate (van Brederode et al. 1995). Note that for the model compounds in vacuum an energy difference of only 21 kJ·mol−1 is obtained, clearly showing the important role the protein environment has.
Besides measuring absorption spectra, they can also be predicted using ab initio methods (Molina and Merchan 2001). As such, these predictions can test if structures have been assigned to the right photocycle species or if the obtained structure makes sense. All available structures involved in the first basic step of the photocycle have been tested in this way. For the electronic spectrum of the ground state a major band at 481 nm and minor bands at 420 and 341 nm are predicted. The major band, though clearly overestimated, compares reasonably well with the experimental value. Furthermore, it is shown that the lowest excited state, giving rise to the major band, has a π-π* nature. The structure assigned to the PYPBL intermediate shows bands at 1000, 479, and 426 nm. The latter is a minor band with respect to the first two. For the PYPBL intermediate a band is expected at 400 nm, only the minor band comes close to that value. However, for PYPHL a band is expected at 447 nm, which is reasonably close to the predicted 479 nm band. Though, a 400nm absorption band was observed in the crystals with cryo-trapped intermediate(s) (Genick et al. 1998), it is possible a significant amount of PYPHL was also present which is difficult to distinguish spectroscopically from pG. Thus the structure may resemble PYPHL or represent a sort of average structure between PYPBL and PYPHL. As one might expect, the predicted absorption bands from the deposited pR structure (Perman et al. 1998) (without the later refinements (Ren et al. 2001)) showed no clear resemblance with the known absorption spectrum of pR.
Very recently an extensive study on the photoexcitation and isomerization of the Photoactive Yellow Protein was published (Groenhof et al. 2002a). Here a combination of molecular dynamics simulation techniques and time-dependent density functional theory calculations were used. Several interesting results were obtained. Out of five separate simulations that were performed of the excited state, two showed a twisted configuration of the chromophore, and in three the chromophore retained its trans configuration. This could explain the two different excited sates observed in the ultra fast absorption measurement (see section 4.2). The twisted state could lead to isomerization, while the other simply returns to the ground state. Furthermore, it seems that the Photoactive Yellow Protein selectively stabilizes the transition state which can lead to the isomerization of the chromophore, i.e. the internal barrier for isomerization is considerably lowered in the excited state. Also, the calculations revealed that isomerization of the chromophore does not lead to a change in protein stability.
28

Chapter 1 Photocycle: initial events
29
4.7 Summary
In the first basic step of the photocycle of the Photoactive Yellow Protein the chromophore is isomerized. The exact sequence of events describing this isomerization is still a puzzle. Though several models have been suggested, it is not clear which, if any, of these models is correct. However, several features are known. At least two different fluorescent states are formed after photo-excitation of the Photoactive Yellow Protein. One of these fluorescent states has a chromophore configuration which is different from the ground state configuration, which presents itself as an anisotropy difference with respect to the ground state. It is unclear if these fluorescent states are actual photocycle intermediates that lead to the progression of the photocycle, are photocycle dead ends, or both (i.e. upon formation they can return either to the ground state directly or indirectly via the photocycle).
The first step in the photocycle is completed upon formation of pR. At least one photocycle intermediate is formed between the excited (fluorescent) state and pR at room temperature. This intermediate, called I0, is formed on a picosecond timescale and decays to pR on a nanosecond timescale. An additional intermediate with similar absorption characteristics as I0, called I0
‡, exists between I0 and pR. At cryogenic temperatures, more intermediates can be distinguished. Here a branched pathway exists where each branch contains two intermediates, one of which can be assigned to the room temperature intermediate I0. The two branches join upon formation of pR. Since the absorption characteristics of the intermediates of one of the branches are very similar to the ground state absorption characteristics, it is very difficult to confidently determine their existence without trapping them at cryogenic temperatures. However, the existence of at least one of these intermediates has been suggested to exist at room temperature.
Though the correct spectroscopic identification of the different intermediates is important, it is more interesting to understand what happens structurally. From what is known it is clear that the protein part shows very little structural change during the first step of the photocycle. Also, the aromatic ring of the chromophore stays more or less at the same position. The only way to facilitate isomerization of the chromophore with these conditions is by rotating the thiol ester carbonyl. This carbonyl flip can be interpreted as a double isomerization around the C7=C8 double bond and C9–Sγ single bond, i.e. the chromophore configuration changes from C7=C8-trans C9–Sγ-cis to C7=C8-cis C9–Sγ-trans.
As one would expect, the protein is rigged to facilitate this isomerization. Most notably, the deprotonated state of the chromophore weakens the C7=C8 double bond, lowering the activation energy barrier for isomerization. Furthermore, a twisted conformation of the chromophore seems to be stabilized in the excited state, possibly producing a bias towards full trans to cis isomerization of the C7=C8 double bond.
The energy content of the Photoactive Yellow Protein has increased 120-160 kJ·mol−1 upon formation of pR. This means that about half the energy of an absorbed photon is stored in the holo-protein at this point (a photon with wavelength 446 nm has an energy of 268 kJ·mol−1). This amount of energy should then be enough to drive the remainder of the photocycle. This also implies that half the energy of the absorbed photon is lost in e.g. thermal relaxations. FTIR analysis of the cryotrapped intermediates in the first step of the photocycle, suggests that there is very little structural difference between these intermediates. Thus small movements induced by thermal relaxations, may dictate the exact isomerization route of the chromophore. Here small, possibly insignificant, structural differences may produce different spectroscopic species, while the manner of isomerization is essentially the same. Additionally, such differences may already be introduced by small structural differences in the ground state, which are due to the natural movements of the protein.
The Photoactive Yellow Protein is not the only protein that has a photocycle, and where a chromophore changes its isomerization state upon photo-activation. The families of rhodopsin and phytochrome proteins are others. Here many characteristics show definite similarities with those of the Photoactive Yellow Protein. Thus the lessons that are learned with the Photoactive Yellow Protein, may lead the way to a better understanding in these other proteins as well, and vice versa.

Chapter 1 Photocycle: signaling state
5 Photocycle: signaling state
This section focuses on the signaling state of the Photoactive Yellow Protein. This state is involved in the last two basic steps of the photocycle (see Figure 8). The consensus is that in this state the protein interacts with a transducer protein to signal the cell that a blue photon has been absorbed. As such, this state needs to have a relatively long lifetime to allow for such a signal to be communicated. Since the interacting transducer protein has not been identified yet, all experiments have been performed on just the purified Photoactive Yellow Protein, i.e. the sensor protein. It is therefore possible that certain characteristics of the signaling state change, once the transducer protein is added. An example of the effect a transducer protein can have on a photo-sensor is the photo-sensor sensory rhodopsin I. Here, in the absence of the transducer protein, the sensor protein acts as a proton pump, while in the presence of the transducer protein the proton pump activity is lost (Spudich and Spudich 1993). Also, the pH dependence of the photocycle kinetics changes upon removal of the transducer protein (Spudich and Spudich 1993). This does not imply that measurements on just the isolated photo-sensor are obsolete. On the contrary, any differences between the characteristics in the absence and presence of the accompanying transducer may lead to a better understanding of how a signal might be transmitted.
For the formation of the signaling state of the Photoactive Yellow Protein, two key events have been identified. One is protonation of the chromophore, neutralizing its negative charge, and the other is structural change of the protein. In the last basic step of the photocycle the ground state is recovered. i.e. the chromophore has to be deprotonated and re-isomerized, and the protein part has to return to its ground state structure. Though the knowledge about the formation of the signaling state has increased significantly over the past few years, little is yet known about the specifics of the recovery of the ground state.
It is much more straight forward to do experiments in the nanoseconds to seconds time-domain than in the femtoseconds to nanoseconds time-domain. Many of the experimental problems mentioned in section 4 are no longer an issue. The simplified experimental conditions allow for many routine like experiments to be performed. Nanosecond time-resolution is not employed in all cases though, microsecond and millisecond time-resolutions are also regularly used. To monitor formation of the signaling state at least microsecond time-resolution has to be used. However, in some cases nanosecond time-resolution is essential. To monitor ground state recovery the use of millisecond time-resolution is usually enough. Mostly, UV/Vis spectroscopy is utilized, though FTIR spectroscopy is becoming more common as well. Research is however not limited by these two commonly used techniques, and more and more other techniques are being utilized, resulting in many new insights.
5.1 The photocycle model
Recently the photocycle model has changed significantly with respect to events that occur after the formation of the pR intermediate (pre-pR events are discussed in detail in section 4). Much of the early work assumed a simple three state photocycle model, as depicted in Figure 8. Here, the formation of the signaling state, pB from pR has been described both as a kinetically bi-exponential and mono-exponential event. Actually, the first detailed analysis of the photocycle of the Photoactive Yellow Protein (Meyer et al. 1987) postulated a photocycle containing an additional intermediate with similar spectral properties as the pB intermediate. This was inspired by the observed bi-exponential kinetic character of pB formation from pR. However, this idea was abandoned in a subsequent paper (Meyer et al. 1989). Recently, the intermediate pB’ was introduced as an intermediate in the pR to pB photocycle step based on results obtained with FTIR spectroscopy (Xie et al. 2001). A subsequent detailed laser induced transient UV/Vis spectroscopic kinetic analysis of the photocycle confirmed the existence of this intermediate and showed it has spectroscopic properties very similar to those of pB (see Chapter 3 section 3). Here it was also revealed that the pB’ intermediate is in equilibrium with pR, which explains the previously observed bi-exponential character of the pR to pB photocycle step (Meyer et al. 1987; Hoff et al. 1994a).
Recovery of the ground state can be achieved either in the dark or photo-induced. In the latter, a photon absorbed by pB’ and/or pB, photo-isomerizes the chromophore allowing a thousand fold increase in the rate of recovery speed, with respect to the rate of recovery in the dark (see Chapter 3 section 2). This branching reaction can also be induced by measuring light and hence influence data. This has to be taken into account when analyzing and comparing data. Though for the dark recovery it has been suggested that before isomerization can take place the chromophore must first be deprotonated and thus an intermediate must exist
30

Chapter 1 Photocycle: signaling state
between pB and pG (Demchuk et al. 2000), this was not experimentally demonstrated until recently (see Chapter 3 section 3). The details of the second and third basic photocycle step are depicted in Figure 12. In the following sections the available data from literature will be evaluated with this photocycle model in mind.
Figure 12. Detailed photocycle events after formation of pR. The photocycle events of the Photoactive Yellow Protein at room temperature after formation of pR are depicted. For this the basic photocycle was extended to include the photocycle intermediates of the second and third basic photocycle step. Alternative names of intermediates that are not used in the text, but can be found in literature, are depicted smaller and below the names used in the text. The typical time-scale of the different photocycle reactions are shown next to the arrow depicting that reaction.
5.2 Influence of experimental conditions
Many experiments have been performed that monitor the signaling state, under almost as many different solvent conditions. Since these solvent conditions can have pronounced effects on the properties of the Photoactive Yellow Protein, it is important to get a handle on these conditions. Especially, when seemingly contradictory results are obtained, the used experimental conditions may provide an explanation. However, comparing data obtained under different experimental conditions has lead to a better understanding of the Photoactive Yellow Protein as well.
The effect of ionic strength, viscosity, hydrophobicity of the solvent, and the effect of denaturing agents on the photocycle kinetics were studied early on. With respect to the ionic strength, all reactions seem to slow down at higher ionic strengths, where recovery of the ground state seems to be affected most (Meyer et al. 1987). However, viscosity and hydrophobicity have a larger effect on the photocycle kinetics, where rate of formation of the signaling state is decreased with increased viscosity and increased with increased hydrophobicity. Recovery of the ground state shows a complex viscosity dependence. Initially the rate increases and then decreases upon increase of the viscosity. The hydrophobicity dependence is relatively straightforward and shows a decrease in rate upon increase of hydrophobicity (Meyer et al. 1989). In the presence of the denaturing agent urea, a dark bleach of the protein is observed at urea concentrations above 5
31
Chapter 1 Photocycle: signaling state
M. Though the rate of signaling state formation seems hardly effected by increased urea concentrations, the rate of recovery of the ground state is dramatically decreased upon increased urea concentration (Meyer et al. 1987). Combined these results suggest that formation of the signaling state involves a significant structural change of the protein, exposing hydrophobic areas in the process. Several other techniques have confirmed this hypothesis and will be discussed in section 5.5.
In contrast, experiments on the Photoactive Yellow Protein in crystal form do not show a significant structural change. Since in these experiments the mesoscopic context is completely different, i.e. solution vs. crystal, it should not be a complete surprise that the observed amount of structural change upon formation of the signaling state is different in solution and crystal. Nonetheless, this issue became hotly debated. Not until it was confirmed with FTIR that in crystals only relatively small structural changes take place, while in solution these structural changes are much larger, this issue was resolved. Both descriptions are correct, where the mesoscopic context makes the difference.
Possibly the most important experimental condition that can be changed is the pH. The pH dependence of the ground state recovery kinetics has a bell shaped form. Here the fastest recovery rates are observed around pH 8. At higher and lower pH values a slower rate is observed, where the pH dependence implies pKa values of 6.4 and 9.4 (Genick et al. 1997a). Recently, the pH dependence of the photocycle was refined for the formation and decay of the signaling state, incorporating new intermediates that were unknown at the time of the first analysis (see Chapter 3 section 3). When comparing data, the pH is a factor that definitely should be taken into account. In fact, the pH is frequently adjusted to obtain favorable photocycle kinetic properties for the specific measurement. E.g. at low pH more of the signaling state can be accumulated with continuous illumination. This practice leads to additional problems when comparing data, since recently it was shown that not only the photocycle kinetics are pH dependent, but as a consequence also the equilibrium between several photocycle intermediates (see section 5.4 and Chapter 3 section 3) and the extent of structural change in the signaling state (see section 5.4 and Chapter 2 section 3 & 4).
FTIR spectroscopy is a technique that has become more and more popular to study the Photoactive Yellow Protein. In these experiments the use of deuterium oxide as solvent is common. When comparing those data with data obtained using water as solvent it is important to take into account that pH and pD values cannot always be simply compared directly, e.g. a pH of 8 is not necessarily similar to a pD of 8. Also, signaling state formation is slightly slower when deuterium oxide is used as solvent, while ground state recovery is slightly faster in deuterium oxide (see Chapter 3 section 3). Furthermore, with FTIR spectroscopy one should take into account the mesoscopic context of the sample. The following have been used, high concentration solutions (Hoff et al. 1999; Xie et al. 2001), hydrated films (Hoff et al. 1999; Kandori et al. 2000; Brudler et al. 2001; Imamoto et al. 2001a), and crunched crystals (Xie et al. 2001). Special care should be taken with hydrated films, since the degree of hydration can have pronounced effects on the characteristics of the Photoactive Yellow Protein (Hoff et al. 1999).
5.3 Structural relaxation of pR
Recently it was found that additional relaxation events in the protein occur after pR has formed (Takeshita et al. 2002a; Takeshita et al. 2002b). Through the use of the transient grating and pulsed-laser photoacoustic method, it was shown that a μs dynamic component exists during the life-time of pR. This indicates that after the structural changes around the chromophore are finished, additional structural changes occur in the protein away from the chromophore. Thus pR can be split up into the two intermediates pR1 and pR2. Though, the transition from pR1 to pR2 is claimed to be spectrally silent, a similar transition was already observed earlier in UV/Vis data (Hoff et al. 1994a). However, as this transition only contributed a very small amount to the total signal, no confident assignment could be made and the feature was dismissed. With the recent proof of a relaxation in pR, this relaxation was incorporated into a photocycle model used to analyze UV/Vis data (see Chapter 3 section 3). From this analysis reaction kinetics were obtained that fit the pR1 to pR2 transition observed via transient grating. Though the obtained spectra for both pR intermediates are very similar, pR1 seems to have a slightly higher extinction coefficient than pR2.
32
Chapter 1 Photocycle: signaling state
5.4 Protonation change upon pB’ formation
The first event that takes place after the formation of the pR intermediate is protonation of the chromophore, which results in the formation of pB’. Since the UV/Vis spectroscopic properties of pB’ are very similar to those of pB, the first experimental evidence for the existence of this intermediate stems from FTIR measurements (Xie et al. 2001). In those measurements it was shown that deprotonation of Glu46 and protonation of the chromophore are simultaneous events, which are subsequently followed by a structural change of the protein. Since the absorption changes monitored with UV/Vis spectroscopy mainly represent changes of the chromophore and its immediate surroundings and not changes of the structure of the protein itself, it is very difficult to make a distinction between pB’ and pB on the basis of UV/Vis spectroscopy. With proof for the existence of this pB’ intermediate, it was subsequently incorporated in a photocycle model, which was used to analyze UV/Vis data in a study on the kinetic deuterium isotope effect in the photocycle of the Photoactive Yellow Protein (see Chapter 3 section 3). From these analyses it was evident that pR and pB’ exist in an equilibrium that shifts towards pB’ upon going to the pH extremes. The observed kinetic Deuterium Isotope Effect is in line with a proton transfer from Glu46 to the chromophore for the whole pH range that was investigated (pH 5 to 11). However, for the return reaction the situation is more complex. Here formation of pR from pB’ can occur via different routes, dependent on pH.
With the reversible character of the pR to pB’ transition, a plausible explanation for the bi-exponential behavior of pB formation, previously observed with UV/Vis spectroscopy (Meyer et al. 1987; Hoff et al. 1994a), is now available. The shift of this equilibrium towards pB’, when going to the pH extremes, also explains the shift towards mono-exponential behavior for the formation of pB at these pH’s. Interestingly, from the Deuterium Isotope Effect data it has become evident that the pR to pB’ equilibrium kinetics are dependent on the concentration of the hydroxide ions, i.e. they are pOH dependent rather than pH dependent (see Chapter 3 section 3).
In a recent molecular dynamics study (Groenhof et al. 2002b), protonation of the chromophore was studied. The calculations showed that due to the isomerization of the chromophore, the negative charge on the phenolate oxygen of the chromophore is increased. As a result, the protonation of the chromophore becomes energetically more favorable. The stability of the protein is not affected much by the isomerization of the chromophore (Groenhof et al. 2002b; Groenhof et al. 2002a). The chromophore thus stays buried inside the protein and as such it is unlikely that the chromophore is protonated by the solvent. It was noted that of the two residues that hydrogen bond with the phenolate oxygen of the chromophore (Glu46 and Tyr42), Glu46 is the most likely to donate a proton. As soon as the proton transfer to the chromophore has occurred, the hydrogen bonding network, which was still intact in pR, collapses. This explains why multiple reaction routes were observed for the reverse reaction, i.e. from pB’ to pR (see Chapter 3 section 3). Several mutants in Glu46 have been studied, i.e. Glu46Ala, Glu46Asp, and Glu46Gln. Of these Glu46Gln has the least dramatic consequences for the protein. In these Glu46 mutants the chromophore still becomes protonated. Tyr42 is the next logical proton donor candidate, based on the molecular dynamics study described above (Groenhof et al. 2002b). Glu46Ala and Glu46Asp, have more severe effects in the protein (Devanathan et al. 1999a). In these mutants the formation of the pBdark form of the protein occurs with pKa values of 7.9 and 8.6 respectively (Glu46Gln has an apparent pKa of 4.2 (see Chapter 2 section 2)), compared to 2.7 in the wild type form of the Photoactive Yellow Protein (Hoff et al. 1997a). These mutants therefore nicely demonstrate the importance of Glu46 for the stability of the protein, but are not very useful for the study of the pR to pB’ step of the photocycle.
5.5 Structural change upon pB formation
In an early study on the temperature dependence of the photocycle of the Photoactive Yellow Protein, normal Arrhenius behavior was observed for the formation of the signaling state, whereas recovery of the ground state was shown to deviate from the normal Arrhenius behavior (Meyer et al. 1989). Upon increase in temperature the rate of signaling state formation decreases steadily in the temperature range of 5 to 62 ºC. The rate of recovery of the ground state increases in the temperature range of 5 to 35 ºC and decreases in the temperature range of 35 to 62 ºC. In a subsequent detailed study of this phenomenon, this temperature dependence was modeled with a model used to describe protein folding thermodynamics (van Brederode et al. 1996). In this model all thermodynamic parameters are assumed to be temperature independent for the temperature range of the experiment. With regard to the formation of the signaling state it was confirmed that
33

Chapter 1 Photocycle: signaling state
this reaction shows only a very small deviation from the normal Arrhenius behavior. However, it was also noted that below 31 ºC the formation of the signaling state showed bi-exponential behavior, whereas above this temperature mono-exponential behavior was observed. As the bi-exponential behavior is caused by the equilibrium between pR and pB’, it is likely that the equilibrium shifts towards pB’ at higher temperatures.
With regard to the ground state recovery rate, the protein folding thermodynamics model is adequate to explain the deviation from normal Arrhenius behavior. The parameter that is responsible for this deviation is a difference of the heat capacity between different states of the Photoactive Yellow Protein (van Brederode et al. 1996). The interpretation is that in the ground state and in the intermediate pR the protein is folded, whereas in the signaling state the protein is at least partly unfolded. In a recent study the temperature dependence of the ground state recovery was determined for a mutant with the first 25 N-terminal amino acids removed (van der Horst et al. 2001). Here the deviation from normal Arrhenius behavior was largely demolished. It therefore seems that the N-terminal region of the Photoactive Yellow Protein is largely responsible for the deviation from normal Arrhenius behavior and thus that this part of the protein shows the largest structural change upon formation of the signaling state.
Other methods, besides monitoring photocycle kinetics as a function of temperature or solvent condition, are available to monitor structural change of the protein as function of the photocycle. E.g. CD , NMR, fluorescence, and FTIR spectroscopy. Most of these methods can directly monitor structural changes and determine their accompanying kinetic behavior. An intrinsic characteristic of proteins, that can be utilized by several techniques to monitor structural change, is the presence of many exchangeable hydrogen atoms. Exchangeable hydrogen atoms can be exchanged for other hydrogen atoms in a reaction with water (Englander et al. 1972). Alternatively, these hydrogen atoms can be exchanged for deuterium and/or tritium atoms, making it possible to monitor the exchange with various techniques. All hydrogen atoms able to form hydrogen bonds can be considered exchangeable. Whereas a buried hydrogen atom may take hours to days to exchange, an exposed hydrogen atom may be exchanged within seconds or faster. Resistance against exchange is influenced by the formation of hydrogen bonds, solvent accessibility, and protein dynamics (Englander et al. 1972).
The Photoactive Yellow Protein potentially contains 235 exchangeable hydrogen atoms, 42 of which are from (de)protonatable groups. In a study where Electrospray Ionization Mass Spectrometry was used to monitor the progress of hydrogen / deuterium exchange in the Photoactive Yellow Protein (Hoff et al. 1999), it was shown that in the dark 162 hydrogen atoms were exchanged for deuterium atoms within 10 minutes, and 177 after 30 minutes. The same experiment performed in the presence of light showed that 175 hydrogen atoms had exchanged after 10 minutes and 193 after 30 minutes. For apoPYP 217 hydrogen atoms are exchanged after 30 minutes, leaving 29 sites resisting exchange, which can be interpreted as that 29 or less of the 42 (de)protonatable groups are deprotonated. Additionally, it may mean that apoPYP has a certain degree of structure, depending on the actual number of deprotonated groups. The light induced hydrogen / deuterium exchange was independently confirmed by using FTIR difference spectroscopy (Hoff et al. 1999). Though these experiments show that there is a difference between the ground and signaling state of the Photoactive Yellow Protein with respect to hydrogen / deuterium exchange protection, they do not pinpoint the areas of the protein responsible for the observed differences. However, it is possible to obtain more specific information with NMR spectroscopy (Craven et al. 2000). Though it was only possible to obtain specific information for the backbone amide exchangeable hydrogen of 51 residues, 14 of these showed a significant change in protection (i.e. resistance against exchange) upon formation of the signaling state pB, i.e. only two less than the number predicted by mass spectrometry, which was not limited to the backbone amide hydrogen atoms. The residues with the most significant loss in protection are Phe28, Glu46, and Thr70. The latter two are close to the chromophore, whereas Phe28 is close to Glu46.
By monitoring pH changes as a function of signaling state formation it is possible to obtain information on hydrogen atoms from (de)protonatable groups (see Chapter 2 section 2). When the apparent pKa of such a group changes upon formation of the signaling state, it is possible that a net proton release into the solvent or proton uptake by the protein takes place, resulting in a small change in the pH of the sample. In such an experiment (see Chapter 2 section 2) only (de)protonatable groups are detected that undergo a significant change in their immediate surroundings, e.g. go from a buried state to a solvent exposed state. Residues Arg52, Asp34, Glu12, Glu46, His108, Lys110, Tyr42, Tyr94, and Tyr118 are all candidates that might be able to show such behavior, as they are all buried and able to change their protonation state. For the Photoactive Yellow Protein net proton uptake is observed at low pH and net proton release at high pH, with little change around the transition point at pH 7.9. Furthermore, it has been shown that the proton uptake
34

Chapter 1 Photocycle: signaling state
events follow the formation and decay of the signaling state (see Chapter 2 section 2 and (Meyer et al. 1993)). The analysis of the His108Phe mutant showed that His108 is involved in net proton uptake events around pH 6.6 (see Chapter 2 section 2). In section 5.4, it was discussed that the residue Glu46 donates a proton to the chromophore upon formation of pB’. This does not lead to a net proton uptake or release. This proton donation route is blocked in the mutant Glu46Gln. In this mutant indeed an increased net proton uptake is observed, indicating that the chromophore is protonated via another route in this mutant, e.g. protonation via Tyr42, which then in turn quickly becomes protonated by solvent due to its typically high pKa of ~10.1. These experiments also indicate that in pB, Glu46 has a pKa of ~5.5 (see Chapter 2 section 2).
Besides using the exchangeable hydrogen atoms as a build in probe for structural change, it is also possible to add a probe to monitor structural change. Two different external probes have been used on the Photoactive Yellow Protein, Nile Red and 8-anilinonaphthalene-1-sulfonate (ANS). Both probes are able to bind to hydrophobic patches on the surface of a protein. The Nile Red probe does not bind to the ground state of the Photoactive Yellow Protein, but does bind to its signaling state (see Chapter 2 section 3). From a kinetic comparison with a UV/Vis experiment it is clear that Nile Red binds to the signaling state pB, and not to pB’. The problem with many probe experiments of this kind is that it is unclear where on the protein surface the probe binds exactly. However, for Nile Red binding to the Photoactive Yellow Protein a probable binding location can be deduced. Initially one would expect that the binding site would be located near the N-terminus, based on the large influence it has on the non-Arrhenius behavior described above. This was dismissed on the basis of results obtained with the mutant with the 25 N-terminal amino acids deleted. Based on NMR results (see below), this left only one area near the chromophore binding site, as a potential binding site for Nile Red in pB. Furthermore, with an apparent pKa of 5.5, this binding site becomes less accessible for Nile Red at low pH. This indicates less structural change around the chromophore binding site at low pH. Note that the Nile Red probe provides no information on structural changes around the N-terminus. Interestingly a pKa of 5.5 was assigned to the residue Glu46 in the pB state (see Chapter 2 section 2). As will be described below, this residue is involved in driving structural change upon formation of pB.
With the ANS probe it was shown that more hydrophobic surface is exposed in pB compared to the ground state (Lee et al. 2001c). However, due to spectral overlap with the Photoactive Yellow Protein, the ANS probe is less suited to obtain detailed kinetic information. Also, possible binding site(s) of ANS have not been determined. This only leaves the basic conclusion that in pB hydrophobic surface becomes exposed. In addition to the ANS binding experiments, it was shown with Circular Diochroism spectroscopy that upon formation of pB a major loss in tertiary structure but little loss of secondary structure takes place. Increased fluorescence quenching of aromatic residues of the Photoactive Yellow Protein upon formation of pB is another sign of structural change. All indications that pB has a molten globule state like structure (Lee et al. 2001c). Molten globule state like structures are often obtained with acid denatured proteins. The acid denatured form of the Photoactive Yellow Protein, also called pBdark due to its spectral and thermodynamic similarity to the pB photocycle intermediate (Hoff et al. 1997a), likely has a similar structure as the pB intermediate with the only major difference being the isomerization state of the chromophore, which is trans in pBdark and cis in pB. pBdark is formed with an apparent pKa of 2.7-2.8 (Hoff et al. 1997a).
In an NMR study of the pB intermediate in solution it was shown that pB exhibits structural and dynamic disorder with respect to the ground state (Rubinstenn et al. 1998). Interestingly, a subsequent NMR study of pBdark formation (Craven et al. 2000) showed that pBdark and the photocycle intermediate pB are very similar. It was also made clear that upon formation of pBdark the protein can be divided into three parts, a relatively stable core (residues 32-41, 80-94, and 113-122) and two areas that display large structural perturbations, the N-terminus (residues 6-18 and 26-29) and the area around the chromophore binding site (residues 42-58, 69-78 and 95-100). As discussed above, the structural perturbations of the N-terminus are largely responsible for the observed non-Arrhenius behavior of the photocycle kinetics. The structural perturbation around the chromophore binding site are likely monitored by the Nile Red hydrophobicity probe (see above). Furthermore the NMR data suggests that the pB intermediate is a mixture of structurally perturbed forms and a form structurally similar to the ground state, or more specifically, similar to the pB crystal structure (Genick et al. 1997b). This model is supported by the results obtained with the Nile Red hydrophobicity probe (see Chapter 2 section 3).
As mentioned in section 5.2 the mesoscopic context influences the extent of structural change upon formation of pB. Under certain conditions little structural change is observed, whereas other conditions lead to large structural changes. Available FTIR data demonstrates the differences best since measurements with FTIR have been done under all the different conditions. The following sample contexts lead to little structural
35

Chapter 1 Photocycle: signaling state
change: crystalline lattice, low/cryogenic temperature, and dehydrated films. Sample contexts leading to large structural changes are: aqueous solution and hydrated films. The only known complete structure of pB is from pB in the crystalline form (Genick et al. 1997b). The only significant structural changes observed in this structure are around the chromophore pocket, with most notably the exposure of the chromophore to the solvent. The lack of major structural change of the protein backbone has been confirmed with FTIR (see Chapter 2 section 4, and (Xie et al. 2001)), where only a small difference signal was observed in the Amide I region of the ‘pB – pG’ difference spectrum, a region sensitive to structural changes of the protein backbone. For the cryotrapped pB intermediate the same lack of signal in the Amide I region is observed (Kandori et al. 2000). Incidentally, pB has thus far only been cryotrapped in hydrated films in the absence of glycerol (Imamoto et al. 1997; Kandori et al. 2000; Imamoto et al. 2001a). It is not possible to cryotrap the pB intermediate in the presence of large amounts of glycerol (Imamoto et al. 1997). One of the possible key factors to whether or not a large structural change is observed seems to be the presence of water, and more specifically water molecules that are free to move. In crystals and at low/cryogenic temperatures water molecules are restricted in a lattice. In the absence of water, i.e. films with reduced hydration, also no major change is observed upon formation of pB in the Amide I region (Hoff et al. 1999; Kandori et al. 2000). The only conditions under which a major structural change is observed is in solution and hydrated films, i.e. in the presence of water molecules that are free to move. Interestingly, the structural water-200, from the crystal structure, has been implicated to change its hydrogen bonding character, upon formation of pB, only when a major structural change takes place (Kandori et al. 2000). This water-200 is located close to the His108 residue, which has been shown to become exposed upon formation of pB when a major structural change takes place (see Chapter 2 section 2).
It has been suggested that the trigger for the major structural change upon formation of pB is the formation of a buried negative charge on Glu46 when it donates its proton to the chromophore (Xie et al. 2001). After formation of pB’ the buried negative charge, initially located on the chromophore, is centered on Glu46. Whereas on the chromophore the negative charge can be effectively neutralized by delocalization of the charge, a hydrogen bonding network, and possibly the positive charge on Arg52, on Glu46 the buried negative charge cannot be effectively neutralized. This leads to a stress situation within the protein, which can be relieved via several routes. One is return to the pR state, reflecting the reversible nature of pB’ formation (see section 5.4). Other routes lead to the formation of pB. The extent of the structural change upon formation of the pB intermediate depends then on the route taken. One route to relieve the buried negative charge is to expose it to solvent, which requires structural change of the protein. Another route is to protonate the Glu46, but not via the chromophore since that would lead to the re-formation of pR. Once Glu46 is protonated the stress situation is relieved and a large structural change is no longer necessary. Since protonation changes play a key role, it is to be expected that these events are pH dependent. Thus depending on the pH one route may dominate over the other. In fact a pH dependence of the extent of structural change has been observed to coincide with protonation of Glu46 (see Chapter 2 section 4). Of course, both routes to pB mentioned here assume that pB’ is formed as an intermediate. It is also possible that a direct, or alternative, route from pR to pB exists. In such a route Glu46 may stay protonated, i.e. it does not donate a proton to the chromophore. The chromophore then becomes protonated only after exposure to the solvent, or via another residue (e.g. Tyr42). Such a route would require little structural change of the protein, and might be preferable in the crystal environment. All mentioned routes are possibilities and depending on the conditions one particular route may dominate. The key factor in all these routes is what happens to the protonation state of both Glu46 and the chromophore. In fact, it has been shown that for the Glu46Gln mutant in solution, the structural change upon formation of pB is significantly less compared to the wild type situation (see Chapter 2 section 4, and (Xie et al. 2001)). In this mutant residue 46 no longer can donate a proton to the chromophore and thus no buried negative charge is formed on residue 46, and hence less driving force for structural change is generated. Though residue 46 plays an essential role in the amount of structural change that takes place, other residues may also have influence. E.g. His108 also has influence on the extent of structural change as it has been shown that the mutant His108Phe also exhibits less structural change compared to the wild type protein (see Chapter 2 section 4, and (Kandori et al. 2000)).
Once pB is formed, via whichever route, it is likely that it exists in an equilibrium between an unfolded and folded form. This has been suggested on the basis of NMR data (Craven et al. 2000), and is corroborated by a molecular dynamics study on the crystal structure of pB in a box of water. This latter study shows that the structure can open up, or change, allowing water to enter the chromophore binding pocket and hydrate the Glu46 residue (Shiozawa et al. 2001). This process is reversible. The effect of possible (de)protonation events
36

Chapter 1 Photocycle: signaling state
of certain residues, such as Glu46, was not modeled, however, the fact that a water molecule can interact with Glu46 implies that such events could take place. This could then possibly lead to larger structural changes.
In a recent molecular dynamics study, the effect of protonation of the chromophore by Glu46 on the stability of the protein was simulated (Groenhof et al. 2002b). Though the simulation was run for only 4 ns after the proton transfer, it is clear that this event induces structural changes in the protein. For one, the proton transfer causes the hydrogen bonding network with the chromophore to collapse, and results in a shift of the negative charge, which becomes localized on Glu46, an energetically unfavorable situation. Furthermore, the N-terminal domain is affected in the simulation, as well as α-helix 3. These, domains were also shown to be involved in structural change based on NMR measurements (see above and (Craven et al. 2000)).
5.6 Recovery of the ground state
During the recovery of the ground state of the Photoactive Yellow Protein, several events have to take place. The chromophore has to be re-isomerized to the trans form, the protonation states of several residues and the chromophore have to be changed, and the protein needs to return to its original fold. Though these are seemingly distinct steps, they have appeared to occur simultaneously, until recently. On the basis of measurements of the kinetic deuterium isotope effect (see Chapter 3 section 3) it was shown that deprotonation of the chromophore occurs before its isomerization. Hence, an intermediate named pBdeprot. is formed ‘en route’ from pB to pG. Though deprotonation of the chromophore aids the re-isomerization of the chromophore tremendously (Sergi et al. 2001), this re-isomerization is still a rate determining step, in which the protein fold likely plays a crucial part. The pBdeprot intermediate is therefore characterized by a deprotonated chromophore and a folding state that allows re-isomerization of the chromophore. This latter characteristic is important, as this intermediate possibly has an absorption spectrum similar to that of the ground state of the Photoactive Yellow Protein and not one that is similar to the pB intermediate at high pH, which also has a deprotonated chromophore but has its absorption maximum around 430 nm (see Chapter 3 section 3). An absorption spectrum similar to the ground state for the pBdeprot intermediate also explains why it has not been observed before. Furthermore, it is in line with the observation that recovery monitored with UV/Vis spectroscopy seems to be faster than recovery monitored with the Nile Red hydrophobicity probe, which probes structural changes around the chromophore (see Chapter 2 section 3).
When re-isomerization of the chromophore is achieved photoactively, the rate of recovery of the ground state is increased a thousand-fold (see Chapter 3 section 2). In this branching reaction an intermediate pBt is formed instantaneously on the nanosecond time scale. A slight blue shift of pBt, with respect to pB, can be explained by the difference in isomerization state of the chromophore, i.e. cis (pB) vs. trans (pBt). No other intermediates are observed with UV/Vis spectroscopy in going from pBt to pG, indicating that change of the protein fold and the protonation state of several residues can be achieved quickly once the chromophore is isomerized. The existence of this branching reaction can influence data in that in the presence of light, that can be absorbed by any of the pB intermediates, may allow recovery kinetics to appear faster than they really are in the absence of this light (Miller et al. 1993). Although, this branching reaction can complicate matters in certain cases, it is also possible to utilize it to aid measurements. E.g. in the mutant Met100Ala the recovery rate is slowed down six orders of magnitude (Devanathan et al. 1998). Normally, it would not be practical to obtain data on the formation of pB in such a mutant, without replacing the sample after every photocycle activation. However, by invoking the branching reaction speed of recovery is increased tremendously and the sample would not have to be replaced after every photocycle activation, making it practical to obtain data on formation of pB in such a mutant.
Several studies have been done to study refolding of the Photoactive Yellow Protein. Mostly, these studies employ a denaturant to aid the initial unfolding of the protein. The exception is an NMR study (Rubinstenn et al. 1998), where recovery of the ground state was measured solely on the bases of light induced unfolding of the protein. For the recovery a differential refolding was observed where the central β-sheet and parts of the α-helical structure refold first, after which the region around the chromophore returns to the ground state fold. Though, the differences between the rates are small and it is unclear if the accompanying error allows one to differentiate between the rates, the observed trend is in line with the idea that in order to facilitate re-isomerization of the chromophore, the chromophore not only needs to be deprotonated, but also the protein needs to be in a relatively folded state.
37

Chapter 1 Photocycle: signaling state
In a study utilizing the denaturants urea and guanidinium·HCl, refolding was studied in unfolded ground state protein and in the unfolded signaling state (Lee et al. 2001a). The major difference between these two denatured forms of the protein is the isomerization state of the chromophore. Where refolding from the denatured ground state is a mono-exponential event, refolding from the denatured signaling state is a bi-exponential event. Here the fast component is identical to refolding from the denatured ground state, and the slow exponent has a rate similar to the photocycle ground state recovery under similar conditions. This indicates that after the signaling state renatures it recovers to the ground state through normal photocycle events. Interestingly, extrapolation of the obtained refolding kinetics to the absence of denaturant shows close to a thousand fold faster rate for refolding for protein with the chromophore in the trans state compared to protein with the chromophore in the cis state. This is similar to rate difference observed between the ground state recovery in the dark and photo activated ground state recovery via the branching reaction (see Chapter 3 section 2).
Similar experiments with the acid denatured state of the Photoactive Yellow Protein were also performed (Lee et al. 2001b). Similar results as with the denaturants as described above were obtained, where refolding from the acid denatured state with the chromophore in the trans state, i.e. pBdark, is 3 to 5 orders of magnitude faster compared to the acid denatured state with the chromophore in the cis state. Interestingly, it was shown with temperature denaturation that, when in the acid denatured state the chromophore is in the cis state, the protein is more stable than when the chromophore is in the trans state. Furthermore, it was shown that the acid denatured state with the chromophore in the cis state is very similar to the photocycle intermediate pB.
For a few mutants of the Photoactive Yellow Protein, a dramatic decrease in recovery rate has been observed, i.e. Glu46Asp (Devanathan et al. 1999a), Met100Ala (Devanathan et al. 1998), and Met100Leu (Sasaki et al. 2002). This indicates that Glu46 and Met100 are important for recovery. Met100 is important for the re-isomerization of the chromophore, as indicated by the dramatic increase in rate of recovery when the chromophore is photochemically re-isomerized in the Met100Ala mutant (Devanathan et al. 1998). In a recent study, it was argued that the electron donating character of the residue at position 100, influences the rate of recovery through interaction with another residue, most likely Arg52 (Kumauchi et al. 2002). With the Glu46Asp mutant such a dramatic increase in recovery rate was not observed upon photochemical re-isomerization of the chromophore (Devanathan et al. 1999a). As such it is likely that Glu46 is important for refolding of the protein, though it may still be involved in dark re-isomerization of the chromophore.
5.7 Summary
For the second step of the photocycle of the Photoactive Yellow Protein, i.e. formation of pB from pR, it has been shown that the different events that occur are heavily dependent on the environmental conditions. In pR the chromophore is isomerized, which does not result in a destabilization of the protein, but rather makes proton transfer of the phenolate oxygen of the chromophore by Glu46, energetically favorable. This proton transfer then leads to the formation of the pB’ intermediate, from which pB is then formed. Several techniques, have been used to arrive at this description. Most notably, FTIR experiments have sparked the idea (Xie et al. 2001), while molecular dynamics simulations (Groenhof et al. 2002b), and UV/Vis spectroscopy (see Chapter 3 section 3) have confirmed and built upon the idea. After the chromophore has become protonated, Glu46 obtains the negative charge. This charge is buried and localized, an energetically unfavorable situation. This unfavorable situation then can be resolved by either returning to pR or progressing towards pB. Molecular dynamics simulations have shown that directly after protonation of the chromophore the hydrogen bonding network collapses. This would suggest that a reverse reaction to form pR is unlikely. However, UV/Vis experiments have shown the reversible character of the pR to pB’ reaction. It was also shown with UV/Vis spectroscopy that several mechanisms are possible for the return reaction, dependent on the pH of the system (see Chapter 3 section 3). Furthermore, at low and high pH the equilibrium shifts toward pB’.
Formation of pB from pB’ is usually accompanied by structural changes in the protein, where the N-terminal domain shows most change as well as the domain around the chromophore. However, the extent or specifics of the structural change heavily depends on the sample conditions. The negative charge on Glu46, after it has donated its proton to the chromophore, has been suggested to be the major driving force for the structural changes. Protonation of Glu46 upon formation of pB therefore would lead to less structural change. The pKa of Glu46 in pB has been deduced to be ~5.5, a pKa also observed with respect to changes in the amount of structural change. In contrast, no major structural change is observed in crystals, at low
38
Chapter 1 Photocycle: signaling state
39
temperature, and insufficiently hydrated films. This suggests that water molecules also play an important role in the structural changes, as they are restricted in movement in all these latter conditions. In solution and sufficiently hydrated films water movement is not restricted and large structural changes of the backbone are observed. Also, the protonation state of several residues may play an important role in structural changes upon formation of pB.
For the third and final basic step of the photocycle of the Photoactive Yellow Protein, i.e. recovery of the ground state, it has been shown that deprotonation of the chromophore precedes its re-isomerization. In order for re-isomerization to take place, not only the chromophore needs to be deprotonated, but the protein also has to have the correct folding state. The intermediate pBdeprot has been introduced to represent this state and is in equilibrium with pB. The absorption spectrum of the pBdeprot intermediate is likely very similar to that of the ground state.
Chapter 1 Tuning
6 Tuning
Tuning of the absorption band of the Photoactive Yellow Protein has several aspects. There is the tuning of the absorption band of the ground state structure. Here, the contributions of specific structural characteristics are considered. However, during the photocycle of the Photoactive Yellow Protein, the absorption spectrum changes as well. These changes therefore contain valuable information regarding the chromophore and its surroundings. A proper understanding of the tuning of the Photoactive Yellow Protein, will therefore aid to understand events that occur during the photocycle.
6.1 Ground state tuning
The interaction of the chromophore and protein part of the Photoactive Yellow Protein produces an absorption band with 446 nm as its maximum. As the free chromophore, trans-4-hydroxycinamic acid, has an absorption maximum that lies at 284 nm (in aqueous solvent around neutral pH) (Aulin-Erdtman and Sandén 1968), this interaction of the chromophore with the protein induces a large red shift. Several specific interactions can be distinguished. For one, the thiol ester link of the chromophore with Cys69, causes a red shift of ~5713 cm-1 (from 284 to 339 nm). This follows from a comparison of the absorption maximum of 4-hydroxycinamic acid and the denatured form of the Photoactive Yellow Protein in aqueous solution at pH 7 (Kroon et al. 1996). An additional red-shift of 4310 cm-1 (from 339 to 397 nm) occurs when the chromophore becomes deprotonated, which follows from a comparison of the absorption maximum of the denatured form of the Photoactive Yellow Protein in aqueous solution at pH 7 and 11 (Kroon et al. 1996). This leaves a red-shift of ~2767 cm-1 (from 397 to 446 nm) that is due to interactions with the protein. Though this description is very illustrative, it does not provide specifics regarding the interactions between the chromophore and the protein.
In a recent study, a closer look was taken at the mechanism(s) that lead(s) to the tuning of the Photoactive Yellow Protein in its ground state (Yoda et al. 2001). Two model compounds were used, a propyl ester and a propyl thiol ester of 4-hydroxycinnamic acid. Here the thiol ester model compound was consistently red-shifted by ~1000 cm-1, with respect to the ester model compound, irrespective of the protonation state of the chromophore. With regard to tuning in the Photoactive Yellow Protein, three tuning contributions were considered, i.e. a medium effect of the protein matrix (700 cm-1), a counter ion effect (5300 cm-1), and a hydrogen bonding effect (–1600 cm-1). The medium effect of the protein matrix takes into account non-specific solvent effects. For the model compounds the absorption maximum shifted dependent on which solvent was used, e.g. for the thiol ester model compound the absorption maximum ranged from 34800 cm-1 (287 nm) in pentane to 31500 cm-1 (317 nm) in pyridine. This difference is mainly caused by differences in the dielectric constant and refractive index between the solvents. To determine the medium effect in the Photoactive Yellow Protein these values were estimated for the protein. Absorption maxima of the thiol ester model compound in hexane and protein were calculated. Note, that only the solvent properties of the protein are considered here and not counter ion and hydrogen bonding effects. This leads to a contribution of ~700 cm-1 to the tuning of the chromophore. The counter ion effect considers the difference in position of the counter ion of the thiol ester model compound in solution (sodium ion at 2.5 Å in a straight line from the phenolate oxygen bond) and in the protein (position of Arg52 in the crystal structure PDB ID: 2PHY (Borgstahl et al. 1995)). Here protein solvent conditions were used in the calculation of the absorption maxima. This leads to a contribution of ~5300 cm-1 to the tuning of the chromophore. The hydrogen bonding effect was determined by placing methanol at the positions of the hydroxy groups of residues Tyr42, Glu46, and Thr50, which are involved in the hydrogen bonding network with the chromophore, in the calculations. By comparing the situation incorporating the medium effect of the protein matrix and the counter ion effect, with the situation that also takes into account the hydrogen bonding effect, the contribution of the latter was determined as –1600 cm-1, i.e. a blue-shift. With regard to the counter ion effect an interesting observation was made. The position of the Arg52 is such that it appears that the counter ion is infinitely apart from the chromophore, i.e. it does not contribute to the tuning. Furthermore, movement of the counter ion towards the thiol ester linkage results in a red-shift, whereas movement toward the phenolate oxygen results in a blue-shift.
From NMR measurements (Dux et al. 1998) and molecular dynamics studies (Groenhof et al. 2002a) it is evident that Arg52, may have two distinct positions in the ground state. Here the two distinct positions obtained with the molecular dynamics studies results in a difference of 20 nm between the absorption maxima of the two situations. Interestingly, in a low temperature study (Masciangioli et al. 2000), two peaks were
40
Chapter 1 Tuning
distinguished for the ground state, i.e. one at 425 nm and one at 452.4 nm, which could represent the two orientations of Arg52. Taking the positions for Arg52 obtained with NMR (PDB ID: 3PHY (Dux et al. 1998)), neither of these overlaps with the position of Arg52 in the crystal structure (PDB ID: 2PHY (Borgstahl et al. 1995)). One of the orientations is closer to the thiol ester link, and one is closer to the phenolate oxygen, which is in line with the observation regarding the counter ion position described above. The position of Arg52 in the crystal structure therefore may represent an average between the two Arg52 positions found for PYP in solution.
The hydrogen bonding network in the Photoactive Yellow Protein has been adjusted in several ways. In one, the hydrogen bonding network was weakened by replacing the bridging hydrogen atoms with deuterium atoms (see Chapter 3 section 3). Indeed, a small red-shift was observed, which would be expected when the hydrogen bonding effect contributes a smaller blue-shift to the total tuning. Furthermore, the residues that are involved in the hydrogen bonding network (Tyr42, Glu46, and Thr50) have been altered through mutagenesis. Here mutants in Tyr42, Glu46, and Thr50 result in red-shifts (Tyr42Ala, Tyr42Phe, Glu46Gln, Glu46Ala, Thr50Val, and Thr50Ala (Genick et al. 1997a; Mihara et al. 1997; Devanathan et al. 1999a; Brudler et al. 2000; Imamoto et al. 2001c)) reflecting the weaker hydrogen bonding effect in these mutants. In some mutants though, protein stability has been severely affected as indicated by an additional blue-shifted absorption band (Tyr42Phe, Tyr42Ala, and Glu46Ala).
Several mutants of residue Arg52 have also been prepared. The Arg52Ala mutant is slightly red-shifted (Genick et al. 1997a), while the Arg52Gln mutant shows no shift of the absorption maximum (Mihara et al. 1997). As described above, removal of the counter ion, would not lead to a change in absorption maximum, which is exactly what is observed in the Arg52Gln mutant. A small red-shift that is observed in the Arg52Ala mutant may be explained by a more open structure of the chromophore binding pocket, possibly allowing a solvent cation to act as a counter ion.
6.2 Tuning in photocycle intermediates
In section 4 the initial photocycle events were discussed. Here a branched pathway was observed at low temperature. With what we have discussed in section 6.1, it is possible that these two pathways reflect isomerization of the chromophore, with different orientations of Arg52. The merger of the two different pathways at pR would then probably indicate that at the temperatures pR can be formed, enough thermal energy is present to allow Arg52 to switch between different positions. The two orientations of Arg52 may have as a consequence that in one orientation the isomerization is easier compared to when Arg52 is in the other orientation. This would have as a result that the measured ground state spectrum may differ from the bleached ground state spectrum (see Chapter 3 section 3). At room temperature, only one pathway has been observed, with all intermediates in this pathway red-shifted with respect to the ground state. The negative charge on the chromophore is most effectively delocalized if the chromophore is planar. During isomerization planarity is lost, and the negative charge is not as efficiently delocalized, which results in a red-shift of the absorption spectrum. This would explain why the intermediates I0 and I0
‡ are more red-shifted than pR, as in those intermediates, isomerization has not yet completed and the chromophore may be in a twisted form. In pR the chromophore is still not quite planar due to steric hindrance between the carboxylic oxygen and phenyl ring atoms (Groenhof et al. 2002b), explaining the red-shift. Additionally, in pR the chromophore has contracted ~0.5 Å (Groenhof et al. 2002b), while the structure of the protein is very similar to that of the ground state. Such a contraction could lead the counter ion Arg52 to become located closer to the phenolate oxygen of the chromophore, which would also lead to a red-shift (see section 6.1).
When the chromophore becomes protonated in pR, pB’ is formed. As described in section 6.1, protonation of the chromophore leads to a large blue-shift, which is exactly what is observed. In pB’ the structure of the protein is still very similar to that of pR, and thus the ground state. Therefore, interactions with the protein are likely. When pB is formed, the structure of the protein has dramatically changed (in solution), where the interaction of the protein with the chromophore has likely diminished, which is also illustrated by the slight additional blue-shift of the pB intermediate with respect to pB’. However, even though the chromophore has become more exposed in pB, its absorption maximum is still slightly red-shifted compared to the situation in denatured protein (Lee et al. 2001a). The chromophore is therefore still tuned in pB, through interactions with the protein. The presence of these interactions is further demonstrated by the pKa of the chromophore in pB which is ~10 and not 8.7 as is the case in denatured protein (see Chapter 3 section 3).
41

Chapter 1 Tuning
42
Before isomerization can take place the chromophore needs to be deprotonated first. This leads to a large red-shift, with respect to pB as is demonstrated by the pB spectrum at high pH where its absorption maximum shifts to ~430 nm (see Chapter 3 section 3). However, for isomerization to take place the folding state of the protein also needs to be correct. When that condition is also met we speak of the intermediate pBdeprot. As an intermediate with an absorption of 430 nm has not been observed during the recovery of the Photoactive Yellow Protein, it is unlikely that the absorption spectrum of pBdeprot is similar to that of pB at high pH. More likely is that, due to interaction with the protein, the absorption band of pBdeprot is similar to that of the ground state (see Chapter 3 section 3).

Chapter 1 Final remarks
7 Final remarks
The Photoactive Yellow Protein has become more and more popular as a model system. This is demonstrated by a literature search with the keyword ‘Photoactive Yellow Protein’. Where only a few years ago, the search result would contain mostly papers where a study on the Photoactive Yellow Protein is described. Now a search result also contains studies on many other proteins, for which the Photoactive Yellow Protein is seen as a model or reference system. Three areas of research can be distinguished where the Photoactive Yellow Protein is used as model system. One is the study of PAS-domains (see section 1.3). A second is the study of protein folding. A third is the study of the primary photochemistry of photoreceptors. The popularity of the Photoactive Yellow Protein stems from its favorable handling characteristics, the availability of high resolution structures, and its relatively simple chromophore, a thiol ester linked 4-hydroxycinnamic acid moiety that is deprotonated in the ground state. In addition, recent studies have provided many new insights, providing a much better understanding of the photocycle. Though a detailed understanding of the physical properties of the Photoactive Yellow Protein is available, information regarding its function and activity in Halorhodospira halophila is relatively scarce. Basically all we know is that it is most likely the photosensor for a blue-light tactile response (photophobic response).
A detailed description of the photocycle of the Photoactive Yellow Protein is shown in Figure 13. After excitation of the ground state two excited states may be formed, one in which the chromophore retains its trans configuration and one in which the chromophore adopts a twisted chromophore configuration. This latter excited state most likely results in formation of the I0 photocycle intermediate. In this I0 intermediate the chromophore has already achieved the cis configuration, though it still is twisted. Relaxations in the protein leads to the formation of I0
‡ and subsequently pR. In pR isomerization of the chromophore has been completed. Isomerization of the chromophore is achieved with a minimal amount of movement of the chromophore. This is achieved through a concerted rotation around several bonds that can be described by a C7=C8-trans C9-Sγ-cis to C7=C8-cis C9-Sγ-trans double isomerization, or a rotation of the chromophore carbonyl oxygen. Isomerization of the chromophore does not lead to a destabilization of the protein, but it does significantly increase the probability of a proton transfer from Glu46 to the chromophore. When this occurs the intermediate pB’ is formed. As a result, the negative charge – which was stabilized when it resided on the chromophore via delocalization, a hydrogen bonding network, and a counter ion – now resides on Glu46 where it is very localized. This is an energetically unfavorable situation which is resolved by either reformation of pR or formation of pB. Upon formation of pB the negative charge on Glu46 induces structural changes both in the N-terminal domain and around the chromophore binding pocket. The extent of these structural changes differs depending on the sample conditions and can range from no structural change in crystals, at low temperature, and insufficiently hydrated films, to large structural changes in solution, and sufficiently hydrated films. In solution the pH can have an influence on the extent of structural change. Here the protonation state of several residues (e.g. Glu46 and His108) may play an important role. With the formation of pB, or the signaling state, the photocycle now comes to the recovery phase. For recovery to take place the chromophore has to be re-isomerized, and the protein needs to return to its ground state fold. Before re-isomerization can take place, the chromophore needs to be deprotonated, and the protein needs to adopt a specific fold that allows for the re-isomerization to take place. This situation is represented by the pBdeprot intermediate, which is in equilibrium with pB. After the chromophore has re-isomerized the ground state is reformed and the photocycle has been completed. In addition to this recovery in the dark it is also possible to re-isomerize the chromophore photochemically, which results in a rate of recovery that is three orders of magnitude faster than dark recovery.
With the full description of the photocycle of the Photoactive Yellow Protein the end of this first chapter has been reached. In the following chapters experiments that have aided in the better understanding of this photocycle, are discussed in detail. Chapter 2 focuses on the structural changes in the photocycle. Besides a general description of sample preparation, the net proton uptake / release experiments (Hendriks et al. 1999b), Nile Red probe binding experiments (Hendriks et al. 2002b), and some FTIR experiments are described. Chapter 3 focuses on photocycle events or kinetics. Here a description of the laser set-up used for UV/Vis measurements in the nanosecond to seconds time domain is given. Furthermore, the characterization of the photocycle branching reaction (Hendriks et al. 1999a) and the (kinetic) deuterium isotope effect of the photocycle (Hendriks et al. 2002a) are discussed. In Chapter 4 some additional lines of research are discussed that warrant further study. In addition a general discussion of the work presented in this thesis is given.
43

Chapter 1 Final remarks
Figure 13. Up-to-date complete description of the photocycle. An up-to-date complete description of the photocycle events at room temperature is shown. Here the information in Figure 9 and Figure 12 has been combined. The route in the primary photocycle step that included PYPHL is not shown as it is unclear weather it really occurs. In addition, schematic drawings of the chromophore and its interactions with the protein, have been added. Here the drawings represent the situation in the intermediate its placed next to.
44

45
Chapter 2
Structural change
In Chapter 1 a comprehensive overview of work done on the Photoactive Yellow Protein (PYP) from Halorhodospira halophila has been presented. There we have seen that the photocycle of PYP can be divided into three basic steps, isomerization, protonation change and structural change, and recovery. In this chapter I will focus on experiments I have been involved in that specifically have looked at the second basic step in the photocycle, protonation change and structural change. Though the results of these experiments have been touched on in Chapter 1, they will be discussed here more extensively. Here new information, not available at the time of publication of those data, is used to reinterpret the data where necessary.
Before the measurements are discussed a general description of sample preparation will be given. The first measurements that will be discussed are measurements performed to determine the net proton uptake, or release, upon formation of the signaling state (Hendriks et al. 1999b). Besides probing the protonation change of several residues upon formation of the signaling state, these experiments also infer something about the structural change that takes place. The discussion will then continue with the Nile Red probe binding experiments that specifically look at the structural change (Hendriks et al. 2002b). To finish some FTIR measurements will be discussed that specifically look at the structural change in the signaling state (unpublished results, and parts of (Xie et al. 2001)).

Chapter 2 Sample preparation
1 Sample preparation
For the overproduction of PYP, a construct in Escherichia coli was prepared. In this construct an N-terminal hexa-histidine containing tag (His-tag; MRGSH6GSD4K–PYP) is present which can be removed with enterokinase (see section 1.3). The construct was made using the commercially available kit QIAexpresse (with the pQE30 vector set) by Qiagen (http://www.qiagen.com/) (Kort et al. 1996b). PYP mutants were prepared via site-directed mutagenesis, using the mega-primer method (Landt et al. 1990). Altered genes were first screened using restriction analyses, and mutagenesis was subsequently confirmed by DNA-sequencing.
In the following a detailed description of the overproduction and subsequent purification of PYP using the E. coli construct prepared with the QIAexpresse kit is given. The procedure is optimized for the wild type protein. Though these procedures worked fine with the mutant PYP forms used for the experiments described in this thesis, minor adjustments may provide even better results. In other cases adaptation of the procedures may be critical (e.g. in overproduction of PYP from Rhodobacter sphaeroides).
1.1 Overproduction
The overproduction was typically carried out in 0.5 l batches. For this, 0.5 l batches of a rich growth medium, including antibiotics, were prepared. This rich medium, dubbed PYP production broth (PB), consists of 20 g·l-1 Tryptone, 10 g·l-1 Yeast extract, 5 g·l-1 sodium chloride, 8.7 g·l-1 dipotassium hydrogen phosphate, 5 g·l-1 glucose, 100 mg·l-1 Ampicillin, and 25 mg·l-1 Kanamycin. The pH of PB was set at 7. The medium was sterilized before use, where glucose, Ampicillin, and Kanamycin were sterilized separately and added after the sterilized medium had cooled down. The E. coli strains were grown at 37°C.
1.1.1 Growth and harvest of cells
50 ml of the 0.5 l batch was used for an overnight culture, which was started from a glycerol stock. The remainder of the 0.5 l batch medium was pre-heated at 37°C and inoculated with the overnight culture. About 30 minutes after inoculation, the culture was induced with isopropyl-β-D-thiogalactopyranoside (IPTG), provided the culture was in the logarithmic growth phase. The induced culture was then incubated, while shaking, for at least 2.5 hours, after which the cells were harvested by centrifugation at 4°C (15 minutes at 5,000 rpm). The pellets were re-suspended in 50 mM phosphate buffer pH 7.5 and stored overnight at –20°C.
1.1.2 Cell lysis and apoPYP reconstitution
After thawing, 25 μg DNAse and 25 μg RNAse was added to the harvested cells, which were then lysed via sonication (at least 6 minutes, with a 50% duty cycle). The obtained suspension was centrifuged for 45 minutes at 14,000 rpm. The supernatant, or cell extract, containing the majority of the apoPYP, was dialyzed for 1 hour against 50 mM Phosphate/Borate buffer pH 9. Reconstitution of the apoPYP with activated chromophore, is faster at this high pH. This is likely caused by deprotonation of the sole cysteine residue to which to the chromophore needs to be attached.
The activated chromophore was prepared by dissolving the acid form of the chromophore (4-hydroxy cinnamic acid for wild type PYP) and 1,1’-carbonyldiimidazole (CDI) (both at a concentration of 250 mM) in dry N,N-dimethylformamide (DMF) and subsequently stirring the mixture overnight at 4 ºC. This is an adaptation from (Imamoto et al. 1995; Genick et al. 1997a). Alternatively, an activated chromophore can be prepared by replacing CDI in the above description by N,N’-dicyclohexylcarbodiimide (DCC). This, however, requires centrifugation of the activated chromophore before use. Reconstitution with the DCC form of the activated chromophore is less dependent on the pH of the solution and can be used to reconstitute apoPYP quickly at a pH lower than 9. However, the cell extract still needs to be dialyzed before reconstitution to remove small molecules that can interfere with reconstitution (dialysis against a buffer with another pH is possible though). Note that the use of the DCC form of the activated chromophore usually produces a precipitate during reconstitution, which has to be removed before purification of the holoPYP.
Reconstitution of apoPYP was achieved by adding small aliquots of activated chromophore to the dialyzed cell extract, while shaking (e.g. add 100 μl in steps of 20 μl). After shaking the cell extract for 30 minutes more activated chromophore was added when necessary, this was checked spectroscopically (adding
46

Chapter 2 Sample preparation
47
a total of 300 μl was usually more than enough). In case the DCC form of the activated chromophore was used, shaking for 5 minutes was sufficient. Note, that when the cysteine is oxidized, reconstitution is blocked. This can occur, e.g., if the apoPYP is first purified with a Ni-NTA resin column. To prepare the cell extract for purification of the holoPYP, it was centrifuged (if necessary) and dialyzed against 50 mM phosphate buffer pH 7.5.
1.2 Purification of holoPYP
For the purification of holoPYP from the cell extract a Pharmacia FPLC system was used ( two P500 pumps, a GP-250 Gradient programmer, and a frac-100 fraction collector). For the first step in the purification a column packed with Ni-NTA resin from Qiagen was used. Here the genetically introduced His-tag binds to the Ni-NTA resin. A buffer containing 10 mM Trizma base (sigma), 10 mM citrate and 150 mM NaCl with a pH of 8 was used as loading buffer. The same buffer with a pH of 3.3 was used as elution buffer. A flow rate of 2ml·min-1 was used. After the cell extract was loaded onto the column and the column was washed with loading buffer, holoPYP was eluted using a gradient. The following gradient provided the best results for wild type PYP: from 0 to 40% elution buffer in 20 ml, from 40 to 50 % elution buffer in 20 ml, from 50 to 70% elution buffer in 80 ml, from 70 to 100% elution buffer in 15 ml, and finally washing with 25 ml elution buffer.
Alternatively, the Ni-NTA resin was packed in a simple table column, loaded with the cell extract, washed with the loading buffer, and eluted with elution buffer (no gradient). This way the purification was less efficient, but faster to perform. The fractions containing holoPYP were rigorously dialyzed against 50 mM Trisma base pH 8 before continuing with the next purification step. At this stage the holoPYP usually had a purity index (OD278/OD446) between 0.5 and 0.7, where a purity index below 0.5 is considered pure.
In the second purification step an anion exchange column (Resource Q, 6 ml, from Amersham Biosciences) was used with a flow rate of 1 ml·min-1, a 10 mM Trizma base pH 8 loading buffer, and a 10 mM Trizma base pH 8 plus 1 M sodium chloride elution buffer. After removal of inorganic phosphate from the pooled holoPYP fractions, the holoPYP was loaded onto the anion exchange column and washed with loading buffer. Pure holoPYP was obtained using an the following elution gradient: from 0 to 9% elution buffer in 4.5 ml, from 9 to 12% elution buffer in 45 ml, from 12 to 50% elution buffer in 38 ml, from 50 to 100% elution buffer in 25 ml, and finally washing with 17.5 ml elution buffer. The thus obtained holoPYP with a purity index <0.5 still contains the His-tag.
1.3 Removal of the His-tag
HoloPYP with a purity index ≤ 0.55, was dialyzed against 50 mM Trizma base pH 7.5 and concentrated to a volume smaller than 2 ml. 1 μg enterokinase (from Boehringer Mannheim) per mg holoPYP was added and left to react overnight at 37°C. The enzymatic reaction was quenched by placing the mixture on ice. Any holoPYP still containing a His-tag was then removed using a Ni-NTA resin table column, to which His-tag free holoPYP does not bind. The His-tag free holoPYP was then purified using an anion exchange column as described in section 1.2. Though, the obtained holoPYP without His-tag with a purity index <0.5 is suitable for most experiments, an additional purification step using gel filtration (column: Superdex 75 HR 10/30 from Amersham Biosciences) is necessary when the holoPYP is to be used for crystallization.

Chapter 2 Proton uptake / release
2 Proton uptake / release
Of the 125 amino acids that make the Photoactive Yellow Protein (PYP), 42 can change their protonation state (including the chromophore). There are three functional groups, that are able to change their protonation state, that can be distinguished here. The carboxylic acid group (–COOH), of which PYP has 20 (1 C-terminus, 12 Asp and 7 Glu), groups with a protonatable nitrogen (–NH3
+, –NH+=, =NH2+), of which PYP has
16 (1 N-terminus, 2 His, 11 Lys, 2 Arg), and the phenol group (Ar–OH), of which PYP has 6 (5 Tyr, 1 Chromophore). Note that the amide group (–CONH2) is not considered able to change its protonation state (i.e. no pKa’s are available for the amide group in the amino acids Gln and Asn). In an analysis of the ground state structure of PYP (crystal structure, PDB ID: 2PHY (Borgstahl et al. 1995)), where a sphere the size of a water molecule is used to probe the surface of the protein, it was concluded that 10 of the 42 groups, able to change their protonation state, are buried. The residues involved are the chromophore, Arg52, Asp34, Glu12, Glu46, His108, Lys110, Tyr42, Tyr94, and Tyr118. As these residues are buried, the pKa of these residues may deviate significantly from that of their exposed variants. E.g. the phenolic group of the chromophore is expected to have a pKa of 8.7 (see Chapter 3 section 3) but actually has a pKa of 2.7 (Hoff et al. 1997a) and is therefore deprotonated around pH 7, not protonated. Exposed glutamic acid normally has a pKa around 4.1 (Weast 1988), but around pH 7, Glu46 in PYP is protonated, not deprotonated. When the surroundings of the buried residues change as a result of structural change, the pKa of these residues could change. E.g. in the ground state, pG, the chromophore has a pKa of 2.7 (Hoff et al. 1997a), but in pB this pKa has shifted to 10 (see Chapter 3 section 3). As such, the titration behavior of these residues may differ between the different photocycle intermediates. Taking the chromophore as an example, at pH 7 the chromophore is deprotonated in pG, but protonated in pB. Because of this one might expect that a proton would be absorbed by PYP upon formation of pB.
Indeed, in previous studies it was shown that upon formation of pB a proton is absorbed (Meyer et al. 1993; Genick et al. 1997a). This was measured via time-resolved absorption changes of the pH-indicator bromocresol purple at pH 6. Though it then seems straightforward to conclude that the observed proton absorption is caused by protonation of the chromophore by solvent, this is not the case. As mentioned before, there are 10 residues in PYP that are buried and are able to change their protonation state. FTIR measurements have shown that upon formation of pB, Glu46 changes its protonation state simultaneously with the chromophore (Xie et al. 2001). As Glu46 is hydrogen bonded to the chromophore, it is therefore more likely that Glu46 donates its proton to the chromophore upon formation of pB. Therefore, no net protonation change is expected when only Glu46 and the chromophore are considered. One of the shortcomings of the reported studies with the pH-indicator bromocresol purple (Meyer et al. 1993; Genick et al. 1997a), is that no control experiments where presented in the presence of buffer. Therefore it is possible that the observed transient absorption change is not caused by a pH change, but e.g. by transient binding of bromocresol purple to PYP. Then again, there are 8 other buried residues that may change their protonation state upon formation of pB. Here, residues that may become buried upon formation of pB are not considered.
To further study the possible protonation changes upon formation of pB, we have measured the net change in proton content upon formation of pB over a large pH range. We repeated the experiment with the pH-indicator bromocresol purple at pH 6 and also used the pH-indicator cresol red at pH 8. However, the use of pH-indicators is cumbersome and limiting for a study in a large pH range. We therefore turned to a technique successfully used to monitor proton binding by purple membranes, i.e. a regular pH electrode is used to monitor transient protonation changes (Renthal 1977). As these techniques are limited to detecting net protonation changes, we also studied two mutants, His108Phe and Glu46Gln, to obtain more detailed information.
48
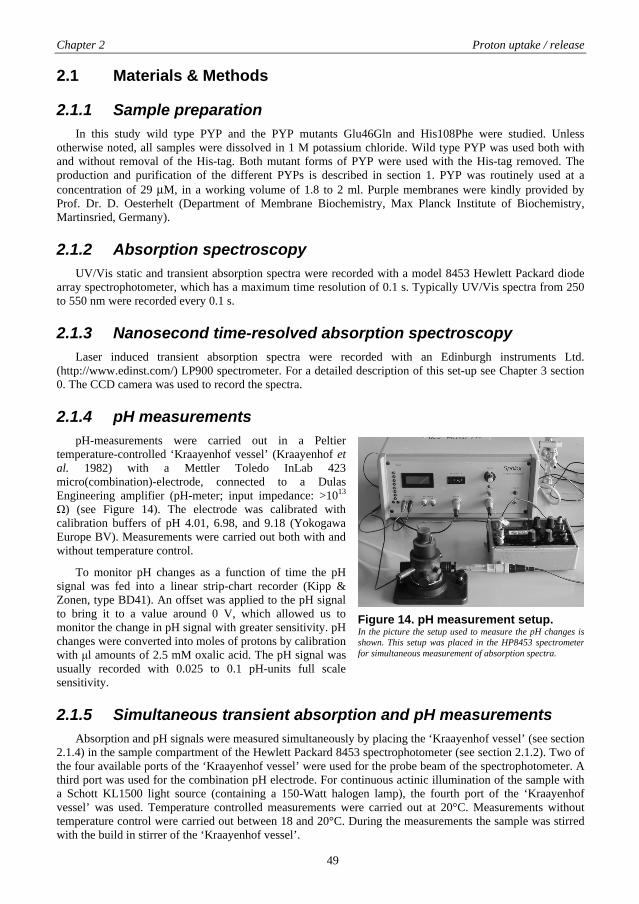
Chapter 2 Proton uptake / release
2.1 Materials & Methods
2.1.1 Sample preparation
In this study wild type PYP and the PYP mutants Glu46Gln and His108Phe were studied. Unless otherwise noted, all samples were dissolved in 1 M potassium chloride. Wild type PYP was used both with and without removal of the His-tag. Both mutant forms of PYP were used with the His-tag removed. The production and purification of the different PYPs is described in section 1. PYP was routinely used at a concentration of 29 μM, in a working volume of 1.8 to 2 ml. Purple membranes were kindly provided by Prof. Dr. D. Oesterhelt (Department of Membrane Biochemistry, Max Planck Institute of Biochemistry, Martinsried, Germany).
2.1.2 Absorption spectroscopy
UV/Vis static and transient absorption spectra were recorded with a model 8453 Hewlett Packard diode array spectrophotometer, which has a maximum time resolution of 0.1 s. Typically UV/Vis spectra from 250 to 550 nm were recorded every 0.1 s.
2.1.3 Nanosecond time-resolved absorption spectroscopy
Laser induced transient absorption spectra were recorded with an Edinburgh instruments Ltd. (http://www.edinst.com/) LP900 spectrometer. For a detailed description of this set-up see Chapter 3 section 0. The CCD camera was used to record the spectra.
2.1.4 pH measurements
pH-measurements were carried out in a Peltier temperature-controlled ‘Kraayenhof vessel’ (Kraayenhof et al. 1982) with a Mettler Toledo InLab 423 micro(combination)-electrode, connected to a Dulas Engineering amplifier (pH-meter; input impedance: >1013 Ω) (see Figure 14). The electrode was calibrated with calibration buffers of pH 4.01, 6.98, and 9.18 (Yokogawa Europe BV). Measurements were carried out both with and without temperature control.
To monitor pH changes as a function of time the pH signal was fed into a linear strip-chart recorder (Kipp & Zonen, type BD41). An offset was applied to the pH signal to bring it to a value around 0 V, which allowed us to monitor the change in pH signal with greater sensitivity. pH changes were converted into moles of protons by calibration with μl amounts of 2.5 mM oxalic acid. The pH signal was usually recorded with 0.025 to 0.1 pH-units full scale sensitivity.
Figure 14. pH measurement setup. In the picture the setup used to measure the pH changes is shown. This setup was placed in the HP8453 spectrometer for simultaneous measurement of absorption spectra.
2.1.5 Simultaneous transient absorption and pH measurements
Absorption and pH signals were measured simultaneously by placing the ‘Kraayenhof vessel’ (see section 2.1.4) in the sample compartment of the Hewlett Packard 8453 spectrophotometer (see section 2.1.2). Two of the four available ports of the ‘Kraayenhof vessel’ were used for the probe beam of the spectrophotometer. A third port was used for the combination pH electrode. For continuous actinic illumination of the sample with a Schott KL1500 light source (containing a 150-Watt halogen lamp), the fourth port of the ‘Kraayenhof vessel’ was used. Temperature controlled measurements were carried out at 20°C. Measurements without temperature control were carried out between 18 and 20°C. During the measurements the sample was stirred with the build in stirrer of the ‘Kraayenhof vessel’.
49

Chapter 2 Proton uptake / release
2.2 Results
2.2.1 Protonation change observed with pH-indicators
An unbuffered solution (1 M KCl) of PYP with the His-tag removed (~13 μM; OD446 ~0.6) and the pH-indicator bromocresol purple (~100 μM) was prepared containing a pH of ~6. Laser induced difference absorption spectra were recorded with delays of 61 μs, 3.9 ms, 250 ms, and 1 s (see Figure 15 a). Any transient pH changes can be observed above 520 nm where none of the PYP transients absorb on the
nanosecond to second time scale and only changes in absorption of the pH-indicator are observed. After 61 μs only pR is present and no pB is formed yet. At this point no changes in pH are observed. Beyond 3.9 ms pB is present in various amounts, as indicated by the bleach signal around 435 nm (due to a calibration error, the pG absorption maximum appears at 435 nm in these measurements not 446 nm). The absorption change induced by a change in pH was calibrated by adding 10 nmol protons, using a 2.5 mM oxalic acid solution, to the sample (see Figure 15 a). The number of protons absorbed by PYP were then determined from the signal at 592 nm. The amount of pB present at the different time points was determined from the pG bleach signal at 435 nm, taking into account the amount of absorption change induced by the indicator at this wavelength. For the signal at 61 μs it was not possible to determine the amount of pB present due to overlap of the absorption spectra of pG and pR. By combining this information, the number of protons absorbed per pB molecule formed was found to be ~0.3 (see Table 7). This corresponds fairly well with the published value of ~0.4 (Meyer et al. 1993) for a protein to bromocresol purple ratio of ~0.13, which was used in our study. As indicated by the experiment performed in the presence of 50 mM 2-(N-Morpholino)ethanesulfonic acid (MES) buffer (see inset Figure 15 a), the absorption change of the pH-indicator is mostly due to the change in pH and contains very little contribution due to transient binding of bromocresol purple. The experiment was repeated at pH 8, replacing the pH-indicator bromocresol purple with cresol red (~100 μM). Interestingly, no clear absorption change as a result of a pH change could be observed (see Figure 15 b).
Figure 15. Reversible protonation of PYP, as studied with Laser-induced transient absorption spectroscopy. Difference absorption spectra are shown for PYP samples (12 μM) in unbuffered solution containing 1 M KCl and either 100 μM bromocresol purple at pH 6 (panel a) or 100 μM cresol red at pH 8 (panel b). For the spectrum in the inset of panel a, 50 mM MES buffer (2-[N-Morpholino]-ethanesulfonic acid; pH = 6) was added. Laser-induced transient absorbance spectra were recorded in the indicated wavelength region after: (1): 61 μs; (2): 3.9 ms; (3) 250 ms and (4): 1 s. The asterisk (*) refers to a calibration experiment in which the difference (bromocresol purple, ΔA595; cresol red ΔA575) spectrum is recorded, induced by the addition of 10 nmol protons (using 2.5 mM oxalic acid).
Table 7. Proton absorption at pH 6 followed with bromocresol purple The data represented in Figure 15 a was used to calculate the values in this table. The concentration of pB ([pB]) that is present at a specific time point was determined from the bleach signal at 435 nm (absorption maximum of pG in collected data is 435 nm and not 446 nm, due to a calibration error). No values were calculated for the 61 μs time point, as [pB] formed could not be determined due to overlap of the pG and pR spectrum. The number of protons absorbed (# H abs.) was determined from the absorption difference at 592 nm, using the calibration difference spectrum, obtained by adding 10 nmol protons, as reference. For the used protein to bromocresol purple ratio of ~0.13 a [pB] to # H abs. ratio of 0.4 is expected (Meyer et al. 1993).
Time point [pB] (μM) # H abs. [pB]/# H abs. 3.9 ms 3.0 9.6 0.31 250 ms 2.5 8.3 0.30
1 s 1.7 4.3 0.39
50
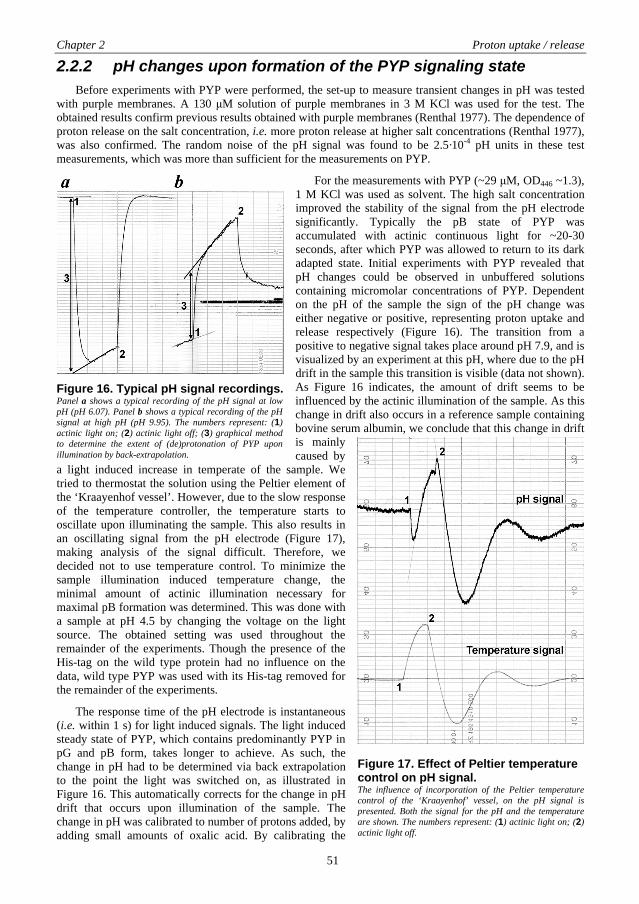
Chapter 2 Proton uptake / release
2.2.2 pH changes upon formation of the PYP signaling state
Before experiments with PYP were performed, the set-up to measure transient changes in pH was tested with purple membranes. A 130 μM solution of purple membranes in 3 M KCl was used for the test. The obtained results confirm previous results obtained with purple membranes (Renthal 1977). The dependence of proton release on the salt concentration, i.e. more proton release at higher salt concentrations (Renthal 1977), was also confirmed. The random noise of the pH signal was found to be 2.5·10-4 pH units in these test measurements, which was more than sufficient for the measurements on PYP.
For the measurements with PYP (~29 μM, OD446 ~1.3), 1 M KCl was used as solvent. The high salt concentration improved the stability of the signal from the pH electrode significantly. Typically the pB state of PYP was accumulated with actinic continuous light for ~20-30 seconds, after which PYP was allowed to return to its dark adapted state. Initial experiments with PYP revealed that pH changes could be observed in unbuffered solutions containing micromolar concentrations of PYP. Dependent on the pH of the sample the sign of the pH change was either negative or positive, representing proton uptake and release respectively (Figure 16). The transition from a positive to negative signal takes place around pH 7.9, and is visualized by an experiment at this pH, where due to the pH drift in the sample this transition is visible (data not shown). As Figure 16 indicates, the amount of drift seems to be influenced by the actinic illumination of the sample. As this change in drift also occurs in a reference sample containing bovine serum albumin, we conclude that this change in drift is mainly caused by
a light induced increase in temperate of the sample. We tried to thermostat the solution using the Peltier element of the ‘Kraayenhof vessel’. However, due to the slow response of the temperature controller, the temperature starts to oscillate upon illuminating the sample. This also results in an oscillating signal from the pH electrode (Figure 17), making analysis of the signal difficult. Therefore, we decided not to use temperature control. To minimize the sample illumination induced temperature change, the minimal amount of actinic illumination necessary for maximal pB formation was determined. This was done with a sample at pH 4.5 by changing the voltage on the light source. The obtained setting was used throughout the remainder of the experiments. Though the presence of the His-tag on the wild type protein had no influence on the data, wild type PYP was used with its His-tag removed for the remainder of the experiments.
The response time
Figure 16. Typical pH signal recordings.Panel a shows a typical recording of the pH signal at low pH (pH 6.07). Panel b shows a typical recording of the pH signal at high pH (pH 9.95). The numbers represent: (1) actinic light on; (2) actinic light off; (3) graphical method to determine the extent of (de)protonation of PYP upon illumination by back-extrapolation.
of the pH electrode is instantaneous (i.e. within 1 s) for light induced signals. The light induced steady state of PYP, which contains predominantly PYP in pG and pB form, takes longer to achieve. As such, the change in pH had to be determined via back extrapolation to the point the light was switched on, as illustrated in Figure 16. This automatically corrects for the change in pH drift that occurs upon illumination of the sample. The change in pH was calibrated to number of protons added, by adding small amounts of oxalic acid. By calibrating the
Figure 17. Effect of Peltier temperature control on pH signal. The influence of incorporation of the Peltier temperature control of the ‘Kraayenhof’ vessel, on the pH signal is presented. Both the signal for the pH and the temperature are shown. The numbers represent: (1) actinic light on; (2) actinic light off.
51

Chapter 2 Proton uptake / release
signal after each measurement, differences in buffering capacity of the PYP solution at different pH values had no influence on the data.
Changes in pH as a result of pB formation were recorded in the pH range 4 to 11. Outside this range measurement conditions are unfavourable. Below pH 4 significant amounts of pBdark are formed (Hoff et al. 1997a). Above pH 11 the thiol ester linkage of the chromophore starts to hydrolyse at a significant rate (Hoff et al. 1996). Simultaneous with the pH signal, the absorption spectra of the PYP solution were recorded (from 250 to 550 nm) with 100 ms intervals. Here, continuous actinic illumination of the sample at a 90° angle to the probe beam of the spectrometer, had no negative influence on the recording of the absorption spectra. An example of a typical measurement, where both the pH signal and absorption spectrum are recorded, is shown in Figure 18 (only the absorption at 446 nm is shown). From the obtained spectra the amount of pB formed could be calculated (see section 0). Combining the information from the pH signal and absorption spectra, the amount of protons absorbed by the pB state of PYP can be plotted as function of pH (see Figure 19 a, dots). Negative values indicate proton release. Using Equation 1 (based on the Henderson-Hasselbalch equation), a fit through the data points was made. Here A0 is an offset value. Ai ,pKi , and ni are the amplitude, pKa, and cooperativity constant of the ith Henderson Hasselbalch equation respectively. It is evident that at low pH protons are absorbed by pB. Around pH 7.9 the net change in proton content of PYP is almost zero. This transition to no change in proton content occurs with a pKa of 6.6. Above pH 7.9 protons are released upon formation of pB. This transition from no change in proton content to release of protons occurs with a pKa of > 10. Where the number of protons absorbed by pB does not seem to exceed 1, the amount of protons released at high pH can number 2 or more.
Figure 18. Simultaneous recording of pH signal and UV/Vis spectra. Overlay of a recorded pH signal with the simultaneously recorded UV/Vis spectra (only a trace of the absorption at 446 nm is shown). The numbers (1) and (2) respectively indicate turning on and off the actinic illumination of the sample. The numbers (4a) and (4b) indicate addition of 10 and 20 nmol protons, respectively.
=
− ++=
10 110i
pHpKni
ii
AASignal )( Equation 1
2.2.3 pH changes in mutant PYP
The pKa of 6.6 observed for the wild type protein, would suggest that a Histidine residue, which typically has a pKa around 6.1 (Weast 1988), is possibly involved. PYP contains two Histidine residues, one at position 3 and one at position 108. Of these two Histidine residues, only His108 is buried in the ground state fold of PYP. As such, we selected His108 as a target for further study. The His108 was replaced by Phenylalanine and the net transient proton uptake/release of this mutant was determined and compared with that of wild type PYP (see Figure 19 a). The curves differ markedly at low pH. Where the observed pKa has shifted from 6.6 in wild type PYP to ~5.5 in the His108Phe mutant. The transition from net proton uptake to net proton release occurs at approximately the same point (pH 7.9). At pH values higher than 7.9, the two curves more or less overlap.
For the protonation of the chromophore upon formation of pB, two possibilities have been suggested. One, the chromophore is protonated by solvent (Genick et al. 1997b). Two, Glu46 donates its proton to the chromophore (Xie et al. 1996). By determining the net transient proton uptake/release of a mutant in Glu46, and comparing it with that of wild type PYP, a distinction between these two mechanisms should be possible. As such, we determined the net transient proton uptake/release of the Glu46Gln mutant, an often used mutant in PYP studies (see Chapter 1 Table 5). However, it was only possible to cover the pH range from ~5.5 to ~7.5 for this mutant. Below pH ~5.5 significant amounts of pBdark were present (pKa for pBdark formation is ~4.2), and above pH ~7.5 we were not able to accumulate a significant amount of pB in the light induced steady state. Due to the small pH range it was not possible to confidently determine pKa values for changes in
52

Chapter 2 Proton uptake / release
net proton uptake/release behavior. It appears though that the Gly46Gln mutant differs from wild type PYP mostly around neutral pH and not at low pH.
Figure 19. Proton uptake and release upon pB formation. The net number of protons absorbed per pB molecule formed is plotted as function of pH. In panel a, wild type (dot) and His108Phe (star) PYP are compared. In panel b, wild type (dot) and Glu46Gln (diamond) PYP are compared. Simulated curves are shown as solid lines. The simulated curves are made up of one or more Henderson-Hasselbalch curves (see text and Equation 1). For wild type PYP, pKa 6.6, 10 and 10.5; n 1.1, 0.74 and 0.7; A –1.0, –1, –2.1 were used respectively. Here the pKa of 10 (including n and A values) was forced representing chromophore deprotonation (see Chapter 3 section 3). For His180Phe, pKa 5.4 and 9.7; n 0.7 and 1.2; A –1 and –2.1 were used respectively. For Glu46Gln pKa 7.5; n 1.8; A –1.1 were used.
2.2.4 Determination of the concentration of pB
As mentioned in section 2.2.2, absorption spectra were recorded simultaneously with the pH electrode signal. From these spectra the amount of pB accumulated in the light induced steady state can be determined. This steady state can be considered as a light induced equilibrium between pG and pB. Any other forms of PYP are not accumulated in significant amounts. Since for pG the molar extinction coefficient is known, it is most practical to determine the amount of pG that has bleached. This should be equal to the amount of pB formed in the light induced steady state. Under most circumstances pB does not absorb at the absorption maximum, 446 nm, of pG. Therefore from the amount of bleach at 446 nm the percentage pB that is formed in the light induced equilibrium can be determined, as shown in Equation 2. Here the superscripts l and d of the absorbance at 446 nm, A446, denote absorption for the light induced steady state and the dark adapted ground state respectively.
1001pB446
446 ⋅
−=
d
l
A
A(%) Equation 2
However, at high pH the absorption spectrum of pB changes dramatically and the absorption band around 360 nm is replaced by one around 430 nm (Figure 20 a). This transition occurs with a characteristic pKa of 10 with a cooperativity constant n of 0.74 (see Chapter 3 section 3). The absorption band around 430 nm also absorbs at 446 nm, which is not corrected for in Equation 2. As such formula (1) underestimates the amount of pB formed at pH values above ~9. At the time of publication of these data (Hendriks et al. 1999b), we were not able to make a proper correction for pB absorption at 446 nm above pH ~9. However, in the mean time, new software has become available to us, which enables us to make the proper correction. The amount of pB formed was therefore recalculated. For this the difference spectra of the light induced steady state were determined by subtracting the dark adapted spectrum from the light induced steady state spectrum. Several skewed Gaussians were then fitted onto these difference spectra. The ground state can be simulated quite well by two skewed Gaussians with maxima at 425 and 452.4 nm respectively (see Chapter 3 section 3). The shape of this ground state simulation was determined by a global fit of a selection of difference spectra over the entire measured pH range. This shape was then used to determine the amount of pG bleach, and thus the amount of pB, from the difference spectra. The pB spectrum was fitted by one skewed Gaussian below pH 9 and with two skewed Gaussians above pH 9. The difference between the two methods for determining the amount of pB formed in the light induced steady state is visualized in Figure 20 b. It is clear that the first method, seriously underestimates the amount of pB formed above pH 9. The values for the amount of pB formed in the light induced signaling state obtained with the new method, were used to calculate the amount
53

Chapter 2 Proton uptake / release
of protons absorbed or released upon formation of pB. Where with the old calculation ~3 protons were released at pH 10.5 for wild type PYP, the new calculation shows that actually only ~1.5 protons are released at this pH.
Figure 20. Accumulation of pB. In panel a the pB absorption spectra for wild type PYP in the light induced steady state at pH 5.52 (solid) and pH 10.47 (dashed) are shown. Absorbance is relative to that of pG (1 at absorption maximum, 446 nm). In panel b the difference is illustrated between determining the percentage pB accumulated in the light induced steady state via two methods. By using Equation 2 (circles), also used in publication (Hendriks et al. 1999b). And by fitting multiple skewed Gaussians (stars) onto the, steady state - minus - dark, difference spectra (see text). Data from wild type PYP is shown with closed symbols, data from the His108Phe mutant is shown with open symbols.
For the mutant His108Phe, the same procedures as for wild type PYP were used. The absorption maximum of the His108Phe mutant also lies at 446 nm. The extinction coefficient of wild type PYP was used to calculate the amount of pB present. Again, above pH 9 the new method shows that the simple method significantly underestimated the amount of pB present (see Figure 20 b). Also, the pH dependence of pB accumulation is different for the His108Phe mutant, which indicates that the pH dependent kinetics of the mutant differ from that of wild type PYP. For the mutant Glu46Gln, only the simple method for determining the amount of pB accumulated was used, as no data above pH 9 was recorded. The absorption maximum of the Glu46Gln mutant lies at 462 nm (Genick et al. 1997a). This wavelength was then also used to determine the amount of pB formed, here the extinction coefficient of wild type PYP (at 446 nm) was used to calculate the amount of pB present.
2.3 Discussion
The pH-indicator bromocresol purple was used to monitor transient pH changes during the photocycle of PYP at pH 6. The results obtained confirm results obtained in previous studies (Meyer et al. 1993; Genick et al. 1997a), i.e. the pH increases upon formation of pB indicating net proton uptake. Unlike the earlier studies, we also performed a control experiment in the presence of buffer (see inset Figure 15 a). As the transient pH signal disappeared in the presence of buffer, we can say that the observed transient pH signal is indeed a result of a pH change and is not due to transient binding of the bromocresol red pH-indicator. We also used the pH-indicator cresol red to monitor pH changes at pH 8. At this pH we observed no transient pH signal (see Figure 15 b). This is evidence that transient pH changes in PYP are pH dependent. To find enough suitable pH-indicators to cover a large pH range is difficult, as pH-indicators are only applicable in small pH ranges. Also, for each pH-indicator an optimal PYP to pH-indicator ratio needs to be determined, if conclusions about the size of the transient pH signals are to be drawn. E.g. our experiment with bromocresol red suggest that ~0.3 protons are absorbed by PYP upon formation of pB at pH 6, while in actuality a signal of ~0.9 is expected (see Figure 19 a). However, if a PYP to bromocresol purple ratio of <0.02 was used instead of ~0.13 the signal would have been ~0.9 (see Fig. 3 of (Meyer et al. 1993)). As such, it would be very cumbersome and time consuming to monitor transient pH changes over a large pH range with pH-indicator dyes. It is much more convenient to measure the transient pH changes with a pH-electrode, as was also done with bacteriorhodopsin (Renthal 1977).
With the pH-indicator experiment the light pulse that drives PYP into its photocycle can be very short (6 ns in our experiments). The response of the pH-indicator to a pH change is diffusion limited and as such can be considered immediate on a μs time-scale. Also, a pH-indicator can detect local changes in pH in the immediate vicinity of PYP molecules. A pH-electrode only monitors the local pH around the pH-electrode.
54

Chapter 2 Proton uptake / release
Taking into account that a representative pH difference signal has to be obtained, the response time of the pH-electrode to monitor changes in pH is much longer. Therefore a different strategy has to be used. By producing a steady state mixture of pG and pB using continuous actinic light irradiation and stirring the solution, a representative pH difference signal can be obtained using a pH-electrode. By not using a pH-indicator it is also easier to determine the amount of pB that is produced during the experiment, as the PYP absorption bands used to determine the amount of pB are not masked by overlapping absorption bands of the pH-indicator.
In the original publication of this work (Hendriks et al. 1999b) a simple method was used to determine the amount of pB formed. Though this method works fine below pH 9 for wild type PYP, above pH 9 this simple method underestimates the amount of pB formed (see Figure 20 b). Recently we have been able to use a more complicated method to determine the amount of pB formed, taking into account changes of the pB absorption spectrum that occur above pH 9 (see Figure 20 a). We have used the values obtained with the more complicated method for determining the amount of pB formed to determine the number of proton uptake per pB formed. Compared with the published analysis, only the values above pH 9 are influenced.
When we take a look at the pH dependence of net proton uptake per pB formed (see Figure 19 a) it is clear that at low pH a net proton uptake and at high pH a net proton release occurs. Around pH 7.9 little net change in proton content of PYP occurs. The transition from no net protonation change to net proton uptake occurs with a characteristic pKa of 6.6. Here a maximum net proton uptake of ~1 is achieved with a cooperativity constant n of 1.1 for the Henderson-Hasselbalch curve representing this part of the curve. It therefore seems that this characteristic is caused by one residue and one proton. Assuming this residue is buried in pG and becomes exposed in pB, the most likely candidate for this residue is His108, as His108 is buried in pG and an exposed Histidine is expected to have a pKa of ~6.1. The pKa of His108 in pG must then be smaller than 6.6. With regard to the proton release at high pH, we know that the chromophore has a pKa of 10 with n 0.74 in pB (see Chapter 3 section 3) and a pKa of 2.7 in pG (Hoff et al. 1997a). Therefore a net proton release of 1 proton with a characteristic pKa of 10 and n 0.74 is expected to occur. As shown in Figure 19 a incorporation of this information into the simulated curve of the wild type PYP data fits well. The remainder of the proton release signal then has a pKa >10.5 and an amplitude of at least 2 protons. Residues that are candidates for this latter proton release signal are Lys110, Tyr42, Tyr94, and Tyr118, which are buried in pG. The pKa of these residues would then have to be higher than 10.5 in pG. It is assumed here that the residues causing the proton release signal become exposed in pB, and therefore have a pKa in pB similar to that of the exposed form of that residue (pKa of exposed Lys is ~10.5, pKa of exposed Tyr is ~10.1 (Weast 1988)). At pH 4 the proton uptake signal seems to increase again, indicating involvement of a residue with a pKa ~4 in pB. The pKa of this residue must be smaller in pG. Candidates, are Asp34, Glu12, and Glu46 (pKa of exposed Glu is ~4.1, pKa of exposed Asp is ~3.9 (Weast 1988)). Glu46 is a special case, as we know the pKa of this residue is much higher than 4.1 in pG as it is still protonated at neutral pH and would therefore not qualify as a candidate. However, Glu46 donates its proton to the chromophore upon formation of pB (Xie et al. 1996), which allows it to be involved in a proton uptake event. It is interesting to note here that Glu12 and Lys110 are in close proximity to each other in pG, and seem to connect the N-terminal region and the central β-sheet via an ionic bond (distance between Oε,2 of Glu12 and Nζ of Lys110 is 3.61 Å). A pKa higher than 10.5 for Lys110 suggests it would have a positive charge at most pH values. A pKa lower than 4.1 for Glu12 suggests it would have a negative charge at most pH values. The buried positive charge of Lys110 and buried negative charge of Glu12 would then cancel each other and allow these residues to be buried in the protein while having a charge.
Based on the pKa of 6.6 observed in the above analysis, we also determined the net protonation change upon formation of pB for the mutant His108Phe (see Figure 19 a). In this mutant residue 108 is no longer able to change its protonation state. The characteristic proton release at high pH seems more or less identical for both wild type PYP and the His108Phe mutant. However, proton uptake at low pH, though still present is affected by the mutation. The characteristic pKa of 6.6 in wild type PYP has shifted to ~5.5 in the His108Phe mutant. It therefore seems that at least part of the proton uptake observed at low pH in wild type PYP is caused by His108. Also, His108 is not the only residue responsible for this proton uptake at low pH. An additional residue, with a pKa of ~5.5 in pB, is also involved. As the net proton uptake in wild type PYP does not exceed 1 around pH 5.5, it would seem that the pKa of H108 in pG is also ~5.5. Alternatively, protonation of the residue with pKa ~5.5 could influence structural change of the protein in such a way as not to expose His108 anymore. In wild type PYP the net proton uptake does seem to exceed 1 above pH 4.5, maybe indicating a different pKa of the additional residue in the pB form of wild type PYP and the His108Phe
55
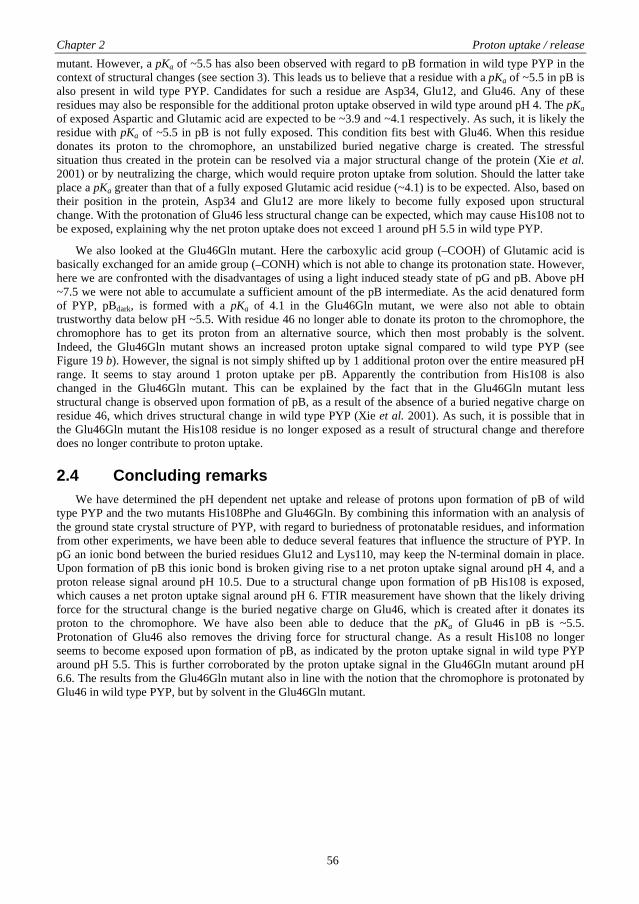
Chapter 2 Proton uptake / release
56
mutant. However, a pKa of ~5.5 has also been observed with regard to pB formation in wild type PYP in the context of structural changes (see section 3). This leads us to believe that a residue with a pKa of ~5.5 in pB is also present in wild type PYP. Candidates for such a residue are Asp34, Glu12, and Glu46. Any of these residues may also be responsible for the additional proton uptake observed in wild type around pH 4. The pKa of exposed Aspartic and Glutamic acid are expected to be ~3.9 and ~4.1 respectively. As such, it is likely the residue with pKa of ~5.5 in pB is not fully exposed. This condition fits best with Glu46. When this residue donates its proton to the chromophore, an unstabilized buried negative charge is created. The stressful situation thus created in the protein can be resolved via a major structural change of the protein (Xie et al. 2001) or by neutralizing the charge, which would require proton uptake from solution. Should the latter take place a pKa greater than that of a fully exposed Glutamic acid residue (~4.1) is to be expected. Also, based on their position in the protein, Asp34 and Glu12 are more likely to become fully exposed upon structural change. With the protonation of Glu46 less structural change can be expected, which may cause His108 not to be exposed, explaining why the net proton uptake does not exceed 1 around pH 5.5 in wild type PYP.
We also looked at the Glu46Gln mutant. Here the carboxylic acid group (–COOH) of Glutamic acid is basically exchanged for an amide group (–CONH) which is not able to change its protonation state. However, here we are confronted with the disadvantages of using a light induced steady state of pG and pB. Above pH ~7.5 we were not able to accumulate a sufficient amount of the pB intermediate. As the acid denatured form of PYP, pBdark, is formed with a pKa of 4.1 in the Glu46Gln mutant, we were also not able to obtain trustworthy data below pH ~5.5. With residue 46 no longer able to donate its proton to the chromophore, the chromophore has to get its proton from an alternative source, which then most probably is the solvent. Indeed, the Glu46Gln mutant shows an increased proton uptake signal compared to wild type PYP (see Figure 19 b). However, the signal is not simply shifted up by 1 additional proton over the entire measured pH range. It seems to stay around 1 proton uptake per pB. Apparently the contribution from His108 is also changed in the Glu46Gln mutant. This can be explained by the fact that in the Glu46Gln mutant less structural change is observed upon formation of pB, as a result of the absence of a buried negative charge on residue 46, which drives structural change in wild type PYP (Xie et al. 2001). As such, it is possible that in the Glu46Gln mutant the His108 residue is no longer exposed as a result of structural change and therefore does no longer contribute to proton uptake.
2.4 Concluding remarks
We have determined the pH dependent net uptake and release of protons upon formation of pB of wild type PYP and the two mutants His108Phe and Glu46Gln. By combining this information with an analysis of the ground state crystal structure of PYP, with regard to buriedness of protonatable residues, and information from other experiments, we have been able to deduce several features that influence the structure of PYP. In pG an ionic bond between the buried residues Glu12 and Lys110, may keep the N-terminal domain in place. Upon formation of pB this ionic bond is broken giving rise to a net proton uptake signal around pH 4, and a proton release signal around pH 10.5. Due to a structural change upon formation of pB His108 is exposed, which causes a net proton uptake signal around pH 6. FTIR measurement have shown that the likely driving force for the structural change is the buried negative charge on Glu46, which is created after it donates its proton to the chromophore. We have also been able to deduce that the pKa of Glu46 in pB is ~5.5. Protonation of Glu46 also removes the driving force for structural change. As a result His108 no longer seems to become exposed upon formation of pB, as indicated by the proton uptake signal in wild type PYP around pH 5.5. This is further corroborated by the proton uptake signal in the Glu46Gln mutant around pH 6.6. The results from the Glu46Gln mutant also in line with the notion that the chromophore is protonated by Glu46 in wild type PYP, but by solvent in the Glu46Gln mutant.

Chapter 2 Nile Red probe binding
3 Nile Red probe binding
The Photoactive Yellow Protein (PYP) is highly water soluble. Hydrophobic parts of the protein will therefore largely be buried inside the protein when it is in its ground state. Indeed, when the buriedness of the side chains of the hydrophobic residues Ala, Leu, Ile, Phe, Trp, Tyr, and Met (total of 50 residues) is determined in the PYP crystal structure (PDB ID: 2PHY (Borgstahl et al. 1995)), 56% of these residues is fully buried, 24% partly buried, and 20% exposed. Here the majority of the partly buried and exposed residues consist of Ala, Phe, Tyr, and Met, all residues that are either small (Ala), aromatic and thus polarizable (Phe and Tyr), or slightly polar (Met). It is therefore not surprising that when a structural change occurs in the protein upon formation of pB, at least some of these buried hydrophobic residues become exposed. Evidence for the exposure of hydrophobic residues stems from kinetic studies in solvents of different polarity (Meyer et al. 1989), kinetic studies in the presence of denaturant (Meyer et al. 1987; Lee et al. 2001a), and kinetic temperature dependence studies (van Brederode et al. 1996). In this latter study, the non-Arrhenius behavior of the pB to pG recovery reaction was explained via a model used in protein folding studies. Here the exposure of hydrophobic contact surface influences the heat capacity of the protein, which results in the non-Arrhenius behavior. A subsequent study with N-terminally truncated versions of PYP (van der Horst et al. 2001), showed that the N-terminus plays an important part in the non-Arrhenius behavior, as it almost completely disappeared when residues 1 thru 25 are deleted from PYP.
To further study the characteristics of unfolding in PYP several techniques have been used. NMR experiments (Craven et al. 2000) have identified two areas in PYP where structural changes in the PYP backbone occur upon formation of pB, and one where they do not occur. One area that undergoes structural change is located at the N-terminus (residues 6-18 and 26-29), the other is located around the chromophore binding site (residues 42-58, 69-78 and 95-100). FTIR experiments (Xie et al. 2001) have shown that the chromophore is protonated before large structural changes take place. These experiments have also shown that though structural changes occur in solution, they do not occur in crystals (see also section 4). FTIR experiments in combination with mass spectrometry (Hoff et al. 1999) have shown that ~23% of the amide groups, that were buried in pG, become exposed in the pB state. Circular dichroism has also been applied to study structural changes in PYP (Chen et al. 2002). In combination with Tryptophan fluorescence quenching and fluorescence probe binding, circular dichroism has also been used to argue that the pB state of PYP is a molten globule state (Lee et al. 2001c).
Here we also use fluorescence probe binding to study the structural changes in PYP. However, we use a different probe. The spectroscopic properties of the probe 1-anilinonaphthalene-8-sulfonic acid (ANS), which was used in the other study, overlaps with those of PYP and therefore can interfere in the measurements. In this study we used the probe Nile Red (NR). Its spectroscopic properties do not interfere with those of PYP. We were therefore able to obtain much more detailed information regarding the structural changes in PYP, such as pH dependence and kinetics of structural change. NR is a fluorescent probe that is very sensitive to the local polarity (i.e. its dielectric environment) and can be used to probe hydrophobic surfaces in proteins (Sackett and Wolff 1987). In a polar environment NR has a low fluorescence quantum yield, whereas in more hydrophobic environments its quantum yield increases and its emission maximum becomes progressively blue-shifted (Dutta et al. 1996; Hou et al. 2000). By applying the NR probe not only to wild type PYP but also to the truncation mutant Δ25-PYP, from which residues 1 thru 25 are deleted, we were also able to deduce a possible binding site for NR.
3.1 Materials & Methods
3.1.1 Sample preparation
In this study wild type PYP and a truncated derivative of PYP (Δ25-PYP), with residues 1-25 removed, were used. Both wild type PYP and the truncation mutant were was used without removal of the His-tag. The production and purification of the different PYPs is described in section 1. For most experiments buffered samples containing ~2 μM wild type PYP (OD446 ~0.1) were prepared with a pH of 4.0 (10 mM formic acid), 5.0 (10 mM citric acid), 6.0 ( 10 mM 2-(N-morpholino)ethanesulfonic acid (MES)), 7.0 (10 mM potassium phosphate), 8.0 (10 mM Tris/ HCl), and 9.0 (10 mM boric acid). For Δ25-PYP only samples buffered at pH 5.0 and 8.0 were prepared. Stock solutions of Nile Red (NR) ranging in concentration from 1 to 100 μM were prepared in dimethylsulphoxide (DMSO). Measurements were started 30 s after adding 20 μl of one of the
57

Chapter 2 Nile Red probe binding
NR stock solutions. Because of this procedure all samples contain 1 % (v/v) DMSO. It was necessary to use this procedure because of aggregation and slow adsorption of NR to the walls of the cuvette, resulting in a steady decrease of the concentration of NR in the aqueous solution (Sackett and Wolff 1987). We have tested the stability of NR fluorescence and absorption under our experimental conditions at pH 8.0 and found no significant changes within the first 10 minutes after dilution of NR in to aqueous solution. Consequently, all experiments with NR have been performed within the first 10 minutes after adding NR.
For the laser-flash photolysis experiments a buffered sample containing 1 μM NR and 10 μM wild type PYP (OD446 ~0.5) at pH 8.0 was used. Again, 20 μl of a NR stock solution was added just before the start of the experiment, and samples were not used longer than 10 minutes after adding NR.
3.1.2 Steady state fluorescence spectroscopy
For the steady state fluorescence spectroscopy an AMINCO Bowman Series 2 Luminescence Spectrometer was used. The excitation wavelength was set at 540 nm (bandpass: 16 nm) and the emission was recorded from 555 to 800 nm (bandpass: 4 nm) at a rate of 2 nm/s. To produce a steady state mixture of pG and pB in the PYP sample a 462 nm LED (FWHM: 22 nm) was used to continuously illuminate the sample. The percentage of accumulated pB was pH dependent and ranged from ~25% for neutral pH to ~85% at pH 4.0, which is consistent with the previous study depicted in section 2 (see Figure 20 b).
The fluorescence quantum yield of NR in 10 mM Tris/HCl buffer (pH 8.0), with and without the presence of PYP, was determined by comparing its fluorescence to that of Rhodamine-101 in ethanol (Φfl = 1 (Karstens and Kobe 1980; Eaton 1988)). Both were excited at 540 nm with equal absorption at that wavelength.
3.1.3 Time resolved (ms/s) fluorescence spectroscopy
To monitor the time-dependence of the release of NR from PYP the same spectrofluorimeter was used as for the steady state measurements, but now with the excitation wavelength set at 530 nm (bandpass: 16 nm), while the emission was monitored at 600 nm (bandpass: 4 nm) with a time resolution of 10 ms (a faster time resolution resulted in an unacceptably low signal to noise ratio). Samples were flashed with a photo flashlight (500 μs pulse-width), through a 400 nm long-pass filter, 10 s after the start of the measurement.
3.1.4 Steady state and transient (ms/s) UV/Vis spectroscopy
The actual concentration of PYP in the samples and the amount of pB that is formed upon flash and/or continuous illumination was measured with an HP 8453 UV/Vis diode array spectrophotometer under similar geometric and illumination conditions as the fluorescence measurements described in section 3.1.3. Spectra were collected from 210 to 800 nm with a time resolution of 100 ms.
3.1.5 Laser-flash photolysis spectroscopy
To study details of the NR-binding step we used an Edinburgh instruments Ltd. (http://www.edinst.com/) LP900 spectrometer. For a detailed description of this set-up see Chapter 3 section 1. Although this set-up is optimized for transient UV/Vis spectroscopy, it can also be used to measure emission spectra. The latter were measured with the CCD camera, using an integration time (gate) of 500 μs. The PYP sample was excited with 446 nm laserflashes of 7 to 8 mJ (pulse width 6 ns). The NR probe was excited with a 517 nm LED (FWHM: 40 nm) that continuously illuminated the sample from below. Emission was measured between 550 and 815 nm. For comparison, UV/Vis time traces were measured using the photomultiplier. To study the transition of pR to pB, traces were recorded at 500 nm, a wavelength at which selectively the presence of the pR intermediate can be monitored (Hoff et al. 1994a). Additionally, traces were recorded at 468 nm to also be able to monitor pG recovery.
58

Chapter 2 Nile Red probe binding
3.1.6 Analysis of steady state fluorescence emission data
In order to be able to relate the fluorescence emission data with the amount of NR present in bound and non-bound form, it is important to be able to fit the shape of the overlapping emission peaks accurately. We found that a single Gaussian, Lorentzian, or Voigt function did not give satisfactory fits. Therefore, we designed a new function consisting of multiple Gaussians (multiGauss; see Equation 3) that does give a satisfactory fit (see Figure 21).
iswsiw
isxsix
eAsiA
esiABy
cc
is
siw
sixxn
i
c
⋅+=⋅+=
⋅=
⋅+=
⋅−
−⋅−−
=
33
22
01
),(
),(1
01
),(
),(
),(
),(
1
2
3
221
Equation 3
In this equation B is a baseline correction, n is the number of Gaussians, A is the amplitude, w is the width in cm-1, xc is the peak maximum in cm-1, and s1, s2, and s3 are factors to convert A, w, and xc for the i = 0 Gaussian into the corresponding values for the 0 < i < n Gaussians. A value of 3 for n provided proper fits (Figure 21), and was used throughout the analysis. In the analysis, first the spectra obtained from samples without PYP added were fitted with one multiGauss function to obtain the emission peak shape of NR in aqueous solution. Next, the spectra from samples containing pB were fitted with two multiGauss functions, one for the NR emission from aqueous solution (using the previously determined peak shape), and a second, to fit the emission of NR when bound to pB. This procedure was applied for each pH value separately. In the further analysis two assumptions were made: First, that the quantum yield of NR is constant in the pH range from 4 to 9. Second, that the amount of NR bound to the pG state of PYP is negligible. Tests and literature have confirmed that these assumptions are allowable (data not shown, (Sackett and Wolff 1987)).
Using these assumptions it is possible to convert the emission peak area into the corresponding concentration of NR, using one conversion factor for NR in aqueous solution and one for NR bound to pB, for all the measured data at different pH values. With this procedure the concentrations of NR (free and bound to pB) are directly determined from the emission spectra, thereby circumventing any errors that are introduced during sample preparation, allowing a more accurate comparison between the experiments performed at the different pH values.
3.1.7 Analysis of transient fluorescence emission data
The same data analysis procedure was used for the transient fluorescence emission data as for the analysis of the steady state fluorescence data described in section 3.1.6. However, to be able to correct for differences in NR concentration, introduced during sample preparation, an additional assumption had to be made. The ratio between the factors to convert emission peak area to concentration of NR (for the two types of NR emission) is the same for the two experimental set-ups, i.e. the LP900 transient (fluorescence) spectrometer and the AMINCO Bowman Series 2 Luminescence Spectrometer.
3.2 Results
3.2.1 Steady state and ms time resolved measurements
In order to detect possible differences in structure between the pG and pB state of PYP the fluorescent hydrophobicity probe NR was used to assay binding of this probe to PYP. The absorption band of NR in water (589 nm) is considerably red-shifted with respect to the absorption maximum of PYP (446 nm) and does not significantly overlap with, nor interfere with, the absorption by PYP. This makes NR an ideal candidate as a probe for conformational transitions in PYP. The emission characteristics of NR in aqueous solution and in the presence of PYP, when the protein is in its pG state, are the same within the error of the
59

Chapter 2 Nile Red probe binding
measurement (quantum yields of 0.02 and 0.026, respectively). Also no change in peak maximum, spectral shape or quantum yield are observed between pH 4 and 9 for NR fluorescence. From this it was concluded that binding of NR to the pG state of PYP is negligible.
However, when the pB intermediate was accumulated, by continuous illumination with blue light, a new fluorescent species was observed (see Figure 21). The emission maximum of this species lies at 600 nm, strongly blue-shifted with respect to the NR emission in aqueous solution (659 nm), indicating that an environment with low dielectric constant is sensed by the probe, when bound to the pB state of PYP. Identical observations were made with reconstituted wild type PYP after removal of the His-tag by proteolysis with enterokinase.
Deconvolution of the emission spectrum into emissions resulting from NR in aqueous solution and NR bound to PYP provides us with some of the emission characteristics of NR bound to the pB state of PYP (dashed line in Figure 21). Like the emission of NR in aqueous solution, the shape of the emission from NR bound to pB can be fitted well with a multiGauss function (see section 3.1.6 Equation 3).
The recovery of pG from pB can be followed by monitoring the fluorescence of NR at 600 nm on a ms time scale, either after discontinuing continuous blue light illumination or after flash-excitation of PYP. This was done at a pH ranging from 4 to 9. The observed recovery kinetics were slightly slower compared to those found in parallel UV/Vis spectroscopy experiments (Data not shown).
Figure 21. Fluorescence emission of NR. Emission spectra at pH 5.0, with excitation at 540 nm, of NR in the presence of buffer (similar to NR emission in the presence of PYP in the pG state; solid line), and in the presence of a steady state mixture of pG and pB (0.3/0.7; dotted line). The dashed line was obtained via deconvolution and represents the pB-specific NR emission. The residuals after fitting with the multiGauss function (Equation 3) are shown for the pG (solid line) and the steady state mixture of pG and pB (dotted line) experiments.
3.2.2 Nile Red Titrations
It was not possible to saturate the binding of NR to pB due to low solubility of NR (Sackett and Wolff 1987) in combination with a relative low affinity for PYP. However, it was possible to determine the equilibrium binding constant (KB) of NR to pB at pH 4.0, 5.0, 6.0, 7.0, 8.0, and 9.0. In order to determine KB, the emission spectrum of NR in the presence of a steady state mixture of pG and pB was measured at several NR concentrations ranging up to 1 μM, which is close to the solubility limit of NR in aqueous solution. A typical set of results (obtained at pH 5.0) is shown in Figure 22 a. From these fluorescence emission data KB values were determined using Equation 4, which describes the association/dissociation equilibrium between the pB form of PYP and Nile Red.
][][][][][][
][][][
freetotal
freetotal
freefreeB
freefree
NR
K
k
k
+=
+=
⋅=
+ ⎯→⎯⎯⎯⎯←
NRpBNR
pBNRpBpB
pBNR
NRpB
NRpBpBNR1
2
Equation 4
The concentration of NR bound to pB ([NRpB]) and the amount of NR in aqueous solution ([NRfree]) was obtained via a fit of the emission spectra with (a) multiGauss function(s) (see section 3.1.6 Equation 3). The total amount of NR added [NRtotal] is obtained by adding [NRpB] and [NRfree]. The total amount of pB formed [pBtotal] was determined separately in a parallel UV/Vis experiment, under similar experimental conditions as the fluorescence measurements. The concentration of free pB ([pBfree]) was then obtained by subtracting [NRpB] from [pBtotal]. The shapes of the peaks that were fitted to the emission spectra are shown
60

Chapter 2 Nile Red probe binding
in Figure 22 b. The peak-shape of the aqueous NR emission is independent of pH within the pH range studied. The shape of the pB-associated NR emission showed a negligible pH-dependence (not shown), with the exception of pH 4.0, where the emission has a much broader spectrum and is shifted slightly to the red (λmax = 614 nm).
Figure 22. NR Titration. Panel a: NR concentration dependence of the emission spectrum in a PYP sample at pH 5.0 containing a steady state mixture of pG and pB (0.3/0.7). Spectra are shown for NR concentrations from 100 nM NR (1) to 1 μM NR (10). Panel b: Representative deconvoluted emission spectra at pH 5.0 of NR in buffer (dashed line) and bound to pB (solid line). The dotted line is the deconvoluted pB-associated NR emission spectrum at pH 4.0, which is the only one that deviates significantly of the data obtained in the pH range from 4 to 9.
In Figure 23 a the NR titration data is summarized and plotted in such a way that the slopes of the lines equal the KB. From this plot it is evident that KB is pH dependent. This is shown more clearly in Figure 23 b where the KB is plotted as a function of pH. The obtained pH profile suggests that a fit of this data would require at least two pKa values, one around 5.5 and the other at 9 or higher.
From the titration data it was derived that, compared to NR in aqueous solution, the pB-associated NR emission peak area was about 5.8 times larger for the same concentration of NR. Assuming that the extinction coefficient does not change significantly upon binding to PYP we calculated that the fluorescence quantum yield for pB-associated NR was 0.12.
Figure 23. Quantitative analysis of Nile Red binding to the pB intermediate of PYP. Panel a: Determination of the NR binding constant KB at pH 4.0 , pH 5.0 , pH 6.0 , pH 7.0 , pH 8.0 , and pH 9.0 . The data is plotted so that the slope of each line equals KB (deduced from Equation 4). Panel b: pH dependence of the binding constant KB. A proposed fit with the Henderson-Hasselbalch equation (see Equation 1 section 2.2.2) using the pKa values of 5.5 (n=3) and 10 (n=0.5) is included.
61

Chapter 2 Nile Red probe binding
3.2.3 Analysis of truncated Δ25-PYP
From NMR-measurements (Craven et al. 2000) and UV/Vis kinetic absorption measurements (van Brederode et al. 1996; van der Horst et al. 2001), both in solution, it is clear that a large structural change occurs in PYP upon formation of the pB state, particularly in its N-terminal domain. This N-terminal domain is therefore a prime candidate for the location of a NR binding-site. However, when we studied NR emission in the presence of the Δ25-PYP mutant, in which the N-terminus is deleted (residues 1-25), we did not detect any NR binding to the pG state of Δ25-PYP. Also, we observed the same shift in fluorescence emission from NR, upon formation of the pB intermediate of Δ25-PYP, as was found for wild type PYP (see Figure 24). In Figure 24 a the NR excitation and emission spectra of a steady state pG/pB mixture of wild type PYP is shown. Two excitation spectra are presented, one with the emission monitored at 600 nm (reflecting emission from pB-associated NR; dashed line) and one with the emission monitored at 659 nm (reflecting emission from free NR; dotted line). These excitation spectra were normalized with respect to the maximum of the included emission spectrum keeping the relative peak heights between the two excitation spectra intact. Figure 24 b shows the equivalent data for Δ25-PYP. Note that in the Δ25-PYP sample more pB was accumulated, which explains the increased pB-associated NR emission. Otherwise the excitation and emission spectra were identical. Additionally, a NR titration experiment was performed with Δ25-PYP at pH 5.0 and 8.0. The obtained NR binding constants were similar to those found for wild type PYP (see Table 8), indicating that the observed pH dependence of the NR binding constant in wild type PYP is also present in Δ25-PYP.
Table 8. Nile Red to pB binding constants Determination of the Nile Red to pB binding constants for wild type PYP is presented in Figure 23.
pH KB for wild type PYP (·104 M–1)
KB for Δ25-PYP (·104 M–1)
4.0 6.09 ± 0.04 5.0 4.40 ± 0.03 10.2 ± 0.1 6.0 16.7 ± 0.2 7.0 16.4 ± 0.1 8.0 14.3 ± 0.1 17.0 ± 0.2 9.0 9.41 ± 0.08
Figure 24. Nile Red emission and excitation spectra for wild type PYP and Δ25-PYP. Panel a: Fluorescence excitation spectra of NR with detection at 600 nm (dashed line) and 659 nm (dotted line), selective for pB-associated NR and free NR respectively, in the presence of a steady state mixture of pG and pB (0.7/0.3) of wild type PYP at pH 8.0. The emission spectrum (solid line) was recorded with excitation at 540 nm. Panel b: Fluorescence excitation and emission spectra for a steady state mixture of pG and pB (0.1/0.9) of Δ25-PYP at pH 8.0.
3.2.4 pBdark state and the free chromophore
In order to determine if the acid-induced pB-state, pBdark (Hoff et al. 1997a), is structurally similar to the light-induced pB state, the NR emission spectrum of a wild type PYP sample at pH 1.8 was determined. At this pH PYP is largely in the pBdark state, a state with similar UV/Vis spectral properties as pB, but which is formed due to the low pH and not due to illumination of the sample. NR in aqueous solution at this low pH still has the same characteristics as in the pH range of 4 to 9 except for a lower emission intensity, which may either be caused by a decreased solubility or a change in quantum yield. In the presence of pBdark the NR emission spectrum was similar but not identical to those observed in a steady state mixture of pG and pB at a pH ranging from 4 to 9. Two different NR emission bands were observed. However, the pBdark-associated NR
62

Chapter 2 Nile Red probe binding
emission has its maximum at 632 nm, which is clearly red-shifted from the emission maximum at 600 nm for the pB-associated NR emission.
As a control, the NR emission was also determined in the presence of the free chromophore 4-hydroxycinamic acid (dissolved at 2 μM), both at pH 6.0 and 9.0. Under those conditions the NR emission did not change noticeably with respect to the NR emission in aqueous solution (data not shown), indicating that the pB-associated NR emission is not due to binding to the chromophore, which becomes exposed in pB.
3.2.5 Nile Red emission and PYP absorption kinetics
Kinetic measurements of the changes in pB-associated NR emission were compared with changes in UV/Vis absorption of PYP. At pH 8.0 both the formation of pB-associated NR emission, as well as its subsequent disappearance, was analyzed using laser-flash transient fluorescence spectroscopy. Emission spectra were recorded with delays ranging from 500 μs to 1.04 s. In Figure 25 the peak areas of pB-associated NR emission and a transient absorption trace at 468 nm are presented. The two data sets were scaled using the amplitude of the single decay component, reflecting pG recovery, obtained in the fitting procedure.
The pB-associated NR emission was fitted with two rise-components, in addition to a single decay component (see Table 9). Using a single rate-constant for fitting of the rise of the pB-associated NR emission gave unsatisfactory results, suggesting pB associated NR emission at time zero. It was estimated from the Stokes-Einstein relation that in the diffusion-limited case a 200 μs time-constant would be expected for our experimental conditions. Since the fastest time-constant observed for the fluorescence rise was 1.2 ± 0.7 ms (with an amplitude of 0.43), these results suggest that the measurements were not diffusion limited and reflected the kinetics of structural rearrangements.
For comparison the photocycle kinetics of PYP in the presence of NR were determined by measurement of transient absorption changes at 468 nm of the same samples used for NR fluorescence (see Figure 25 and Table 9). This allowed direct comparison between the NR fluorescence and the photocycle kinetics. The presence of NR did not influence the photocycle kinetics. As for the NR emission, two components were necessary to fit the rise phase at 468 nm, in agreement with a previous study (Hoff et al. 1994a). The value of the two rise components in the absorption data were determined at 500 nm, since it is not possible to get an accurate fit of these two rise components at 468 nm. Note that the formation of the pB-associated NR emission is about eight times slower than pB formation measured by UV/Vis absorption spectroscopy. Also, the decay of pB-associated NR emission is slightly slower (~30%) than the decay at 468 nm, reflecting recovery of the pG state. The differences between the NR fluorescence and photocycle kinetics (see Figure 25 and Table 9) were consistently detected and well within the accuracy of our experiments.
Figure 25. Comparison of photocycle kinetics determined via NR-emission and UV/Vis absorption. Two types of data are shown, a UV/Vis absorption timetrace monitored at 468 nm, and the amount of NR bound tothe pB state of PYP at discrete time points, with a curve fitted through the data points. The data were normalized viathe contributions of the recovery exponent obtained in theexponential fit of the data. Both types of data were recordedon the same set-up and with the same amount of PYP andNR present at pH 8.0. Below are the residuals obtainedusing a mono-exponential fit (χ2
NR = 1.2·10-5; χ2abs = 9.1·10-
7; dotted line) and a bi-exponential fit (χ2NR = 6.8·10-6; χ2
abs
= 2.0·10-7; solid line) of the rise component.
Table 9. Comparison of the Nile Red emission and UV/Vis absorption kinetic constants. The Nile Red emission and UV/Vis absorption kinetics were fitted from the flash-photolysis data presented in Figure 25.
type of data τ1 (Amplitude) τ2 (Amplitude) τ3 (Amplitude) NR emission 1.2 ± 0.7 ms (0.43) 10 ± 2 ms (0.57) 530 ± 40 ms (-1)
UV/Vis absorption 213 ± 9 μs (0.48) 1.23 ± 0.02 ms (0.52) 405 ± 1 ms (-1)
63

Chapter 2 Nile Red probe binding
3.3 Discussion
The possible exposure of a hydrophobic surface upon formation of the pB intermediate in the photocycle of PYP has been suggested on the basis of time-resolved absorption experiments (Meyer et al. 1989) and was later also implied on the basis of specific heat capacity changes derived from time-resolved absorption measurements (van Brederode et al. 1996), transient proton uptake and release (see section 2 and (Meyer et al. 1993)), and binding to lipid bilayers (Salamon et al. 1995). However, this view became heavily debated upon publication of a crystal structure of the pB intermediate (Genick et al. 1997b), which does not show a structural change that would suggest such an exposure of a hydrophobic surface. Meanwhile FTIR experiments have shown, in a direct comparison of the two PYP forms (i.e. in aqueous solution and in a crystalline lattice), that the behavior of PYP in crystals is different from that in solution with respect to global structural changes (see section 4 and (Xie et al. 2001)). In this study we have further characterized the exposure of a hydrophobic surface in pB with the aid of the fluorescent hydrophobicity probe NR.
Recently it was put forward that the pB state resembles a molten globule state (Lee et al. 2001c). One of their observations was a 12% increase of the fluorescence of the hydrophobicity probe ANS in the pB state, compared to the pG state. No binding site was suggested, however, and no kinetic analysis of the exposure of the ANS binding site was performed. Since ANS binds to the pG state and excitation of ANS also excites the PYP photocycle, the analysis presented here would not be possible using the ANS probe.
The excitation maximum of Nile Red is sufficiently distant from the absorption maximum of the pG state of PYP to allow the probe to be used under conditions of continuous excitation of NR, without inducing photochemistry in PYP. From the steady state emission spectra of NR in buffer, in the presence of pG, and in the presence of a steady state mixture of pB and pG (see Fig. 1 a) we can deduce that NR only binds to pB and not to pG. The association of NR with pB was further shown by comparing time-resolved NR emission and UV/Vis absorption measurements on a ms to s time scale, where the pG recovery kinetics were similar for both types of experiment. To determine if the transient binding of NR to pB could be explained by hydrophobicity changes on the surface of the known pB crystal structure, we analyzed the surface hydrophobicity of the pG and the pB crystal structure using GRID (Goodford 1985). We did not observe a significant difference in surface hydrophobicity (data not shown), indicating that we are indeed looking at a structural change specific for PYP in solution.
The sensitivity of NR emission to the polarity of the environment can be understood from the internal charge transfer in the excited state and its stabilization by a geometrical change of the NR molecule in the excited state in polar solvents. Such a state is called a twisted internal charge transfer (TICT) state (Dutta et al. 1996). It has been shown that a TICT state is characterized by red-shifted absorption and emission maxima and a low fluorescence quantum yield. This is in good agreement with the experimental fluorescence properties of NR in solvents with different dielectric constants (Greenspan and Fowler 1985; Sackett and Wolff 1987; Sarkar et al. 1994; Dutta et al. 1996; Datta et al. 1997; Ghoneim 2000), where the fluorescence emission maximum (λfl) is positively correlated and the fluorescence quantum yield (Φfl) is negatively correlated to the dielectric constant or the dielectric polarity of the solvent. For two proteins (κ-casein and albumin) this correlation between the fluorescence emission maximum and the fluorescence quantum yield of protein-bound NR has also been established (Sackett and Wolff 1987). From the fluorescence maximum of the pB-associated NR emission observed in this study a dielectric constant, D, of 15-20 is expected for the environment of NR near its binding site. The fluorescence quantum yield of the pB-associated NR (0.12), however, is a factor of two smaller than expected from these correlations. We propose that the reduced fluorescence quantum yield is due to specific quenching of NR fluorescence by the surrounding PYP molecule.
By titrating NR it was intended to determine the binding constant KB as well as the number of NR molecules that bind to a single PYP molecule in the pB state. However, due to the low solubility of NR (Sackett and Wolff 1987) and its relatively low affinity for PYP, we were not able to saturate binding of NR to the pB state of PYP. As a result, we were not able to determine the number of NR molecules binding to PYP in the pB state. However, based on the molecular dimensions of NR and PYP, it is likely that they bind in a one-to-one stoichiometry.
The pH dependence of the determined NR binding constant indicates that a fit of the data would require at least two pKa values. One around 5.5 and one around 9 or higher. In a previous study that also looked at structural changes upon formation of pB, which used transient proton uptake and release as a probe (see
64

Chapter 2 Nile Red probe binding
section 2), pKa values of ~5.5 and ~10 were observed. These pKa values were fit onto the pH dependence of KB using the Henderson-Hasselbalch equation (see Equation 1 section 2.2.2), which resulted in a good fit (see Figure 23 b). Note, that a pKa value of 9 instead of 10 also provides a good fit through the data. A pKa of around 6.4 has also been found in titrations of several properties of the pB state (Genick et al. 1997a; Demchuk et al. 2000). However, it was not possible to fit a pKa of 6.4 onto the data presented here.
The pB-associated NR emission spectrum also shows a pH-dependence. The emission maximum of pB-associated NR emission at pH values of 4.0 and 1.8 is red-shifted with respect to the emission maximum in the pH range from 5 to 9. This red-shift can be interpreted as a more polar nature of the hydrophobic surface that NR binds to. Note that a change in emission maximum also implies a change in the quantum yield of NR emission. This possibly explains why the data-point at pH 4.0 in Figure 23 b deviates slightly from the fitted curve, since the analysis of the data did not take this effect into account. Note that the pH dependence of the KB does not coincide with the pH dependence of the pB-associated NR emission maximum. In other words, the pH dependence of KB is not caused by a change in polarity of the NR binding site. It is therefore possible that the pH dependence of KB is caused by a difference in the structure of pB.
It already has been proposed that the pB state exists in multiple configurations, both ordered and partially unfolded (Craven et al. 2000). In light of the observed pH dependence of KB we would like to propose that the equilibrium between these ordered and partially unfolded states is pH dependent. More specifically, at low pH the number of pB molecules with a structural change large enough to allow binding of NR is lower than at high pH. The apparent pKa for this difference is about 5.5. From the net proton uptake/release experiments described in section 2, we have been able to deduce that the pKa of Glu46 is 5.5 in the pB state. As this residue has been shown to be responsible, at least in part, for the observed structural change of PYP upon formation of pB (Xie et al. 2001), it is likely that a change of its protonation state influences the structure of pB. This would then explain the observed pKa of 5.5 in the pH dependent NR titration experiments of PYP.
To interpret the data more accurately it is important that we know the location of the NR binding site in PYP. Using the available information we can narrow down the location of this binding site. It is known that NR binds to hydrophobic parts of a protein (Sackett and Wolff 1987). NR does not bind to the ground state of PYP, thus the NR binding site must be buried when PYP is in its ground state. PYP has two buried hydrophobic cores, the major hydrophobic core, which is also part of the chromophore binding pocket, and the minor hydrophobic core shielded by the N-terminal part of the protein (Borgstahl et al. 1995). NMR experiments indicate that around both cores structural changes take place upon formation of pB (Craven et al. 2000). This provides us with two possible areas where NR may bind. By analyzing the Δ25-PYP mutant it is possible to distinguish between these two possible areas. The Δ25-PYP mutant has similar NR binding characteristics as wild type PYP. The most important similarity being that NR binds to pB and not pG. Therefore, it can be excluded that NR binds to the hydrophobic core shielded by the N-terminus in wild type PYP. It also means, taking into account the near linear Arrhenius behavior of the PYP recovery reaction of the Δ25-PYP mutant (van der Horst et al. 2001), that the phenomena of NR binding to the pB state of PYP and the non-Arrhenius behavior of the pB to pG recovery (of wild type PYP) are caused by different protein structural changes (both involving exposure of hydrophobic surfaces and/or changes in its accessibility, though). Note that changes in the accessibility of a hydrophobic site for Nile Red does not necessarily have to be correlated with a large increase of hydrophobic contact area. The exposure of the NR binding site may therefore not contribute much to the non-Arrhenius behavior of PYP ground state recovery.
The major hydrophobic core is left as the only area of the protein that potentially contains the NR binding site. NMR experiments have indicated that, besides the N-terminal domain, residues 42-58, 69-78 and 95-100, which encompass the chromophore-binding pocket and contain part of the major hydrophobic core, show structural changes upon formation of pB (Craven et al. 2000). A hydrophobicity analysis, using GRID (Goodford 1985), of the molecular surface of the amino acid clusters 69-78 and 95-100 shows this region to represent a significantly hydrophobic site. Rearrangements of the clusters 69-78 and 95-100 such as expected from the NMR studies, could potentially result in solvent-exposure of a hydrophobic surface, consisting of some, or all of the residues Phe62, Phe63, Phe75, Tyr76, Phe79, Phe92, Tyr94, Phe96, Val107 and Val120. This site is also relatively close to the chromophore (see Figure 26). Exposure of this site would not be expected to result in de-protection of the amide (backbone) groups of these ‘core’ residues.
The fluorescence emission maximum of pB-bound NR is direct evidence for the hydrophobic nature of the interaction between pB and NR. Since the photocycle kinetics are affected by solvent properties (Meyer et
65
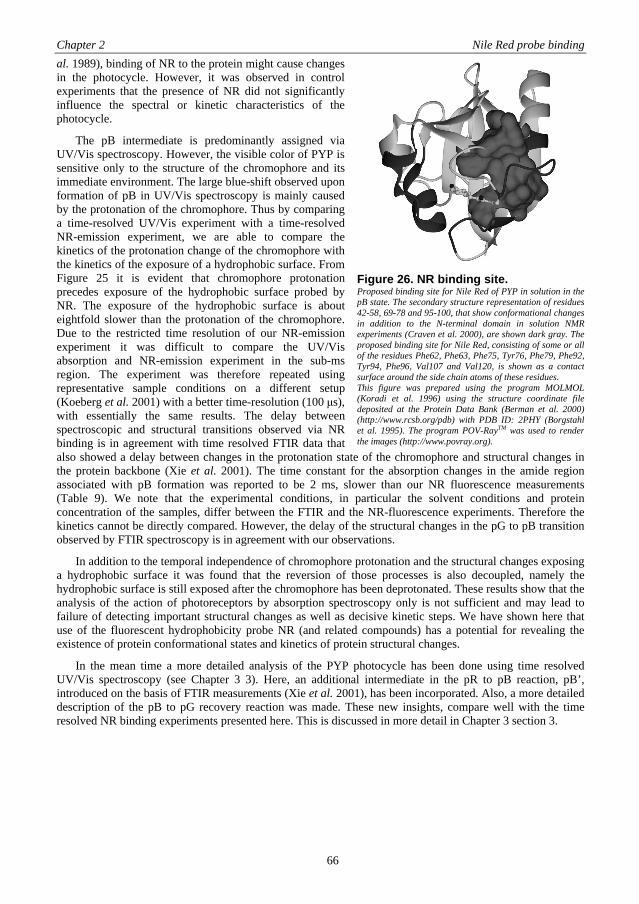
Chapter 2 Nile Red probe binding
al. 1989), binding of NR to the protein might cause changes in the photocycle. However, it was observed in control experiments that the presence of NR did not significantly influence the spectral or kinetic characteristics of the photocycle.
The pB intermediate is predominantly assigned via UV/Vis spectroscopy. However, the visible color of PYP is sensitive only to the structure of the chromophore and its immediate environment. The large blue-shift observed upon formation of pB in UV/Vis spectroscopy is mainly caused by the protonation of the chromophore. Thus by comparing a time-resolved UV/Vis experiment with a time-resolved NR-emission experiment, we are able to compare the kinetics of the protonation change of the chromophore with the kinetics of the exposure of a hydrophobic surface. From Figure 25 it is evident that chromophore protonation precedes exposure of the hydrophobic surface probed by NR. The exposure of the hydrophobic surface is about eightfold slower than the protonation of the chromophore. Due to the restricted time resolution of our NR-emission experiment it was difficult to compare the UV/Vis absorption and NR-emission experiment in the sub-ms region. The experiment was therefore repeated using representative sample conditions on a different setup (Koeberg et al. 2001) with a better time-resolution (100 μs), with essentially the same results. The delay between spectroscopic and structural transitions observed via NR binding is in agreement with time resolved FTIR data that also showed a delay between changes in the protonation state of the chromophore and structural changes in the protein backbone (Xie et al. 2001). The time constant for the absorption changes in the amide region associated with pB formation was reported to be 2 ms, slower than our NR fluorescence measurements (Table 9). We note that the experimental conditions, in particular the solvent conditions and protein concentration of the samples, differ between the FTIR and the NR-fluorescence experiments. Therefore the kinetics cannot be directly compared. However, the delay of the structural changes in the pG to pB transition observed by FTIR spectroscopy is in agreement with our observations.
Figure 26. NR binding site. Proposed binding site for Nile Red of PYP in solution in the pB state. The secondary structure representation of residues 42-58, 69-78 and 95-100, that show conformational changes in addition to the N-terminal domain in solution NMR experiments (Craven et al. 2000), are shown dark gray. The proposed binding site for Nile Red, consisting of some or all of the residues Phe62, Phe63, Phe75, Tyr76, Phe79, Phe92, Tyr94, Phe96, Val107 and Val120, is shown as a contact surface around the side chain atoms of these residues. This figure was prepared using the program MOLMOL (Koradi et al. 1996) using the structure coordinate file deposited at the Protein Data Bank (Berman et al. 2000) (http://www.rcsb.org/pdb) with PDB ID: 2PHY (Borgstahl et al. 1995). The program POV-RayTM was used to render the images (http://www.povray.org).
In addition to the temporal independence of chromophore protonation and the structural changes exposing a hydrophobic surface it was found that the reversion of those processes is also decoupled, namely the hydrophobic surface is still exposed after the chromophore has been deprotonated. These results show that the analysis of the action of photoreceptors by absorption spectroscopy only is not sufficient and may lead to failure of detecting important structural changes as well as decisive kinetic steps. We have shown here that use of the fluorescent hydrophobicity probe NR (and related compounds) has a potential for revealing the existence of protein conformational states and kinetics of protein structural changes.
In the mean time a more detailed analysis of the PYP photocycle has been done using time resolved UV/Vis spectroscopy (see Chapter 3 3). Here, an additional intermediate in the pR to pB reaction, pB’, introduced on the basis of FTIR measurements (Xie et al. 2001), has been incorporated. Also, a more detailed description of the pB to pG recovery reaction was made. These new insights, compare well with the time resolved NR binding experiments presented here. This is discussed in more detail in Chapter 3 section 3.
66
Chapter 2 Fourier Transform Infrared Spectroscopy
4 Fourier Transform Infrared Spectroscopy
Fourier Transform Infrared Spectroscopy (FTIR) is a powerful technique that enables us to monitor structural changes during the photocycle of PYP. By determining difference spectra (after – before photocycle activation), changes in the vibrational characteristics of specific functional groups are monitored. Here the correct assignment of the observed peaks in the difference spectra is important. Several peaks have been assigned Refs, but not all. With regard to structural change of the protein two features of the difference spectra have been used as a reporter (Xie et al. 2001). One, the difference signal in the amide I band region that reflects changes in the protein backbone, and another around 1689 cm-1 (when deuterium oxide is used as solvent), which monitors an ND group of a side chain of an as of yet unspecified amino acid. As with the use of other techniques, correlation of FTIR difference spectra with kinetic events monitored in the UV/Vis region of the electromagnetic spectrum, is important. As the sample conditions can have pronounced effects on the kinetics (see Chapter 1 section 5.2), it is important to measure both types of data under identical or close to identical conditions.
4.1 Materials & Methods
4.1.1 Sample preparation
In this study wild type PYP and the PYP mutants Glu46Gln, His108Phe, and a truncated derivative (Δ25-PYP), with residues 1-25 removed, were studied. All were used with the His-tag removed with the exception of Δ25-PYP. The production and purification of PYP is described in section 1. For the solution samples concentrations of ~ 6.6-10 mM PYP (OD446, 1 cm 300-450) were used. These samples were sandwiched between two CaF2 plates (diameter 25 mm, thickness 2 mm) using a 12 μm spacer. Preparation of the crystal samples is described in section 4.1.2.
4.1.2 Crystals
P63 crystals of wild type PYP were grown using the reported protocol (Borgstahl et al. 1995). P65 crystals of wild type PYP were obtained using the hanging drop method. Used stock solutions are, a 50% Polyethylene Glycol 4000 (PEG 4000; from Hampton Research) solution, and a 1 M MES (2[N-Morpholino]ethanesulfonic acid) buffer pH ~6. For both stock solutions water was used as solvent (not deuterium oxide) and both were filtered through a 20 μm filter. Also, a 20 mg·ml-1 PYP solution (OD446, 1cm 66; 1.33 mM) in 100 mM MES pH ~6 was prepared. A 4 μl drop of the PYP solution was pipetted on a cover slide and mixed with another 4 μl of the well solution. When well solutions containing 35-40% PEG 4000 and 100 mM MES buffer pH ~6 were used, all of the PYP was in crystalline form after ~3 days incubation in the dark at 18°C. Crystals were harvested by adding small amounts of mother liquor containing 45% PEG 4000 with 100 mM MES pH ~6, and subsequently pipetting the crystals from the cover plate into a small eppendorf cup. The collected crystals were then centrifuged and excess mother liquor was removed.
For preparation of samples for measurement, the crystals were washed with mother liquor containing deuterium oxide instead of water. Then as much mother liquor was removed as possible. 2.5 μl of the remaining crystal slurry was then sandwiched between two CaF2 plates (diameter 25 mm, thickness 2 mm) using a 12 μm spacer, and the crystals were further grinded between the two CaF2 plates until a homogeneous crystal slurry was obtained. This was checked using a microscope (10 to 40 times magnification).
4.1.3 Transient FTIR spectroscopy
Transient FTIR spectra were recorded with a Bruker IFS 66v FTIR spectrometer, using the rapidscan technique. Samples were exited with a Continuum Surelite-II OPO pumped laser (450 nm (430 nm for Glu46Gln mutant), ~5-6 mJ per pulse, 3-4 ns pulse width,). Spectra were recorded from 1900 to 970 cm-1 or 1860 to 930 cm-1. This allowed a time-resolution of ~60 ms with rapidscan. Several Macro’s were created to automate calculation of the difference spectra. This allowed for immediate and easy pre-evaluation of the data right after it was measured.
67
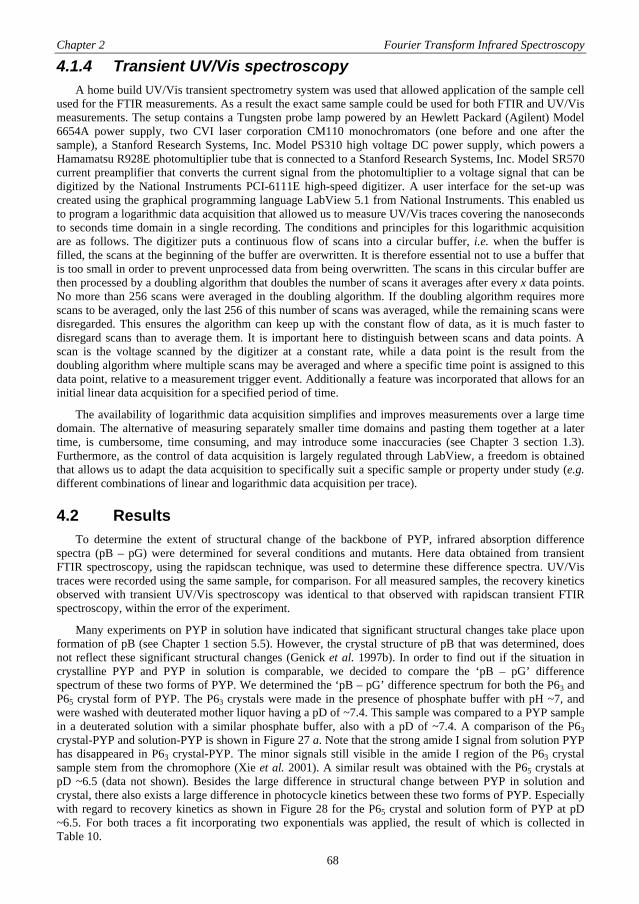
Chapter 2 Fourier Transform Infrared Spectroscopy
4.1.4 Transient UV/Vis spectroscopy
A home build UV/Vis transient spectrometry system was used that allowed application of the sample cell used for the FTIR measurements. As a result the exact same sample could be used for both FTIR and UV/Vis measurements. The setup contains a Tungsten probe lamp powered by an Hewlett Packard (Agilent) Model 6654A power supply, two CVI laser corporation CM110 monochromators (one before and one after the sample), a Stanford Research Systems, Inc. Model PS310 high voltage DC power supply, which powers a Hamamatsu R928E photomultiplier tube that is connected to a Stanford Research Systems, Inc. Model SR570 current preamplifier that converts the current signal from the photomultiplier to a voltage signal that can be digitized by the National Instruments PCI-6111E high-speed digitizer. A user interface for the set-up was created using the graphical programming language LabView 5.1 from National Instruments. This enabled us to program a logarithmic data acquisition that allowed us to measure UV/Vis traces covering the nanoseconds to seconds time domain in a single recording. The conditions and principles for this logarithmic acquisition are as follows. The digitizer puts a continuous flow of scans into a circular buffer, i.e. when the buffer is filled, the scans at the beginning of the buffer are overwritten. It is therefore essential not to use a buffer that is too small in order to prevent unprocessed data from being overwritten. The scans in this circular buffer are then processed by a doubling algorithm that doubles the number of scans it averages after every x data points. No more than 256 scans were averaged in the doubling algorithm. If the doubling algorithm requires more scans to be averaged, only the last 256 of this number of scans was averaged, while the remaining scans were disregarded. This ensures the algorithm can keep up with the constant flow of data, as it is much faster to disregard scans than to average them. It is important here to distinguish between scans and data points. A scan is the voltage scanned by the digitizer at a constant rate, while a data point is the result from the doubling algorithm where multiple scans may be averaged and where a specific time point is assigned to this data point, relative to a measurement trigger event. Additionally a feature was incorporated that allows for an initial linear data acquisition for a specified period of time.
The availability of logarithmic data acquisition simplifies and improves measurements over a large time domain. The alternative of measuring separately smaller time domains and pasting them together at a later time, is cumbersome, time consuming, and may introduce some inaccuracies (see Chapter 3 section 1.3). Furthermore, as the control of data acquisition is largely regulated through LabView, a freedom is obtained that allows us to adapt the data acquisition to specifically suit a specific sample or property under study (e.g. different combinations of linear and logarithmic data acquisition per trace).
4.2 Results
To determine the extent of structural change of the backbone of PYP, infrared absorption difference spectra (pB – pG) were determined for several conditions and mutants. Here data obtained from transient FTIR spectroscopy, using the rapidscan technique, was used to determine these difference spectra. UV/Vis traces were recorded using the same sample, for comparison. For all measured samples, the recovery kinetics observed with transient UV/Vis spectroscopy was identical to that observed with rapidscan transient FTIR spectroscopy, within the error of the experiment.
Many experiments on PYP in solution have indicated that significant structural changes take place upon formation of pB (see Chapter 1 section 5.5). However, the crystal structure of pB that was determined, does not reflect these significant structural changes (Genick et al. 1997b). In order to find out if the situation in crystalline PYP and PYP in solution is comparable, we decided to compare the ‘pB – pG’ difference spectrum of these two forms of PYP. We determined the ‘pB – pG’ difference spectrum for both the P63 and P65 crystal form of PYP. The P63 crystals were made in the presence of phosphate buffer with pH ~7, and were washed with deuterated mother liquor having a pD of ~7.4. This sample was compared to a PYP sample in a deuterated solution with a similar phosphate buffer, also with a pD of ~7.4. A comparison of the P63 crystal-PYP and solution-PYP is shown in Figure 27 a. Note that the strong amide I signal from solution PYP has disappeared in P63 crystal-PYP. The minor signals still visible in the amide I region of the P63 crystal sample stem from the chromophore (Xie et al. 2001). A similar result was obtained with the P65 crystals at pD ~6.5 (data not shown). Besides the large difference in structural change between PYP in solution and crystal, there also exists a large difference in photocycle kinetics between these two forms of PYP. Especially with regard to recovery kinetics as shown in Figure 28 for the P65 crystal and solution form of PYP at pD ~6.5. For both traces a fit incorporating two exponentials was applied, the result of which is collected in Table 10.
68
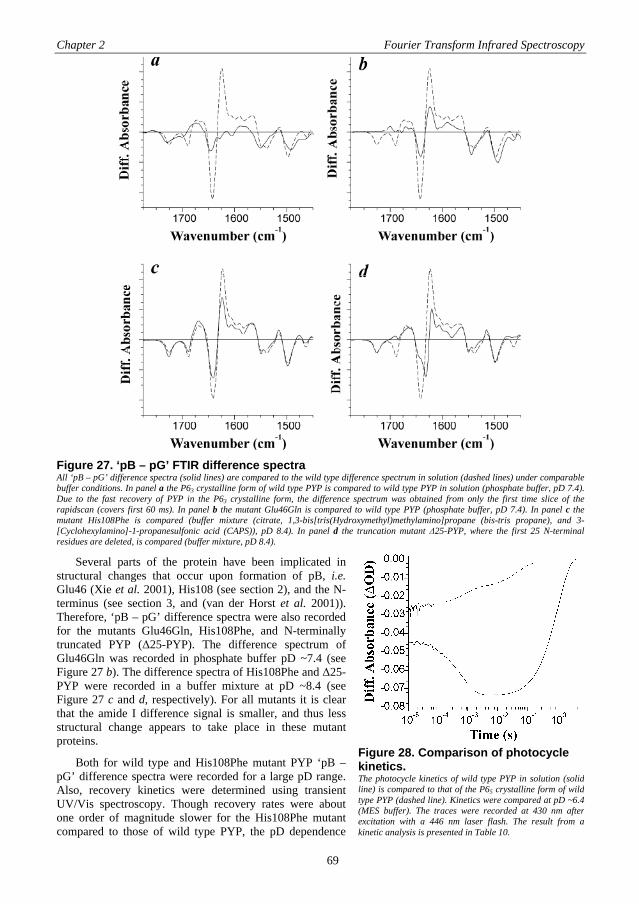
Chapter 2 Fourier Transform Infrared Spectroscopy
Figure 27. ‘pB – pG’ FTIR difference spectra All ‘pB – pG’ difference spectra (solid lines) are compared to the wild type difference spectrum in solution (dashed lines) under comparable buffer conditions. In panel a the P63 crystalline form of wild type PYP is compared to wild type PYP in solution (phosphate buffer, pD 7.4). Due to the fast recovery of PYP in the P63 crystalline form, the difference spectrum was obtained from only the first time slice of the rapidscan (covers first 60 ms). In panel b the mutant Glu46Gln is compared to wild type PYP (phosphate buffer, pD 7.4). In panel c the mutant His108Phe is compared (buffer mixture (citrate, 1,3-bis[tris(Hydroxymethyl)methylamino]propane (bis-tris propane), and 3-[Cyclohexylamino]-1-propanesulfonic acid (CAPS)), pD 8.4). In panel d the truncation mutant Δ25-PYP, where the first 25 N-terminal residues are deleted, is compared (buffer mixture, pD 8.4).
Several parts of the protein have been implicated in structural changes that occur upon formation of pB, i.e. Glu46 (Xie et al. 2001), His108 (see section 2), and the N-terminus (see section 3, and (van der Horst et al. 2001)). Therefore, ‘pB – pG’ difference spectra were also recorded for the mutants Glu46Gln, His108Phe, and N-terminally truncated PYP (Δ25-PYP). The difference spectrum of Glu46Gln was recorded in phosphate buffer pD ~7.4 (see Figure 27 b). The difference spectra of His108Phe and Δ25-PYP were recorded in a buffer mixture at pD ~8.4 (see Figure 27 c and d, respectively). For all mutants it is clear that the amide I difference signal is smaller, and thus less structural change appears to take place in these mutant proteins.
Figure 28. Comparison of photocycle kinetics. The photocycle kinetics of wild type PYP in solution (solid line) is compared to that of the P65 crystalline form of wild type PYP (dashed line). Kinetics were compared at pD ~6.4 (MES buffer). The traces were recorded at 430 nm after excitation with a 446 nm laser flash. The result from a kinetic analysis is presented in Table 10.
Both for wild type and His108Phe mutant PYP ‘pB – pG’ difference spectra were recorded for a large pD range. Also, recovery kinetics were determined using transient UV/Vis spectroscopy. Though recovery rates were about one order of magnitude slower for the His108Phe mutant compared to those of wild type PYP, the pD dependence
69
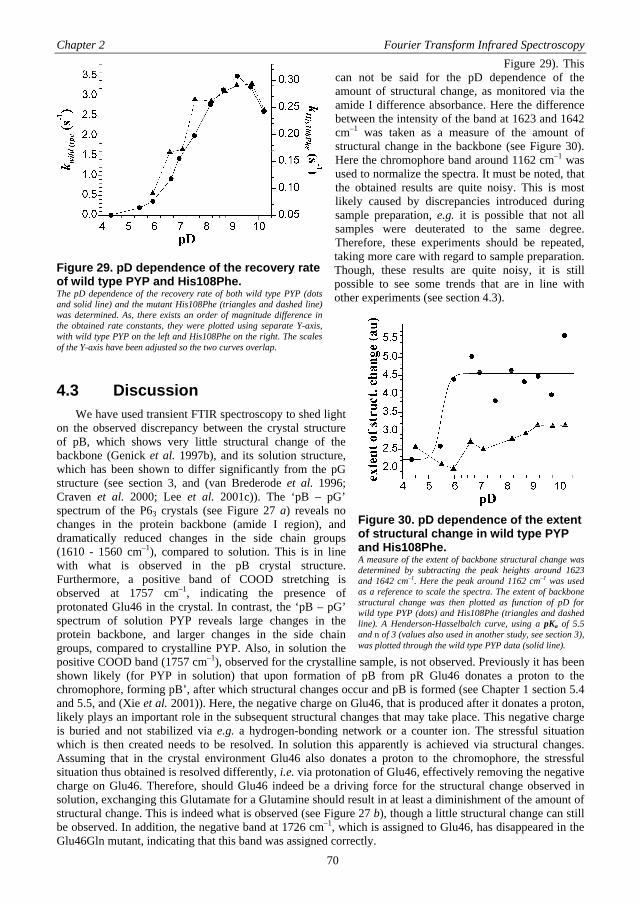
Chapter 2 Fourier Transform Infrared Spectroscopy
Figure 29). This can not be said for the pD dependence of the amount of structural change, as monitored via the amide I difference absorbance. Here the difference between the intensity of the band at 1623 and 1642 cm–1 was taken as a measure of the amount of structural change in the backbone (see Figure 30). Here the chromophore band around 1162 cm–1 was used to normalize the spectra. It must be noted, that the obtained results are quite noisy. This is most likely caused by discrepancies introduced during sample preparation, e.g. it is possible that not all samples were deuterated to the same degree. Therefore, these experiments should be repeated, taking more care with regard to sample preparation. Though, these results are quite noisy, it is still possible to see some trends that are in line with other experiments (see section 4.3).
4.3 Discussion
We have used transient FTIR spectroscopy to shed light on the observed discrepancy between the crystal structure of pB, which shows very little structural change of the backbone (Genick et al. 1997b), and its solution structure, which has been shown to differ significantly from the pG structure (see section 3, and (van Brederode et al. 1996; Craven et al. 2000; Lee et al. 2001c)). The ‘pB – pG’ spectrum of the P63 crystals (see Figure 27 a) reveals no changes in the protein backbone (amide I region), and dramatically reduced changes in the side chain groups (1610 - 1560 cm–1), compared to solution. This is in line with what is observed in the pB crystal structure. Furthermore, a positive band of COOD stretching is observed at 1757 cm–1, indicating the presence of protonated Glu46 in the crystal. In contrast, the ‘pB – pG’ spectrum of solution PYP reveals large changes in the protein backbone, and larger changes in the side chain groups, compared to crystalline PYP. Also, in solution the positive COOD band (1757 cm–1), observed for the crystalline sample, is not observed. Previously it has been shown likely (for PYP in solution) that upon formation of pB from pR Glu46 donates a proton to the chromophore, forming pB’, after which structural changes occur and pB is formed (see Chapter 1 section 5.4 and 5.5, and (Xie et al. 2001)). Here, the negative charge on Glu46, that is produced after it donates a proton, likely plays an important role in the subsequent structural changes that may take place. This negative charge is buried and not stabilized via e.g. a hydrogen-bonding network or a counter ion. The stressful situation which is then created needs to be resolved. In solution this apparently is achieved via structural changes. Assuming that in the crystal environment Glu46 also donates a proton to the chromophore, the stressful situation thus obtained is resolved differently, i.e. via protonation of Glu46, effectively removing the negative charge on Glu46. Therefore, should Glu46 indeed be a driving force for the structural change observed in solution, exchanging this Glutamate for a Glutamine should result in at least a diminishment of the amount of structural change. This is indeed what is observed (see Figure 27 b), though a little structural change can still be observed. In addition, the negative band at 1726 cm–1, which is assigned to Glu46, has disappeared in the Glu46Gln mutant, indicating that this band was assigned correctly.
Figure 29. pD dependence of the recovery rate of wild type PYP and His108Phe. The pD dependence of the recovery rate of both wild type PYP (dots and solid line) and the mutant His108Phe (triangles and dashed line)was determined. As, there exists an order of magnitude difference inthe obtained rate constants, they were plotted using separate Y-axis, with wild type PYP on the left and His108Phe on the right. The scalesof the Y-axis have been adjusted so the two curves overlap.
Figure 30. pD dependence of the extent of structural change in wild type PYP and His108Phe. A measure of the extent of backbone structural change was determined by subtracting the peak heights around 1623 and 1642 cm–1. Here the peak around 1162 cm–1 was used as a reference to scale the spectra. The extent of backbone structural change was then plotted as function of pD for wild type PYP (dots) and His108Phe (triangles and dashed line). A Henderson-Hasselbalch curve, using a pKa of 5.5 and n of 3 (values also used in another study, see section 3), was plotted through the wild type PYP data (solid line).
70
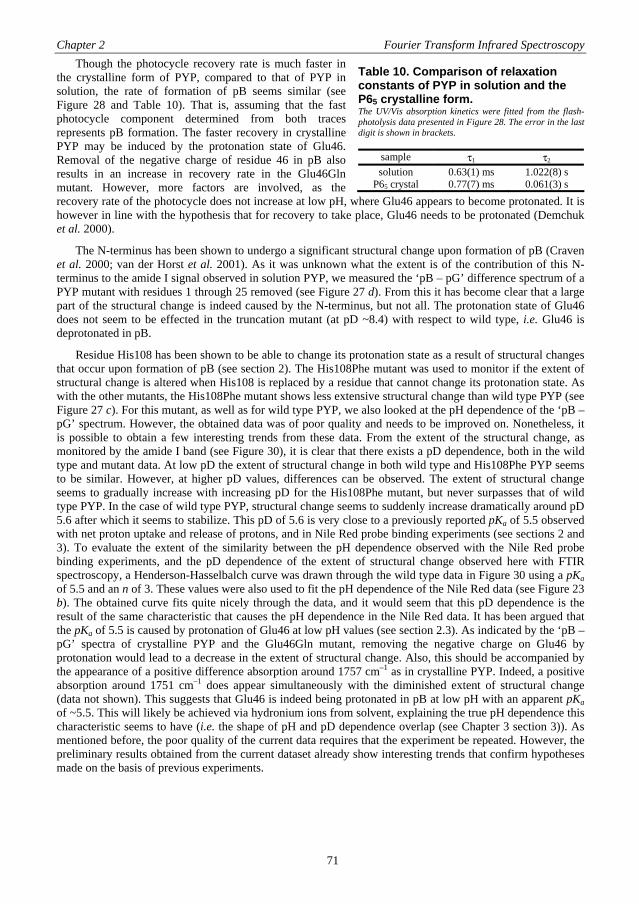
Chapter 2 Fourier Transform Infrared Spectroscopy
Though the photocycle recovery rate is much faster in the crystalline form of PYP, compared to that of PYP in solution, the rate of formation of pB seems similar (see Figure 28 and Table 10). That is, assuming that the fast photocycle component determined from both traces represents pB formation. The faster recovery in crystalline PYP may be induced by the protonation state of Glu46. Removal of the negative charge of residue 46 in pB also results in an increase in recovery rate in the Glu46Gln mutant. However, more factors are involved, as the recovery rate of the photocycle does not increase at low pH, where Glu46 appears to become protonated. It is however in line with the hypothesis that for recovery to take place, Glu46 needs to be protonated (Demchuk et al. 2000).
Table 10. Comparison of relaxation constants of PYP in solution and the P65 crystalline form. The UV/Vis absorption kinetics were fitted from the flash-photolysis data presented in Figure 28. The error in the last digit is shown in brackets.
sample τ1 τ2 solution 0.63(1) ms 1.022(8) s
P65 crystal 0.77(7) ms 0.061(3) s
The N-terminus has been shown to undergo a significant structural change upon formation of pB (Craven et al. 2000; van der Horst et al. 2001). As it was unknown what the extent is of the contribution of this N-terminus to the amide I signal observed in solution PYP, we measured the ‘pB – pG’ difference spectrum of a PYP mutant with residues 1 through 25 removed (see Figure 27 d). From this it has become clear that a large part of the structural change is indeed caused by the N-terminus, but not all. The protonation state of Glu46 does not seem to be effected in the truncation mutant (at pD ~8.4) with respect to wild type, i.e. Glu46 is deprotonated in pB.
Residue His108 has been shown to be able to change its protonation state as a result of structural changes that occur upon formation of pB (see section 2). The His108Phe mutant was used to monitor if the extent of structural change is altered when His108 is replaced by a residue that cannot change its protonation state. As with the other mutants, the His108Phe mutant shows less extensive structural change than wild type PYP (see Figure 27 c). For this mutant, as well as for wild type PYP, we also looked at the pH dependence of the ‘pB – pG’ spectrum. However, the obtained data was of poor quality and needs to be improved on. Nonetheless, it is possible to obtain a few interesting trends from these data. From the extent of the structural change, as monitored by the amide I band (see Figure 30), it is clear that there exists a pD dependence, both in the wild type and mutant data. At low pD the extent of structural change in both wild type and His108Phe PYP seems to be similar. However, at higher pD values, differences can be observed. The extent of structural change seems to gradually increase with increasing pD for the His108Phe mutant, but never surpasses that of wild type PYP. In the case of wild type PYP, structural change seems to suddenly increase dramatically around pD 5.6 after which it seems to stabilize. This pD of 5.6 is very close to a previously reported pKa of 5.5 observed with net proton uptake and release of protons, and in Nile Red probe binding experiments (see sections 2 and 3). To evaluate the extent of the similarity between the pH dependence observed with the Nile Red probe binding experiments, and the pD dependence of the extent of structural change observed here with FTIR spectroscopy, a Henderson-Hasselbalch curve was drawn through the wild type data in Figure 30 using a pKa of 5.5 and an n of 3. These values were also used to fit the pH dependence of the Nile Red data (see Figure 23 b). The obtained curve fits quite nicely through the data, and it would seem that this pD dependence is the result of the same characteristic that causes the pH dependence in the Nile Red data. It has been argued that the pKa of 5.5 is caused by protonation of Glu46 at low pH values (see section 2.3). As indicated by the ‘pB – pG’ spectra of crystalline PYP and the Glu46Gln mutant, removing the negative charge on Glu46 by protonation would lead to a decrease in the extent of structural change. Also, this should be accompanied by the appearance of a positive difference absorption around 1757 cm–1 as in crystalline PYP. Indeed, a positive absorption around 1751 cm–1 does appear simultaneously with the diminished extent of structural change (data not shown). This suggests that Glu46 is indeed being protonated in pB at low pH with an apparent pKa of ~5.5. This will likely be achieved via hydronium ions from solvent, explaining the true pH dependence this characteristic seems to have (i.e. the shape of pH and pD dependence overlap (see Chapter 3 section 3)). As mentioned before, the poor quality of the current data requires that the experiment be repeated. However, the preliminary results obtained from the current dataset already show interesting trends that confirm hypotheses made on the basis of previous experiments.
71

Chapter 2 Fourier Transform Infrared Spectroscopy
72
4.4 Concluding remarks
The data presented in this section, clearly demonstrates the differences between measurements performed on PYP in solution and PYP in crystalline form. We have also shown the importance of the residue Glu46. The protonation state of this residue is an important factor that influences the extent of structural change upon formation of pB and may also influence the photocycle recovery rate. Furthermore, we have shown that the residue His108 also has an influence on the extent of structural change. Finally we have confirmed that the majority of the structural change occurs in the N-terminus.

73
Chapter 3
Photocycle characterization
As can be gathered from Chapter 1, in recent years a comprehensive description of the photocycle of the Photoactive Yellow Protein has become available. Such a description is of vital importance if the Photoactive Yellow Protein is to be used as a model system. Time resolved UV/Vis spectroscopy has proven to be a key technique for the description this photocycle. It is then not surprising that time resolved UV/Vis spectroscopy on a nanoseconds to seconds time-scale has been an important part of my work on the Photoactive Yellow Protein. Therefore, a description of the set-up used for these experiments is provided at the start of this chapter. The remainder of this chapter will be devoted to the description of the experiments I have been involved in that have led to a better understanding of the photocycle. The characterization of the photocycle branching reaction is described (Hendriks et al. 1999a). Though its existence was already known, it had not been characterized in detail before. Furthermore, the (kinetic) deuterium isotope effect was determined for the photocycle over a large pH range (Hendriks et al. 2002a). Here the culmination of information obtained in recent years, have made it possible in combination with these data to provide a much improved insight into the photocycle of the Photoactive Yellow Protein.
Chapter 3 Laser-flash photolysis 1 Laser-flash photolysis
1.1 The set-up
The set-up was custom build by Edinburgh Instruments Ltd. (http://www.edinst.com), and is based on their LP900 spectrometer. It incorporates a 450 Watt high pressure Xenon arc lamp, which acts as the probe light source. This lamp is powered by a power supply (Xe900) that provides a constant power. This constant power can be supplemented with a millisecond power pulse from a different unit (Xp900), resulting in a temporary significant increase in light output, more UV output, less structure of the lamp emission spectrum, and a shorter lifetime of the Xenon lamp. After the probe light has passed through the sample chamber it enters the TM300 monochromator. In this monochromator two gratings are present, one with 300 grooves per millimeter and another with 1800 grooves per millimeter. The latter is used in combination with the photomultiplier detector, the former is used in combination with the CCD camera detector.
For excitation of the sample a nanosecond tunable laser was used. A Continuum I-10 YAG laser (output intensity 140 mJ at 355 nm) was used to pump a Continuum Surelite I OPO (output range 410 to 2200 nm), which was usually tuned to 446 nm. Pulse width of the obtained laser pulse was 6 ns. The laser pulse was guided to the sample chamber via prisms.
For the measurements two types of sample holder have been used. One can be water-cooled on one side of the cuvette, and was supplied with the set-up by Edinburgh Instruments Ltd. The other, is a home build cuvette holder, with which the sample temperature can be Peltier controlled. Also, a feature was incorporated that allows the sample to be illuminated via the bottom of the cuvette, e.g. with a LED or via a light guide. This home-build cuvette holder was used for experiments described in Chapter 2 section 3, and Chapter 3 section 3.
1.2 CCD measurements
The advantage of the CCD measurements is that a large spectral range can be detected at once. The disadvantage is that only one time slice can be recorded at once. Time gated spectra are obtained as follows. Light refracted by the grating in the monochromator (light of different wavelength is refracted at different angles by this grating) is projected onto an image intensifier (DiDEC unit). Here a wavelength range encompassing approximately 260 nm is projected (when the grating with 300 grooves per millimeter is used). Only if the projected light is amplified, a phosphor image is created that is intense enough for the CCD camera to read. Consequently, by adjusting the delay and width of the gain pulse of the image intensifier, a spectrum at a specific point in time can be recorded. The image intensifier is able to generate gain pulses with a delay up to 1 ms and a width (or gate) down to 10 ns. Spectra with longer delays are obtained by supplying the image intensifier with external pulses from a delay generator (BNC model 500 pulse generator). Typically several images are accumulated per spectrum to reduce the signal to noise ratio. Time gated spectra were usually recorded pseudo-randomly with the CCD camera in order to prevent long-term trends in the data. Also, time points were usually chosen, evenly spaced on a logarithmic time-scale. Typically a gate of 5% of the delay time was chosen with 10 ns as minimum and 10 ms as maximum.
1.3 Photomultiplier measurements
The advantage of the photomultiplier measurements is that traces are recorded with a high temporal resolution. The disadvantage is that only one wavelength can be recorded at a time. Time traces are obtained as follows. Light refracted by the grating in the monochromator is projected, through a slit, onto the photomultiplier tube. The resulting signal is subsequently monitored by a Oscilloscope (Tektronix TDS 340A). Typically several traces were averaged to reduce the signal to noise ratio.
As only a limited time-range can be monitored by the oscilloscope, it is necessary to record multiple traces when information over a larger time range is necessary. These different time traces can then later be combined into a single time trace encompassing the larger time range. As the different traces usually do not overlap perfectly, it is necessary to apply a minor correction factor to these separate traces before they are combined. Unfortunately, the Tektronix TDS 340A oscilloscope does not allow the generation of data into a circular buffer as described in Chapter 2 section 4.1.4. This would allow the possibility of a logarithmic data acquisition to be programmed, and would render the combining of separate time traces unnecessary.
74

Chapter 3 Branching reaction
2 Branching reaction
The photoactivity of the Photoactive Yellow Protein (PYP) is not limited to its ground state. Also photocycle intermediates can be photoactive. It has already been shown that in the presence of 366 nm light rate of recovery becomes faster, indicating that a photon induced branching reaction exists between pB and pG (Miller et al. 1993). As it is likely that in this branching reaction the chromophore is isomerized photoactively, the study of this branching reaction may provide further insight into the photocycle recovery reaction.
2.1 Materials & Methods
2.1.1 Sample preparation
In this study only wild type PYP with its His-tag removed was used. The production and purification of PYP is described in Chapter 2 section 1. A 22 μM PYP (OD446 is ~1) batch solution was prepared buffered at pH 5.6 with 50 mM 2-(N-Morpholino)ethanesulfonic acid (MES). Samples for the different experiments were taken from this batch solution. A steady state mixture of PYP in the pG and pB state was obtained by continuous actinic illumination of a PYP sample with a Schott KL1500 light source (containing a 150 Watt halogen lamp) through a glass fiber (i.e. λ > 350 nm). The selected pH allowed for ~70% pB to be accumulated (see also Chapter 2 section 2). At pH 8 only ~20% pB is accumulated, which is insufficient for our purposes.
2.1.2 Nanosecond time resolved absorption spectroscopy
We used an Edinburgh Instruments Ltd. LP900 spectrometer, equipped with a CCD camera, in combination with a Continuum Surelite OPO laser (for further details see section 1). The samples were kept at ~20ºC during the measurements, using a water-cooled cuvette holder. Time resolved spectra were recorded pseudo-randomly, with delays between 119 ns and 8 s. The gate width was selected between 10 ns and 10 ms at 5% of the delay time. For each time point between 60 and 10 spectra were accumulated using a cycle time of 20 s. The wavelength scale of the spectrophotometer was calibrated with a holmium filter; the position of the 355 nm line of the Nd:YAG-laser was consistent with this calibration.
2.1.3 Photocycle measurements
Measurements were performed either with a steady state mixture of the pG and the pB state of PYP (obtained with continuous actinic illumination), or with the pG state present exclusively. The steady state mixture of PYP intermediates was excited with either a 355 nm laser flash (Nd:YAG, 5 (±1) mJ/pulse) or with a 446 nm laser flash (OPO, 7 (±1) mJ/pulse). The sample containing pG exclusively was excited with a 446 nm laser flash (OPO, 7 (±1) mJ/pulse). Flash intensities were varied through adjustment of the laser pump voltage. With 355 nm laser flash excitation a new sample was used regularly to minimize the effects of sample deterioration. For all samples used, the decrease in absorbance at 446 nm due to photo-deterioration of the sample was less than 2%.
2.1.4 Analyses of time gated spectra:
Global analysis was performed as described in (Hoff et al. 1994a). The transient absorption data, accumulated in the presence of background light, were modeled as follows: All spectra before and after the excitation were analyzed simultaneously. The kinetic model used described the background light excitation by a pseudo rate constant kI, which depended upon the effective background light intensity I. This kI was a fitting parameter for each time delay, to allow for the fluctuations in the equilibrium concentrations of pB and pG, caused by slight differences in cuvette position with respect to the continuous actinic light source used to create the background light. Typically kI was 2 to 3 times as large as the rate of the recovery reaction of pB back to pG. The concentrations of the four species, pR, pB, pBt and pG, obey a set of coupled differential equations as described in Equation 5.
75

Chapter 3 Branching reaction
−−
+
−−
−−
=
βα
αβ
δ )(t
pG
pB
pB
pR
kkk
kk
k
kk
pG
pB
pB
pR
dt
d t
I
I
t
0
00
000
00
23
21
3
1
Equation 5
The 355 nm laser flash δ(t) excites a proportion α of pB to pBt, and a (much smaller) proportion β of pG to pR, whereas the background light only excites pG to pR (with pseudo rate kI). A contribution of the background light to the branching reaction can be neglected, because of the lack of overlap between the color of this background light and the absorbance spectrum of pB. Furthermore, an independently measured ground state spectrum was added to the data, and the amplitude of the spectra of pB and pBt were assumed to be zero at wavelengths larger than 425 nm (Meyer et al. 1987; Hoff et al. 1994a). This latter constraint is necessary in order to be able to estimate all kinetic and spectral parameters. The 446 nm excitation data are analyzed according to the same procedure, except that pBt and α are omitted from Equation 5. In the present study, in which time-gated spectra were recorded, all transitions in the photocycle of PYP were fitted with mono-exponential kinetics, largely because of lack of a sufficiently large signal to noise ratio to discriminate between mono- and bi-exponential kinetics of these transitions, or even more complex kinetics (compare section 3 and (Hoff et al. 1994a; Hoff et al. 1997a)).
2.2 Results To study the PYP photocycle branching reaction, originating from the pB intermediate, a steady state
mixture of pG and pB was generated with actinic illumination. Typically, in such mixtures about 70 % of the PYP molecules are in the pB state. Subsequently, a 355 nm laser flash (FWHM = 6 ns) was used to selectively excite the pB intermediate. Absorbance transients with ns time resolution were measured up to 10 s after the flash and global analysis was performed on the data obtained (Figure 31). This analysis showed the presence of a previously undetected intermediate that we propose to name pBt. This intermediate is slightly blue-shifted with respect to pB (Figure 31 d). Within the time-resolution of our set-up pBt is formed instantaneously after laser flash excitation (Figure 31 c). pBt subsequently relaxes to pG on the μs time scale (Figure 31 c and Table 11).
With 355 nm laser flash excitation it is also possible to excite pG (see e.g. (Hoff et al. 1997a)). This will result in the subsequent formation of the intermediates pR and pB, before the system returns to the steady state. However, when the intensity of the laser flash is chosen sufficiently low, and the steady state mixture of intermediates predominantly contains pB, such a contribution by pG excitation can be neglected. This latter approximation holds for the measurements presented here. When, in contrast, the 355 nm laser energy was high, contributions from both pB and pG excitation were indeed observed (data not shown).
To determine whether or not the use of a steady state mixture of pG and pB influences the regular photocycle of PYP, measurements with 446 nm laser excitation were compared between a sample containing a light-induced steady state mixture of pB and pG and a sample containing only pG. Difference spectra of these experiments are shown, together with those of the experiment with 355 nm excitation, in panels a, c, and e of Figure 32. The difference between the difference-spectra obtained with 446 nm excitation (Figure 32 a and c) and those obtained with 355 nm excitation (Figure 32 e) is striking. The two sets of difference spectra obtained with 446 nm excitation (Figure 32 a and c) look very similar and both show the formation of the pB intermediate (dashed and dot-dashed) from the pR intermediate (solid and dotted). For all three experiments the singular value decomposition showed two significant singular values, implying that the data contain two relevant components (panels b, d and f of Figure 32). For excitation with a 446 nm laser flash, these components are the formation of pB from pR and the return from pB to pG and to the steady state mixture of pG and pB, respectively (Panels a and b, and panels c and d of Figure 32, respectively). For excitation with a 355 nm laser flash these are the formation of pG from pBt, and the return to the steady state mixture from pG (Figure 32 e and f). In Table 11 the results of the global analysis of the three different experiments are shown. Comparison of the rates of corresponding photocycle transitions does show minor variations, which we consider insignificant. The absolute values of these rate constants are largely in agreement with previously published values (Meyer et al. 1987; Hoff et al. 1994a; Hoff et al. 1997a). We therefore conclude that the photocycle kinetics of PYP are not significantly affected by the actinic illumination.
76

Chapter 3 Branching reaction
Figure 31. Global analysis of the data obtained with transient absorbance measurements with 355 nm laser flash excitation. Panels a and b: Fit of the absorption spectrum obtained after 0.5 μs and 31 ms respectively. Panel c: Concentration profiles of pG (circles), pB (diamonds), and pBt (triangles), before (dashed lines, solid symbols) and after (solid lines, open symbols) the laser flash. Data points in this panel have been culled for clarity. Panel d: Estimated spectra of pG (dashed line), pB (dotted line), and pBt (solid line). The absorbance has been plotted relative to pG (εpG, 446 = 45.5 mM-1·cm-1 (Meyer et al. 1989)).
Table 11. Results from global analysis on the data of the tree separate data sets. The estimated standard error has been indicated between parentheses only when it is larger than 1 in the last decimal.
sample pB/pG pB/pG pG
λex (nm) 355 446 446 excited (%) 12
(of pB present) 27
(of pG present) 32
kpR→pB (ms-1) - 4.2 3.3(3) kpB→pG (s-1) 0.74 0.60 0.72(7) kpB
t→pG (ms-1) 6.8 - - pG λmax (nm) 445 445
εrel 1 1 pR λmax (nm) - 463 (2) 460 (2)
εrel - 0.67(3) 0.62 (3) pB λmax (nm) 363 363 363
εrel 0.36 0.34 0.35 pBt 354 - - λmax (nm)
0.54(2) - εrel -
77

Chapter 3 Branching reaction
In each of the three experiments the extinction coefficient and shape of the UV/Vis spectra of the different intermediates were also estimated in the global analysis (e.g. Figure 31 d and Table 11). Of all four intermediates a spectrum is shown in Figure 33 a. The spectra of pB and pR have been taken from the data-set in which the mixture of pG and pB was excited with a 446 nm flash; for pBt the corresponding data set with 355 nm excitation was used. The pG spectrum is shown only for comparison and was obtained with static UV/Vis absorption spectroscopy.
Figure 32. Difference spectra and singular values of the matrix of time-gated spectra. Difference spectra at 119 ns (solid line), 15 μs (dotted line), 1.95 ms (dashed line) and 250 ms (dot-dashed line) and singular values of the matrix of time-gated spectra. Panels a and b: pG sample excited with 446 nm laser flashes; Panels c and d: steady state mixture of pG and pB, excited with 446 nm laser flashes; Panels e and f: steady state mixture of pG and pB, excited with 355 nm laser flashes.
78

Chapter 3 Branching reaction
2.3 Discussion
Here we have used a steady state mixture of pB and pG to characterize a branching reaction in wild type PYP from E. halophila, that is induced by excitation of the pB intermediate. We detected a new intermediate in this branching pathway, which is slightly blue-shifted with respect to pB and which recovers to pG on the microsecond time scale. This latter rate is approximately a thousand-fold faster than the thermal recovery from pB back to pG in the dark. The branching reaction was not observed when 446 nm light was used to excite the steady state mixture of pB and pG. This is as predicted when the observed branching reaction, elicited with 355 nm light excitation, indeed originates from pB and is in agreement with our assumption that the pB intermediate does not show absorption at wavelengths above 425 nm (see section 2.1). Figure 33 b shows the photocycle of PYP with this new branching reaction incorporated. The protonation state of the new pBt intermediate (with a λmax at 354 nm) is evident from its strongly blue-shifted absorbance maximum with respect to pG, similar to that of pB. It should be noted that the λmax, determined for pB in the current data set, is at a slightly longer wavelength than previously determined values (i.e. 363 nm vs. ~340 to 357 nm (Meyer et al. 1987; Hoff et al. 1994a; Hoff et al. 1997a)). Nevertheless, the difference in λmax between pB and pBt, measured within one data set, is significant (the standard error in the determination of λmax is ~2 nm for pB-like intermediates; see Table 11).
Figure 33. Absorption spectra of intermediates and update of the schematic representation of the photocycle of PYP. Panel a: Scaled absorption spectra of pG (dashed line), pR (dot-dashed line), pB (dotted line), and pBt (solid line). Molar extinction has been plotted relative to pG (εpG, 446 = 45.5 mM-1·cm-1 (Meyer et al. 1989)). The spectra of pB and pR have been taken from the data set in which a mixture of pG and pB was excited with a 446 nm flash; for pBt the corresponding data set with 355 nm excitation was used. Panel b: Simplified photocycle scheme with the blue-light induced branching reaction, originating from pB, included. Approximate lifetimes have been indicated. The symbols hν1 and hν2 refer to blue (i.e. 446 nm) and UVA (i.e. 355 nm) photons, respectively.
The isomerization state of the chromophore in pG, pR and pB has been resolved with capillary electrophoresis, X-ray diffraction and NMR (Borgstahl et al. 1995; Kort et al. 1996b; Genick et al. 1997b; Dux et al. 1998; Perman et al. 1998). As long as similar techniques have not yet been used for the intermediate discovered in this study (i.e. pBt), we presume that its chromophore is in the trans configuration. By comparing the spectral characteristics of pG and pR, as well as of those of pB and pBt (Figure 33 a), it is then evident that, when bound to the protein, the trans form of the chromophore (e.g. pG) is blue-shifted with respect to its cis form (e.g. pR). This shift corresponds to an energy difference of approximately 0.1 eV. In addition, the extinction coefficient in the trans form is higher than that of the cis form. This extrapolates well to the comparison between the pB and the pBt intermediate. In aqueous solution, chromophore model compounds like 4-hydroxycinnamic acid, have an extinction coefficient that is highest in the trans form of these compounds (Aulin-Erdtman and Sandén 1968). These compounds show the opposite behavior, however, with respect to the wavelength of maximal absorbance, which is red-shifted approximately 0.4 eV in the trans derivatives.
79

Chapter 3 Branching reaction
80
The kinetics of the recovery from pBt to pG are a thousand fold faster than those of the dark recovery from pB. This implies that chromophore isomerization is the major rate-controlling factor in the dark recovery of pG from pB. This was also concluded from experiments performed on the Met100Ala mutant of PYP (Devanathan et al. 1998) and also implies that the change in exposure of a hydrophobic patch in the protein, as reported by van Brederode et al. (van Brederode et al. 1996), must be intimately linked to isomerization of the chromophore.
The kinetics of pG formation from pBt are very similar to those of pB formation from pR, although these transitions proceed in opposite direction with respect to the partial unfolding of PYP (van Brederode et al. 1996; Hoff et al. 1999). The combination of conformational change and (de)protonation in both reactions is a microsecond event. The absolute value of these two time constants (i.e. several hundreds of microseconds) is compatible with the assumption that this transition is accompanied by a rearrangement of a considerable part of the protein (i.e. equivalent to a loop of 40 to 50 amino acids, see (Goldbeck et al. 1999)).
The intermediate(s) in the main branching pathway in sensory rhodopsin I has/have a clear biological significance (Spudich and Bogomolni 1984). For PYP this is not known yet, since phototactile responses to UV light have not been investigated. However, given the fact that this branching reaction displays microsecond kinetics (note that the ground state recovery in sensory rhodopsin I displays millisecond kinetics) it will be interesting to see whether or not these microsecond kinetics are too fast for a signal to be passed on from PYP to its downstream signal transduction component.
2.4 Concluding remarks
In this study we have characterized the photocycle branching reaction, discovering a new intermediate in the progress. Furthermore, we have shown that re-isomerization of the chromophore is at least one of the rate determining steps in dark photocycle recovery. Further study of this photon induced branching reaction may prove important for a better understanding of photocycle recovery in the dark.
Chapter 3 Deuterium isotope effect
3 Deuterium isotope effect
In the Photoactive Yellow Protein (PYP), as in all proteins, there are many exchangeable protons that can be exchanged for deuterium atoms easily and rapidly. PYP contains 235 exchangeable hydrogen atoms, 42 of which are from (de)protonatable groups. As such, for any characteristic of PYP, in which exchangeable protons play a significant role, it might be possible to observe a deuterium isotope effect (DIE) upon deuteration of the exchangeable protons. In this study we will be mostly concerned with the kinetic deuterium isotope effect (KDIE) of the different photocycle transitions. Both normal and inverse KDIEs can be observed, i.e. in deuterium oxide the reactions can be slower and faster, respectively. For H/D exchange, often a factor of 1.41 (square root of 2) is observed in KDIE experiments, which is caused by the difference in mass of the hydrogen and the deuterium atom. Nevertheless, larger factors are also frequently measured, reflecting hydrogen-tunneling mechanisms (Kohen and Klinman 1999). The KDIE will not only help to determine reaction mechanisms within the photocycle, but by analyzing it in combination with the pH dependence that most PYP photocycle reactions display, it is possible to determine whether these reactions are dependent on the hydronium ion or on the hydroxide ion concentration. This is of crucial importance when comparing data obtained in H2O and D2O at different pH or pD values.
In this study we have been able to confirm known reaction mechanisms in the photocycle of PYP, elaborate on certain photocycle transitions, and obtain more information about the details of the third basic photocycle step. Combining the pOH (or pH) dependence and the KDIE has been crucial in our approach. Furthermore, the results from this study will aid in choosing optimal conditions in future studies of specific photocycle events and/or intermediates.
3.1 Materials & Methods
3.1.1 Sample preparation
In this study only wild type PYP with its His-tag removed was used. The production and purification of PYP is described in Chapter 2 section 1. Samples for the time trace experiments were prepared by mixing the following four solutions. 1) Water or deuterium oxide (1.8-2.0 ml). 2) A buffer mixture in water or deuterium oxide (176 μl), consisting of citric acid, 1,3-bis[tris(Hydroxymethyl)methylamino]propane, and 3-[Cyclohexylamino]-1-propanesulfonic acid (250 mM each). 3) Wild type PYP in deuterium oxide buffer mixture (4.8 μl). 4) A 1 M sodium hydroxide or sodium deuteroxide solution (0-160 μl). After mixing, the pH was measured with a Mettler Toledo InLab®423 pH-electrode. The pD was obtained by adding 0.4 to the electrode reading (Glasoe and Long 1960). Samples ranging in pH from 5.1 to 10.6 and ranging in pD from 5.7 to 11.5 were obtained. The optical density at the absorption maximum of wild type PYP of the samples was approximately 0.5. Samples for the time gated spectra experiments were prepared by making a batch solution of wild type PYP in 20 mM of the buffer mixture in water described above at pH 8.10 and 9.55.
3.1.2 Transient (ms/s) UV/Vis measurements
An HP 8453 UV/Vis diode array spectrophotometer was used with a time-resolution of 100 ms. Spectra were collected from 210 to 600 nm. Samples were flashed with a 500 μs photoflash. Samples were measured at room temperature, just before the start of the accompanying laser-flash photolysis measurements.
3.1.3 Laser-flash photolysis spectroscopy
We used an Edinburgh Instruments Ltd. LP900 spectrometer, equipped with a photomultiplier and a CCD camera, in combination with a Continuum Surelite OPO laser (for further details see section 1). The PYP sample was excited with 446 nm laser flashes of ~5-6 mJ/pulse (pulse width 6 ns). During the measurements the sample was kept at 20ºC in a Peltier controlled cuvette holder. Time-traces were recorded at 500, 450, and 360 nm with the slow-board option of the photomultiplier (time-resolution ~2 μs). Optical interference filters were used before the sample to minimize measurement artifacts induced by probe light. The following time-windows were measured for all three wavelengths, –10 to 190 μs (0.2 μs resolution), and –1 to 19 ms (20 μs resolution). In addition, for traces at 450 and 360 nm one of the following time-windows was used, depending on recovery rate, –0.25 to 4.75 s (5 ms resolution), –0.5 to 9.5 s (10 ms resolution), or –1 to 19 s (20 ms resolution).
81

Chapter 3 Deuterium isotope effect
Time gated spectra were recorded pseudo-randomly with the CCD camera in order to prevent long-term trends in the data. 80 time points were chosen, evenly spaced on a logarithmic time-scale between 30 ns and 2 s. A gate of 5% of the delay time was chosen with 10 ns as minimum and 10 ms as maximum.
3.1.4 Data analysis
Data from the different time-windows were merged, correcting for any intensity differences between the traces. Merged traces obtained at a single pH or pD were analyzed simultaneously. For the initial analysis with a simple sequential model, the program Origin 6.0 (Microcal Software, Inc.) was used. For analysis with more complex models the merged traces were analyzed with a global fitting program described elsewhere (van Stokkum et al. 1994), making use of the Target Analysis method (van Stokkum and Lozier 2002). For the Target Analysis to succeed, several spectral constraints needed to be introduced for the model depicted in Figure 37 a. The intermediate pR has no contribution at 360 nm. The intermediates pB and pB’ only have a contribution at 360 nm and do not contribute to the 450 and 500 nm traces. The intermediate pBdeprot only contributes to the 450 nm trace. Due to a discrepancy between the recovery kinetics of the 360 and 450 nm trace, which is caused by a probe light induced branching reaction in the 360 nm trace, a correction needed to be introduced in the model. Two corrections were tried, which are described in the Results section.
For the analysis of the CCD data, the complex model used for the analysis of the time traces was found to be too complex with regard to ground state recovery. As such the part of the complex model describing pB formation was used in conjunction with a simple one-step recovery from pB to pG (see Figure 39 a). Two constraints were used in the Target Analysis, i.e. pB’ and pB are zero above 425 nm. These constraints were found valid by also testing the constraints that pB’ and pB are zero above 460 nm, which resulted in approximately zero absorption between 425 and 460 nm for both pB’ and pB. Also, as a reference a calculated absorption spectrum of the ground state was used (see section 3.2).
3.2 Results Since the photocycle kinetics of PYP are pH dependent (Genick et al. 1997a), a kinetic analysis was
carried out in a large pH range (5.1 to 10.6) and pD range (5.7 to 11.5), to distinguish between pH and deuterium isotope effects on the photocycle kinetics. At 20°C the dissociation constant of water pKw (with Kw in mol·l-1) is 14.1669 for H2O and 15.049 for D2O (Weast 1988). Due to this difference in pKw, a clear distinction can be made in plotting data as function of pH / pD or pOH / pOD, when comparing data obtained in H2O and D2O. In fact, data obtained in D2O appears to shift 0.88 units with respect to the same data obtained in H2O when plotted as function of pOH / pOD instead of pH / pD. For a property with a clear pH dependence it is then possible to determine if this dependence is indeed a pH (hydronium ion) or in fact a pOH (hydroxide ion) dependence. Both types of dependence can be observed in PYP and data is plotted accordingly in this study. The choice between pH and pOH dependence is mainly based on an alignment of the shape of the curves. In some cases the underlying chemistry of the used photocycle model was also used to base a choice on.
Figure 34. Spectral deuterium isotope effect. In panel a the fitted spectra of the species involved in ground state recovery are shown for pH 5.1, 7.9, 9.2, 9.8, 10.1 and 10.6. The transition between the two peaks has a pKa of 10. In panel b the absorption maximum of pG (circles) and pB with a protonated chromophore (triangles) is plotted as function of pOH/pOD for the samples in H2O (filled symbols) and D2O (open symbols).
82
Chapter 3 Deuterium isotope effect
Besides kinetic effects, there may also be some spectral effects due to the substitution of hydrogen atoms for deuterium atoms. Therefore transient spectra were recorded with a time resolution of 100 ms for each sample and the difference spectra, representing the recovery component, were determined. After subtracting the contribution of the pG spectrum (using a calculated pG spectrum) from these difference spectra, the absorption bands of species other than pG were obtained (see Figure 34 a). At high pH the chromophore in pB becomes deprotonated, forming a species which is red shifted with respect to pB and appears with an apparent pKa of 10 and a cooperativity constant, n, in the Henderson-Hasselbalch equation of 0.74. This is in line with earlier observations (see Chapter 2 section 2). From these spectra the absorption maxima of the pB state were determined. In the case where pB is present with both a protonated and deprotonated chromophore the peak maximum of pB with a protonated chromophore was determined via deconvolution of the spectrum. In Figure 34 b the peak maxima of pG and pB are compared for the protein in H2O and in D2O. As these absorption maxima appear to be dependent on the hydroxide / deuteroxide ion concentration of the solution, they are plotted as function of pOH / pOD. For pG a red shift of 2 nm is observed for the deuterated samples. For pB the deuterated samples show a blue shift of ~2 nm over a large range, which changes to a red shift above pOH ~8.5. In addition, pB shows a clear pOH dependence of the peak maximum, which shifts over a range of 5 nm in H2O. Contrary to pB, pG shows a negligible pOH dependence of the peak maximum. As a control we also carried out a titration of the chromophore in a protein denatured with 8 M guanidine hydrochloride. In this titration the chromophore has a pKa of 8.7 and an n of 1 (data not shown).
To determine the photocycle kinetics with microsecond time resolution, traces were recorded at 360, 450 and 500 nm (see Figure 36 a-c for representative traces at pH 7.06). To start with, the data was analyzed using a simple 2 exponent sequential model (see Figure 35 a). This model was also used in an earlier study on the pH dependence of the photocycle of PYP (Genick et al. 1997a). In Figure 35 the pOH dependence obtained with this simple model is shown. As a result of the measurement conditions, the recovery rate measured at 450 nm is slower than that measured at 360 nm (see Figure 35 c). This is caused by the 360 nm probe light, which invokes the photocycle branching reaction, leading to an accelerated recovery (see section 2 and (Miller et al. 1993)). At low pOH the rates at 360 and 450 nm are almost identical. This is probably caused by the presence of pB with either a protonated or a deprotonated chromophore at these pOH values (see Figure 34 a and below). Because of this, both 360 and 450 nm light is able to initiate the branching reaction via pB with a protonated or a deprotonated chromophore, respectively. The rate of formation of pB (see Figure 35 b) shows a normal KDIE (i.e. rate in deuterium oxide is slower) over the entire measured pH range. For ground state recovery (see Figure 35 c and d) an inverse KDIE (i.e. rate in deuterium oxide is faster) can be observed. However, at low pOH this effect diminishes. Interestingly, when measured at 360 nm (see Figure 35 c) the KDIE disappears below pOH ~6, whereas when it is measured at 450 nm it disappears below pOH 4. Presumably this difference is caused by the photocycle branching reaction. The shape of the pOH dependence, both of pB formation and of pG recovery, is similar to the previously determined pH dependency for these reactions (Genick et al. 1997a). The simple model (see Figure 35 a) only provides an acceptable fit at the pH extremes, and is not able to properly describe the data over the entire measured pH range. This is illustrated in Figure 36 d where the root mean square deviation (rmsd) of the fits with the simple model (circles) are plotted as function of pH. The increased rmsd values between pH 6 and 9.5, together with residuals from the fit of the traces (see Figure 36 a-c for representative fits at pH 7.06) clearly show the inadequacy of this simple model.
A more complex model was subsequently constructed on the basis of what is known from literature and what was inferred from the KDIE observed with the simple model. On the basis of FTIR measurements it was shown that an additional intermediate pB‘ is formed from pR, which precedes pB (Xie et al. 2001). This pB’ has very similar, or possibly the same, spectral characteristics as pB. The pB’ intermediate differs from pR only in one important respect, i.e. where in pR a buried negative charge resides on the chromophore where it can be effectively neutralized via delocalization of the charge, a hydrogen bonding network and the vicinity of a positive charge from Arg52, in pB’ this buried negative charge resides on Glu46 where it no longer can be effectively neutralized. This is a stressful situation for the protein that potentially can be resolved in two different ways. One, Glu46 could be protonated by the chromophore, i.e. a return to the pR state. Two, formation of pB. Indeed, only when the formation of pB’ from pR is considered to be reversible, does the incorporation of this intermediate significantly improve the fit. This is illustrated by a fit on the data at pH 7.06 (see Figure 36). Here the rmsd obtained with the simple model represented in Figure 35 a is 1.32 mOD. The addition of the pB’ intermediate in a unidirectional reaction results in an rmsd of 1.29 mOD, which is only a very small decrease. However, by making the pR to pB’ reaction reversible an rmsd of 0.62 mOD is
83

Chapter 3 Deuterium isotope effect
obtained, which is a significant reduction. With respect to pB formation the addition of the pB’ intermediate in equilibrium with pR, was sufficient to obtain an acceptable fit of the part of the data representing pB formation.
Figure 35. KDIE obtained with the simple photocycle model. In panel a the photocycle model, used to analyze the data presented in panels b - d, is shown. Data obtained in H2O is represented with closed symbols; data obtained in D2O with open symbols. All data is plotted as function of pOH / pOD. In panel b the rate representing pB formation (k1) is shown. In panel c the ground state recovery measured at 360 nm (k2) is shown. The dashed line represents recovery at 450 nm in H2O. In panel d the ground state recovery measured at 450 nm (k3) is shown.
On the basis of the inverse KDIE of the recovery rate obtained with the simple model, we conclude that deprotonation of the chromophore by a hydroxide ion from solution is likely involved before isomerization of the chromophore takes place (see Discussion). Therefore we included a new photocycle intermediate, which we have named pBdeprot, that is formed from pB. As this intermediate is formed through a (de)protonation reaction, it is most likely that this reaction is reversible. As a result of the addition of this equilibrium between pB and pBdeprot, the rmsd of the fit at pH 7.06 was further lowered from 0.62 to 0.50 mOD. Note that the incorporation of the pBdeprot intermediate in the recovery step is purely based on the observed KDIE, not on the UV/Vis traces themselves. The resulting model as depicted in Figure 37 a was then used to fit the data. As indicated by the analysis with the simple model, it is necessary to correct for the fact that the recovery kinetics differ between the 360 and 450 nm traces. Two types of correction were tried. For the first a branching reaction from pB directly to pG, only present in the 360 nm data, was incorporated. In the second the pBdeprot to pG reaction is considered separately in the 360 and 450 nm traces. The results obtained with both types of correction were very similar, with the exception of the pB to pBdeprot equilibrium. The rate constants obtained for this equilibrium showed relatively large errors with the first branching correction, while the second branching correction did not display this problem. Therefore, the more complex model was used with the incorporation of the second branching correction. With the described more complex model an acceptable fit over the entire measured pH range was obtained (see Figure 36 d).
84

Chapter 3 Deuterium isotope effect
Figure 36. Comparison between the simple and the complex model. Data recorded at 360 (panel a), 450 (panel b) and 500 nm (panel c) is shown for pH 7.06. The data is represented by dots. The solid line gives the fit with the complex model and the dashed line with the simple model. Accompanying residuals are shown in the lower part of the panels. Note the different scales. In panel d the rmsd obtained for the fits of the data in water with the simple (circles) and complex (stars) model are shown as function of pH.
For the pR to pB’ reaction (see Figure 37 b) a normal KDIE can be observed over the entire pOH range. The reverse reaction (see Figure 37 c) shows a normal KDIE between pOH 5.7 and 6.5, no KDIE at higher pOH values, and an inverse KDIE at lower pOH values. Formation of pB from pB’ (see Figure 37 d) shows no clear KDIE at low pOH values, a normal KDIE at intermediate pOH values going to a normal or inverse KDIE for higher pOH values. It is good to note here that at the pH extremes the simple photocycle model was able to describe the data equally well (see Figure 36 d) and showed a normal KDIE at both pH extremes for the formation of pB (see Figure 35 b).
For the formation of pBdeprot from pB (see Figure 38 a) no KDIE is observed at lower pOH values and an inverse KDIE at pOH values above ~5. The reverse reaction (see Figure 38 b) shows a pH dependence with no KDIE at lower pH values and an inverse KDIE at pH values above ~8. For the last step in the photocycle, i.e. formation of pG from pBdeprot, rates were obtained specific for the 450 nm data set (see Figure 38 c) and the 360 nm data set (see Figure 38 d). In the data from the 450 nm data set a pOH dependence is observed with no KDIE below pOH ~6.5 , and an inverse KDIE for pOH values above ~6.5. In the data from the 360 nm data set no clear KDIE could be observed due to the relatively large error in the rate constants. Interestingly, we have been able to dissect the observed KDIE of the simple photocycle model into reactions with different dependencies (pOH and pH), and with different KDIEs using the more complex model depicted in Figure 37 a. This supports the application of this more complex model.
85

Chapter 3 Deuterium isotope effect
Figure 37. KDIE obtained for pB formation with the complex model. In panel a the photocycle model used to analyze the data presented in panels b - d and Figure 38 is shown. Data obtained in H2O is represented with closed symbols; data obtained in D2O by open symbols. Triangles denote values that were forced in the analysis. Error bars are shown for data points where the error is larger than the size of the symbol. Data is plotted as function of pOH / pOD. In panel b the rate representing pB’ formation (k1) is shown. The dashed line represents the values for the reverse reaction in H2O. The KDIE of this reverse reaction (k-1) is illustrated in panel c. In panel d the formation of pB from pB’ (k2) is represented.
In addition to the kinetic traces at specific wavelengths with microsecond time resolution, spectral data with nanosecond time resolution were collected at pH 8.10 and 9.55. For the analysis of these data it is necessary to use the absorption spectrum of the ground state as a reference. However, we have noticed that the measured ground state spectrum is possibly not suitable. This is indicated by the following: When the measured ground state spectrum is subtracted from spectra obtained with 100 ms time resolution or through accumulation of the pB intermediate with continuous wave irradiation, we find a pR-like residue. In these spectra the presence of a significant amount of pR is not expected. Also, when the measured ground state spectrum is used as a reference in the analysis of time-gated spectra on a nanosecond to second timescale, the spectrum of pR contains a long, offset like, tail on the blue side of the absorption peak (Hoff et al. 1994a). Lastly, when the complex model depicted in Figure 37 a is used, the pR intermediate has a clear fast decay component similar to that found in the absorption traces, but also a slow decay component similar to the decay rate of pB, which is not observed in the absorption traces. In an attempt to simulate a ground state spectrum we found that the ground state spectrum can be simulated very well by two skewed Gaussians (Fraser and Suzuki 1969; Sevilla et al. 1989) above 385 nm. The maxima of these two skewed Gaussians were selected to be at 425 and 452.4 nm, values that have been observed in a low temperature study (Masciangioli et al. 2000). We determined an appropriate calculated ground state spectrum via a global analysis of five time-gated difference spectra that did not contain a pR signal, using the Origin 6.0 program. The resulting calculated ground state spectrum is very similar to the measured ground state spectrum, but has a little less absorption on the red side of absorption spectrum and has no residual absorption on the blue side of the absorption spectrum (see Figure 39 b). This calculated ground state spectrum was then used as reference in the Target Analysis. The calculated ground state spectrum improved the analysis significantly, which is demonstrated by the absence of the offset like blue absorption in the absorption spectra of pR that were determined with the Target Analysis (see Figure 39 c).
86

Chapter 3 Deuterium isotope effect
Figure 38. KDIE obtained for recovery with the complex model. In Figure 37 a the photocycle model used to analyze the data presented in this figure is shown. Data obtained in H2O is represented with closed symbols; data obtained in D2O by open symbols. Error bars are shown for data points where the error is larger than the size of the symbol. Data is plotted as function of pOH / pOD with the exception of the data in panel b, which is plotted as function of pH / pD. In panel a the rate representing pBdeprot formation (k3) is shown. The dashed line represents the values for the reverse reaction in H2O. The KDIE of this reverse reaction (k-3) is illustrated in panel b. In panels c and d the formation of pG from pBdeprot is plotted for data recorded at 450 nm (k4) and 360 nm (k5) respectively.
As the time resolution of the CCD dataset was higher than the one of the time traces, we were able to see a relaxation of the pR intermediate. This relaxation has also been observed recently in transient grating experiments (Takeshita et al. 2002a; Takeshita et al. 2002b). Therefore an additional step in the photocycle was introduced that reflects this, i.e. a unidirectional reaction from pR1 to pR2 (see Figure 39 a). With the time traces we saw that the rmsd of the analysis improved tremendously upon introduction of the reversible character of the pR to pB’ transition. In the CCD data the improvement in rmsd is not as dramatic with a change from an rmsd of 4.59 mOD for the simple model (see Figure 35 a) to an rmsd of 3.86 mOD for the more complex model depicted in Figure 39 a (compare the rmsd change of 1.32 mOD to 0.62 for the time traces at pH 7.06). Though we also tried the complex model depicted in Figure 37 a, the quality of the data was not sufficient to use this model confidently. As such we present the results obtained with the somewhat less complex model as depicted in Figure 39 a. As Figure 39 c indicates the absorption spectra of both pR species are very similar where pR1 has a slightly higher extinction coefficient than pR2. Note that the offset like blue absorption of the pR spectra observed before (Hoff et al. 1994a), has disappeared as a result of using the calculated ground state spectrum as a reference. Also, the pB’ intermediate seems to be slightly red shifted with respect to the pB intermediate (see Figure 39 d). The spectra of the intermediates obtained at pH 9.55 (not shown) are very similar to those found at pH 8.10. The rate constants obtained in the analysis of the CCD data at pH 8.10 and pH 9.55 (see Table 12) agree with those found with the UV/Vis traces.
87

Chapter 3 Deuterium isotope effect
Figure 39. Spectral analysis of the photocycle at pH 8.1. In panel a the photocycle model used to analyze the CCD data is shown. Panel b shows the measured ground state spectrum as dots (1 out of every 6 data points is shown). The calculated ground state spectrum is shown as a solid line with the contribution of the 425 nm and 452.4 nm skewed Gaussian to this fit, shown as dashed lines. In panel c the absorption spectrum of pR1 (dashed line) and pR2 (solid line) obtained in the analysis are shown. Panel d presents the absorption spectrum of pB’ (dashed line) and pB (solid line) obtained in the analysis.
The effect of acid denaturation of PYP was also studied. The pKa for pBdark formation in H2O and D2O were determined as 2.7 and 3.2 respectively. In both solvents the cooperativity constant n in the Henderson-Hasselbalch equation is 1.5, which is within the previously reported range for this value (Hoff et al. 1997a). This indicates that PYP is less stable in D2O. Ionic hydrogen bonds could play an important role in the stability of PYP, as these bonds are less strong in D2O.
Table 12. Rate constants obtained from the CCD data sets. Rate constants obtained from the CCD data sets, using the model depicted in Figure 39 a. The estimated standard error in the last digit is indicated in parentheses.
pH k1 (s–1) k2 (s
–1) k-2 (s–1) k3 (s
–1) k4 (s–1)
8.10 59(7)·104 2400(130) 2700(400) 1840(160) 4.65(4) 9.55 20(4)·105 2350(80) 710(100) 440(70) 4.49(6)
3.3 Discussion
As a result of changing the solvent from H2O to D2O, exchangeable hydrogen atoms in PYP are exchanged for deuterium atoms. Consequently, any property of the protein in which an exchangeable hydrogen atom is involved may be influenced. Additionally, there are several (de)protonatable groups that may induce a pH or pOH dependence in any property of PYP. It is possible to distinguish between a pH and pOH dependence via the DIE. We have mainly investigated effects on photocycle kinetics, but also e.g. information concerning the absorption maximum of the ground and signaling state was obtained.
Spectral tuning of the 4-hydroxy cinnamic acid chromophore in the PYP ground state can be divided into three contributions (Yoda et al. 2001), i.e. counter ion effect (5300 cm–1), medium effect of the protein matrix
88
Chapter 3 Deuterium isotope effect
(700 cm–1), and hydrogen-bonding effect (–1600 cm–1). This latter contribution is likely the cause of the observed 2 nm red shift of the ground state spectrum in D2O (see Figure 34 b). In the ground state the chromophore is involved in two ionic hydrogen bonds (Borgstahl et al. 1995). Such hydrogen bonds become weaker when deuterium is the bridging atom (Scheiner 2000). As such, in D2O the contribution of the hydrogen-bonding effect to the spectral tuning is less, i.e. a smaller blue shift, which effectively results in a red shift of the main band in the visible absorption spectrum. For the signaling state, pB, a spectral deuterium isotope effect was also observed. Interestingly, the isotope effect changes from a blue to a red shift as function of pOH. When the absorption maxima are plotted as function of pH the change from a blue to a red shift occurs around pH 7.5. No property with an apparent pKa of 7.5 has been observed for PYP as of yet. When plotted as a function of pOH (see Figure 34 b) the change from a blue to red shift occurs around pOH 8.5, which is equal to a pH of 5.5. In earlier studies a pKa of 5.5 has been correlated with a change in folding state of pB (see Chapter 2 sections 2,3, and 4). A pOH dependence of the absorption maximum of pB is therefore likely. Especially since a change in folding state of pB could also explain the change from a blue to a red shift. As in pB the chromophore is protonated, it is likely that any effect on tuning in pB involving exchangeable hydrogen atoms is mainly caused by hydrogen-bond(s) formed by the hydroxy group of the chromophore. Here a distinction can be made between neutral and ionic hydrogen bonds. Whereas ionic hydrogen-bonds become weaker when deuterium becomes the bridging atom, in neutral hydrogen bonds, the bond becomes stronger when deuterium is the bridging atom (Scheiner 2000). Consequently, a blue shift would indicate involvement of (a) neutral hydrogen bond(s) and a red shift involvement of ionic hydrogen bonds. It is unclear whether the change from neutral- to ionic hydrogen bonding is due to a change in hydrogen-bonding partner or a change of the protonation state of the hydrogen-bonding partner. Interestingly, the possible ionic hydrogen bond is formed in the pB state that is supposedly more folded (see Chapter 2 sections 3). Furthermore, it has now been shown for the first time that the absorption spectrum of pB is pOH dependent. The interpretation that in pB the phenolic hydroxy group is involved in (a) hydrogen bond(s) with the protein is supported by the fact that the pKa of this hydroxy group in pB is about 10, as is shown in Figure 34 a (see also Chapter 2 section 2). Without such an interaction one would expect the pKa to be 8.7 as indicated by pH titration of the denatured protein. It is assumed here that the pKa of the chromophore in the cis configuration is very similar to that of the chromophore in the trans configuration.
To determine the KDIE for the photocycle of PYP, the progress of the photocycle was monitored at three representative wavelengths. The resulting traces were first analyzed with a simple photocycle model (see Figure 35 a). Though the shape of the pOH dependence (see Figure 35 b - d) compares well with the previously published pH dependence for pB formation and pG recovery (Genick et al. 1997a), our rate constants are about a factor of 3 lower for both transitions. The reason for this discrepancy is unclear, but may lie in the fact that different buffers were used in the two studies. Also different illumination conditions may have had an influence. E.g. a difference in intensity of light that can induce the photocycle branching reaction, can lead to significant differences in the rate of pG recovery (Miller et al. 1993). Note, that in previous, non pH dependent, studies, recovery rates similar to those found in this study were reported (see Chapter 2 section 3, and (Meyer et al. 1989; Hoff et al. 1994a)). As the simple photocycle model is not able to accurately fit the data over the entire measured pH range (only at the pH extremes is it able to accurately describe the data), a more complex model (see Figure 37 a) was designed. With respect to pB formation, the different photocycle reactions in this complex model reflect the following reactions. The formation of pB’ from pR is characterized by the protonation of the chromophore by Glu46. This results in a shift of the buried negative charge from the chromophore to Glu46, where it can no longer be effectively stabilized. This introduces a stress situation for the protein that can be resolved by either returning to pR or forming pB. During the formation of pB from pB’ the protein undergoes a structural change. We have shown that formation of pB, as described by the complex model, is able to accurately describe pB formation over a large pH range. As such, it also explains the previously observed bi-exponential behavior of the pR to pB transition (Meyer et al. 1987; Hoff et al. 1994a). The large improvement in rmsd shown in Figure 36 d for the fit with the complex model (see Figure 37 a), compared to the simple model (see Figure 35 a), is mainly caused by the improvement of the model regarding pB formation.
For the recovery step a reasonable fit was obtained with the simple model. However, an inverse KDIE was observed for pG recovery (see Figure 35 d). An inverse KDIE could indicate that the breaking of an ionic hydrogen bond is part of a rate determining step, as ionic hydrogen bonds are weaker when deuterium is the bridging atom (Scheiner 2000). In light of the spectral deuterium isotope effect described above, this is unlikely. The spectral deuterium isotope effect suggests that the chromophore is most likely involved in a neutral hydrogen bond for most of the measured pH range. Alternatively, the inverse KDIE could suggest that
89

Chapter 3 Deuterium isotope effect
deprotonation of the chromophore by a hydroxide ion from solution is a rate determining step. As the deuteroxide ion is a stronger base than the hydroxide ion (Scheiner 2000), it is a more potent proton extractor. This also explains the apparent pOH dependence of this reaction. Furthermore, it has already been shown that when the chromophore is deprotonated it isomerizes more easily (Sergi et al. 2001). This makes it likely that the chromophore needs to be deprotonated before re-isomerization of the chromophore can take place. A mechanism also proposed on the basis of an in depth analysis (Demchuk et al. 2000) of previously reported pH-dependent kinetics (Genick et al. 1997a). Therefore, an additional intermediate representing the pB intermediate in a deprotonated form pBdeprot was introduced in the model. As formation of pBdeprot is a (de)protonation event it is likely that this reaction is reversible. The model incorporating these characteristics is presented in Figure 37 a. This complex model provided an accurate fit of the data over the entire measured pH range. However, at the pH extremes the model was too complex for the data, resulting in an increased inaccuracy of the obtained rate constants.
pR to pB’
Formation of pB’ from pR (Figure 37 b) shows a pOH dependence. A normal KDIE is observed over the whole measured pH range. The pR to pB’ reaction describes a proton transfer reaction, for which a normal KDIE is expected (Scheiner 2000). It has been suggested in the past that upon pB formation the chromophore is deprotonated by the solvent (Genick et al. 1997b). A normal KDIE would then only be observed if protonation of the chromophore is achieved via water, as D2O is a weaker acid than H2O. Protonation via the hydronium ion would lead to an inverse KDIE as the deuterated form of the hydronium ion is a stronger acid, like the deuterium oxide ion is a stronger base than the hydroxide ion (Scheiner 2000). Though, protonation of the chromophore by water is also compatible with the obtained data, we favor the interpretation that the chromophore is protonated via Glu46, as suggested on the basis of FTIR results (Xie et al. 1996; Xie et al. 2001).
pB’ to pR
Formation of pR from pB’ shows a different pOH dependence as pB’ formation from pR (compare Figure 37 b and c). From this pOH dependence it is clear that at the pH extremes the equilibrium between pR and pB’ shifts toward pB’. This explains why the simple model is able to accurately describe pB formation at the pH extremes. Though the transition from pB’ to pB is spectrally silent at 360 nm (see Figure 39 d), it is made visible through the reversible character of the pR to pB’ reaction which causes the bi-exponential character of the formation of the spectral species representing both pB’ and pB. With a shift of the equilibrium towards pB’ it is no longer possible to make a clear distinction between pB’ and pB on a kinetic basis.
One would expect the pB’ to pR reaction to be a proton transfer reaction like the pR to pB’ reaction. As such a normal KDIE is expected for the whole measured pH range. However, a normal KDIE is only observed for a small pOH range (pOH 5.7 - 6.5). At low pOH values an inverse KDIE and at higher pOH values no KDIE is observed. It is therefore likely that the pB’ to pR reaction may have more than one reaction mechanism. Between pOH 5.7 - 6.5 a proton transfer mechanism, i.e. one in which Glu46 is protonated by the chromophore, may dominate. At low pOH values, a mechanism in which a hydroxide ion extracts a proton from the chromophore and then protonates Glu46 could explain the observed KDIE at low pOH values. In such a mechanism it is likely the protein is already starting to change its fold, allowing a hydroxide ion to enter the chromophore pocket. Then after the proton is transferred via the hydroxide ion, the protein may return to the pR fold. Here the proton extraction by the hydroxide ion is the rate determining step. If the rate determining step would be protonation of Glu46 by the newly formed water molecule a normal KDIE would be expected. Likewise, at higher pOH values, indirect proton transfer via a hydronium ion could explain the absence of a KDIE. Only here, protonation of Glu46 by the hydronium ion and deprotonation of the chromophore via the newly formed water molecule are both rate determining steps, effectively canceling each others inverse and normal KDIEs. Again, for this mechanism to work it is likely that the protein has already started to change its fold, before returning to pR. Alternatively, a water molecule could first deprotonate the chromophore after which the newly formed hydronium ion protonates Glu46. In a recent molecular dynamics study (Groenhof et al. 2002b) it was calculated that after Glu46 donates its proton to the chromophore, the hydrogen bonding network is very quickly lost and structural changes start to occur, which is in line with the above hypotheses.
90

Chapter 3 Deuterium isotope effect
pB’ to pB
Formation of pB from pB’ shows no clear KDIE at low pOH and a normal going to no KDIE at higher pOH values (see Figure 37 d). Basically the protein changes its fold in this step, exposing the chromophore to solvent. The normal KDIE can be explained by the need to break neutral backbone hydrogen bonds. As neutral hydrogen bonds are stronger when deuterium is the bridging atom, it is more difficult to drastically change the protein fold in D2O. At low pOH values, either it is not necessary to break the backbone hydrogen bonds, or breaking them is no longer rate determining, e.g. due to the presence of a buried charge (Xie et al. 2001) which would then drive the structural change. As at very high pOH values the data are not reliable enough, it is not possible to draw conclusions about the KDIE at those pOH values. However, it is clear that the normal KDIE diminishes in going to higher pOH values. This could be explained by a decrease in the extent of structural change accompanying pB formation, as is also suggested to occur at low pH values (see Chapter 2 sections 2,3, and 4), and thus at high pOH values. Less structural change means less backbone hydrogen bonds need to be broken, which would lead to a smaller KDIE. The diminished need for structural change can be explained by protonation of Glu46 by either water or a hydronium ion, effectively removing the buried charge on Glu46, which has been suggested to be the driving force for structural change in the pB’ to pB reaction (Xie et al. 2001). Coincidentally, protonation of Glu46 by a hydronium ion is also the first step in one of the suggested mechanisms for pR formation from pB’ at high pOH.
pB to pBdeprot
As suggested by the analysis with the simple model, the pB to pBdeprot reaction represents deprotonation of the chromophore by a hydroxy ion. As such, the reaction must show a pOH dependence. Interestingly, the inverse KDIE expected for deprotonation of the chromophore via a hydroxide ion is only observed above pOH ~5 (see Figure 38 a). The absence of a KDIE at lower pOH values could be explained by the fact that at low pOH the concentration of hydroxide ions is high and as such the small difference in basicity between hydroxide and deuteroxide ions no longer makes a significant difference for the rate of deprotonation.
In the reverse reaction the chromophore is most likely protonated by a hydronium ion. As such, this reaction is presumably pH dependent. This results in a similar picture as observed for the pB to pBdeprot reaction (see Figure 38 b). A KDIE is only observed for higher pH values, at low pH (below pH ~8) the concentration of hydronium ions is sufficient to mask the difference in acidity between the deuterated and protonated form of the hydronium ion.
The mechanisms described for the reversible reaction of the pB to pBdeprot transition imply that the obtained rate constants contain a contribution from the hydroxide or hydronium ion concentration, i.e. k3 = k3c [OH–] and k-3 = k-3c [H3O
+]. However, after correction of the rate constants, the new rate constants predict that the equilibrium between pB and pBdeprot is reached within 100 ns and has a pKa of ~7.3. This is in contradiction with the pKa of 10 that is found experimentally for the equilibrium between pB and pBdeprot (see above and Figure 34 a). Therefore, the pBdeprot in the complex model not only represents deprotonation of the chromophore, but also implies a certain protein fold, that allows isomerization to take place. Here, deprotonation of the chromophore by hydroxide ions is a rate-determining step only at higher pOH values. Otherwise, structural change is the rate-determining step. Here the structural change leads to no KDIE at lower pOH values either due to the small amount of structural change necessary or due to cancellation of different isotope effects. Similarly, protonation of the chromophore in the return reaction is only a rate determining step at higher pH values and structural change is rate determining where no KDIE is observed.
The inverse KDIE for the pB to pBdeprot reaction disappears below pOH ~5. A pKb of 4 (pKa 10) was determined for the equilibrium between pB and pBdeprot, with a cooperativity constant n in the Henderson-Hasselbalch equation of 0.74. As such at pOH ~5 the equilibrium contains approximately 15% pBdeprot and 85% pB. Assuming that in pBdeprot the phenolate part of the chromophore no longer is involved in hydrogen bonds with the protein and is exposed to solvent, the pKa of the chromophore would be expected to be 8.7 with n is 1, as suggested by pH titration of the chromophore in the denatured protein. It is assumed here that the pKa of the chromophore in the cis configuration is very similar to that of the chromophore in the trans configuration. In this case at the point the KDIE disappears (pH~8) in the pBdeprot to pB reaction an equilibrium between these two intermediates is expected to have 85% pBdeprot and 15% pB. These values are the inverse of the values found in the pB to pBdeprot reaction. Note that the true equilibrium between pB and pBdeprot has a pKa of 10, but that the pKa that is felt by the pBdeprot species in the reaction from pBdeprot to pB is 8.7 in the above assumption. The observation that the implied pBdeprot to pB ratios coincide inversely with the
91

Chapter 3 Deuterium isotope effect
disappearance of the observed KDIE is a sign that the introduction of the pB to pBdeprot equilibrium reaction, in the recovery step of PYP, is justified.
The precise characteristics of the structural change in the pB to pBdeprot step are unclear. It is likely though that the protonation state of the Glu46 residue has an influence on this step. This is based on information about the recovery rate of the Glu46Gln mutant, which displays a faster recovery of the ground state than the wild type protein (Genick et al. 1997a). In the Glu46Gln an amide group effectively replaces the carboxyl group of residue 46. As this is a neutral group, it is likely that Glu46 needs to be protonated in pBdeprot in order for the final recovery step to take place. This is in line with an earlier observation where it was proposed that for recovery to take place, the chromophore has to be in a deprotonated state and the Glu46 needs to be in protonated state (Demchuk et al. 2000).
pBdeprot to pG
In the final reaction from pBdeprot to pG (see Figure 38 c) it is likely that isomerization is the rate-determining step. As isomerization is not likely to involve any exchangeable protons, no KDIE is expected for this reaction. However, this only seems true below pOH ~6.5. Above pOH ~6.5 an inverse KDIE is observed. Interestingly, this is very similar to what was observed in the analysis with the simple model of the 360 nm data (see Figure 35 c), in which isomerization occurs, at least in part, photoactively. It would therefore seem that the observed KDIE is characteristic of the refolding event in the recovery after isomerization has taken place. However, any structural changes following isomerization will likely occur at least 2 orders of magnitude faster than the rates observed for the pBdeprot to pG photocycle step. This conclusion is based on experiments in which acid denatured PYP is re-natured (Lee et al. 2001b) in a pH range overlapping with the pH range showing the inverse KDIE. An alternative explanation is that due to the unfavorable pKa of 10 for deprotonation of the chromophore in pB that at high pOH (low pH) the presence of hydroxide ions may be important for the dark isomerization step in order to keep the chromophore deprotonated long enough for isomerization to take place.
When ground state recovery is compared between the simple and complex model, it is worth noting that an inverse KDIE was observed over almost the entire measured pH range with the simple model, where the kinetics showed a pOH dependence. With the complex model, the obtained rates showed an inverse KDIE for only part of the measured pH range for the pB to pBdeprot equilibrium and the pBdeprot to pG step. Also, not only reactions that showed a pOH dependence were observed but also a reaction that showed a pH dependence. Additionally, through plausible assumptions we were able to show that the point at which the KDIE disappears in both reactions of the pB to pBdeprot equilibrium occur inversely at the same implied pB to pBdeprot ratios. All this supports the relevance of the introduction of the pBdeprot intermediate.
Spectral kinetic analysis
92
With the insight we have obtained through the analysis of the time traces, we have applied the new photocycle model to spectral data of the photocycle recorded at pH 8.10 and 9.55. As these data had nanosecond time resolution, we were also able to observe a transition from one pR-like intermediate to another. Such a transition was recently observed with transient grating (Takeshita et al. 2002a; Takeshita et al. 2002b), and reflects structural relaxation of the protein far from the chromophore. Though, it is claimed that this transition is not observable via UV/Vis spectroscopy, an earlier UV/Vis study (Hoff et al. 1994a) already noted an additional pR-like component could be observed. However, it was ignored as the quality of the data was deemed not good enough to confidently make the distinction between the two pR components. Inclusion of the transition of pR1 to pR2 shows that the two pR intermediates have very similar absorption spectra differing mainly in their extinction coefficient. The reversible character of the pR to pB’ reaction is clearly observed in the dataset recorded at both pH 8.10 and 9.55. This enabled us to determine an absorption spectrum for both pB’ and pB. It is notable that these two spectra are very similar but not identical. The absorption spectrum of pB’ is slightly red-shifted with respect to pB. As the quality of the CCD data was not good enough, we were not able to obtain reliable information with regard to the pBdeprot intermediate introduced on the basis of the KDIE of the photocycle recovery step. This lack of quality of the data is evident from the absence of an additional small shoulder around 430 nm in the pB spectrum at pH 9.55 (data not shown) as would be expected on the basis of the spectra shown in Figure 34 a. It is likely that the absorption spectrum of the pBdeprot intermediate is very similar to that of pG. This is also suggested by the fact that not only deprotonation of the chromophore but also the folding state of PYP is an important feature of this proposed intermediate. As such the absorption spectrum is not necessarily the same as that of the shoulder observed in the pB spectrum at high pH (see Figure 34 a), which is also caused by a pB species with

Chapter 3 Deuterium isotope effect
93
a deprotonated chromophore. The different fold of pBdeprot may cause an additional red shift. In fact, an analysis incorporating pBdeprot resulted in a pG like spectrum for pBdeprot (data not shown). However, as mentioned before we feel the data is not of sufficient quality to confidently draw such a conclusion. It would however explain why this intermediate has not been observed before. Also, it is in line with the observation that refolding, as measured via the Nile Red fluorescent probe (see Chapter 2 section 3) seems to be slightly slower than recovery monitored with UV/Vis spectroscopy at 468 nm.
Acid denaturation
When acid denaturation is compared in H2O and D2O it appears that PYP is less stable in D2O. As ionic hydrogen bonds are less strong in D2O, it is likely that such (a) bond(s) causes the decreased stability. The prime candidates for this are the hydrogen bonds between the chromophore, and Glu46 and Tyr42. These two hydrogen bonds then have a greater influence than the neutral hydrogen bonds which are much more abundant and are stronger when deuterium is the bridging atom.
3.4 Concluding remarks
By comparing pH effects using both H2O and D2O as solvent, we have been able to show that most characteristics in PYP are not pH, but rather pOH dependent; an essential distinction when comparing data obtained in H2O and D2O. Furthermore, we have shown that the pB’ intermediate, which was introduced on the bases of FTIR experiments and contains a protonated chromophore (Xie et al. 2001), is in equilibrium with pR. Its absorption spectrum is slightly red-shifted with respect to pB. On the basis of the KDIE of the photocycle-recovery reaction we were able to show that deprotonation of the chromophore is an essential step before re-isomerization can take place. This necessitates the introduction of a new photocycle intermediate, pBdeprot, to represent this step. This intermediate is in equilibrium with pB. We have shown for the first time that the absorption maximum of pB (containing a protonated chromophore) is pH dependent. Furthermore, the stability of PYP is mainly governed by ionic hydrogen bonds.

This page was left blank intentionally
94
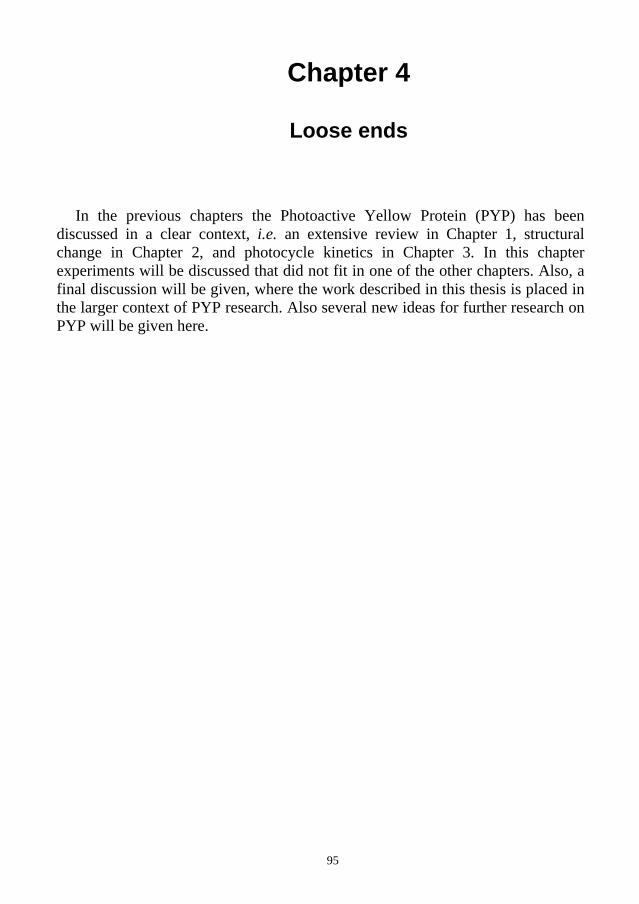
95
Chapter 4
Loose ends
In the previous chapters the Photoactive Yellow Protein (PYP) has been discussed in a clear context, i.e. an extensive review in Chapter 1, structural change in Chapter 2, and photocycle kinetics in Chapter 3. In this chapter experiments will be discussed that did not fit in one of the other chapters. Also, a final discussion will be given, where the work described in this thesis is placed in the larger context of PYP research. Also several new ideas for further research on PYP will be given here.

Chapter 4 Hybrids
1 Hybrids
1.1 Introduction
A major advantage of having an overexpression system that produces apoPYP, is that it is fairly straightforward to introduce non-native chromophores. After the free acid form of the chromophore is activated it can be easily attached to Cys69 of PYP (see Chapter 2 section 1). Several chromophore analogs have been studied, some more extensively than others. This section shortly discusses some of the observed characteristics.
1.2 Materials & Methods
1.2.1 Sample preparation
A series of hybrids of PYP was compared to wild type PYP, all without removal of the His-tag. The production and purification of PYP is described in Chapter 2 section 1. ApoPYP was reconstituted with the following chromophores: I) 4-hydroxycinnamic acid (wild type); II) 3,4-dihydroxycinnamic acid (cafeic acid); III) 3,5-dimethoxy-4-hydroxycinnamic acid (sinapinic acid); IV) 4-aminocinnamic acid; V) 4-fluorocinnamic acid; VI) cinnamic acid, VII) Imidazole-4-acrylic acid; VIII) 4-hydroxy-α-bromocinnamic acid; and IX) 4-hydroxyphenylpropiolic acid (see also Table 13). All but the latter two, which were synthesised by the organic chemistry department of the University of Amsterdam, are commercially available. All chromophores were activated using 1,1’-carbonyldiimidazole (Chapter 2 section 1.1.2).
Absorption spectra were recorded on an HP 8453 UV/Vis diode array spectrophotometer. 10 mM Tris buffer was used to determine the pKa of pBdark formation. All denaturation experiments were performed in the presence of 50 mM Tris pH 8 using urea as denaturant with the exception of the hybrid containing the chromophore 4-aminocinnamic acid, for which guanidine HCl was used as denaturant.
1.3 Results
Due to the straightforward nature of chromophore reconstitution, several commercially available compounds that are similar to 4-hydroxycinnamic acid, were selected and tested. For those hybrids where it was difficult to distinguish a clear chromophore induced absorbance, an additional round of reconstitution was performed on part of the sample, with wild type chromophore, to make sure reconstitution had been successful (little to none of the wild type chromophore will attach if reconstitution was successful). The structure of the free acid form of the chromophore and the absorption maximum of the tested hybrids is presented in Table 13. For several of the chromophores absorption maxima have been reported in literature (Kroon et al. 1996). Only for the absorption maximum of hybrid IV a significant difference was observed (i.e. 405 nm instead of the reported 353 nm). It is not clear where this difference stems from. In addition, the relative stability with respect to wild type PYP was determined via urea/guanidium denaturation for several hybrids (see Table 13). Also, the pKa of pBdark formation (acid denaturation) was determined for several hybrids (see Table 13). For hybrids I-IV and IX the absorption maxima were determined for the free acid, the protein, and the denatured protein at two pH values. A comparison of the obtained values gives an impression with regard to the contribution of the thiol ester bond, deprotonation, and protein interaction to the total tuning of the protein (see Table 14).
96

Chapter 4 Hybrids
Table 13. Characteristics of several hybrid PYPs. A list of used PYP hybrids together with some of the determined characteristics. Behind the pKa the cooperativity constant from the Henderson-Hasselbalch equation (see Equation 1 Chapter 2 section 2.2.2) is shown in brackets. The values ΔGD,rel are relative to the ΔGD of wild type PYP and were determined via titration with either urea or guanidine HCl. When a hybrid protein has been shown to contain a photocycle similar to that of the wild type protein it has been awarded the property photoactive.
no. Name and properties Structure of free acid
I
4-hydroxycinnamic acid λmax 446 nm
pKa 2.7 (n = 1.5) photoactive
O
HO
OH
II
3,4-dihydroxycinnamic acid λmax 457 nm
pKa 3.2 (n = 1.3) ΔGD,rel = –1.21 kJ·mol–1 (urea)
photoactive
O
HO
OH
OH
III
3,5-dimethoxy-4-hydroxycinnamic acid λmax 488 nm
pKa 8.7 (n = 1.0) ΔGD,rel = –2.35 kJ·mol–1 (urea)
photoactive
O
HO
OH
OCH3
OCH3
IV
4-aminocinnamic acid λmax 405 nm (353 nm (Kroon et al. 1996))
pKa 2.0 (n = 1.6) ΔGD,rel = 4.51 kJ·mol–1 (guanidine HCl)
O
HO
NH2
V cinnamic acid λmax 317 nm
O
HO
VI 4-fluorocinnamic acid O
HO
F
λmax 317 nm
O
HO
N
NH
imidazole-4-acrylic acid VII
λmax 343 nm
VIII 4-hydroxy-α-bromocinnamic acid
λmax 447 nm photoactive
O
HO
OH
Br
IX
4-hydroxyphenylpropiolic acid λmax 404 nm
pKa 3.0 (n = 1.9) ΔGD,rel = –3.0 kJ·mol–1 (urea)
O
HO
OH
With one of the preparations of hybrid VIII, the absorption peak had shifted from 447 to 464 nm. Additionally, very slow photocycle kinetics were observed for this sample. These properties are very similar to those of the reported characteristics of hybrid IX (Cordfunke et al. 1998). As such, a fresh batch of 4-hydroxyphenylpropiolic acid was prepared and reconstituted with apoPYP for comparison. Though the absorption spectrum of the freshly prepared hybrid contained a small absorption peak at 464 nm, a larger absorption peak was observed at 404 nm for this sample (data not shown). To test if the hybrid was reconstituted correctly, an FTIR absorption spectrum was recorded to test for the presence of the unique triple bond of the chromophore of hybrid IX. A triple bond peak at 2145 cm-1 was observed (data not shown), indicating that the correct absorption maximum of hybrid IX is 404 nm, not 464 nm. In addition, no photocycle was observed for this hybrid. In an attempt to understand what is happening, the spectrum of the activated ester was followed in time, to determine if the activated ester is altered in time (see Figure 40 a). In
97

Chapter 4 Hybrids
addition, activated ester, aged for different periods of time, was used for reconstitution after which the absorption spectra of the hybrids were determined (see Figure 40 b). From these experiments it is clear the problem resides with the preparation of the activated ester. Once the hybrid is prepared the chromophore seems to be stable (data not shown), where with freshly prepared activated ester mostly the 404 nm form is formed and with aged activated ester the 464 nm form.
Figure 40. Preperation of the hybrid containing chromophore IX. In panel a the UV/Vis absorption spectrum is shown of the free acid of chromophore IX (4-hydroxyphenylpropiolic acid, solid line) and of the activated ester at specific times after mixing the free acid and CID: 0 minutes (dash double dotted line), 150 minutes (dashed line), overnight (dotted line), and over the weekend (dash dotted line). In panel b the UV/Vis absorption spectra are shown of the hybrid reconstituted with activated ester aged for specific times: 30 minutes (solid line), 240 minutes (dashed line), overnight (dotted line), and 4 days (dash dotted line).
Table 14. Spectral tuning of hybrids. The spectral tuning of several hybrids with in the first column the number of the hybrid as depicted in Table 13. Spectral information is denoted as wavelength with below, in italics, the value in wavenumbers. In the top part of the table the observed absorption maxima are depicted of free acid in 50 mM Tris buffer pH 8, of the hybrid in 50 mM Tris buffer pH 8, of the denatured hybrid in 4 M Guanidine HCl with 50 mM Tris buffer pH 8 and pH 11. For hybrid II the spectrum for column ‘Denatured hybrid pH 8’ was recorded at pH 4. For hybrid III he spectrum for column ‘Hybrid pH 8’ was recorded at pH 9. In the bottom part of the table differences that depict total tuning (free acid – hybrid), contribution of thiol ester bond (free acid – denatured hybrid pH 8), contribution of deprotonation (denatured hybrid pH 8 – denatured hybrid pH 11), and contribution from protein interaction (hybrid – denatured hybrid pH 11). For hybrid III the latter contribution was determined with denatured hybrid pH 8 instead of pH 11 (see text). All difference values are shown as absolute values.
Hybrid no.
Free acid pH 8
Hybrid pH 8
Denatured hybridpH 8
Denatured hybrid pH 11
284 nm 446 nm 341 nm 398 nm I 35,211 cm–1 22,422 cm–1 29,326 cm–1 25,126 cm–1
291 nm 457 nm 350 nm 412 nm II 34,364 cm–1 21,882 cm–1 28,571 cm–1 24,272 cm–1
306 nm 490 nm 360 nm 429 nm III 32,680 cm–1 20,408 cm–1 27,778 cm–1 23,310 cm–1
301 nm 405 nm 367 nm 325 nm IV 33,223 cm–1 24,691 cm–1 27,248 cm–1 30,769 cm–1
278 nm 404 nm 335 nm 385 nm IX 35,971 cm–1 24,752 cm–1 29,851 cm–1 25,974 cm–1
Δtotal Δthioester Δdeprot Δprotein
162 nm 57 nm 57 nm 48 nm I 12,790 cm–1 5,886 cm–1 4,200 cm–1 2,704 cm–1
166 nm 59 nm 62 nm 45 nm II 12,482 cm–1 5,793 cm–1 4,300 cm–1 2,390 cm–1
184 nm 54 nm 69 nm 61 nm III 12,272 cm–1 4,902 cm–1 4,468 cm–1 2,902 cm–1
104 nm 66 nm 42 nm 38 nm IV 8,531 cm–1 5,975 cm–1 3,521 cm–1 2,557 cm–1
126 nm 57 nm 50 nm 19 nm IX 11,219 cm–1 6,120 cm–1 3,877 cm–1 1,222 cm–1
98

Chapter 4 Hybrids
1.4 Discussion
Several hybrid chromophores have been tested. Chromophores V through VII show little tuning by binding to the protein. For chromophores V and VI this can be explained by the absence of the phenolic oxygen. Though the fluoro group, in chromophore VI, is a possible hydrogen bond acceptor, it apparently is not able to replace the phenolic oxygen in the hydrogen bonding network. Chromophore VII is a naturally occurring compound involved in e.g. immunosuppressive effects in humans via trans to cis isomerization (Termorshuizen et al. 2002). However, it does not seem to be able to functionally replace the wild type chromophore of PYP.
Hybrid VIII was prepared for use with the fluorescence upconversion technique to determine possible effects on the rate of rotation around the chromophore double bond (see Chapter 1 section 4.1 and (van der Meer 2000)). Due to a discrepancy in the preparation of the hybrid, doubts had arisen about a previously prepared and characterized hybrid IX (Cordfunke et al. 1998). Characterization of the freshly prepared hybrid showed a different absorbance characteristic. The presence of the correct chromophore in the freshly prepared hybrid IX was confirmed with FTIR. Such an analysis was also performed on the previously characterized hybrid, but no signal for the triple bond was found. This was explained by the low abundance of triple bonds in the sample. As it would seem, the characterized hybrid does not contain chromophore IX, but rather a derivative. As a hybrid with similar characteristics was obtained with the preparation of hybrid VIII, it is likely that the unknown characterized hybrid contained a chromophore similar to chromophore VIII, but with a
substituted bromo-moiety. A possibility is that a substitution with a hydroxy group took place, which would yield 4,α-dihydroxycinnamic acid. Such a chromophore is likely to displays keto-enol tautomerism and thus an equilibrium between two chromophore species would be obtained (see Figure 41). In the folded protein this equilibrium might then shift towards the α-hydroxy (enol) form, and in the signaling state the equilibrium might shift towards the keto form, possibly explaining the slow recovery of this hybrid. In order to determine in which step of the preparation of hybrid IX the chromophore is modified, the spectrum of both the activated ester and the hybrid reconstituted with activated ester was determined with activated ester aged for different lengths of time (see Figure 40). From this experiment is has become clear that the activated ester changes in time. This is then also reflected in the hybrid. For the preparation of hybrid IX it is then necessary to use freshly prepared activated ester. The use of freshly prepared activated ester has as a drawback that reconstitution is less efficient, which is the reason why normally one would use activated ester that has been left to age overnight at 4°C. When the activated ester has aged for 4 days only the hybrid with an absorption maximum of 464 nm is formed.
Hybrids II, III, IV, and IX were further characterized with respect to their stability relative to wild type PYP (see Table 13). This was done both with urea/guanidine denaturation and pBdark formation (acid denaturation). All hybrids are less stable than wild type PYP with the exception of the hybrid IV. Notable is hybrid III, which shows a pKa of 8.7 for pBdark formation, which is identical to the pKa of the wild type chromophore in denatured PYP (see Chapter 3 section 3). It would therefore seem that the bulkiness of this chromophore causes a poor fit in the chromophore binding pocket. However, when the phenolic oxygen becomes deprotonated the hydrogen bonding network can be formed. The slightly higher pKa of pBdark formation for hybrid IX compared to wild type PYP indicates that this hybrid folds similarly to wild type PYP and a hydrogen bonding network is formed. However, due to the triple bond, no isomerization of the chromophore can occur and no wild type like photocycle is observed.
With regard to the spectral tuning of hybrids II, III, IV, and IX the contributions of the thiol ester bond, deprotonation of the chromophore, and interaction of the protein, to the tuning were determined (see Table 14). As reference point the absorbance of the free acid in aqueous solution is used. For all hybrids including wild type PYP the red-shift contribution of the thiol ester bond is similar (~6000 cm–1), with the
Figure 41. Keto-enol tautomerism. Addition/substitution of a hydroxy group on the α-position of 4-hydroxycinnamic acid, likely results in a keto - enol tautomerism.
99

Chapter 4 Hybrids
100
exception of hybrid III for which a somewhat smaller contribution is found (~5000 cm–1). Also for the contribution of deprotonation of the chromophore similar red-shift contributions are found (~4000 cm–1). An obvious exception is hybrid IV, which does not have a phenolic hydroxy group but an amino group instead. This group is protonated at pH 8 and neutral at pH 11. Protonation of chromophore IV in the denatured hybrid leads to a red-shift slightly lower (~3500 cm–1) than the red-shift induced by deprotonation of the other chromophores. The red-shift contribution of protein interaction to the total tuning is also similar for most hybrids (~2500 cm–1), with the exception of hybrid IX, for which a significantly lower contribution is found (~1200 cm–1). This could be explained by a less than optimal geometry of the chromophore in the chromophore pocket as a result of its triple bond. With regard to hybrid IV it has to be noted that to determine the contribution of protein interaction, the denatured hybrid with the protonated (positively charged) chromophore was chosen as a reference, as this resulted in a red-shift contribution comparable to that of the other chromophores. When the neutral chromophore was used as reference a significantly higher red-shift contribution was found (~6000 cm–1). We prefer the idea that in hybrid IV the chromophore is positively charged. This charge could than be stabilized by the nearby Glu46. In this case Glu46 would be deprotonated, normally its preferred protonation state. The ionic bond between Glu46 and chromophore IV would also explain the higher stability of this hybrid, compared to wild type PYP. Of hybrids II, III, IV and IX only hybrids II and III display a photocycle similar to that of wild type PYP, be it that ground state recovery is somewhat slower. The absence of a wild type like photocycle for hybrid IX is easily explained through the presence of the triple bond in its chromophore, effectively blocking isomerization of the chromophore. For hybrid IV the likely cause for the absence of a wild type like photocycle is the possible ionic bond between the chromophore and Glu46, which may alter the excited state surface such that isomerization is no longer promoted. This is further corroborated by a significantly higher fluorescence quantum yield of this hybrid compared to wild type PYP (~ 20 times higher, data not shown).

Chapter 4 Observations
2 Observations
Several pilot experiments have been performed to determine the feasibility for certain lines of research. Two series of such pilot experiments showed interesting results and warrant further work. However, there was not enough time to continue with these lines of work. As such, only the observations made during the pilot experiments are discussed.
2.1 Protein (photo)stability
Photostability of the sample is an issue when studying photoactive compounds. For PYP we have done several experiments to get an indication of the photostability. We have exposed the protein to continuous light or laser pulses for prolonged periods of time. Here we have noticed that 355 nm laser flashes seem to permanently bleach to protein more easily than 446 nm laser pulses (Similar laser energies were used in the comparison). This effect is enhanced in combination with continuous white light irradiation, i.e. with the possibility of exciting the signaling state. Exciting the sample at higher wavelengths (e.g. 480 nm) seems to reduce the amount of permanent bleaching. Furthermore, after prolonged excitation regimes, when part of the protein does not recover to the ground state anymore and permanent bleach seems to have occurred, part of the ‘permanently’ bleached protein seems to regenerate over a long period of time (week(s)). This regenerated protein fraction then shows normal photocycle behavior. This indicates that semi-stable intermediates may be formed that recover very slowly to the ground state. These intermediates are likely formed through excitation of other photocycle intermediates.
In addition, we have observed that certain samples contain a fraction that either recovers very slowly, or do not recover at all. Generally these have been older samples, that have not been exposed to excess light. As such it is important to not only measure the absorption spectrum to determine sample quality, but also to include a test of the recovery behavior of the sample. Such a test can easily and quickly be performed on the HP 8453 UV/Vis diode array spectrophotometer using a single photoflash.
The nature of the observed degradation of the sample has thus far not been characterized. It would however be interesting to determine the exact nature of the degradation. This may provide a way to prevent or slow it down, which is advantageous for experiments that require large amounts of sample to be used, or experiments where regular replacement of sample is unpractical. Possible forms of degradation are, loss of chromophore, (photo)chemical change of the chromophore, degradation of the protein, (photo)chemical change of specific amino acids, or a combination of these possibilities.
2.2 Time resolved Small Angle X-ray/Neutron Scattering
Both Small Angle X-ray Scattering (SAXS) and Small Angle Neutron Scattering (SANS) can be used to determine the shape of a protein (Svergun et al. 1995; Dainese et al. 2000). As such it might be possible to observe a difference between the ground state of PYP and its signaling state, in which significant structural changes have been observed (see Chapter 1 section 5.5 and Chapter 2). We have performed several pilot experiments to determine if time-resolved measurement of SAXS and SANS is possible. SAXS measurements were performed at the European Synchrotron Radiation Facility (ESRF) in Grenoble using beamline BM26 (The Dutch-Belgian beamline (DUBBLE)). SANS measurements were performed at the Institut Laue-Langevin (ILL) in Grenoble using beamline D22. In both cases no clear differences were observed between the PYP ground and signaling state. However, recently the influence of solvent on the signal difference between PYP ground and signaling state using SAXS was observed (Shimizu et al. 2002), which could explain why we did not observe a clear difference. Furthermore, in order to perform time-resolved experiments, the mechanics/geometry of the sample holder is of vital importance. Especially, sample excitation has been less than optimal in our experiments. Nonetheless, we were able to observe a small time dependence in the SANS signal that correlated with ground state recovery of PYP. However, the signal to noise was very poor in this experiment, due to a combination of low detector sensitivity and the amount of signaling state formed after excitation. Improvement of the detector (planned for the near future) and sample cell may remedy this. A proper sample cell should have an integrated sample excitation system, that preferably excites the sample from two sides. Also an integrated feature for measuring the UV/Vis spectrum simultaneously with the SANS (or SAXS) signal is advantageous. The desired 1 to 2 mm path length of the cell is a complicating factor in the design of such a sample cell.
101

Chapter 4 Final Discussion
3 Concluding discussion
Over the last few years, work on the Photoactive Yellow Protein (PYP) has intensified tremendously. This is due, in a large part, to its favorable handling characteristics, availability of high resolution crystal structures, and its relatively simple chromophore. It was the first protein of the large PAS-domain family for which a structure was available and as such has been dubbed the prototype for the PAS fold (see Chapter 1 section 1.3). Its relatively simple chromophore in combination with the availability of high resolution structures (both X-ray and NMR) have made it a prime candidate for in silico experiments and the study of primary photoreactions. The transient (un)folding events displayed by PYP, also have made it interesting for the general study of protein folding. All in all, this is an impressively wide variety of study topics for which PYP is a suitable candidate. The increased use of PYP as a reference system, is further apparent through literature searches. Where only a few years ago a search on PYP yielded mainly studies about the protein itself, nowadays in addition many studies are found on other subjects, where PYP is used as reference/comparison. Furthermore, PYP has not only been used as a topic of study, but also for development of new techniques, such as time-resolved X-ray crystallography.
Though a lot is known about the physical properties of PYP, relatively little is known about its biological function, other than that it is a photoreceptor for a blue light response in Halorhodospira halophila. This is for a large part caused by the extremophilic character of this organism, making it difficult to study and manipulate genetically. Like the favorable handling characteristics of PYP make the protein a popular topic of study, the unfavorable handling characteristics of H. halophila make the organism a less attractive topic of study.
With the increased use of PYP as a model/reference system it has become more and more important to have a proper understanding of its characteristics. Especially with regard to the photocycle events in the nanoseconds to seconds time-range, we have made important contributions. We discovered that the net proton uptake/release during the photocycle is pH dependent (see Chapter 2 section 2). We characterized the photocycle branching reaction (see Chapter 3 section 2). Made a significant contribution to the elucidation of the transient (un)folding characteristics of PYP (see Chapter 2 section 3). Resolved an important issue with regard to comparing crystallographic data, with data obtained in solution (see Chapter 2 section 4). And we have made a detailed pH dependent analysis of the photocycle, both in H2O and D2O, allowing us to confirm and expand on the knowledge about signaling state formation, and provide important new information about the photocycle recovery reaction (see Chapter 3 section 3). Especially this last study may serve as an important reference for choosing the best conditions for the study of specific photocycle events. With regard to (bio)chemical research general, our results have shown on several occasions the important influence the pH of a solution can have on obtained data. Especially when comparing data obtained using either H2O or D2O as solvent, it is important to make a distinction between using the pH or pOH as reference point. Where such a distinction normally is arbitrary, it no longer is in this case due to the different dissociation constant of H2O and D2O. Also, we have shown that though crystallographic data is a tremendously important source of information for the explanation of certain events and the design of new experiments, it also must be used with caution, when applied to transient structures, as it not necessarily reflects events in solution, the medium where most experiments are performed in, and also the medium PYP resides in in vivo.
Though many physical characteristics of PYP are known, there are still many characteristics that warrant further study. For one, the signaling state or pB is a very interesting photocycle intermediate. One of the problems is, that it mostly can only be studied transiently. Here solvent conditions determine the amount of pB formed, which ranges from ~20 to ~95%. As such, it would be advantageous to have pB stable in solution. This would make it a lot easier for example to determine its structure via NMR. Also, the effect of many different conditions on the characteristics of pB could be studied more easily that way. Additionally, it may provide further insight about pre-isomerization events in the photocycle recovery step. A possible way to obtain a solution containing just stable pB is by locking the chromophore in the cis configuration. A locked version of the chromophore in the trans configuration has already been incorporated successfully (Cordfunke et al. 1998). Several, possible candidates for a locked cis-chromophore are collected in Figure 42 a - e. To determine the importance of the carbonyl group of the chromophore, the use of a chromophore analog with the carbonyl group removed may also be helpful. Here, the standard way of chromophore reconstitution for PYP (see Chapter 2 section 1) can not be applied. However, by using an alkyl halide form of the chromophore (see Figure 42 f) this should be possible. This method is also used to attach fluorescent probes to cysteine residues (http://www.probes.com/handbook/).
102
Chapter 4 Final Discussion
One of the major challenges left is the elucidation of the details of the recovery reaction. Especially the question of how the protein facilitates re-isomerization of the chromophore is an interesting one. Here a temperature dependent study of the photocycle branching reaction may provide interesting results. But also, a detailed temperature dependent study of the normal photocycle, making use of the latest photocycle model, may prove useful. Here both UV/Vis and FTIR spectroscopy may prove to be useful techniques. Also, the study of certain mutant and hybrid forms of PYP can provide clues to how the protein facilitates re-isomerization of the chromophore. Once that is known, specific modifications of PYP may be designed, in order to make PYP suitable for ‘real-world’ applications.
In vivo, PYP has to interact with a transducer protein in order to signal the cell that it has absorbed a photon. Such a transducer protein has not been identified yet for PYP. Discovery of such a protein would open up a whole new line of research. One technique for identification of such a transducer protein is by fishing for it using PYP as bait. PYP can be linked/bound to a chromatographic column after which cell extracts can be eluted over the column. However, using this technique has not lead to successful identification of a transducer protein yet. There may be several reasons for this. As only the cytosolic fraction of the
cell was eluted, any transducer proteins located in the membrane are not tested for affinity. Also, it has not been possible yet to link/bind PYP in a stable signaling state form. Here the use of a hybrid, with a chromophore locked in the cis configuration, may be advantageous. It is also possible that the transducer only transiently binds to the Photoactive Yellow Protein. In that case, the transducer would only be retarded by PYP. As such, it may be advantageous to record chromatograms using columns with PYP in the ground state (use of chromophore locked in trans configuration) and columns with PYP in the signaling state (use of chromophore locked in cis configuration). Here the transducer protein may be identified via a change in its retention time between the two columns.
Figure 42. Interesting analog chromophores. In panels a - e, possible analog chromophores locked in the cis configuration are depicted. In panel f a chromophore analog is depicted with its carbonyl function removed. Thedepicted compounds in panels e and f should be able form a thio-ether with Cys69, without further activation of thechromophore. The chromophores depicted in panels a - dneed to be activated before they can be attached to Cys69(see Chapter 2 section 1). Note that the cis double bond likely becomes less stretched going from panel a to d.
PYP from Halorhodospira halophila is by far the best studied Xanthopsin. Further characterization of PYPs from other organisms, is another line of research worth following. However, due to the vast amount of information available for PYP from H. halophila, the interest to study other PYPs is relatively low. The study of other PYPs may nonetheless lead to new and unexpected insights, not only into the physics of PYP, but also into its biological function and interaction with possible transducer proteins.
Even though a lot has become known about PYP over the last few years, there is even more we still do not know about it. The next few years will be exciting ones, as more and more techniques are utilized to study PYP, pushing the limits of the different techniques along the way.
103

This page was left blank intentionally
104

105
References Aulin-Erdtman G., Sandén R., 'Spectrographic contributions to Lignin chemistry', Acta Chemica Scandinavica, (1968), 22: 1187-1209
Baca M., Borgstahl G.E., Boissinot M., Burke P.M., Williams D.R., Slater K.A., Getzoff E.D., 'Complete chemical structure of photoactive yellow protein: novel thioester-linked 4-hydroxycinnamyl chromophore and photocycle chemistry', Biochemistry, (1994), 33: 14369-14377
Balashov S.P., 'Photoreactions of the photointermediates of bacteriorhodopsin', Israel Journal of Chemistry, (1995), 35: 415-428
Baltuška A., van Stokkum I.H.M., Kroon A., Monshouwer R., Hellingwerf K.J., van Grondelle R., 'The primary events in the photoactivation of yellow protein', Chemical Physics Letters, (1997), 270: 263-266
Berman H.M., Westbrook J., Feng Z., Gilliland G., Bhat T.N., Weissig H., Shindyalov I.N., Bourne P.E., 'The Protein Data Bank', Nucleic Acids Research, (2000), 28: 235-242
Borgstahl G.E., Williams D.R., Getzoff E.D., '1.4 Å structure of photoactive yellow protein, a cytosolic photoreceptor: unusual fold, active site, and chromophore', Biochemistry, (1995), 34: 6278-6287
Borsarelli C.D., Braslavsky S.E., 'Volume changes correlate with enthalpy changes during the photoinduced formation of the (MLCT)-M-3 state of ruthenium(II) bipyridine cyano complexes in the presence of salts. A case of the entropy-enthalpy compensation effect', Journal of Physical Chemistry B, (1998), 102: 6231-6238
Borucki B., Devanathan S., Otto H., Cusanovich M.A., Tollin G., Heyn M.P., 'Kinetics of proton uptake and dye binding by photoactive yellow protein in wild type and in the E46Q and E46A mutants', Biochemistry, (2002), 41: 10026-10037
Braslavsky S.E., Heibel G.E., 'Time-Resolved Photothermal and Photoacoustic Methods Applied to Photoinduced Processes in Solution', Chemical Reviews, (1992), 92: 1381-1410
Brudler R., Meyer T.E., Genick U.K., Devanathan S., Woo T.T., Millar D.P., Gerwert K., Cusanovich M.A., Tollin G., Getzoff E.D., 'Coupling of hydrogen bonding to chromophore conformation and function in photoactive yellow protein', Biochemistry, (2000), 39: 13478-13486
Brudler R., Rammelsberg R., Woo T.T., Getzoff E.D., Gerwert K., 'Structure of the I1 early intermediate of photoactive yellow protein by FTIR spectroscopy', Nature Structural Biology, (2001), 8: 265-270
Changenet P., Zhang H., van der Meer M.J., Hellingwerf K.J., Glasbeek M., 'Subpicosecond fluorescence upconversion measurements of primary events in yellow proteins', Chemical Physics Letters, (1998), 282: 276-282
Changenet-Barret P., Plaza P., Martin M.M., 'Primary events in the photoactive yellow protein chromophore in solution', Chemical Physics Letters, (2001), 336: 439-444
Chen E., Gensch T., Gross A.B., Hendriks J., Hellingwerf K.J., Kliger D.S., 'Dynamics of protein and chromophore structural changes in the photocycle of photoactive yellow protein monitored by time-resolved optical rotatory dispersion', submitted, (2002),
Chosrowjan H., Mataga N., Nakashima N., Imamoto Y., Tokunaga F., 'Femtosecond--picosecond fluorescence studies on excited state dynamics of photoactive yellow protein from Ectothiorhodospira halophila', Chemical Physics Letters, (1997), 270: 267-272
Chosrowjan H., Mataga N., Shibata Y., Imamoto Y., Tokunaga F., 'Environmental effects on the femtosecond-picosecond fluorescence dynamics of photoactive yellow protein: Chromophores in aqueous solutions and in protein nanospaces modified by site-directed mutagenesis', Journal of Physical Chemistry B, (1998), 102: 7695-7698
Cordfunke R., Kort R., Pierik A., Gobets B., Koomen G.J., Verhoeven J.W., Hellingwerf K.J., 'Trans/cis (Z/E) photoisomerization of the chromophore of photoactive yellow protein is not a prerequisite for the initiation of the photocycle of this photoreceptor protein', Proceedings of the National Academy of Sciences of the United States of America, (1998), 95: 7396-7401
Craven C.J., Derix N.M., Hendriks J., Boelens R., Hellingwerf K.J., Kaptein R., 'Probing the nature of the blue-shifted intermediate of photoactive yellow protein in solation by NMR: Hydrogen- deuterium exchange data and pH studies', Biochemistry, (2000), 39: 14392-14399
Dainese E., Svergun D., Beltramini M., Di Muro P., Salvato B., 'Low-resolution structure of the proteolytic fragments of the Rapana venosa hemocyanin in solution', Archives of Biochemistry and Biophysics, (2000), 373: 154-162
Datta A., Mandal D., Pal S.K., Bhattacharyya K., 'Intramolecular charge transfer processes in confined systems. Nile red in reverse micelles', Journal of Physical Chemistry B, (1997), 101: 10221-10225
Demchuk E., Genick U.K., Woo T.T., Getzoff E.D., Bashford D., 'Protonation states and pH titration in the photocycle of photoactive yellow protein', Biochemistry, (2000), 39: 1100-1113
Devanathan S., Genick U.K., Getzoff E.D., Meyer T.E., Cusanovich M.A., Tollin G., 'Preparation and properties of a 3,4-dihydroxycinnamic acid chromophore variant of the photoactive yellow protein', Archives of Biochemistry and Biophysics, (1997), 340: 83-89
Devanathan S., Genick U.K., Canestrelli I.L., Meyer T.E., Cusanovich M.A., Getzoff E.D., Tollin G., 'New insights into the photocycle of Ectothiorhodospira halophila photoactive yellow protein: photorecovery of the long-lived photobleached intermediate in the Met100Ala mutant', Biochemistry, (1998), 37: 11563-11568

References Devanathan S., Brudler R., Hessling B., Woo T.T., Gerwert K., Getzoff E.D., Cusanovich M.A., Tollin G., 'Dual photoactive species in
Glu46Asp and Glu46Ala mutants of photoactive yellow protein: a pH-driven color transition', Biochemistry, (1999a), 38: 13766-13772
Devanathan S., Pacheco A., Ujj L., Cusanovich M., Tollin G., Lin S., Woodbury N., 'Femtosecond spectroscopic observations of initial intermediates in the photocycle of the photoactive yellow protein from Ectothiorhodospira halophila', Biophysical Journal, (1999b), 77: 1017-1023
Devanathan S., Lin S., Cusanovich M.A., Woodbury N., Tollin G., 'Early intermediates in the photocycle of the Glu46Gln mutant of photoactive yellow protein: femtosecond spectroscopy', Biophysical Journal, (2000), 79: 2132-2137
Devanathan S., Lin S., Cusanovich M.A., Woodbury N., Tollin G., 'Early photocycle kinetic behavior of the E46A and Y42F mutants of photoactive yellow protein: femtosecond spectroscopy', Biophysical Journal, (2001), 81: 2314-2319
Dutta A.K., Kamada K., Ohta K., 'Spectroscopic studies of nile red in organic solvents and polymers', Journal of Photochemistry and Photobiology a-Chemistry, (1996), 93: 57-64
Dux P., Rubinstenn G., Vuister G.W., Boelens R., Mulder F.A., Hard K., Hoff W.D., Kroon A.R., Crielaard W., Hellingwerf K.J., Kaptein R., 'Solution structure and backbone dynamics of the photoactive yellow protein', Biochemistry, (1998), 37: 12689-12699
Eaton D.F., 'Reference Materials For Fluorescence Measurement', Pure and Applied Chemistry, (1988), 60: 1107-1114
Englander S.W., Downer N.W., Teitelbaum H., 'Hydrogen exchange', Annual Review of Biochemistry, (1972), 41: 903-924
Fraser R.D.B., Suzuki E., 'Resolution of overlapping bands. Functions for simulating band shapes', Analytical Chemistry, (1969), 41: 37-39
Genick U.K., Devanathan S., Meyer T.E., Canestrelli I.L., Williams E., Cusanovich M.A., Tollin G., Getzoff E.D., 'Active site mutants implicate key residues for control of color and light cycle kinetics of photoactive yellow protein', Biochemistry, (1997a), 36: 8-14
Genick U.K., Borgstahl G.E., Ng K., Ren Z., Pradervand C., Burke P.M., Srajer V., Teng T.Y., Schildkamp W., McRee D.E., Moffat K., Getzoff E.D., 'Structure of a protein photocycle intermediate by millisecond time-resolved crystallography', Science, (1997b), 275: 1471-1475
Genick U.K., Soltis S.M., Kuhn P., Canestrelli I.L., Getzoff E.D., 'Structure at 0.85 Å resolution of an early protein photocycle intermediate', Nature, (1998), 392: 206-209
Gensch T., Hellingwerf K.J., Braslavsky S.E., Schaffner K., 'Photoequilibrium in the primary steps of the photoreceptors phytochrome A and photoactive yellow protein', Journal of Physical Chemistry A, (1998), 102: 5398-5405
Gensch T., Viappiani C., Braslavsky S.E. 1999. Laser Induced Optoacoustic Spectroscopy. In: Tranter G.E., Holmes J.L., editors. Encyclopedia of Spectroscopy and Spectrometry. p 1124-1132.
Gensch T., Gradinaru C.C., van Stokkum I.H.M., Hendriks J., Hellingwerf K.J., van Grondelle R., 'The primary photoreaction of photoactive yellow protein (PYP): anisotropy changes and excitation wavelength dependence', Chemical Physics Letters, (2002), 356: 347-354
Ghoneim N., 'Photophysics of Nile red in solution - Steady state spectroscopy', Spectrochimica Acta Part a-Molecular and Biomolecular Spectroscopy, (2000), 56: 1003-1010
Glasoe P.K., Long F.A., 'Use of glass electrodes to measure acidities in deuterium oxide', Journal of Physical Chemistry, (1960), 64: 188-190
Goldbeck R.A., Thomas Y.G., Chen E., Esquerra R.M., Kliger D.S., 'Multiple pathways on a protein-folding energy landscape: kinetic evidence', Proceedings of the National Academy of Sciences of the United States of America, (1999), 96: 2782-2787
Goodford P.J., 'A computational procedure for determining energetically favorable binding sites on biologically important macromolecules', Journal of Medicinal Chemistry, (1985), 28: 849-857
Greenspan P., Fowler S.D., 'Spectrofluorometric studies of the lipid probe, nile red', Journal of Lipid Research, (1985), 26: 781-789
Groenhof G., Lensink M.F., Berendsen H.J., Snijders J.G., Mark A.E., 'Signal transduction in the photoactive yellow protein. I. Photon absorption and the isomerization of the chromophore', Proteins: Structure, Function, and Genetics, (2002a), 48: 202-211
Groenhof G., Lensink M.F., Berendsen H.J., Mark A.E., 'Signal transduction in the photoactive yellow protein. II. Proton transfer initiates conformational changes', Proteins: Structure, Function, and Genetics, (2002b), 48: 212-219
Hanada H., Kanematsu Y., Kinoshita S., Kumauchi M., Sasaki J., Tokunaga F., 'Ultrafast fluorescence spectroscopy of photoactive yellow protein', Journal of Luminescence, (2001), 94: 593-596
Hara T., Hirota N., Terazima M., 'New application of the transient grating method to a photochemical reaction: The enthalpy, reaction volume change, and partial molar volume measurements', Journal of Physical Chemistry, (1996), 100: 10194-10200
He Z., Martin C.H., Birge R., Freed K.F., 'Theoretical studies on excited states of a phenolate anion in the environment of photoactive yellow protein', Journal of Physical Chemistry A, (2000), 104: 2939-2952
Hellingwerf K.J., Hoff W.D., Crielaard W., 'Photobiology of microorganisms: how photosensors catch a photon to initialize signalling', Molecular Microbiology, (1996), 21: 683-693
106
References Hendriks J., van Stokkum I.H., Crielaard W., Hellingwerf K.J., 'Kinetics of and intermediates in a photocycle branching reaction of the
photoactive yellow protein from Ectothiorhodospira halophila', Febs Letters, (1999a), 458: 252-256
Hendriks J., Hoff W.D., Crielaard W., Hellingwerf K.J., 'Protonation/deprotonation reactions triggered by photoactivation of photoactive yellow protein from Ectothiorhodospira halophila', The Journal of Biological Chemistry, (1999b), 274: 17655-17660
Hendriks J., van Stokkum I.H.M., Hellingwerf K.J., 'Deuterium isotope effects in the photocycle transitions of the Photoactive Yellow Protein', Biophysical Journal, (2002a), accepted for publication
Hendriks J., Gensch T., Hviid L., van Der Horst M.A., Hellingwerf K.J., van Thor J.J., 'Transient exposure of hydrophobic surface in the photoactive yellow protein monitored with nile red', Biophysical Journal, (2002b), 82: 1632-1643
Hoff W.D., Kwa S.L.S., van Grondelle R., Hellingwerf K.J., 'Low temperature absorbance and fluorescence spectroscopy of the photoactive yellow protein from Ectothiorhodospira halophila', Photochemistry and Photobiology, (1992), 56: 529-539
Hoff W.D., van Stokkum I.H., van Ramesdonk H.J., van Brederode M.E., Brouwer A.M., Fitch J.C., Meyer T.E., van Grondelle R., Hellingwerf K.J., 'Measurement and global analysis of the absorbance changes in the photocycle of the photoactive yellow protein from Ectothiorhodospira halophila', Biophysical Journal, (1994a), 67: 1691-1705
Hoff W.D., Dux P., Hard K., Devreese B., Nugteren-Roodzant I.M., Crielaard W., Boelens R., Kaptein R., van Beeumen J., Hellingwerf K.J., 'Thiol ester-linked p-coumaric acid as a new photoactive prosthetic group in a protein with rhodopsin-like photochemistry', Biochemistry, (1994b), 33: 13959-13962
Hoff W.D., Matthijs H.C.P., Schubert H., Crielaard W., Hellingwerf K.J., 'Rhodopsin(s) in eubacteria', Biophysical Chemistry, (1995), 56: 193-199
Hoff W.D., Devreese B., Fokkens R., Nugteren-Roodzant I.M., Van Beeumen J., Nibbering N., Hellingwerf K.J., 'Chemical reactivity and spectroscopy of the thiol ester-linked p-coumaric acid chromophore in the photoactive yellow protein from Ectothiorhodospira halophila', Biochemistry, (1996), 35: 1274-1281
Hoff W.D., Van Stokkum I.H.M., Gural J., Hellingwerf K.J., 'Comparison of acid denaturation and light activation in the eubacterial blue-light receptor photoactive yellow protein', Biochimica Et Biophysica Acta-Bioenergetics, (1997a), 1322: 151-162
Hoff W.D., Jung K.H., Spudich J.L., 'Molecular mechanism of photosignaling by archaeal sensory rhodopsins', Annual Review of Biophysics and Biomolecular Structure, (1997b), 26: 223-258
Hoff W.D., Xie A., Van Stokkum I.H., Tang X.J., Gural J., Kroon A.R., Hellingwerf K.J., 'Global conformational changes upon receptor stimulation in photoactive yellow protein', Biochemistry, (1999), 38: 1009-1017
Hou Y.W., Bardo A.M., Martinez C., Higgins D.A., 'Characterization of molecular scale environments in polymer films by single molecule spectroscopy', Journal of Physical Chemistry B, (2000), 104: 212-219
Imamoto Y., Ito T., Kataoka M., Tokunaga F., 'Reconstitution photoactive yellow protein from apoprotein and p-coumaric acid derivatives', Febs Letters, (1995), 374: 157-160
Imamoto Y., Kataoka M., Tokunaga F., 'Photoreaction cycle of photoactive yellow protein from Ectothiorhodospira halophila studied by low-temperature spectroscopy', Biochemistry, (1996), 35: 14047-14053
Imamoto Y., Mihara K., Hisatomi O., Kataoka M., Tokunaga F., Bojkova N., Yoshihara K., 'Evidence for proton transfer from Glu-46 to the chromophore during the photocycle of photoactive yellow protein', The Journal of Biological Chemistry, (1997), 272: 12905-12908
Imamoto Y., Shirahige Y., Tokunaga F., Kinoshita T., Yoshihara K., Kataoka M., 'Low-temperature Fourier transform infrared spectroscopy of photoactive yellow protein', Biochemistry, (2001a), 40: 8997-9004
Imamoto Y., Kataoka M., Tokunaga F., Asahi T., Masuhara H., 'Primary photoreaction of photoactive yellow protein studied by subpicosecond-nanosecond spectroscopy', Biochemistry, (2001b), 40: 6047-6052
Imamoto Y., Koshimizu H., Mihara K., Hisatomi O., Mizukami T., Tsujimoto K., Kataoka M., Tokunaga F., 'Roles of amino acid residues near the chromophore of photoactive yellow protein', Biochemistry, (2001c), 40: 4679-4685
Imamoto Y., Mihara K., Tokunaga F., Kataoka M., 'Spectroscopic characterization of the photocycle intermediates of photoactive yellow protein', Biochemistry, (2001d), 40: 14336-14343
Imhoff J.F., Hashwa F., Trüper H.G., 'Isolation of extremely halophilic bacteria from the alkaline Wadi Natrun, Egypt', Archives of Hydrobiology, (1978), 84: 381-388
Imhoff J.F., Suling J., 'The phylogenetic relationship among Ectothiorhodospiraceae: a reevaluation of their taxonomy on the basis of 16S rDNA analyses', Archives of microbiology, (1996), 165: 106-113
Jiang Z., Bauer E.C., 'Genetic characterization of photoactive yellow protein from Rhodobacter capsulatus', unpublished, (1998),
Jiang Z., Swem L.R., Rushing B.G., Devanathan S., Tollin G., Bauer C.E., 'Bacterial photoreceptor with similarity to photoactive yellow protein and plant phytochromes', Science, (1999), 285: 406-409
Kandori H., Iwata T., Hendriks J., Maeda A., Hellingwerf K.J., 'Water structural changes involved in the activation process of photoactive yellow protein', Biochemistry, (2000), 39: 7902-7909
Karstens T., Kobe K., 'Rhodamine B and Rhodamine 101 as Reference Substances for Fluorescence Quantum Yield Measurements', Journal of Physical Chemistry, (1980), 84: 1871-1872
107

References Kim M., Mathies R.A., Hoff W.D., Hellingwerf K.J., 'Resonance Raman evidence that the thioester-linked 4-hydroxycinnamyl
chromophore of photoactive yellow protein is deprotonated', Biochemistry, (1995), 34: 12669-12672
Koeberg M., de Groot M., Verhoeven J.W., Lokan N.R., Shephard M.J., Paddon-Row M.N., 'U-shaped donor [bridge] acceptor systems with remarkable charge transfer fluorescent properties: An experimental and computational investigation', Journal of Physical Chemistry A, (2001), 105: 3417-3424
Koh M., Van Driessche G., Samyn B., Hoff W.D., Meyer T.E., Cusanovich M.A., Van Beeumen J.J., 'Sequence evidence for strong conservation of the photoactive yellow proteins from the halophilic phototrophic bacteria Chromatium salexigens and Rhodospirillum salexigens', Biochemistry, (1996), 35: 2526-2534
Kohen A., Klinman J.P., 'Hydrogen tunneling in biology', Chemistry & Biology, (1999), 6: R191-R198
Koradi R., Billeter M., Wuthrich K., 'MOLMOL: a program for display and analysis of macromolecular structures', Journal of Molecular Graphics, (1996), 14: 51-55
Kort R., Vonk H., Xu X., Hoff W.D., Crielaard W., Hellingwerf K.J., 'Evidence for trans-cis isomerization of the p-coumaric acid chromophore as the photochemical basis of the photocycle of photoactive yellow protein', Febs Letters, (1996a), 382: 73-78
Kort R., Hoff W.D., Van West M., Kroon A.R., Hoffer S.M., Vlieg K.H., Crielaand W., Van Beeumen J.J., Hellingwerf K.J., 'The xanthopsins: a new family of eubacterial blue-light photoreceptors', The EMBO Journal, (1996b), 15: 3209-3218
Kort R., Crielaard W., Spudich J.L., Hellingwerf K.J., 'Color-sensitive motility and methanol release responses in Rhodobacter sphaeroides', Journal of Bacteriology, (2000), 182: 3017-3021
Kraayenhof R., Schuurmans J.J., Valkier L.J., Veen J.P., Van Marum D., Jasper C.G., 'A thermoelectrically regulated multipurpose cuvette for simultaneous time-dependent measurements', Analytical Biochemistry, (1982), 127: 93-99
Kroon A.R., Hoff W.D., Fennema H.P., Gijzen J., Koomen G.J., Verhoeven J.W., Crielaard W., Hellingwerf K.J., 'Spectral tuning, fluorescence, and photoactivity in hybrids of photoactive yellow protein, reconstituted with native or modified chromophores', The Journal of Biological Chemistry, (1996), 271: 31949-31956
Kumauchi M., Hamada N., Sasaki J., Tokunaga F., 'A Role of Methionine100 in Facilitating PYP(M)-Decay Process in the Photocycle of Photoactive Yellow Protein', The Journal of Biochemistry, (2002), 132: 205-210
Landt O., Grunert H.P., Hahn U., 'A general method for rapid site-directed mutagenesis using the polymerase chain reaction', Gene, (1990), 96: 125-128
Lee B.C., Pandit A., Croonquist P.A., Hoff W.D., 'Folding and signaling share the same pathway in a photoreceptor', Proceedings of the National Academy of Sciences of the United States of America, (2001a), 98: 9062-9067
Lee B.C., Croonquist P.A., Hoff W.D., 'Mimic of photocycle by a protein folding reaction in photoactive yellow protein', The Journal of Biological Chemistry, (2001b), 276: 44481-44487
Lee B.C., Croonquist P.A., Sosnick T.R., Hoff W.D., 'PAS domain receptor photoactive yellow protein is converted to a molten globule state upon activation', The Journal of Biological Chemistry, (2001c), 276: 20821-20823
Liang J., Edelsbrunner H., Woodward C., 'Anatomy of protein pockets and cavities: measurement of binding site geometry and implications for ligand design', Protein Science, (1998), 7: 1884-1897
Losi A., Wegener A.A., Engelhard M., Braslavsky S.E., 'Enthalpy-entropy compensation in a photocycle: The K-to-L transition in sensory rhodopsin II from Natronobacterium pharaonis', Journal of the American Chemical Society, (2001), 123: 1766-1767
Masciangioli T., Devanathan S., Cusanovich M.A., Tollin G., el-Sayed M.A., 'Probing the primary event in the photocycle of photoactive yellow protein using photochemical hole-burning technique', Photochemistry and Photobiology, (2000), 72: 639-644
Mataga N., Chosrowjan H., Shibata Y., Imamoto Y., Tokunaga F., 'Effects of modification of protein nanospace structure and change of temperature on the femtosecond to picosecond fluorescence dynamics of photoactive yellow protein', Journal of Physical Chemistry B, (2000), 104: 5191-5199
Mataga N., Chosrowjan H., Shibata Y., Imamoto Y., Kataoka M., Tokunaga F., 'Ultrafast photoinduced reaction dynamics of photoactive yellow protein (PYP): observation of coherent oscillations in the femtosecond fluorescence decay dynamics', Chemical Physics Letters, (2002), 352: 220-225
McRee D.E., Meyer T.E., Cusanovich M.A., Parge H.E., Getzoff E.D., 'Crystallographic characterization of a photoactive yellow protein with photochemistry similar to sensory rhodopsin', The Journal of Biological Chemistry, (1986), 261: 13850-13851
Meyer T.E., 'Isolation and characterization of soluble cytochromes, ferredoxins and other chromophoric proteins from the halophilic phototrophic bacterium Ectothiorhodospira halophila', Biochimica Et Biophysica Acta, (1985), 806: 175-183
Meyer T.E., Yakali E., Cusanovich M.A., Tollin G., 'Properties of a water-soluble, yellow protein isolated from a halophilic phototrophic bacterium that has photochemical activity analogous to sensory rhodopsin', Biochemistry, (1987), 26: 418-423
Meyer T.E., Tollin G., Hazzard J.H., Cusanovich M.A., 'Photoactive yellow protein from the purple phototrophic bacterium, Ectothiorhodospira halophila. Quantum yield of photobleaching and effects of temperature, alcohols, glycerol, and sucrose on kinetics of photobleaching and recovery', Biophysical Journal, (1989), 56: 559-564
108
Meyer T.E., Fitch J.C., Bartsch R.G., Tollin G., Cusanovich M.A., 'Soluble cytochromes and a photoactive yellow protein isolated from the moderately halophilic purple phototrophic bacterium, Rhodospirillum salexigens', Biochimica Et Biophysica Acta, (1990), 1016: 364-370

References Meyer T.E., Tollin G., Causgrove P., Cheng P., Blankenship R.E., 'Picosecond decay kinetics and quantum yield of fluorescence of the
photoactive yellow protein from the halophilic purple phototrophic bacterium, Ectothiorhodospira halophila', Biophysical Journal, (1991), 59: 988-991
Meyer T.E., Cusanovich M.A., Tollin G., 'Transient proton uptake and release is associated with the photocycle of the photoactive yellow protein from the purple phototrophic bacterium Ectothiorhodospira halophila', Archives of Biochemistry and Biophysics, (1993), 306: 515-517
Mihara K., Hisatomi O., Imamoto Y., Kataoka M., Tokunaga F., 'Functional expression and site-directed mutagenesis of photoactive yellow protein', The Journal of Biochemistry, (1997), 121: 876-880
Miller A., Leigeber H., Hoff W.D., Hellingwerf K.J., 'A Light-Dependent Branching-Reaction in the Photocycle of the Yellow Protein From Ectothiorhodospira-Halophila', Biochimica Et Biophysica Acta, (1993), 1141: 190-196
Molina V., Merchan M., 'On the absorbance changes in the photocycle of the photoactive yellow protein: A quantum-chemical analysis', Proceedings of the National Academy of Sciences of the United States of America, (2001), 98: 4299-4304
Pellequer J.L., Wager-Smith K.A., Kay S.A., Getzoff E.D., 'Photoactive yellow protein: a structural prototype for the three-dimensional fold of the PAS domain superfamily', Proceedings of the National Academy of Sciences of the United States of America, (1998), 95: 5884-5890
Perman B., Srajer V., Ren Z., Teng T., Pradervand C., Ursby T., Bourgeois D., Schotte F., Wulff M., Kort R., Hellingwerf K., Moffat K., 'Energy transduction on the nanosecond time scale: early structural events in a xanthopsin photocycle', Science, (1998), 279: 1946-1950
Raymond J.C., Sistrom W.R., 'The isolation and preliminary characterization of a halophilic photosynthetic bacterium', Archiv für Mikrobiologie, (1967), 59: 255-268
Raymond J.C., Sistrom W.R., 'Ectothiorhodospira halophila: a new species of the genus Ectothiorhodospira', Archiv für Mikrobiologie, (1969), 69: 121-126
Ren Z., Perman B., Srajer V., Teng T.Y., Pradervand C., Bourgeois D., Schotte F., Ursby T., Kort R., Wulff M., Moffat K., 'A molecular movie at 1.8 Å resolution displays the photocycle of photoactive yellow protein, a eubacterial blue-light receptor, from nanoseconds to seconds', Biochemistry, (2001), 40: 13788-13801
Renthal R., 'Apparent pK of photolabile proton binding to bacteriorhodopsin', Biochemical and Biophysical Research Communications, (1977), 77: 155-161
Rubinstenn G., Vuister G.W., Mulder F.A., Dux P.E., Boelens R., Hellingwerf K.J., Kaptein R., 'Structural and dynamic changes of photoactive yellow protein during its photocycle in solution', Nature Structural Biology, (1998), 5: 568-570
Sackett D.L., Wolff J., 'Nile red as a polarity-sensitive fluorescent probe of hydrophobic protein surfaces', Analytical Biochemistry, (1987), 167: 228-234
Salamon Z., Meyer T.E., Tollin G., 'Photobleaching of the photoactive yellow protein from Ectothiorhodospira halophila promotes binding to lipid bilayers: evidence from surface plasmon resonance spectroscopy', Biophysical Journal, (1995), 68: 648-654
Sarkar N., Das K., Nath D.N., Bhattacharyya K., 'Twisted Charge-Transfer Process of Nile Red in Homogeneous Solution and in Faujasite Zeolite', Langmuir, (1994), 10: 326-329
Sasaki J., Kumauchi M., Hamada N., Oka T., Tokunaga F., 'Light-induced unfolding of photoactive yellow protein mutant M100L', Biochemistry, (2002), 41: 1915-1922
Scheiner S., 'Calculation of isotope effects from first principles', Biochimica Et Biophysica Acta, (2000), 1458: 28-42
Schulenberg P., Braslavski S.E. 2001. Progress in Photothermal and Photoacoustic Science and Technology. p 58-81.
Scrutton N.S., Raine A.R., 'Cation-pi bonding and amino-aromatic interactions in the biomolecular recognition of substituted ammonium ligands', The Biochemical Journal, (1996), 319: 1-8
Sergi A., Gruning M., Ferrario M., Buda F., 'Density Functional study of the photoactive yellow protein's chromophore', Journal of Physical Chemistry B, (2001), 105: 4386-4391
Sevilla J.M., Dominguez M., Grarcia-Blanco F., Blazquez M., 'Resolution of absorption spectra', Computers & Chemistry, (1989), 13: 197-200
Shimizu N., Kamikubo H., Mihara K., Imamoto Y., Kataoka M., 'Effect of organic anions on the photoreaction of photoactive yellow protein', The Journal of Biochemistry, (2002), 132: 257-263
Shiozawa M., Yoda M., Kamiya N., Asakawa N., Higo J., Inoue Y., Sakurai M., 'Evidence for large structural fluctuations of the photobleached intermediate of photoactive yellow protein in solution', Journal of the American Chemical Society, (2001), 123: 7445-7446
Sprenger W.W., Hoff W.D., Armitage J.P., Hellingwerf K.J., 'The eubacterium Ectothiorhodospira halophila is negatively phototactic, with a wavelength dependence that fits the absorption spectrum of the photoactive yellow protein', Journal of Bacteriology, (1993), 175: 3096-3104
Spudich E.N., Spudich J.L., 'The photochemical reactions of sensory rhodopsin I are altered by its transducer', The Journal of Biological Chemistry, (1993), 268: 16095-16097
109

References Spudich J.L., Bogomolni R.A., 'Mechanism of colour discrimination by a bacterial sensory rhodopsin', Nature, (1984), 312: 509-513
Spudich J.L., Yang C.S., Jung K.H., Spudich E.N., 'Retinylidene proteins: structures and functions from archaea to humans', Annual Review of Cell and Developmental Biology, (2000), 16: 365-392
Svergun D., Barberato C., Koch M.H.J., 'CRYSOL - A program to evaluate x-ray solution scattering of biological macromolecules from atomic coordinates', Journal of Applied Crystallography, (1995), 28: 768-773
Takeshita K., Hirota N., Terazima M., 'Enthalpy changes and reaction volumes of photoisomerization reactions in solution: azobenzene and p-coumaric acid', Journal of Photochemistry and Photobiology A: Chemistry, (2000a), 134: 103-109
Takeshita K., Hirota N., Imamoto Y., Kataoka M., Tokunaga F., Terazima M., 'Temperature-dependent volume change of the initial step of the photoreaction of photoactive yellow protein (PYP) studied by transient grating', Journal of the American Chemical Society, (2000b), 122: 8524-8528
Takeshita K., Imamoto Y., Kataoka M., Mihara K., Tokunaga F., Terazima M., 'Structural change of site-directed mutants of PYP: new dynamics during pR state', Biophysical Journal, (2002a), 83: 1567-1577
Takeshita K., Imamoto Y., Kataoka M., Tokunaga F., Terazima M., 'Themodynamic and transport properties of intermediate states of the photocyclic reaction of photoactive yellow protein', Biochemistry, (2002b), 41: 3037-3048
Taylor B.L., Zhulin I.B., 'PAS domains: Internal sensors of oxygen, redox potential, and light', Microbiology and Molecular Biology Reviews, (1999), 63: 479-506
Termorshuizen F., Garssen J., Norval M., Koulu L., Laihia J., Leino L., Jansen C.T., De Gruijl F., Gibbs N.K., De Simone C., Van Loveren H., 'A review of studies on the effects of ultraviolet irradiation on the resistance to infections: evidence from rodent infection models and verification by experimental and observational human studies', International Immunopharmacology, (2002), 2: 263-275
Thompson J.D., Higgins D.G., Gibson T.J., 'CLUSTAL W: improving the sensitivity of progressive multiple sequence alignment through sequence weighting, position-specific gap penalties and weight matrix choice', Nucleic Acids Research, (1994), 22: 4673-4680
Ujj L., Devanathan S., Meyer T.E., Cusanovich M.A., Tollin G., Atkinson G.H., 'New photocycle intermediates in the photoactive yellow protein from Ectothiorhodospira halophila: picosecond transient absorption spectroscopy', Biophysical Journal, (1998), 75: 406-412
Unno M., Kumauchi M., Sasaki J., Tokunaga F., Yamauchi S., 'Resonance Raman spectroscopy and quantum chemical calculations reveal structural changes in the active site of photoactive yellow protein', Biochemistry, (2002), 41: 5668-5674
van Aalten D.M., Hoff W.D., Findlay J.B., Crielaard W., Hellingwerf K.J., 'Concerted motions in the photoactive yellow protein', Protein Engineering, (1998), 11: 873-879
van Aalten D.M., Haker A., Hendriks J., Hellingwerf K.J., Joshua-Tor L., Crielaard W., 'Engineering photocycle dynamics. Crystal structures and kinetics of three photoactive yellow protein hinge-bending mutants', The Journal of Biological Chemistry, (2002a), 277: 6463-6468
van Aalten D.M., Crielaard W., Hellingwerf K.J., Joshua-Tor L., 'Structure of the photoactive yellow protein reconstituted with caffeic acid at 1.16 Å resolution', Acta Crystallographica Section D: Biological Crystallography, (2002b), 58: 585-590
Van Aalten D.M.F., Crielaard W., Hellingwerf K.J., Joshua-Tor L., 'Conformational substates in different crystal forms of the photoactive yellow protein - Correlation with theoretical and experimental flexibility', Protein Science, (2000), 9: 64-72
van Brederode M.E., Gensch T., Hoff W.D., Hellingwerf K.J., Braslavsky S.E., 'Photoinduced volume change and energy storage associated with the early transformations of the photoactive yellow protein from Ectothiorhodospira halophila', Biophysical Journal, (1995), 68: 1101-1109
van Brederode M.E., Hoff W.D., Van Stokkum I.H., Groot M.L., Hellingwerf K.J., 'Protein folding thermodynamics applied to the photocycle of the photoactive yellow protein', Biophysical Journal, (1996), 71: 365-380
van der Horst M.A., van Stokkum I.H., Crielaard W., Hellingwerf K.J., 'The role of the N-terminal domain of photoactive yellow protein in the transient partial unfolding during signalling state formation', Febs Letters, (2001), 497: 26-30
van der Meer M.J., 'Femtosecond fluorescence studies of intramolecular reorientational motions', Faculteit der Natuurwetenschappen, Wiskunde en Informatica, University of Amsterdam
van Stokkum I.H.M., Scherer T., Brouwer A.M., Verhoeven J.W., 'Conformational Dynamics of Flexibly and Semirigidly Bridged Electron Donor-Acceptor Systems as Revealed by Spectrotemporal Parameterization of Fluorescence', Journal of Physical Chemistry, (1994), 98: 852-866
van Stokkum I.H.M., Lozier R.H., 'Target analysis of the bacteriorhodopsin photocycle using a spectrotemporal model', Journal of Physical Chemistry B, (2002), 106: 3477-3485
Weast R.C., Handbook of Chemistry and Physics, (1988), 1st student edition, CRC Press, Inc.
Xie A., Hoff W.D., Kroon A.R., Hellingwerf K.J., 'Glu46 donates a proton to the 4-hydroxycinnamate anion chromophore during the photocycle of photoactive yellow protein', Biochemistry, (1996), 35: 14671-14678
110
Xie A., Kelemen L., Hendriks J., White B.J., Hellingwerf K.J., Hoff W.D., 'Formation of a new buried charge drives a large-amplitude protein quake in photoreceptor activation', Biochemistry, (2001), 40: 1510-1517

References
111
Yamato T., Niimura N., Go N., 'Molecular dynamics study of femtosecond events in photoactive yellow protein after photoexcitation of the chromophore', Proteins, (1998), 32: 268-275
Yoda M., Houjou H., Inoue Y., Sakurai M., 'Spectral tuning of photoactive yellow protein. Theoretical and experimental analysis of medium effects on the absorption spectrum of the chromophore', Journal of Physical Chemistry B, (2001), 105: 9887-9895
Zhou Y., Ujj L., Meyer T.E., Cusanovich M.A., Atkinson G.H., 'Photocycle dynamics and vibrational spectroscopy of the E46Q mutant of photoactive yellow protein', Journal of Physical Chemistry A, (2001), 105: 5719-5726

112
Summary
All life forms interact with each other and/or their environment in one-way or another. Therefore, the gathering and subsequent relay of information may be considered a vital part of life. One important source of information is light or electromagnetic radiation. For the organism Halorhodospira halophila (formerly Ectothiorhodospira halophila), light first of all is an energy source. However, this organism also contains light sensing systems that not only guide it towards this energy source, but also steer it away from potentially harmful UV radiation. The Photoactive Yellow Protein (PYP) is a sensor for the latter, i.e. it is a sensor for the photophobic blue light response in H. halophila. Currently, PYP is the only identified component of this blue light sensing system. No transducer protein(s) that can relay the information from the sensor to the cell has/have been identified yet. Additional blue-light sensors, similar to PYP, have been identified in other organisms. This family of proteins is called Xanthopsins and can be divided into three sub-groups based on their primary structure. Though all Xanthopsins are blue-light sensors, they are not all involved in photophobic responses. It is likely that between the Xanthopsin sub-groups, the cellular response upon activation of their blue-light sensor is different. Of the Xanthopsins, PYP has been studied most extensively.
PYP is a small (125 amino acids, 14 kDa) water-soluble protein, which, when activated by blue light, goes through a photocycle. The combination of favorable handling characteristics, a relatively high photostability, a relatively simple chromophore, and the availability of an overexpression system, have made this protein a popular subject of study. This popularity is further enhanced by the availability of large amounts of structural information (e.g. a high resolution crystal structure of the ground state (obtained with X-ray diffraction), a solution structure of the ground state (obtained with NMR), and high resolution crystal structures of several photocycle intermediates (obtained with X-ray diffraction)). In addition, PYP has been dubbed the prototype for the PAS-fold, a folding motive found in signal transduction proteins from all kingdoms of life.
PYP has an α/β-fold. It contains a central β-sheet with an α-helical rich domain on each side. The chromophore, a thiol ester linked trans-4-hydroxycinnamic acid moiety, is deprotonated in the ground state and buried inside the protein. The negative charge of the chromophore is stabilized through delocalization of the charge, via a hydrogen-bonding network involving Tyr42, protonated Glu46, and Thr50, and ionic interaction with the positively charged Arg52. The photocycle of PYP can be divided into three basic steps. In the first the ground state (pG) is excited by blue light, after which the chromophore is isomerized from the trans to the cis configuration. At the end of this first basic step a spectrally red-shifted intermediate (pR) is formed. In the second basic step, the signaling state (pB) is formed. Here the chromophore becomes protonated and structural changes occur in the protein. In the third basic step, pG is recovered.
The exact sequence of events describing the first basic photocycle step is not known yet. It is however clear that two different excited states are formed, only one of which appears to lead to progression of the photocycle. In addition, two intermediates, I0 and I0
‡, have been identified, which are formed on a femto- to picoseconds and picoseconds time scale respectively. Both have a red-shifted absorption spectrum relative to both pG and pR. pR is then formed on a nanoseconds time-scale. During this first basic step, the chromophore is isomerized in such a way as to minimize the movement of the chromophore. This is accomplished by flipping the carbonyl function of the chromophore, which can be seen as a double isomerization from C7=C8-trans C9–Sγ-cis to C7=C8-cis C9–Sγ-trans. During this event the hydrogen-bonding network between the deprotonated chromophore, Tyr42, protonated Glu46, and Thr50 stays in tact. After pR has formed, some additional structural changes occur in the protein on a microseconds time scale. These changes only have a minor influence on the absorption spectrum of pR. During the second basic photocycle step, the chromophore is protonated by the nearby Glu46 and the intermediate pB’ is formed on a microsecond time scale. As a result, the hydrogen-bonding network is disrupted and a non-stabilized buried charge on Glu46 is obtained. This stressful situation is then resolved by either reforming pR or by formation of pB. In the latter the initially buried charge on Glu46 is exposed through a major structural change in the protein, or neutralized via protonation, depending on the conditions. As such the extent of structural change observed for this step differs depending on the conditions, from no structural change in crystals, at low temperature, and in insufficiently hydrated films, to large structural changes in solution, and sufficiently hydrated films. pB is typically formed on a milliseconds time scale. During the recovery of pG the chromophore is first deprotonated by solvent combined with a structural change of the protein to form the pBdeprot intermediate. From this intermediate the chromophore can be re-isomerized from cis to trans after which further structural changes occur quickly and pG is obtained. pG is typically recovered on a milliseconds to seconds time scale.

Summary
In recent years much progress has been made in PYP research. The comparison of data obtained with many different techniques has tremendously improved our understanding of the photocycle events in PYP. It also has aided the design and interpretation of new experiments. As such a comprehensive review on PYP research is given in Chapter 1 of this thesis, not only to familiarize the reader with the subject, but also to aid future work on PYP.
In Chapter 2 several lines of research are presented that have been used to characterize the structural change that occurs during the photocycle of PYP. Due to these structural changes, residues buried in pG may become exposed. For those residues that contain a group that can be (de)protonated, the pKa of that group may change as a result. For those cases it is possible that that residue changes its protonation state during the photocycle. This may then be observed as a change in pH. Indeed, net protonation changes can be observed in PYP. It has been found that these changes are pH dependent and range from net proton uptake at acidic pH to net proton release at alkaline pH. His108 has been identified as the cause of net proton uptake around pH 6. Furthermore, the obtained results support the idea that the chromophore is protonated by Glu46 and not by solvent. Furthermore, through analysis of the ground state structure several other residues were identified as possible causes of the observed net proton uptake/release.
Structural changes may also lead to the exposure of hydrophobic residues. By employing the fluorescent hydrophobicity probe Nile Red it was shown that upon formation of pB hydrophobic residues become exposed. Nile Red only seems to bind to the pB intermediate and not to pG, pR, or pB’. From NMR experiments it is known that in pB both the N-terminus and the area around the chromophore binding pocket are structurally perturbed. As in a N-terminally truncated from of PYP, the Nile Red binding behavior was similar to that of wild type PYP, it was possible to narrow down the Nile Red binding site to the area around the chromophore binding site.
One of the major issues with regard to structural change upon formation of pB was the lack of major structural change in the crystal structure of the pB intermediate in contrast to the situation in solution. We resolved this issue using FTIR spectroscopy. It was confirmed that for PYP in crystalline form no major structural change occurs. However, it was also confirmed that for PYP in solution a major structural change does occur. Furthermore, in solution less structural change was observed for the mutants Glu46Gln and His108Phe compared to wild type PYP. Both Glu46 and His108 have previously been connected with events in which the structure of PYP changes considerably. Also, pH dependence in the extent of structural change was observed for wild type PYP, in which the protonation state of Glu46 seems to play a crucial role.
In Chapter 3 two lines of research are presented that have been used to characterize the photocycle of PYP in the nanoseconds to seconds time range. The photoactivity of PYP is not limited to its ground state, the photocycle intermediates are also photoactive. By continuous actinic illumination of PYP a steady state sample, consisting mainly of pG and pB, is obtained. By specifically exciting the pB state, a photon-induced branching reaction from pB to pG was activated (and investigated). It was shown that this branching reaction leads to a 3 orders of magnitude faster dark recovery of pG. Here the intermediate pBt is formed instantaneously on a nanosecond timescale. In pBt the chromophore has been re-isomerized from cis to trans photoactively. This indicates that re-isomerization is one of the rate limiting steps in dark recovery.
Through (kinetic) deuterium isotope effects it is possible to obtain further information about the mechanism of certain photocycle steps. As the photocycle of PYP is pH dependent, it is important to perform a pH-dependency analysis of both a deuterated and a non-deuterated sample. When comparing those data a distinction has to be made between comparing the data as function of pH and pOH. This distinction is no longer arbitrary in this case because of the difference in dissociation constant of water and deuterium oxide. From the comparison it is evident that most photocycle reactions of PYP are pOH dependent. Furthermore, with the recent improvement in the understanding of the photocycle, we were able to improve on an earlier pH dependent analysis of the photocycle. Here it has become clear that pB’ is in a pH dependent equilibrium with pR, providing an explanation for the earlier unexplained observation that the pR to pB reaction is bi-exponential in some cases and mono-exponential in others. Additionally it was shown that the absorption spectra of pB’ and pB are similar and not identical. The observation that pG recovery shows an inverse kinetic deuterium isotope effect, allowed the introduction of a new intermediate pBdeprot, which is in equilibrium with pB. In pBdeprot the chromophore has become deprotonated by solvent and the protein has adopted a fold that can catalyze re-isomerization of the chromophore from cis to trans. The extensive pH dependent analysis, is not only an improvement on the previous analysis, but is also an important tool for
113

Summary
114
further study of the PYP photocycle, as it provides a way to determine the optimal conditions to study specific photocycle events in more detail.
In Chapter 4 several lines of research are presented that have not been completed yet, but warrant further study. As after the over production of PYP the chromophore has to be connected to the protein chemically, it is fairly straightforward to introduce analog chromophores. Several of these have been tested. However, the production of the hybrid PYP containing the chromophore analog 4-hydroxyphenylpropiolic acid proved to be not quite as straightforward as previously thought. In addition, several pilot experiments with regard to protein (photo)stability, and the use of Small Angle X-ray/Neutron Scattering to study structural changes in PYP are discussed. Also, a final discussion of the work presented in this thesis is given together with some suggestions for future work.
115
Samenvatting
Alle vormen van leven hebben interactie met elkaar en/of hun omgeving. Men kan daarom zeggen dat het verzamelen en vervolgens doorgeven van informatie een essentieel deel is van het leven. Een belangrijke bron van informatie is licht ofwel elektromagnetische straling. Voor het organisme Halorhodospira halophila (voorheen Ectothiorhodospira halophila) dient licht als een energie bron. Daarnaast bezit dit organisme lichtdetectiesystemen die het niet alleen naar deze bron van energie toe leiden, maar die er ook voor zorgen dat het organisme weg blijft van mogelijk gevaarlijke UV straling. Het Fotoactieve Gele Eiwit (‘Photoactive Yellow Protein’, PYP) is een sensor voor dit laatste proces, een fotofobische blauwlichtreactie in H. halophila. Op dit moment is PYP de enige component die is geïdentificeerd voor dit blauwlichtdetectiesysteem. Er zijn nog geen transductie eiwitten geïdentificeerd die het signaal van de sensor naar de cel kunnen doorgeven. Ook in andere organismen zijn PYPachtige blauwlichtsensoren gevonden. De eiwitfamilie waar al deze blauwlichtsensoren onder vallen is de Xanthopsin familie, welke in drie subgroepen kan worden verdeeld op basis van de primaire structuur van de eiwitten. Hoewel het hier allemaal blauwlichtsensoren betreft, zijn ze niet allemaal onderdeel van een fotofobische blauwlichtresponse. Het is waarschijnlijk dat tussen de verschillende Xanthopsine subgroepen de reactie van de cel, als gevolg van het absorberen van blauw licht, anders is. Van alle Xanthopsines is PYP de best bestudeerde.
PYP is een klein (125 aminozuren, 14 kDa) wateroplosbaar eiwit dat, wanner het wordt geactiveerd door blauw licht, een fotocyclus doorloopt. De combinatie van goede handelbaarheidskarakteristieken, een relatief hoge fotostabiliteit, een relatief simpele chromofoor, en de beschikbaarheid van een overproductie systeem, hebben dit eiwit tot een populair onderwerp van onderzoek gemaakt. Deze populariteit wordt daarbij nog eens verhoogd door de beschikbaarheid van grote hoeveelheden informatie omtrent de structuur van het eiwit (bijv. hoge resolutie kristalstructuur van de grondtoestand (verkregen via Röntgendiffractie), structuur van PY in oplossing (verkregen via NMR), en kristalstructuren van verschillende fotocyclus intermediairen (verkregen via Röntgendiffractie)). Daarnaast is PYP verkozen als prototype voor de structuur van het PAS domein, een eiwitvouwingsmotief dat in signaal transductie eiwitten uit alle soorten levensvormen op aarde voorkomt.
PYP heeft een α/β-vouwing en bestaat uit een centrale β-sheet met aan beide kanten een α-helix rijk domein. De chromofoor, een thiol ester gebonden ‘4-hydroxycinamic acid’ (4-hydroxykaneelzuur of p-coumaarzuur), is gedeprotoneerd in de grondtoestand en ‘opgeborgen’ binnenin het eiwit. De negatieve lading op de chromofoor wordt gestabiliseerd door delokalisatie van de lading, via een waterstofbrugnetwerk met Tyr42, geprotoneerd Glu46, en Thr50, en een ionogene interactie met de positief geladen Arg52. De fotocyclus van PYP kan in drie basisstappen worden verdeeld. In de eerste basisstap wordt de grondtoestand (pG) geëxciteerd door blauw licht, waarna de chromofoor wordt geïsomeriseerd van de trans naar de cis vorm. Aan het eind van deze eerste basisstap wordt een spectraal roodverschoven intermediair (pR) gevormd. In de tweede basisstap wordt de signaaltoestand (pB) gevormd. Hierbij wordt de chromofoor geprotoneerd en vinden er structuurveranderingen plaats in het eiwit. In de derde basisstap wordt pG teruggevormd en is de cyclus rond.
De exacte volgorde van veranderingen die de eerste basisstap beschrijven is nog niet helemaal bekend. Het echter wel duidelijk dat twee verschillende geëxciteerde toestanden worden gevormd, waarvan er één leid tot voortgang van de fotocyclus. Daarnaast zijn er twee intermediairen, I0 en I0
‡, geïdentificeerd welke respectievelijk op een femto- tot picoseconde en picoseconde tijdsschaal worden gevormd. Beide hebben een roodverschoven absorptiespectrum relatief tot zowel pG als pR. Vervolgens wordt pR gevormd op de nanoseconde tijdschaal. Gedurende deze eerste basisstap wordt de chromofoor geïsomeriseerd op een dusdanige manier dat de positie van de chromofoor zo min mogelijk verandert. Dit wordt gerealiseerd door rotatie van de carbonyl groep van de chromofoor wat gezien kan worden als een dubbel isomerisatie van C7=C8-trans C9–Sγ-cis naar C7=C8-cis C9–Sγ-trans. Hierbij blijft het waterstofbruggen netwerk met Tyr42, geprotoneerd Glu46, en Thr50, in tact. Nadat pR is gevormd vinden er nog een aantal structurele relaxaties plaats in het eiwit op een microseconde tijdschaal. Deze veranderingen hebben maar een kleine invloed op het absorptiespectrum van pR. Gedurende de tweede basisstap wordt de chromofoor geprotoneerd door het naburige Glu46 waarbij de intermediair pB’ wordt gevormd op een microseconde tijdschaal. Als gevolg wordt het waterstofbrugnetwerk ontbonden en ontstaat er een ongestabiliseerde negatieve lading op Glu46. Deze stressvolle situatie kan worden opgelost door óf terug te keren naar pR óf door pB te vormen. In het laatste geval wordt Glu46 blootgesteld via grote structuurveranderingen in het eiwit, of door Glu46 te neutraliseren door het te protoneren, afhankelijk van de condities. Als gevolg kan de hoeveelheid
Samenvatting
structuurverandering die wordt geobserveerd in deze stap, afhankelijk van de condities, variëren van geen structuurverandering in kristallen, bij lage temperatuur, en in onvoldoende gehydrateerde films, tot grote structuurveranderingen in oplossing, en voldoende gehydrateerde films. pB wordt typisch gevormd op een milliseconde tijdschaal. Gedurende de terugwinning van pG wordt de chromofoor eerst gedeprotoneerd via de oplossing en vindt er een structuurverandering plaats. Hierbij wordt de intermediair pBdeprot gevormd. Via deze intermediair kan de chromofoor gereïsomeriseerd worden van cis naar trans waarna via snelle structuurveranderingen pG teruggewonnen wordt. pG wordt typisch teruggevormd op een milliseconde tot seconde tijdschaal.
In de afgelopen jaren is er veel progressie geboekt binnen het PYP onderzoek. Door data te vergelijken die zijn verkregen met vele verschillende technieken is een vergroot inzicht in de werking van PYP verkregen. Dit heeft ook geholpen bij het ontwerpen en interpreteren van nieuwe experimenten. Daarom is een compleet overzicht van het PYP onderzoek gegeven in Hoofdstuk 1, niet alleen om de lezer bekend te maken met het onderwerp, maar ook om verder onderzoek aan PYP te vergemakkelijken.
In Hoofdstuk 2 zijn verschillende lijnen van onderzoek verzameld welke gebruikt zijn om een beter inzicht te krijgen in de structuurveranderingen die gedurende de fotocyclus van PYP plaatsvinden. Als gevolg van structuurveranderingen kunnen residuen die begraven zijn in pG, blootgesteld worden aan het oplosmiddel in pB. Voor de residuen die een groep bezitten die kan worden ge(de)protoneerd, kan dat als gevolg hebben dat de pKa van die groep verandert. Daardoor is het mogelijk dat het betreffende residu van protoneringstoestand verandert, wat op zijn beurt kan resulteren in een pH verandering van de oplossing. Het is inderdaad mogelijk om netto veranderingen in de protoneringstoestand van PYP waar te nemen. Deze veranderingen blijken pH afhankelijk te zijn en variëren van proton opname bij zure pHs tot proton uitstoting bij alkalische pHs. His108 is geïdentificeerd als de veroorzaker van proton opname rond pH 6. Deze resultaten bevestigen verder het idee dat de chromofoor door Glu46 wordt geprotoneerd en niet vanuit de oplossing. Daarnaast is het mogelijk gebleken, door analyse van de grondtoestandsstructuur, om verschillende andere residuen te identificeren die mogelijk netto proton opname/afstoting veroorzaken.
Structuurveranderingen kunnen ook leiden tot blootstelling van hydrofobe residuen. Door gebruik te maken van de fluorescente probe Nile Red was het mogelijk om aan te tonen dat als gevolg van de vorming van pB, hydrofobe residuen blootgesteld worden aan het oplosmiddel. Deze probe lijkt alleen te binden aan pB en niet aan pG, pR, en pB’. Uit NMR experimenten weten we dat in pB zowel de N-terminus als het gebied rond de chromofoorbindingspocket structuurveranderingen ondergaan. Aangezien in een N-terminaal getrunceerde variant van PYP het bindingsgedrag van Nile Red gelijkwaardig is aan dat van het wild type PYP, is het mogelijk om in het gebied rond de chromofoorbindingspocket aan te wijzen als de meest waarschijnlijke bindingsplaats van Nile Red.
Eén van de grote (schijnbare) tegenstrijdigheden met betrekking tot structuurverandering in pB is de afwezigheid van grote structuurveranderingen in de kristalstructuur van de pB intermediair. Dit probleem is opgelost met behulp van FTIR spectroscopie. Hiermee is bevestigd dat, voor PYP in kristallijne vorm, er geen grote structuurveranderingen plaatsvinden. Echter, er is ook een bevestiging gevonden dat voor PYP in oplossing er wel degelijk grote structuurveranderingen plaats vinden. Verder is er in oplossing een minder grote structuurverandering waargenomen voor de mutanten Glu46Gln en His108Phe, in vergelijking met wild type PYP. Zowel Glu46 als His108 zijn eerder geassocieerd met structuurveranderingen in PYP. Daarnaast is ook vastgesteld dat de mate van structuurverandering pH afhankelijk is, waarbij de protoneringstoestand van Glu46 een cruciale rol lijkt te spelen.
In Hoofdstuk 3 zijn twee lijnen van onderzoek verzameld welke gebruikt zijn om de fotocyclus van PYP te karakteriseren van de nanoseconde tot de seconde tijdschaal. De fotoactiviteit van PYP is niet gelimiteerd tot de grondtoestand, ook de overige fotocyclus intermediairen zijn fotoactief. Door continue actinische belichting van een PYP monster kan een evenwichtssituatie bereikt worden waarbij hoofdzakelijk pG en pB aanwezig zijn. Door specifiek pB te exciteren was het mogelijk om de foton geïnduceerde pB naar pG reactie te bestuderen. Hierbij is aangetoond dat deze reactie 3 grootteordes sneller is dan de equivalente reactie in het donker. Hierbij wordt de intermediair pBt instantaan gevormd op de nanoseconde tijdschaal. In pBt is de chromofoor door licht absorptie ge-reïsomeriseerd van cis naar trans. Dit suggereert dat reïsomerisatie één van de snelheidsbepalende stappen is voor terugwinning van pG in het donker.
116
Met behulp van het (kinetisch) deuterium isotoop effect is het mogelijk om informatie te krijgen over de reactiemechanismen van de verschillende fotocyclus stappen. Aangezien de fotocyclus van PYP pH afhankelijk is, is het belangrijk om zowel een pH afhankelijke analyse in water als in deuteriumoxide uit te

Samenvatting
117
voeren. Wanneer deze data dan worden vergeleken moet er onderscheid gemaakt worden tussen het vergelijken van de data als functie van pH en pOH. Dit onderscheid is in dit geval niet arbitrair vanwege het verschil in dissociatieconstante van water en deuteriumoxide. Uit de vergelijking blijkt dat de meeste fotocyclus stappen pOH afhankelijk zijn. Met het recent verbeterde inzicht in de fotocyclus, was het verder mogelijk om een eerdere pH afhankelijke analyse te verbeteren. Hierbij is het duidelijk geworden dat pB’ een pH afhankelijk evenwicht vormt met pR. Hiermee is tevens een verklaring gevonden voor de waarneming dat de pR naar pB reactie soms bi-exponentieel en soms mono-exponentieel gedrag vertoont. Tevens is aangetoond dat de absorptie spectra van pB’ en pB sterk op elkaar lijken, maar niet identiek zijn. De waarneming dat pG terugwinning een invers kinetisch deuterium isotoop effect laat zien heeft het mogelijk gemaakt om een nieuwe intermediair, pBdeprot, te introduceren, welke in evenwicht staat met pB. In pBdeprot is de chromofoor gedeprotoneerd en heeft het eiwit een vouwingsvorm aangenomen die reïsomerisatie van de chromofoor van cis naar trans mogelijk maakt. De uitgebreide pH afhankelijke analyse is niet alleen een verbetering van een eerdere analyse, maar is ook een belangrijke bron van informatie voor verder onderzoek aan PYP aangezien het een mogelijkheid biedt om de beste condities te vinden voor de bestudering van specifieke fotocyclus deel-reacties.
In Hoofdstuk 4 zijn verschillende lijnen van onderzoek beschreven die nog niet afgerond zijn, maar waarvoor verder onderzoek wel interessant is. Aangezien bij de overproductie van PYP de chromofoor op een chemische manier aan het eiwit wordt gekoppeld, is het vrij gemakkelijk om een alternatieve chromofoor te introduceren. Verschillende chromoforen zijn getest, waarbij echter de productie van het hybride PYP met de chromofoor ‘4-hydroxyphenylpropiolic acid’ niet zo recht toe recht aan bleek te zijn als eerder werd gedacht. Daarnaast worden er verschillende ‘pilot’ experimenten besproken die zijn uitgevoerd met betrekking tot eiwit (foto)stabiliteit en het gebruik van Kleine Hoek Röntgen/Neutron Verstrooiing (Small Angle X-ray/Neutron Scattering) om structuurveranderingen in PYP te bestuderen. Dit hoofdstuk wordt afgesloten met een korte discussie van het totaal van de experimenten die in dit proefschrift zijn gepresenteerd, samen met verschillende suggesties voor toekomstig onderzoek aan PYP.

This page was left blank intentionally
118
119
Dankwoord (Acknowledgements)
Hier zijn we dan aangekomen bij mogelijk het belangrijkste deel van dit proefschrift. In ieder geval dat onderdeel van het proefschrift dat door de meeste mensen wordt gelezen. Ga snel kijken of je er bij staat. Mocht je er niet bij staan dan heb je blijkbaar weinig indruk op me gemaakt of ben ik je gewoon vergeten (niet ondenkbaar in de hectische tijden gedurende de afronding van dit proefschrift). Voor de taalfreaks onder jullie heb ik tevens wat taalfauten toegevoegt waar jullie je op kunnen uitleven (;-)).
Ik zou graag beginnen met het danken van de leescommissie voor hun waardevolle tijd. Ik hoop dat jullie mijn proefschrift met plezier hebben gelezen. Verder wil ik mijn dank betuigen aan mijn promotor Klaas Hellingwerf en copromotor Wim Crielaard. Jullie hebben er toch voor gezorgd dat ik aan het Photoactive Yellow Protein heb kunnen werken deze afgelopen jaren. Klaas je wist altijd toch weer tijd te vinden om met nieuwe computer problemen op de kroppen te komen die opgelost moesten worden. Je hebt er ook voor gezorgd dat mijn artwork en filmpjes van PYP over de hele wereld vertoond zijn, waarbij je zo vriendelijk was om de goede kritieken die je daarover kreeg ook aan mij door te geven. Daarmee is mijn ego toch regelmatig gestreeld geweest. Je kon ook altijd goed merken wanneer je toe was aan vakantie, de spanning in de groep was dan te snijden en je werd dan ook zoveel mogelijk gemeden. Bij terugkomst van vakantie was je dan altijd weer makkelijk in de omgang. Een tip voor de toekomst, offer nooit je vakantie op, dat is niet alleen goed voor zelf, maar ook voor de werksfeer in de groep. Wim jouw stijl is duidelijk veel losser dan die van Klaas. Dat is wel zo prettig en brengt toch ook wat evenwicht in de groep. Je bent ook degene die de penibele computersituatie op het lab opgelost heeft m.b.v. je computercursus. Ik ben je daar dan ook erg dankbaar voor. Ik had je graag wel eens willen assisteren bij deze computercursus, maar op de een of andere manier zat ik altijd in het buitenland wanneer deze cursus gegeven werd. Ik weet nog goed dat we op 11 September op weg waren naar Grenoble, toen je door je vrouw gebeld werd dat er extreme dingen in New York gebeurden. Je schakelde dan ook meteen over naar de BBC op de radio. We hebben toen vervolgens een uur lang kunnen luisteren naar de mestproblematiek in het Verenigd Koninkrijk. Ik ben ook erg dankbaar dat je wat leuke spelletjes op je labtop had geïnstalleerd. Dit heeft er toch voor gezorgd dat ik de nachtelijke meetsessies in Grenoble goed doorgekomen ben. Hoewel de dagen zwaar waren in Grenoble, hebben we toch ook altijd wel wat tijd kunnen vinden om er even tot rust te komen. Als er één ding is wat ik heb opgepikt gedurende onze samenwerking is dat het belangrijk is je privé leven goed te scheiden van je wetenschappelijke leven.
Ik zou ook graag mijn dank betuigen aan de mensen op het lab. Robert, jij hebt me in het begin de weg gewezen en me vele dingen met betrekking tot eiwit productie en zuivering geleerd. Je zult altijd die aardige collega aan de andere kant van de labtafel voor me zijn. Ik hoop dat je het naar je zin hebt bij je nieuwe werkgever. Jasper, je was een aardige kamergenoot, ik hoop dat ik je niet al te veel last heb bezorgd door mijn windvlaagproducerende acties bij het betreden en verlaten van onze kamer. Je gitaarkunsten hebben veel indruk op me gemaakt. Ik hoop dat je huidige buren dezelfde appreciatie voor je gitaarspel hebben. Frank en Arthur, jullie unieke koffiehoek besprekingen en visies op het leven hebben me toch menige malen vermaakt. Daarnaast heb ik met plezier met jullie samengewerkt tijdens de practica microbiologie, waar ik waarschijnlijk meer geleerd heb over microbiologie dan de studenten zelf. Dennis, je bent een bijna onzichtbare, maar belangrijke kracht op het lab. Dit wordt eens temeer bevestigd als je een aantal weken, als gevolg van cursus of vakantie niet beschikbaar bent, en er een groot tekort aan schoon en steriel glaswerk ontstaat. Pieter, ook jij bent zo’n belangrijke onzichtbare kracht. Je zorgt er toch steeds weer voor dat de bestellingen op tijd gedaan worden. En mocht er een keer iets mis gaan, dan zorg je ervoor dat het zo snel mogelijk opgelost wordt. Menno, ik hoop dat je het naar je zin hebt gehad tijdens je HLO-stage. Aangezien ik zelf ook op het HLO heb gezeten, heb ik je tijd bij mij toch met enige nostalgie beleefd. Daarnaast ben ik dankzij jouw weer met regelmaat gaan zwemmen. Mijn dank daarvoor is groot. Die Thomas, je hebt een belangrijke en goede invloed op de groep gehad. Dankzij jouw hebben we kennis kunnen maken met het programma Origin, waardoor de analyse van data een stuk makkelijker is geworden. Daarnaast heb ik dankbaar gebruik kunnen maken van je grote wetenschappelijke kennis en inzicht. Hellaas zullen de rest van de mensen op het lab het moeten doen met een dankjewel voor de fijne werksfeer, Alex, Bart, Betsie, Femke, Frans, Inge, Jocelyne, Joost, Jos, Merijn, Michael, Mike, Remco, Wally, Wouter, studenten en anderen die ik mogelijk ben vergeten.

Dankwoord (Acknowledgements)
At this point I would like to thank the people at OSU, who have made my two stays on campus enjoyable. Brandy, your help has been vital during my first stay. Sadly I didn’t see much of you during my second stay for obvious reasons. I hope everything has turned out OK for you. I noticed that being a female computer expert is much easier than being a male computer expert. Nobody seemed to bother you with their small and not so small computer problems, allowing you time for all those other ‘important’ tasks. Beining and Jianning, thank you for driving me to and from the airport on my second visit. I was a bit worried when I got stuck in Chicago and wasn’t able to contact you that I was going to be a day late. I hope you guys were able to fix that heating problem in your car. Also, thanx to the other people at OSU that have made may stay enjoyable. Aihua, Wouter, and Shirley, thank you for welcoming me in your home and for those wonderful discussions around the dinner table. I thoroughly enjoyed playing the computer games and being able to provide at least some competitive gameplay.
Ik zou ook graag mijn dank betuigen aan mensen buiten het lab. Uiteraard Pa & Ma, die me beide, op hun eigen manier, hebben gesteund. Oma voor die fantastische vakantie in Singapore en Australië. We hebben het daar toch erg goed naar onze zin gehad. Een maandje met weinig zorgen doet een mens goed. Henk & Renata, altijd weer goed om even een filmpje te pikken. Marjolein & Erwin, ik hoop dat je na het lezen van ten minste het begin van dit proefschrift het duidelijk is waar ik nu mee bezig ben geweest, hoef je het niet meer te vragen. Levi, wat kan ik zeggen, duikmaatje, mede piloot. We hebben onze letterlijke diepte en hoogte punten samen ervaren. Dankzij jouw heb ik mijn levenslange dromen van duiken en vliegen kunnen verwezenlijken. Dit zijn belangrijke uitlaatkleppen die het leven mooi maken.
Zoals mensen om me heen wel zullen weten en/of gemerkt hebben is muziek een belangrijk onderdeel van mijn leven. Hierbij springen twee artiesten er toch wel met kop en schouders bovenuit. Bruce Springsteen en Natalie Merchant. De hemelse stem van Natalie zorgt er toch steeds weer voor dat ik tot rust kan komen in hectische tijden. En Bruce, wat kan ik zeggen, het is gewoon een energie bron. Wanneer ik het even niet meer zie zitten is een beetje Bruce altijd weer het juiste medicijn. De gedachte van de vele concerten van Bruce die ik heb mogen ondergaan zorgt er altijd weer voor op zijn minst een glimlach en de honger voor meer. Als hommage heb ik de titel van Hoofdstuk 4 vernoemd naar een Springsteen nummer op de 4-CD Box set ‘Tracks’. Daarnaast zijn enkele zinsneden in dit proefschrift ook geïnspireerd door Springsteen nummers.
Dan bekruipt me nu dan toch het gevoel dat ik iemand vergeten ben. Iemand belangrijks. Wie zou dat nou kunnen zijn? Uhm. Natuurlijk, Andrea ‘blup’ Haker. Hoe kan ik mijn nieuwe zwemmaatje nou vergeten. Ik ben blij dat ik samen met jouw mijn promotie kan gaan vieren. Met name de laatste paar weken zijn zwaar geweest. En het is dan fijn om iemand te hebben wie hetzelfde doormaakt. In de afgelopen jaren zijn er wel wat momenten geweest dat je helemaal in de war kwam door al die talen die je door elkaar sprak (Nederlands, Engels, Duits, Frans). Ik weet nog goed, dat vlak voor Thomas ons op het lab vergezelde, je stellig zei: ’Ik zal niet in het Duits met Thomas praten.’ Die vlieger ging dus niet op. Menige malen hoorde ik je in het Duits met Thomas converseren, waarna je vrolijk in het Duits tegen mij verder ging. Al met al hebben we denk ik onderling toch een prettige tijd gehad en veel geleerd. Plons.
Dit is het dan, het einde van dit proefschrift. Het is gelukt. Er kan weer van het leven genoten worden.
120

This page was left blank intentionally
121
Shining light on
the Photoactive Yellow Proteinfrom Halorhodospira halophila
Johnny Hendriks
Shining light onth
e P
ho
toactiv
e Y
ello
w P
rote
infrom
Halorhodospira halophila
Johnny Hendriks
Over the past few years I have thoroughly enjoyed the investigation of the Photoactive Yellow Protein from Halorhodospira halophila. Having shed light on important aspects of this protein by shining light on it, raising new and interesting questions in the process, it is with pain in my hart that I bid the study of this protein farewell (for the time being). The time has come to spread my wings and fly of to new adventures in science. Meet you further on up the road.
Johnny
Uitnodigingvoor het bijwonen van de
openbare verdediging van het proefschrift van
Johnny Hendriks
op vrijdag6 December 2002om 11:00 precies
in de Doelenzaalvan de Aula van de
Universiteit van Amsterdam
Oude Lutherse KerkSingel 411 (hoek Spui)
Amsterdam
Receptiena afloop van de promotie
Johnny HendriksHuigenbos 621
1102 KA Amsterdam020-6911715
Paranimfen
Henk [email protected]
Levi [email protected]
Het Spui is goed bereikbaar met de tram (lijn 1,2,5 of 9)