
Shin Kong Financial Holding - TWSEmops.twse.com.tw/nas/STR/288820100831M002.pdf · • SKL China...
59
-0- Confidential Shin Kong Financial Holding Company Overview September 2010
Transcript of Shin Kong Financial Holding - TWSEmops.twse.com.tw/nas/STR/288820100831M002.pdf · • SKL China...
-0-
Confidential
Shin Kong Financial Holding
Company OverviewSeptember 2010
-1-
This presentation and the presentation materials distributed herewith include forward-looking statements. All statements, other than statements of historical facts, that address activities, events or developments that Shin Kong Financial Holding Company (“Shin Kong FHC”) expect or anticipate will or may occur in the future (including but not limited to projections, targets, estimates and business plans) are forward-looking statements. Shin Kong FHC’s actual results or developments may differ materially from those indicated by these forward-looking statements as a result of various factors and uncertainties, including but not limited to price fluctuations, actual demand, exchange rate fluctuations, market shares, competition, changes in legal, financial and regulatory frameworks, international economic and financial market conditions, political risks, cost estimates and other risks and factors beyond our control. In addition, Shin Kong FHC makes the forward-looking statements referred to herein as of today and undertakes no obligation to update these statements.
Figures in this presentation and the presentation materials distributed herewith are numbers audited by the auditors.
Disclaimer
-2-
I. SKFH
II. Life Insurance Business
III. Banking Business
IV. Appendix• Market opportunities• SKL Premium• One-off losses of CDO & CBO investment• EV & AV Result• SKL China Development Strategy• Capital Enhancement• Other Information
Agenda
-2-
-3-
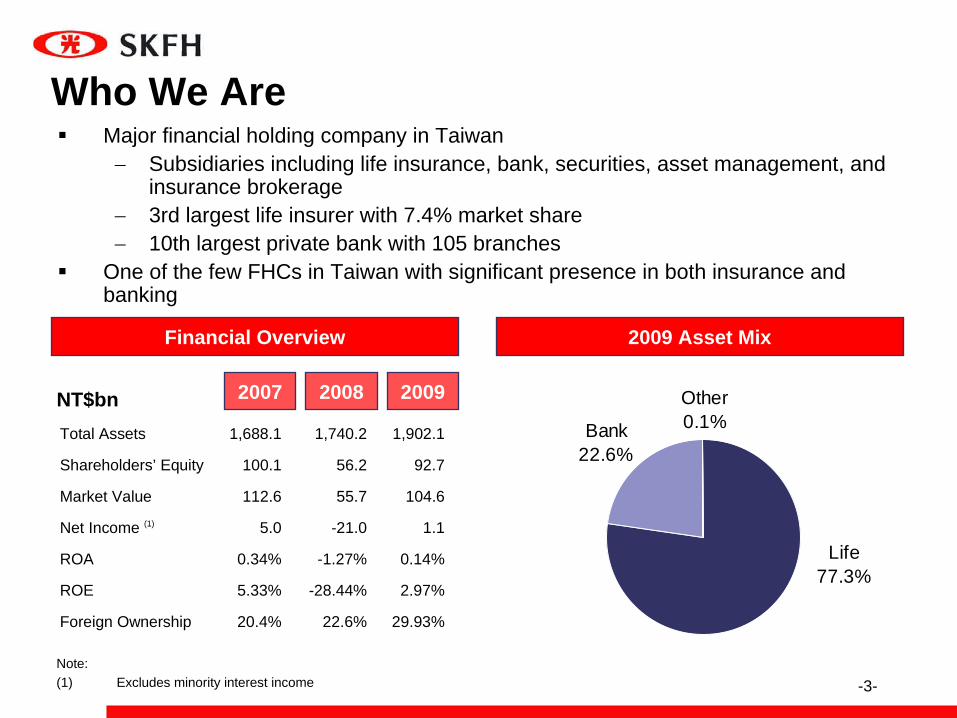
Who We AreMajor financial holding company in Taiwan−
Subsidiaries including life insurance, bank, securities, asset management, and insurance brokerage
−
3rd largest life insurer with 7.4% market share−
10th largest private bank with 105 branchesOne of the few FHCs in Taiwan with significant presence in both insurance and banking
2009 Asset Mix
Other0.1%Bank
22.6%
Life77.3%
Financial Overview
NT$bn 200920082007
Total Assets 1,688.1 1,740.2 1,902.1
Shareholders’ Equity 100.1 56.2 92.7
Market Value 112.6 55.7 104.6
Net Income (1) 5.0 -21.0 1.1
ROA 0.34% -1.27% 0.14%
ROE 5.33% -28.44% 2.97%
Foreign Ownership 20.4% 22.6% 29.93%
Note:(1) Excludes minority interest income
-4-
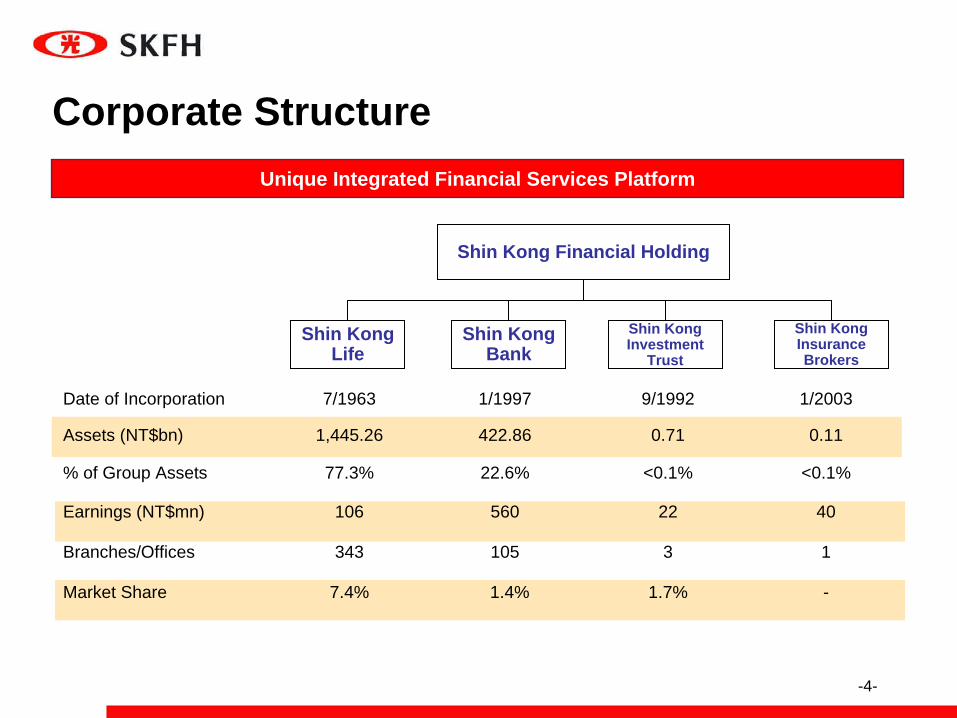
Corporate Structure
Date of Incorporation 7/1963 1/1997 9/1992 1/2003
Assets (NT$bn) 1,445.26 422.86 0.71 0.11
% of Group Assets 77.3% 22.6% <0.1% <0.1%
Earnings (NT$mn) 106 560 22 40
Branches/Offices 343 105 3 1
Market Share 7.4% 1.4% 1.7% -
Shin Kong Life
Shin Kong Bank
Shin Kong Insurance Brokers
Shin Kong Financial Holding
Unique Integrated Financial Services Platform
Shin Kong Investment
Trust
-5-
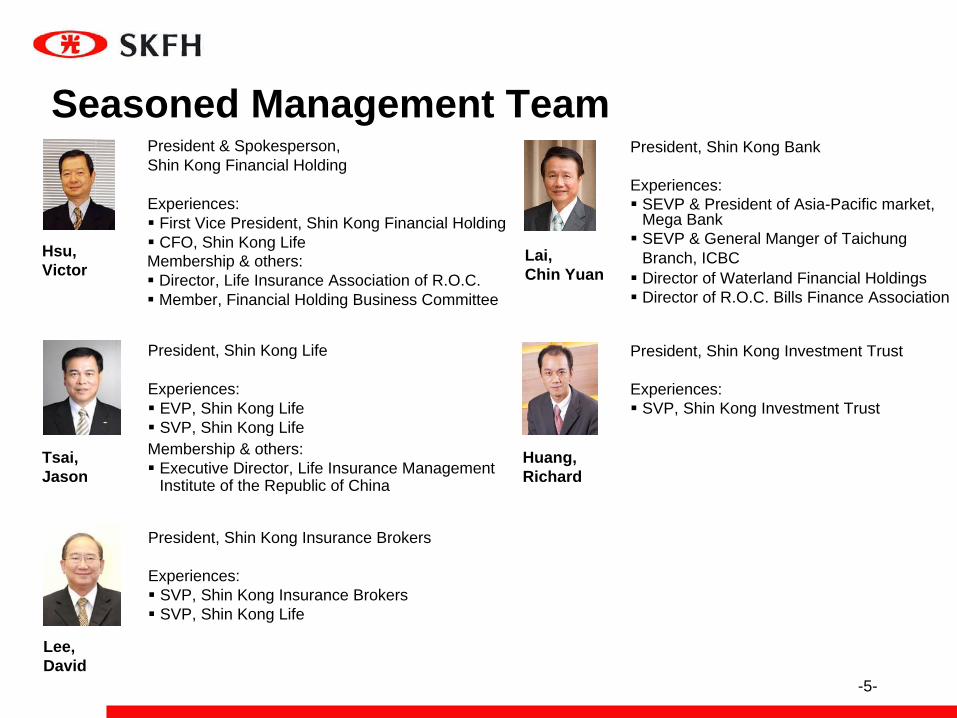
Seasoned Management TeamPresident & Spokesperson,Shin Kong Financial Holding
Experiences: First Vice President, Shin Kong Financial HoldingCFO, Shin Kong LifeHsu,
Victor
President, Shin Kong Life
Experiences: EVP, Shin Kong LifeSVP, Shin Kong Life
Tsai,Jason
President, Shin Kong Bank
Experiences:SEVP & President of Asia-Pacific market, Mega BankSEVP & General Manger of Taichung Branch, ICBCDirector of Waterland Financial Holdings Director of R.O.C. Bills Finance Association
Lai,Chin Yuan
President, Shin Kong Investment Trust
Experiences:SVP, Shin Kong Investment Trust
President, Shin Kong Insurance Brokers
Experiences:SVP, Shin Kong Insurance BrokersSVP, Shin Kong Life
Membership & others:Director, Life Insurance Association of R.O.C. Member, Financial Holding Business Committee
Membership & others:Executive Director, Life Insurance Management Institute of the Republic of China
Huang, Richard
Lee, David
-6-
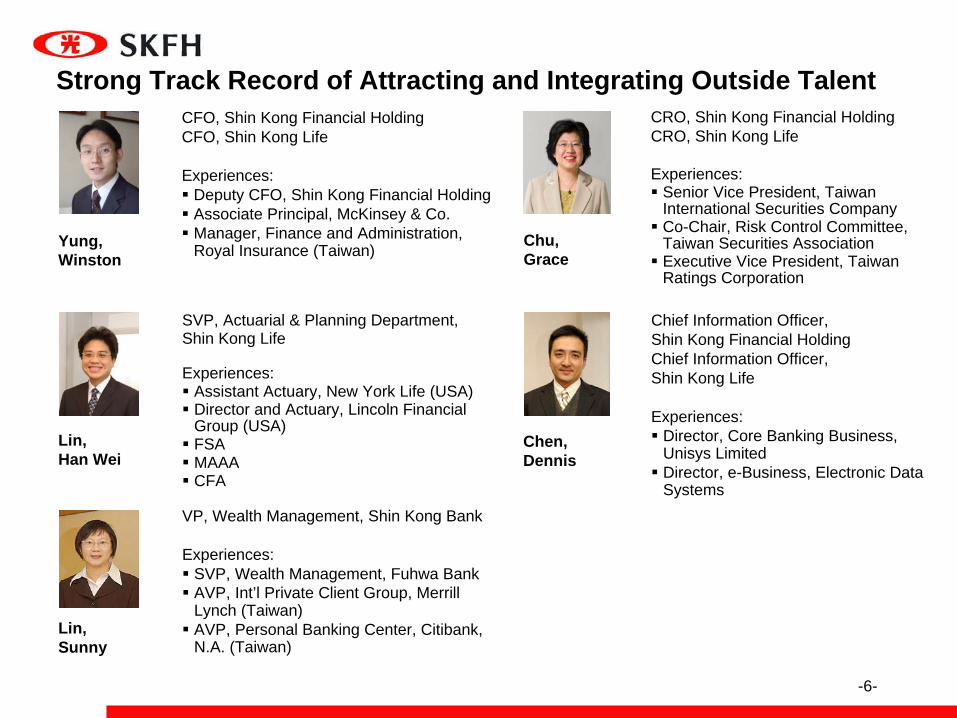
Strong Track Record of Attracting and Integrating Outside TalentCFO, Shin Kong Financial HoldingCFO, Shin Kong Life
Experiences:Deputy CFO, Shin Kong Financial HoldingAssociate Principal, McKinsey & Co.Manager, Finance and Administration, Royal Insurance (Taiwan)Yung,
Winston
VP, Wealth Management, Shin Kong Bank
Experiences: SVP, Wealth Management, Fuhwa BankAVP, Int’l Private Client Group, Merrill Lynch (Taiwan)AVP, Personal Banking Center, Citibank, N.A. (Taiwan)
Lin, Sunny
Chief Information Officer,Shin Kong Financial HoldingChief Information Officer,Shin Kong Life
Experiences: Director, Core Banking Business, Unisys LimitedDirector, e-Business, Electronic Data Systems
Chu,Grace
CRO, Shin Kong Financial HoldingCRO, Shin Kong Life
Experiences: Senior Vice President, Taiwan International Securities CompanyCo-Chair, Risk Control Committee, Taiwan Securities AssociationExecutive Vice President, Taiwan Ratings Corporation
Lin,Han Wei
SVP, Actuarial & Planning Department,Shin Kong Life
Experiences: Assistant Actuary, New York Life (USA)Director and Actuary, Lincoln Financial Group (USA)FSAMAAACFA
Chen, Dennis
-7-
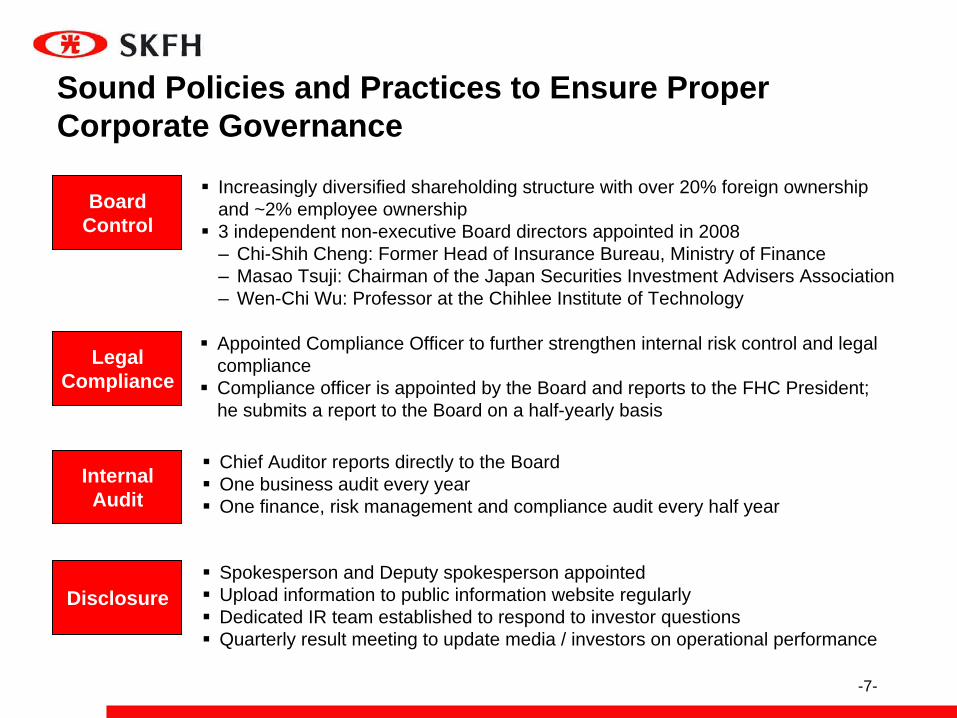
Sound Policies and Practices to Ensure Proper Corporate Governance
Board Control
Increasingly diversified shareholding structure with over 20% foreign ownership and ~2% employee ownership3 independent non-executive Board directors appointed in 2008‒
Chi-Shih Cheng: Former Head of Insurance Bureau, Ministry of Finance‒
Masao Tsuji: Chairman of the Japan Securities Investment Advisers Association‒
Wen-Chi Wu: Professor at the Chihlee Institute of Technology
Legal Compliance
Appointed Compliance Officer to further strengthen internal risk control and legal complianceCompliance officer is appointed by the Board and reports to the FHC President; he submits a report to the Board on a half-yearly basis
Internal Audit
Chief Auditor reports directly to the BoardOne business audit every yearOne finance, risk management and compliance audit every half year
DisclosureSpokesperson and Deputy spokesperson appointedUpload information to public information website regularlyDedicated IR team established to respond to investor questionsQuarterly result meeting to update media / investors on operational performance
-8-
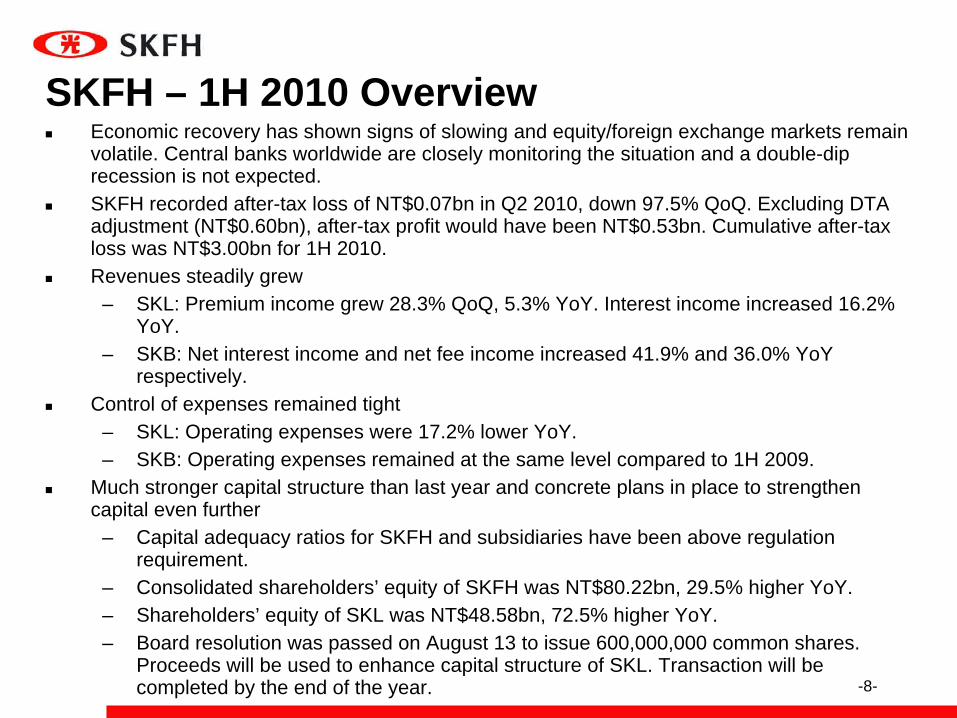
SKFH – 1H 2010 OverviewEconomic recovery has shown signs of slowing and equity/foreign exchange markets remain volatile. Central banks worldwide are closely monitoring the situation and a double-dip recession is not expected.SKFH recorded after-tax loss of NT$0.07bn in Q2 2010, down 97.5% QoQ. Excluding DTA adjustment (NT$0.60bn), after-tax profit would have been NT$0.53bn. Cumulative after-tax loss was NT$3.00bn for 1H 2010.Revenues steadily grew
– SKL: Premium income grew 28.3% QoQ, 5.3% YoY. Interest income increased 16.2% YoY.
– SKB: Net interest income and net fee income increased 41.9% and 36.0% YoY respectively.
Control of expenses remained tight– SKL: Operating expenses were 17.2% lower YoY.– SKB: Operating expenses remained at the same level compared to 1H 2009.
Much stronger capital structure than last year and concrete plans in place to strengthen capital even further
– Capital adequacy ratios for SKFH and subsidiaries have been above regulation requirement.
– Consolidated shareholders’ equity of SKFH was NT$80.22bn, 29.5% higher YoY.– Shareholders’ equity of SKL was NT$48.58bn, 72.5% higher YoY.– Board resolution was passed on August 13 to issue 600,000,000 common shares.
Proceeds will be used to enhance capital structure of SKL. Transaction will be completed by the end of the year.
-9-
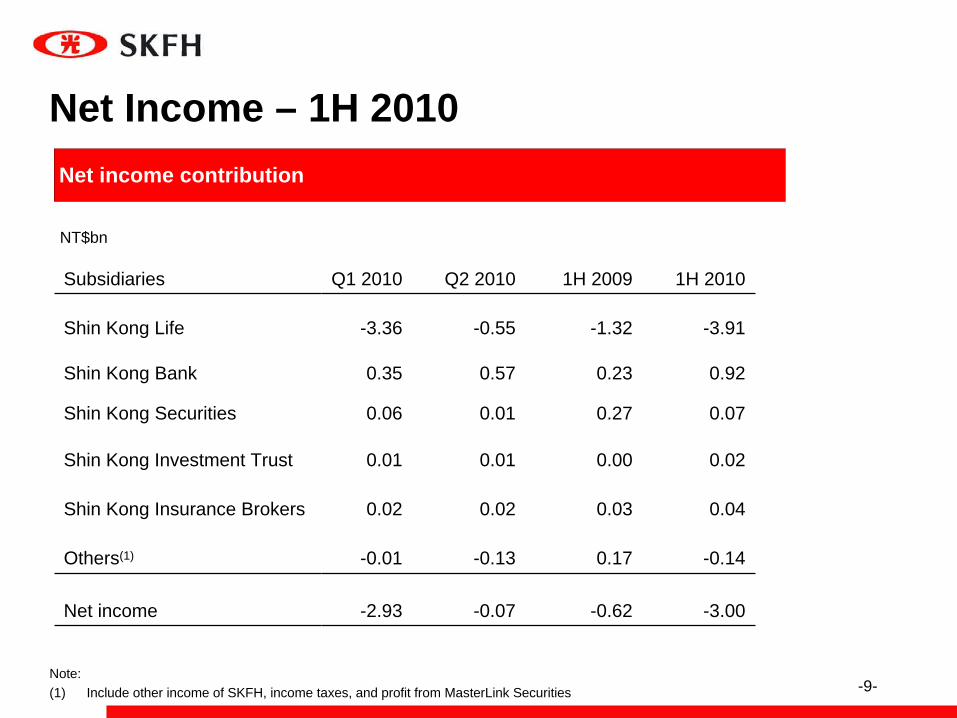
Net Income – 1H 2010Net income contribution
NT$bn
Note:(1) Include other income of SKFH, income taxes, and profit from MasterLink Securities
Subsidiaries Q1 2010 Q2 2010 1H 2009 1H 2010
Shin Kong Life -3.36 -0.55 -1.32 -3.91
Shin Kong Bank 0.35 0.57 0.23 0.92
Shin Kong Securities 0.06 0.01 0.27 0.07
Shin Kong Investment Trust 0.01 0.01 0.00 0.02
Shin Kong Insurance Brokers 0.02 0.02 0.03 0.04
Others(1) -0.01 -0.13 0.17 -0.14
Net income -2.93 -0.07 -0.62 -3.00
-10-
I. SKFH
II. Life Insurance Business
III. Banking Business
IV. Appendix• Market opportunities• SKL Premium• One-off losses of CDO & CBO investment• EV & AV Result• SKL China Development Strategy• Capital Enhancement• Other Information
Agenda
-10-
-11-
2009
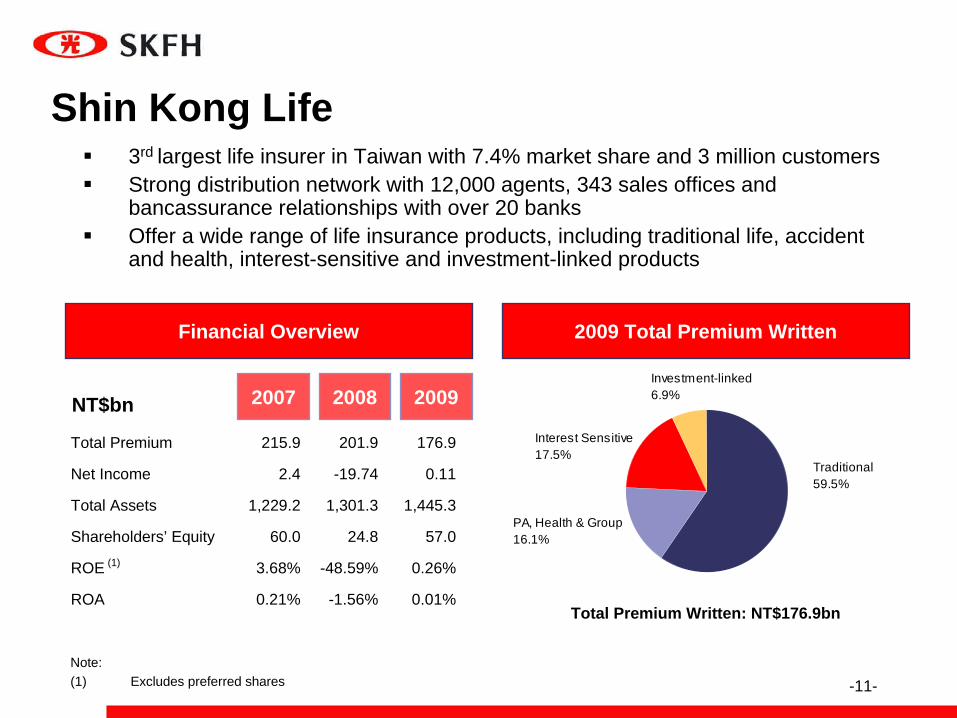
Shin Kong Life
2009 Total Premium WrittenFinancial Overview
NT$bn 20082007
Total Premium 215.9 201.9 176.9
Net Income 2.4 -19.74 0.11
Total Assets 1,229.2 1,301.3 1,445.3
Shareholders’ Equity 60.0 24.8 57.0
ROE (1) 3.68% -48.59% 0.26%
ROA 0.21% -1.56% 0.01%
Traditional59.5%
PA, Health & Group16.1%
Interest Sensitive17.5%
Investment-linked6.9%
Total Premium Written: NT$176.9bn
3rd largest life insurer in Taiwan with 7.4% market share and 3 million customersStrong distribution network with 12,000 agents, 343 sales offices and bancassurance relationships with over 20 banksOffer a wide range of life insurance products, including traditional life, accident and health, interest-sensitive and investment-linked products
Note:(1) Excludes preferred shares
-12-
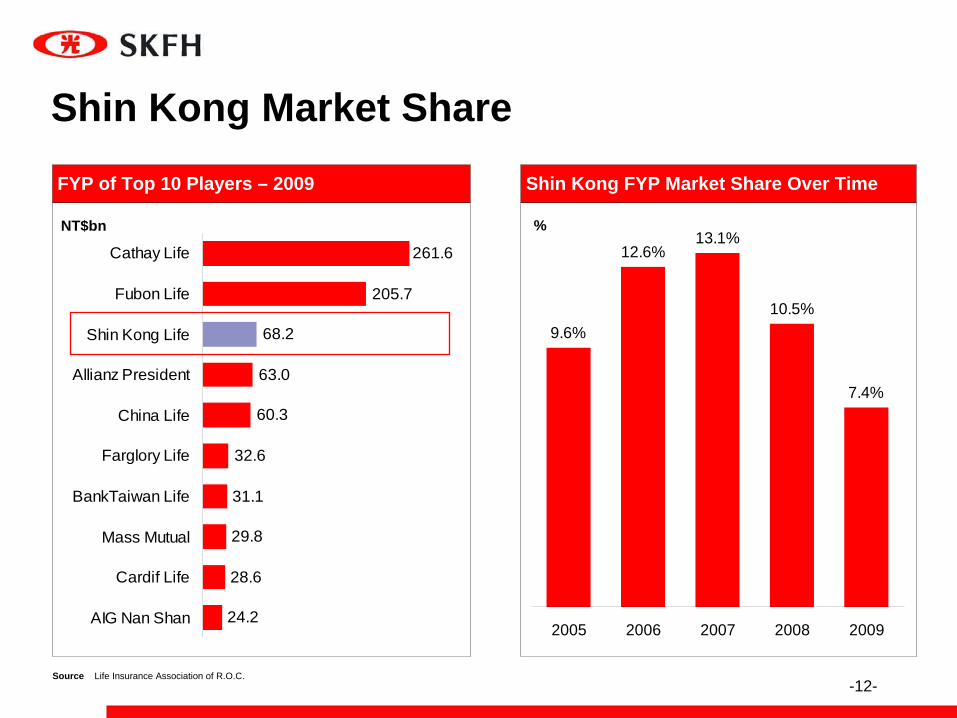
31.1
29.8
28.6
24.2
32.6
60.3
63.0
68.2
205.7
261.6Cathay Life
Fubon Life
Shin Kong Life
Allianz President
China Life
Farglory Life
BankTaiwan Life
Mass Mutual
Cardif Life
AIG Nan Shan
Shin Kong Market ShareFYP of Top 10 Players – 2009
7.4%
10.5%
13.1%12.6%
9.6%
2005 2006 2007 2008 2009
Shin Kong FYP Market Share Over Time
Source Life Insurance Association of R.O.C.
NT$bn %
-13-
Awards and Recognition
National Quality Award (2004) by MOEA
Taiwan Capital Markets Deal of the Year (2009) by IFR Asia
Institutional Investor of the Year (2006) by Finance Asia
Information Disclosure A+ (2006, 2007, 2008, 2009, 2010) by Securities & Futures Institute
Taiwan Superbrand (2006) by Superbrands International
National Community Service Award (2007) by Ministry of the Interior
Global Views Excellent Service Award (2008) by Taiwan Global Views Magazine
Best IR Website in Taiwan (2010) and Top 5 Websites in Greater China (2009) by IR Global Rankings
-14-
SKL recorded lower after-tax loss of NT$0.55bn in Q2 2010 driven by higher premium income and lower foreign exchange hedging cost. Excluding DTA adjustment (NT$0.60bn), after-tax profit would have been NT$0.05bn. Cumulative after-tax loss was NT$3.91bn in 1H. ROE was -7.40%.1H FYP was NT$37.93bn, up 21.2% YoY. Q2 FYP was NT$22.46bn, 45.2% higher QoQ. Market share was 6.7%.Sales were mainly contributed by traditional and interest-sensitive products, accounting for 25.3% and 63.5% of FYP respectively. Protection products were the focus of traditional sales vs higher share of single premium savings products in 2009. Due to stabilization in global markets, sales of investment-linked products increased to NT$1.84bn in Q2 2010.Margin is the main consideration in new product development. SKL recently launched regular premium investment-linked product and protection product co-developed with Dai-ichi Life to drive mortality/expense gains.13-month persistency improved to 91.3%. 25-month persistency was 76.3%.1H annualized investment return was 3.2%.Shareholders’ equity was NT$48.58bn, up 72.5% YoY.
SKL – 1H 2010 Overview
-15-
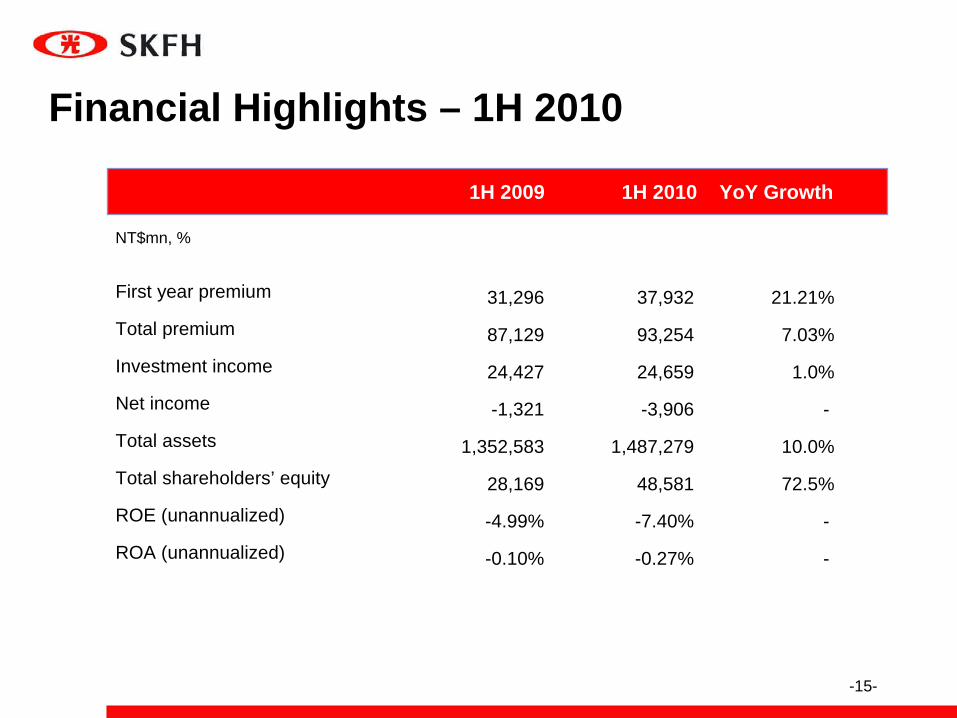
Financial Highlights – 1H 2010
NT$mn, %
1H 2009 1H 2010 YoY Growth
First year premium 31,296 37,932 21.21%
Total premium 87,129 93,254 7.03%
Investment income 24,427 24,659 1.0%
Net income -1,321 -3,906 -
Total assets 1,352,583 1,487,279 10.0%
Total shareholders’ equity 28,169 48,581 72.5%
ROE (unannualized) -4.99% -7.40% -
ROA (unannualized) -0.10% -0.27% -
-16-
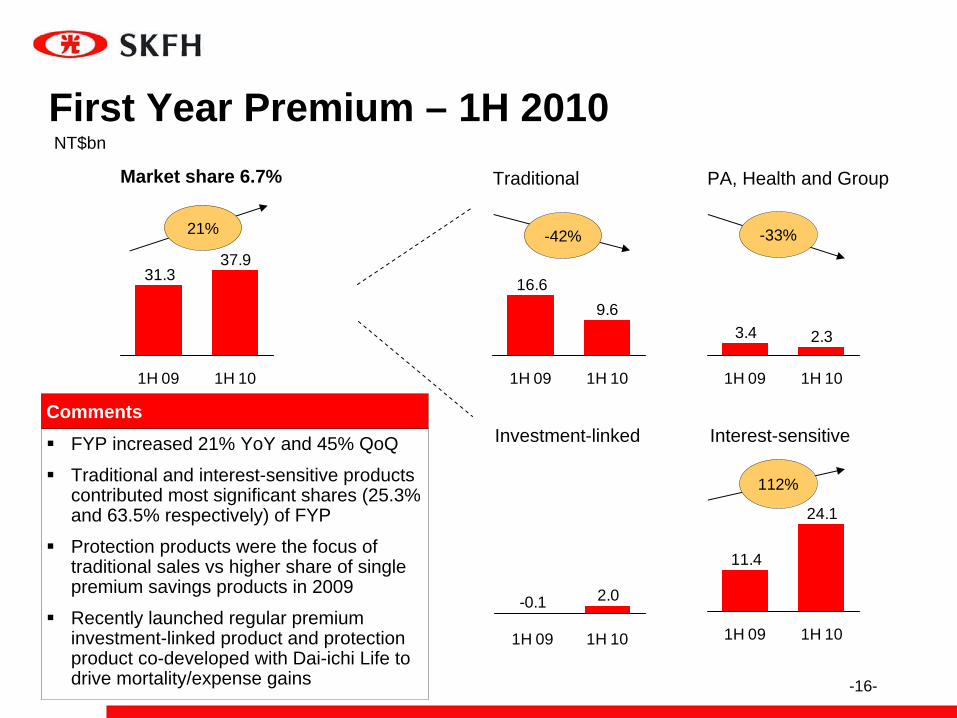
First Year Premium – 1H 2010NT$bn
PA, Health and Group
Investment-linked Interest-sensitive
TraditionalMarket share 6.7%
CommentsFYP increased 21% YoY and 45% QoQ
Traditional and interest-sensitive products contributed most significant shares (25.3% and 63.5% respectively) of FYP
Protection products were the focus of traditional sales vs higher share of single premium savings products in 2009
Recently launched regular premium investment-linked product and protection product co-developed with Dai-ichi Life to drive mortality/expense gains
37.931.3
1H 09 1H 10
9.616.6
1H 09 1H 10
2.33.4
1H 09 1H 10
2.0-0.1
1H 09 1H 10
24.1
11.4
1H 09 1H 10
21% -42%
112%
-33%
-17-
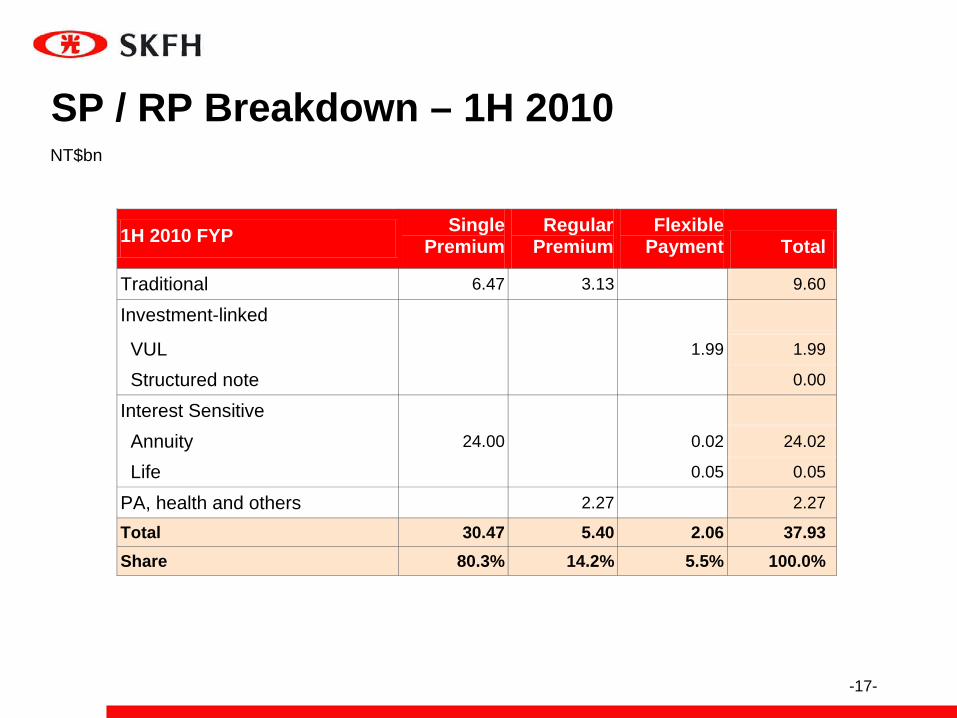
SP / RP Breakdown – 1H 2010NT$bn
1H 2010 FYP Single Premium
Regular Premium
Flexible Payment Total
Traditional 6.47 3.13 9.60
Investment-linked
VUL 1.99 1.99
Structured note 0.00
Interest Sensitive
Annuity 24.00 0.02 24.02
Life 0.05 0.05
PA, health and others 2.27 2.27
Total 30.47 5.40 2.06 37.93 Share 80.3% 14.2% 5.5% 100.0%
-18-
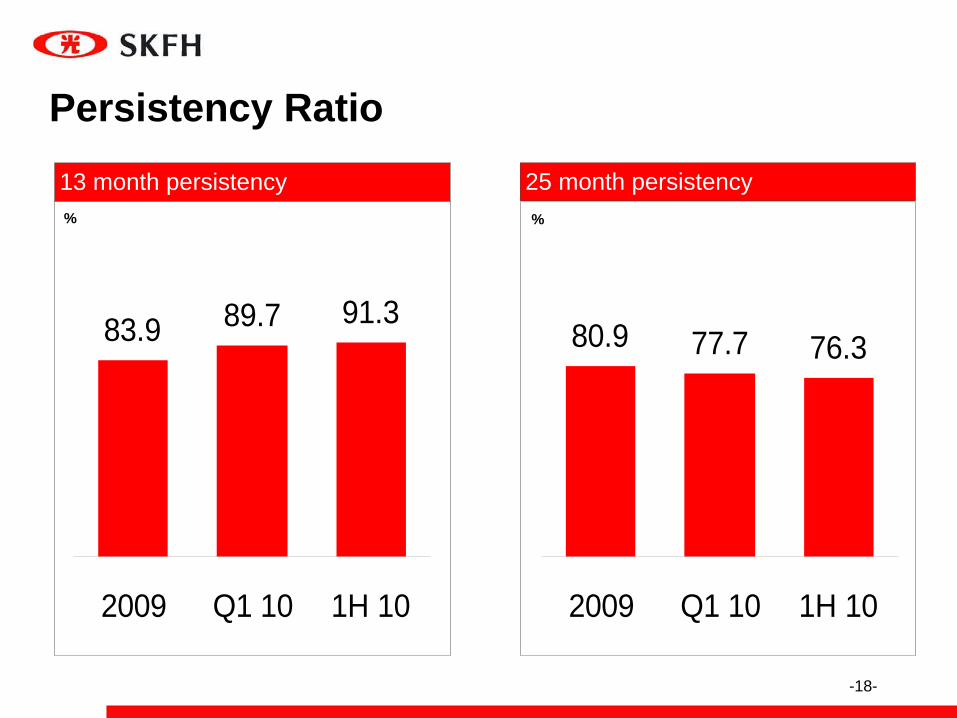
Persistency Ratio13 month persistency 25 month persistency
%%
83.9 89.7 91.3
0
20
4060
80
100
2009 Q1 10 1H 10
80.9 77.7 76.3
0
20
4060
80
100
2009 Q1 10 1H 10
-19-
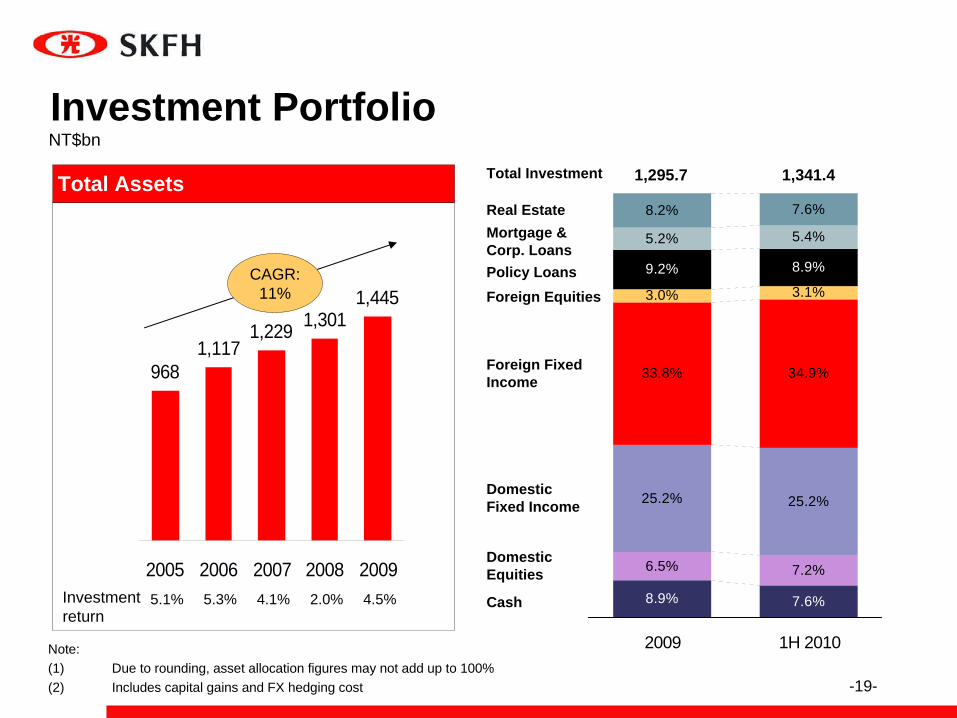
Total Assets
Investment PortfolioNT$bn
Total Investment
Foreign Fixed Income
Real Estate
Domestic Equities
Foreign Equities
Domestic Fixed Income
Policy Loans
Mortgage & Corp. Loans
Cash
Note:(1) Due to rounding, asset allocation figures may not add up to 100%(2) Includes capital gains and FX hedging cost
9681,117
1,229 1,3011,445
-55
445
945
1,445
2005 2006 2007 2008 2009Investmentreturn
5.1% 5.3% 4.1% 2.0% 4.5%
CAGR:11%
7.6%8.9%
7.2%6.5%
25.2%25.2%
34.9%33.8%
3.1%3.0%
8.9%9.2%
5.4%5.2%
7.6%8.2%
2009 1H 2010
1,295.7 1,341.4
-20-
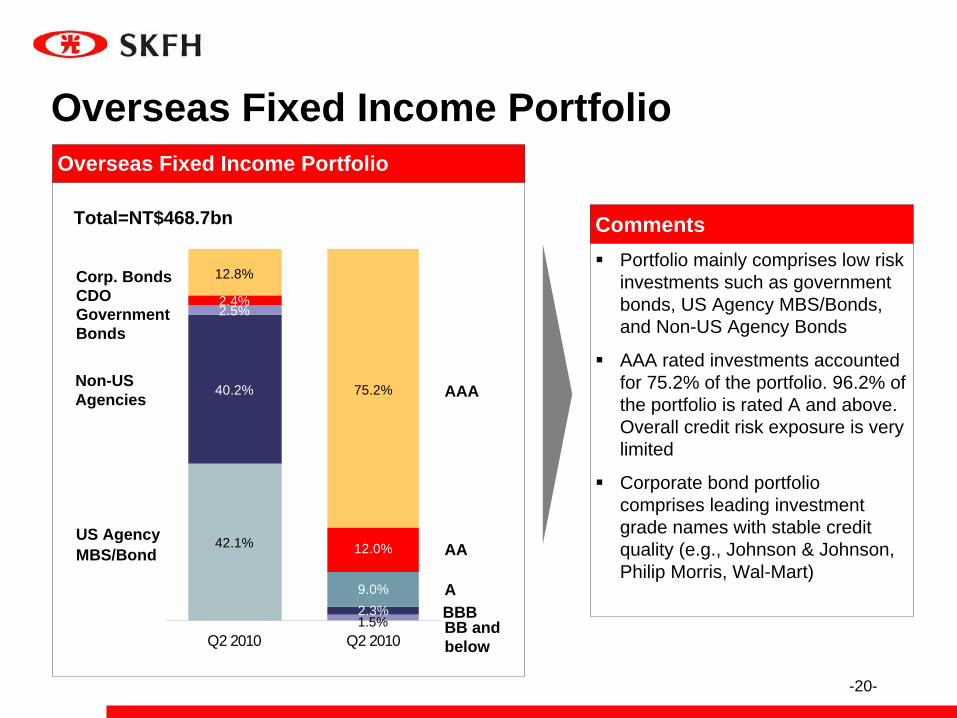
Overseas Fixed Income PortfolioOverseas Fixed Income Portfolio
CDO
US Agency MBS/Bond
Government Bonds
CommentsPortfolio mainly comprises low risk investments such as government bonds, US Agency MBS/Bonds, and Non-US Agency Bonds
AAA rated investments accounted for 75.2% of the portfolio. 96.2% of the portfolio is rated A and above. Overall credit risk exposure is very limited
Corporate bond portfolio comprises leading investment grade names with stable credit quality (e.g., Johnson & Johnson, Philip Morris, Wal-Mart)
AAA
AA
Total=NT$468.7bn
Non-US Agencies 40.2%
2.5%2.4%
12.8%
75.2%
42.1%
2.3%9.0%
12.0%
Q2 2010 Q2 2010BB and below
BBBA
1.5%
Corp. Bonds
-21-
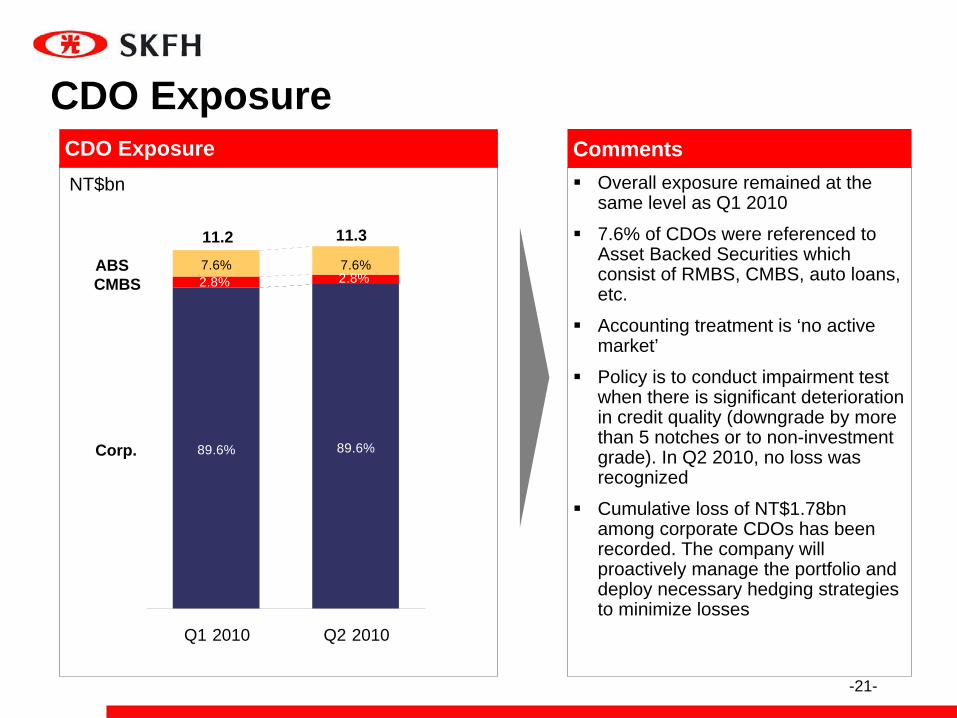
CDO ExposureCDO Exposure Comments
Overall exposure remained at the same level as Q1 2010
7.6% of CDOs were referenced to Asset Backed Securities which consist of RMBS, CMBS, auto loans, etc.
Accounting treatment is ‘no active market’
Policy is to conduct impairment test when there is significant deterioration in credit quality (downgrade by more than 5 notches or to non-investment grade). In Q2 2010, no loss was recognized
Cumulative loss of NT$1.78bn among corporate CDOs has been recorded. The company will proactively manage the portfolio and deploy necessary hedging strategies to minimize losses
NT$bn
ABS
Corp.
CMBS
11.2
89.6%
7.6%
89.6%
2.8% 2.8%7.6%
Q1 2010 Q2 2010
11.3
-22-
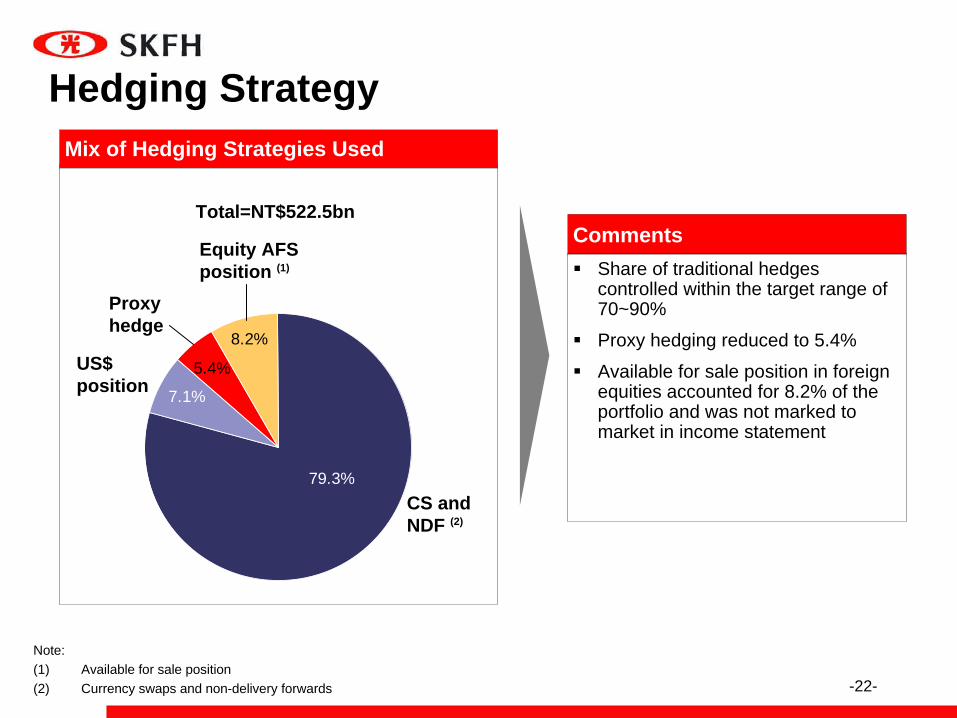
7.1%
5.4%
8.2%
79.3%
Mix of Hedging Strategies Used
CommentsShare of traditional hedges controlled within the target range of 70~90%
Proxy hedging reduced to 5.4%
Available for sale position in foreign equities accounted for 8.2% of the portfolio and was not marked to market in income statement
Hedging Strategy
Total=NT$522.5bn
Proxyhedge
Equity AFSposition (1)
CS and NDF (2)
US$position
Note:(1) Available for sale position(2) Currency swaps and non-delivery forwards
-23-
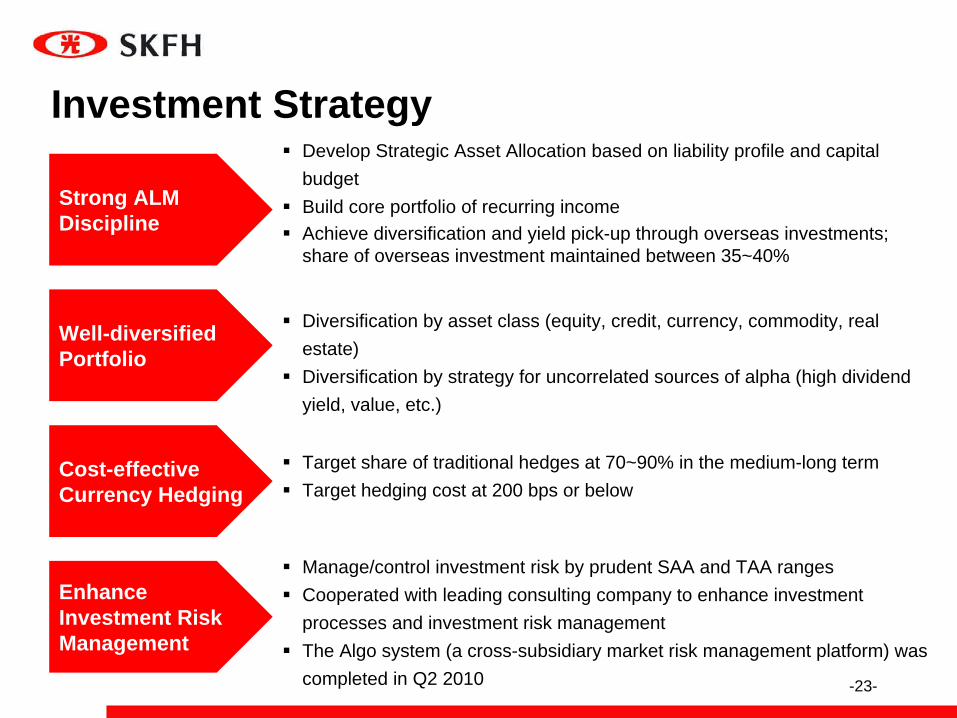
Investment StrategyDevelop Strategic Asset Allocation based on liability profile and capital budgetBuild core portfolio of recurring incomeAchieve diversification and yield pick-up through overseas investments;share of overseas investment maintained between 35~40%
Strong ALM Discipline
Well-diversified Portfolio
Cost-effectiveCurrency Hedging
EnhanceInvestment Risk Management
Diversification by asset class (equity, credit, currency, commodity, real estate)Diversification by strategy for uncorrelated sources of alpha (high dividend yield, value, etc.)
Manage/control investment risk by prudent SAA and TAA rangesCooperated with leading consulting company to enhance investmentprocesses and investment risk managementThe Algo system (a cross-subsidiary market risk management platform) was completed in Q2 2010
Target share of traditional hedges at 70~90% in the medium-long termTarget hedging cost at 200 bps or below

-24-
I. SKFH
II. Life Insurance Business
III. Banking Business
IV. Appendix• Market opportunities• SKL Premium• One-off losses of CDO & CBO investment• EV & AV Result• SKL China Development Strategy• Capital Enhancement• Other Information
Agenda
-24-
-25-
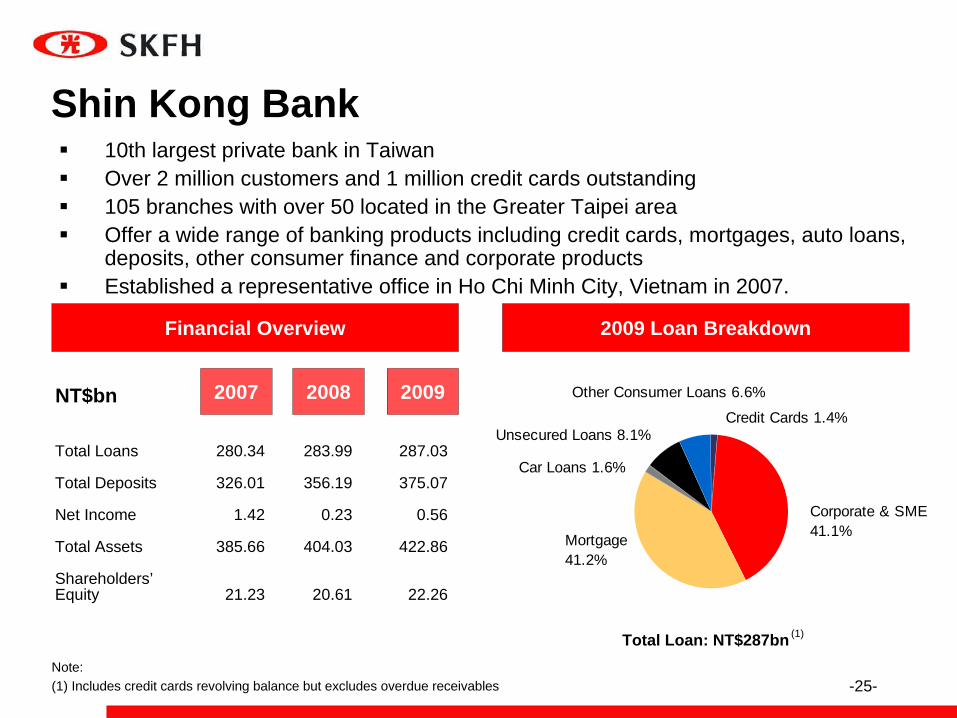
Shin Kong Bank10th largest private bank in TaiwanOver 2 million customers and 1 million credit cards outstanding105 branches with over 50 located in the Greater Taipei areaOffer a wide range of banking products including credit cards, mortgages, auto loans, deposits, other consumer finance and corporate productsEstablished a representative office in Ho Chi Minh City, Vietnam in 2007.
2009 Loan BreakdownFinancial Overview
NT$bn 200920082007Credit Cards 1.4%
Corporate & SME41.1%Mortgage
41.2%
Unsecured Loans 8.1%
Car Loans 1.6%
Other Consumer Loans 6.6%
Total Loan: NT$287bn
Total Loans 280.34 283.99 287.03
Total Deposits 326.01 356.19 375.07
Net Income 1.42 0.23 0.56
Total Assets 385.66 404.03 422.86
Shareholders’ Equity 21.23 20.61 22.26
Note:(1) Includes credit cards revolving balance but excludes overdue receivables
(1)
-26-
After-tax profit for 1H 2010 was NT$916 million (up 297.3% year-on-year); pre-provision profit increased 69.4% year-on-year to NT$1,918 million while operating expense remained at the same level compared to 1H 2009.Loan balance increased 5.0% year-on-year. L/D ratio was 81.4% (incl. credit cards balance). To strike a better balance between risk and return, risk management has been strengthened.NIM improved from 1.60% in Q1 2010 to 1.64% in Q2 2010. Fee income from wealth management has recovered since Q2 2009 due to recovery in global markets. Fee income from wealth management for 1H 2010 was NT$377 million (up 31.7% year-on-year). SKB achieved bancassurance cross-sales of NT$10.7 billion in 1H 2010, accounting for 45.2% of SKL bancassurance premium.Credit card NPL ratio decreased to 0.62% and coverage ratio increased to 410.27%.11,773 cases (amounting to NT$946 million) were filed since implementation of the Consumer Debt Clearance Regulations till the end of 1H 2010; overall situation expected to be manageable. Monthly repayment rate of restructured loans remained stable; cumulative repayment rate was 52.06%. Asset quality improved with overall NPL and coverage at 0.85% and 116.62% respectively. NPL ratio for mortgages remained low at 0.48%.
SKB – 1H 2010 Overview
-27-
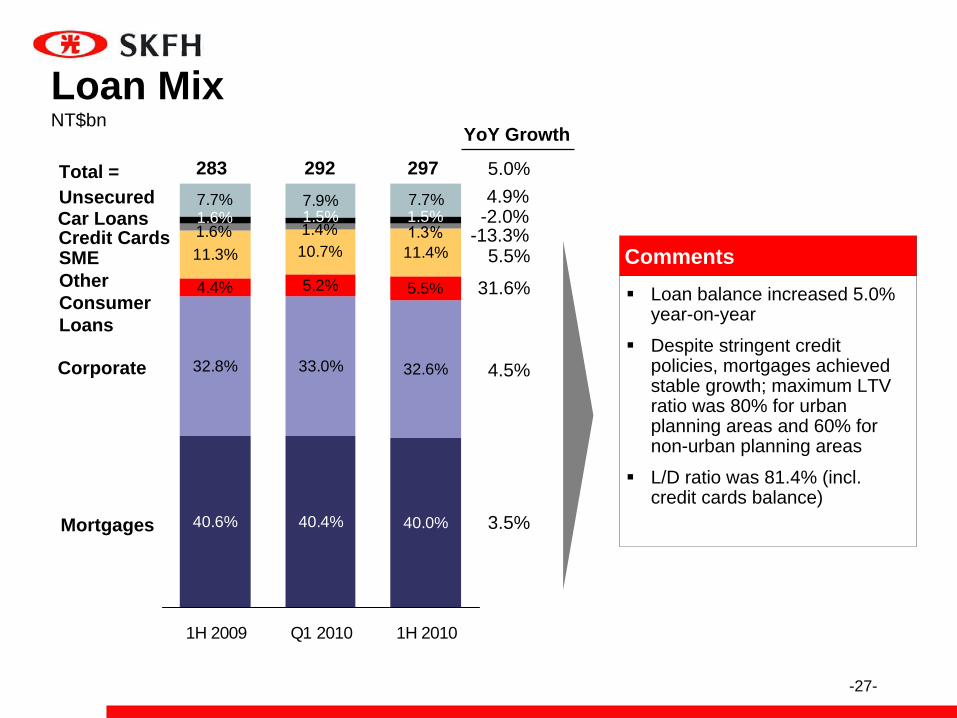
40.0%40.4%40.6%
32.6%33.0%32.8%
5.5%5.2%4.4%
11.4%10.7%11.3%1.3%1.6% 1.4%1.5%1.5%1.6%
7.9%7.7% 7.7%
1H 2009 Q1 2010 1H 2010
Comments
Car LoansCredit Cards
Mortgages
SME
YoY Growth
Loan Mix
Corporate
Other Consumer Loans
Total =
NT$bn
Loan balance increased 5.0% year-on-year
Despite stringent credit policies, mortgages achieved stable growth; maximum LTV ratio was 80% for urban planning areas and 60% for non-urban planning areas
L/D ratio was 81.4% (incl. credit cards balance)
Unsecured283 292 297
4.5%
5.5%
3.5%
31.6%
5.0%
-2.0%4.9%
-13.3%
-28-
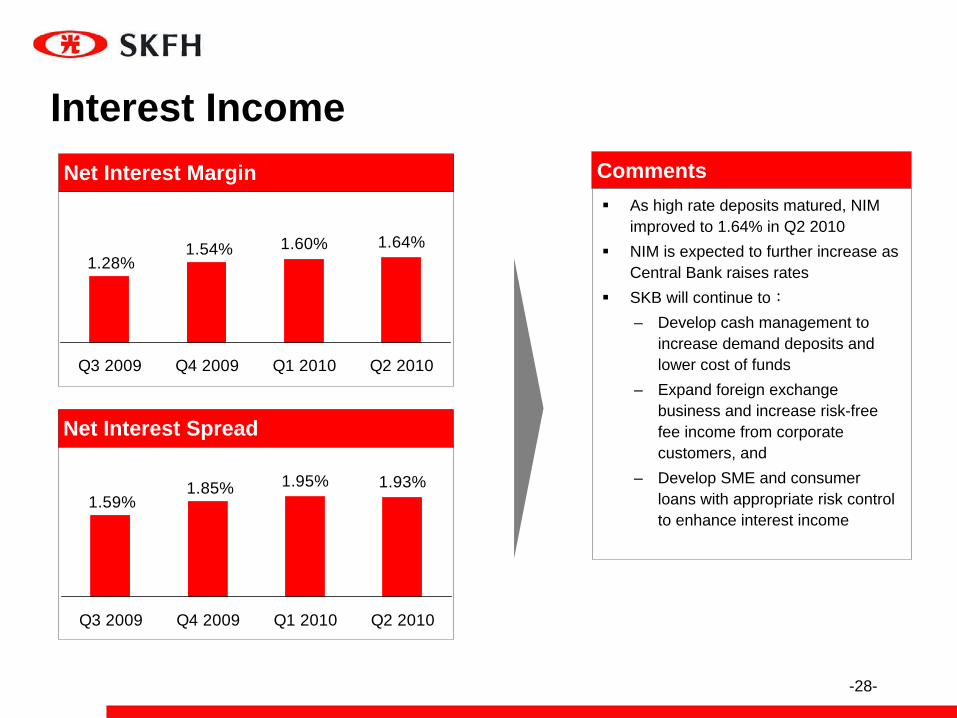
Interest IncomeComments
Net Interest Spread
Net Interest MarginAs high rate deposits matured, NIM improved to 1.64% in Q2 2010NIM is expected to further increase as Central Bank raises ratesSKB will continue to:– Develop cash management to
increase demand deposits and lower cost of funds
– Expand foreign exchange business and increase risk-free fee income from corporate customers, and
– Develop SME and consumer loans with appropriate risk control to enhance interest income
1.60% 1.64%1.54%1.28%
Q3 2009 Q4 2009 Q1 2010 Q2 2010
1.95% 1.93%1.85%1.59%
Q3 2009 Q4 2009 Q1 2010 Q2 2010
-29-
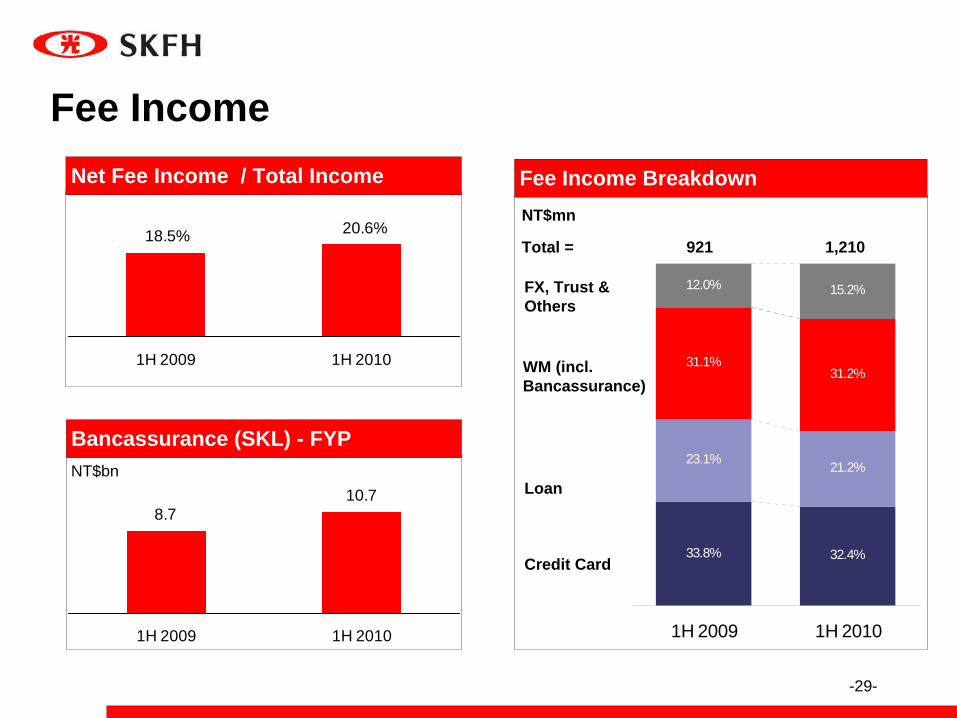
33.8% 32.4%
23.1% 21.2%
31.2%31.1%
15.2%12.0%
1H 2009 1H 2010
Fee IncomeNet Fee Income / Total Income
Bancassurance (SKL) - FYPNT$bn
2.1 1.6Fee Income Breakdown
WM (incl.Bancassurance)
Total =
Loan
Credit Card
NT$mn
FX, Trust & Others
921 1,21020.6%18.5%
1H 2009 1H 2010
10.78.7
1H 2009 1H 2010
-30-
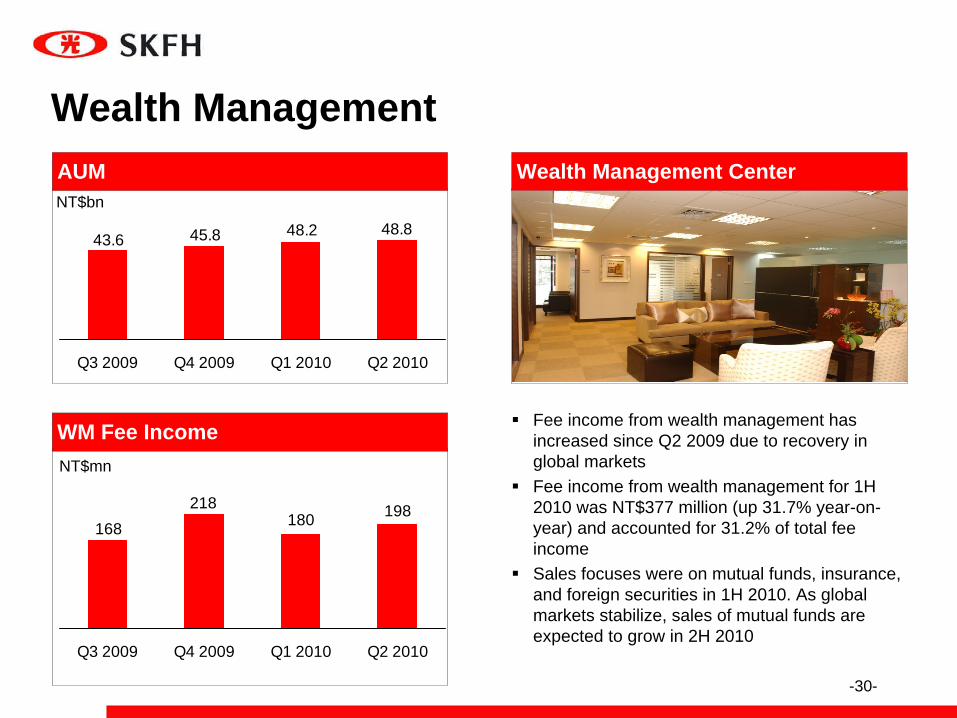
218168 180 198
Q3 2009 Q4 2009 Q1 2010 Q2 2010
Wealth ManagementWealth Management CenterAUM
WM Fee Income
NT$bn
NT$mn
Fee income from wealth management has increased since Q2 2009 due to recovery in global marketsFee income from wealth management for 1H 2010 was NT$377 million (up 31.7% year-on-year) and accounted for 31.2% of total fee income Sales focuses were on mutual funds, insurance, and foreign securities in 1H 2010. As global markets stabilize, sales of mutual funds are expected to grow in 2H 2010
48.848.243.6 45.8
Q3 2009 Q4 2009 Q1 2010 Q2 2010
-31-
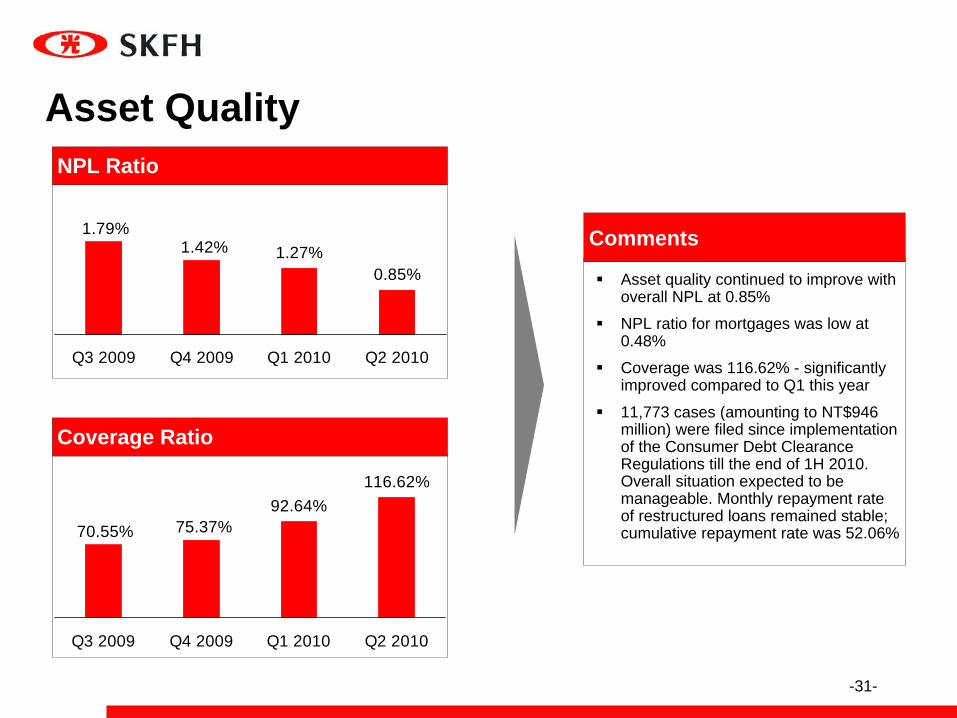
Asset quality continued to improve with overall NPL at 0.85%
NPL ratio for mortgages was low at 0.48%
Coverage was 116.62% - significantly improved compared to Q1 this year
11,773 cases (amounting to NT$946 million) were filed since implementation of the Consumer Debt Clearance Regulations till the end of 1H 2010. Overall situation expected to be manageable. Monthly repayment rate of restructured loans remained stable;cumulative repayment rate was 52.06%
Asset Quality NPL Ratio
Coverage Ratio
Comments1.27%
0.85%
1.42%1.79%
Q3 2009 Q4 2009 Q1 2010 Q2 2010
92.64%116.62%
75.37%70.55%
Q3 2009 Q4 2009 Q1 2010 Q2 2010
-32-
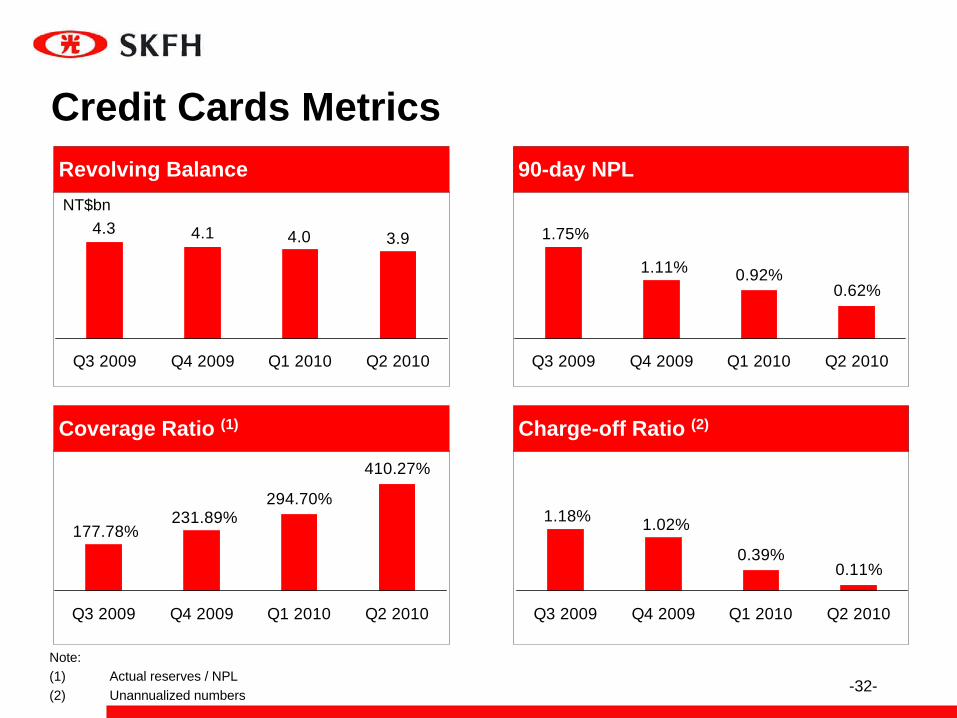
Credit Cards Metrics90-day NPL
Charge-off Ratio (2)Coverage Ratio (1)
Note:(1) Actual reserves / NPL(2) Unannualized numbers
Revolving BalanceNT$bn
3.94.04.14.3
Q3 2009 Q4 2009 Q1 2010 Q2 2010
0.92%0.62%
1.11%
1.75%
Q3 2009 Q4 2009 Q1 2010 Q2 2010
294.70%
410.27%
231.89%177.78%
Q3 2009 Q4 2009 Q1 2010 Q2 2010
0.39%0.11%
1.02%1.18%
Q3 2009 Q4 2009 Q1 2010 Q2 2010

-33-
I. SKFH
II. Life Insurance Business
III. Banking Business
IV. Appendix• Market opportunities• SKL Premium• One-off losses of CDO & CBO investment• EV & AV Result• SKL China Development Strategy• Capital Enhancement• Other Information
Agenda
-33-
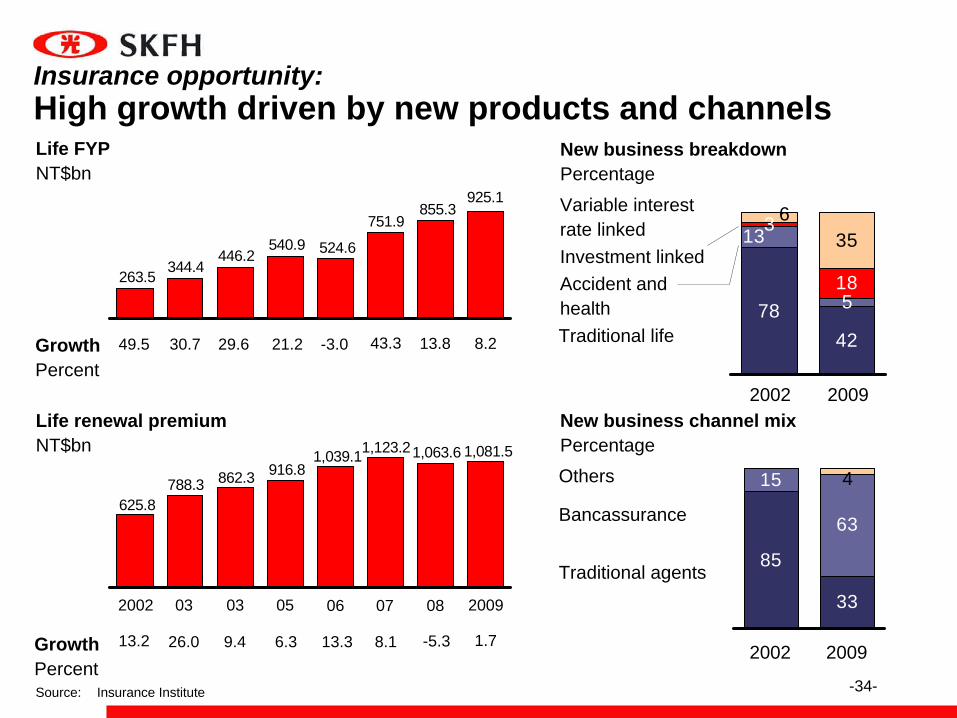
-34-Source: Insurance Institute
Life FYPNT$bn
925.1751.9
524.6540.9446.2
344.4263.5
855.3
GrowthPercent
Life renewal premiumNT$bn
625.8788.3 862.3 916.8
1,039.11,123.21,063.6 1,081.5
052002 03 03 06 2009
GrowthPercent
49.5 30.7 29.6 21.2
13.2 26.0 9.4 6.3
New business breakdownPercentage
New business channel mixPercentage
5
3
4278
13
18
635
2002 2009
Variable interest rate linkedInvestment linkedAccident and healthTraditional life
2002 2009
Bancassurance
Traditional agents
-3.0
13.3
Insurance opportunity: High growth driven by new products and channels
8.1
07
43.3 13.8
08
-5.3
8.2
1.7
Others 15
63
85
33
4
-35-
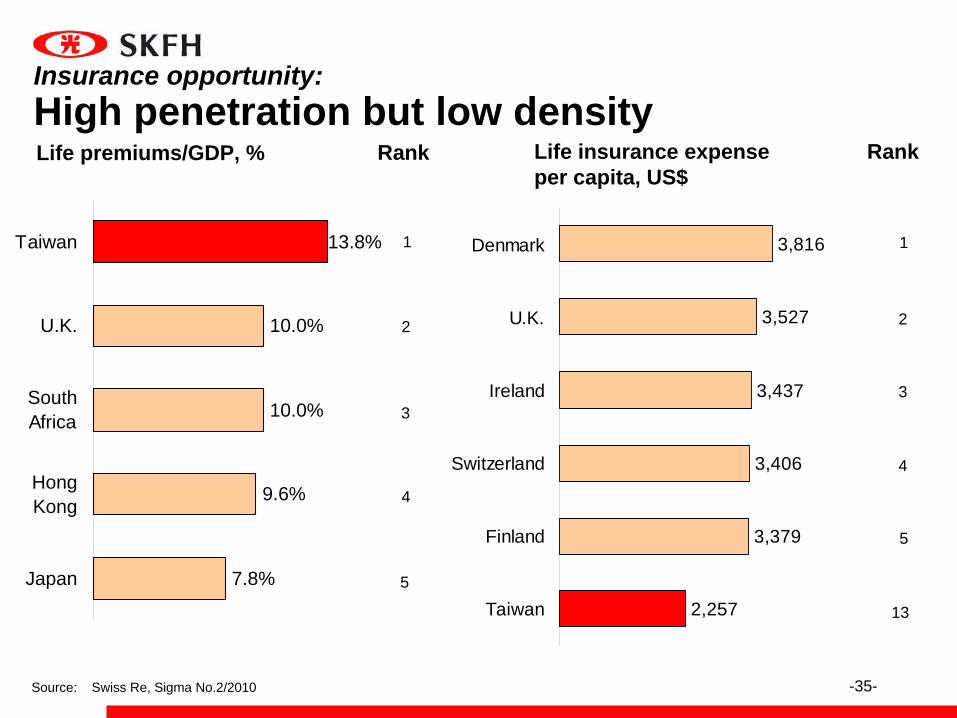
2,257
3,379
3,406
3,437
3,527
3,816Denmark
U.K.
Ireland
Switzerland
Finland
Taiwan
13.8%
10.0%
10.0%
9.6%
7.8%
Taiwan
U.K.
SouthAfrica
HongKong
Japan
Source: Swiss Re, Sigma No.2/2010
Life insurance expense per capita, US$
Rank
1
5
2
3
4
Rank
1
5
2
3
4
13
Life premiums/GDP, %
Insurance opportunity: High penetration but low density
-36-
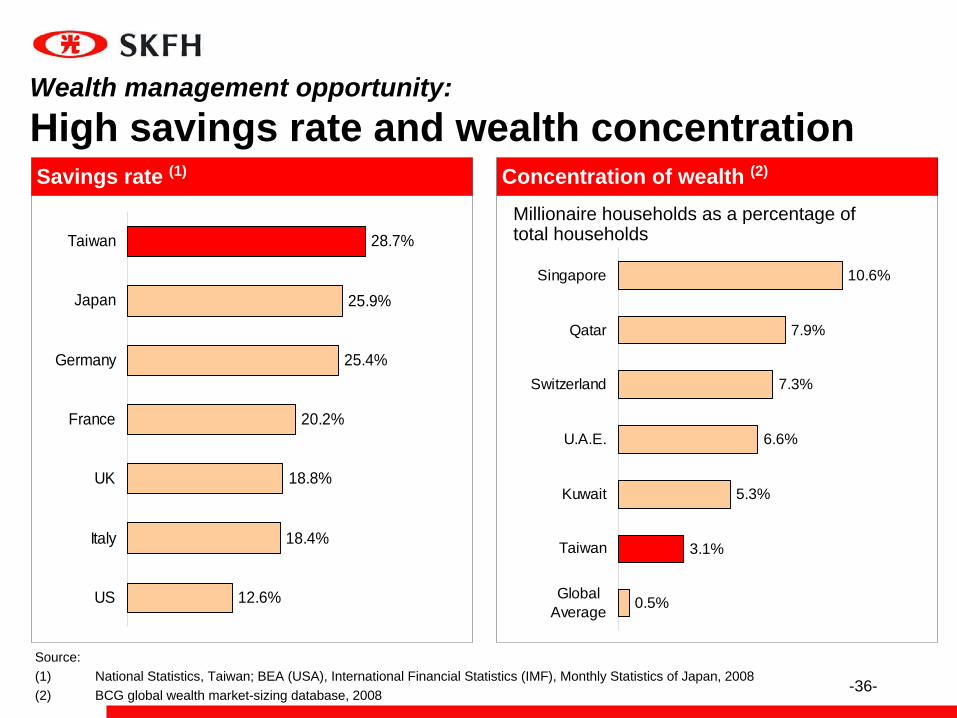
Wealth management opportunity: High savings rate and wealth concentrationSavings rate (1) Concentration of wealth (2)
Source:(1) National Statistics, Taiwan; BEA (USA), International Financial Statistics (IMF), Monthly Statistics of Japan, 2008(2) BCG global wealth market-sizing database, 2008
Millionaire households as a percentage of total households28.7%
25.9%
25.4%
20.2%
18.8%
18.4%
12.6%US
Italy
UK
France
Germany
Japan
Taiwan
0.5%
3.1%
5.3%
6.6%
7.3%
7.9%
10.6%
GlobalAverage
Taiwan
Kuwait
U.A.E.
Switzerland
Qatar
Singapore
-37-
0
5,000
10,000
15,000
20,000
25,000
30,000
35,000
40,000
45,000
1997 1998 1999 2000 2001 2002 2003 2004 2005 2006
NT$ bn
20,92522,601
25,23224,068 24,931
26,840
55%
9%3%23%3%7%
56%
10%3%22%3%6%
55%
10%3%
22%4%6%
54%
12%3%21%
5%5%
55% 55%
1%14%
7%5%
16%1%
8%
20%
0%
38,239
6%
29%
1%
16%
47%
0%
33,655
8%
25%
1%
16%
49%
0%
5%
25%
2%
18%
50%
0%38,277
NT$ bn
18%
42,496
5%
23%
2%
18%
52%
0%
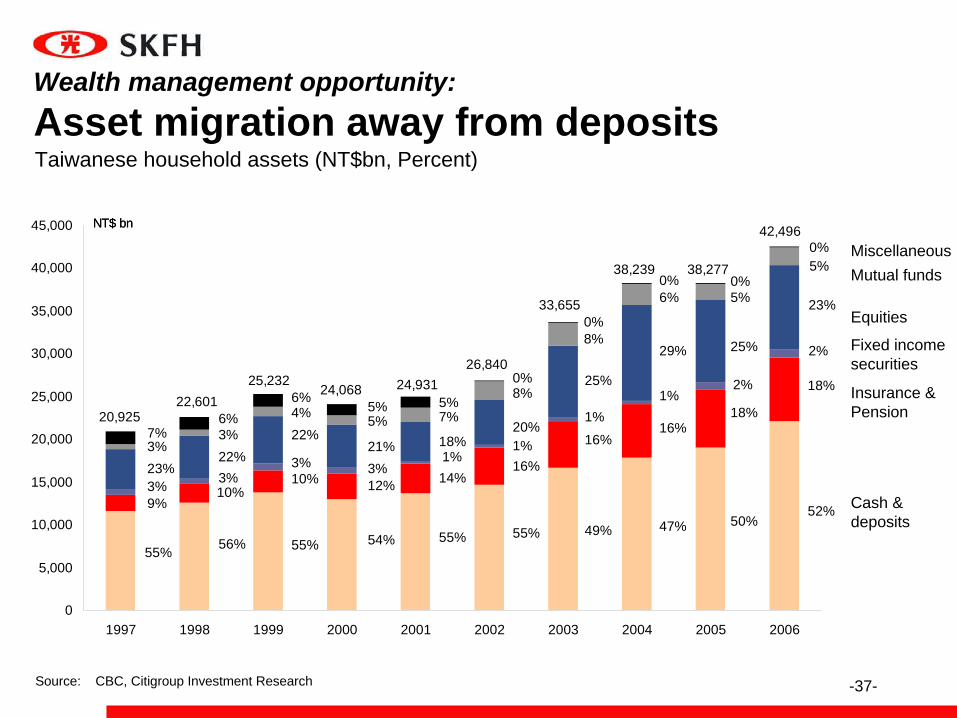
Taiwanese household assets (NT$bn, Percent)
Cash & deposits
Insurance &Pension
Fixed incomesecurities
Equities
Mutual funds Miscellaneous
Source: CBC, Citigroup Investment Research
Wealth management opportunity: Asset migration away from deposits
-38-
I. SKFH
II. Life Insurance Business
III. Banking Business
IV. Appendix• Market opportunities• SKL Premium• One-off losses of CDO & CBO investment• EV & AV Result• SKL China Development Strategy• Capital Enhancement• Other Information
Agenda
-38-
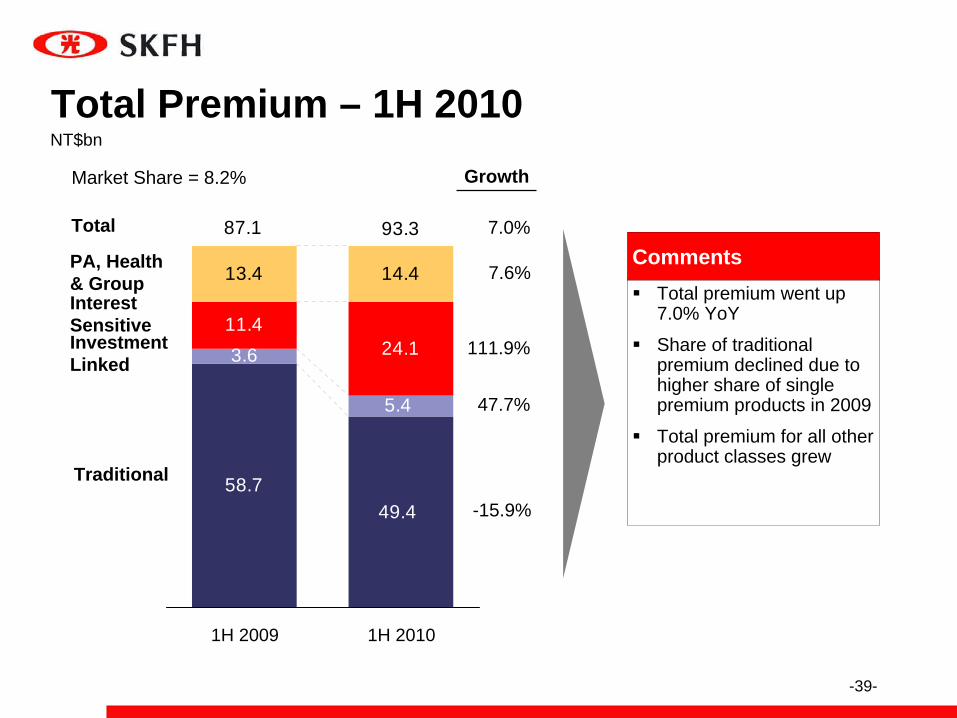
-39-
Growth
Total
Market Share = 8.2%
Total premium went up 7.0% YoY
Share of traditional premium declined due to higher share of single premium products in 2009
Total premium for all other product classes grew
Total Premium – 1H 2010NT$bn
PA, Health & GroupInterest SensitiveInvestment Linked
Traditional
Comments
5.4
24.1
49.458.7
3.611.4
14.413.4
93.387.1
1H 2009 1H 2010
7.6%
111.9%
47.7%
-15.9%
7.0%
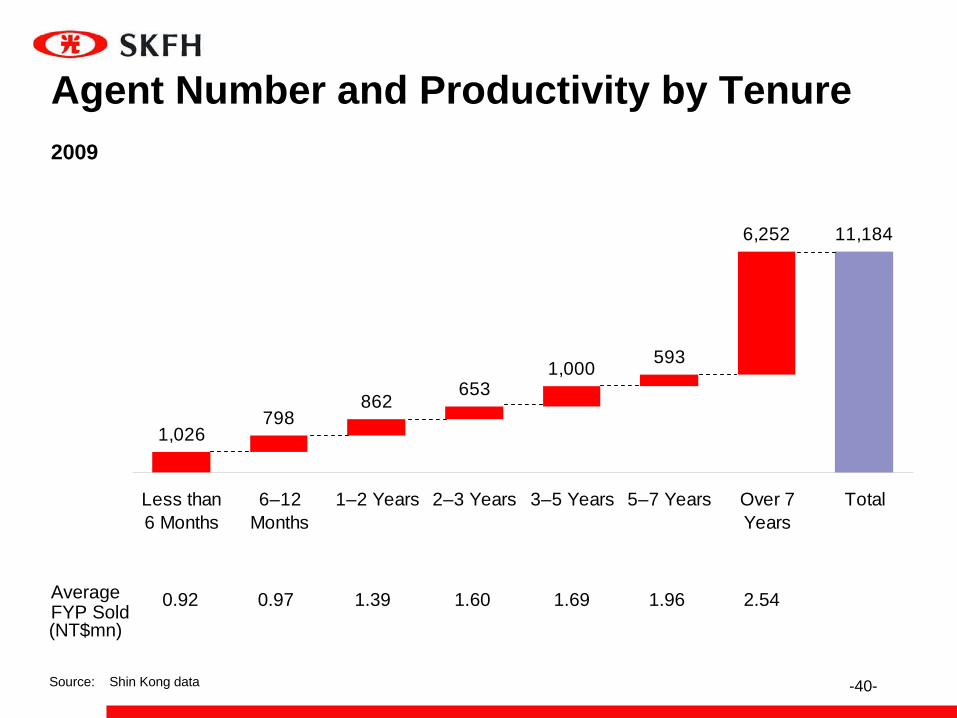
-40-
(NT$mn)
1,026798
862653
1,000 593
6,252 11,184
Less than6 Months
6–12Months
1–2 Years 2–3 Years 3–5 Years 5–7 Years Over 7Years
Total
0.92 0.97 1.39 1.60 1.69 1.96 2.54
Source: Shin Kong data
Average FYP Sold
Agent Number and Productivity by Tenure 2009
-41-
I. SKFH
II. Life Insurance Business
III. Banking Business
IV. Appendix• Market opportunities• SKL Premium• One-off losses of CDO & CBO investment• EV & AV Result• SKL China Development Strategy• Capital Enhancement• Other Information
Agenda
-41-
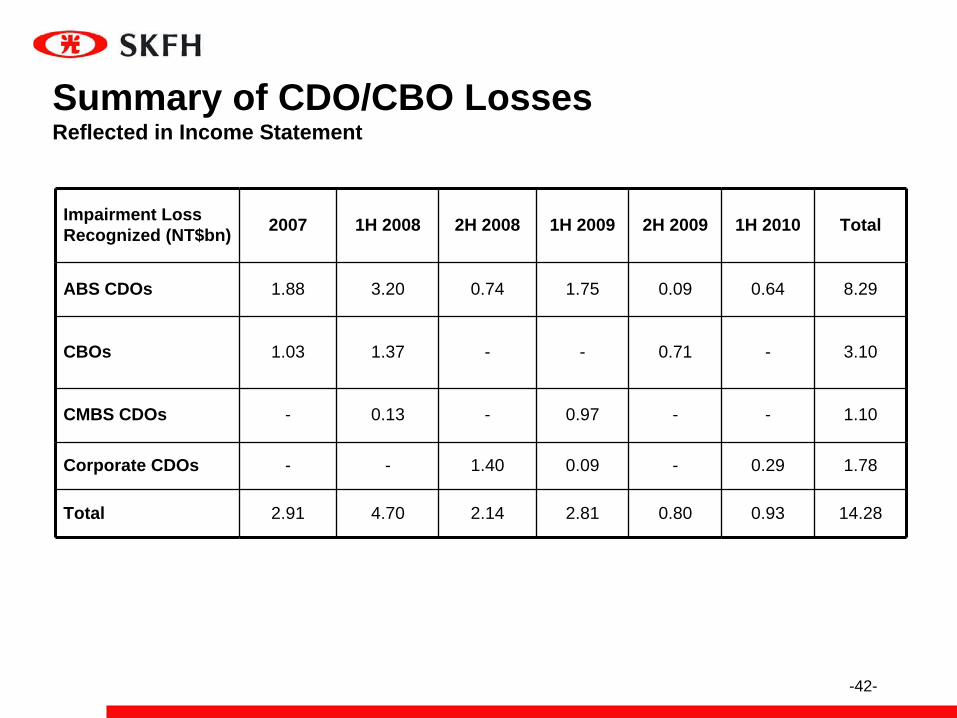
-42-
Summary of CDO/CBO Losses Reflected in Income Statement
Impairment LossRecognized (NT$bn) 2007 1H 2008 2H 2008 1H 2009 2H 2009 1H 2010 Total
ABS CDOs 1.88 3.20 0.74 1.75 0.09 0.64 8.29
CBOs 1.03 1.37 - - 0.71 - 3.10
CMBS CDOs - 0.13 - 0.97 - - 1.10
Corporate CDOs - - 1.40 0.09 - 0.29 1.78
Total 2.91 4.70 2.14 2.81 0.80 0.93 14.28
-43-
I. SKFH
II. Life Insurance Business
III. Banking Business
IV. Appendix• Market opportunities• SKL Premium• One-off losses of CDO & CBO investment• EV & AV Result• SKL China Development Strategy• Capital Enhancement• Other Information
Agenda
-43-
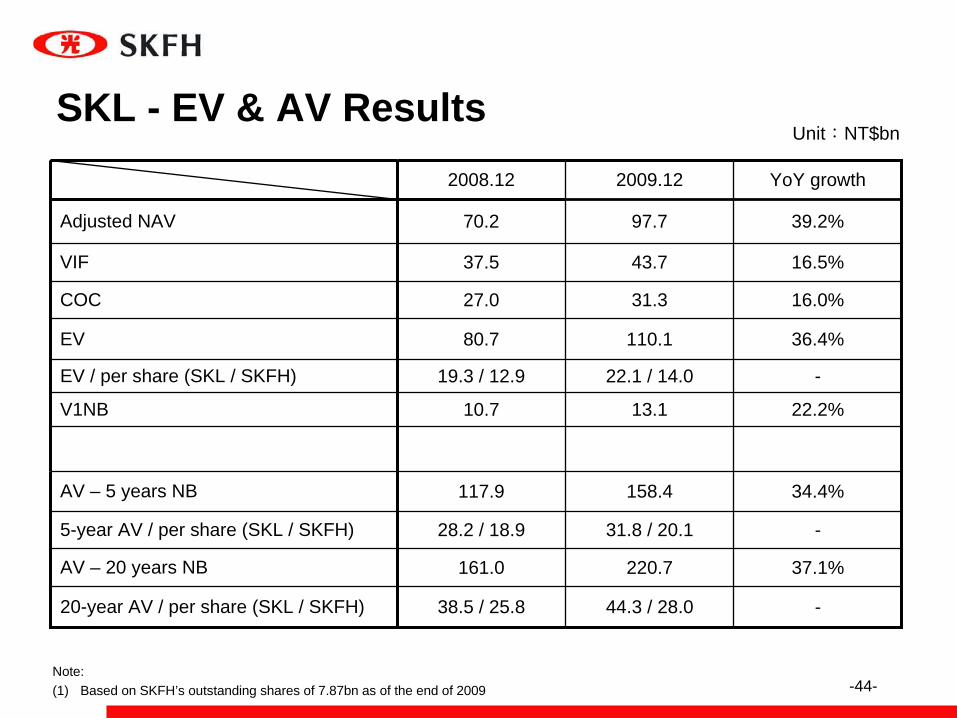
-44-
2008.12 2009.12 YoY growth
Adjusted NAV 70.2 97.7 39.2%
VIF 37.5 43.7 16.5%
COC 27.0 31.3 16.0%
EV 80.7 110.1 36.4%
EV / per share (SKL / SKFH) 19.3 / 12.9 22.1 / 14.0 -
V1NB 10.7 13.1 22.2%
AV – 5 years NB 117.9 158.4 34.4%
5-year AV / per share (SKL / SKFH) 28.2 / 18.9 31.8 / 20.1 -
AV – 20 years NB 161.0 220.7 37.1%
20-year AV / per share (SKL / SKFH) 38.5 / 25.8 44.3 / 28.0 -
Unit:NT$bnSKL - EV & AV Results
Note:(1) Based on SKFH’s outstanding shares of 7.87bn as of the end of 2009
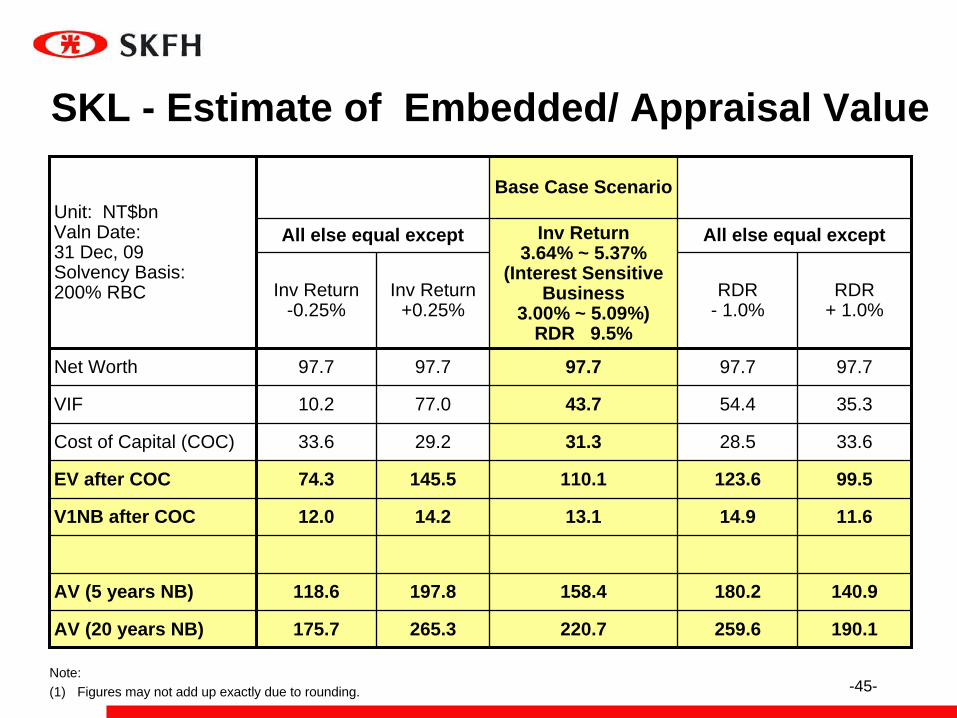
-45-Note:(1) Figures may not add up exactly due to rounding.
SKL - Estimate of Embedded/ Appraisal Value
Unit: NT$bnValn Date: 31 Dec, 09Solvency Basis: 200% RBC
Base Case Scenario
All else equal except Inv Return3.64% ~ 5.37%
(Interest Sensitive Business
3.00% ~ 5.09%)RDR 9.5%
All else equal except
Inv Return-0.25%
Inv Return+0.25%
RDR - 1.0%
RDR+ 1.0%
Net Worth 97.7 97.7 97.7 97.7 97.7
VIF 10.2 77.0 43.7 54.4 35.3
Cost of Capital (COC) 33.6 29.2 31.3 28.5 33.6
EV after COC 74.3 145.5 110.1 123.6 99.5
V1NB after COC 12.0 14.2 13.1 14.9 11.6
AV (5 years NB) 118.6 197.8 158.4 180.2 140.9
AV (20 years NB) 175.7 265.3 220.7 259.6 190.1
-46-
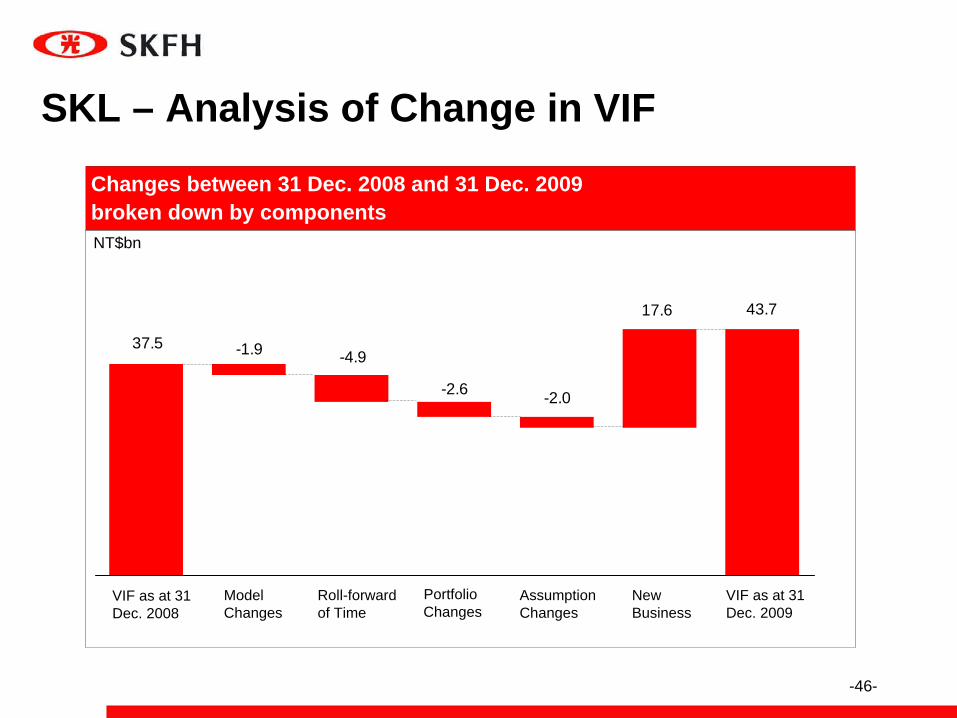
Changes between 31 Dec. 2008 and 31 Dec. 2009broken down by components NT$bn
Roll-forward of Time
Portfolio Changes
Assumption Changes
New Business
VIF as at 31 Dec. 2009
Model Changes
VIF as at 31 Dec. 2008
43.717.6
-2.0-2.6
-4.9-1.937.5
SKL – Analysis of Change in VIF
-47-
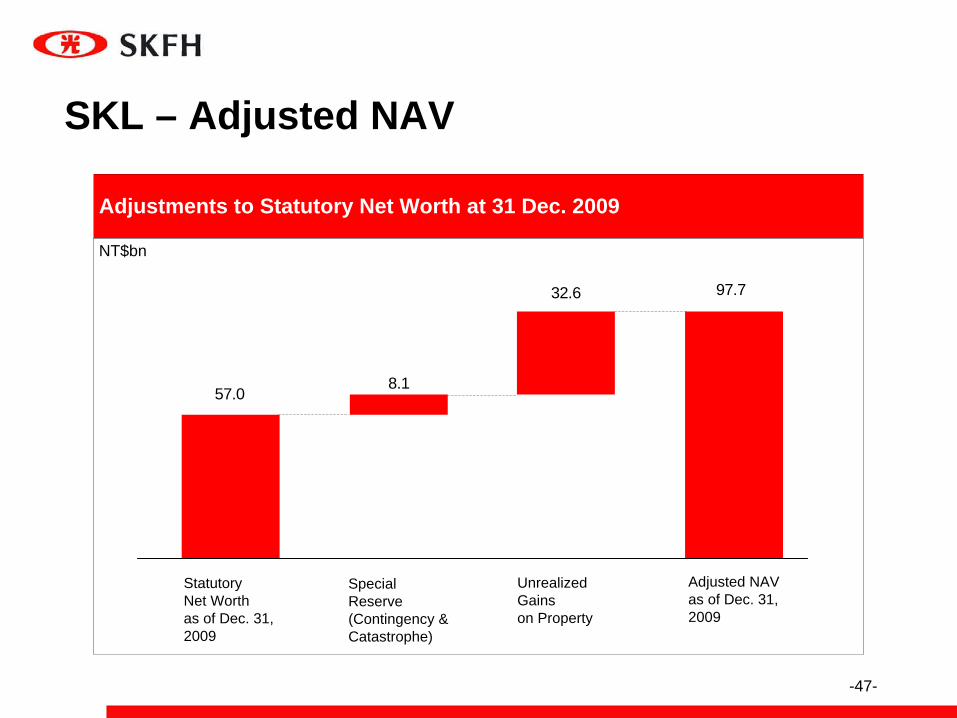
Adjustments to Statutory Net Worth at 31 Dec. 2009
NT$bn
Special Reserve (Contingency & Catastrophe)
Unrealized Gainson Property
Adjusted NAVas of Dec. 31, 2009
StatutoryNet Worthas of Dec. 31, 2009
57.08.1
32.6 97.7
SKL – Adjusted NAV
-48-
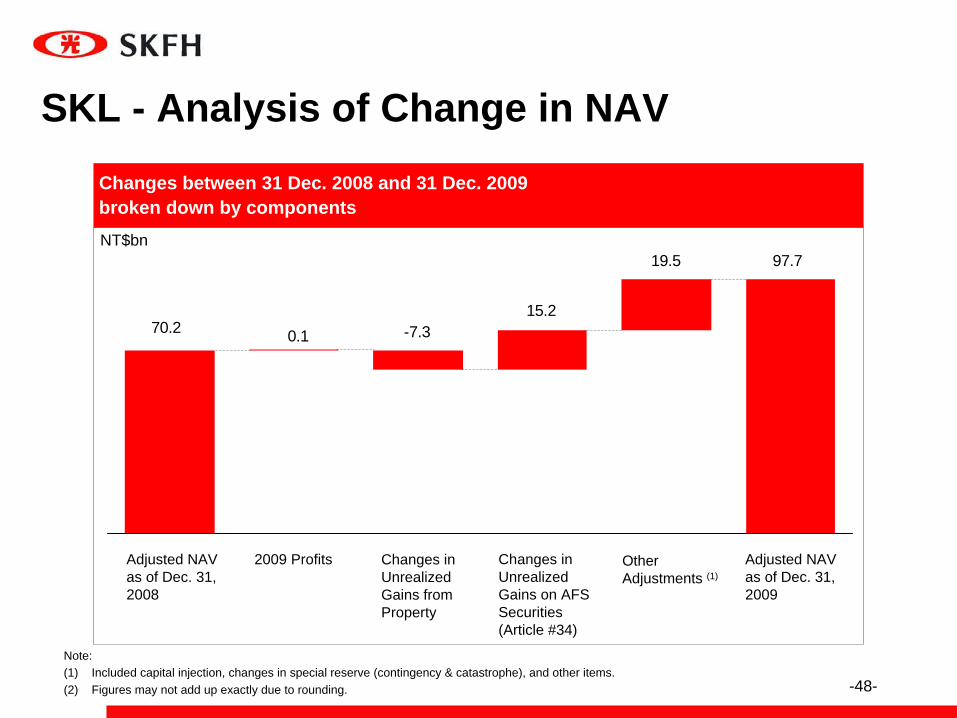
Changes between 31 Dec. 2008 and 31 Dec. 2009broken down by componentsNT$bn
Changes in Unrealized Gains on AFSSecurities(Article #34)
Changes in Unrealized Gains fromProperty
Adjusted NAV as of Dec. 31, 2009
Adjusted NAV as of Dec. 31,2008
2009 Profits OtherAdjustments (1)
Note:(1) Included capital injection, changes in special reserve (contingency & catastrophe), and other items.(2) Figures may not add up exactly due to rounding.
97.719.5
15.2-7.30.170.2
SKL - Analysis of Change in NAV

-49-
I. SKFH
II. Life Insurance Business
III. Banking Business
IV. Appendix• Market opportunities• SKL Premium• One-off losses of CDO & CBO investment• EV & AV Result• SKL China Development Strategy• Capital Enhancement• Other Information
Agenda
-49-
-50-
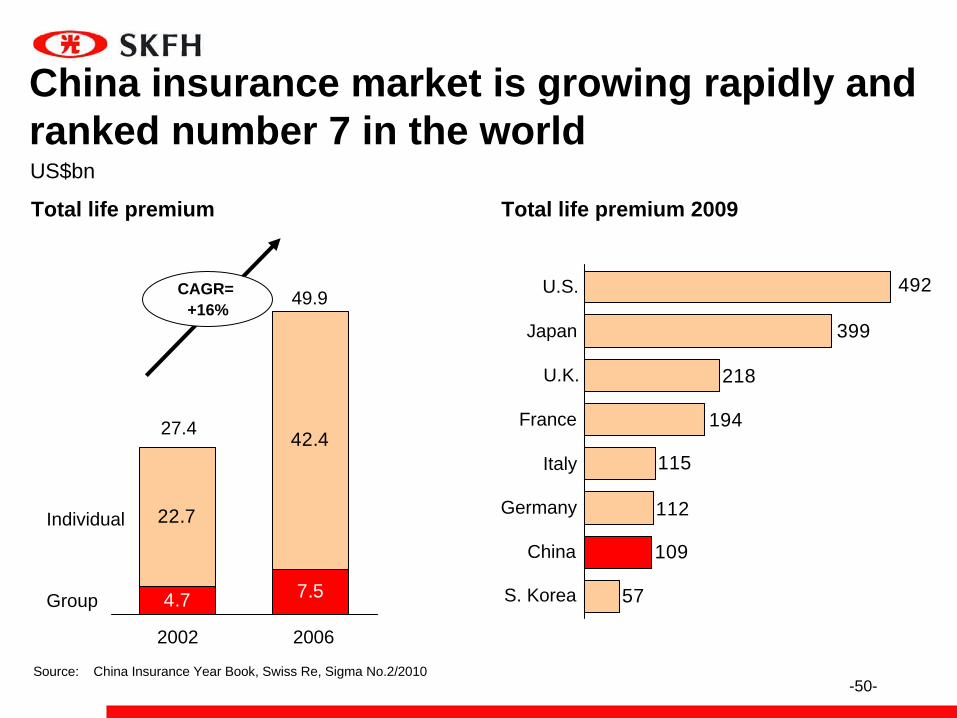
Total life premium
China insurance market is growing rapidly and ranked number 7 in the world
Total life premium 2009
US$bn
22.7
42.4
4.7 7.5
2002
49.9
2006
Individual
Group
CAGR= +16%
57
109
112
115
194
218
399
492U.S.
Japan
U.K.
France
Italy
Germany
China
S. Korea
27.4
Source: China Insurance Year Book, Swiss Re, Sigma No.2/2010
-51-
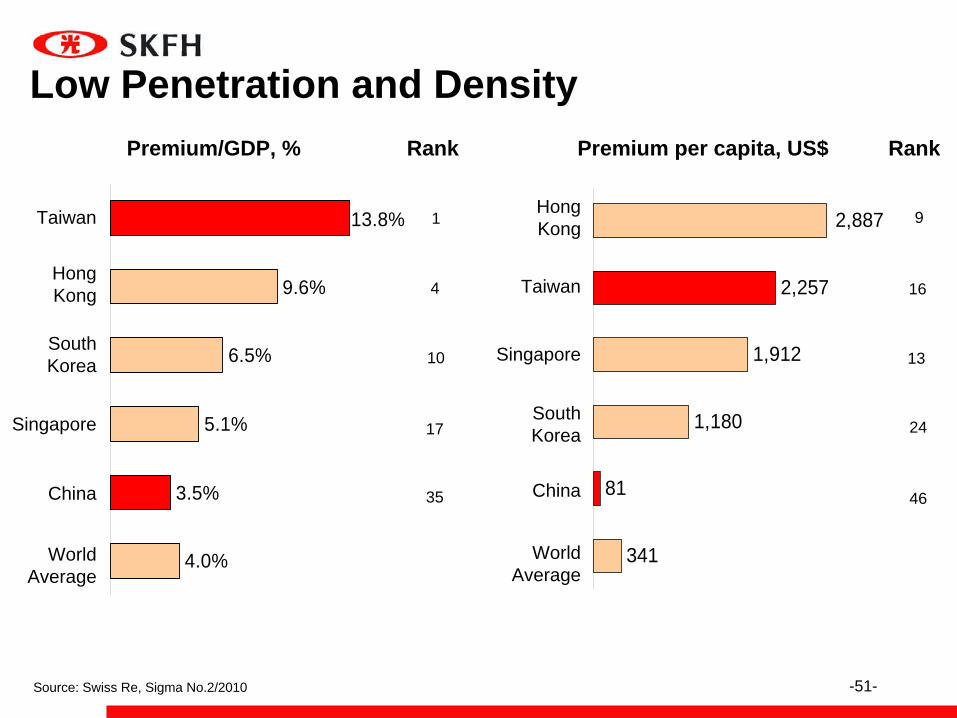
341
81
1,180
1,912
2,257
2,88713.8%
9.6%
6.5%
5.1%
3.5%
4.0%
Premium per capita, US$Rank
1
35
4
10
17
Rank
9
46
16
13
24
Premium/GDP, %
Low Penetration and Density
Source: Swiss Re, Sigma No.2/2010
Taiwan
HongKong
South Korea
Singapore
China
WorldAverage
HongKong
Taiwan
Singapore
South Korea
China
WorldAverage
-52-
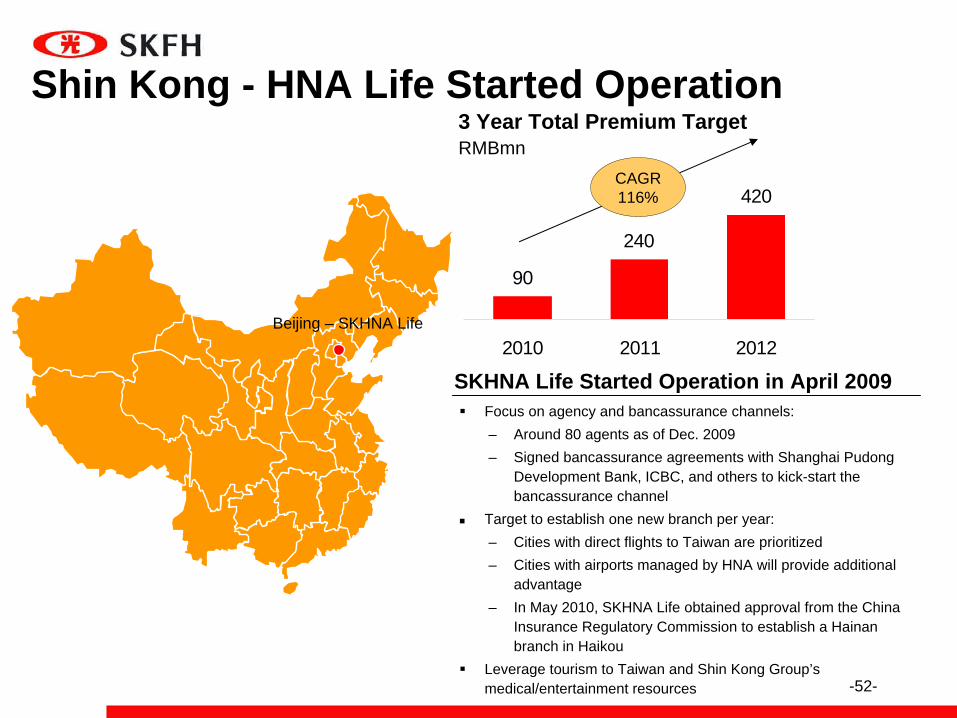
Focus on agency and bancassurance channels:– Around 80 agents as of Dec. 2009 – Signed bancassurance agreements with Shanghai Pudong
Development Bank, ICBC, and others to kick-start the bancassurance channel
Target to establish one new branch per year:– Cities with direct flights to Taiwan are prioritized– Cities with airports managed by HNA will provide additional
advantage– In May 2010, SKHNA Life obtained approval from the China
Insurance Regulatory Commission to establish a Hainan branch in Haikou
Leverage tourism to Taiwan and Shin Kong Group’s medical/entertainment resources
90
240
420
0
200
400
2010 2011 2012
SKHNA Life Started Operation in April 2009
3 Year Total Premium Target
Beijing – SKHNA Life
Shin Kong - HNA Life Started Operation
CAGR116%
RMBmn
-53-
Joint Venture Partner – HNA Group
Hainan Airlines Group (HNA Group) is one of China's top-four aviation consortiums. In addition to its core Hainan airlines business, the group is involved in China Xinhua Airlines, Changan Airlines, and Shanxi AirlinesTotal assets of about RMB 60 billion yuan (approx. NT$250 billion)Hainan Airlines’ B shares were listed in the Shanghai Stock Exchange in 1997, while its A shares were listed in 1999Total employees of 30,000 in HNA GroupGroup headquarters is in Haikou and Beijing will be the future operation centerHNA Group brings together air transport, airport management, hotel, travel, retail and other related businesses, with operations in Hainan, Beijing, Shanghai, Guangzhou, Xian, and Tianjin

-54-
I. SKFH
II. Life Insurance Business
III. Banking Business
IV. Appendix• Market opportunities• SKL Premium• One-off losses of CDO & CBO investment• EV & AV Result• SKL China Development Strategy• Capital Enhancement• Other Information
Agenda
-54-
-55-
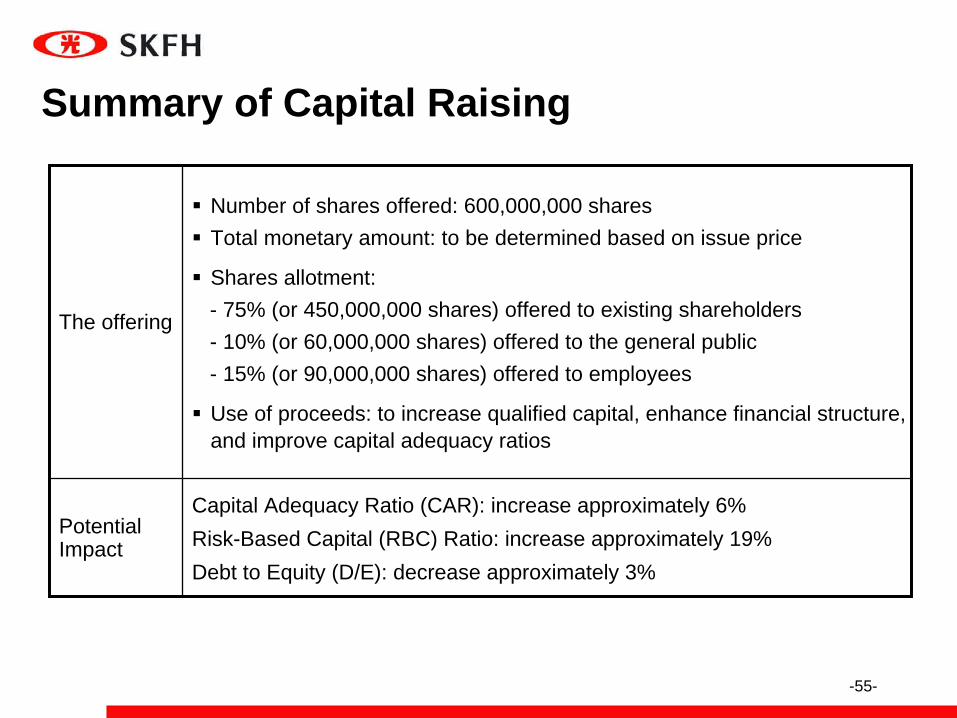
Summary of Capital Raising
The offering
Number of shares offered: 600,000,000 sharesTotal monetary amount: to be determined based on issue price
Shares allotment:- 75% (or 450,000,000 shares) offered to existing shareholders- 10% (or 60,000,000 shares) offered to the general public- 15% (or 90,000,000 shares) offered to employees
Use of proceeds: to increase qualified capital, enhance financial structure, and improve capital adequacy ratios
Potential Impact
Capital Adequacy Ratio (CAR): increase approximately 6%Risk-Based Capital (RBC) Ratio: increase approximately 19%Debt to Equity (D/E): decrease approximately 3%

-56-
I. SKFH
II. Life Insurance Business
III. Banking Business
IV. Appendix• Market opportunities• SKL Premium• One-off losses of CDO & CBO investment• EV & AV Result• SKL China Development Strategy• Capital Enhancement• Other Information
Agenda
-56-
-57-
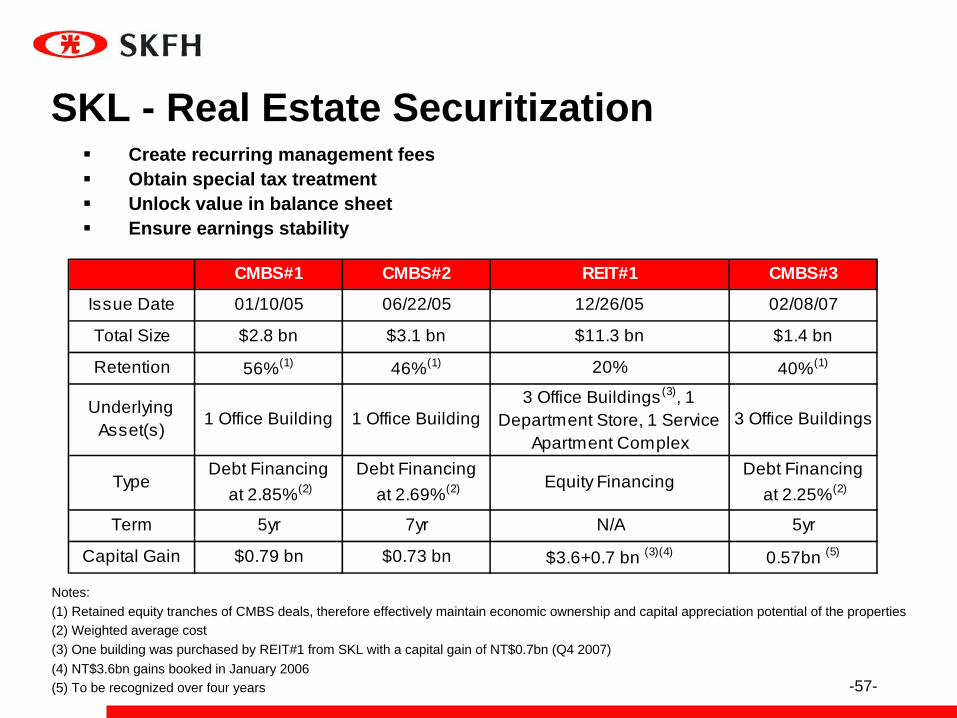
Notes:(1) Retained equity tranches of CMBS deals, therefore effectively maintain economic ownership and capital appreciation potential of the properties (2) Weighted average cost(3) One building was purchased by REIT#1 from SKL with a capital gain of NT$0.7bn (Q4 2007) (4) NT$3.6bn gains booked in January 2006(5) To be recognized over four years
SKL - Real Estate SecuritizationCreate recurring management fees Obtain special tax treatmentUnlock value in balance sheetEnsure earnings stability
CMBS#1 CMBS#2 REIT#1 CMBS#3
Issue Date 01/10/05 06/22/05 12/26/05 02/08/07
Total Size $2.8 bn $3.1 bn $11.3 bn $1.4 bn
Retention 56%(1) 46%(1) 20% 40%(1)
UnderlyingAsset(s) 1 Office Building 1 Office Building
3 Office Buildings(3), 1Department Store, 1 Service
Apartment Complex3 Office Buildings
TypeDebt Financing
at 2.85%(2)Debt Financing
at 2.69%(2) Equity FinancingDebt Financing
at 2.25%(2)
Term 5yr 7yr N/A 5yr
Capital Gain $0.79 bn $0.73 bn $3.6+0.7 bn (3)(4) 0.57bn (5)


![CITIBANK, N.A. JAMAICA BRANCH FINANCIAL … · 3 CITIBANK, N.A. [Incorporated in the U.S.A. with limited liability] JAMAICA BRANCH Statement of Financial Position December 31, 2014](https://static.fdocuments.net/doc/165x107/5ae22a167f8b9ae74a8c11c3/citibank-na-jamaica-branch-financial-citibank-na-incorporated-in-the.jpg)

![CITIBANK, N.A., JAMAICA BRANCH FINANCIAL ......5 CITIBANK, N.A. [Incorporated in the U.S.A. with limited liability] JAMAICA BRANCH Statement of Profit or Loss and Other Comprehensive](https://static.fdocuments.net/doc/165x107/5f67dda90edc860c33200b96/citibank-na-jamaica-branch-financial-5-citibank-na-incorporated.jpg)