Shifting Property Taxes - Tax Admin Property Taxes: ... [email protected] 2 1 Presentation...
18
1 Shifting Property Taxes: A Case Study of Minnesota’s “Limited Market Value” Presentation to Federation of Tax Administrators Revenue Estimated Conference Tax Research Division Minnesota Department of Revenue September 18, 2007 [email protected] 2 1 Presentation Outline What is “Limited Market Value”? Limited Value by Property Type and Region Tax Impact by Property Type Tax Impact on Individual Home and Cabin Owners (parcel level analysis) Tax impact variation by home value
Transcript of Shifting Property Taxes - Tax Admin Property Taxes: ... [email protected] 2 1 Presentation...

1
Shifting Property Taxes:
A Case Study ofMinnesota’s “Limited Market Value”
Presentation toFederation of Tax AdministratorsRevenue Estimated Conference
Tax Research DivisionMinnesota Department of Revenue
September 18, [email protected]
2 1
Presentation Outline
What is “Limited Market Value”?
Limited Value by Property Type and Region
Tax Impact by Property Type
Tax Impact on Individual Home and CabinOwners (parcel level analysis)
Tax impact variation by home value

2
3
What is “Limited Market Value?”
2
________________________________Ramsey County 2003 Property Tax StatementProperty Tax and Revenue 2003 Value Notice Information
16 Assessment Date, January 2, 2001, January 2, 2002, January 2, 2003, Taxes payable year payable 2002 payable 2003 payable 2004
17 Estimated Market Value $129,000 $139,600 $161,000
18 Limited Market Value $113,600 $125,000 $140,000
________________________________
Taxable Value reduced about 15%, so my taxes are down about 15% too.
4
Preview: Three Surprises
Surprise #1: Homeowners as a group arenet losers in 2007! (They pay more tax.)
Surprise #2: One-third of homeownerswhose value is limited are still losers!
Surprise #3: Taxable value rose fasterthan market value in 2007 (because ofLMV).
Will LMV be allowed to expirefor taxes payable in 2010?

3
5
What is “Limited Market Value?”
A limit on annual growth in the dollar valuesubject to property taxation.
LMV applies only to “preferred classes”: Residential homestead and non-homestead; Agricultural homestead and non-homestead; Seasonal recreational residential (cabins); and Timberland (added in 2001).
2
6
Does not apply to an increase in value dueto improvements.
Not owner-specific. LMV applies to theparcel, so carries over to a new owner.
Value limit restricts neither the property taxrate nor the property tax levy.
If the property tax levy is fixed, then LMVshifts tax burden to other properties.
3
Limited Market Value

4
7
For assessment year 2006 (taxes payable2007), the increase in taxable value cannotexceed the larger of:
15% of previous year’s TMV; or 25% of the difference between new EMV
and previous year’s TMV.
where TMV = Taxable Market Value EMV = Estimated Market Value
(full market value, assessed annually)
4
8
Limited Market Value (LMV) – Example 1
5
$200 $200 $200 $200
$30 $40 $50
$120$150
$20
$30
$0
$100
$200
$300
$400
$500
10% 30% 80% 100%
Percent Increase in EMV for Pay 2007
2005 TMV Increase in TMV Untaxed Value
($ T
hous
ands
)
TMV+10%
TMV+15%
TMV+20%
TMV+25%
Impact of Limited Market Value for Pay 2007 TaxesHome with TMV = EMV = $200,000 for Pay 2006 Taxes
5
9
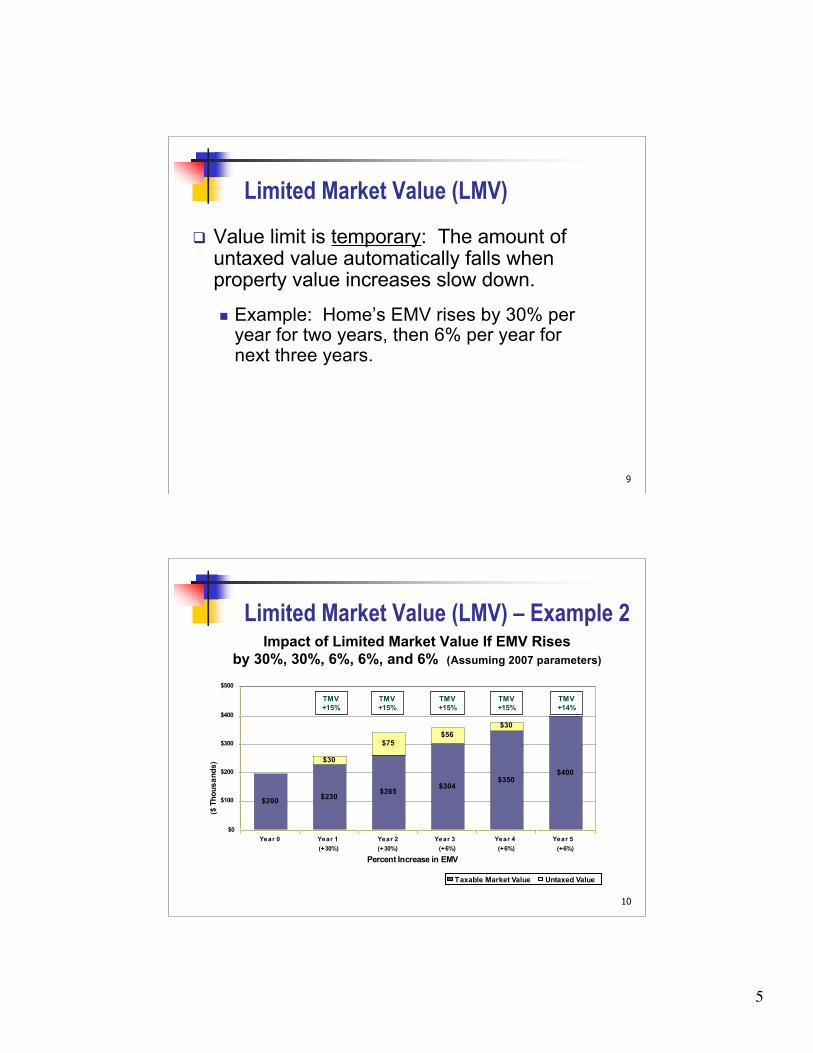
Value limit is temporary: The amount ofuntaxed value automatically falls whenproperty value increases slow down.
Example: Home’s EMV rises by 30% peryear for two years, then 6% per year fornext three years.
Limited Market Value (LMV)
6
10
Limited Market Value (LMV) – Example 2
($ T
hous
ands
)
$200$230
$265$304
$350$400
$75$56
$30
$30
$0
$100
$200
$300
$400
$500
Year 0 Year 1
(+30%)
Year 2
(+30%)
Year 3
(+6%)
Year 4
(+6%)
Year 5
(+6%)
Percent Increase in EMV
Taxable Market Value Untaxed Value
TMV+15%
TMV+15%
TMV+15%
TMV+15%
TMV+14%
Impact of Limited Market Value If EMV Risesby 30%, 30%, 6%, 6%, and 6% (Assuming 2007 parameters)
6
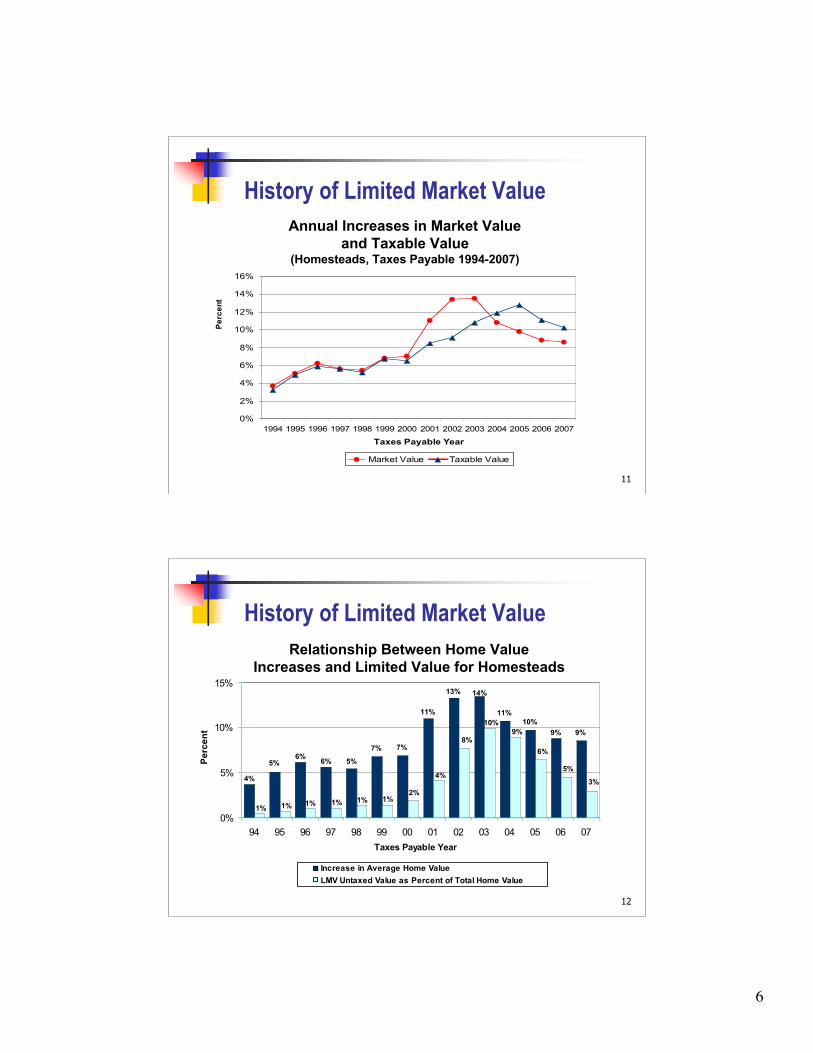
11
Annual Increases in Market Valueand Taxable Value
(Homesteads, Taxes Payable 1994-2007)
0%
2%
4%
6%
8%
10%
12%
14%
16%
1994 1995 1996 1997 1998 1999 2000 2001 2002 2003 2004 2005 2006 2007
Taxes Payable Year
Market Value Taxable Value
Perc
ent
8
History of Limited Market Value
12
History of Limited Market Value
7% 7%
11%
10%
9%
6%
9%
11%
13% 14%
4%
5% 5%6%
3%
2%
6%
5%
9%
10%
4%
8%
1%1%1%1%1%1%
0%
5%
10%
15%
94 95 96 97 98 99 00 01 02 03 04 05 06 07
Taxes Payable Year
Increase in Average Home Value
LMV Untaxed Value as Percent of Total Home Value
Perc
ent
Relationship Between Home ValueIncreases and Limited Value for Homesteads

7
1310
History of Limited Market Value
Percent Increase
Above Previous
Year's TMV
or
Percent of Difference
Between EMV and
Previous Year's TMV
1973-74 5% -
1975-79 10% 25%
1980 10% 50%
1993-96 10% 33%
1997-02 10% 15%
2003 12% 20%
2004 15% 20%
2005-07 15% 25%
2008 15% 33%
2009 15% 50%
NO LMV 2010 AND AFTER
Residential, agriculture, and cabins.
All Property
Residential, agriculture, and cabins
(plus timber starting 2001).
Preferred Classes
Maximum increase in taxable market value
is larger of:
Payable
Year(s)
NO LMV 1981-1992
14
History of Limited Market ValueTotal Nontaxable Market Value due to LMV
(all property types combined)Highest in 2004, but very little decline.
$1.0 $1.6 $2.0 $2.5 $3.4$5.6
$10.6
$21.0
$30.9
$34.9$33.1
$32.5$33.0
$0
$5
$10
$15
$20
$25
$30
$35
$40
1995 1996 1997 1998 1999 2000 2001 2002 2003 2004 2005 2006 2007
Taxes Payable Year
($ B
illio
ns)
11

8
15
History of Limited Market Value
0%
5%
10%
15%
20%
25%
30%
1994 1995 1996 1997 1998 1999 2000 2001 2002 2003 2004 2005 2006 2007
Taxes Payable Year
Farms Seasonal Rec. Resid. Total Residential Total Statewide
Perc
ent
Statewide Limitation as a Percentof Estimated Market Value
(Before Limitation)
12
16
Statewide Market Value Limitationby Type of Property (2007)
Seasonal Rec.
16.6%
Non-homestead
11.3%
Homestead
29.9%
Timber
2.2%
Farms
40.1%
13
Limited Value by Property Type

9
17
Perc
ent o
f Sta
tew
ide
Lim
ited
Valu
e
Shares of Statewide Limited Market Valueby Property Type (2000-2007)
27
0%
25%
50%
75%
100%
2000 2001 2002 2003 2004 2005 2006 2007
Taxes Payable Year
Timber
Farm
Seasonal
Recreation
Non-Homestead
Residential
Homestead
18
Change in Market Value Limitationby Region
14
($ B
illio
ns)
Limited Value by Region
10
19
Perc
ent o
f Sta
tew
ide
Lim
ited
Valu
e
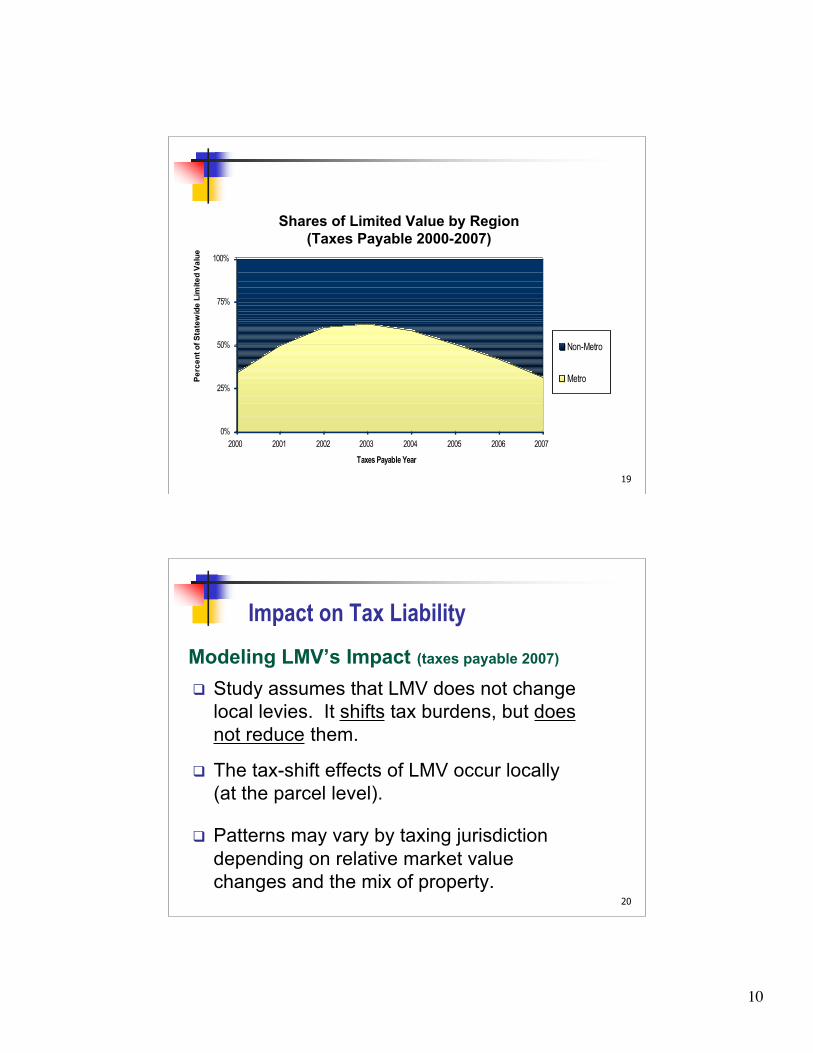
Shares of Limited Value by Region(Taxes Payable 2000-2007)
27
0%
25%
50%
75%
100%
2000 2001 2002 2003 2004 2005 2006 2007
Taxes Payable Year
Non-Metro
Metro
20
Impact on Tax Liability
Modeling LMV’s Impact (taxes payable 2007)
Study assumes that LMV does not changelocal levies. It shifts tax burdens, but doesnot reduce them.
The tax-shift effects of LMV occur locally(at the parcel level).
Patterns may vary by taxing jurisdictiondepending on relative market valuechanges and the mix of property.
15

11
21
Impact on Tax Liability
Parcel-level data for assessment year 2006.
Calculates tax impact for taxes payable 2007: Add untaxed value (due to LMV) back to tax
base. Recalculate local tax rates (levies unchanged). Compute “no LMV” tax amounts for each
homestead and cabin parcel. Compute “no LMV” aggregate tax amounts for
other classes (not parcel-level).
Study Methodology
16
22
Impact on Tax Liability by Property Class
Average Percent Change in Property TaxDue to LMV, By Class of Property
Taxes Payable 2007 (Statewide)
-23.3%
-10.7%
-8.3%
-5.5%
1.3% 2.2% 3.8% 4.1%
13.2%
-24%
-20%
-16%
-12%
-8%
-4%
0%
4%
8%
12%
16%
Metro
Timberland
Farms
Cabins
Non-Hmstd.
Hmstd.
C/I
Pub. Utilities
Apart.
Seasonal
Comm.
Perc
ent C
hang
e
17

12
23
Impact on Tax Liability – Homes
Tax Effects on Residential HomesteadsTaxes Payable 2007 (1.43 Million Parcels)
227,000 (16%) homeowners paid $64 millionless tax.
1,203,000 (84%) homeowners paid$110 million more tax. One-third of homes with limited value actually
paid more in tax (one-half for non-metro).
$46 million net loss to homeowners wasshifted on to homes from other classes.
18
24
Impact on Tax Liability –Homes
19
Limited Market Value Impactson Residential Homesteads
(Payable 2007)
0
100
200
300
400
500
600
-5,000
-3,000
-2,000
-1,000
-500
-300
-200
-100 -5
0 0 50 100
200
300
500
1,000
2,000
3,000
5,000
Estimated Homeowner Tax Change in Dollars
Coun
t of P
rope
rtie
s in
Tho
usan
ds
1,203,000 homeownerspay, on average, $92more tax.
227,000 homeowners pay,on average, $282 less tax.
Total TaxDecrease$64 Million
Total Tax Increase$110 Million

13
25
Percent with Limitation (Overall 25%) and
Percent who Gain (Overall 16%)Statewide (Pay 2007)
26% 25% 25%21% 22%
25%
33%
14% 16% 17%14% 14% 16%
23%
0%
10%
20%
30%
40%
50%
Under
$100
$100 to
$150
$150 to
200
$200 to
$250
$250 to
$300
$300 to
$400
Over
$400
Market Value of Home ($1000s)
Percent w ith
Value Limited
Percent
Gainers
LMV Variation by Home Market Value
30% of homes < $150,000.18% over $300,000 (and 8% over $400,000).
26
Percent with Limitation (Overall 24%) and
Percent who Gain (Overall 12%)Non-Metro (Pay 2007)
25%
18% 18%23%
30%
45%
13%10% 9% 11%
14%
25%
0%
10%
20%
30%
40%
50%
Under
$100
$100 to
$150
$150 to
200
$200 to
$250
$250 to
$300
Over
$300
Market Value of Home ($1000s)
Percent w ith
Value Limited
Percent
Gainers
57% of non-metro homes < $150,000.Only 8% over $300,000.

14
27
Percent with Limitation (Overall 26%) and
Percent who Gain (Overall 19%)Metro (Pay 2007)
39%
30%
20% 20% 21%
29%
34%
23%
15% 14% 14%
21%
0%
10%
20%
30%
40%
50%
Under
$150
$150 to
200
$200 to
$250
$250 to
$300
$300 to
$400
Over
$400
Market Value of Home ($1000s)
Percent w ith
Value Limited
Percent
Gainers
Only 7% of metro homes < $150,000.28% over $300,000 (and 13% over $400,000).
28
Average Limitation for Homes with LimitationStatewide
$7$14
$19$23
$28$36
$80
12%11%
11%10% 10% 10%
13%
0
20
40
60
80
100
120
Under $100 $100 to $150 $150 to 200 $200 to $250 $250 to $300 $300 to $400 Over $400
Market Value ($1000s)
$ T
ho
us
an
ds
0%
2%
4%
6%
8%
10%
12%
14%
Average ($1000s)
Ave. % of Value

15
29
Impact on Tax Liability – Cabins
LMV’s Effect on CabinsTaxes Payable 2007 (203,000 Parcels)
140,000 (69%) parcels paid $25 millionless tax.
63,000 (31%) parcels paid $7 millionmore tax.
$17.2 million net gain was shifted to otherclasses, and off of cabins.
20
30
Impact on Tax Liability – Cabins
21
0
10
20
30
40
50
60
-5,000
-3,000
-2,000
-1,000
-500
-300
-200
-100 -5
0 0 50 100
200
300
500
1,000
2,000
3,000
5,000
Estimated Seasonal Recreational Residential Tax Change in Dollars*
Coun
t of P
rope
rtie
s in
Tho
usan
ds 63,000 seasonalrecreational residentialproperties pay, onaverage, $110 more tax.
140,000 seasonalrecreational residentialproperties pay, onaverage, $179 less tax.
*Includes state tax. State tax rate adjusted to hold state tax amount constant.
Total Tax Decrease$25 Million
Total Tax Increase$7 Million
Limited Market Value Impactson Seasonal Recreational Residential Property
(Payable 2007)
16
31
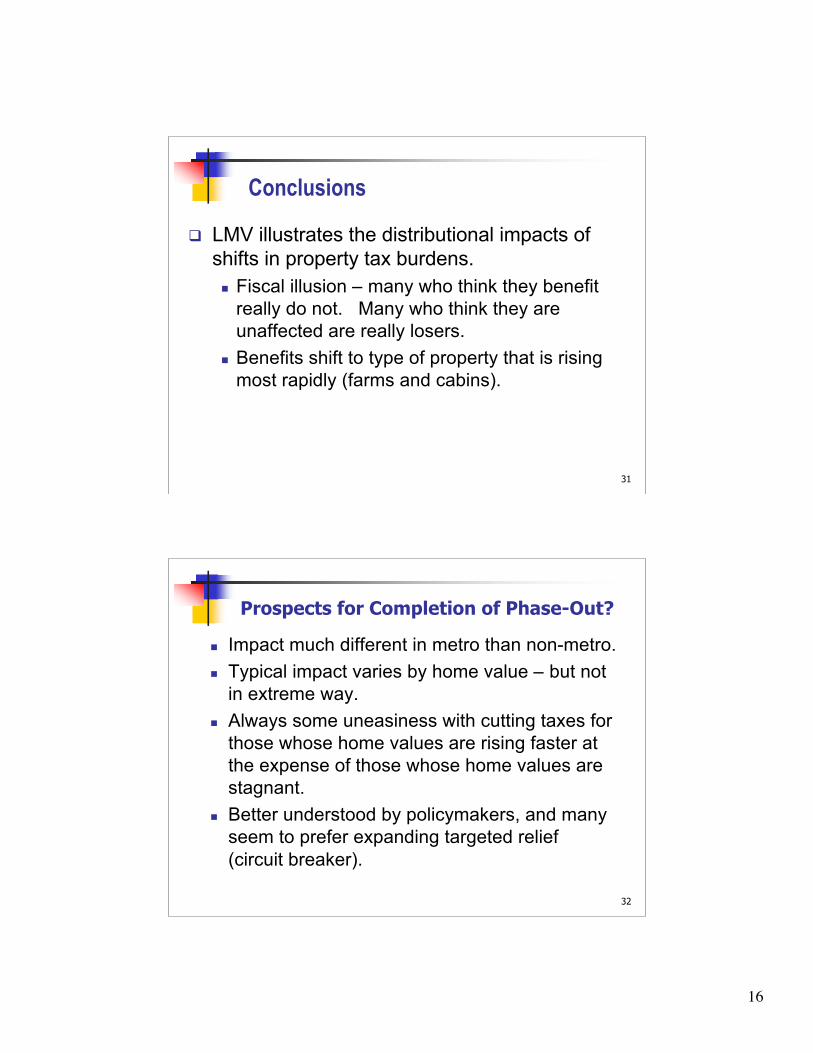
LMV illustrates the distributional impacts ofshifts in property tax burdens. Fiscal illusion – many who think they benefit
really do not. Many who think they areunaffected are really losers.
Benefits shift to type of property that is risingmost rapidly (farms and cabins).
22
Conclusions
32
Impact much different in metro than non-metro. Typical impact varies by home value – but not
in extreme way. Always some uneasiness with cutting taxes for
those whose home values are rising faster atthe expense of those whose home values arestagnant.
Better understood by policymakers, and manyseem to prefer expanding targeted relief(circuit breaker).
23
Prospects for Completion of Phase-Out?

17
3324
Annual Increases in Taxable Value and Net Tax(Homesteads, 1996-2007)
-20%
-10%
0%
10%
20%
30%
40%
76 79 82 85 88 91 94 97 00 03 06
Taxes Payable Year
Pe
rce
nt
Taxable Value Net Tax
34
Annual Increases in Market Value and Taxable Value(Homesteads, 1996-2007)
0%
5%
10%
15%
20%
25%
30%
35%
40%
76 79 82 85 88 91 94 97 00 03 06
Taxes Payable Year
Pe
rce
nt
Market Value Taxable Value
25

18
35
0%
5%
10%
15%
20%
25%
30%
35%
40%
1994 1995 1996 1997 1998 1999 2000 2001 2002 2003 2004 2005 2006 2007
Taxes Payable Year
Farms Seasonal Rec. Resid. Total Residential Total Metro
Perc
ent
Limitation as a Percentage ofEstimated Market Value (Before Limitation)
Metro Area
26
36
0%
5%
10%
15%
20%
25%
30%
35%
40%
1994 1995 1996 1997 1998 1999 2000 2001 2002 2003 2004 2005 2006 2007
Taxes Payable Year
Farms Seasonal Rec. Resid. Total Residential Total Non-Metro
Perc
ent
Limitation as a Percentage ofEstimated Market Value (Before Limitation)
Non-Metro Area
27