Shidler college of_business_ws
19
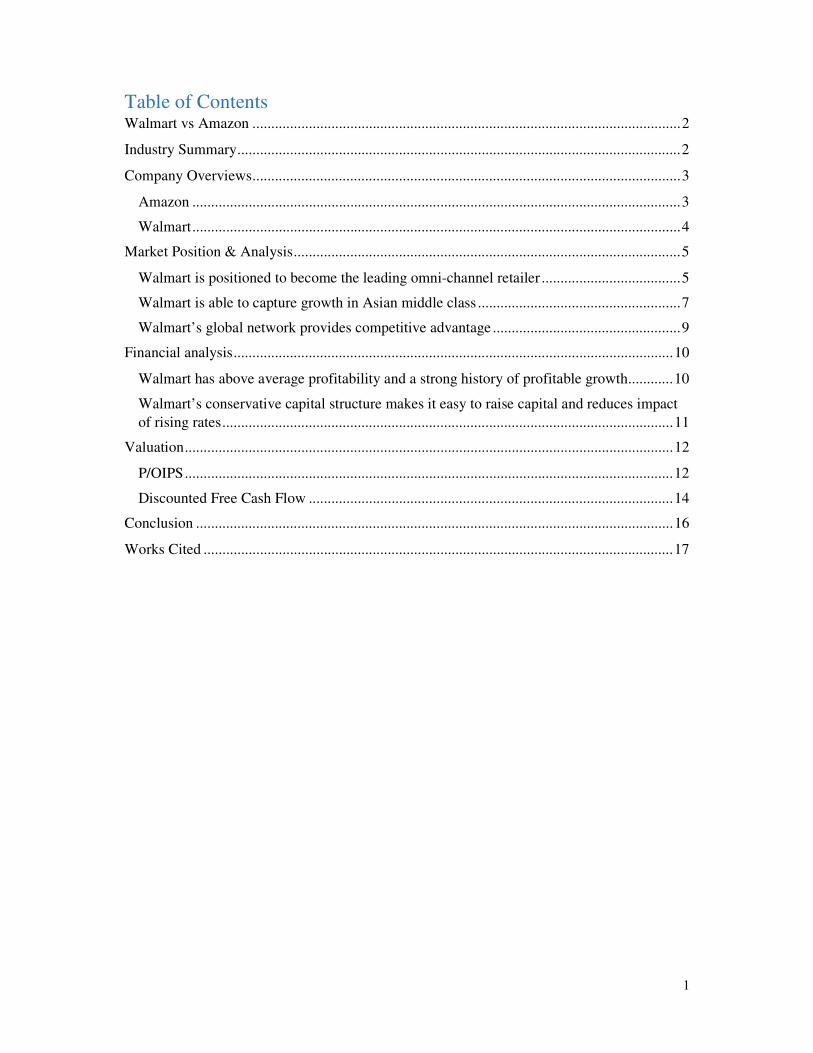
Abstract WALMART VS AMAZON Economist 2016 Investment Case Competition sponsored by RealVision Cole Buckley, Pete DeFina and Lindsay Root Over the next 10 years Walmart stock will outperform Amazon because: • Combining brick-and-mortar with e-commerce is a winning strategy: Although the growth of e-commerce is impressive, brick-and-mortar stores still account for 90% of retail revenues. Walmart is better positioned as an omni-channel retailer given its global store network and strong online presence. • Early entry in China will pay dividends as country’s middle class booms: The growth of the Chinese middle class will alter global consumption trends in the next decade. Walmart has been laying the foundation to meet this demand and is accelerating expansion in China. • Earnings, not dreams, drive value: Walmart has proven it can deliver long-term profitable growth. Comprehensive strategy and operational excellence will continue to provide above average profitability. • Strong balance sheet and robust free cash flow provide low cost capital to support growth: Relatively low debt insulates Walmart from rising rates. • Undervalued stock will provide most value to shareholders: Conservative DCF model shows the market is significantly mispricing Walmart’s stock.
-
Upload
karaikudi-institute-of-management -
Category
Health & Medicine
-
view
44 -
download
0
Transcript of Shidler college of_business_ws
Abstract
WALMART VS AMAZON Economist 2016 Investment Case Competition
sponsored by RealVision
Cole Buckley, Pete DeFina and Lindsay Root
Over the next 10 years Walmart stock will outperform Amazon because:
• Combining brick-and-mortar with e-commerce is a winning
strategy: Although the growth of e-commerce is impressive, brick-and-mortar
stores still account for 90% of retail revenues. Walmart is better positioned as an
omni-channel retailer given its global store network and strong online presence.
• Early entry in China will pay dividends as country’s middle class booms: The
growth of the Chinese middle class will alter global consumption trends in the next
decade. Walmart has been laying the foundation to meet this demand and is
accelerating expansion in China.
• Earnings, not dreams, drive value: Walmart has proven it can deliver long-term
profitable growth. Comprehensive strategy and operational excellence will
continue to provide above average profitability.
• Strong balance sheet and robust free cash flow provide low cost capital to
support growth: Relatively low debt insulates Walmart from rising rates.
• Undervalued stock will provide most value to shareholders: Conservative DCF
model shows the market is significantly mispricing Walmart’s stock.
1
Table of Contents Walmart vs Amazon .................................................................................................................. 2
Industry Summary ...................................................................................................................... 2
Company Overviews .................................................................................................................. 3
Amazon .................................................................................................................................. 3
Walmart .................................................................................................................................. 4
Market Position & Analysis ....................................................................................................... 5
Walmart is positioned to become the leading omni-channel retailer ..................................... 5
Walmart is able to capture growth in Asian middle class ...................................................... 7
Walmart’s global network provides competitive advantage .................................................. 9
Financial analysis ..................................................................................................................... 10
Walmart has above average profitability and a strong history of profitable growth ............ 10
Walmart’s conservative capital structure makes it easy to raise capital and reduces impact of rising rates ........................................................................................................................ 11
Valuation .................................................................................................................................. 12
P/OIPS .................................................................................................................................. 12
Discounted Free Cash Flow ................................................................................................. 14
Conclusion ............................................................................................................................... 16
Works Cited ............................................................................................................................. 17

2
Walmart vs Amazon Amazon and Walmart have become ubiquitous, household names in the US and for good
reason: both of these companies have revolutionized the way in which we shop. Amazon offers
a convenient experience, and an ever-expanding selection of products whereas Walmart has a
wide network of store locations and famously low prices. As investments, these companies
highlight the dichotomous nature of the retail industry – brick-and-mortar vs e-commerce; high
growth vs steady growth; US vs International; actual vs market expectations. To coalesce these
stark differences, we will first summarize the industry and these companies, followed by an
analysis of market position and financials, and finally an analysis of the firm valuation, all of
which point to Walmart as the clear investment over the next 10 years.
Investment decision: Buy WMT
Industry Summary
For the ease of comparison, we’ve grouped both Amazon and Walmart into retail, however,
the industry forces that drive each of these companies are distinctly different and the firm that
is best able to leverage these forces will ultimately make a better investment for the next 10
years.

3
Table 1: Industry Summary1
Industry E-commerce and Online Auctions in the US
Warehouse Clubs & Supercenters in the US
Department Stores in the US
Key Drivers Per capita disposable income Number of mobile internet connections Percentage of services conducted online
World price of crude oil
Life cycle stage:
Growth Mature Decline
Concentration Level:
Low – HHI 250 High – HHI 5,000
High HHI 2,000
Technology Change:
High Medium Medium
Barriers to Entry:
Low High Medium
Threats High reliance on shipping companies (FedEx, UPS, etc.). Operating profits limited when oil prices are high. Membership (like Prime) limits ability to pass higher costs onto customers.
Gas stations generate large portion of industry revenue.
E-commerce sites are better positioned due to low overhead costs, offering lower prices and wider inventories.
Opportunities Disposable income levels determine quantity and quality of online purchases
Integrate in-store and online for personalized customer experience
Company Overviews
Amazon
Amazon.com, founded in 1994 by current CEO Jeff Bezos, is the largest internet-based retailed
in the US. They maintain three different operating segments: North America, International, and
1 (IBIS World, 2015)

4
Web Services. In Q2 of 2015, Amazon reported $23 billion in sales of which North America
represented 60%, International 32%, and Web Services 8%.2 Amazon currently sells over 300
million products in a variety of categories. Its retail operation encompasses many different
business models – Amazon Retail, Amazon Marketplace, and Amazon Web Services. In
Amazon Retail, the company purchases and takes possession of inventory in which it stores in
one of its 743 distribution centers in the US. In Amazon Marketplace, third party sellers are
able to list items on Amazon’s website and the seller pays a fee to Amazon. Amazon Web
Services is cloud-computing platform providing services like online storage and virtual
servers.4
Walmart
Walmart, founded in 1962 by Sam Walton, was the world’s largest company by revenue5. Its
operating segments include Sam’s Club, Walmart US, and International. In Q2 of 2015,
Walmart reported $119 billion in sales of which Walmart US represented 62%, International
26% and Sam’s Club 12%.6 Sales are generated predominantly through one of its 11,526 stores
throughout the globe. Walmart also generates sales through its website Walmart.com, however
less than 3% of sales are generated online.7 Evolving to compete in the digital space, Walmart
is moving from a traditional brick-and-mortar retail store to an omni-channel model which
includes online sales.8
Table2: Selected Company Metrics9
Company Name Walmart (WMT) Amazon (AMZN)
Employees 2.2 Million 154,000
Shareholders 250,000 2,744
2 (Amazon, 2015) 3 (MWPVL, 2015) 4 (Amazon, 2015) 5 (Fortune, 2015) 6 (Walmart, 2015) 7 (Forbes, 2015) 8 (Walmart, 2015) 9 (Mergent Online, 2015)
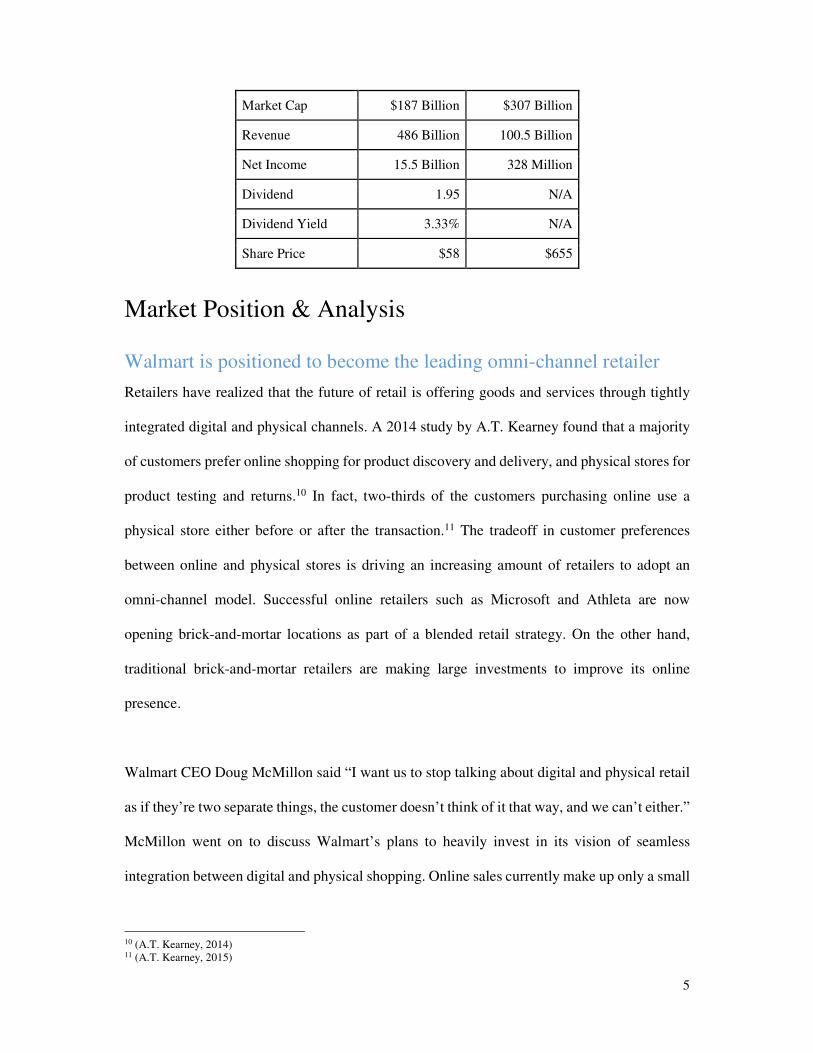
5
Market Cap $187 Billion $307 Billion
Revenue 486 Billion 100.5 Billion
Net Income 15.5 Billion 328 Million
Dividend 1.95 N/A
Dividend Yield 3.33% N/A
Share Price $58 $655
Market Position & Analysis
Walmart is positioned to become the leading omni-channel retailer
Retailers have realized that the future of retail is offering goods and services through tightly
integrated digital and physical channels. A 2014 study by A.T. Kearney found that a majority
of customers prefer online shopping for product discovery and delivery, and physical stores for
product testing and returns.10 In fact, two-thirds of the customers purchasing online use a
physical store either before or after the transaction.11 The tradeoff in customer preferences
between online and physical stores is driving an increasing amount of retailers to adopt an
omni-channel model. Successful online retailers such as Microsoft and Athleta are now
opening brick-and-mortar locations as part of a blended retail strategy. On the other hand,
traditional brick-and-mortar retailers are making large investments to improve its online
presence.
Walmart CEO Doug McMillon said “I want us to stop talking about digital and physical retail
as if they’re two separate things, the customer doesn’t think of it that way, and we can’t either.”
McMillon went on to discuss Walmart’s plans to heavily invest in its vision of seamless
integration between digital and physical shopping. Online sales currently make up only a small
10 (A.T. Kearney, 2014) 11 (A.T. Kearney, 2015)

6
percentage of Walmart’s total revenues, however with $12 billion in e-commerce sales in 2015
it is already one of the largest online retailers in the world.12 Indeed, Walmart has incredible
upside potential in online retailing if it can successfully execute its omni-channel strategy.
In 2015 the global e-commerce market was estimated to be $1.5 trillion which is forecast to
grow at an average of 15% for the next 3 years.13 Despite this high growth rate, in 2019 e-
commerce sales will still only account 12.4% or $3.5 trillion of total retail sales of $28.5 trillion
(see Figure 1).14
Figure 1: Global Retail and E-commerce Sales Forecast in Trillions15
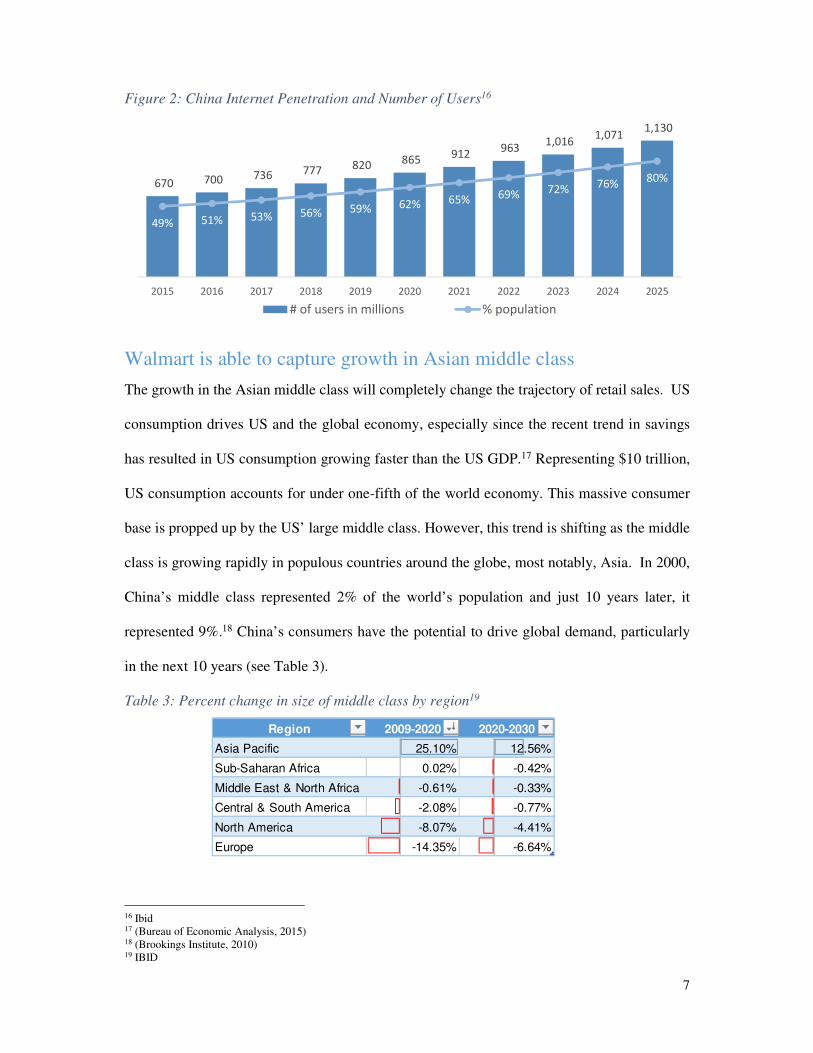
As of 2014, China represents a $400 billion e-commerce market and is forecast to grow at more
than 20% over the next few years (see Figure 2). The drivers for this growth include China’s
large population, growing internet penetration, and increase in disposable income with the
forecasted rise of the middle class.
12 (Market Realist, 2015) 13 (eMarketer, 2015) 14 Ibid 15 (eMarketer, 2015)
93% 91% 90% 89% 88% 87% 86% 85% 84% 83% 83%
7%9% 10% 11% 12% 13% 14% 15% 16% 17% 17%
22.8 24.3 25.7 27.1 28.6 30.0 31.4 32.8 34.3 35.7 37.1
2015 2016 2017 2018 2019 2020 2021 2022 2023 2024 2025
Brick-and-mortar Retail e-commerce sales Total
7
Figure 2: China Internet Penetration and Number of Users16
Walmart is able to capture growth in Asian middle class
The growth in the Asian middle class will completely change the trajectory of retail sales. US
consumption drives US and the global economy, especially since the recent trend in savings
has resulted in US consumption growing faster than the US GDP.17 Representing $10 trillion,
US consumption accounts for under one-fifth of the world economy. This massive consumer
base is propped up by the US’ large middle class. However, this trend is shifting as the middle
class is growing rapidly in populous countries around the globe, most notably, Asia. In 2000,
China’s middle class represented 2% of the world’s population and just 10 years later, it
represented 9%.18 China’s consumers have the potential to drive global demand, particularly
in the next 10 years (see Table 3).
Table 3: Percent change in size of middle class by region19
16 Ibid 17 (Bureau of Economic Analysis, 2015) 18 (Brookings Institute, 2010) 19 IBID
670 700 736 777 820 865 912 963 1,016 1,071 1,130
49% 51% 53% 56% 59% 62% 65% 69% 72% 76% 80%
2015 2016 2017 2018 2019 2020 2021 2022 2023 2024 2025# of users in millions % population
Region 2009-2020 2020-2030
Asia Pacific 25.10% 12.56%
Sub-Saharan Africa 0.02% -0.42%
Middle East & North Africa -0.61% -0.33%
Central & South America -2.08% -0.77%
North America -8.07% -4.41%
Europe -14.35% -6.64%

8
Additionally, Chinese consumers are avid shoppers. In a 2007 survey, Chinese respondents
indicated that they spend 9.8 hours per week shopping, whereas the typical American only
spends 3.6 hours.20 More than 40% of survey respondents also stated that shopping was their
favorite activity.
Given these sentiments, and the fact that half of China is still not connected to the internet,
Walmart is better positioned to capitalize on these trends than Amazon. In contrast to its
position in the US, Amazon must compete for market share with Alibaba and JD.com in China.
Current research estimates that Amazon occupies less than 1.5% of the market share and is
losing $600 million a year.21 Earlier this year, Amazon quietly opened a store on competitor
Alibaba’s Tmall platform, a site for authentic brands, in order to access Chinese customers
since it has not had much success via its own website Amazon.cn. This does not bode well for
the ubiquity nor profitability of Amazon in China.
Whereas Amazon is struggling for a foothold in the Chinese market, Walmart is enjoying
modest, albeit slow, growth in China. Since entering the market in 1996 with two stores, it
rapidly expanded to 279 stores by 2010, however, Walmart did face some challenges as
particular low performing stores were forced to close.22 Despite rising debt and total liabilities
up from 76% in 2013 to close to 80% currently, Walmart was able to improve profits and
margins over the same period indicating that the firm is able to rein in costs.23 "Our aim is to
become an integral part of China's economy," said CEO Doug McMillon. "China is a top
priority."24 Despite setbacks, Walmart has pledged to open 115 new stores by 2017, bringing
20 (McKinsey & Company, 2007) 21 (Fortune, 2015) 22 (Wall Street Journal, 2015) 23 (Reuters, 2015) 24 (Reuters, 2015)

9
the total to 530 stores in China.25 In 2011, sales in China accounts for about 2% or $7.5 billion
of Walmart’s annual revenues, but sales in China have risen over the last decade while sales in
the US continues to shrink.26
Furthermore, Walmart is positioning itself to offer greater e-commerce flexibility to its Chinese
customers by partnering with local company, Yihaodian. Walmart just recently bought out the
company’s founders, signaling that Walmart is gearing up for an investment into its Chinese
omni-channel model. China’s online retail sales rose 49% to $440 billion27 and with Walmart’s
ownership in Yihaodian, Walmart hopes to expand its inconsequential 1% market share. With
China as the largest opportunity for growth for both Amazon and Walmart, it is clear that
Walmart is much better positioned.
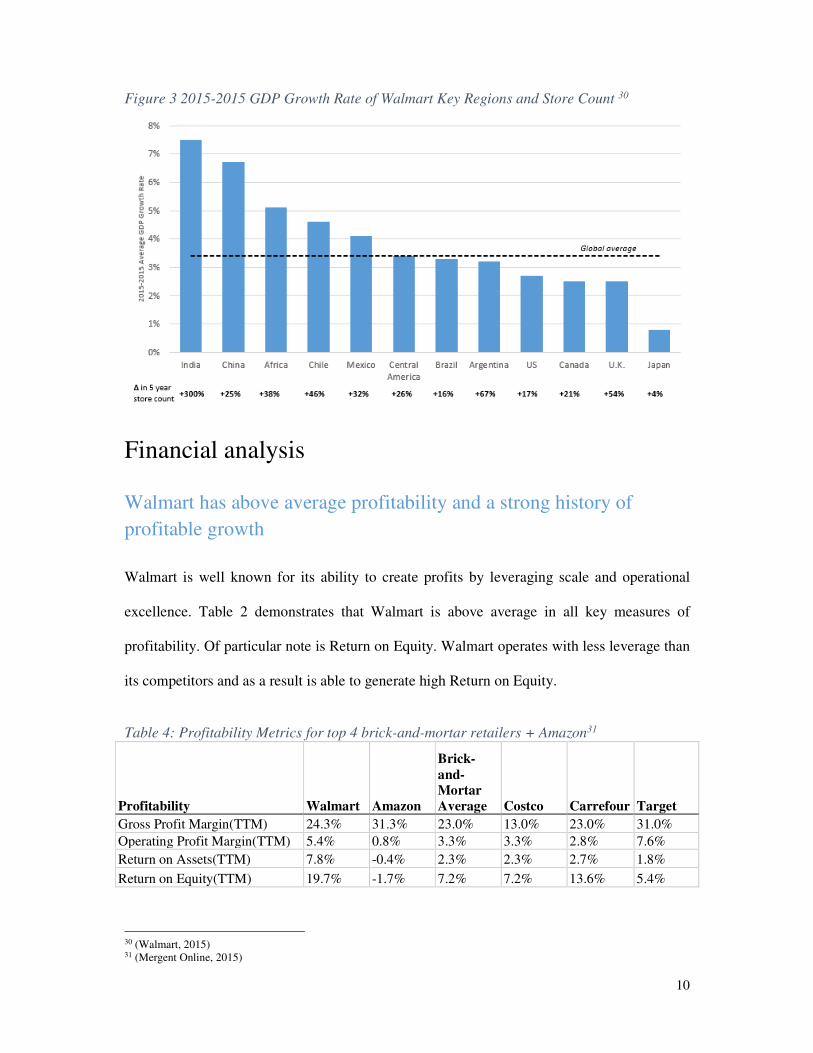
Walmart’s global network provides competitive advantage
Since the opening of its first international location in 1991, Walmart has been steadily
increasing its global presence. Currently, it operates 6,290 international store locations.
Walmart is well established in developed countries and is now focusing on growing store count
in the fastest growing economies. Five of Walmart’s international regions are forecast to
outpace global average growth in the next 10 years. Each of these regions has seen store count
rise by more than 25% in the last 5 years. Of particular interest are India and Africa, where it
has been difficult for US retailers to gain a strong foothold. Walmart has made steady progress
in these regions through a series of acquisitions. Despite the challenges of doing business in
emerging economies, Walmart is planning continued expansion. By 2020, it will add 50 new
stores in India and 90 stores in Africa.28 29
25 (Wall Street Journal, 2015) 26 (The Atlanic, 2015) 27 (CCTV America, 2015) 28 (AFK Insider, 2014) 29 (The Street, 2015)
10
Figure 3 2015-2015 GDP Growth Rate of Walmart Key Regions and Store Count 30
Financial analysis
Walmart has above average profitability and a strong history of
profitable growth
Walmart is well known for its ability to create profits by leveraging scale and operational
excellence. Table 2 demonstrates that Walmart is above average in all key measures of
profitability. Of particular note is Return on Equity. Walmart operates with less leverage than
its competitors and as a result is able to generate high Return on Equity.
Table 4: Profitability Metrics for top 4 brick-and-mortar retailers + Amazon31
Profitability Walmart Amazon
Brick-and-Mortar Average Costco Carrefour Target
Gross Profit Margin(TTM) 24.3% 31.3% 23.0% 13.0% 23.0% 31.0% Operating Profit Margin(TTM) 5.4% 0.8% 3.3% 3.3% 2.8% 7.6%
Return on Assets(TTM) 7.8% -0.4% 2.3% 2.3% 2.7% 1.8%
Return on Equity(TTM) 19.7% -1.7% 7.2% 7.2% 13.6% 5.4%
30 (Walmart, 2015) 31 (Mergent Online, 2015)

11
Walmart’s profitability is not just a recent occurrence. Gross profit margin (Gross Profit/Total
Revenues) has been steadily increasing for more than two decades; proving that Walmart can
balance everyday low pricing with its tremendous purchasing power (see Figure 4).
Figure 4: Walmart Annual Gross Profit Margin32
Walmart’s conservative capital structure makes it easy to raise capital
and reduces impact of rising rates
Walmart has used profits to pay down its debt and achieve a conservative capital structure.
60% of Walmart’s assets are financed through debt, compared to 78% for Amazon and 68%
for brick-and-mortar competitors.33 This relatively low debt to equity ratio is a characteristic
of family-owned businesses which view debt as a constraint.34 The relatively low debt ratio
and high interest coverage ratio have earned Walmart a high credit rating and low cost of
borrowing. Moody’s gives Walmart an investment grade rating of Aa2, significantly higher
than Amazon and other key competitors. The benefit of Walmart’s conservative capital
structure is its ability to issue future debt at a lower cost than industry peers.
32 (Mergent Online, 2015) 33 (Mergent Online, 2015) 34 (Harvard Business Review, 2012)
20%
21%
22%
23%
24%
25%
26%
1990 1995 2000 2005 2010 2015

12
Another benefit of Walmart’s relatively low amount of debt is it helps to insulate them from
the shock of rising interest rates. A forecast consensus prepared by the Wall Street Journal
shows interest rates rising dramatically throughout 2016 and 2017.35 Firms such as Amazon,
with high leverage and low operating margins will be significantly burdened by debt service in
an environment of rapidly rising interest rates.
Valuation Our valuation of Walmart is based on two approaches: using Price (P) to Operating Income Per
Share (OI) multiple, and a Discounted Free Cash Flow (DFCF) valuation.
Price/Operating Income Per Share
The P/OI ratio was selected to remove inconsistencies in valuations that can result from high
growth rates and/or depressed or negative net earnings, characteristic of many pure play e-
commerce retailers. Specifically, this valuation metric was selected over a net earnings
valuation metric, such as Price to Earnings (P/E) ratios, in order to eliminate any bias created
by deductions of interest, depreciation, and or amortization. Also, because of the different
growth rates traditional brick-and-mortar retail and e-commerce segments, fixed asset capital
expenditures (CAPEX) and their financing are also varied across the retail industry. For
example, e-commerce is a relatively high growth segment, exhibiting relatively high average
CAPEX, (AMZN CAPEX as % of Sales = 8.8%; WMT CAPEX as % of Sales = 2.5%) and
depreciation, which can depress net earnings and bias valuation estimates based on e-commerce
net earnings. Similarly, diverse financing methods and interest deductions create net earnings-
based valuation biases.
35 (Wall Street Journal, 2015)
13
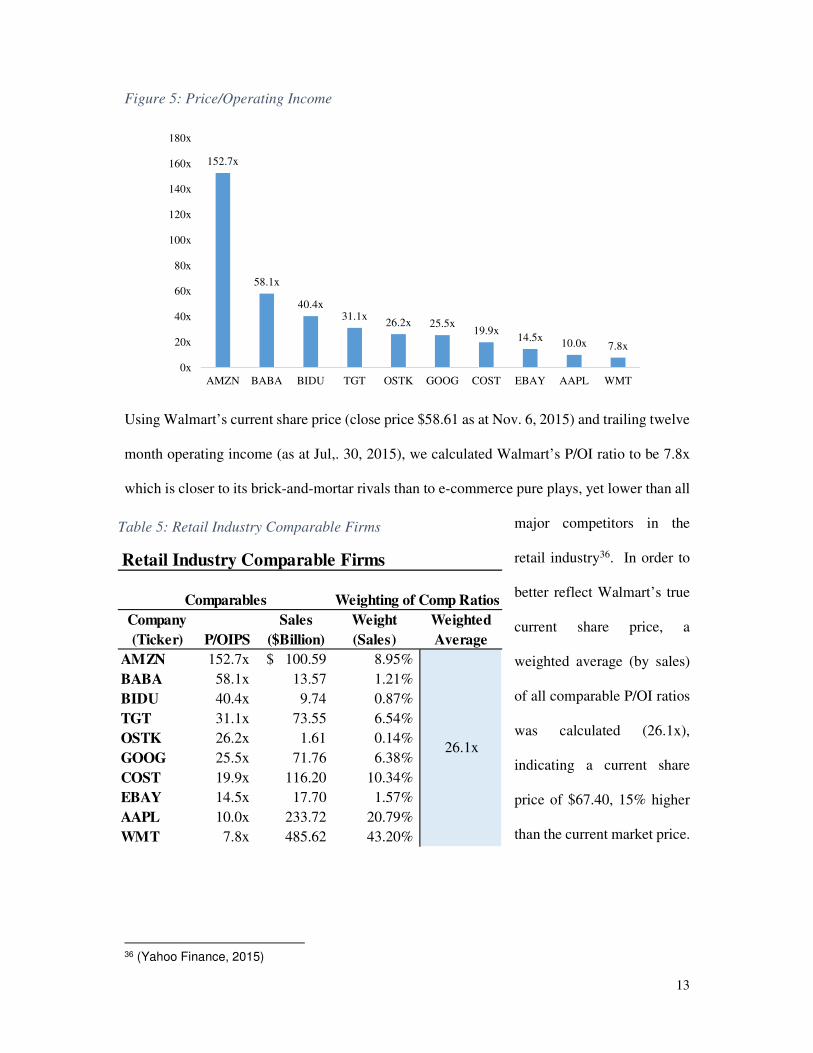
Figure 5: Price/Operating Income
Using Walmart’s current share price (close price $58.61 as at Nov. 6, 2015) and trailing twelve
month operating income (as at Jul,. 30, 2015), we calculated Walmart’s P/OI ratio to be 7.8x
which is closer to its brick-and-mortar rivals than to e-commerce pure plays, yet lower than all
major competitors in the
retail industry36. In order to
better reflect Walmart’s true
current share price, a
weighted average (by sales)
of all comparable P/OI ratios
was calculated (26.1x),
indicating a current share
price of $67.40, 15% higher
than the current market price.
36 (Yahoo Finance, 2015)
152.7x
58.1x
40.4x31.1x
26.2x 25.5x19.9x
14.5x10.0x 7.8x
0x
20x
40x
60x
80x
100x
120x
140x
160x
180x
AMZN BABA BIDU TGT OSTK GOOG COST EBAY AAPL WMT
Retail Industry Comparable Firms
Company
(Ticker) P/OIPS
Sales
($Billion)
Weight
(Sales)
Weighted
Average
AMZN 152.7x 100.59$ 8.95%
BABA 58.1x 13.57 1.21%
BIDU 40.4x 9.74 0.87%
TGT 31.1x 73.55 6.54%
OSTK 26.2x 1.61 0.14%
GOOG 25.5x 71.76 6.38%
COST 19.9x 116.20 10.34%
EBAY 14.5x 17.70 1.57%
AAPL 10.0x 233.72 20.79%
WMT 7.8x 485.62 43.20%
Comparables Weighting of Comp Ratios
26.1x
Table 5: Retail Industry Comparable Firms

14
Discounted Free Cash Flow
The discounted free cash flow valuation method was selected to provide a business-driven
valuation method, to complement the market-driven P/OI valuation. This is a credible
valuation method since it allows the incorporation of expected growth in both sales channels
and profit margins. A free cash flow growth rate of 3.0%, in line with global GDP growth,
was applied to Walmart’s free cash flow over the 5 year discounted cash flow valuation.
Cost of Equity (re) 7.12%
Risk-free rate (rf) 3.09%
Market Risk Premium 6.01%
Beta 0.4646
After-tax Cost of Debt 2.85%
Cost of Debt (rd) 4.39%
Tax rate (t) 35.00%
Debt Weight (Wd) 13.73%
Equity Weight (We) 86.27%
WACC 5.46%
Weighted Average Cost of Capital
Table 6: Price/Operating Income Per Share
P/OIPS ValuationP/OI 26.1x
Enterprise Value $634,924,825,970
Net Debt 416,341,000,000
Equity 218,583,825,970
3,243,000,000
67.40
Total Diluted
Shares
Equity Value
Per Share
Table 7: Weighted Average Cost of Capital
15
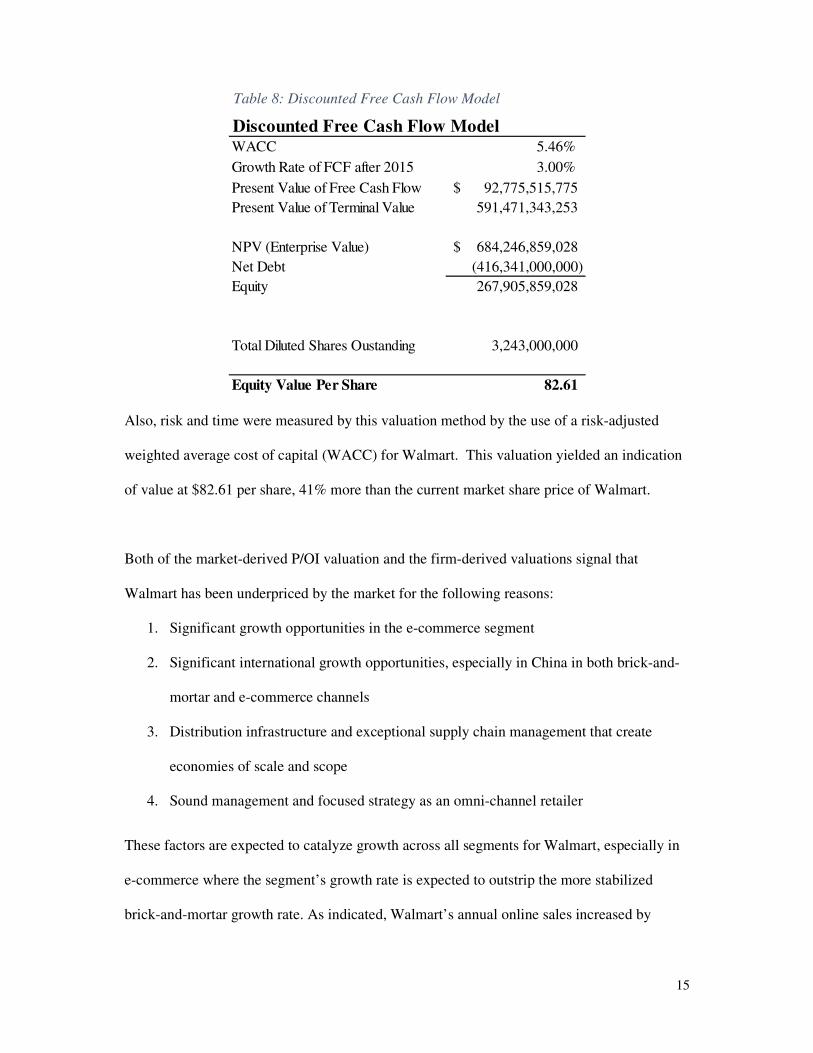
Also, risk and time were measured by this valuation method by the use of a risk-adjusted
weighted average cost of capital (WACC) for Walmart. This valuation yielded an indication
of value at $82.61 per share, 41% more than the current market share price of Walmart.
Both of the market-derived P/OI valuation and the firm-derived valuations signal that
Walmart has been underpriced by the market for the following reasons:
1. Significant growth opportunities in the e-commerce segment
2. Significant international growth opportunities, especially in China in both brick-and-
mortar and e-commerce channels
3. Distribution infrastructure and exceptional supply chain management that create
economies of scale and scope
4. Sound management and focused strategy as an omni-channel retailer
These factors are expected to catalyze growth across all segments for Walmart, especially in
e-commerce where the segment’s growth rate is expected to outstrip the more stabilized
brick-and-mortar growth rate. As indicated, Walmart’s annual online sales increased by
WACC 5.46%
Growth Rate of FCF after 2015 3.00%
Present Value of Free Cash Flow 92,775,515,775$
Present Value of Terminal Value 591,471,343,253
NPV (Enterprise Value) 684,246,859,028$
Net Debt (416,341,000,000)
Equity 267,905,859,028
Total Diluted Shares Oustanding 3,243,000,000
Equity Value Per Share 82.61
Discounted Free Cash Flow Model
Table 8: Discounted Free Cash Flow Model

16
approximately 22% in its most recent fiscal year, a trend that is expected to continue to drive
sales up.37
Conclusion
Given that the expected trends in the greater retail industry are expected to fuel rapid
expansion of the e-commerce channel and stabilized growth in the brick-and-mortar channel,
Walmart’s omni-channel model and strategy are expected to provide the retail giant with
substantial growth opportunities. Moreover, Walmart’s existing footprint in China and
presence globally allow the firm to capitalize on future demographic changes given the rise of
China’s middle class. In line with these drivers and as evidenced above, Walmart’s intrinsic
value is greater than its current market value, further indicating that Walmart is the superior
investment choice.
37 (New York Times, 2015)
17
Works Cited A.T. Kearney. (2014). On Solid Ground: Brick and Mortar Is the Foundation of Omnichannel
Retailing. Retrieved from
https://www.atkearney.com/documents/10192/4683364/On+Solid+Ground.pdf/f96d82
ce-e40c-450d-97bb-884b017f4cd7 A.T. Kearney. (2015). Global Retail E-Commerce Keeps On Clicking. Retrieved from
https://www.atkearney.com/consumer-products-retail/e-commerce-index/full-report/-
/asset_publisher/87xbENNHPZ3D/content/global-retail-e-commerce-keeps-on-
clicking/10192?_101_INSTANCE_87xbENNHPZ3D_redirect=%2Fconsumer-
products-retail%2Fe-commerce-index AFK Insider. (2014). Sub-Saharan Africa Is Walmart’s New Battleground. Retrieved from
http://afkinsider.com/29296/walmarts-new-battleground-sub-saharan-africa/
Amazon. (2015). Retrieved from www.amazon.com Amazon. (2015). 10Q 2nd Quarter 2015. Brookings Institute. (2010). The New Global Middle Class:. Retrieved from
http://www.brookings.edu/~/media/research/files/papers/2010/3/china%20middle%20
class%20kharas/03_china_middle_class_kharas.pdf
Bureau of Economic Analysis. (2015). CCTV America. (2015). Walmart expands its scale in China in face of sales decline.
Retrieved from http://www.cctv-america.com/2015/05/19/walmart-to-expand-in-china
eMarketer. (2015). Retail Sales Worldwide Will Top $22 Trillion This Year. Retrieved from
Retail Sales Worldwide Will Top $22 Trillion This Year - See more at:
http://www.emarketer.com/Article.aspx?R=1011765#sthash.U8h45vzQ.dpuf Forbes. (2015). As Walmart Forecast Dips, Is It Also Losing The Low-Price Battle To
Amazon? Retrieved from http://www.forbes.com/sites/clareoconnor/2015/10/15/as-
walmart-forecast-dips-is-it-also-losing-the-low-price-battle-to-amazon/ Fortune. (2015). 500 Largest Companies. Retrieved from http://fortune.com/global500
Fortune. (2015). Humbled Amazon turns to rival Alibaba for help in China. Retrieved from
http://fortune.com/2015/03/06/humbled-amazon-turns-to-rival-alibaba-for-help-in-
china/ Harvard Business Review. (2012). What you Can Learn From Family Business. Retrieved
from https://hbr.org/2012/11/what-you-can-learn-from-family-business
IBIS World. (2015). Market Realist. (2015). Inherent Risks and Rewards in Walmart’s E-Commerce Business.
Retrieved from http://marketrealist.com/2015/10/inherent-risks-rewards-walmarts-e-
commerce-business/ McKinsey & Company. (2007). The Consumer Trap: Retailers Need to Adapt to Entice Fickle
Chinese Shoppers into Their Stores.
Mergent Online. (2015). MWPVL. (2015). Amazon Global Fulfillment Center Network. Retrieved from
http://www.mwpvl.com/html/amazon_com.html New York Times. (2015). Walmart, Lagging in Online Sales, Is Strengthening E-Commerce.
Retrieved from http://www.nytimes.com/2015/06/06/business/walmart-lagging-in-
online-sales-is-strengthening-e-commerce.html?_r=0
18
Reuters. (2015). Rare store sales data highlights Wal-Mart's China challenge. Retrieved
from http://www.reuters.com/article/2015/10/16/us-wal-mart-china-
idUSKCN0SA1O620151016#JWgIGqXKdtpMjFYY.97
Reuters. (2015). Wal-Mart to expand China store network by nearly a third after growth
stalls. Retrieved from http://www.reuters.com/article/2015/04/29/us-wal-mart-stores-
china-idUSKBN0NK02C20150429#Z30lDUgeO0ClGklg.99 The Atlanic. (2015). How Walmart Is Changing China. Retrieved from
http://www.theatlantic.com/magazine/archive/2011/12/how-walmart-is-changing-china/308709/
The Street. (2015). Wal-Mart Renews India Wholesale Expansion, Plans 50 New Stores by
2020. Retrieved from http://www.thestreet.com/story/13253722/1/wal-mart-renews-
india-wholesale-expansion-plans-50-new-stores-by-2020.html
Wall Street Journal. (2015). Econ Forecast. Retrieved from
http://projects.wsj.com/econforecast/ Wall Street Journal. (2015). Wal-Mart Says It Will Go Slow in China. Retrieved from
http://www.wsj.com/articles/wal-mart-to-open-115-stores-in-china-by-2017-
1430270579 Walmart. (2015). 10Q 2nd Quarter 2015.
Yahoo Finance. (2015). Yahoo Finance. Retrieved from http://finance.yahoo.com/