Sheng, Wong - North American Business Press
19
Innovation Capacity in China: An Analysis in a Global Context Shirley Ye Sheng Barry University Roman Wong Barry University The objective of this study is to identify the position of China’s innovation in the world. We discussed the major challenges China faces with respect to the sustainability of her outstanding economic growth. Using a canonical correlation analysis, we examined the major factors that are important to raise a country's innovation capacity, and evaluate China’s innovation level in terms of those innovation enabling factors. We also compared China's level of innovation with its potential competitors. To address major challenging issues, we make recommendations in regard of China’s policy making for enhancing those innovation enabling factor, hence, improving the innovation outputs. INTRODUCTION Innovation has long been regarded as an important element in creating sustainable competitive advantage for firms and even societies. Organizations need to innovate in response to changing customer demands and business environment and capitalize on opportunities offered by new technologies (Rowley et al., 2011; Yang et al., 2008; Cheung and Prendergast, 2006). China, as the fastest growing economy, has created huge amount of attention and business interaction with the rest of the world. With globalization and interconnected business community, innovation process today is more critical, collaborative, and global than ever. Prior studies so far have presented two schools of thoughts regarding the subject of innovativeness in China. One stream of literature that has presented a more critical perspective generally suggesting Chinese firms to have been laggard in being innovative and have largely relied on imitating the innovative ideas and technologies from the West (Swike et al., 2008; Johnson and Weiss, 2008). That stream of literature basically suggests that China is still lacking the propensity towards being proactive and original in innovation. Some literature even criticizes China for lacking the system and spirit of being innovative (Zhan and Renwei, 2003, cited in Johnson and Weiss, 2008). The other school of thought, on the other hand, presents a relatively positive perspective focusing more on China’s increasing capacity of being innovative. However, studies that present 88 International Journal of China Marketing vol. 3(1) 2012
Transcript of Sheng, Wong - North American Business Press

Innovation Capacity in China: An Analysis in a Global Context
Shirley Ye Sheng Barry University
Roman Wong
Barry University
The objective of this study is to identify the position of China’s innovation in the world. We discussed the major challenges China faces with respect to the sustainability of her outstanding economic growth. Using a canonical correlation analysis, we examined the major factors that are important to raise a country's innovation capacity, and evaluate China’s innovation level in terms of those innovation enabling factors. We also compared China's level of innovation with its potential competitors. To address major challenging issues, we make recommendations in regard of China’s policy making for enhancing those innovation enabling factor, hence, improving the innovation outputs. INTRODUCTION
Innovation has long been regarded as an important element in creating sustainable competitive advantage for firms and even societies. Organizations need to innovate in response to changing customer demands and business environment and capitalize on opportunities offered by new technologies (Rowley et al., 2011; Yang et al., 2008; Cheung and Prendergast, 2006). China, as the fastest growing economy, has created huge amount of attention and business interaction with the rest of the world. With globalization and interconnected business community, innovation process today is more critical, collaborative, and global than ever.
Prior studies so far have presented two schools of thoughts regarding the subject of innovativeness in China. One stream of literature that has presented a more critical perspective generally suggesting Chinese firms to have been laggard in being innovative and have largely relied on imitating the innovative ideas and technologies from the West (Swike et al., 2008; Johnson and Weiss, 2008). That stream of literature basically suggests that China is still lacking the propensity towards being proactive and original in innovation. Some literature even criticizes China for lacking the system and spirit of being innovative (Zhan and Renwei, 2003, cited in Johnson and Weiss, 2008).
The other school of thought, on the other hand, presents a relatively positive perspective focusing more on China’s increasing capacity of being innovative. However, studies that present
88 International Journal of China Marketing vol. 3(1) 2012

that school of thought concentrate mainly on the microscopic levels focusing on either the firm and industry level (Zhang et al., 2003; Ren et al., 2010; Rubera and Kirca, 2012) or the regional and provincial levels (Bai and Li, 2011; Wu, 2011) of innovation. Such a focus has left the subject of innovations from a broader country level unexamined. Research on China’s innovation potential, especially its innovation position compared to other countries, therefore, is limited.
Our objective for this current study is to fill in this gap by looking at the position of China’s innovation in a world spectrum. We examine the major factors that are important to raise a country's innovation capacity, and then evaluate China’s innovation level in terms of those innovation enabling factors. We also compare China's level of innovation with other countries that are China's potential competitors in terms of their future economic development. Finally, we make recommendations based on our analysis to China in regard of her policy making for enhancing those innovation enabling factors, hence, improving the innovation outputs.
In the following sessions, we first provide a brief review on prior studies exploring the topic of innovation, followed by an account of how previous research has classified different kinds of innovations. We then present the two schools of thoughts in regard of the innovation capacity in China. Subsequent to the introduction and background sections is the presentation of the methodology and data analysis we performed using the data extracted from INSEAD. At the end of the paper, we relate our findings in the data analysis to China's own development pattern and make recommendations to China's public administrative authorities. BACKGROUND Typologies of Innovation
The New Oxford American dictionary defines innovation as “make changes in something established, especially by introducing new methods.” However, the definitions and types of innovation described by different researchers in literature are much more varied. Boer and During (2001, p.84) define innovation as “creation of a new product-market-technology-organization combination”. Damanpour (1991, p.676) defined innovation as the “implementation of an idea – whether pertaining to a device, system, process, policy, program, or service – that is new to the organization at the time of adoption”. In our study, we adopt the definition used in OECD (2005) and define innovation as “the implantation of a new or significantly improved product (good or service), a new process, a new marketing method, or a new organizational method in business practices, workplace organization, or external relations” (OECD/EC, 2005, also known as the Oslo Manual 2005, cited in Global Innovation Index 2011 by INSEAD). In other words, innovation converts imagination and information into valuable knowledge and subsequently derives different or greater value and delivers significant benefits to individuals or organizations in the form of new or improved products, processes, or services.
An innovation can be new to the world, or new to a sector or market. When it is new to a market, it can be “perceived as new” instead of being totally new. For example, dish washer may not be an “innovation” for American consumers, however when it is newly introduced to an emerging market where dish washer has never been introduced, it may be regarded as an “innovation” for that specific market. An innovation can be disruptive or dynamic, where the focus is on its impact in addition to novelty. In order to have a clear view of different types of innovation, several typologies of innovation have been conducted in literature (e.g., Zaltman et al., 1973; Rowley et al., 2011). Table 1 summarized the major literature regarding the classifications of innovation typology based on Rowley et al.’s (2011) study.
International Journal of China Marketing vol. 3(1) 2012 89

TABLE 1 MAJOR INNOVATION TYPOLOGIES
Knight (1967) has identified four types of innovation, namely product and service innovation,
production process innovation, organizational structure innovation and people innovation. Product, service, and process innovation have been widely discussed in literature. People innovation in Knight’s (1967) study refers to the changes to people through altering personnel by hiring or dismissing and changes of beliefs or behavior through education. Although people innovation is not as frequently discussed by other researchers, strengthening innovation indeed begins with strengthening people. Innovation calls for more and better educated people, including employees, administrations, researchers, and even customers.
Another type of innovation is Binary Innovations. Binary (pair) types of innovation gained much attention during 1970s to 1990s. The following three pairs of innovation dichotomies are frequently discussed in literature (e.g., Daft, 1978; Damanpour, 1987; Cooper, 1998): product versus process innovation, technical versus administrative, and radical versus incremental innovation. The product-production dichotomy is related to whether the changes are about the offerings (products/service) or production operation. The product, service, and process innovation are related to technical innovation, while administrative innovations bring changes to the structure or administration of the organizations such as change of compensation system or hiring procedure. The incremental-radical dichotomy is based on the degree of change and dynamics of the innovation. Similar concept can be found in continuous and discontinuous technological changes (Porter, 1986), incremental vs. breakthrough innovations (Tushman and Anderson, 1986 cited in Innovationzen.com) and conservative vs. radical innovations (Abernathy and Clark, 1985 cited in Innovationzen.com).
90 International Journal of China Marketing vol. 3(1) 2012

Starting from late 1990s to twenty-first century, researchers have recognized a wider range of innovation types and emphasized the business system and marketing innovations in addition to product, process, and administrative innovation. Hovgaard and Hansen (2004) introduced business system innovation. Trott (2005) proposed the related concept of marketing innovation and Bessant and Tidd (2007) identified position innovation and paradigm innovation. Position innovation is highly related to marketing strategy through communication and branding. The basic approach to position innovation is not to create something new, but to change what is already in the mind of the customer. In other words, a position innovation changes the customer’s view or understanding the product (Kim and Mauborgne, 1999). Paradigm innovation, however, is associated with a significant shift in perceptions of what an organization is about and in what ways it comes up with new approaches to deal with situations and its external world. For example, with the launch of iPhone, iPad, and App stores, Apple Inc. is no longer being viewed as just a computer manufacturer. The paradigm of the Apple Inc. is expanded, and Apple is a computer, phone, entertainments, and even educational program provider. Literature of Innovation in China
During the last few decades, China has maintained an annual growth of over 9%. This outstanding growth has largely been attributed to China’s industry modernization. As mentioned earlier, one stream of literature has already shed light on China's innovation outcomes derived from her industry modernization.
Such literature generally consented that China had gained a steady improvement in its innovation inputs, outputs, and innovation efficiency in the past decades. Statistics show that China’s investment in R&D (research and development) has increased from $40.5 billion PPP in 2000 to $153.7 billion PPP in 2011(Battelle.org). China’s R&D growth over the past 15 years has consistently exceeded 10%. China's growth in R&D has been forecasted to be 11.5% per year while U.S. would maintain an annual growth rate in R&D at about 4.0% for the next 13 years (Battelle.org). Mu and Fan (2011) measured 38 countries’ national innovation capacity (NIC) and concluded that China’s ranking of NIC among those 38 countries has moved forward from the 28th in 2000 to the 10th in 2008. Johnson and Weiss’s (2008) model describes that China has moved from a pure imitation stage (direct copying) to what the authors refer as "incremental innovation stage" (modified offering), and that China is heading towards the radical innovation stage (new to the world offering). They further claim that if China stays in the imitation and incremental innovation stage, she will not be able to further its economic progress for too long. Wu’s (2011) study shows that infrastructure development, participation of foreign capital, government spending, development of private sector and increase in human capital all have played a significantly positive role in innovation and economic growth in China.
While gaining significant improvement and successes on her way towards being a country of innovation, China is facing some major challenges according to the literature. First, as the role of Chinese governments at all levels is pivotal in facilitating and boosting innovation in China, the implementation of the central policy for innovation is neither effective nor efficient. Bai and Li (2011) evaluate the efficiency of China’s regional innovation system and found that the provincial governments have not effectively carried out their assigned roles. It is suggested that government should provide and secure an innovation-friendly business environment through making courageous policy (such as protective innovation policy) for the promotion of more creative innovations, and a freer market as well.
International Journal of China Marketing vol. 3(1) 2012 91

The second challenge faced by China is the call for educational reforms to develop a more liberal educational system (Johnson and Weiss, 2008). Johnson and Weiss’ (2008) conceptual stage model demonstrated the important linkage between creative educations with radical innovation. China needs to provide a more liberal education, in mode and in contents, to the school children in order for them to develop a creative mind. Such a creative mind is instrumental for original and radical innovations.
The third challenge that China’s business and government have to face is to transit from the current export based economy to one that is more sustainable; one that is likely to be more knowledge-intensive. According to the State Council document released in the beginning of year 2006, the Medium- and Long-Term Plan for National Science and Technology Development (2006-2020) proposed that China would become an innovation-driven nation by 2020. Chinese government recognizes that the export-led, manufacturing-based pattern of economic development would not be indefinitely sustainable (Dodgson and Xue, 2009; Johnson and Weiss, 2008). The 2008 US subprime credit crisis and the subsequently wide-spreading recession in the States and Europe have caused the demands for Chinese exports to decline (Wu, 2011). Furthermore, the increasingly serious depletion in natural resources, the rising cost of labor and raw materials, and the deterioration of environmental conditions are threats to the sustainability of rapid economic growth in China. Policy-makers should be keen at steering the country towards an alternative growth model that is more knowledge-intensive and high-tech based. The main challenge here is how China’s industries can change the business model from one of imitation to one that is truly innovative. METHODOLOGY
Our objective for this study is two-fold: first, to evaluate China of her relative capacity and capability to be innovative as a nation compared to others; and, second, to identify possible future directions, towards which, China may consider formulating her public policies for the promotion of innovation in the country. We need a research tool that would allow us to develop (a) an objective measurement of the outcomes of a nation’s innovativeness, and (b) a parsimonious set of factors that are most critical for a nation to promote innovation. Such a research tool is necessary for the accomplishment of our research objective.
In the following paragraphs of this section, we will first give a brief background of the Global Innovation Index, and then provide a discussion on our data analysis procedure to guide our identification of a parsimonious set of factors that are critical for promoting innovation. Global Innovation Index
Recognizing innovation’s key role of being a major driver for economic growth and prosperity, INSEAD and the World Intellectual Property Organization (WIPO) since 2007 co-publish the yearly Global Innovation Index, a comprehensive study on 125 nations and economic entities with respect to their relative capacity of promoting innovation. A conceptual framework was developed in the GII study seeing each subject nation (or economic entity) as a system converting input required for innovation (the “input pillars”) to the innovation output (the “output pillars”). The GII framework consists of altogether seven scales, five for measuring the innovation inputs of a subject nation, and two scales for the measurement of the subject nation’s innovation outputs. A total of eighty indicators covering the areas of social, political, intellectual, and economic areas are included in the seven scales. The five input pillars embrace a total of
92 International Journal of China Marketing vol. 3(1) 2012

seventy-one indicators to capture the pulses of an economy in these areas: (1) institutions, (2) human capital and research, (3) infrastructure, (4) market sophistication, and (5) business sophistication; while the two output pillars capture innovation performance in two aspects: (1) scientific outputs and (2) creative outputs. Details of all the constructs and subscales that are used by GII are listed in figure 1.
In this current study, we use the GII conceptual framework to provide us with a comprehensive set of factors that are relevant in shaping and the development of a nation’s innovation. In addition, the framework includes not only the innovation input factors, but also multiple measurements of the innovation outputs as well. The availability of objective output measures provides a reference so that discriminating analysis can be done to single out the more powerful predicting indicators in the five input pillars. Furthermore, GII covers measures from both the more affluent developed nations as well as those that are still emerging. The well representative sample set of 125 nations and economic entities, which account for 93.2% of the world’s population and 98.0% of the world’s GDP, would allow a more stable analytical result to be derived.
A main reason for narrowing down the number of innovation input factors is that China, like many other emerging states, may not be able to devise a policy that can cover all the deficient areas due to limitations of resources or implementation. Therefore, ranking the various input pillars in terms of their potential impacts on innovation outputs serves a very pragmatic purpose.
FIGURE 1 THE CONCEPTUAL FRAMEWORK OF THE GLOBAL INNOVATION INDEX 2011
Source: The Global Innovation Index 2011, INSEAD Data
The quantitative analysis for this current study was based on secondary data obtained from the 2011 Global Innovation Index of INSEAD in Fontainebleau, France. Major data sources for GII were from the World Bank statistic division (World Development Indicators), World Bank, and International Monetary Fund. These sources are considered reliable with uniformed
International Journal of China Marketing vol. 3(1) 2012 93

terminology and methodology, and they are frequently used in the business studies (Cavusgil et al., 2004; Sheng and Mullen, 2011). For our study, we used the open-source programming language R to perform 'Web-scraping' to retrieve a data set of 107 measures of 124 countries or economies. Data Analysis
The objective for the data analysis in the current study is to obtain insights into the interrelationships between the innovation input scales and the innovation output scales. In the current study, we have a set of five metric scales for the innovation inputs as the independent variables and two for the innovation outputs as the criterion variables. Since ordinary regression analysis or stepwise regression analysis handle only a single criterion variable; therefore, these statistical techniques do not provide an accommodation for the multiple criterion variables in our study. As such, we use the canonical correlation analysis method to analyze the data we retrieved from the GII study. Canonical Correlation Analysis
Canonical correlation analysis (CCA) is a multivariate statistical model aimed at studying the interrelationships among sets of multiple dependent variables and multiple independent variables. It is generally accepted to be the most appropriate and powerful multivariate approach (Hair et. al 1998). CCA develops a number of orthogonal canonical functions that maximize the correlation between the linear composites, also known as canonical variates, which are sets of dependent and independent variables. Each canonical function is actually based on the correlation between two canonical variates, one variate for the dependent variables and another for the independent variables. Those variates are derived to maximize the correlation between them. In addition, CCA generates a number of canonical functions (pairs of canonical variates). The number of functions generated each time is equal to the number of variables in the smaller set of variables. The CCA Model
In the current study, our objective is to evaluate the strength of the associations among the innovation input scales (the independent variables) and the innovation output scales (the dependent variables). Due to the relatively small data set (only 125 data points), in our preliminary analysis we included only the main scales and left the sub-scales out of the analysis. The set of independent variables includes the five scales: INSTIT, HCR, INFRA, MKTSOPH, and BUSSOPH. The set of dependent variables includes the two innovation output scales of SCIOP and CREAOP.
The designation of the variables includes two metric-dependent and five metric-independent variables. The five variables resulted in a 25-to-1 ratio of observations to variables, exceeding the guideline of 10 observations per variable.
The canonical correlation analysis in our study was restricted to deriving two canonical functions as the dependent variable set contained only two variables, SCIOP and CREAOP. To determine if both canonical functions to include in the interpretation stage, we focused on the level of statistical significance, the practical significance of the canonical correlation, and the redundancy indices for each variate.
The first statistical significance test is for the canonical correlations of each of the two canonical functions. Only the first function was tested to be statistically significant (see Table 2).
94 International Journal of China Marketing vol. 3(1) 2012

In addition to tests of each canonical function separately, multivariate tests of both functions simultaneously are also performed. The test statistics employed are Pillai’s criterion, Hotelling’s trace, Wilks’ lambda, and Roy’s gcr. Table 3 also details the multivariate test statistics, which all indicate that the canonical functions, taken collectively, are statistically significant at the .000 level. In addition to statistical significance, the first canonical correlation was of sufficient size to be deemed practically significant. The next step was to perform redundancy analyses on both canonical functions.
TABLE 2 MEASURES OF OVERALL MODEL FIT FOR CANONICAL CORRELATION
ANALYSIS
Can. Function F Canon. Corr. Sq. Corr
p
1 15.644 0.87 0.75 0.000
2 1.480 0.22 0.05 0.213
TABLE 3 MULTIVARIATE TESTS OF SIGNIFICANCE
Test Name Value Approx. F Sig. of F Pillais 0.79727 15.64391 0.000 Hotellings 3.04232 35.29089 0.000 Wilks 0.23853 24.5122 0.000 Roys 0.74951
Redundancy Analysis
What the squared canonical correlations (roots) provide is an estimate of the shared variance between the canonical variates rather than that from the sets of dependent and independent variables (Alpert and Peterson 1972). The interpretation of the canonical correlations can be misleading. This is particularly so when the roots are considerably larger than previously reported bivariate and multiple correlation coefficients. The researcher may be tempted to assume that the canonical analysis has uncovered substantial relationships of conceptual and practical significance (Hair et. al 1998). To overcome this issue, Steward and Love (1968) proposed the calculation of the redundancy index as a summary measure of the ability of a set of independent variables (taken as a set) to explain variation in the dependent variables (taken one at a time).
In the earlier statistical significance tests, it is obvious that only the first of the two functions is statistically significant and thus should be accepted. In Table 4 we summarized the computation of the redundancy indices for the independent and dependent variates of the first function.
International Journal of China Marketing vol. 3(1) 2012 95

TABLE 4 CALCULATION OF THE REDUNDANCY INDICES FOR THE FIRST CANONICAL
FUNCTION
Predictor Variable Canonical Loading
Sq. Can. Loading
Avg. Sq. Loading
Sq. Can. Corr.
Redundancy Index
INSTIT 0.8185 0.6699 HCR 0.9008 0.8115 INFRA 0.9455 0.8940 MKTSOPH 0.8729 0.7620 BUSSOPH 0.8794 0.7733 Predictor Variate
3.9107 0.7821 0.7495 0.5862
Criterion Variable SCIOP 0.9285 0.8621
CREAOP 0.8239 0.6788 Criterion Variate
1.5409 0.7705 0.7495 0.5775
The redundancy index for the criterion variables is 0.5775. That is, approximately 58% of the
variances in the criterion variables can be explained by the predictor variate. As there have not been any generally accepted guidelines to judge what level, above which, a redundancy index is supposed to be acceptable, one needs to make his judgment in accordance to the context of the study. In the current study, as the input and output scales we use are at their aggregate levels, we consider the redundancy indices for both of the dependent and independent variates to be substantial (0.576 and 0.586 respectively). Interpretation of the Canonical Variates
Since the canonical relationship deemed statistically significant, magnitude of the canonical root and the redundancy indices acceptable, we proceed to making substantive interpretations of the CCA results.
TABLE 5 CANONICAL STRUCTURE MATRIX (CANONICAL LOADING)
Canonical Functions Predictor Variable 1 2 INSTIT 0.8185 0.16702 HCR 0.9008 -0.26503 INFRA 0.9455 0.2542 MKTSOPH 0.8729 0.1579 BUSSOPH 0.8794 -0.3037 Criterion Variable
SCIOP 0.9285 -0.3713 CREAOP 0.8239 0.5667
The CCA results are summarized in the Canonical Structure Matrix (Table 5). The canonical
structure matrix reveals the correlations between each variable and its own variate in the canonical functions. It can be said that these correlations are like the factor loadings of the variables on each discriminant function. It allows the comparison of the variables in terms of
96 International Journal of China Marketing vol. 3(1) 2012

their correlations and see how closely a variable is related to each function. Generally, any variable with a correlation of 0.3 or more is considered to be significant.
Recall the results of the significance tests in the earlier paragraphs. Since only the first canonical function is statistically significant, we interpret only that canonical function and not the second one. According to the loading of the variables, all of the independent and dependent variables have significant contribution to their correspondent variates in the canonical function. Based on their loading values, we can rank the importance of the independent variables in the following orders: INFRA, HCR, BUSSOPH, MKTSOPH, and INSTIT. That is to say that the infrastructure variable (INFRA) contributes most highly in explaining the variances in the dependent variate in the canonical function. In terms of the dependent variables, it appears that the variances in the scientific outputs variable (SCIOP) are slightly more ready to be explained by the independent variate than the other innovation outputs (CREAOP). Subscale Level Analysis
In this section, we discuss our performance of the CCA to the GII data set at the sub-scale level. The objective we aim at accomplishing is to develop a more insightful understanding of the dimensions in the five innovation input scales that are actually contributing to the variances in the innovation outputs.
There are three sub-scales for each of the five innovation input scales, altogether fifteen of them in total. Table 6 summarizes the structural loadings on the predictor and criterion variables for the two canonical functions. As we have concluded earlier that only the first canonical function would have captured most of the variance; therefore, we interpret only the first canonical function in the sub-scale level CCA.
TABLE 6 CANONICAL STRUCTURE MATRIX (CANONICAL LOADING)
Predictor Variable 1 2 POLIENVI 0.7659 0.3082 REGENVIR 0.7911 0.1989 BUSENVIR 0.4496 -0.2779 EDU 0.6808 0.1484 GRADEDU 0.6019 -0.0775 R&D 0.8598 -0.1790 ICT 0.9249 0.2108 ENGERGY 0.5061 0.2037 INFRAGEN 0.4182 0.0085 CREDIT 0.8079 0.1731 INVEST 0.6042 -0.1021 TRADECOM 0.5671 0.2805 KWORKER 0.8208 0.0217 INNOLINK 0.6093 0.0915 KABSORP 0.6355 -0.2854 Criterion Variable
SCIOP 0.9389 -0.3443 CREAOP 0.8072 0.5903
International Journal of China Marketing vol. 3(1) 2012 97
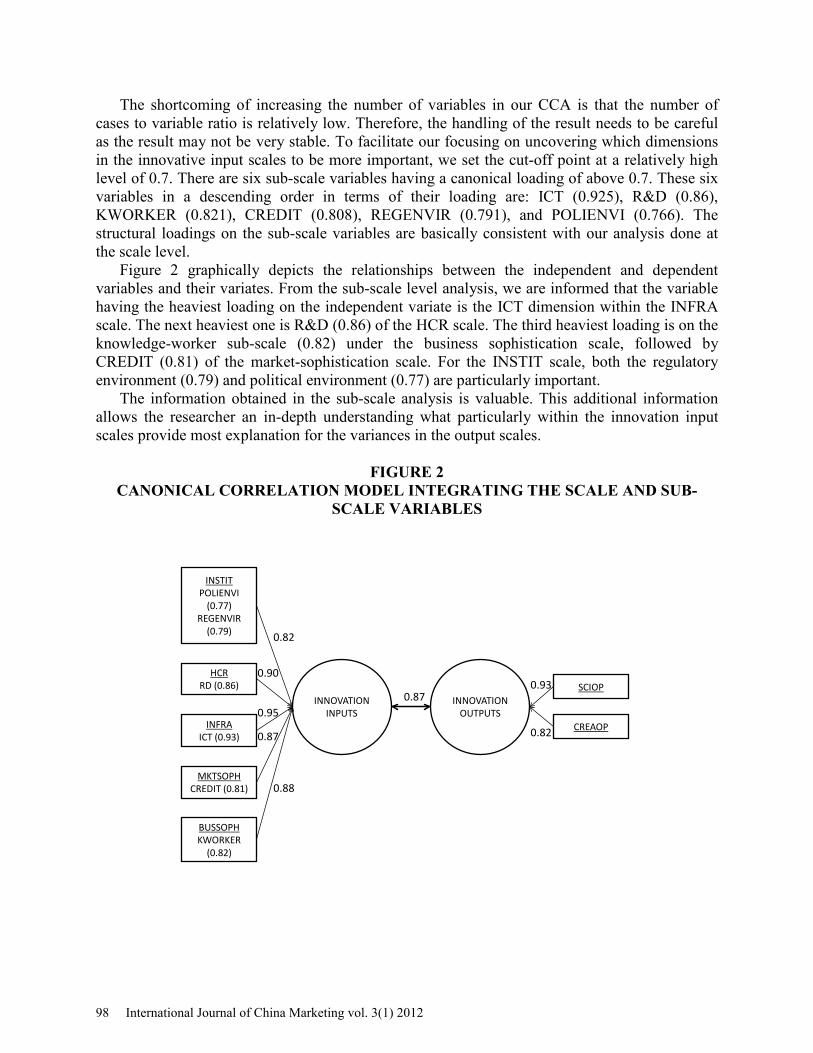
The shortcoming of increasing the number of variables in our CCA is that the number of cases to variable ratio is relatively low. Therefore, the handling of the result needs to be careful as the result may not be very stable. To facilitate our focusing on uncovering which dimensions in the innovative input scales to be more important, we set the cut-off point at a relatively high level of 0.7. There are six sub-scale variables having a canonical loading of above 0.7. These six variables in a descending order in terms of their loading are: ICT (0.925), R&D (0.86), KWORKER (0.821), CREDIT (0.808), REGENVIR (0.791), and POLIENVI (0.766). The structural loadings on the sub-scale variables are basically consistent with our analysis done at the scale level.
Figure 2 graphically depicts the relationships between the independent and dependent variables and their variates. From the sub-scale level analysis, we are informed that the variable having the heaviest loading on the independent variate is the ICT dimension within the INFRA scale. The next heaviest one is R&D (0.86) of the HCR scale. The third heaviest loading is on the knowledge-worker sub-scale (0.82) under the business sophistication scale, followed by CREDIT (0.81) of the market-sophistication scale. For the INSTIT scale, both the regulatory environment (0.79) and political environment (0.77) are particularly important.
The information obtained in the sub-scale analysis is valuable. This additional information allows the researcher an in-depth understanding what particularly within the innovation input scales provide most explanation for the variances in the output scales.
FIGURE 2 CANONICAL CORRELATION MODEL INTEGRATING THE SCALE AND SUB-
SCALE VARIABLES
INSTITPOLIENVI
(0.77)REGENVIR
(0.79)
HCRRD (0.86)
INFRAICT (0.93)
MKTSOPHCREDIT (0.81)
BUSSOPHKWORKER
(0.82)
SCIOP
CREAOP
INNOVATION OUTPUTS
INNOVATION INPUTS
0.82
0.90
0.95
0.87
0.88
0.93
0.82
0.87
98 International Journal of China Marketing vol. 3(1) 2012
DISCUSSION
In this section, we provide discussions, first, on China's global position within the GII framework; second, on the implications for China in regard of policy making for the promotion of innovation outputs; and, finally, on the contributions and limitations of this study. Innovation Position of China
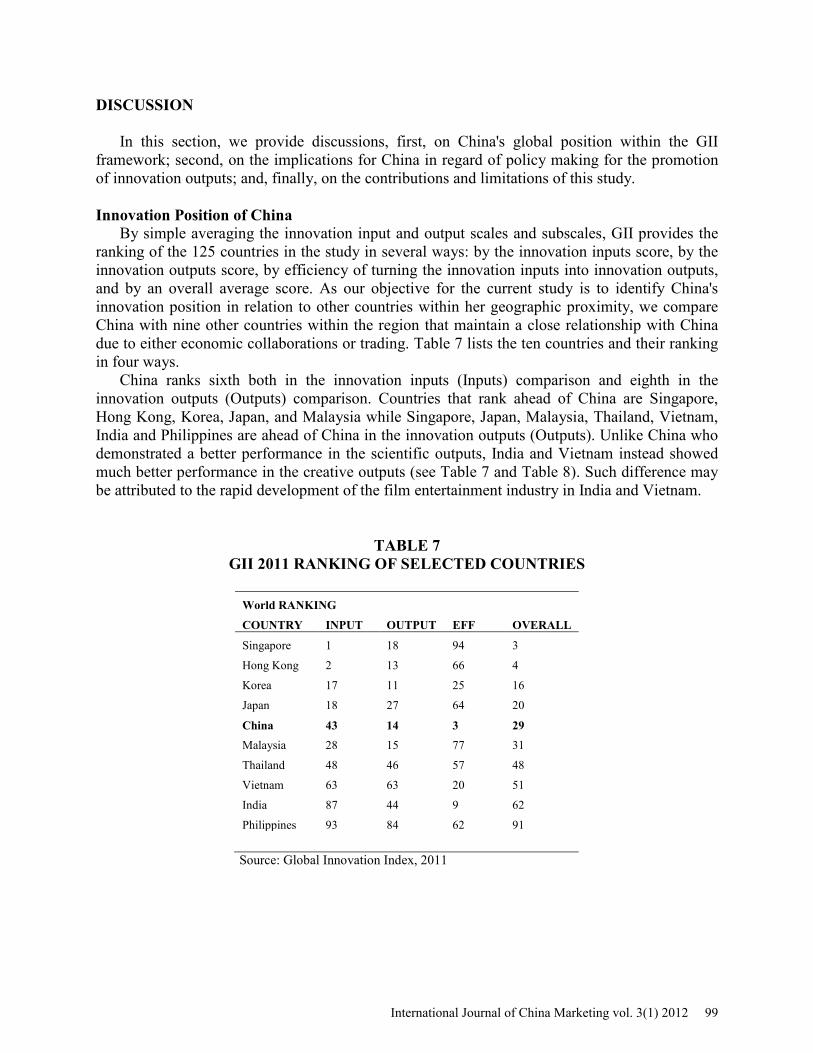
By simple averaging the innovation input and output scales and subscales, GII provides the ranking of the 125 countries in the study in several ways: by the innovation inputs score, by the innovation outputs score, by efficiency of turning the innovation inputs into innovation outputs, and by an overall average score. As our objective for the current study is to identify China's innovation position in relation to other countries within her geographic proximity, we compare China with nine other countries within the region that maintain a close relationship with China due to either economic collaborations or trading. Table 7 lists the ten countries and their ranking in four ways.
China ranks sixth both in the innovation inputs (Inputs) comparison and eighth in the innovation outputs (Outputs) comparison. Countries that rank ahead of China are Singapore, Hong Kong, Korea, Japan, and Malaysia while Singapore, Japan, Malaysia, Thailand, Vietnam, India and Philippines are ahead of China in the innovation outputs (Outputs). Unlike China who demonstrated a better performance in the scientific outputs, India and Vietnam instead showed much better performance in the creative outputs (see Table 7 and Table 8). Such difference may be attributed to the rapid development of the film entertainment industry in India and Vietnam.
TABLE 7 GII 2011 RANKING OF SELECTED COUNTRIES
World RANKING
COUNTRY INPUT OUTPUT EFF OVERALL
Singapore 1 18 94 3
Hong Kong 2 13 66 4
Korea 17 11 25 16
Japan 18 27 64 20
China 43 14 3 29 Malaysia 28 15 77 31
Thailand 48 46 57 48
Vietnam 63 63 20 51
India 87 44 9 62
Philippines 93 84 62 91
Source: Global Innovation Index, 2011
International Journal of China Marketing vol. 3(1) 2012 99

TABLE 8 INNOVATION INPUTS AND OUTPUTS PERFORMANCE OF SELECTED
COUNTRIES IN COMPETING POSITIONS TO CHINA
INSTIT HCR INFRA MRTSOPH BUSSOPH Innovation Outputs
COUNTRY POLIENVI (6)*
REGENVIR (5)*
R&D (2)*
ICT (1)*
CREDIT (4)*
KWORKER (3)* SCIOP CREAOP
Singapore 80.00 97.50 60.20 69.00 65.10 87.30 48.90 41.40
Hong Kong 88.60 96.70 32.10 70.20 78.00 65.60 38.10 57.60
Korea 73.90 73.30 58.40 81.00 66.30 57.70 53.70 42.20
Japan 89.20 84.40 65.10 68.80 79.70 82.30 49.80 32.80
China 32.80 53.50 42.30 28.40 49.10 64.80 52.70 40.90 Malaysia 57.50 71.70 26.40 44.20 58.00 69.00 30.40 39.90
Thailand 38.00 67.30 18.50 21.30 44.70 52.70 23.90 39.90
Vietnam 39.20 50.50 17.80 22.10 64.30 26.00 25.30 41.30
India 42.20 56.60 38.80 16.30 38.20 24.40 24.80 40.30
Philippines 32.50 52.90 11.50 22.30 21.00 46.70 22.30 25.70 * The number in the parentheses represents the ranked importance of the sub-scale in terms of its structural loading in the canonical function.
Table 8 summarizes the Inputs and Outputs subscale scores for the ten countries. Based on
their scores, we computed the relative ranking of these ten countries and summarize it in Table 9. For the ICT sub-scale, China ranks the 6th among the ten countries. For the second most significant Inputs sub-scale, R&D, China did relatively better ranking in the fourth position of the ten countries. For the third and fourth most important Inputs sub-scales, KWORKER and CREDIT, China ranks the fifth and the seventh, respectively.
TABLE 9 INNOVATION INPUTS AND OUTPUTS PERFORMANCE RANKING OF SELECTED
COUNTRIES IN COMPETING POSITION WITH CHINA
INSTIT HCR INFRA MRTSOPH BUSSOPH Innovation Output
COUNTRY POLIENVI (6)*
REGENVIR (5)*
R&D (2)*
ICT (1)*
CREDIT (4)*
KWORKER (3)* SCIOP CREAOP
Singapore 3.00 1.00 2.00 3.00 4.00 1.00 4.00 3.00
Hong Kong 2.00 2.00 6.00 2.00 2.00 4.00 5.00 1.00
Korea 4.00 4.00 3.00 1.00 3.00 6.00 1.00 2.00
Japan 1.00 3.00 1.00 4.00 1.00 2.00 3.00 9.00
China 9.00 8.00 4.00 6.00 7.00 5.00 2.00 5.00 Malaysia 5.00 5.00 7.00 5.00 6.00 3.00 6.00 7.00
Thailand 8.00 6.00 8.00 9.00 8.00 7.00 9.00 7.00
Vietnam 7.00 10.00 9.00 8.00 5.00 9.00 7.00 4.00
India 6.00 7.00 5.00 10.00 9.00 10.00 8.00 6.00
Philippines 10.00 9.00 10.00 7.00 10.00 8.00 10.00 10.00 * The number in the parentheses represents the ranked importance of the sub-scale in terms of its structural loading in the canonical function.
100 International Journal of China Marketing vol. 3(1) 2012

Implications of the Ranking on China's Innovation Policy Despite the fact that China ranks only the sixth in providing an innovation enabling
environment, China ranks first in being efficient in turning innovation inputs into outputs (Efficiency). Countries that rank higher than China in Inputs and Outputs all rank much lower than China in the Efficiency ranking. It is interesting to note that countries that rank second and third are India and Vietnam, respectively (see Table 7). All of these three countries, China; India; and Vietnam, rank relatively low in terms of Inputs and Outputs. Zhu and Xu (2006) have found that the R&D efficiency of Chinese high-tech industries has been growing gradually and steadily. They also found in their study that R&D efficiency is positively related with firm size and market competition. In addition, the study pointed out that foreign investment enterprises had played more important role in enhancing R&D efficiency than state owned enterprises. Based on these findings, the China public administrators should consider a policy to selectively accept foreign investments that will bring in technological capabilities matching Chinese future innovation needs. For a long time, China has emphasized the importance of 'self-reliance' in developing her technological and innovative capability. Foreign investment and importation, however, provides an efficient alternative for hiking up the country's technological know-how, which will help China's development model to become more knowledge-intensive.
The implications of this relative ranking for China in terms of formulating future innovation policy are multiple folded. First, China should encourage ICT investments to promote the availability and ease of use of ICT, expediting the digitization of more government processes. In terms of promoting citizens' participation in ICT use and processes, speeding up the movement towards e-government is one effective way to boost citizen participation in digitized and streamlined public processes. The lessons we have learned about benefits of e-government include: (a) a government of increased efficiency, which will have a positive impact on increasing the quality of civil services, (b) increased public spending on the ICT related infrastructure, which will contribute to the build-up of innovative capacity, (c) an increased level of human capital quality because of more public participation in public work and information processes, and (d) the increased tendency of the economy to be reshaped into a more information-based one (Jaeger and Thompson 2003, Kumar and Best 2006). All these benefits are promoters of a more innovation-embracing economy and a freer market.
In terms of the second key innovation input factor, R&D, China ranks the fourth after Japan, Singapore and Korea. However, the difference in their measuring indices is much larger than the relative ranking may suggest. As the quality and quantity of the R&D capability and output have a tremendous impact, China should continue to focus on promoting this aspect in her public policy formulation such as in the areas of fiscal and education.
On the KWORKER sub-scale under business sophistication, China's performance was after Singapore, Japan, Malaysia, and Hong Kong ranking fifth. As the accumulation of human capital is an indispensable condition for innovation to take place, businesses foster their productivity, competitiveness, and innovation potential with the employment of highly qualified professionals and technicians. Therefore, the Chinese government should, through the use of encouraging tax legislation, support businesses to invest in staff professional development activities and directly involve in R&D.
The recent global financial crisis has demonstrated how critical it is for a business to attain the ability of credit, investment funds, and access to international markets in order to stay prosperous. China ranks the seventh on the fourth important Inputs factor, the CREDIT subscale. Numerous studies have pointed out that a lot of SMEs in China have difficulties in obtaining the
International Journal of China Marketing vol. 3(1) 2012 101

necessary finances for their operations. The role that government can play is to operate more SME financing and micro-financing programs. CONTRIBUTION AND LIMITATIONS OF CURRENT STUDY
The current study contributes to the existing literature in several ways. First, this study provides an evaluation and a platform for discussions on the readiness, or the lack of such, of China for embracing and enabling innovations in the country as a whole. Second, drawing on INSEAD’s GII conceptual framework and a rich set of secondary data, we were able to rank a large set of innovation enabling factors based on the correlations between these factors and the innovation outcome measurements. Third, based on the ranking of the innovation input factors, we come up with recommends for China in regard of the future directions the government may take in formulating public policy that will promote an innovation friendly environment.
Nonetheless, this current study is not without limitations. Two of the more conspicuous limitations are: (a) the limitation in sample size, and (b) the lack of a clear connection between the innovation output measurement and the overall well being and economic prosperity of a country or economic entity. Regarding the first limitation, as the number of data points included in the data set is only 124, while the number of indicators included in the conceptual framework is eighty. The analysis is destined to have to sacrifice the opportunity of analyzing the data at the indicator level (i.e. the most detailed level of measurement) as our study being restricted for the same reason. In the future, revisions must be done to the data collection, such as including longitudinal data, in order to increase the number of data points.
With respect to the second limitation, future studies must include economic measures in the outcome measurement as the focus of the outcome measurement in the current study focuses only on the quantity of the outputs. Such a measurement neglects the impact of specific innovation outcomes may have on an economy’s overall well being. Therefore, it does not provide a clear and direct connection to link the two output pillars to economic outcomes or prosperity. CONCLUSION
Driven by an export-oriented economic development pattern, China has gained great
progresses in terms of innovativeness and technological advancement. Researchers generally recognize that China has gradually migrated from a 'piracy' mode to an incremental innovation mode. This change more or less has reflected on INSEAD's GII ranking: China's ranking in the Global Innovation Index improved from the 43th in 2010 to the 29th in 2011. However, China still has to face with three major challenges: policy formulation and implementation; education system reforms to embrace a more liberal education model to encourage the germination of a creative thinking generation; and transcending from a manufacturing and export based economic development pattern to one that is more knowledge intensive and innovative.
To obtain insights into the interrelationships between the various innovation inputs and the outputs, we performed a canonical correlation analysis at the broader level on the five Innovation Inputs and the two Innovation Outputs. Our objective is to evaluate the strength of the associations among the innovation input scales (the independent variables) and the innovation output scales (the dependent variables). Due to the relatively small data set (only 125 data points), in our preliminary analysis we included only the main scales and left the sub-scales out of the
102 International Journal of China Marketing vol. 3(1) 2012

analysis. The data analysis results show that the infrastructure variable (INFRA) contributes most highly in explaining the variances in the differences in the innovation outputs.
In order to develop a further understanding of the specific dimensions in the five innovation input scales have actually contributed to the explanation of the variances in the innovation outputs, we performed another canonical correlation analysis at a more refined level to the subscales of the Inputs and Outputs. Our subscale level analysis indicates that the ICT subscale of infrastructure scale, R&D of the human capital resources, knowledge workers of the business sophistication scale, and the credit subscale of the market sophistication scale contribute most to explain the differences in the innovation outputs.
Based on the findings from the subscale level analysis of the data collected by INSEAD, we make several suggestions to the policy making authorities of China to enhance the Inputs factors. To address the issues presented in the three challenges, first, we recommend public administrators to continue considering a policy to selectively accept foreign investments that will bring in technological capabilities matching China’s future innovation needs. Second, China should encourage ICT investments to promote the availability and ease of use of ICT, and speed up the digitization of more government processes. In terms of promoting citizens' participation in ICT use and processes, China should speed up the movement towards e-government for the effective expansion of citizen participation in digitized and streamlined public processes. In addition, China should focus on reforming her education models and contents for the incubation of creative education. Through tax legislation and public policy formulation, Chinese government needs to provide stronger supports for businesses to invest in human resources development and R&D. Finally, as availability of credit to the private sector has been identified to be a key component in market sophistication, the Chinese government needs to be more considerate and flexible in formulating its fiscal policy to operate more SME financing and micro-financing programs. REFERENCES Abernathy, W., & Clark, K. B. (1985). Mapping the Winds of Creative Destruction. Research Policy, 14, 3-22. Alpert, M. I., & Peterson, R. A. (1972). On the Interpretation of Canonical Analysis. Journal of Marketing Research, 9 (May), 187. Bai, Junhong & Li, Jing (2011). Regional Innovation Efficiency in China: the Role of Local Government. Innovation: Management, Policy, & Practice. 13 (2), 142 - 153. www.battelle.org, accessed in January, 2012. Bessant, J. & Tidd, J. (2007), Innovation and Entrepreneurship, JohnWiley & Sons, Chichester. Boer, H. & During, W. E. (2001). Innovation, What Innovation? A Comparison Between Product, Process and Organizational Innovation, International Journal of Technology Management, 22 (1-3), 83-107.
International Journal of China Marketing vol. 3(1) 2012 103
Cavusgil, S.T., Kiyak, T., & Yeniyurt, S. (2004). Complementary Approaches to Preliminary Foreign Market Assessment: Country Clustering and Country Ranking, Industrial Marketing Management, 33 (7), 607-617. Cheung,Wah-Leung, & Prendergast, G. P. (2006). Exploring the Materialism and Conformity Motivations of Chinese Pirated Product Buyers. Journal of International Consumer Marketing, 18(3), 7-31. Cooper, J. R. (1998). A multidimensional Approach to the Adoption of Innovation. Management Decision, 36 (8), 493-502. Daft, R. L. (1978). A Dual-core Model of Organizational Innovation. Academy of Management Journal, 21 (2), 193-210. Damanpour, F. (1987). The Adoption of Technological, Administrative, and Ancillary Innovations: Impact of Organizational Factors, Journal of Management, 13 (4), 675-688. Damanpour, F. (1991). Organizational Innovation: a Meta-analysis of Effects of Determinants and Moderators. Academy of Management Journal, 34 (3), 555-590. Dodgson, M., & Xue, L. (2009). Editorial: Innovation in China. Innovation: Management Policy & Practice, 11 (1), 2-5. The Global Innovation Index 2011: Accelerating Growth and Development, INSEAD, edited by Aoumitra Dutta, downloaded at www.globalinnovationindex.org. Hair, Jr., Joseph, F., Anderson, R. E., Tatham, R. L., & Black, W. C. (1998). Multivariate Data Analysis, 5th edition. Prentice Hall. Hovgaard, A., & Hansen, E. (2004). Innovativeness in the Forest Products Industry. Forest Products Journal, 54 (1), 26-33. http://innovationzen.com/blog/2006/08/04/innovation-management-theory-part-2/, accessed in January, 2012. Jaeger, P. T., & Thompson, K. M. (2003). E-government Around the World: Lessons, Challenges, and Future Directions. Government Information Quarterly, 20, 389–394. Johnson, W. H. A., & Weiss, J. W. (2008). A Stage Model of Education and Innovation Type in China, the Paradox of the Dragon. Journal of Technology Management in China, 3 (1), 66-81. Kim, W. C., & Mauborgne, R. (1999). Creating New Market Space: A Systematic Approach to Value Innovation Can Help Companies Break Free from the Competitive Pack. Harvard Business Review, (January-February), 83-93.
104 International Journal of China Marketing vol. 3(1) 2012

Knight, K. E. (1967). A Descriptive Model of the Intra-firm Innovation Process, The Journal of Business, 40 (4), 478-496. Kumar, R., & Best, M. L. (2006) Impact and Sustainability of E-Government Services in Developing Countries: Lessons Learned from Tamil Nadu, India, The Information Society, 22 (1), 1–12. Mu, R., & Fan, Y. (2011). Framework for Building National Innovation Capacity in China. Journal of Chinese Economic and Business Studies, 9(4), 317-327. Porter, M. E. (1986). Competition in Global Industries, Boston: Harvard Business School Press. Ren, L., Xue, G., & Krabbendam, K. (2010). Sustainable Competitive Advantage and Marketing Innovation within Firms: A pragmatic Approach for Chinese Firms, Management Research Review, 33 (1), 79-89. Rowley, J., Baregheh, A., & Sambrook, S. (2011). Towards an Innovation-type Mapping Tool, Management Decision, 49 (1), 73-86. Rubera, G., & Kirca, A. H. (2012). Firm Innovativeness and Its Performance Outcomes: A Meta-analytic Review and Theoretical Integration. Journal of Marketing, 76(3), 130-147. Sheng, Y. S., & Mullen, M. R. (2011). A Hybrid Model for Export Market Opportunity Analysis. International Marketing Review, 28(2), 163-182. Stewart, D., & Love, W. (1968). A General Canonical Correlation Index. Psychological Bulletin, 70, 160-163. Swike, E., Thompson, S., & Vasquez, C. (2008). Piracy in China. Business Horizons, 51(6), 493-500. The State Council, People’s Republic of China, accessed at www.gov.cn/jrzg/2006-02/09/content 183787.htm. Trott, P. (2005). Innovation Management and New Product Development, Harlow: Prentice-Hall. Tushman M.L., & Anderson, P. (1986). Technological Discontinuities and Organizational Environments. Administrative Science Quarterly, 31, 439-465. Wu, Y. (2011). Innovation and Economic Growth in China: Evidence at the Provincial Level. Journal of the Asia Pacific Economy, 16(2), 129-142. Yang, D., Fryxell, G. E., & Sie, A. K. Y. (2008). Anti-piracy Effectiveness and Managerial Confidence: Insights from Multinationals in China. Journal of World Business, 43(3), 321-339.
International Journal of China Marketing vol. 3(1) 2012 105

Zaltman, G., Duncanand, R., & Holbek, J. (1973). Innovations and Organizations, New York: Wiley. Zhan,W., & Renwei, H. (2003),What Will the World Gain from China in Twenty Years? The China Business Review, 30 (2), 36-39. Zhang, A., Zhang, Y., & Zhao, R. (2003). A Study of the R&D Efficiency and Productivity of Chinese Firms, Journal of Comparative Economics, 31 (3), 443-464. Zhu, K., Kraemer, K., & Xu, S. (2006). The Process of Innovation Assimilation by Firms in Different Countries: A Technology Diffusion Perspective, Management Science, 52 (10), 1557-1576.
106 International Journal of China Marketing vol. 3(1) 2012