Sheep Statistics · Newfoundland and Labrador reported increases in the ewe and lambs kept for...
29
Catalogue no. 23-011-X Sheep Statistics 2012
-
Upload
nguyendang -
Category
Documents
-
view
218 -
download
0
Transcript of Sheep Statistics · Newfoundland and Labrador reported increases in the ewe and lambs kept for...
Catalogue no. 23-011-X
Sheep Statistics
2012
How to obtain more information
For information about this product or the wide range of services and data available from Statistics Canada, visit our website atwww.statcan.gc.ca, e-mail us at [email protected], or telephone us, Monday to Friday from 8:30 a.m. to 4:30 p.m., at thefollowing numbers:
Statistics Canada’s National Contact Centre
Toll-free telephone (Canada and the United States):Inquiries line 1-800-263-1136National telecommunications device for the hearing impaired 1-800-363-7629Fax line 1-877-287-4369
Local or international calls:Inquiries line 1-613-951-8116Fax line 1-613-951-0581
Depository Services ProgramInquiries line 1-800-635-7943Fax line 1-800-565-7757
To access this product
This product, Catalogue no. 23-011-X, is available free in electronic format. To obtain a single issue, visit our website atwww.statcan.gc.ca and browse by “Key resource” > “Publications.”
Standards of service to the public
Statistics Canada is committed to serving its clients in a prompt, reliable and courteous manner. To this end, Statistics Canadahas developed standards of service that its employees observe. To obtain a copy of these service standards, please contactStatistics Canada toll-free at 1-800-263-1136. The service standards are also published on www.statcan.gc.ca under “About us” >“The agency” > “Providing services to Canadians.”
Statistics CanadaAgriculture Division
Sheep Statistics2012
Published by authority of the Minister responsible for Statistics Canada
© Minister of Industry, 2012
All rights reserved. Use of this publication is governed by the Statistics CanadaOpen License Agreement:
http://www.statcan.gc.ca/reference/copyright-droit-auteur-eng.htm
February 2012
Catalogue no. 23-011-X, vol. 11, no. 1
ISSN 1705-1223
Frequency: Semi-Annual
Ottawa
Cette publication est également disponible en français.
Note of appreciation
Canada owes the success of its statistical system to a long-standing partnership betweenStatistics Canada, the citizens of Canada, its businesses, governments and otherinstitutions. Accurate and timely statistical information could not be produced withouttheir continued cooperation and goodwill.

User information
Symbols
The following standard symbols are used in Statistics Canada publications:
. not available for any reference period
.. not available for a specific reference period
... not applicable
0 true zero or a value rounded to zero
0s value rounded to 0 (zero) where there is a meaningful distinction between true zero and the value that wasrounded
p preliminary
r revised
x suppressed to meet the confidentiality requirements of the Statistics Act
E use with caution
F too unreliable to be published
* significantly different from reference category (p < 0.05)
Acknowledgements
This publication was prepared by Donald Cutts, Jesus Dominguez, James Duffy and Susie Knox of the LivestockEstimation Unit, under the direction of Bill Parsons, Chief, Livestock Section and Bishnu Saha, Unit Head, LivestockEstimations.
Special thanks to Jeffrey Smith, Robert Pagnutti, Barbara McLaughlin, Sandra Venturino and the CANSIM and SmartPublishing teams for their support and contribution to this publication.
The support of Agriculture and Agri-Food Canada and the provincial focal points for their review of the data are alsogratefully acknowledged.
2 Statistics Canada – Catalogue no. 23-011-X
Table of contents
Highlights 5
Analysis 6
Sheep statistics 6
Related products 7
Statistical tables
1 Sheep and lambs on farms 10
1-1 Canada 10
1-2 Newfoundland and Labrador 10
1-3 Prince Edward Island 11
1-4 Nova Scotia 11
1-5 New Brunswick 12
1-6 Quebec 12
1-7 Ontario 13
1-8 Eastern provinces 13
1-9 Manitoba 14
1-10 Saskatchewan 14
1-11 Alberta 15
1-12 British Columbia 15
1-13 Western provinces 16
2 Sheep and lambs, supply and demand 17
2-1 2006 17
2-2 2007 18
2-3 2008 19
2-4 2009 20
2-5 2010 21
2-6 2011 22
3 Shorn wool production, disposition and farm value 23
Statistics Canada – Catalogue no. 23-011-X 3
Sheep Statistics – 2012
Table of contents – continued
4 Sheep and lambs: number by class 24
4-1 total for United States and Canada, January 1 24
4-2 United States, January 1 24
4-3 Canada, January 1 25
Data quality, concepts and methodology
Concepts and methodology 26
4 Statistics Canada – Catalogue no. 23-011-X
Highlights
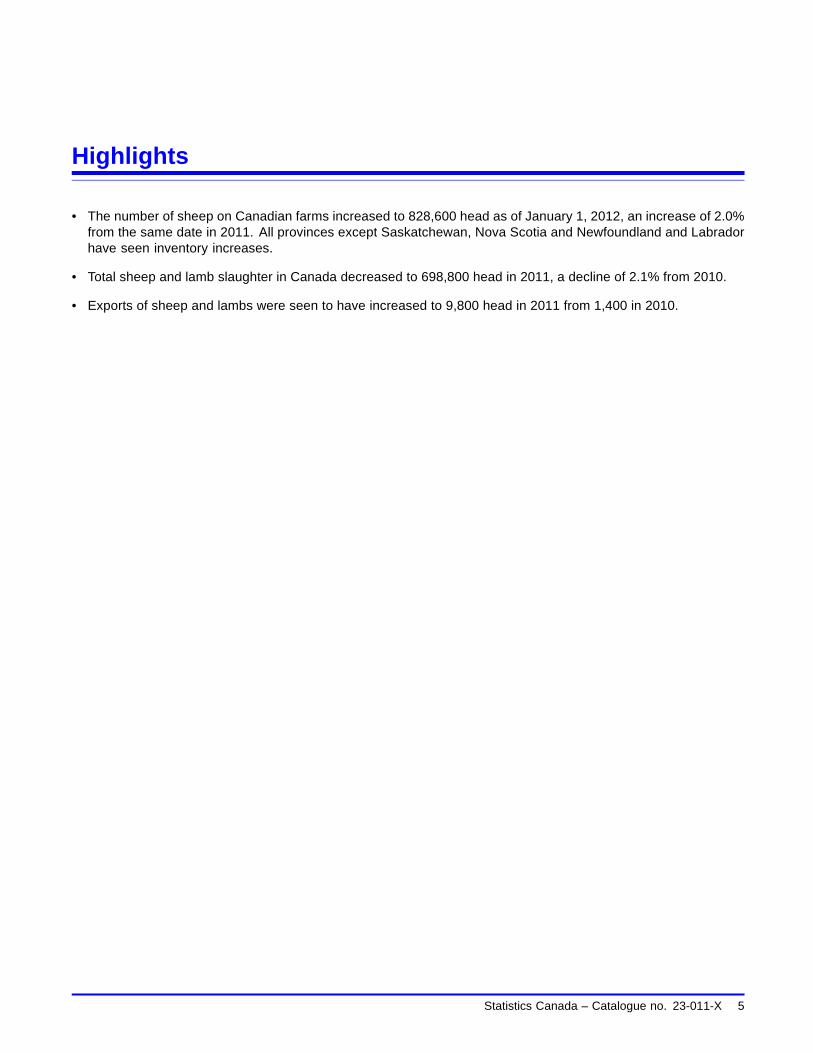
• The number of sheep on Canadian farms increased to 828,600 head as of January 1, 2012, an increase of 2.0%from the same date in 2011. All provinces except Saskatchewan, Nova Scotia and Newfoundland and Labradorhave seen inventory increases.
• Total sheep and lamb slaughter in Canada decreased to 698,800 head in 2011, a decline of 2.1% from 2010.
• Exports of sheep and lambs were seen to have increased to 9,800 head in 2011 from 1,400 in 2010.
Statistics Canada – Catalogue no. 23-011-X 5

Analysis
Sheep statistics
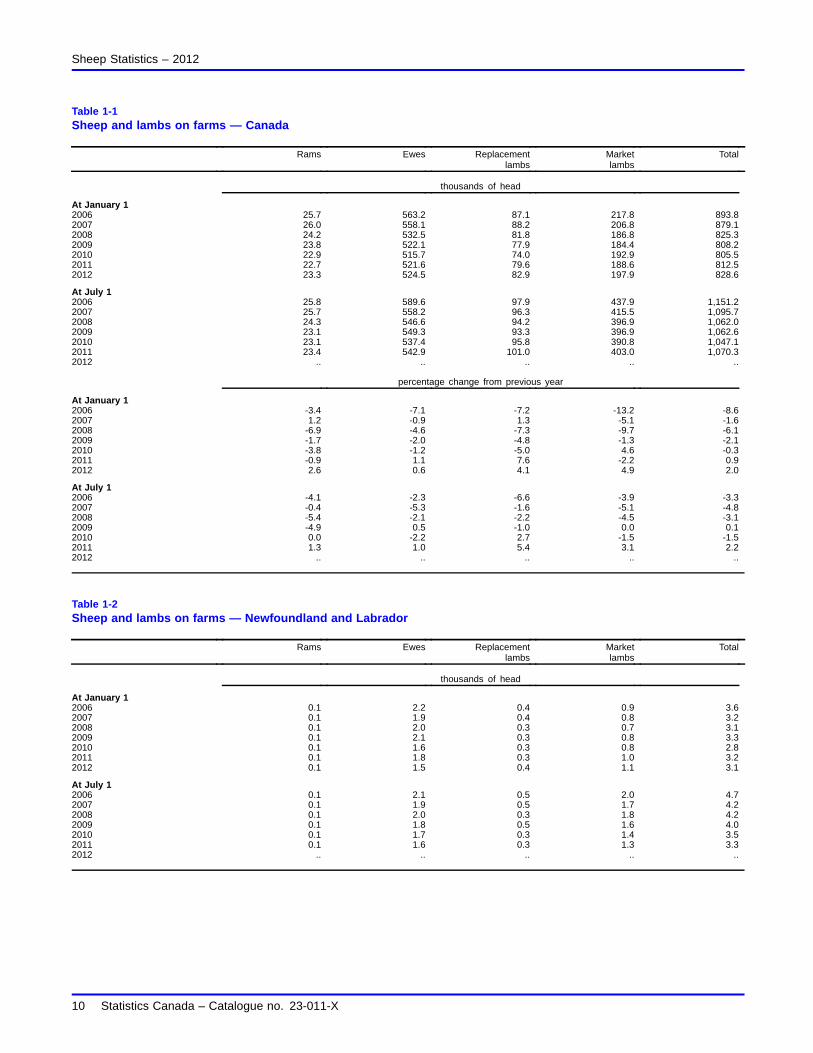
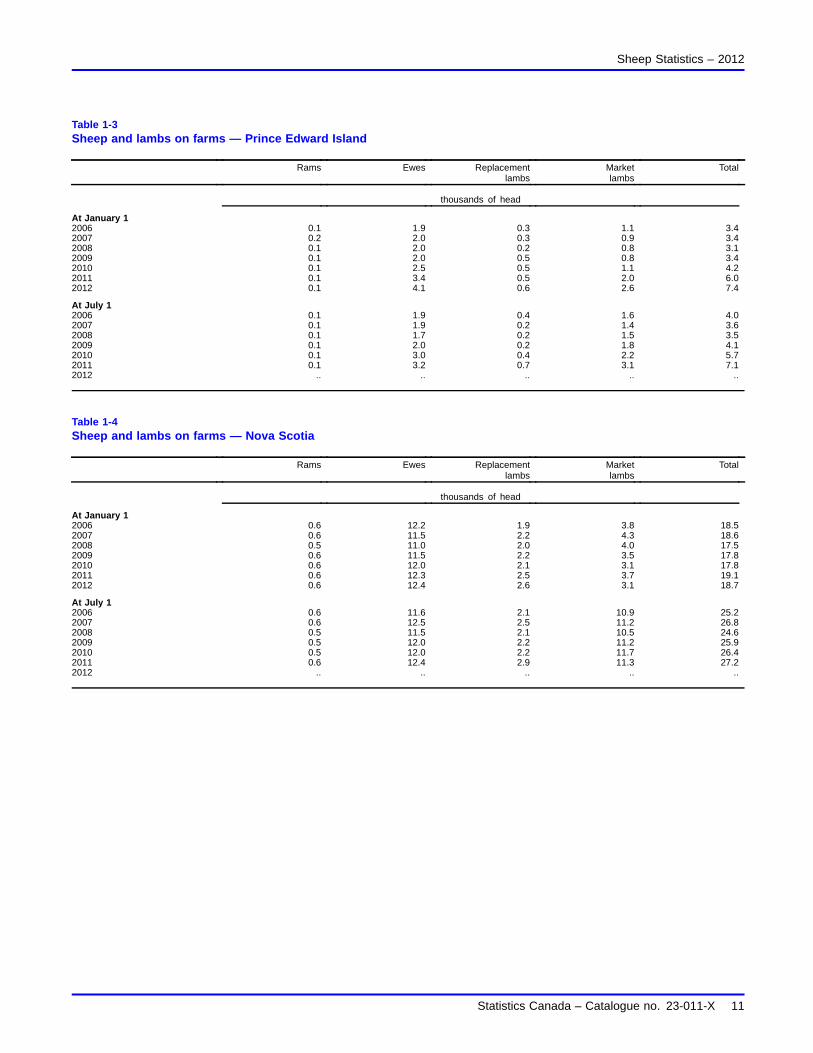
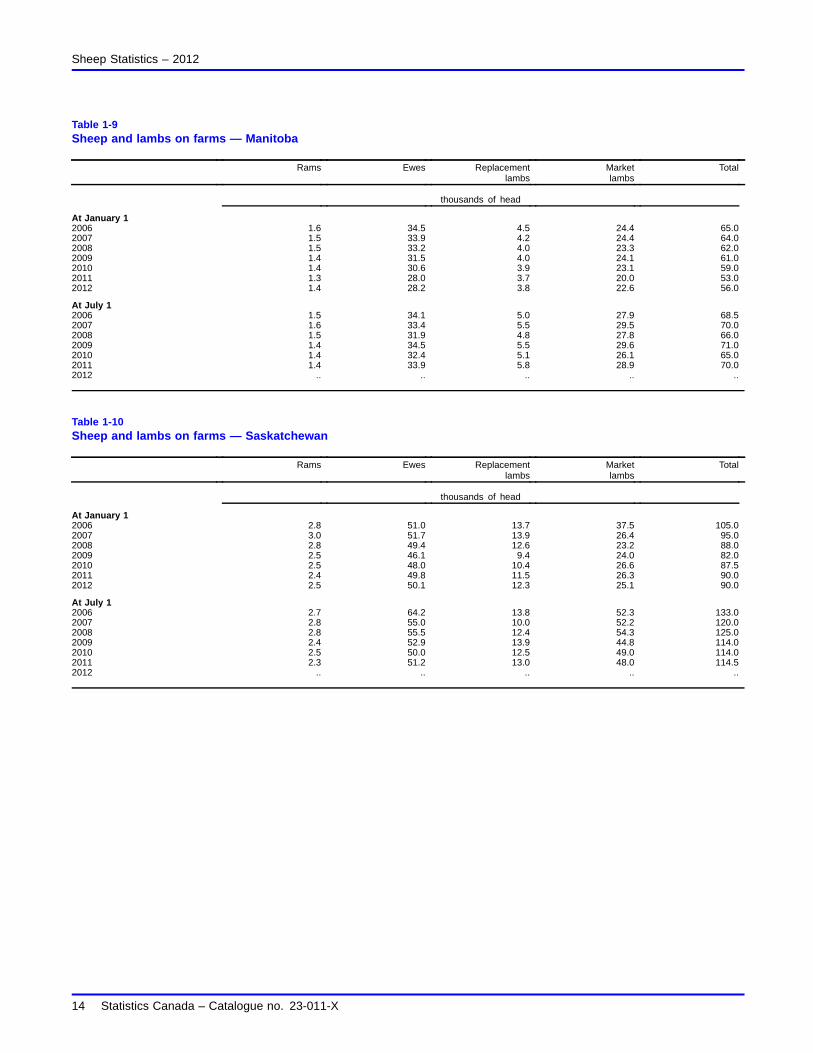
The number of sheep on Canadian farms increased to 828,600 head as of January 1, 2012, an increase of 2.0% fromthe same period in 2011. All provinces except Saskatchewan, Nova Scotia and Newfoundland and Labrador haveseen inventory increases. Sheep inventories in Saskatchewan, however, remained unchanged on a year-over-yearbasis.
Text table 1Sheep inventories
January 12011
r July 12011
January 12012
July 2011 toJanuary 2012
January 2011 toJanuary 2012
thousands of head percentage change
Canada 812.5 1,070.3 828.6 -22.6 2.0Eastern provinces 492.0 646.3 501.6 -22.4 2.0
Atlantic 34.0 46.8 35.6 -23.9 4.7Quebec 226.0 273.5 230.0 -15.9 1.8Ontario 232.0 326.0 236.0 -27.6 1.7
Western provinces 320.5 424.0 327.0 -22.9 2.0Manitoba 53.0 70.0 56.0 -20.0 5.7Saskatchewan 90.0 114.5 90.0 -21.4 0.0Alberta 133.0 183.0 136.0 -25.7 2.3British Columbia 44.5 56.5 45.0 -20.4 1.1
Note(s): The superscript r stands for revised.
The Canadian sheep flock is showing signs of rebuilding in parts of the country with the number of ewes and lambskept for breeding increased by 0.6% and 4.1%, respectively, from a year ago. All provinces except Quebec andNewfoundland and Labrador reported increases in the ewe and lambs kept for breeding inventory.
Total sheep and lamb slaughter in Canada decreased to 698,800 head in 2011, a decline of 2.1% from 2010. Sheepimports were reported at 18,000 head for the year ending on December 31, 2011, a 46.3% decline from the sameperiod a year earlier.
Exports of sheep and lambs were seen to have increased to 9,800 head in 2011 from 1,400 in 2010. Althoughexports of sheep and lamb are showing signs of recovery, they are still only a fraction of the number exported priorto 2003.
6 Statistics Canada – Catalogue no. 23-011-X
Related products
Selected publications from Statistics Canada
23-010-X Hog Statistics
23-012-X Cattle Statistics
21-206-X Statistics on Income of Farm Operators
21-207-X Statistics on Income of Farm Families
21-208-X Statistics on Revenues and Expenses of Farms
23-009-X Stocks of Frozen and Chilled Meats
23-501-X Livestock Feed Requirements Study
Selected CANSIM tables from Statistics Canada
002-0010 Supply and disposition of food in Canada, annual
002-0011 Food available in Canada, annual
002-0019 Food available by major groups in Canada, annual
003-0004 Number of hogs on farms at end of quarter, quarterly
003-0026 Cattle and calves, farm and meat production, annual
003-0028 Hogs, sheep and lambs, farm and meat production, annual
003-0031 Number of sheep and lambs on farms, annual
003-0032 Number of cattle, by class and farm type, annual
003-0080 Nutrients in the food supply, by source of nutritional equivalent and commodity, annual
003-0083 Cattle statistics, supply and demand of cattle, annual
003-0084 Cattle prices, steers, monthly
003-0085 Cattle and calves, number by class and calf crop, United States, annual
003-0086 Cattle, weighted average prices, steers, annual
003-0087 Hogs statistics, sows farrowed, pigs born and sows bred to farrow, quarterly
Statistics Canada – Catalogue no. 23-011-X 7
Sheep Statistics – 2012
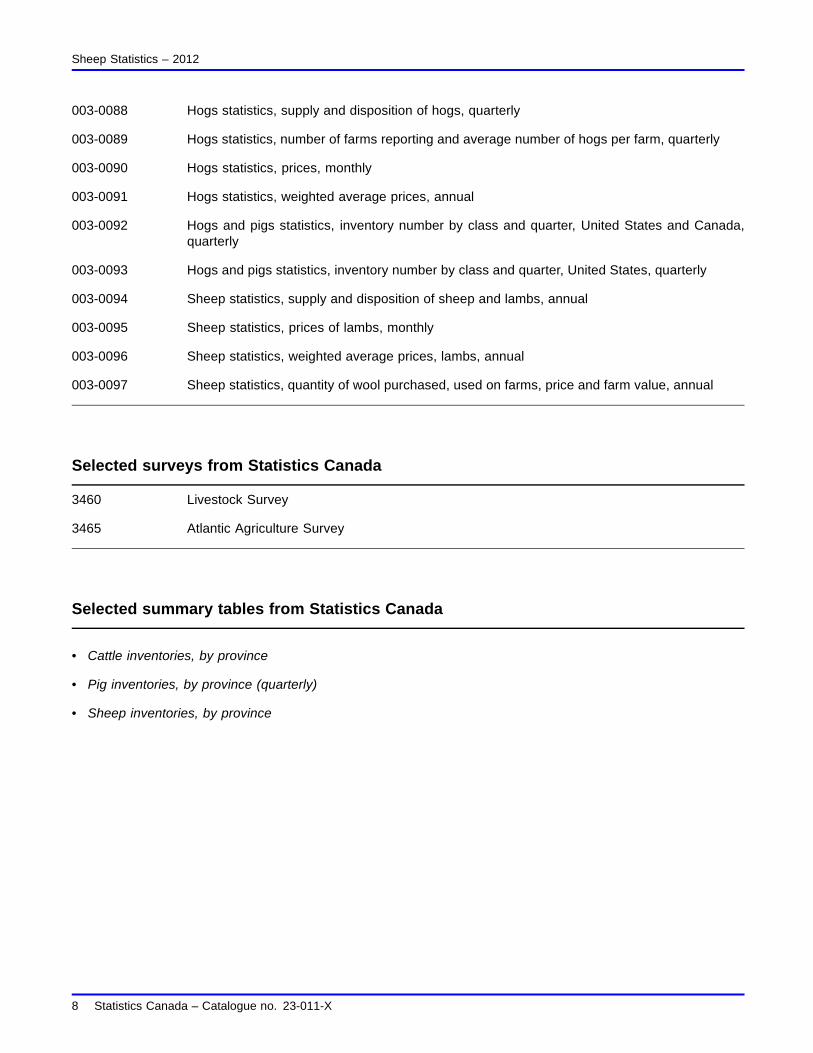
003-0088 Hogs statistics, supply and disposition of hogs, quarterly
003-0089 Hogs statistics, number of farms reporting and average number of hogs per farm, quarterly
003-0090 Hogs statistics, prices, monthly
003-0091 Hogs statistics, weighted average prices, annual
003-0092 Hogs and pigs statistics, inventory number by class and quarter, United States and Canada,quarterly
003-0093 Hogs and pigs statistics, inventory number by class and quarter, United States, quarterly
003-0094 Sheep statistics, supply and disposition of sheep and lambs, annual
003-0095 Sheep statistics, prices of lambs, monthly
003-0096 Sheep statistics, weighted average prices, lambs, annual
003-0097 Sheep statistics, quantity of wool purchased, used on farms, price and farm value, annual
Selected surveys from Statistics Canada
3460 Livestock Survey
3465 Atlantic Agriculture Survey
Selected summary tables from Statistics Canada
• Cattle inventories, by province
• Pig inventories, by province (quarterly)
• Sheep inventories, by province
8 Statistics Canada – Catalogue no. 23-011-X

Statistical tables
Sheep Statistics – 2012
Table 1-1Sheep and lambs on farms — Canada
Rams Ewes Replacementlambs
Marketlambs
Total
thousands of head
At January 12006 25.7 563.2 87.1 217.8 893.82007 26.0 558.1 88.2 206.8 879.12008 24.2 532.5 81.8 186.8 825.32009 23.8 522.1 77.9 184.4 808.22010 22.9 515.7 74.0 192.9 805.52011 22.7 521.6 79.6 188.6 812.52012 23.3 524.5 82.9 197.9 828.6
At July 12006 25.8 589.6 97.9 437.9 1,151.22007 25.7 558.2 96.3 415.5 1,095.72008 24.3 546.6 94.2 396.9 1,062.02009 23.1 549.3 93.3 396.9 1,062.62010 23.1 537.4 95.8 390.8 1,047.12011 23.4 542.9 101.0 403.0 1,070.32012 .. .. .. .. ..
percentage change from previous year
At January 12006 -3.4 -7.1 -7.2 -13.2 -8.62007 1.2 -0.9 1.3 -5.1 -1.62008 -6.9 -4.6 -7.3 -9.7 -6.12009 -1.7 -2.0 -4.8 -1.3 -2.12010 -3.8 -1.2 -5.0 4.6 -0.32011 -0.9 1.1 7.6 -2.2 0.92012 2.6 0.6 4.1 4.9 2.0
At July 12006 -4.1 -2.3 -6.6 -3.9 -3.32007 -0.4 -5.3 -1.6 -5.1 -4.82008 -5.4 -2.1 -2.2 -4.5 -3.12009 -4.9 0.5 -1.0 0.0 0.12010 0.0 -2.2 2.7 -1.5 -1.52011 1.3 1.0 5.4 3.1 2.22012 .. .. .. .. ..
Table 1-2Sheep and lambs on farms — Newfoundland and Labrador
Rams Ewes Replacementlambs
Marketlambs
Total
thousands of head
At January 12006 0.1 2.2 0.4 0.9 3.62007 0.1 1.9 0.4 0.8 3.22008 0.1 2.0 0.3 0.7 3.12009 0.1 2.1 0.3 0.8 3.32010 0.1 1.6 0.3 0.8 2.82011 0.1 1.8 0.3 1.0 3.22012 0.1 1.5 0.4 1.1 3.1
At July 12006 0.1 2.1 0.5 2.0 4.72007 0.1 1.9 0.5 1.7 4.22008 0.1 2.0 0.3 1.8 4.22009 0.1 1.8 0.5 1.6 4.02010 0.1 1.7 0.3 1.4 3.52011 0.1 1.6 0.3 1.3 3.32012 .. .. .. .. ..
10 Statistics Canada – Catalogue no. 23-011-X
Sheep Statistics – 2012
Table 1-3Sheep and lambs on farms — Prince Edward Island
Rams Ewes Replacementlambs
Marketlambs
Total
thousands of head
At January 12006 0.1 1.9 0.3 1.1 3.42007 0.2 2.0 0.3 0.9 3.42008 0.1 2.0 0.2 0.8 3.12009 0.1 2.0 0.5 0.8 3.42010 0.1 2.5 0.5 1.1 4.22011 0.1 3.4 0.5 2.0 6.02012 0.1 4.1 0.6 2.6 7.4
At July 12006 0.1 1.9 0.4 1.6 4.02007 0.1 1.9 0.2 1.4 3.62008 0.1 1.7 0.2 1.5 3.52009 0.1 2.0 0.2 1.8 4.12010 0.1 3.0 0.4 2.2 5.72011 0.1 3.2 0.7 3.1 7.12012 .. .. .. .. ..
Table 1-4Sheep and lambs on farms — Nova Scotia
Rams Ewes Replacementlambs
Marketlambs
Total
thousands of head
At January 12006 0.6 12.2 1.9 3.8 18.52007 0.6 11.5 2.2 4.3 18.62008 0.5 11.0 2.0 4.0 17.52009 0.6 11.5 2.2 3.5 17.82010 0.6 12.0 2.1 3.1 17.82011 0.6 12.3 2.5 3.7 19.12012 0.6 12.4 2.6 3.1 18.7
At July 12006 0.6 11.6 2.1 10.9 25.22007 0.6 12.5 2.5 11.2 26.82008 0.5 11.5 2.1 10.5 24.62009 0.5 12.0 2.2 11.2 25.92010 0.5 12.0 2.2 11.7 26.42011 0.6 12.4 2.9 11.3 27.22012 .. .. .. .. ..
Statistics Canada – Catalogue no. 23-011-X 11

Sheep Statistics – 2012
Table 1-5Sheep and lambs on farms — New Brunswick
Rams Ewes Replacementlambs
Marketlambs
Total
thousands of head
At January 12006 0.2 3.8 0.6 1.7 6.32007 0.2 3.6 0.5 1.6 5.92008 0.2 4.0 0.6 1.8 6.62009 0.2 3.6 0.4 1.5 5.72010 0.2 3.4 0.5 1.1 5.22011 0.2 3.8 0.6 1.1 5.72012 0.2 4.2 0.8 1.2 6.4
At July 12006 0.2 3.6 0.7 2.8 7.32007 0.2 4.0 0.8 3.1 8.12008 0.2 4.0 0.9 3.6 8.72009 0.2 3.5 0.6 3.8 8.12010 0.2 3.5 0.7 3.6 8.02011 0.3 4.0 0.9 4.0 9.22012 .. .. .. .. ..
Table 1-6Sheep and lambs on farms — Quebec
Rams Ewes Replacementlambs
Marketlambs
Total
thousands of head
At January 12006 6.0 170.6 23.0 52.4 252.02007 6.1 167.8 22.1 52.0 248.02008 6.0 166.0 22.0 51.0 245.02009 6.0 163.2 23.0 51.8 244.02010 5.8 158.5 20.5 53.7 238.52011 5.5 152.5 19.0 49.0 226.02012 5.5 152.0 18.5 54.0 230.0
At July 12006 6.1 181.5 25.5 93.9 307.02007 5.9 171.6 26.6 90.9 295.02008 5.9 170.0 26.6 87.5 290.02009 5.8 171.6 24.3 83.8 285.52010 5.7 165.5 22.8 80.5 274.52011 5.6 165.2 22.5 80.2 273.52012 .. .. .. .. ..
12 Statistics Canada – Catalogue no. 23-011-X

Sheep Statistics – 2012
Table 1-7Sheep and lambs on farms — Ontario
Rams Ewes Replacementlambs
Marketlambs
Total
thousands of head
At January 12006 7.0 158.9 21.5 37.6 225.02007 7.0 159.5 23.3 45.2 235.02008 7.2 159.2 23.5 40.1 230.02009 6.9 150.9 20.0 37.2 215.02010 7.0 152.0 21.5 38.0 218.52011 7.1 160.0 24.0 40.9 232.02012 7.4 161.0 25.1 42.5 236.0
At July 12006 7.2 158.6 26.8 118.4 311.02007 7.8 159.2 27.9 110.1 305.02008 7.3 154.1 28.6 105.0 295.02009 7.0 160.1 28.4 119.5 315.02010 7.1 160.1 33.3 115.0 315.52011 7.3 159.1 35.5 124.1 326.02012 .. .. .. .. ..
Table 1-8Sheep and lambs on farms — Eastern provinces
Rams Ewes Replacementlambs
Marketlambs
Total
thousands of head
At January 12006 14.0 349.6 47.7 97.5 508.82007 14.2 346.3 48.8 104.8 514.12008 14.1 344.2 48.6 98.4 505.32009 13.9 333.3 46.4 95.6 489.22010 13.8 330.0 45.4 97.8 487.02011 13.6 333.8 46.9 97.7 492.02012 13.9 335.2 48.0 104.5 501.6
At July 12006 14.3 359.3 56.0 229.6 659.22007 14.7 351.1 58.5 218.4 642.72008 14.1 343.3 58.7 209.9 626.02009 13.7 351.0 56.2 221.7 642.62010 13.7 345.8 59.7 214.4 633.62011 14.0 345.5 62.8 224.0 646.32012 .. .. .. .. ..
Statistics Canada – Catalogue no. 23-011-X 13
Sheep Statistics – 2012
Table 1-9Sheep and lambs on farms — Manitoba
Rams Ewes Replacementlambs
Marketlambs
Total
thousands of head
At January 12006 1.6 34.5 4.5 24.4 65.02007 1.5 33.9 4.2 24.4 64.02008 1.5 33.2 4.0 23.3 62.02009 1.4 31.5 4.0 24.1 61.02010 1.4 30.6 3.9 23.1 59.02011 1.3 28.0 3.7 20.0 53.02012 1.4 28.2 3.8 22.6 56.0
At July 12006 1.5 34.1 5.0 27.9 68.52007 1.6 33.4 5.5 29.5 70.02008 1.5 31.9 4.8 27.8 66.02009 1.4 34.5 5.5 29.6 71.02010 1.4 32.4 5.1 26.1 65.02011 1.4 33.9 5.8 28.9 70.02012 .. .. .. .. ..
Table 1-10Sheep and lambs on farms — Saskatchewan
Rams Ewes Replacementlambs
Marketlambs
Total
thousands of head
At January 12006 2.8 51.0 13.7 37.5 105.02007 3.0 51.7 13.9 26.4 95.02008 2.8 49.4 12.6 23.2 88.02009 2.5 46.1 9.4 24.0 82.02010 2.5 48.0 10.4 26.6 87.52011 2.4 49.8 11.5 26.3 90.02012 2.5 50.1 12.3 25.1 90.0
At July 12006 2.7 64.2 13.8 52.3 133.02007 2.8 55.0 10.0 52.2 120.02008 2.8 55.5 12.4 54.3 125.02009 2.4 52.9 13.9 44.8 114.02010 2.5 50.0 12.5 49.0 114.02011 2.3 51.2 13.0 48.0 114.52012 .. .. .. .. ..
14 Statistics Canada – Catalogue no. 23-011-X
Sheep Statistics – 2012
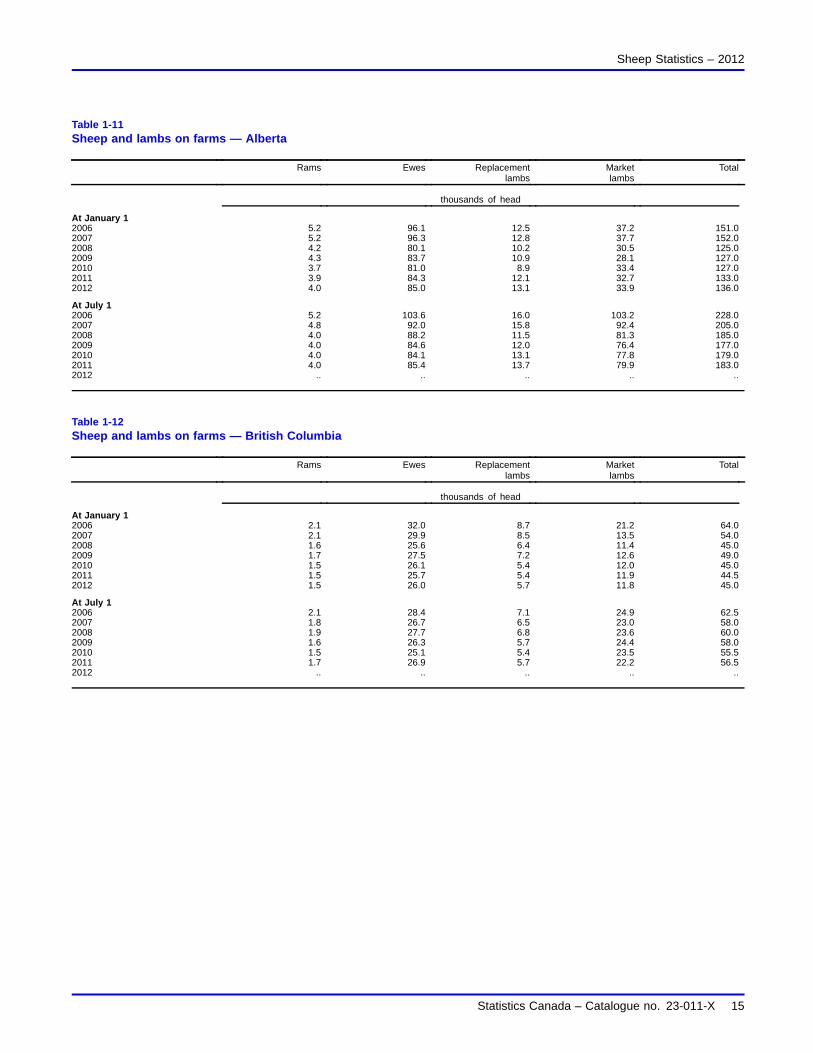
Table 1-11Sheep and lambs on farms — Alberta
Rams Ewes Replacementlambs
Marketlambs
Total
thousands of head
At January 12006 5.2 96.1 12.5 37.2 151.02007 5.2 96.3 12.8 37.7 152.02008 4.2 80.1 10.2 30.5 125.02009 4.3 83.7 10.9 28.1 127.02010 3.7 81.0 8.9 33.4 127.02011 3.9 84.3 12.1 32.7 133.02012 4.0 85.0 13.1 33.9 136.0
At July 12006 5.2 103.6 16.0 103.2 228.02007 4.8 92.0 15.8 92.4 205.02008 4.0 88.2 11.5 81.3 185.02009 4.0 84.6 12.0 76.4 177.02010 4.0 84.1 13.1 77.8 179.02011 4.0 85.4 13.7 79.9 183.02012 .. .. .. .. ..
Table 1-12Sheep and lambs on farms — British Columbia
Rams Ewes Replacementlambs
Marketlambs
Total
thousands of head
At January 12006 2.1 32.0 8.7 21.2 64.02007 2.1 29.9 8.5 13.5 54.02008 1.6 25.6 6.4 11.4 45.02009 1.7 27.5 7.2 12.6 49.02010 1.5 26.1 5.4 12.0 45.02011 1.5 25.7 5.4 11.9 44.52012 1.5 26.0 5.7 11.8 45.0
At July 12006 2.1 28.4 7.1 24.9 62.52007 1.8 26.7 6.5 23.0 58.02008 1.9 27.7 6.8 23.6 60.02009 1.6 26.3 5.7 24.4 58.02010 1.5 25.1 5.4 23.5 55.52011 1.7 26.9 5.7 22.2 56.52012 .. .. .. .. ..
Statistics Canada – Catalogue no. 23-011-X 15
Sheep Statistics – 2012
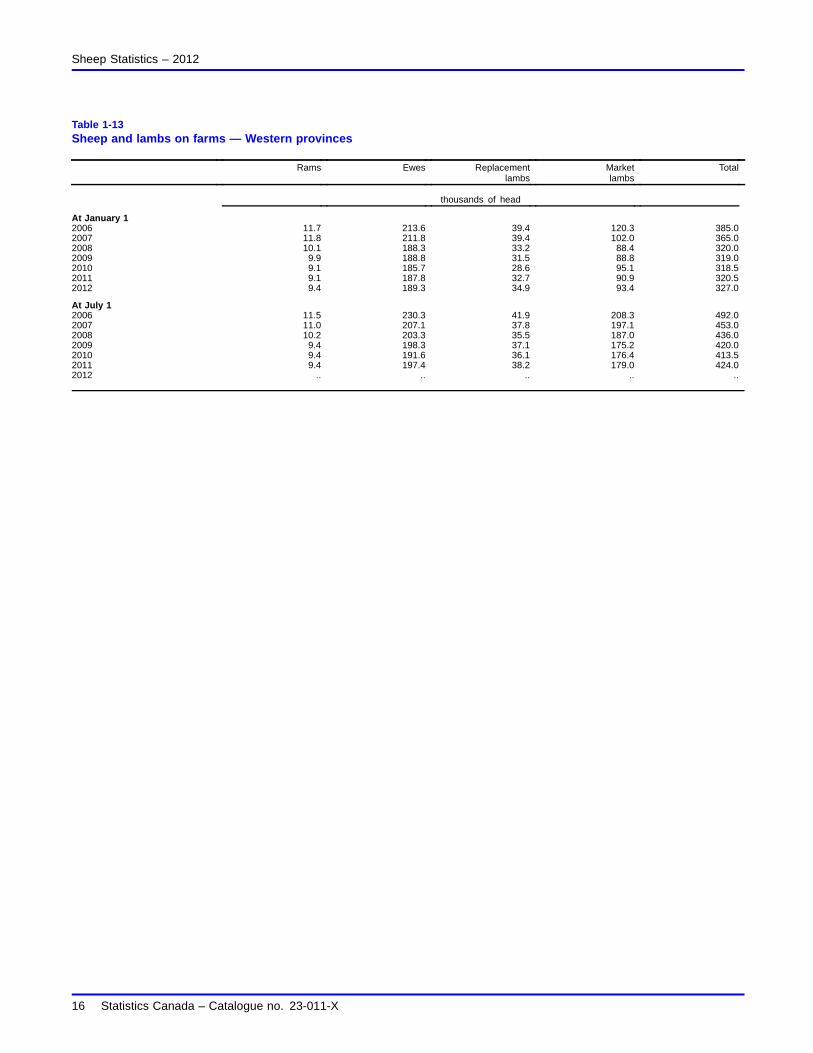
Table 1-13Sheep and lambs on farms — Western provinces
Rams Ewes Replacementlambs
Marketlambs
Total
thousands of head
At January 12006 11.7 213.6 39.4 120.3 385.02007 11.8 211.8 39.4 102.0 365.02008 10.1 188.3 33.2 88.4 320.02009 9.9 188.8 31.5 88.8 319.02010 9.1 185.7 28.6 95.1 318.52011 9.1 187.8 32.7 90.9 320.52012 9.4 189.3 34.9 93.4 327.0
At July 12006 11.5 230.3 41.9 208.3 492.02007 11.0 207.1 37.8 197.1 453.02008 10.2 203.3 35.5 187.0 436.02009 9.4 198.3 37.1 175.2 420.02010 9.4 191.6 36.1 176.4 413.52011 9.4 197.4 38.2 179.0 424.02012 .. .. .. .. ..
16 Statistics Canada – Catalogue no. 23-011-X
Sheep Statistics – 2012
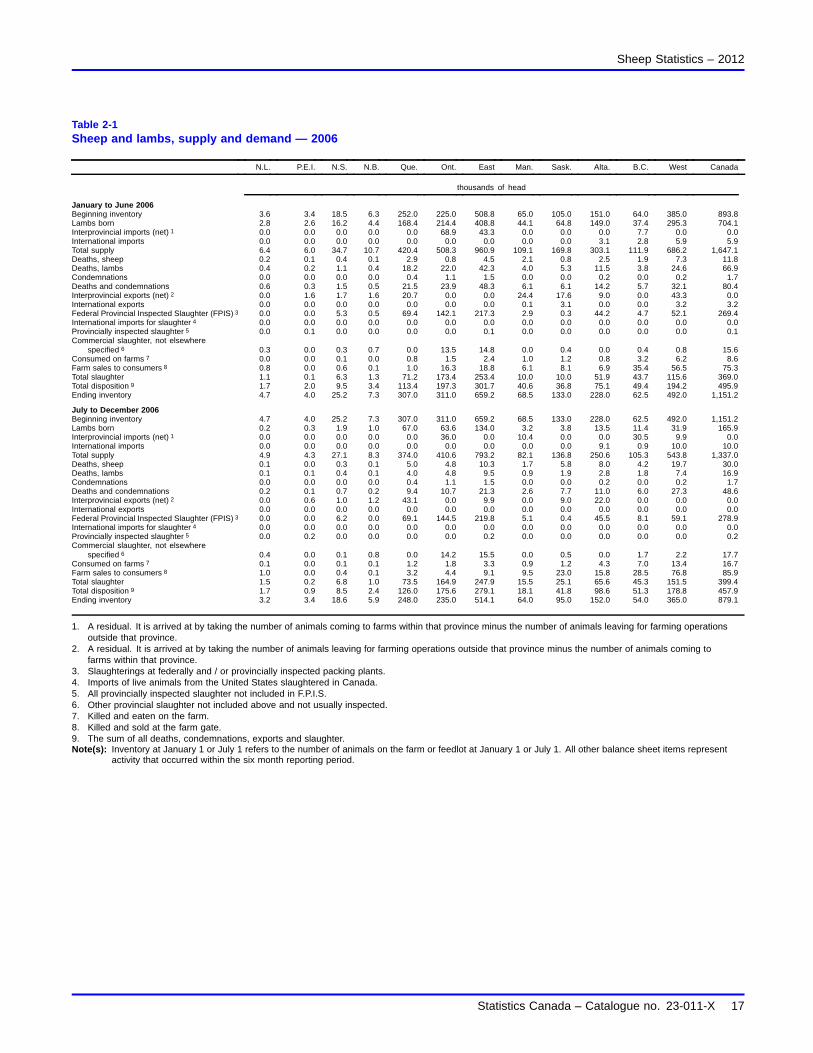
Table 2-1Sheep and lambs, supply and demand — 2006
N.L. P.E.I. N.S. N.B. Que. Ont. East Man. Sask. Alta. B.C. West Canada
thousands of head
January to June 2006Beginning inventory 3.6 3.4 18.5 6.3 252.0 225.0 508.8 65.0 105.0 151.0 64.0 385.0 893.8Lambs born 2.8 2.6 16.2 4.4 168.4 214.4 408.8 44.1 64.8 149.0 37.4 295.3 704.1Interprovincial imports (net) 1 0.0 0.0 0.0 0.0 0.0 68.9 43.3 0.0 0.0 0.0 7.7 0.0 0.0International imports 0.0 0.0 0.0 0.0 0.0 0.0 0.0 0.0 0.0 3.1 2.8 5.9 5.9Total supply 6.4 6.0 34.7 10.7 420.4 508.3 960.9 109.1 169.8 303.1 111.9 686.2 1,647.1Deaths, sheep 0.2 0.1 0.4 0.1 2.9 0.8 4.5 2.1 0.8 2.5 1.9 7.3 11.8Deaths, lambs 0.4 0.2 1.1 0.4 18.2 22.0 42.3 4.0 5.3 11.5 3.8 24.6 66.9Condemnations 0.0 0.0 0.0 0.0 0.4 1.1 1.5 0.0 0.0 0.2 0.0 0.2 1.7Deaths and condemnations 0.6 0.3 1.5 0.5 21.5 23.9 48.3 6.1 6.1 14.2 5.7 32.1 80.4Interprovincial exports (net) 2 0.0 1.6 1.7 1.6 20.7 0.0 0.0 24.4 17.6 9.0 0.0 43.3 0.0International exports 0.0 0.0 0.0 0.0 0.0 0.0 0.0 0.1 3.1 0.0 0.0 3.2 3.2Federal Provincial Inspected Slaughter (FPIS) 3 0.0 0.0 5.3 0.5 69.4 142.1 217.3 2.9 0.3 44.2 4.7 52.1 269.4International imports for slaughter 4 0.0 0.0 0.0 0.0 0.0 0.0 0.0 0.0 0.0 0.0 0.0 0.0 0.0Provincially inspected slaughter 5 0.0 0.1 0.0 0.0 0.0 0.0 0.1 0.0 0.0 0.0 0.0 0.0 0.1Commercial slaughter, not elsewhere
specified 6 0.3 0.0 0.3 0.7 0.0 13.5 14.8 0.0 0.4 0.0 0.4 0.8 15.6Consumed on farms 7 0.0 0.0 0.1 0.0 0.8 1.5 2.4 1.0 1.2 0.8 3.2 6.2 8.6Farm sales to consumers 8 0.8 0.0 0.6 0.1 1.0 16.3 18.8 6.1 8.1 6.9 35.4 56.5 75.3Total slaughter 1.1 0.1 6.3 1.3 71.2 173.4 253.4 10.0 10.0 51.9 43.7 115.6 369.0Total disposition 9 1.7 2.0 9.5 3.4 113.4 197.3 301.7 40.6 36.8 75.1 49.4 194.2 495.9Ending inventory 4.7 4.0 25.2 7.3 307.0 311.0 659.2 68.5 133.0 228.0 62.5 492.0 1,151.2
July to December 2006Beginning inventory 4.7 4.0 25.2 7.3 307.0 311.0 659.2 68.5 133.0 228.0 62.5 492.0 1,151.2Lambs born 0.2 0.3 1.9 1.0 67.0 63.6 134.0 3.2 3.8 13.5 11.4 31.9 165.9Interprovincial imports (net) 1 0.0 0.0 0.0 0.0 0.0 36.0 0.0 10.4 0.0 0.0 30.5 9.9 0.0International imports 0.0 0.0 0.0 0.0 0.0 0.0 0.0 0.0 0.0 9.1 0.9 10.0 10.0Total supply 4.9 4.3 27.1 8.3 374.0 410.6 793.2 82.1 136.8 250.6 105.3 543.8 1,337.0Deaths, sheep 0.1 0.0 0.3 0.1 5.0 4.8 10.3 1.7 5.8 8.0 4.2 19.7 30.0Deaths, lambs 0.1 0.1 0.4 0.1 4.0 4.8 9.5 0.9 1.9 2.8 1.8 7.4 16.9Condemnations 0.0 0.0 0.0 0.0 0.4 1.1 1.5 0.0 0.0 0.2 0.0 0.2 1.7Deaths and condemnations 0.2 0.1 0.7 0.2 9.4 10.7 21.3 2.6 7.7 11.0 6.0 27.3 48.6Interprovincial exports (net) 2 0.0 0.6 1.0 1.2 43.1 0.0 9.9 0.0 9.0 22.0 0.0 0.0 0.0International exports 0.0 0.0 0.0 0.0 0.0 0.0 0.0 0.0 0.0 0.0 0.0 0.0 0.0Federal Provincial Inspected Slaughter (FPIS) 3 0.0 0.0 6.2 0.0 69.1 144.5 219.8 5.1 0.4 45.5 8.1 59.1 278.9International imports for slaughter 4 0.0 0.0 0.0 0.0 0.0 0.0 0.0 0.0 0.0 0.0 0.0 0.0 0.0Provincially inspected slaughter 5 0.0 0.2 0.0 0.0 0.0 0.0 0.2 0.0 0.0 0.0 0.0 0.0 0.2Commercial slaughter, not elsewhere
specified 6 0.4 0.0 0.1 0.8 0.0 14.2 15.5 0.0 0.5 0.0 1.7 2.2 17.7Consumed on farms 7 0.1 0.0 0.1 0.1 1.2 1.8 3.3 0.9 1.2 4.3 7.0 13.4 16.7Farm sales to consumers 8 1.0 0.0 0.4 0.1 3.2 4.4 9.1 9.5 23.0 15.8 28.5 76.8 85.9Total slaughter 1.5 0.2 6.8 1.0 73.5 164.9 247.9 15.5 25.1 65.6 45.3 151.5 399.4Total disposition 9 1.7 0.9 8.5 2.4 126.0 175.6 279.1 18.1 41.8 98.6 51.3 178.8 457.9Ending inventory 3.2 3.4 18.6 5.9 248.0 235.0 514.1 64.0 95.0 152.0 54.0 365.0 879.1
1. A residual. It is arrived at by taking the number of animals coming to farms within that province minus the number of animals leaving for farming operationsoutside that province.
2. A residual. It is arrived at by taking the number of animals leaving for farming operations outside that province minus the number of animals coming tofarms within that province.
3. Slaughterings at federally and / or provincially inspected packing plants.4. Imports of live animals from the United States slaughtered in Canada.5. All provincially inspected slaughter not included in F.P.I.S.6. Other provincial slaughter not included above and not usually inspected.7. Killed and eaten on the farm.8. Killed and sold at the farm gate.9. The sum of all deaths, condemnations, exports and slaughter.Note(s): Inventory at January 1 or July 1 refers to the number of animals on the farm or feedlot at January 1 or July 1. All other balance sheet items represent
activity that occurred within the six month reporting period.
Statistics Canada – Catalogue no. 23-011-X 17

Sheep Statistics – 2012
Table 2-2Sheep and lambs, supply and demand — 2007
N.L. P.E.I. N.S. N.B. Que. Ont. East Man. Sask. Alta. B.C. West Canada
thousands of head
January to June 2007Beginning inventory 3.2 3.4 18.6 5.9 248.0 235.0 514.1 64.0 95.0 152.0 54.0 365.0 879.1Lambs born 2.7 2.3 16.9 4.5 155.2 194.8 376.4 42.3 60.6 131.3 35.8 270.0 646.4Interprovincial imports (net) 1 0.0 0.0 0.0 0.0 0.0 69.1 51.1 0.0 0.0 0.0 12.0 0.0 0.0International imports 0.0 0.0 0.0 0.0 0.0 0.1 0.1 0.0 0.0 6.9 1.0 7.9 8.0Total supply 5.9 5.7 35.5 10.4 403.2 499.0 941.7 106.3 155.6 290.2 102.8 642.9 1,584.6Deaths, sheep 0.2 0.1 0.3 0.1 3.0 1.1 4.8 2.0 1.0 2.7 2.0 7.7 12.5Deaths, lambs 0.3 0.2 1.1 0.3 19.0 23.6 44.5 3.6 5.5 12.2 4.0 25.3 69.8Condemnations 0.0 0.0 0.0 0.0 0.4 1.0 1.4 0.0 0.0 0.2 0.0 0.2 1.6Deaths and condemnations 0.5 0.3 1.4 0.4 22.4 25.7 50.7 5.6 6.5 15.1 6.0 33.2 83.9Interprovincial exports (net) 2 0.0 1.7 1.1 0.7 14.5 0.0 0.0 21.3 21.1 20.7 0.0 51.1 0.0International exports 0.0 0.0 0.0 0.0 0.0 0.0 0.0 0.0 0.0 0.0 0.0 0.0 0.0Federal Provincial Inspected Slaughter (FPIS) 3 0.0 0.0 5.4 0.4 68.3 131.7 205.8 2.2 0.2 42.0 4.9 49.3 255.1International imports for slaughter 4 0.0 0.0 0.0 0.0 0.0 0.0 0.0 0.0 0.0 0.0 0.0 0.0 0.0Provincially inspected slaughter 5 0.0 0.1 0.0 0.0 0.0 0.0 0.1 0.0 0.0 0.0 0.0 0.0 0.1Commercial slaughter, not elsewhere
specified 6 0.4 0.0 0.3 0.7 0.0 12.2 13.6 0.0 0.4 0.0 0.5 0.9 14.5Consumed on farms 7 0.0 0.0 0.1 0.0 1.0 1.5 2.6 1.0 1.2 0.8 3.2 6.2 8.8Farm sales to consumers 8 0.8 0.0 0.4 0.1 2.0 22.9 26.2 6.2 6.2 6.6 30.2 49.2 75.4Total slaughter 1.2 0.1 6.2 1.2 71.3 168.3 248.3 9.4 8.0 49.4 38.8 105.6 353.9Total disposition 9 1.7 2.1 8.7 2.3 108.2 194.0 299.0 36.3 35.6 85.2 44.8 189.9 488.9Ending inventory 4.2 3.6 26.8 8.1 295.0 305.0 642.7 70.0 120.0 205.0 58.0 453.0 1,095.7
July to December 2007Beginning inventory 4.2 3.6 26.8 8.1 295.0 305.0 642.7 70.0 120.0 205.0 58.0 453.0 1,095.7Lambs born 0.3 0.3 1.8 1.0 63.0 58.9 125.3 3.1 3.9 13.0 10.9 30.9 156.2Interprovincial imports (net) 1 0.0 0.0 0.0 0.0 0.0 38.5 0.0 7.5 0.0 0.0 22.9 0.1 0.0International imports 0.0 0.0 0.0 0.0 0.0 2.2 2.2 0.0 0.0 13.8 2.2 16.0 18.2Total supply 4.5 3.9 28.6 9.1 358.0 404.6 770.2 80.6 123.9 231.8 94.0 500.0 1,270.2Deaths, sheep 0.0 0.0 0.4 0.1 5.0 5.0 10.5 1.7 5.2 7.5 4.0 18.4 28.9Deaths, lambs 0.1 0.1 0.6 0.1 4.0 5.2 10.1 0.9 1.5 1.9 1.6 5.9 16.0Condemnations 0.0 0.0 0.0 0.0 0.4 1.1 1.5 0.0 0.0 0.3 0.0 0.3 1.8Deaths and condemnations 0.1 0.1 1.0 0.2 9.4 11.3 22.1 2.6 6.7 9.7 5.6 24.6 46.7Interprovincial exports (net) 2 0.0 0.5 2.7 1.3 34.1 0.0 0.1 0.0 5.8 24.5 0.0 0.0 0.0International exports 0.0 0.0 0.0 0.0 0.0 0.1 0.1 0.0 0.0 0.0 0.0 0.0 0.1Federal Provincial Inspected Slaughter (FPIS) 3 0.0 0.0 6.5 0.0 63.7 137.3 207.5 4.6 0.4 56.2 10.3 71.5 279.0International imports for slaughter 4 0.0 0.0 0.0 0.0 0.0 0.0 0.0 0.0 0.0 0.0 0.0 0.0 0.0Provincially inspected slaughter 5 0.0 0.2 0.0 0.0 0.0 0.0 0.2 0.0 0.0 0.0 0.0 0.0 0.2Commercial slaughter, not elsewhere
specified 6 0.3 0.0 0.2 0.8 0.0 13.1 14.4 0.0 0.8 0.0 0.9 1.7 16.1Consumed on farms 7 0.1 0.0 0.2 0.1 1.3 1.8 3.5 0.9 1.2 4.3 7.0 13.4 16.9Farm sales to consumers 8 0.9 0.0 0.5 0.1 4.5 11.0 17.0 10.5 21.0 12.1 25.2 68.8 85.8Total slaughter 1.3 0.2 7.4 1.0 69.5 163.2 242.6 16.0 23.4 72.6 43.4 155.4 398.0Total disposition 9 1.4 0.8 11.1 2.5 113.0 174.6 264.9 18.6 35.9 106.8 49.0 180.0 444.9Ending inventory 3.1 3.1 17.5 6.6 245.0 230.0 505.3 62.0 88.0 125.0 45.0 320.0 825.3
1. A residual. It is arrived at by taking the number of animals coming to farms within that province minus the number of animals leaving for farming operationsoutside that province.
2. A residual. It is arrived at by taking the number of animals leaving for farming operations outside that province minus the number of animals coming tofarms within that province.
3. Slaughterings at federally and / or provincially inspected packing plants.4. Imports of live animals from the United States slaughtered in Canada.5. All provincially inspected slaughter not included in F.P.I.S.6. Other provincial slaughter not included above and not usually inspected.7. Killed and eaten on the farm.8. Killed and sold at the farm gate.9. The sum of all deaths, condemnations, exports and slaughter.Note(s): Inventory at January 1 or July 1 refers to the number of animals on the farm or feedlot at January 1 or July 1. All other balance sheet items represent
activity that occurred within the six month reporting period.
18 Statistics Canada – Catalogue no. 23-011-X
Sheep Statistics – 2012
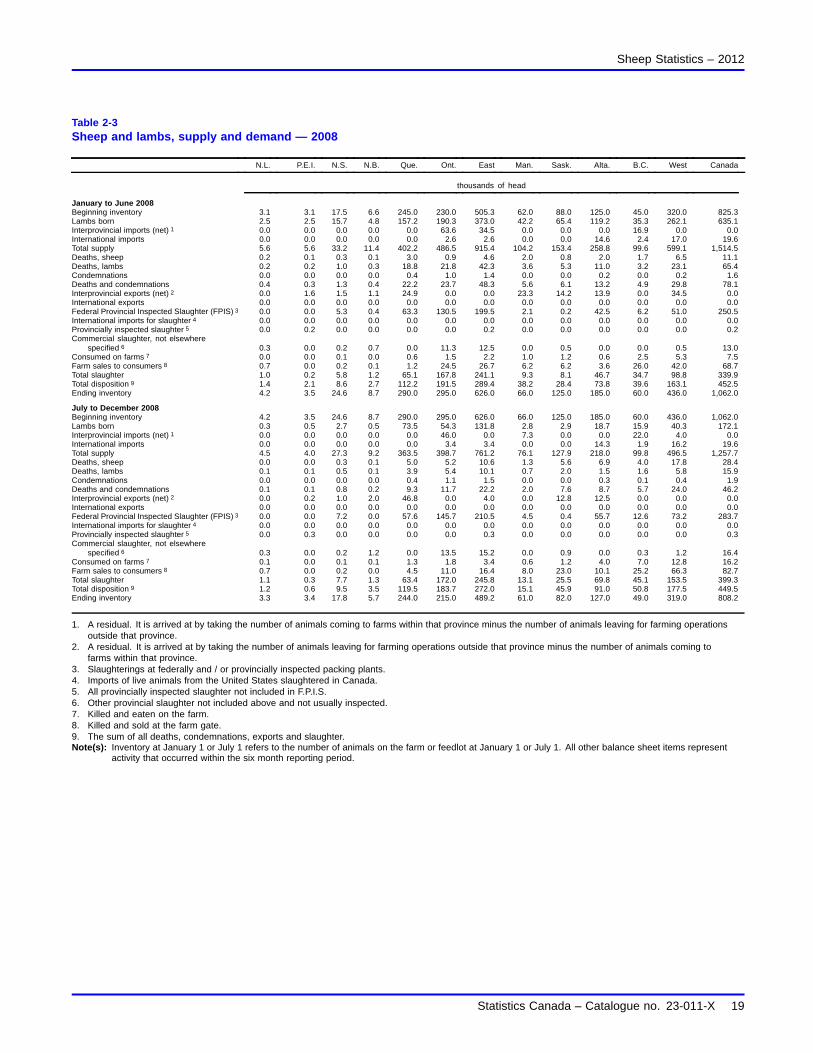
Table 2-3Sheep and lambs, supply and demand — 2008
N.L. P.E.I. N.S. N.B. Que. Ont. East Man. Sask. Alta. B.C. West Canada
thousands of head
January to June 2008Beginning inventory 3.1 3.1 17.5 6.6 245.0 230.0 505.3 62.0 88.0 125.0 45.0 320.0 825.3Lambs born 2.5 2.5 15.7 4.8 157.2 190.3 373.0 42.2 65.4 119.2 35.3 262.1 635.1Interprovincial imports (net) 1 0.0 0.0 0.0 0.0 0.0 63.6 34.5 0.0 0.0 0.0 16.9 0.0 0.0International imports 0.0 0.0 0.0 0.0 0.0 2.6 2.6 0.0 0.0 14.6 2.4 17.0 19.6Total supply 5.6 5.6 33.2 11.4 402.2 486.5 915.4 104.2 153.4 258.8 99.6 599.1 1,514.5Deaths, sheep 0.2 0.1 0.3 0.1 3.0 0.9 4.6 2.0 0.8 2.0 1.7 6.5 11.1Deaths, lambs 0.2 0.2 1.0 0.3 18.8 21.8 42.3 3.6 5.3 11.0 3.2 23.1 65.4Condemnations 0.0 0.0 0.0 0.0 0.4 1.0 1.4 0.0 0.0 0.2 0.0 0.2 1.6Deaths and condemnations 0.4 0.3 1.3 0.4 22.2 23.7 48.3 5.6 6.1 13.2 4.9 29.8 78.1Interprovincial exports (net) 2 0.0 1.6 1.5 1.1 24.9 0.0 0.0 23.3 14.2 13.9 0.0 34.5 0.0International exports 0.0 0.0 0.0 0.0 0.0 0.0 0.0 0.0 0.0 0.0 0.0 0.0 0.0Federal Provincial Inspected Slaughter (FPIS) 3 0.0 0.0 5.3 0.4 63.3 130.5 199.5 2.1 0.2 42.5 6.2 51.0 250.5International imports for slaughter 4 0.0 0.0 0.0 0.0 0.0 0.0 0.0 0.0 0.0 0.0 0.0 0.0 0.0Provincially inspected slaughter 5 0.0 0.2 0.0 0.0 0.0 0.0 0.2 0.0 0.0 0.0 0.0 0.0 0.2Commercial slaughter, not elsewhere
specified 6 0.3 0.0 0.2 0.7 0.0 11.3 12.5 0.0 0.5 0.0 0.0 0.5 13.0Consumed on farms 7 0.0 0.0 0.1 0.0 0.6 1.5 2.2 1.0 1.2 0.6 2.5 5.3 7.5Farm sales to consumers 8 0.7 0.0 0.2 0.1 1.2 24.5 26.7 6.2 6.2 3.6 26.0 42.0 68.7Total slaughter 1.0 0.2 5.8 1.2 65.1 167.8 241.1 9.3 8.1 46.7 34.7 98.8 339.9Total disposition 9 1.4 2.1 8.6 2.7 112.2 191.5 289.4 38.2 28.4 73.8 39.6 163.1 452.5Ending inventory 4.2 3.5 24.6 8.7 290.0 295.0 626.0 66.0 125.0 185.0 60.0 436.0 1,062.0
July to December 2008Beginning inventory 4.2 3.5 24.6 8.7 290.0 295.0 626.0 66.0 125.0 185.0 60.0 436.0 1,062.0Lambs born 0.3 0.5 2.7 0.5 73.5 54.3 131.8 2.8 2.9 18.7 15.9 40.3 172.1Interprovincial imports (net) 1 0.0 0.0 0.0 0.0 0.0 46.0 0.0 7.3 0.0 0.0 22.0 4.0 0.0International imports 0.0 0.0 0.0 0.0 0.0 3.4 3.4 0.0 0.0 14.3 1.9 16.2 19.6Total supply 4.5 4.0 27.3 9.2 363.5 398.7 761.2 76.1 127.9 218.0 99.8 496.5 1,257.7Deaths, sheep 0.0 0.0 0.3 0.1 5.0 5.2 10.6 1.3 5.6 6.9 4.0 17.8 28.4Deaths, lambs 0.1 0.1 0.5 0.1 3.9 5.4 10.1 0.7 2.0 1.5 1.6 5.8 15.9Condemnations 0.0 0.0 0.0 0.0 0.4 1.1 1.5 0.0 0.0 0.3 0.1 0.4 1.9Deaths and condemnations 0.1 0.1 0.8 0.2 9.3 11.7 22.2 2.0 7.6 8.7 5.7 24.0 46.2Interprovincial exports (net) 2 0.0 0.2 1.0 2.0 46.8 0.0 4.0 0.0 12.8 12.5 0.0 0.0 0.0International exports 0.0 0.0 0.0 0.0 0.0 0.0 0.0 0.0 0.0 0.0 0.0 0.0 0.0Federal Provincial Inspected Slaughter (FPIS) 3 0.0 0.0 7.2 0.0 57.6 145.7 210.5 4.5 0.4 55.7 12.6 73.2 283.7International imports for slaughter 4 0.0 0.0 0.0 0.0 0.0 0.0 0.0 0.0 0.0 0.0 0.0 0.0 0.0Provincially inspected slaughter 5 0.0 0.3 0.0 0.0 0.0 0.0 0.3 0.0 0.0 0.0 0.0 0.0 0.3Commercial slaughter, not elsewhere
specified 6 0.3 0.0 0.2 1.2 0.0 13.5 15.2 0.0 0.9 0.0 0.3 1.2 16.4Consumed on farms 7 0.1 0.0 0.1 0.1 1.3 1.8 3.4 0.6 1.2 4.0 7.0 12.8 16.2Farm sales to consumers 8 0.7 0.0 0.2 0.0 4.5 11.0 16.4 8.0 23.0 10.1 25.2 66.3 82.7Total slaughter 1.1 0.3 7.7 1.3 63.4 172.0 245.8 13.1 25.5 69.8 45.1 153.5 399.3Total disposition 9 1.2 0.6 9.5 3.5 119.5 183.7 272.0 15.1 45.9 91.0 50.8 177.5 449.5Ending inventory 3.3 3.4 17.8 5.7 244.0 215.0 489.2 61.0 82.0 127.0 49.0 319.0 808.2
1. A residual. It is arrived at by taking the number of animals coming to farms within that province minus the number of animals leaving for farming operationsoutside that province.
2. A residual. It is arrived at by taking the number of animals leaving for farming operations outside that province minus the number of animals coming tofarms within that province.
3. Slaughterings at federally and / or provincially inspected packing plants.4. Imports of live animals from the United States slaughtered in Canada.5. All provincially inspected slaughter not included in F.P.I.S.6. Other provincial slaughter not included above and not usually inspected.7. Killed and eaten on the farm.8. Killed and sold at the farm gate.9. The sum of all deaths, condemnations, exports and slaughter.Note(s): Inventory at January 1 or July 1 refers to the number of animals on the farm or feedlot at January 1 or July 1. All other balance sheet items represent
activity that occurred within the six month reporting period.
Statistics Canada – Catalogue no. 23-011-X 19

Sheep Statistics – 2012
Table 2-4Sheep and lambs, supply and demand — 2009
N.L. P.E.I. N.S. N.B. Que. Ont. East Man. Sask. Alta. B.C. West Canada
thousands of head
January to June 2009Beginning inventory 3.3 3.4 17.8 5.7 244.0 215.0 489.2 61.0 82.0 127.0 49.0 319.0 808.2Lambs born 2.3 2.6 17.3 4.7 154.0 212.4 393.3 45.5 61.6 121.6 35.2 263.9 657.2Interprovincial imports (net) 1 0.0 0.0 0.0 0.0 0.0 74.8 47.5 0.0 0.0 0.0 12.5 0.0 0.0International imports 0.0 0.0 0.0 0.0 0.0 3.8 3.8 0.0 3.0 8.5 1.8 13.3 17.1Total supply 5.6 6.0 35.1 10.4 398.0 506.0 933.8 106.5 146.6 257.1 98.5 596.2 1,530.0Deaths, sheep 0.2 0.1 0.3 0.1 3.0 0.9 4.6 2.0 0.9 2.0 1.7 6.6 11.2Deaths, lambs 0.2 0.2 1.2 0.3 17.2 24.0 43.1 3.6 6.1 10.0 3.2 22.9 66.0Condemnations 0.0 0.0 0.0 0.0 0.4 1.0 1.4 0.0 0.0 0.2 0.0 0.2 1.6Deaths and condemnations 0.4 0.3 1.5 0.4 20.6 25.9 49.1 5.6 7.0 12.2 4.9 29.7 78.8Interprovincial exports (net) 2 0.0 1.4 1.5 0.8 23.6 0.0 0.0 20.5 17.8 21.7 0.0 47.5 0.0International exports 0.0 0.0 0.0 0.0 0.0 0.0 0.0 0.0 0.0 0.0 0.0 0.0 0.0Federal Provincial Inspected Slaughter (FPIS) 3 0.0 0.0 5.7 0.4 66.4 128.4 200.9 2.3 0.2 39.6 6.3 48.4 249.3International imports for slaughter 4 0.0 0.0 0.0 0.0 0.0 0.0 0.0 0.0 0.0 0.0 0.0 0.0 0.0Provincially inspected slaughter 5 0.0 0.2 0.0 0.0 0.0 0.0 0.2 0.0 0.0 0.0 0.0 0.0 0.2Commercial slaughter, not elsewhere
specified 6 0.4 0.0 0.2 0.6 0.0 11.1 12.3 0.0 0.2 0.0 0.1 0.3 12.6Consumed on farms 7 0.0 0.0 0.1 0.0 0.6 1.5 2.2 1.0 1.2 0.8 2.6 5.6 7.8Farm sales to consumers 8 0.8 0.0 0.2 0.1 1.3 24.1 26.5 6.1 6.2 5.8 26.6 44.7 71.2Total slaughter 1.2 0.2 6.2 1.1 68.3 165.1 242.1 9.4 7.8 46.2 35.6 99.0 341.1Total disposition 9 1.6 1.9 9.2 2.3 112.5 191.0 291.2 35.5 32.6 80.1 40.5 176.2 467.4Ending inventory 4.0 4.1 25.9 8.1 285.5 315.0 642.6 71.0 114.0 177.0 58.0 420.0 1,062.6
July to December 2009Beginning inventory 4.0 4.1 25.9 8.1 285.5 315.0 642.6 71.0 114.0 177.0 58.0 420.0 1,062.6Lambs born 0.1 0.4 2.8 0.8 76.8 54.5 135.4 2.8 3.1 16.4 13.8 36.1 171.5Interprovincial imports (net) 1 0.0 0.1 0.0 0.0 0.0 24.0 0.0 0.0 0.0 5.4 20.3 20.0 0.0International imports 0.0 0.0 0.0 0.0 0.1 2.8 2.9 0.0 9.7 1.8 2.1 13.6 16.5Total supply 4.1 4.6 28.7 8.9 362.4 396.3 780.9 73.8 126.8 200.6 94.2 489.7 1,270.6Deaths, sheep 0.0 0.0 0.1 0.1 4.6 5.2 10.0 1.1 5.9 7.5 4.0 18.5 28.5Deaths, lambs 0.1 0.1 0.3 0.1 3.3 5.4 9.3 0.5 2.1 1.7 1.6 5.9 15.2Condemnations 0.0 0.0 0.1 0.0 0.4 1.1 1.6 0.0 0.0 0.2 0.1 0.3 1.9Deaths and condemnations 0.1 0.1 0.5 0.2 8.3 11.7 20.9 1.6 8.0 9.4 5.7 24.7 45.6Interprovincial exports (net) 2 0.0 0.0 0.8 2.2 41.1 0.0 20.0 0.0 5.7 0.0 0.0 0.0 0.0International exports 0.0 0.0 0.0 0.0 0.0 0.0 0.0 0.0 0.0 0.0 0.0 0.0 0.0Federal Provincial Inspected Slaughter (FPIS) 3 0.0 0.0 9.6 0.0 68.7 140.0 218.3 5.8 0.5 50.1 12.7 69.1 287.4International imports for slaughter 4 0.0 0.0 0.0 0.0 0.0 0.0 0.0 0.0 0.0 0.0 0.0 0.0 0.0Provincially inspected slaughter 5 0.0 0.3 0.0 0.0 0.0 0.0 0.3 0.0 0.0 0.0 0.0 0.0 0.3Commercial slaughter, not elsewhere
specified 6 0.4 0.0 0.0 1.2 0.0 13.4 15.0 0.0 0.9 0.0 0.2 1.1 16.1Consumed on farms 7 0.1 0.0 0.0 0.1 1.3 1.8 3.3 0.6 1.2 4.0 7.0 12.8 16.1Farm sales to consumers 8 0.7 0.0 0.0 0.0 4.5 10.9 16.1 6.8 23.0 10.1 23.6 63.5 79.6Total slaughter 1.2 0.3 9.6 1.3 74.5 166.1 253.0 13.2 25.6 64.2 43.5 146.5 399.5Total disposition 9 1.3 0.4 10.9 3.7 123.9 177.8 293.9 14.8 39.3 73.6 49.2 171.2 465.1Ending inventory 2.8 4.2 17.8 5.2 238.5 218.5 487.0 59.0 87.5 127.0 45.0 318.5 805.5
1. A residual. It is arrived at by taking the number of animals coming to farms within that province minus the number of animals leaving for farming operationsoutside that province.
2. A residual. It is arrived at by taking the number of animals leaving for farming operations outside that province minus the number of animals coming tofarms within that province.
3. Slaughterings at federally and / or provincially inspected packing plants.4. Imports of live animals from the United States slaughtered in Canada.5. All provincially inspected slaughter not included in F.P.I.S.6. Other provincial slaughter not included above and not usually inspected.7. Killed and eaten on the farm.8. Killed and sold at the farm gate.9. The sum of all deaths, condemnations, exports and slaughter.Note(s): Inventory at January 1 or July 1 refers to the number of animals on the farm or feedlot at January 1 or July 1. All other balance sheet items represent
activity that occurred within the six month reporting period.
20 Statistics Canada – Catalogue no. 23-011-X

Sheep Statistics – 2012
Table 2-5Sheep and lambs, supply and demand — 2010
N.L. P.E.I. N.S. N.B. Que. Ont. East Man. Sask. Alta. B.C. West Canada
thousands of head
January to June 2010Beginning inventory 2.8 4.2 17.8 5.2 238.5 218.5 487.0 59.0 87.5 127.0 45.0 318.5 805.5Lambs born 2.1 3.1 16.7 4.7 145.0 209.2 380.8 41.9 61.3 115.1 33.2 251.5 632.3Interprovincial imports (net) 1 0.0 0.0 0.0 0.0 0.0 71.7 43.2 0.0 0.0 0.0 13.2 0.0 0.0International imports 0.0 0.0 1.6 0.0 0.0 2.8 4.4 0.0 7.6 2.4 4.6 14.6 19.0Total supply 4.9 7.3 36.1 9.9 383.5 502.2 915.4 100.9 156.4 244.5 96.0 584.6 1,500.0Deaths, sheep 0.1 0.1 0.2 0.1 2.8 1.0 4.3 1.7 1.6 1.9 1.8 7.0 11.3Deaths, lambs 0.2 0.2 0.9 0.3 17.0 22.0 40.6 3.3 6.8 9.7 3.5 23.3 63.9Condemnations 0.0 0.0 0.0 0.0 0.4 1.0 1.4 0.0 0.0 0.2 0.0 0.2 1.6Deaths and condemnations 0.3 0.3 1.1 0.4 20.2 24.0 46.3 5.0 8.4 11.8 5.3 30.5 76.8Interprovincial exports (net) 2 0.0 1.1 1.1 0.5 25.8 0.0 0.0 20.8 26.1 9.5 0.0 43.2 0.0International exports 0.0 0.0 0.0 0.0 0.0 0.0 0.0 0.0 0.0 0.0 0.0 0.0 0.0Federal Provincial Inspected Slaughter (FPIS) 3 0.0 0.0 7.4 0.6 61.2 126.2 195.4 2.9 0.3 37.6 5.9 46.7 242.1International imports for slaughter 4 0.0 0.0 0.0 0.0 0.0 0.0 0.0 0.0 0.0 0.0 0.0 0.0 0.0Provincially inspected slaughter 5 0.0 0.2 0.0 0.0 0.0 0.0 0.2 0.0 0.0 0.0 0.0 0.0 0.2Commercial slaughter, not elsewhere
specified 6 0.5 0.0 0.1 0.4 0.0 11.0 12.0 0.0 0.2 0.0 0.0 0.2 12.2Consumed on farms 7 0.0 0.0 0.0 0.0 0.6 1.5 2.1 1.0 1.2 0.8 2.6 5.6 7.7Farm sales to consumers 8 0.6 0.0 0.0 0.0 1.2 24.0 25.8 6.2 6.2 5.8 26.7 44.9 70.7Total slaughter 1.1 0.2 7.5 1.0 63.0 162.7 235.5 10.1 7.9 44.2 35.2 97.4 332.9Total disposition 9 1.4 1.6 9.7 1.9 109.0 186.7 281.8 35.9 42.4 65.5 40.5 171.1 452.9Ending inventory 3.5 5.7 26.4 8.0 274.5 315.5 633.6 65.0 114.0 179.0 55.5 413.5 1,047.1
July to December 2010Beginning inventory 3.5 5.7 26.4 8.0 274.5 315.5 633.6 65.0 114.0 179.0 55.5 413.5 1,047.1Lambs born 0.1 1.0 2.8 0.7 71.7 62.4 138.7 3.8 3.5 18.8 13.7 39.8 178.5Interprovincial imports (net) 1 0.2 0.0 0.0 0.0 0.0 27.5 0.0 0.0 0.0 8.1 20.4 22.7 0.0International imports 0.0 0.0 0.6 0.0 0.0 0.1 0.7 0.0 8.0 4.0 1.8 13.8 14.5Total supply 3.8 6.7 29.8 8.7 346.2 405.5 773.0 68.8 125.5 209.9 91.4 489.8 1,262.8Deaths, sheep 0.0 0.0 0.1 0.1 4.6 5.1 9.9 1.0 5.8 7.8 4.0 18.6 28.5Deaths, lambs 0.1 0.1 0.3 0.1 3.2 5.3 9.1 0.5 2.1 1.7 1.6 5.9 15.0Condemnations 0.0 0.0 0.1 0.0 0.4 1.0 1.5 0.0 0.0 0.2 0.0 0.2 1.7Deaths and condemnations 0.1 0.1 0.5 0.2 8.2 11.4 20.5 1.5 7.9 9.7 5.6 24.7 45.2Interprovincial exports (net) 2 0.0 0.2 0.8 1.6 47.8 0.0 22.7 0.6 5.2 0.0 0.0 0.0 0.0International exports 0.0 0.0 0.0 0.0 0.0 1.4 1.4 0.0 0.0 0.0 0.0 0.0 1.4Federal Provincial Inspected Slaughter (FPIS) 3 0.0 0.0 9.4 0.0 59.2 135.8 204.4 6.9 0.6 50.9 12.2 70.6 275.0International imports for slaughter 4 0.0 0.0 0.0 0.0 0.0 0.0 0.0 0.0 0.0 0.0 0.0 0.0 0.0Provincially inspected slaughter 5 0.0 0.4 0.0 0.0 0.0 0.0 0.4 0.0 0.0 0.0 0.0 0.0 0.4Commercial slaughter, not elsewhere
specified 6 0.3 0.0 0.0 1.2 0.0 12.2 13.7 0.0 0.8 0.0 0.2 1.0 14.7Consumed on farms 7 0.1 0.0 0.0 0.0 1.0 1.8 2.9 0.5 1.0 4.3 7.0 12.8 15.7Farm sales to consumers 8 0.1 0.0 0.0 0.0 4.0 10.9 15.0 6.3 20.0 12.0 21.9 60.2 75.2Total slaughter 0.5 0.4 9.4 1.2 64.2 160.7 236.4 13.7 22.4 67.2 41.3 144.6 381.0Total disposition 9 0.6 0.7 10.7 3.0 120.2 173.5 281.0 15.8 35.5 76.9 46.9 169.3 450.3Ending inventory 3.2 6.0 19.1 5.7 226.0 232.0 492.0 53.0 90.0 133.0 44.5 320.5 812.5
1. A residual. It is arrived at by taking the number of animals coming to farms within that province minus the number of animals leaving for farming operationsoutside that province.
2. A residual. It is arrived at by taking the number of animals leaving for farming operations outside that province minus the number of animals coming tofarms within that province.
3. Slaughterings at federally and / or provincially inspected packing plants.4. Imports of live animals from the United States slaughtered in Canada.5. All provincially inspected slaughter not included in F.P.I.S.6. Other provincial slaughter not included above and not usually inspected.7. Killed and eaten on the farm.8. Killed and sold at the farm gate.9. The sum of all deaths, condemnations, exports and slaughter.Note(s): Inventory at January 1 or July 1 refers to the number of animals on the farm or feedlot at January 1 or July 1. All other balance sheet items represent
activity that occurred within the six month reporting period.
Statistics Canada – Catalogue no. 23-011-X 21
Sheep Statistics – 2012
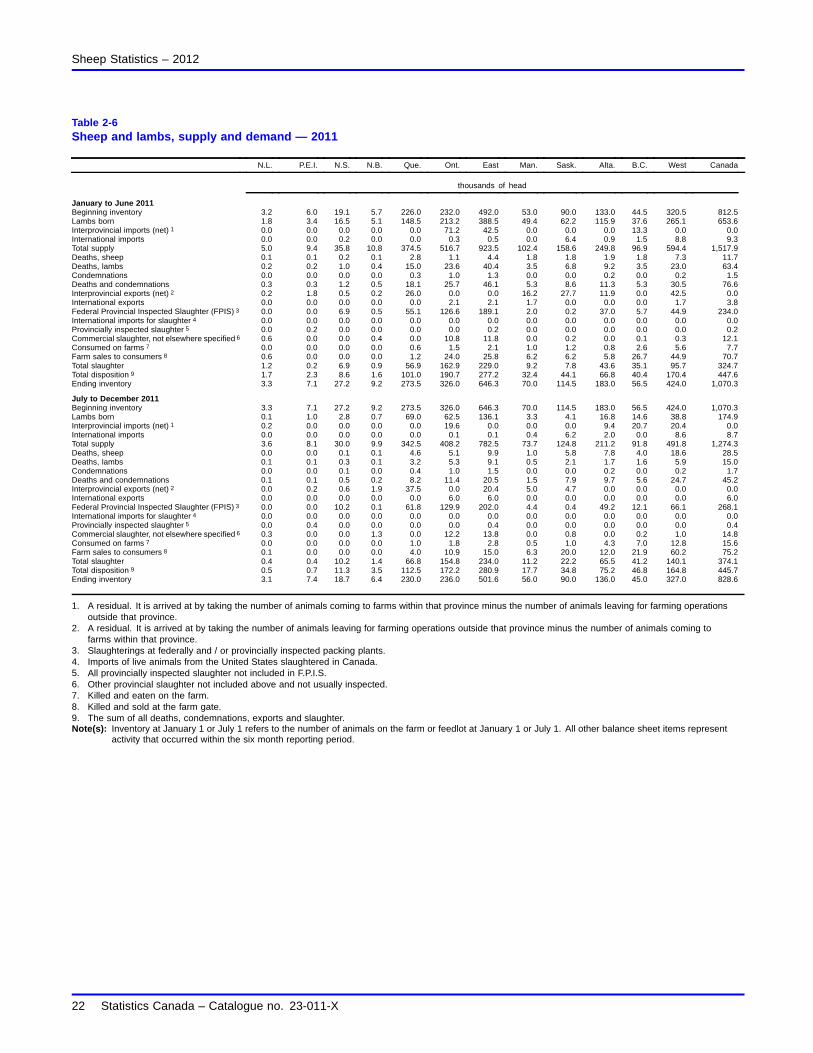
Table 2-6Sheep and lambs, supply and demand — 2011
N.L. P.E.I. N.S. N.B. Que. Ont. East Man. Sask. Alta. B.C. West Canada
thousands of head
January to June 2011Beginning inventory 3.2 6.0 19.1 5.7 226.0 232.0 492.0 53.0 90.0 133.0 44.5 320.5 812.5Lambs born 1.8 3.4 16.5 5.1 148.5 213.2 388.5 49.4 62.2 115.9 37.6 265.1 653.6Interprovincial imports (net) 1 0.0 0.0 0.0 0.0 0.0 71.2 42.5 0.0 0.0 0.0 13.3 0.0 0.0International imports 0.0 0.0 0.2 0.0 0.0 0.3 0.5 0.0 6.4 0.9 1.5 8.8 9.3Total supply 5.0 9.4 35.8 10.8 374.5 516.7 923.5 102.4 158.6 249.8 96.9 594.4 1,517.9Deaths, sheep 0.1 0.1 0.2 0.1 2.8 1.1 4.4 1.8 1.8 1.9 1.8 7.3 11.7Deaths, lambs 0.2 0.2 1.0 0.4 15.0 23.6 40.4 3.5 6.8 9.2 3.5 23.0 63.4Condemnations 0.0 0.0 0.0 0.0 0.3 1.0 1.3 0.0 0.0 0.2 0.0 0.2 1.5Deaths and condemnations 0.3 0.3 1.2 0.5 18.1 25.7 46.1 5.3 8.6 11.3 5.3 30.5 76.6Interprovincial exports (net) 2 0.2 1.8 0.5 0.2 26.0 0.0 0.0 16.2 27.7 11.9 0.0 42.5 0.0International exports 0.0 0.0 0.0 0.0 0.0 2.1 2.1 1.7 0.0 0.0 0.0 1.7 3.8Federal Provincial Inspected Slaughter (FPIS) 3 0.0 0.0 6.9 0.5 55.1 126.6 189.1 2.0 0.2 37.0 5.7 44.9 234.0International imports for slaughter 4 0.0 0.0 0.0 0.0 0.0 0.0 0.0 0.0 0.0 0.0 0.0 0.0 0.0Provincially inspected slaughter 5 0.0 0.2 0.0 0.0 0.0 0.0 0.2 0.0 0.0 0.0 0.0 0.0 0.2Commercial slaughter, not elsewhere specified 6 0.6 0.0 0.0 0.4 0.0 10.8 11.8 0.0 0.2 0.0 0.1 0.3 12.1Consumed on farms 7 0.0 0.0 0.0 0.0 0.6 1.5 2.1 1.0 1.2 0.8 2.6 5.6 7.7Farm sales to consumers 8 0.6 0.0 0.0 0.0 1.2 24.0 25.8 6.2 6.2 5.8 26.7 44.9 70.7Total slaughter 1.2 0.2 6.9 0.9 56.9 162.9 229.0 9.2 7.8 43.6 35.1 95.7 324.7Total disposition 9 1.7 2.3 8.6 1.6 101.0 190.7 277.2 32.4 44.1 66.8 40.4 170.4 447.6Ending inventory 3.3 7.1 27.2 9.2 273.5 326.0 646.3 70.0 114.5 183.0 56.5 424.0 1,070.3
July to December 2011Beginning inventory 3.3 7.1 27.2 9.2 273.5 326.0 646.3 70.0 114.5 183.0 56.5 424.0 1,070.3Lambs born 0.1 1.0 2.8 0.7 69.0 62.5 136.1 3.3 4.1 16.8 14.6 38.8 174.9Interprovincial imports (net) 1 0.2 0.0 0.0 0.0 0.0 19.6 0.0 0.0 0.0 9.4 20.7 20.4 0.0International imports 0.0 0.0 0.0 0.0 0.0 0.1 0.1 0.4 6.2 2.0 0.0 8.6 8.7Total supply 3.6 8.1 30.0 9.9 342.5 408.2 782.5 73.7 124.8 211.2 91.8 491.8 1,274.3Deaths, sheep 0.0 0.0 0.1 0.1 4.6 5.1 9.9 1.0 5.8 7.8 4.0 18.6 28.5Deaths, lambs 0.1 0.1 0.3 0.1 3.2 5.3 9.1 0.5 2.1 1.7 1.6 5.9 15.0Condemnations 0.0 0.0 0.1 0.0 0.4 1.0 1.5 0.0 0.0 0.2 0.0 0.2 1.7Deaths and condemnations 0.1 0.1 0.5 0.2 8.2 11.4 20.5 1.5 7.9 9.7 5.6 24.7 45.2Interprovincial exports (net) 2 0.0 0.2 0.6 1.9 37.5 0.0 20.4 5.0 4.7 0.0 0.0 0.0 0.0International exports 0.0 0.0 0.0 0.0 0.0 6.0 6.0 0.0 0.0 0.0 0.0 0.0 6.0Federal Provincial Inspected Slaughter (FPIS) 3 0.0 0.0 10.2 0.1 61.8 129.9 202.0 4.4 0.4 49.2 12.1 66.1 268.1International imports for slaughter 4 0.0 0.0 0.0 0.0 0.0 0.0 0.0 0.0 0.0 0.0 0.0 0.0 0.0Provincially inspected slaughter 5 0.0 0.4 0.0 0.0 0.0 0.0 0.4 0.0 0.0 0.0 0.0 0.0 0.4Commercial slaughter, not elsewhere specified 6 0.3 0.0 0.0 1.3 0.0 12.2 13.8 0.0 0.8 0.0 0.2 1.0 14.8Consumed on farms 7 0.0 0.0 0.0 0.0 1.0 1.8 2.8 0.5 1.0 4.3 7.0 12.8 15.6Farm sales to consumers 8 0.1 0.0 0.0 0.0 4.0 10.9 15.0 6.3 20.0 12.0 21.9 60.2 75.2Total slaughter 0.4 0.4 10.2 1.4 66.8 154.8 234.0 11.2 22.2 65.5 41.2 140.1 374.1Total disposition 9 0.5 0.7 11.3 3.5 112.5 172.2 280.9 17.7 34.8 75.2 46.8 164.8 445.7Ending inventory 3.1 7.4 18.7 6.4 230.0 236.0 501.6 56.0 90.0 136.0 45.0 327.0 828.6
1. A residual. It is arrived at by taking the number of animals coming to farms within that province minus the number of animals leaving for farming operationsoutside that province.
2. A residual. It is arrived at by taking the number of animals leaving for farming operations outside that province minus the number of animals coming tofarms within that province.
3. Slaughterings at federally and / or provincially inspected packing plants.4. Imports of live animals from the United States slaughtered in Canada.5. All provincially inspected slaughter not included in F.P.I.S.6. Other provincial slaughter not included above and not usually inspected.7. Killed and eaten on the farm.8. Killed and sold at the farm gate.9. The sum of all deaths, condemnations, exports and slaughter.Note(s): Inventory at January 1 or July 1 refers to the number of animals on the farm or feedlot at January 1 or July 1. All other balance sheet items represent
activity that occurred within the six month reporting period.
22 Statistics Canada – Catalogue no. 23-011-X

Sheep Statistics – 2012
Table 3Shorn wool production, disposition and farm value
Quantitypurchased
Quantityused on
farms
Averageprice paid to
producer
Totalfarm
value
thousands of kg $/kg thousands of $
2006Newfoundland and Labrador 3.4 0.9 1.22 5Prince Edward Island 4.4 0.5 1.38 7Nova Scotia 26.8 1.2 1.12 31New Brunswick 14.1 0.9 0.97 14Quebec 327.3 6.2 0.45 150Ontario 393.9 15.6 0.56 229Manitoba 69.9 3.3 0.65 48Saskatchewan 105.2 4.2 0.78 85Alberta 288.7 9.0 0.91 271British Columbia 21.5 14.7 0.68 25Canada 1,255.2 56.5 0.66 865
2007Newfoundland and Labrador 2.0 0.8 1.43 4Prince Edward Island 3.9 0.4 1.43 6Nova Scotia 24.8 1.2 1.21 31New Brunswick 1.5 0.8 1.43 3Quebec 266.1 5.7 0.40 109Ontario 450.9 14.8 0.61 284Manitoba 67.0 3.0 0.67 47Saskatchewan 127.9 3.7 1.05 138Alberta 303.0 8.2 0.98 305British Columbia 21.4 14.3 0.78 28Canada 1,268.5 52.9 0.72 955
2008Newfoundland and Labrador 4.3 0.8 1.09 6Prince Edward Island 3.9 0.4 1.21 5Nova Scotia 21.6 1.2 1.07 24New Brunswick 1.5 0.8 1.21 3Quebec 249.9 5.7 0.41 105Ontario 386.8 14.8 0.53 213Manitoba 51.7 3.0 0.68 37Saskatchewan 117.2 3.7 0.89 108Alberta 270.5 8.2 0.89 248British Columbia 19.7 14.3 0.78 27Canada 1,127.1 52.9 0.66 776
2009Newfoundland and Labrador 3.0 0.8 1.50 6Prince Edward Island 4.5 0.4 1.50 7Nova Scotia 22.1 1.2 1.36 32New Brunswick 1.5 0.8 1.50 3Quebec 268.1 5.7 0.38 104Ontario 414.2 14.8 0.53 227Manitoba 79.1 3.0 0.77 63Saskatchewan 80.9 3.7 0.65 55Alberta 250.6 8.2 0.94 243British Columbia 14.4 14.3 0.51 15Canada 1,138.4 52.9 0.63 755
2010Newfoundland and Labrador 2.8 0.8 1.50 5Prince Edward Island 5.2 0.4 1.50 8Nova Scotia 21.8 1.2 1.41 32New Brunswick 1.4 0.8 1.50 3Quebec 250.3 5.7 0.49 125Ontario 467.6 14.8 0.66 318Manitoba 50.8 3.0 0.73 39Saskatchewan 125.1 3.7 1.16 149Alberta 226.7 8.2 1.45 341British Columbia 29.1 14.3 0.96 42Canada 1,180.8 52.9 0.86 1,062
Note(s): Totals may not add due to rounding.
Statistics Canada – Catalogue no. 23-011-X 23
Sheep Statistics – 2012
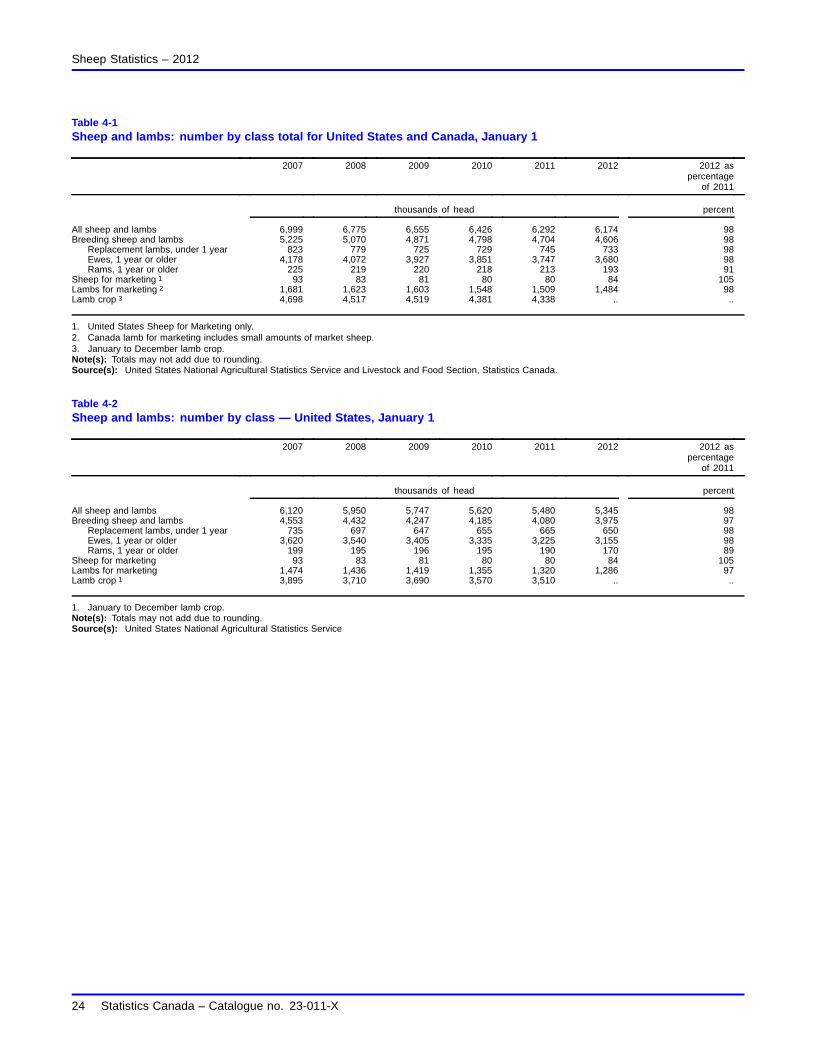
Table 4-1Sheep and lambs: number by class total for United States and Canada, January 1
2007 2008 2009 2010 2011 2012 2012 aspercentage
of 2011
thousands of head percent
All sheep and lambs 6,999 6,775 6,555 6,426 6,292 6,174 98Breeding sheep and lambs 5,225 5,070 4,871 4,798 4,704 4,606 98
Replacement lambs, under 1 year 823 779 725 729 745 733 98Ewes, 1 year or older 4,178 4,072 3,927 3,851 3,747 3,680 98Rams, 1 year or older 225 219 220 218 213 193 91
Sheep for marketing 1 93 83 81 80 80 84 105Lambs for marketing 2 1,681 1,623 1,603 1,548 1,509 1,484 98Lamb crop 3 4,698 4,517 4,519 4,381 4,338 .. ..
1. United States Sheep for Marketing only.2. Canada lamb for marketing includes small amounts of market sheep.3. January to December lamb crop.Note(s): Totals may not add due to rounding.Source(s): United States National Agricultural Statistics Service and Livestock and Food Section, Statistics Canada.
Table 4-2Sheep and lambs: number by class — United States, January 1
2007 2008 2009 2010 2011 2012 2012 aspercentage
of 2011
thousands of head percent
All sheep and lambs 6,120 5,950 5,747 5,620 5,480 5,345 98Breeding sheep and lambs 4,553 4,432 4,247 4,185 4,080 3,975 97
Replacement lambs, under 1 year 735 697 647 655 665 650 98Ewes, 1 year or older 3,620 3,540 3,405 3,335 3,225 3,155 98Rams, 1 year or older 199 195 196 195 190 170 89
Sheep for marketing 93 83 81 80 80 84 105Lambs for marketing 1,474 1,436 1,419 1,355 1,320 1,286 97Lamb crop 1 3,895 3,710 3,690 3,570 3,510 .. ..
1. January to December lamb crop.Note(s): Totals may not add due to rounding.Source(s): United States National Agricultural Statistics Service
24 Statistics Canada – Catalogue no. 23-011-X
Sheep Statistics – 2012
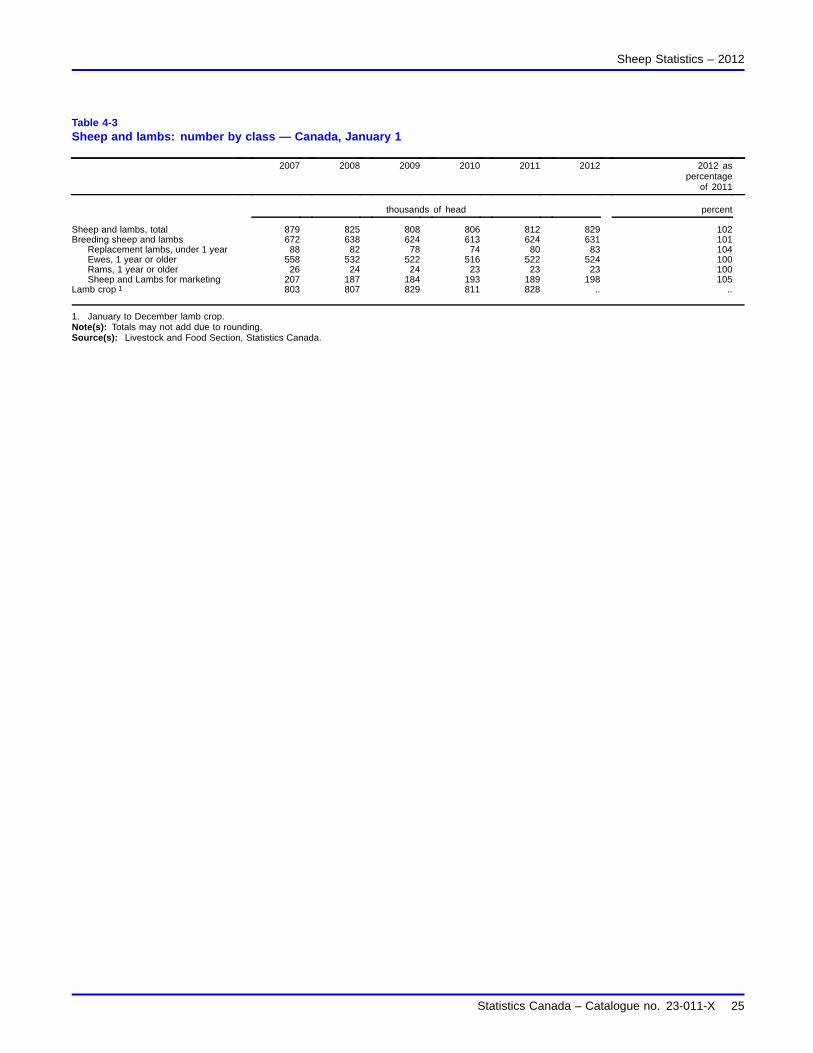
Table 4-3Sheep and lambs: number by class — Canada, January 1
2007 2008 2009 2010 2011 2012 2012 aspercentage
of 2011
thousands of head percent
Sheep and lambs, total 879 825 808 806 812 829 102Breeding sheep and lambs 672 638 624 613 624 631 101
Replacement lambs, under 1 year 88 82 78 74 80 83 104Ewes, 1 year or older 558 532 522 516 522 524 100Rams, 1 year or older 26 24 24 23 23 23 100Sheep and Lambs for marketing 207 187 184 193 189 198 105
Lamb crop 1 803 807 829 811 828 .. ..
1. January to December lamb crop.Note(s): Totals may not add due to rounding.Source(s): Livestock and Food Section, Statistics Canada.
Statistics Canada – Catalogue no. 23-011-X 25
Concepts and methodology
Concepts
Livestock statistics
Inventory levels of the various types of livestock intended for sale in Canada are measured at specific timesthroughout the year. Surveyed operations are requested to include all animals located on the farming operation,regardless of ownership. They are also asked to include animals owned but pastured on a community pasture,grazing co-op or public land. Producers are asked to exclude animals owned but kept on a farm, ranch or feedlotoperated by someone else. Inventory levels are estimated for cattle, calves, pigs, sheep and lambs. Estimatesare also produced for certain categories of animals on the basis of age, sex, weight and/or purpose i.e. breedingor slaughter.
Current information on livestock inventories and related statistics such as supply and disposition enable thoseactive in the agricultural sector to observe and assess changes in the industry, measure performance and keepthe agricultural community and general public informed of developments. The primary data users are federal andprovincial governments, producer boards, farmers and farm organizations, private business, academic researchinstitutions and students. Livestock data assists governments in formulating agricultural policies and developingprograms. Farming organizations use statistics in developing recommendations for producers and governments.Farmers make increasing use of prices, production, and marketing statistics in planning their operations. Inaddition, these livestock statistics are used in the calculation of farm incomes and in the Canadian System ofNational Accounts for indicators such as gross domestic product.
Methods
To produce livestock estimates, there are actually 6 different survey occasions. All of the survey occasions collectdata primarily using Computer Assisted Telephone Interviews (CATI) although there are special procedures in placefor the very large or complex operations.
Two of the occasions are the January Livestock Survey and the July Livestock Survey. These are large-scale generallivestock surveys collecting data on cattle, hogs and sheep, referring to inventories at the 1st of the month. Theprobability samples include about 10,260 operations at January 1, and about 10,000 operations at July 1. Thesesurveys collect data during a three-week period in the western provinces, Ontario and Quebec. Regardless of whenoperators respond, they are asked to report inventories as of January 1 or July 1. The livestock survey results arereleased, following processing and analysis, approximately seven weeks after the reference date.
Hog inventories are the focus of two other survey occasions collecting estimates of pig numbers at April 1 andOctober 1. This survey was initiated in 1998 as estimates from 1978 to 1997 were based solely on analyticaltools. For the hog surveys, a sub-sample of the prior livestock survey is used. The probability samples areapproximately 2,100 operations and 2,500 operations, respectively, at April 1 and October 1 and, similar to thelivestock surveys, these CATI surveys cover the western provinces, Ontario and Quebec. Producers are requestedto report their inventories as of the reference date, although the data are collected during a 7-day period near orbefore that date. The hog survey results are normally released three to four weeks after the reference date.
26 Statistics Canada – Catalogue no. 23-011-X

Sheep Statistics – 2012
The June and November Atlantic Surveys are used to produce estimates for that region. These surveys aremulti-purpose collecting data, primarily inventories, on livestock including cattle, hogs and sheep in addition tocollecting data related to the area, yield and production of the principal field crops. The probability samples areabout 1,000 operations in June and 1,100 operations in November. The results are released at the same timeas the livestock results. For reference points where surveys do not exist for the Atlantic region, analytical toolsare used to produce the estimates.
The total inventories are now distributed to a specific farm type, on the basis of survey results and sector levelbalance sheets. The two major categories are dairy and beef. The beef sector is then broken down to beef cattleon cow/calf and mixed beef and dairy operations; beef cattle on feeder, stocker/finish operations; and, beef cattleon feeding operations, which include feedlots.
Canadian exports to the United States are obtained from U.S. import custom documents and are officially releasedby the International Trade Division of Statistics Canada. These data try to register the province of origin of thecommodity, but when unknown, will reflect the province of entry into the United States. Information from secondarysources is used by Agriculture Division of Statistics Canada to better estimate the province in which the commoditywas raised/grown. Administrative data from the provinces are used to adjust the export numbers by province tobetter reflect provincial production. Though this methodology will result in different exports by province, the Canadianexport totals will equal those released by International Trade Division. At release, some export data are unavailable.The missing data are imputed based on historical and auxiliary data sourced from the United States Animal and PlantHealth Inspection Service. The imputed data are replaced with actual International Trade data when it becomesavailable.
To summarize, the livestock statistics are survey-based estimates. The survey relies on a list frame that is establishedevery five years by the Census of Agriculture and updated to include new entrants, particularly large hog operations.The probability sample surveys are conducted by telephone. The survey results are analysed and corrected beforethe data are used to analyse the industry and fine-tune the estimates. The survey data are reviewed in a boardenvironment before the commodity analyst works with the data primarily using supply-disposition analysis. Theresults of the industry analysis are reviewed by the board before being sent to the individual provinces. Once thedata are finalised they are released to the public and published. The principal data released include inventoriesand summarized supply-disposition tables. The data also flow, via farm income estimates, to the Canadian Systemof National Accounts. In addition the data are used in the calculation of net farm income projections, produced byAgriculture and Agri-Food Canada in co-operation with Statistics Canada and the provinces.
Statistics Canada – Catalogue no. 23-011-X 27