Sheep and Goats Final Estimates 2004-2008 · Sheep and Goats Final Estimates 2004-2008 Agricultural...
38
United States Department of Agriculture National Agricultural Statistics Service Statistical Bulletin Number 1023 Sheep and Goats Final Estimates 2004-2008 March 2009
Transcript of Sheep and Goats Final Estimates 2004-2008 · Sheep and Goats Final Estimates 2004-2008 Agricultural...
United States Department of Agriculture National Agricultural Statistics Service Statistical Bulletin Number 1023
Sheep and Goats Final Estimates 2004-2008 March 2009

Sheep and Goats Final Estimates 2004-2008 Agricultural Statistics Board March 2009 1 NASS, USDA
Contents Page Summary ......................................................................................................................................... 2
Sheep and Lambs: Number by Class, U.S., January 1, 2004-2008 ............................................... 3
Lamb Crop: U.S., 2003-2007......................................................................................................... 3
Wool Production: United States, 2003-2007 ................................................................................. 3
All Sheep and Lambs: Number by State and U.S., January 1, 2004-2008 .................................... 4
Breeding Sheep and Lambs: Number by Class, State, and U.S., January 1, 2004-2008 ............... 5
Market Sheep and Lambs: Number by Weight Group, State, and U.S.......................................... 9
Lamb Crop: Breeding Ewes 1 Year Old and Older by State and U.S.,
January 1, 2003-2007.................................................................................................................... 14
Lamb Crop: Per Ewes 1+ by State and U.S., January 1, 2003-2007 ........................................... 15
Lamb Crop: By State and U.S., 2003-2007 ................................................................................. 16
Wool: Shorn, Weight per Fleece, Production, Price and Value by State and U.S., 2003-2007 .. 17
Sheep and Lambs: By Region and U.S., July 1, 2003-2007 ......................................................... 22
All Goats: Number by class, U.S., January 1, 2005-2008 ........................................................... 26
Angora Goats: Number by class, U.S., January 1, 2005-2008 .................................................... 26
Milk Goats: Number by class, U.S., January 1, 2005-2008......................................................... 27
Meat and Other Goats: Number by class, U.S., January 1, 2005-2008 ....................................... 27
Mohair: Production, Price, and Value, Selected States and U.S., 2003-2007 ............................. 28
Angora Goats: Number by State and U.S., January 1, 2005-2008 .............................................. 29
Milk Goats: Number by State and U.S., January 1, 2005-2008................................................... 30
Meat and Other Goats: Number by State and U.S., January 1, 2005-2008 ................................. 31
All Goats: Number by class, U.S., July 1, 2005-2007 ................................................................. 32
Angora Goats: Number by class, U.S., July 1, 2005-2007 .......................................................... 32
Milk Goats: Number by class, U.S., July 1, 2005-2007 .............................................................. 33
Meat and Other Goats: Number by class, U.S., July 1, 2005-2007 ............................................. 33
Information Contacts..................................................................................................................... 34
Statistical Bulletin Publication Schedule and other ASB Services............................................... 35
Sheep and Goats Final Estimates 2004-2008 Agricultural Statistics Board March 2009 2 NASS, USDA
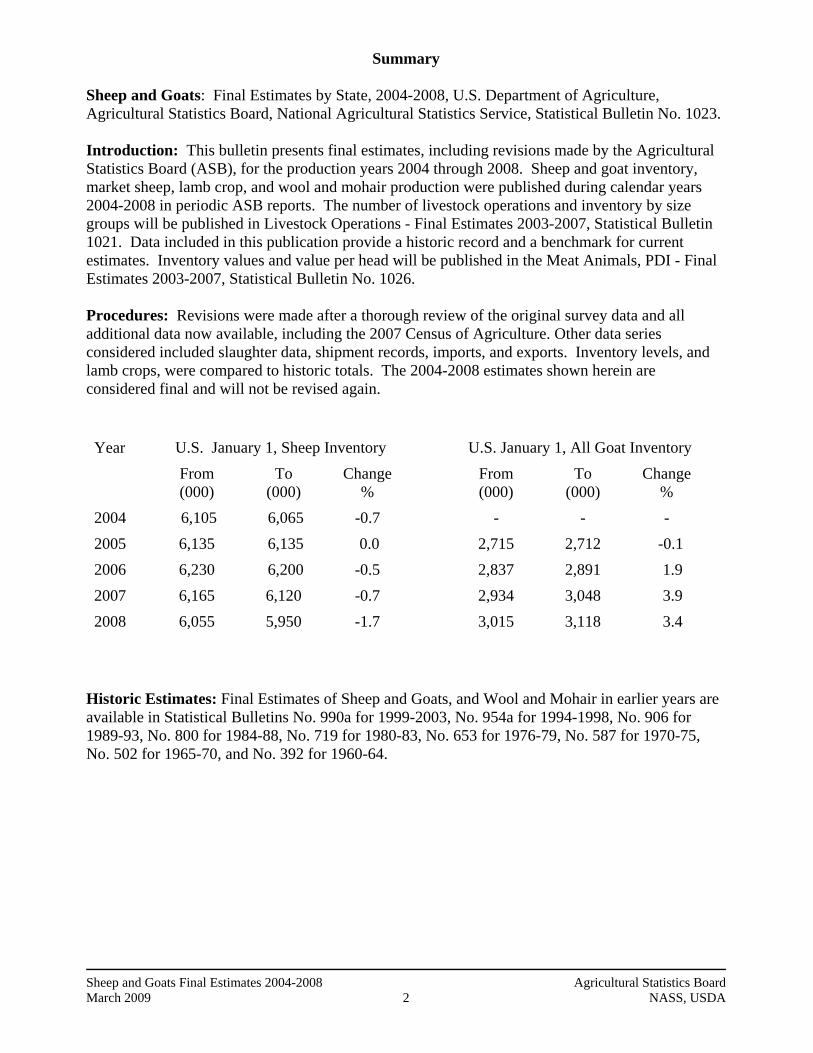
Summary Sheep and Goats: Final Estimates by State, 2004-2008, U.S. Department of Agriculture, Agricultural Statistics Board, National Agricultural Statistics Service, Statistical Bulletin No. 1023. Introduction: This bulletin presents final estimates, including revisions made by the Agricultural Statistics Board (ASB), for the production years 2004 through 2008. Sheep and goat inventory, market sheep, lamb crop, and wool and mohair production were published during calendar years 2004-2008 in periodic ASB reports. The number of livestock operations and inventory by size groups will be published in Livestock Operations - Final Estimates 2003-2007, Statistical Bulletin 1021. Data included in this publication provide a historic record and a benchmark for current estimates. Inventory values and value per head will be published in the Meat Animals, PDI - Final Estimates 2003-2007, Statistical Bulletin No. 1026. Procedures: Revisions were made after a thorough review of the original survey data and all additional data now available, including the 2007 Census of Agriculture. Other data series considered included slaughter data, shipment records, imports, and exports. Inventory levels, and lamb crops, were compared to historic totals. The 2004-2008 estimates shown herein are considered final and will not be revised again.
U.S. January 1, Sheep Inventory U.S. January 1, All Goat Inventory Year
From (000)
To (000)
Change %
From (000)
To (000)
Change %
2004 6,105 6,065 -0.7 - - - 2005 6,135 6,135 0.0 2,715 2,712 -0.1 2006 6,230 6,200 -0.5 2,837 2,891 1.9 2007 6,165 6,120 -0.7 2,934 3,048 3.9 2008 6,055 5,950 -1.7 3,015 3,118 3.4
Historic Estimates: Final Estimates of Sheep and Goats, and Wool and Mohair in earlier years are available in Statistical Bulletins No. 990a for 1999-2003, No. 954a for 1994-1998, No. 906 for 1989-93, No. 800 for 1984-88, No. 719 for 1980-83, No. 653 for 1976-79, No. 587 for 1970-75, No. 502 for 1965-70, and No. 392 for 1960-64.
Sheep and Goats Final Estimates 2004-2008 Agricultural Statistics Board March 2009 3 NASS, USDA
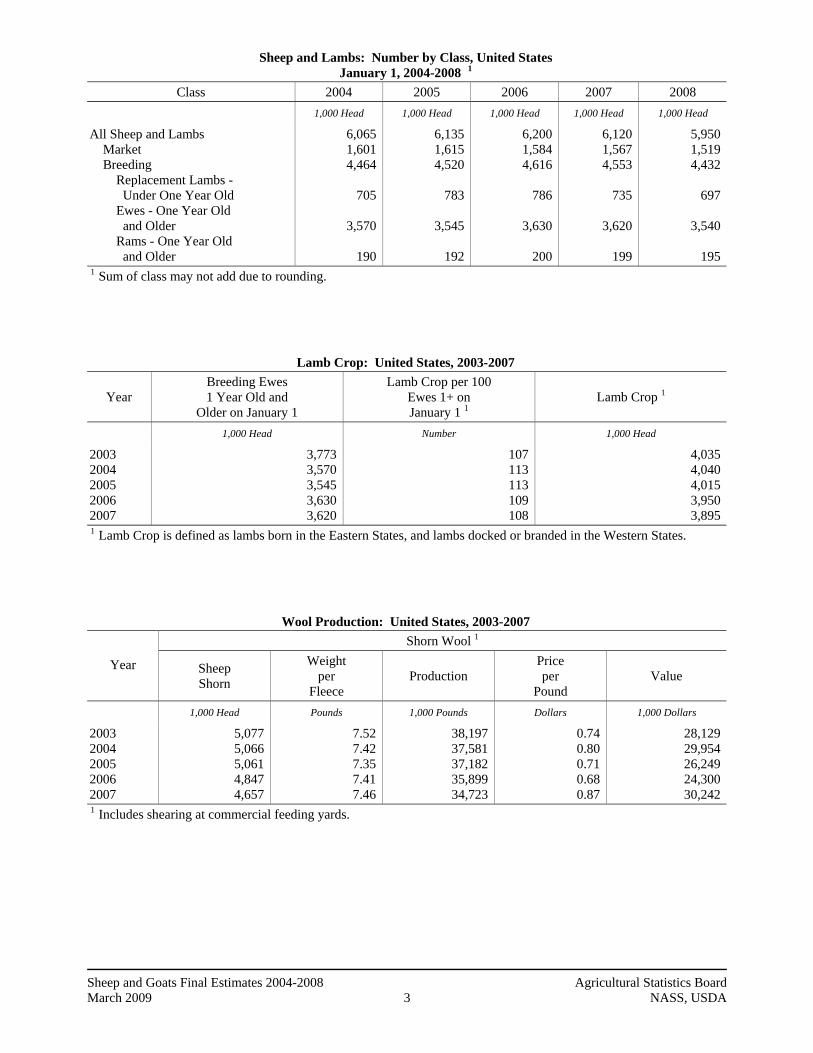
Sheep and Lambs: Number by Class, United States January 1, 2004-2008 1
Class 2004 2005 2006 2007 2008
1,000 Head 1,000 Head 1,000 Head 1,000 Head 1,000 Head
All Sheep and Lambs Market Breeding Replacement Lambs - Under One Year Old Ewes - One Year Old and Older Rams - One Year Old and Older
6,065 1,601 4,464
705
3,570
190
6,135 1,615 4,520
783
3,545
192
6,200 1,584 4,616
786
3,630
200
6,120 1,567 4,553
735
3,620
199
5,950 1,519 4,432
697
3,540
195
1 Sum of class may not add due to rounding.
Lamb Crop: United States, 2003-2007
Year Breeding Ewes 1 Year Old and
Older on January 1
Lamb Crop per 100 Ewes 1+ on January 1 1
Lamb Crop 1
1,000 Head Number 1,000 Head
2003 2004 2005 2006 2007
3,773 3,570 3,545 3,630 3,620
107 113 113 109 108
4,035 4,040 4,015 3,950 3,895
1 Lamb Crop is defined as lambs born in the Eastern States, and lambs docked or branded in the Western States.
Wool Production: United States, 2003-2007 Shorn Wool 1
Year Sheep Shorn
Weight per
Fleece Production
Price per
Pound Value
1,000 Head Pounds 1,000 Pounds Dollars 1,000 Dollars
2003 2004 2005 2006 2007
5,077 5,066 5,061 4,847 4,657
7.52 7.42 7.35 7.41 7.46
38,197 37,581 37,182 35,899 34,723
0.74 0.80 0.71 0.68 0.87
28,129 29,954 26,249 24,300 30,242
1 Includes shearing at commercial feeding yards.
Sheep and Goats Final Estimates 2004-2008 Agricultural Statistics Board March 2009 4 NASS, USDA
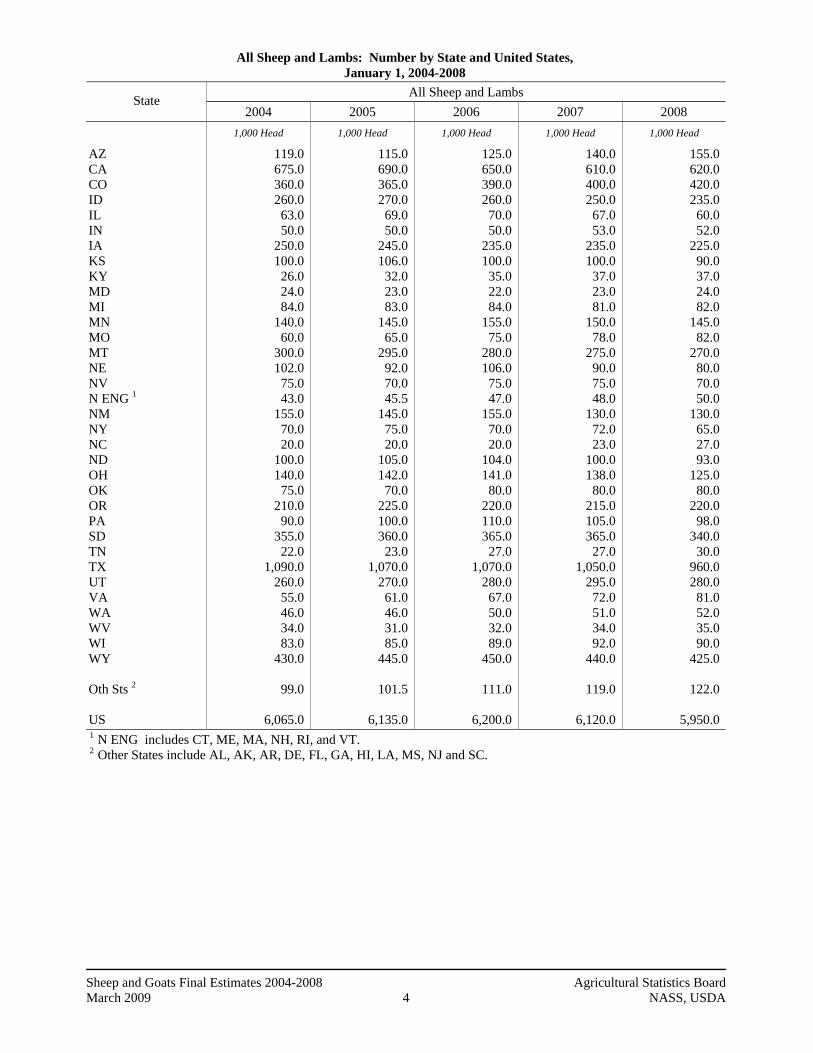
All Sheep and Lambs: Number by State and United States, January 1, 2004-2008
All Sheep and Lambs State 2004 2005 2006 2007 2008
1,000 Head 1,000 Head 1,000 Head 1,000 Head 1,000 Head
AZ CA CO ID IL IN IA KS KY MD MI MN MO MT NE NV N ENG 1 NM NY NC ND OH OK OR PA SD TN TX UT VA WA WV WI WY Oth Sts 2 US
119.0 675.0 360.0 260.0 63.0 50.0
250.0 100.0 26.0 24.0 84.0
140.0 60.0
300.0 102.0 75.0 43.0
155.0 70.0 20.0
100.0 140.0 75.0
210.0 90.0
355.0 22.0
1,090.0 260.0 55.0 46.0 34.0 83.0
430.0
99.0
6,065.0
115.0 690.0 365.0 270.0 69.0 50.0
245.0 106.0 32.0 23.0 83.0
145.0 65.0
295.0 92.0 70.0 45.5
145.0 75.0 20.0
105.0 142.0 70.0
225.0 100.0 360.0 23.0
1,070.0 270.0 61.0 46.0 31.0 85.0
445.0
101.5
6,135.0
125.0 650.0 390.0 260.0 70.0 50.0
235.0 100.0 35.0 22.0 84.0
155.0 75.0
280.0 106.0 75.0 47.0
155.0 70.0 20.0
104.0 141.0 80.0
220.0 110.0 365.0 27.0
1,070.0 280.0 67.0 50.0 32.0 89.0
450.0
111.0
6,200.0
140.0 610.0 400.0 250.0 67.0 53.0
235.0 100.0 37.0 23.0 81.0
150.0 78.0
275.0 90.0 75.0 48.0
130.0 72.0 23.0
100.0 138.0 80.0
215.0 105.0 365.0 27.0
1,050.0 295.0 72.0 51.0 34.0 92.0
440.0
119.0
6,120.0
155.0 620.0 420.0 235.0 60.0 52.0
225.0 90.0 37.0 24.0 82.0
145.0 82.0
270.0 80.0 70.0 50.0
130.0 65.0 27.0 93.0
125.0 80.0
220.0 98.0
340.0 30.0
960.0 280.0 81.0 52.0 35.0 90.0
425.0
122.0
5,950.0 1 N ENG includes CT, ME, MA, NH, RI, and VT. 2 Other States include AL, AK, AR, DE, FL, GA, HI, LA, MS, NJ and SC.
Sheep and Goats Final Estimates 2004-2008 Agricultural Statistics Board March 2009 5 NASS, USDA
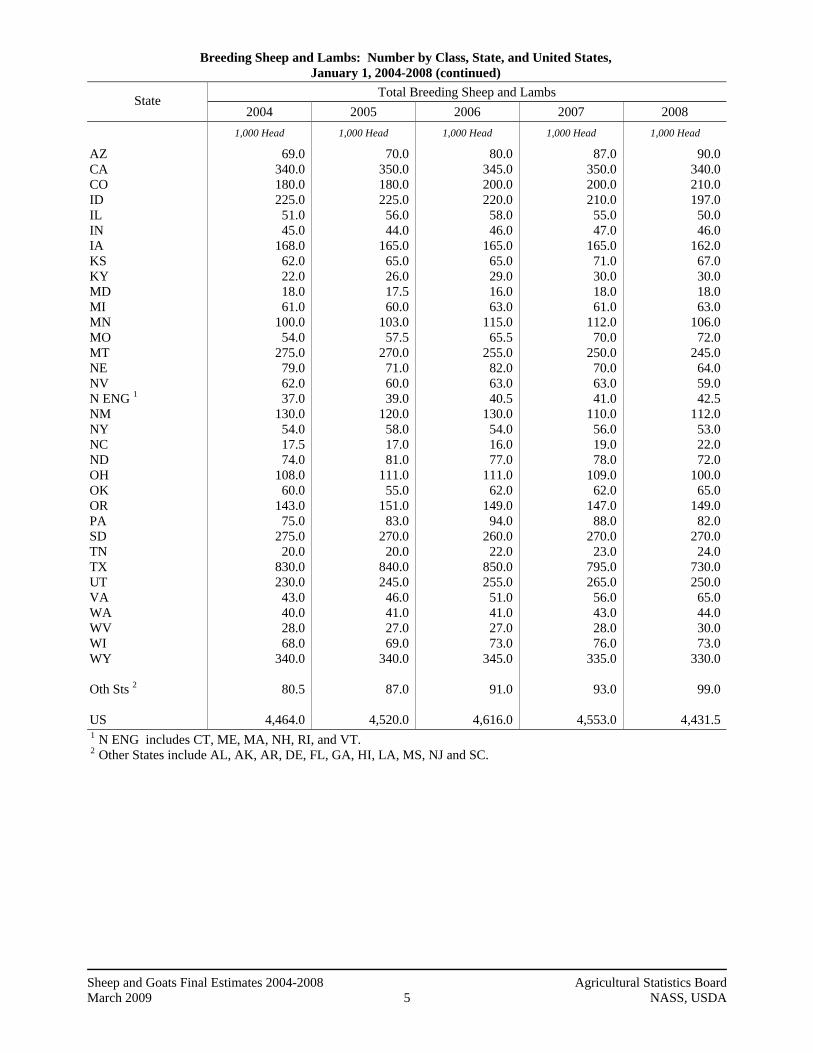
Breeding Sheep and Lambs: Number by Class, State, and United States, January 1, 2004-2008 (continued)
Total Breeding Sheep and Lambs State 2004 2005 2006 2007 2008
1,000 Head 1,000 Head 1,000 Head 1,000 Head 1,000 Head
AZ CA CO ID IL IN IA KS KY MD MI MN MO MT NE NV N ENG 1 NM NY NC ND OH OK OR PA SD TN TX UT VA WA WV WI WY Oth Sts 2 US
69.0 340.0 180.0 225.0 51.0 45.0
168.0 62.0 22.0 18.0 61.0
100.0 54.0
275.0 79.0 62.0 37.0
130.0 54.0 17.5 74.0
108.0 60.0
143.0 75.0
275.0 20.0
830.0 230.0 43.0 40.0 28.0 68.0
340.0
80.5
4,464.0
70.0 350.0 180.0 225.0 56.0 44.0
165.0 65.0 26.0 17.5 60.0
103.0 57.5
270.0 71.0 60.0 39.0
120.0 58.0 17.0 81.0
111.0 55.0
151.0 83.0
270.0 20.0
840.0 245.0 46.0 41.0 27.0 69.0
340.0
87.0
4,520.0
80.0 345.0 200.0 220.0 58.0 46.0
165.0 65.0 29.0 16.0 63.0
115.0 65.5
255.0 82.0 63.0 40.5
130.0 54.0 16.0 77.0
111.0 62.0
149.0 94.0
260.0 22.0
850.0 255.0 51.0 41.0 27.0 73.0
345.0
91.0
4,616.0
87.0 350.0 200.0 210.0 55.0 47.0
165.0 71.0 30.0 18.0 61.0
112.0 70.0
250.0 70.0 63.0 41.0
110.0 56.0 19.0 78.0
109.0 62.0
147.0 88.0
270.0 23.0
795.0 265.0 56.0 43.0 28.0 76.0
335.0
93.0
4,553.0
90.0 340.0 210.0 197.0 50.0 46.0
162.0 67.0 30.0 18.0 63.0
106.0 72.0
245.0 64.0 59.0 42.5
112.0 53.0 22.0 72.0
100.0 65.0
149.0 82.0
270.0 24.0
730.0 250.0 65.0 44.0 30.0 73.0
330.0
99.0
4,431.5 1 N ENG includes CT, ME, MA, NH, RI, and VT. 2 Other States include AL, AK, AR, DE, FL, GA, HI, LA, MS, NJ and SC.

Sheep and Goats Final Estimates 2004-2008 Agricultural Statistics Board March 2009 6 NASS, USDA
Breeding Sheep and Lambs: Number by Class, State, and United States, January 1, 2004-2008 (continued)
Ewes One Year Old and Older State 2004 2005 2006 2007 2008
1,000 Head 1,000 Head 1,000 Head 1,000 Head 1,000 Head
AZ CA CO ID IL IN IA KS KY MD MI MN MO MT NE NV N ENG 1 NM NY NC ND OH OK OR PA SD TN TX UT VA WA WV WI WY Oth Sts 2 US
60.0 290.0 149.0 184.0 36.0 34.0
135.0 51.0 16.0 15.0 45.0 80.0 45.0
210.0 65.0 47.0 28.0
108.0 41.0 12.0 59.0 78.0 45.0
112.0 58.0
225.0 14.0
665.0 195.0 34.0 32.0 23.0 52.0
270.0
57.0
3,570.0
58.0 290.0 145.0 182.0 40.0 33.0
132.0 54.0 18.0 14.0 46.0 83.0 47.0
205.0 58.0 46.0 29.0 97.0 43.0 12.0 63.0 80.0 41.0
120.0 63.0
210.0 14.0
650.0 200.0 35.0 32.0 21.0 52.0
270.0
62.0
3,545.0
64.0 290.0 158.0 178.0 42.0 33.0
127.0 52.0 22.5 12.5 48.0 90.0 52.0
195.0 67.0 47.0 30.5
102.0 41.0 11.5 62.0 80.0 46.0
121.0 70.0
210.0 15.0
670.0 205.0 40.0 33.0 22.0 56.0
273.0
64.0
3,630.0
70.0 290.0 162.0 166.0 38.0 36.0
131.0 54.0 22.0 14.0 47.0 87.0 55.0
195.0 58.0 49.0 31.0 90.0 43.0 13.0 62.0 80.0 46.0
118.0 66.0
225.0 17.0
650.0 215.0 43.0 35.0 23.0 58.0
265.0
66.0
3,620.0
76.0 285.0 170.0 162.0 35.0 35.0
130.0 53.0 23.0 14.0 48.0 86.0 57.0
190.0 52.0 46.0 32.0 89.0 43.0 16.0 60.0 75.0 46.0
120.0 63.0
220.0 18.0
590.0 210.0 50.0 36.0 24.0 56.0
260.0
70.0
3,540.0 1 N ENG includes CT, ME, MA, NH, RI, and VT. 2 Other States include AL, AK, AR, DE, FL, GA, HI, LA, MS, NJ and SC.
Sheep and Goats Final Estimates 2004-2008 Agricultural Statistics Board March 2009 7 NASS, USDA
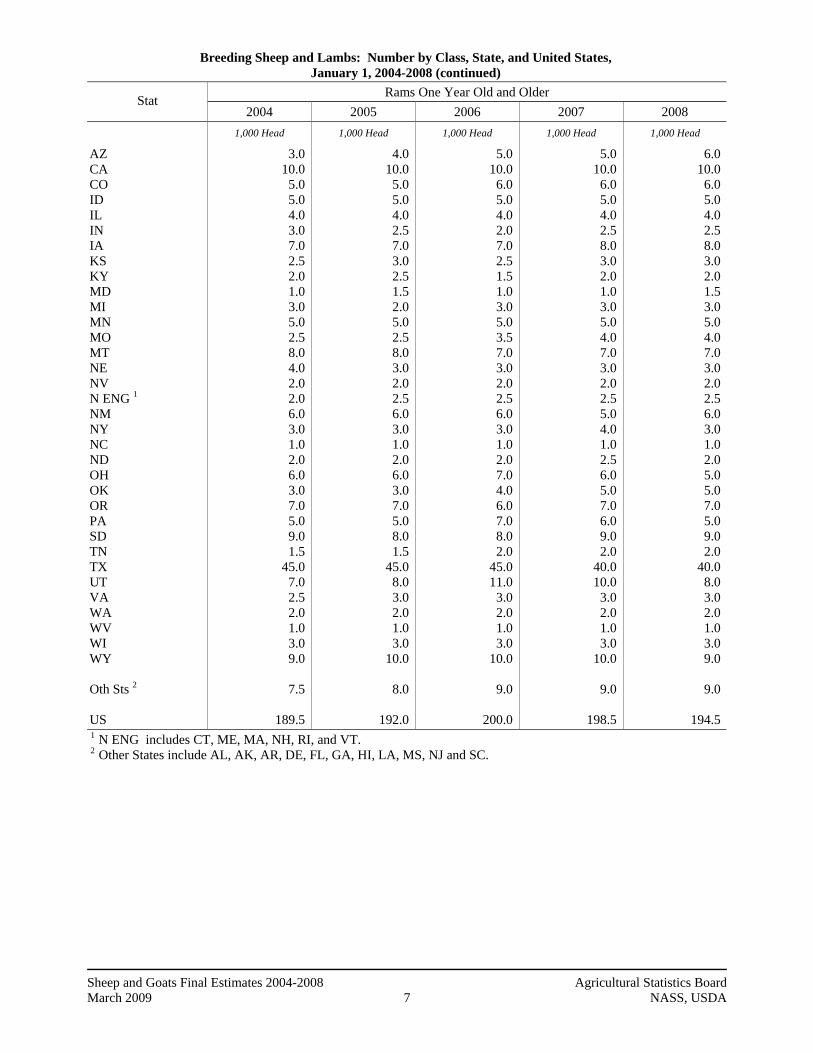
Breeding Sheep and Lambs: Number by Class, State, and United States, January 1, 2004-2008 (continued)
Rams One Year Old and Older Stat 2004 2005 2006 2007 2008
1,000 Head 1,000 Head 1,000 Head 1,000 Head 1,000 Head
AZ CA CO ID IL IN IA KS KY MD MI MN MO MT NE NV N ENG 1 NM NY NC ND OH OK OR PA SD TN TX UT VA WA WV WI WY Oth Sts 2 US
3.0 10.0
5.0 5.0 4.0 3.0 7.0 2.5 2.0 1.0 3.0 5.0 2.5 8.0 4.0 2.0 2.0 6.0 3.0 1.0 2.0 6.0 3.0 7.0 5.0 9.0 1.5
45.0 7.0 2.5 2.0 1.0 3.0 9.0
7.5
189.5
4.0 10.0
5.0 5.0 4.0 2.5 7.0 3.0 2.5 1.5 2.0 5.0 2.5 8.0 3.0 2.0 2.5 6.0 3.0 1.0 2.0 6.0 3.0 7.0 5.0 8.0 1.5
45.0 8.0 3.0 2.0 1.0 3.0
10.0
8.0
192.0
5.0 10.0
6.0 5.0 4.0 2.0 7.0 2.5 1.5 1.0 3.0 5.0 3.5 7.0 3.0 2.0 2.5 6.0 3.0 1.0 2.0 7.0 4.0 6.0 7.0 8.0 2.0
45.0 11.0
3.0 2.0 1.0 3.0
10.0
9.0
200.0
5.0 10.0
6.0 5.0 4.0 2.5 8.0 3.0 2.0 1.0 3.0 5.0 4.0 7.0 3.0 2.0 2.5 5.0 4.0 1.0 2.5 6.0 5.0 7.0 6.0 9.0 2.0
40.0 10.0
3.0 2.0 1.0 3.0
10.0
9.0
198.5
6.0 10.0
6.0 5.0 4.0 2.5 8.0 3.0 2.0 1.5 3.0 5.0 4.0 7.0 3.0 2.0 2.5 6.0 3.0 1.0 2.0 5.0 5.0 7.0 5.0 9.0 2.0
40.0 8.0 3.0 2.0 1.0 3.0 9.0
9.0
194.5
1 N ENG includes CT, ME, MA, NH, RI, and VT. 2 Other States include AL, AK, AR, DE, FL, GA, HI, LA, MS, NJ and SC.

Sheep and Goats Final Estimates 2004-2008 Agricultural Statistics Board March 2009 8 NASS, USDA
Breeding Sheep and Lambs: Number by Class, State, and United States, January 1, 2004-2008 (continued)
Replacement Lambs State 2004 2005 2006 2007 2008
1,000 Head 1,000 Head 1,000 Head 1,000 Head 1,000 Head
AZ CA CO ID IL IN IA KS KY MD MI MN MO MT NE NV N ENG 1 NM NY NC ND OH OK OR PA SD TN TX UT VA WA WV WI WY Oth Sts 2 US
6.0 40.0 26.0 36.0 11.0
8.0 26.0
8.5 4.0 2.0
13.0 15.0
6.5 57.0 10.0 13.0
7.0 16.0 10.0
4.5 13.0 24.0 12.0 24.0 12.0 41.0
4.5 120.0 28.0
6.5 6.0 4.0
13.0 61.0
16.0
704.5
8.0 50.0 30.0 38.0 12.0
8.5 26.0
8.0 5.5 2.0
12.0 15.0
8.0 57.0 10.0 12.0
7.5 17.0 12.0
4.0 16.0 25.0 11.0 24.0 15.0 52.0
4.5 145.0 37.0
8.0 7.0 5.0
14.0 60.0
17.0
783.0
11.0 45.0 36.0 37.0 12.0 11.0 31.0 10.5
5.0 2.5
12.0 20.0 10.0 53.0 12.0 14.0
7.5 22.0 10.0
3.5 13.0 24.0 12.0 22.0 17.0 42.0
5.0 135.0 39.0
8.0 6.0 4.0
14.0 62.0
18.0
786.0
12.0 50.0 32.0 39.0 13.0
8.5 26.0 14.0
6.0 3.0
11.0 20.0 11.0 48.0
9.0 12.0
7.5 15.0
9.0 5.0
13.5 23.0 11.0 22.0 16.0 36.0
4.0 105.0 40.0 10.0
6.0 4.0
15.0 60.0
18.0
734.5
8.0 45.0 34.0 30.0 11.0
8.5 24.0 11.0
5.0 2.5
12.0 15.0 11.0 48.0
9.0 11.0
8.0 17.0
7.0 5.0
10.0 20.0 14.0 22.0 14.0 41.0
4.0 100.0 32.0 12.0
6.0 5.0
14.0 61.0
20.0
697.0
1 N ENG includes CT, ME, MA, NH, RI, and VT. 2 Other States include AL, AK, AR, DE, FL, GA, HI, LA, MS, NJ and SC.
Sheep and Goats Final Estimates 2004-2008 Agricultural Statistics Board March 2009 9 NASS, USDA
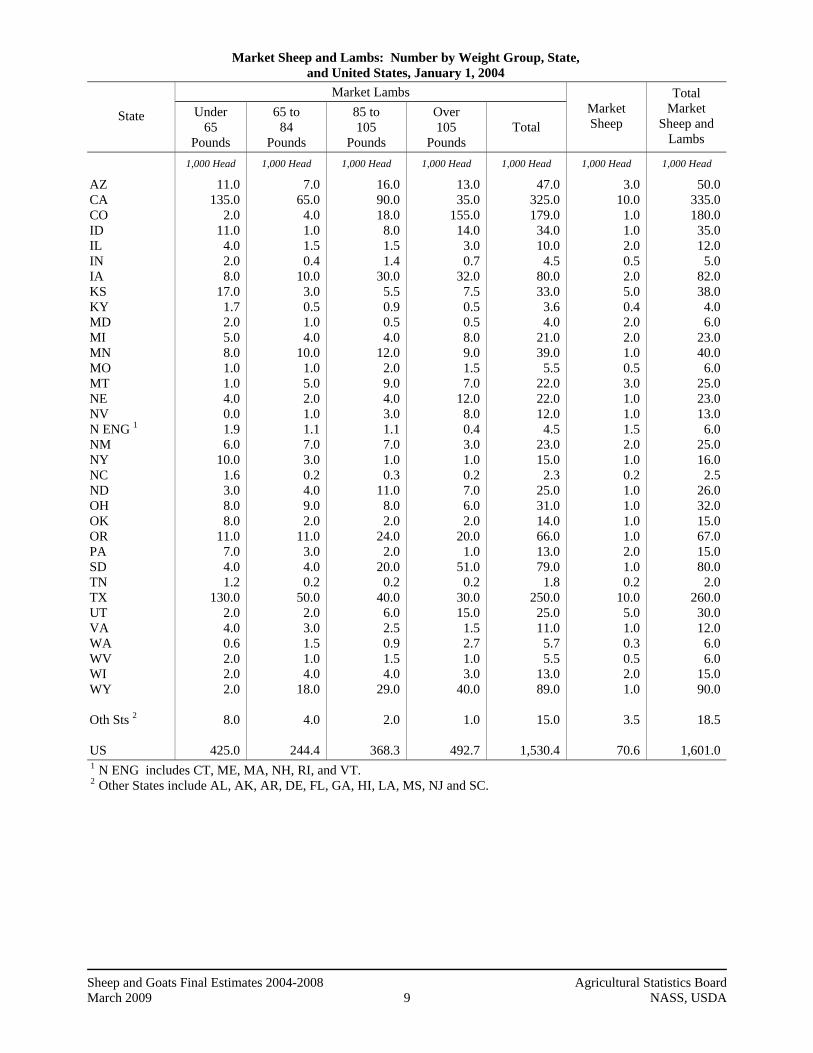
Market Sheep and Lambs: Number by Weight Group, State, and United States, January 1, 2004
Market Lambs
State Under 65
Pounds
65 to 84
Pounds
85 to 105
Pounds
Over 105
Pounds Total
Market Sheep
Total Market
Sheep and Lambs
1,000 Head 1,000 Head 1,000 Head 1,000 Head 1,000 Head 1,000 Head 1,000 Head
AZ CA CO ID IL IN IA KS KY MD MI MN MO MT NE NV N ENG 1 NM NY NC ND OH OK OR PA SD TN TX UT VA WA WV WI WY Oth Sts 2 US
11.0 135.0
2.0 11.0
4.0 2.0 8.0
17.0 1.7 2.0 5.0 8.0 1.0 1.0 4.0 0.0 1.9 6.0
10.0 1.6 3.0 8.0 8.0
11.0 7.0 4.0 1.2
130.0 2.0 4.0 0.6 2.0 2.0 2.0
8.0
425.0
7.0 65.0
4.0 1.0 1.5 0.4
10.0 3.0 0.5 1.0 4.0
10.0 1.0 5.0 2.0 1.0 1.1 7.0 3.0 0.2 4.0 9.0 2.0
11.0 3.0 4.0 0.2
50.0 2.0 3.0 1.5 1.0 4.0
18.0
4.0
244.4
16.0 90.0 18.0
8.0 1.5 1.4
30.0 5.5 0.9 0.5 4.0
12.0 2.0 9.0 4.0 3.0 1.1 7.0 1.0 0.3
11.0 8.0 2.0
24.0 2.0
20.0 0.2
40.0 6.0 2.5 0.9 1.5 4.0
29.0
2.0
368.3
13.0 35.0
155.0 14.0
3.0 0.7
32.0 7.5 0.5 0.5 8.0 9.0 1.5 7.0
12.0 8.0 0.4 3.0 1.0 0.2 7.0 6.0 2.0
20.0 1.0
51.0 0.2
30.0 15.0
1.5 2.7 1.0 3.0
40.0
1.0
492.7
47.0 325.0 179.0 34.0 10.0
4.5 80.0 33.0
3.6 4.0
21.0 39.0
5.5 22.0 22.0 12.0
4.5 23.0 15.0
2.3 25.0 31.0 14.0 66.0 13.0 79.0
1.8 250.0 25.0 11.0
5.7 5.5
13.0 89.0
15.0
1,530.4
3.0 10.0
1.0 1.0 2.0 0.5 2.0 5.0 0.4 2.0 2.0 1.0 0.5 3.0 1.0 1.0 1.5 2.0 1.0 0.2 1.0 1.0 1.0 1.0 2.0 1.0 0.2
10.0 5.0 1.0 0.3 0.5 2.0 1.0
3.5
70.6
50.0 335.0 180.0 35.0 12.0
5.0 82.0 38.0
4.0 6.0
23.0 40.0
6.0 25.0 23.0 13.0
6.0 25.0 16.0
2.5 26.0 32.0 15.0 67.0 15.0 80.0
2.0 260.0 30.0 12.0
6.0 6.0
15.0 90.0
18.5
1,601.0
1 N ENG includes CT, ME, MA, NH, RI, and VT. 2 Other States include AL, AK, AR, DE, FL, GA, HI, LA, MS, NJ and SC.

Sheep and Goats Final Estimates 2004-2008 Agricultural Statistics Board March 2009 10 NASS, USDA
Market Sheep and Lambs: Number by Weight Group, State, and United States, January 1, 2005
Market Lambs
State Under 65
Pounds
65 to 84
Pounds
85 to 105
Pounds
Over 105
Pounds Total
Market Sheep
Total Market
Sheep and Lambs
1,000 Head 1,000 Head 1,000 Head 1,000 Head 1,000 Head 1,000 Head 1,000 Head
AZ CA CO ID IL IN IA KS KY MD MI MN MO MT NE NV N ENG 1 NM NY NC ND OH OK OR PA SD TN TX UT VA WA WV WI WY Oth Sts 2 US
16.0 155.0
2.0 4.0 3.5 3.2 8.0
13.5 3.0 1.7 6.0 8.0 2.0 2.0 3.5 0.0 2.3 7.0
10.0 1.6 3.0 9.0 6.0
10.0 6.0
10.0 1.8
100.0 2.0 4.9 2.0 1.5 3.0 1.0
5.7
418.2
6.0 55.0
6.0 1.0 1.5 0.4 9.0 3.0 0.8 1.0 4.0
10.0 1.0 3.0 2.5 1.0 2.0 7.0 3.5 0.5 4.0 8.0 3.0
10.0 3.0 7.0 0.6
40.0 2.0 1.9 1.0 1.0 4.0 6.0
2.5
212.2
11.0 65.0 39.0
8.0 1.5 0.9
27.0 13.5
0.5 0.7 4.0
12.0 1.5
12.0 5.0 5.0 1.0 5.0 1.0 0.4 7.0 8.0 3.0
30.0 3.0
18.0 0.2
50.0 10.0
5.5 1.4 1.0 4.0
39.0
1.3
395.4
9.0 55.0
137.0 31.0
3.5 0.7
34.0 5.0 0.2 0.5 8.0
11.0 2.0 5.0 9.0 4.0 0.3 4.0 1.0 0.1 9.0 4.0 2.0
22.0 1.0
53.0 0.2
30.0 9.0 1.7 0.4 0.5 3.0
58.0
1.0
515.1
42.0 330.0 184.0 44.0 10.0
5.2 78.0 35.0
4.5 3.9
22.0 41.0
6.5 22.0 20.0 10.0
5.6 23.0 15.5
2.6 23.0 29.0 14.0 72.0 13.0 88.0
2.8 220.0 23.0 14.0
4.8 4.0
14.0 104.0
10.5
1,540.9
3.0 10.0
1.0 1.0 3.0 0.8 2.0 6.0 1.5 1.6 1.0 1.0 1.0 3.0 1.0 0.0 0.9 2.0 1.5 0.4 1.0 2.0 1.0 2.0 4.0 2.0 0.2
10.0 2.0 1.0 0.2 0.0 2.0 1.0
4.0
74.1
45.0 340.0 185.0 45.0 13.0
6.0 80.0 41.0
6.0 5.5
23.0 42.0
7.5 25.0 21.0 10.0
6.5 25.0 17.0
3.0 24.0 31.0 15.0 74.0 17.0 90.0
3.0 230.0 25.0 15.0
5.0 4.0
16.0 105.0
14.5
1,615.0
1 N ENG includes CT, ME, MA, NH, RI, and VT. 2 Other States include AL, AK, AR, DE, FL, GA, HI, LA, MS, NJ and SC.
Sheep and Goats Final Estimates 2004-2008 Agricultural Statistics Board March 2009 11 NASS, USDA
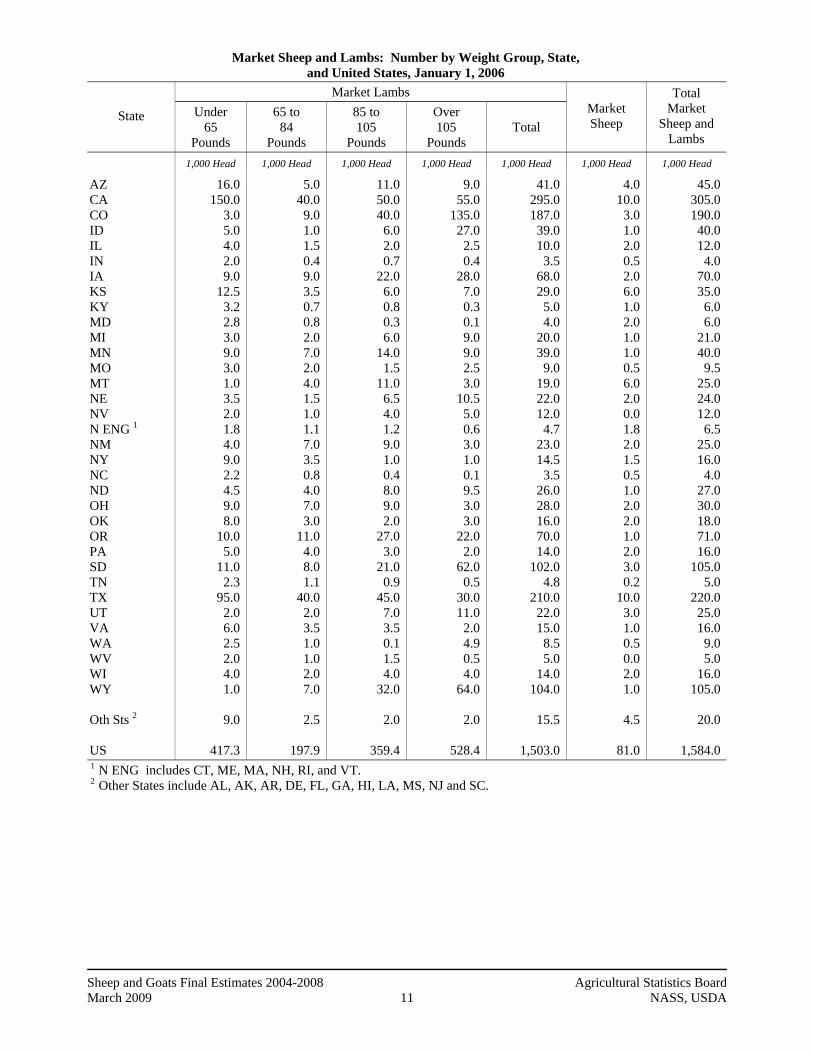
Market Sheep and Lambs: Number by Weight Group, State, and United States, January 1, 2006
Market Lambs
State Under 65
Pounds
65 to 84
Pounds
85 to 105
Pounds
Over 105
Pounds Total
Market Sheep
Total Market
Sheep and Lambs
1,000 Head 1,000 Head 1,000 Head 1,000 Head 1,000 Head 1,000 Head 1,000 Head
AZ CA CO ID IL IN IA KS KY MD MI MN MO MT NE NV N ENG 1 NM NY NC ND OH OK OR PA SD TN TX UT VA WA WV WI WY Oth Sts 2 US
16.0 150.0
3.0 5.0 4.0 2.0 9.0
12.5 3.2 2.8 3.0 9.0 3.0 1.0 3.5 2.0 1.8 4.0 9.0 2.2 4.5 9.0 8.0
10.0 5.0
11.0 2.3
95.0 2.0 6.0 2.5 2.0 4.0 1.0
9.0
417.3
5.0 40.0
9.0 1.0 1.5 0.4 9.0 3.5 0.7 0.8 2.0 7.0 2.0 4.0 1.5 1.0 1.1 7.0 3.5 0.8 4.0 7.0 3.0
11.0 4.0 8.0 1.1
40.0 2.0 3.5 1.0 1.0 2.0 7.0
2.5
197.9
11.0 50.0 40.0
6.0 2.0 0.7
22.0 6.0 0.8 0.3 6.0
14.0 1.5
11.0 6.5 4.0 1.2 9.0 1.0 0.4 8.0 9.0 2.0
27.0 3.0
21.0 0.9
45.0 7.0 3.5 0.1 1.5 4.0
32.0
2.0
359.4
9.0 55.0
135.0 27.0
2.5 0.4
28.0 7.0 0.3 0.1 9.0 9.0 2.5 3.0
10.5 5.0 0.6 3.0 1.0 0.1 9.5 3.0 3.0
22.0 2.0
62.0 0.5
30.0 11.0
2.0 4.9 0.5 4.0
64.0
2.0
528.4
41.0 295.0 187.0 39.0 10.0
3.5 68.0 29.0
5.0 4.0
20.0 39.0
9.0 19.0 22.0 12.0
4.7 23.0 14.5
3.5 26.0 28.0 16.0 70.0 14.0
102.0 4.8
210.0 22.0 15.0
8.5 5.0
14.0 104.0
15.5
1,503.0
4.0 10.0
3.0 1.0 2.0 0.5 2.0 6.0 1.0 2.0 1.0 1.0 0.5 6.0 2.0 0.0 1.8 2.0 1.5 0.5 1.0 2.0 2.0 1.0 2.0 3.0 0.2
10.0 3.0 1.0 0.5 0.0 2.0 1.0
4.5
81.0
45.0 305.0 190.0 40.0 12.0
4.0 70.0 35.0
6.0 6.0
21.0 40.0
9.5 25.0 24.0 12.0
6.5 25.0 16.0
4.0 27.0 30.0 18.0 71.0 16.0
105.0 5.0
220.0 25.0 16.0
9.0 5.0
16.0 105.0
20.0
1,584.0
1 N ENG includes CT, ME, MA, NH, RI, and VT. 2 Other States include AL, AK, AR, DE, FL, GA, HI, LA, MS, NJ and SC.
Sheep and Goats Final Estimates 2004-2008 Agricultural Statistics Board March 2009 12 NASS, USDA
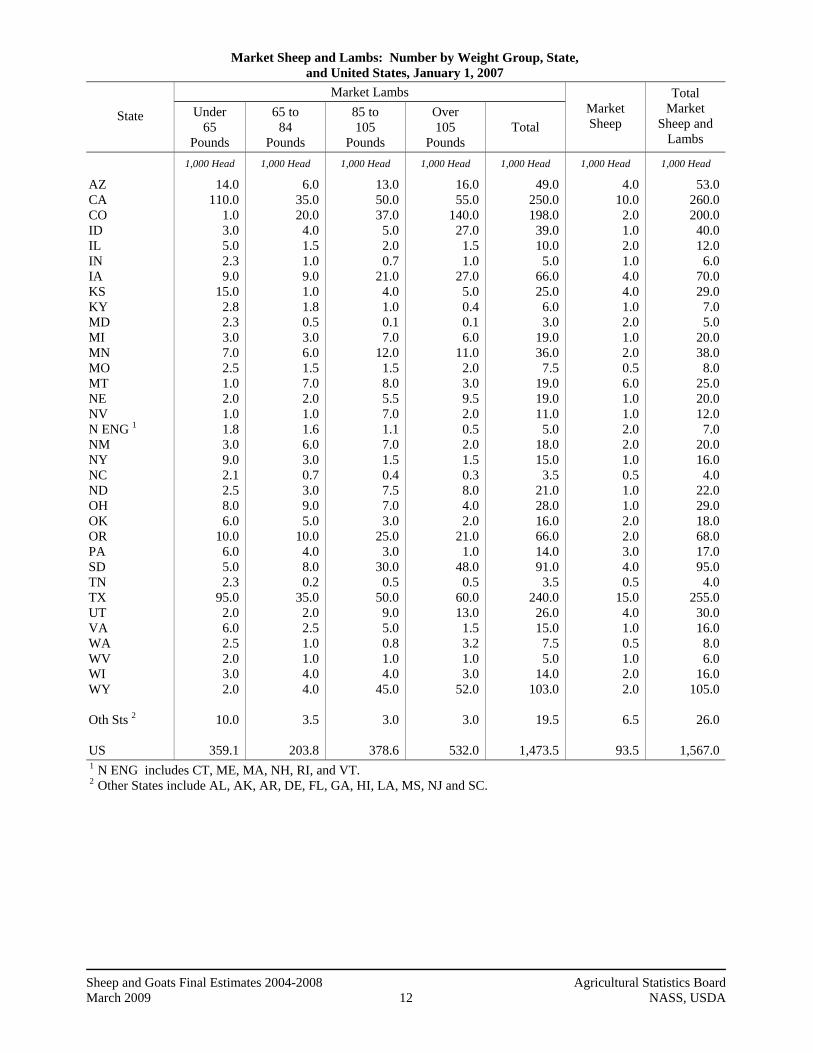
Market Sheep and Lambs: Number by Weight Group, State, and United States, January 1, 2007
Market Lambs
State Under 65
Pounds
65 to 84
Pounds
85 to 105
Pounds
Over 105
Pounds Total
Market Sheep
Total Market
Sheep and Lambs
1,000 Head 1,000 Head 1,000 Head 1,000 Head 1,000 Head 1,000 Head 1,000 Head
AZ CA CO ID IL IN IA KS KY MD MI MN MO MT NE NV N ENG 1 NM NY NC ND OH OK OR PA SD TN TX UT VA WA WV WI WY Oth Sts 2 US
14.0 110.0
1.0 3.0 5.0 2.3 9.0
15.0 2.8 2.3 3.0 7.0 2.5 1.0 2.0 1.0 1.8 3.0 9.0 2.1 2.5 8.0 6.0
10.0 6.0 5.0 2.3
95.0 2.0 6.0 2.5 2.0 3.0 2.0
10.0
359.1
6.0 35.0 20.0
4.0 1.5 1.0 9.0 1.0 1.8 0.5 3.0 6.0 1.5 7.0 2.0 1.0 1.6 6.0 3.0 0.7 3.0 9.0 5.0
10.0 4.0 8.0 0.2
35.0 2.0 2.5 1.0 1.0 4.0 4.0
3.5
203.8
13.0 50.0 37.0
5.0 2.0 0.7
21.0 4.0 1.0 0.1 7.0
12.0 1.5 8.0 5.5 7.0 1.1 7.0 1.5 0.4 7.5 7.0 3.0
25.0 3.0
30.0 0.5
50.0 9.0 5.0 0.8 1.0 4.0
45.0
3.0
378.6
16.0 55.0
140.0 27.0
1.5 1.0
27.0 5.0 0.4 0.1 6.0
11.0 2.0 3.0 9.5 2.0 0.5 2.0 1.5 0.3 8.0 4.0 2.0
21.0 1.0
48.0 0.5
60.0 13.0
1.5 3.2 1.0 3.0
52.0
3.0
532.0
49.0 250.0 198.0 39.0 10.0
5.0 66.0 25.0
6.0 3.0
19.0 36.0
7.5 19.0 19.0 11.0
5.0 18.0 15.0
3.5 21.0 28.0 16.0 66.0 14.0 91.0
3.5 240.0 26.0 15.0
7.5 5.0
14.0 103.0
19.5
1,473.5
4.0 10.0
2.0 1.0 2.0 1.0 4.0 4.0 1.0 2.0 1.0 2.0 0.5 6.0 1.0 1.0 2.0 2.0 1.0 0.5 1.0 1.0 2.0 2.0 3.0 4.0 0.5
15.0 4.0 1.0 0.5 1.0 2.0 2.0
6.5
93.5
53.0 260.0 200.0 40.0 12.0
6.0 70.0 29.0
7.0 5.0
20.0 38.0
8.0 25.0 20.0 12.0
7.0 20.0 16.0
4.0 22.0 29.0 18.0 68.0 17.0 95.0
4.0 255.0 30.0 16.0
8.0 6.0
16.0 105.0
26.0
1,567.0
1 N ENG includes CT, ME, MA, NH, RI, and VT. 2 Other States include AL, AK, AR, DE, FL, GA, HI, LA, MS, NJ and SC.

Sheep and Goats Final Estimates 2004-2008 Agricultural Statistics Board March 2009 13 NASS, USDA
Market Sheep and Lambs: Number by Weight Group, State, and United States, January 1, 2008
Market Lambs
State Under 65
Pounds
65 to 84
Pounds
85 to 105
Pounds
Over 105
Pounds Total
Market Sheep
Total Market
Sheep and Lambs
1,000 Head 1,000 Head 1,000 Head 1,000 Head 1,000 Head 1,000 Head 1,000 Head
AZ CA CO ID IL IN IA KS KY MD MI MN MO MT NE NV N ENG 1 NM NY NC ND OH OK OR PA SD TN TX UT VA WA WV WI WY Oth Sts 2 US
17.0 105.0
4.0 4.0 3.5 2.9 7.0
10.0 3.5 2.3 3.0 9.0 3.5 1.0 2.0 1.0 2.2 4.0 7.0 2.2 2.0 8.0 5.0
10.0 5.0 7.0 3.6
85.0 2.0 8.0 3.5 1.5 4.0 2.0
10.0
350.7
6.0 30.0 22.0
1.0 3.5 0.5 7.0 3.0 0.5 1.1 5.0 8.0 2.5 4.0 3.0 1.0 1.3 5.0 2.0 1.0 4.0 7.0 3.0
10.0 4.0 9.0 0.6
35.0 2.0 2.0 1.0 1.5 3.0 5.0
3.0
197.5
13.0 55.0 41.0
8.0 1.5 0.7
20.0 4.0 1.5 0.5 4.0
11.0 2.0
12.0 4.0 3.0 1.2 5.0 1.0 0.5 8.0 6.0 3.0
26.0 3.0
14.0 0.5
50.0 9.0 3.0 1.5 1.5 4.0
35.0
2.5
355.9
23.0 80.0
141.0 23.0
0.5 0.9
25.0 3.0 0.5 0.1 6.0
10.0 1.0 5.0 6.0 5.0 0.6 2.0 1.0 0.5 6.0 3.0 3.0
23.0 1.0
38.0 0.8
50.0 13.0
2.0 1.5 0.5 4.0
50.0
2.0
531.9
59.0 270.0 208.0 36.0
9.0 5.0
59.0 20.0
6.0 4.0
18.0 38.0
9.0 22.0 15.0 10.0
5.3 16.0 11.0
4.2 20.0 24.0 14.0 69.0 13.0 68.0
5.5 220.0 26.0 15.0
7.5 5.0
15.0 92.0
17.5
1,436.0
6.0 10.0
2.0 2.0 1.0 1.0 4.0 3.0 1.0 2.0 1.0 1.0 1.0 3.0 1.0 1.0 2.2 2.0 1.0 0.8 1.0 1.0 1.0 2.0 3.0 2.0 0.5
10.0 4.0 1.0 0.5 0.0 2.0 3.0
5.5
82.5
65.0 280.0 210.0 38.0 10.0
6.0 63.0 23.0
7.0 6.0
19.0 39.0 10.0 25.0 16.0 11.0
7.5 18.0 12.0
5.0 21.0 25.0 15.0 71.0 16.0 70.0
6.0 230.0 30.0 16.0
8.0 5.0
17.0 95.0
23.0
1,518.5
1 N ENG includes CT, ME, MA, NH, RI, and VT. 2 Other States include AL, AK, AR, DE, FL, GA, HI, LA, MS, NJ and SC.
Sheep and Goats Final Estimates 2004-2008 Agricultural Statistics Board March 2009 14 NASS, USDA
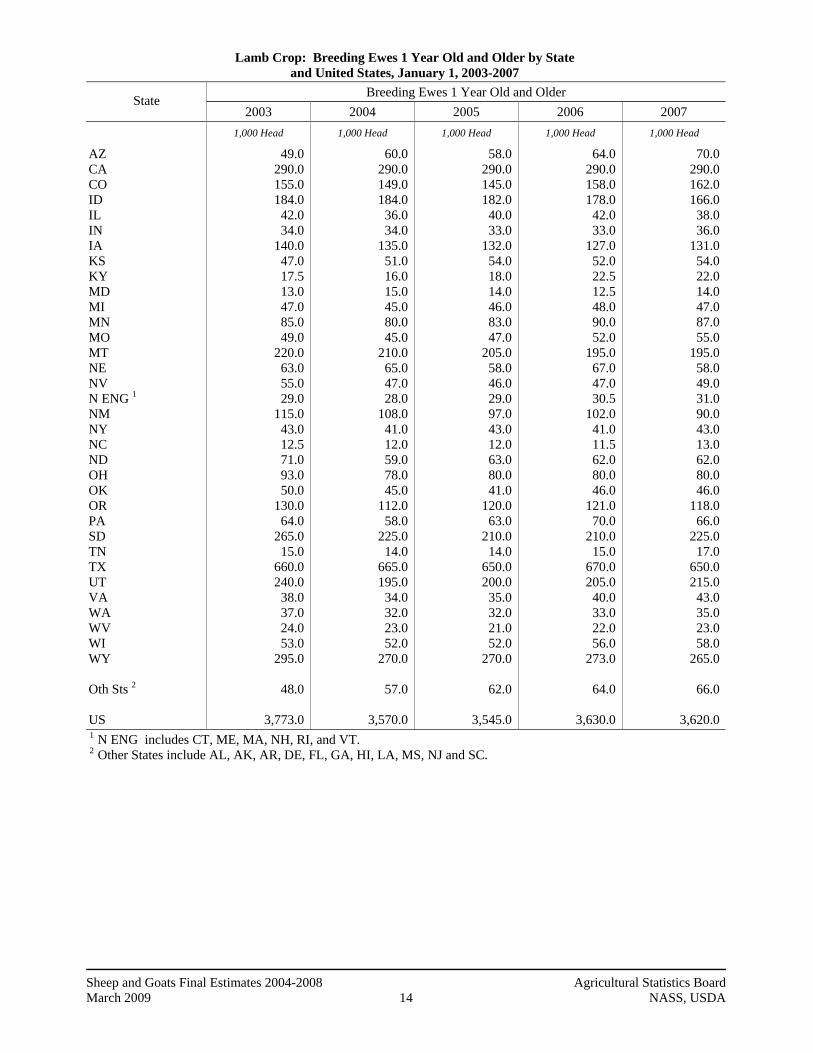
Lamb Crop: Breeding Ewes 1 Year Old and Older by State and United States, January 1, 2003-2007
Breeding Ewes 1 Year Old and Older State 2003 2004 2005 2006 2007
1,000 Head 1,000 Head 1,000 Head 1,000 Head 1,000 Head
AZ CA CO ID IL IN IA KS KY MD MI MN MO MT NE NV N ENG 1 NM NY NC ND OH OK OR PA SD TN TX UT VA WA WV WI WY Oth Sts 2 US
49.0 290.0 155.0 184.0 42.0 34.0
140.0 47.0 17.5 13.0 47.0 85.0 49.0
220.0 63.0 55.0 29.0
115.0 43.0 12.5 71.0 93.0 50.0
130.0 64.0
265.0 15.0
660.0 240.0 38.0 37.0 24.0 53.0
295.0
48.0
3,773.0
60.0 290.0 149.0 184.0 36.0 34.0
135.0 51.0 16.0 15.0 45.0 80.0 45.0
210.0 65.0 47.0 28.0
108.0 41.0 12.0 59.0 78.0 45.0
112.0 58.0
225.0 14.0
665.0 195.0 34.0 32.0 23.0 52.0
270.0
57.0
3,570.0
58.0 290.0 145.0 182.0 40.0 33.0
132.0 54.0 18.0 14.0 46.0 83.0 47.0
205.0 58.0 46.0 29.0 97.0 43.0 12.0 63.0 80.0 41.0
120.0 63.0
210.0 14.0
650.0 200.0 35.0 32.0 21.0 52.0
270.0
62.0
3,545.0
64.0 290.0 158.0 178.0 42.0 33.0
127.0 52.0 22.5 12.5 48.0 90.0 52.0
195.0 67.0 47.0 30.5
102.0 41.0 11.5 62.0 80.0 46.0
121.0 70.0
210.0 15.0
670.0 205.0 40.0 33.0 22.0 56.0
273.0
64.0
3,630.0
70.0 290.0 162.0 166.0 38.0 36.0
131.0 54.0 22.0 14.0 47.0 87.0 55.0
195.0 58.0 49.0 31.0 90.0 43.0 13.0 62.0 80.0 46.0
118.0 66.0
225.0 17.0
650.0 215.0 43.0 35.0 23.0 58.0
265.0
66.0
3,620.0 1 N ENG includes CT, ME, MA, NH, RI, and VT. 2 Other States include AL, AK, AR, DE, FL, GA, HI, LA, MS, NJ and SC.

Sheep and Goats Final Estimates 2004-2008 Agricultural Statistics Board March 2009 15 NASS, USDA
Lamb Crop: Per 100 Ewes 1+ by State and United States, January 1, 2003-2007
Lamb Crop per 100 Ewes 1+ State 2003 2004 2005 2006 2007
Number Number Number Number Number
AZ CA CO ID IL IN IA KS KY MD MI MN MO MT NE NV N ENG 1 NM NY NC ND OH OK OR PA SD TN TX UT VA WA WV WI WY Oth Sts 2 US
67 88
113 128 131 129 154 136 114 131 128 154 110 125 137 105 114 83
116 112 117 138 94
104 127 109 100 77 98
111 146 133 136 102
96
107
83 93
134 130 144 132 144 133 138 107 136 166 118 124 125 106 125 78
129 133 147 127 116 128 143 124 107 76
123 138 166 113 140 111
93
113
83 90
155 118 143 124 142 111 128 107 139 170 132 124 140 104 124 86
116 108 130 121 129 142 137 131 114 77
118 137 163 119 140 106
85
113
75 90
136 115 117 133 154 127 107 120 123 154 129 131 121 100 118 72
122 104 134 131 107 119 124 131 113 69
112 128 155 127 136 108
92
109
71 83
130 120 132 119 149 119 127 114 145 172 138 131 136 88
119 82
102 100 127 131 107 130 102 127 118 65
105 133 154 135 131 102
97
108
1 N ENG includes CT, ME, MA, NH, RI, and VT. 2 Other States include AL, AK, AR, DE, FL, GA, HI, LA, MS, NJ and SC.
Sheep and Goats Final Estimates 2004-2008 Agricultural Statistics Board March 2009 16 NASS, USDA
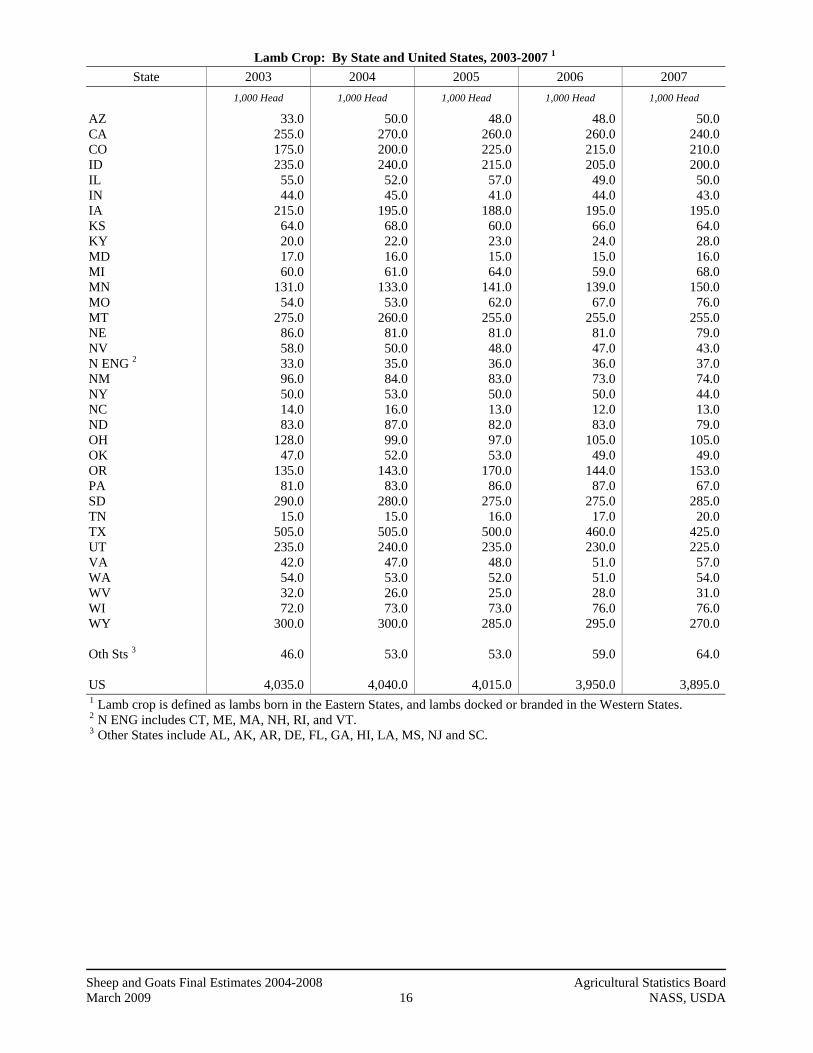
Lamb Crop: By State and United States, 2003-2007 1 State 2003 2004 2005 2006 2007
1,000 Head 1,000 Head 1,000 Head 1,000 Head 1,000 Head
AZ CA CO ID IL IN IA KS KY MD MI MN MO MT NE NV N ENG 2 NM NY NC ND OH OK OR PA SD TN TX UT VA WA WV WI WY Oth Sts 3 US
33.0 255.0 175.0 235.0 55.0 44.0
215.0 64.0 20.0 17.0 60.0
131.0 54.0
275.0 86.0 58.0 33.0 96.0 50.0 14.0 83.0
128.0 47.0
135.0 81.0
290.0 15.0
505.0 235.0 42.0 54.0 32.0 72.0
300.0
46.0
4,035.0
50.0 270.0 200.0 240.0 52.0 45.0
195.0 68.0 22.0 16.0 61.0
133.0 53.0
260.0 81.0 50.0 35.0 84.0 53.0 16.0 87.0 99.0 52.0
143.0 83.0
280.0 15.0
505.0 240.0 47.0 53.0 26.0 73.0
300.0
53.0
4,040.0
48.0 260.0 225.0 215.0 57.0 41.0
188.0 60.0 23.0 15.0 64.0
141.0 62.0
255.0 81.0 48.0 36.0 83.0 50.0 13.0 82.0 97.0 53.0
170.0 86.0
275.0 16.0
500.0 235.0 48.0 52.0 25.0 73.0
285.0
53.0
4,015.0
48.0 260.0 215.0 205.0 49.0 44.0
195.0 66.0 24.0 15.0 59.0
139.0 67.0
255.0 81.0 47.0 36.0 73.0 50.0 12.0 83.0
105.0 49.0
144.0 87.0
275.0 17.0
460.0 230.0 51.0 51.0 28.0 76.0
295.0
59.0
3,950.0
50.0 240.0 210.0 200.0 50.0 43.0
195.0 64.0 28.0 16.0 68.0
150.0 76.0
255.0 79.0 43.0 37.0 74.0 44.0 13.0 79.0
105.0 49.0
153.0 67.0
285.0 20.0
425.0 225.0 57.0 54.0 31.0 76.0
270.0
64.0
3,895.0 1 Lamb crop is defined as lambs born in the Eastern States, and lambs docked or branded in the Western States. 2 N ENG includes CT, ME, MA, NH, RI, and VT. 3 Other States include AL, AK, AR, DE, FL, GA, HI, LA, MS, NJ and SC.
Sheep and Goats Final Estimates 2004-2008 Agricultural Statistics Board March 2009 17 NASS, USDA
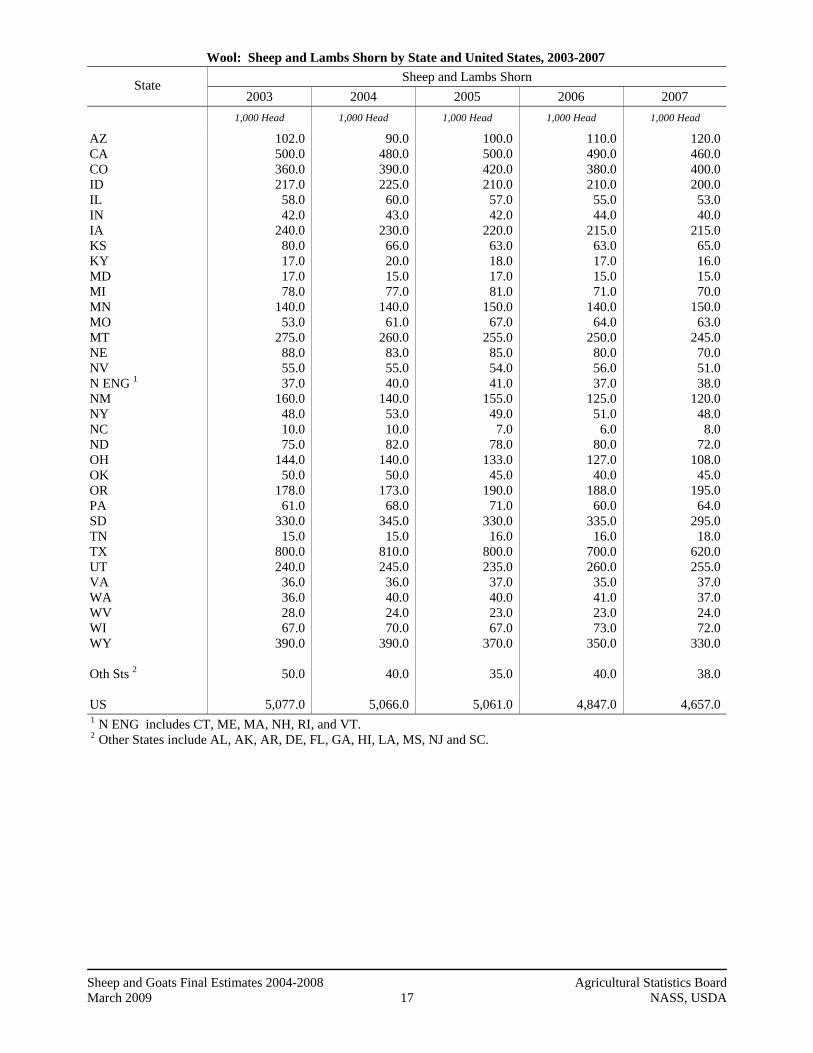
Wool: Sheep and Lambs Shorn by State and United States, 2003-2007 Sheep and Lambs Shorn State
2003 2004 2005 2006 2007
1,000 Head 1,000 Head 1,000 Head 1,000 Head 1,000 Head
AZ CA CO ID IL IN IA KS KY MD MI MN MO MT NE NV N ENG 1 NM NY NC ND OH OK OR PA SD TN TX UT VA WA WV WI WY Oth Sts 2 US
102.0 500.0 360.0 217.0 58.0 42.0
240.0 80.0 17.0 17.0 78.0
140.0 53.0
275.0 88.0 55.0 37.0
160.0 48.0 10.0 75.0
144.0 50.0
178.0 61.0
330.0 15.0
800.0 240.0 36.0 36.0 28.0 67.0
390.0
50.0
5,077.0
90.0 480.0 390.0 225.0 60.0 43.0
230.0 66.0 20.0 15.0 77.0
140.0 61.0
260.0 83.0 55.0 40.0
140.0 53.0 10.0 82.0
140.0 50.0
173.0 68.0
345.0 15.0
810.0 245.0 36.0 40.0 24.0 70.0
390.0
40.0
5,066.0
100.0 500.0 420.0 210.0 57.0 42.0
220.0 63.0 18.0 17.0 81.0
150.0 67.0
255.0 85.0 54.0 41.0
155.0 49.0
7.0 78.0
133.0 45.0
190.0 71.0
330.0 16.0
800.0 235.0 37.0 40.0 23.0 67.0
370.0
35.0
5,061.0
110.0 490.0 380.0 210.0 55.0 44.0
215.0 63.0 17.0 15.0 71.0
140.0 64.0
250.0 80.0 56.0 37.0
125.0 51.0
6.0 80.0
127.0 40.0
188.0 60.0
335.0 16.0
700.0 260.0 35.0 41.0 23.0 73.0
350.0
40.0
4,847.0
120.0 460.0 400.0 200.0 53.0 40.0
215.0 65.0 16.0 15.0 70.0
150.0 63.0
245.0 70.0 51.0 38.0
120.0 48.0
8.0 72.0
108.0 45.0
195.0 64.0
295.0 18.0
620.0 255.0 37.0 37.0 24.0 72.0
330.0
38.0
4,657.0 1 N ENG includes CT, ME, MA, NH, RI, and VT. 2 Other States include AL, AK, AR, DE, FL, GA, HI, LA, MS, NJ and SC.

Sheep and Goats Final Estimates 2004-2008 Agricultural Statistics Board March 2009 18 NASS, USDA
Wool: Weight per Fleece by State and United States, 2003-2007 Weight per Fleece State
2003 2004 2005 2006 2007
Pounds Pounds Pounds Pounds Pounds
AZ CA CO ID IL IN IA KS KY MD MI MN MO MT NE NV N ENG 1 NM NY NC ND OH OK OR PA SD TN TX UT VA WA WV WI WY Oth Sts 2 US
6.1 7.0 7.2 9.7 6.8 6.7 6.0 7.0 6.8 7.1 6.2 6.8 7.0 9.5 7.2 8.4 7.0 7.8 6.7 6.5 8.7 6.4 6.3 6.8 6.7 8.0 6.3 7.0 9.3 6.1 8.1 5.7 7.2 9.1
6.6
7.5
6.4 7.1 6.6 9.4 6.8 6.4 6.0 7.3 6.8 6.9 5.8 6.5 6.4 9.6 7.2 9.3 7.1 7.3 6.7 6.4 9.1 6.5 6.2 6.3 6.5 7.6 6.3 6.9 9.2 6.3 8.2 5.6 7.1 9.1
6.8
7.4
6.2 7.0 6.3 9.0 6.8 6.4 6.0 6.8 6.7 7.0 5.9 6.5 6.5 9.6 7.1 9.3 7.1 7.4 6.7 6.1 8.8 6.0 6.0 6.3 6.5 7.8 6.6 6.9 9.3 6.0 8.1 5.8 7.3 9.2
6.3
7.3
6.2 7.1 6.8 9.2 6.7 6.3 6.1 7.1 6.5 7.0 6.1 6.5 6.6 9.2 7.5 9.3 7.0 7.5 7.1 6.3 8.7 6.0 6.3 6.2 6.7 7.2 6.3 7.0 9.0 5.7 7.3 5.7 7.1 9.6
6.3
7.4
6.3 6.7 6.8 9.4 7.7 6.3 6.2 7.1 6.9 6.8 6.1 6.5 6.6 9.2 7.6 9.7 7.0 7.5 6.7 6.3 8.8 6.0 5.6 6.5 6.7 7.7 5.8 7.3 9.2 5.7 7.6 5.4 7.1 9.5
6.8
7.5
1 N ENG includes CT, ME, MA, NH, RI, and VT. 2 Other States include AL, AK, AR, DE, FL, GA, HI, LA, MS, NJ and SC.
Sheep and Goats Final Estimates 2004-2008 Agricultural Statistics Board March 2009 19 NASS, USDA
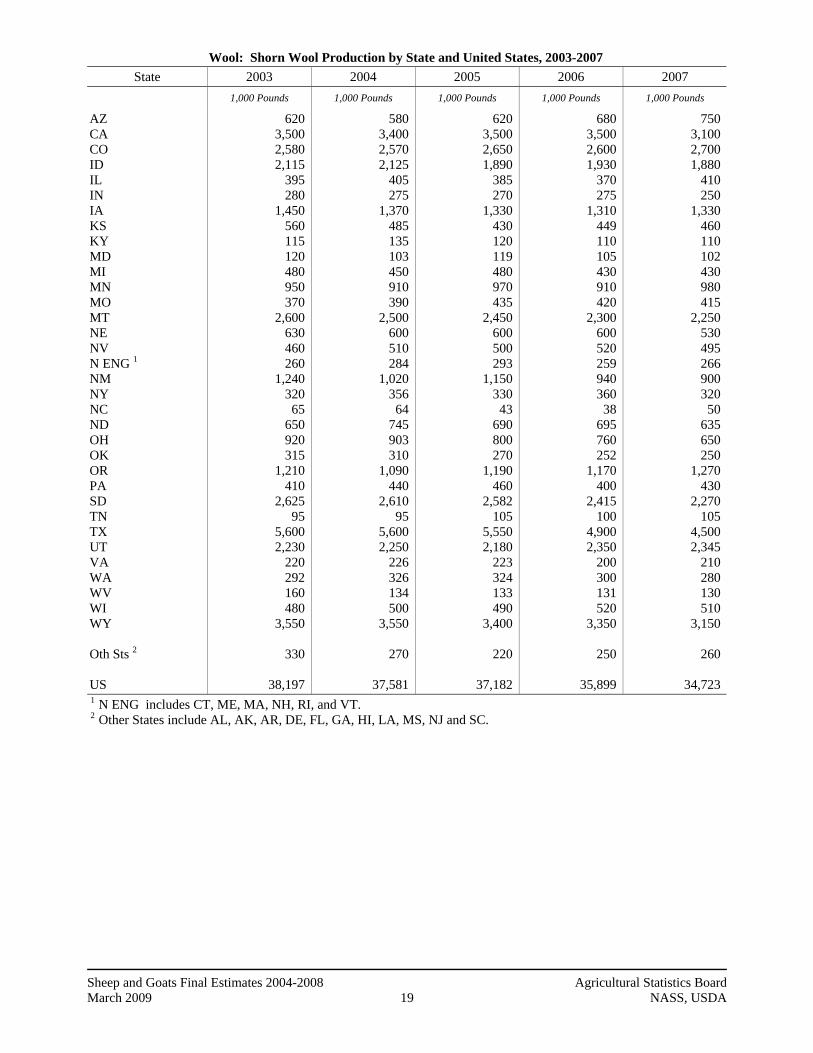
Wool: Shorn Wool Production by State and United States, 2003-2007 State 2003 2004 2005 2006 2007
1,000 Pounds 1,000 Pounds 1,000 Pounds 1,000 Pounds 1,000 Pounds
AZ CA CO ID IL IN IA KS KY MD MI MN MO MT NE NV N ENG 1 NM NY NC ND OH OK OR PA SD TN TX UT VA WA WV WI WY Oth Sts 2 US
620 3,500 2,580 2,115
395 280
1,450 560 115 120 480 950 370
2,600 630 460 260
1,240 320 65
650 920 315
1,210 410
2,625 95
5,600 2,230
220 292 160 480
3,550
330
38,197
580 3,400 2,570 2,125
405 275
1,370 485 135 103 450 910 390
2,500 600 510 284
1,020 356 64
745 903 310
1,090 440
2,610 95
5,600 2,250
226 326 134 500
3,550
270
37,581
620 3,500 2,650 1,890
385 270
1,330 430 120 119 480 970 435
2,450 600 500 293
1,150 330 43
690 800 270
1,190 460
2,582 105
5,550 2,180
223 324 133 490
3,400
220
37,182
680 3,500 2,600 1,930
370 275
1,310 449 110 105 430 910 420
2,300 600 520 259 940 360 38
695 760 252
1,170 400
2,415 100
4,900 2,350
200 300 131 520
3,350
250
35,899
750 3,100 2,700 1,880
410 250
1,330 460 110 102 430 980 415
2,250 530 495 266 900 320 50
635 650 250
1,270 430
2,270 105
4,500 2,345
210 280 130 510
3,150
260
34,723 1 N ENG includes CT, ME, MA, NH, RI, and VT. 2 Other States include AL, AK, AR, DE, FL, GA, HI, LA, MS, NJ and SC.
Sheep and Goats Final Estimates 2004-2008 Agricultural Statistics Board March 2009 20 NASS, USDA
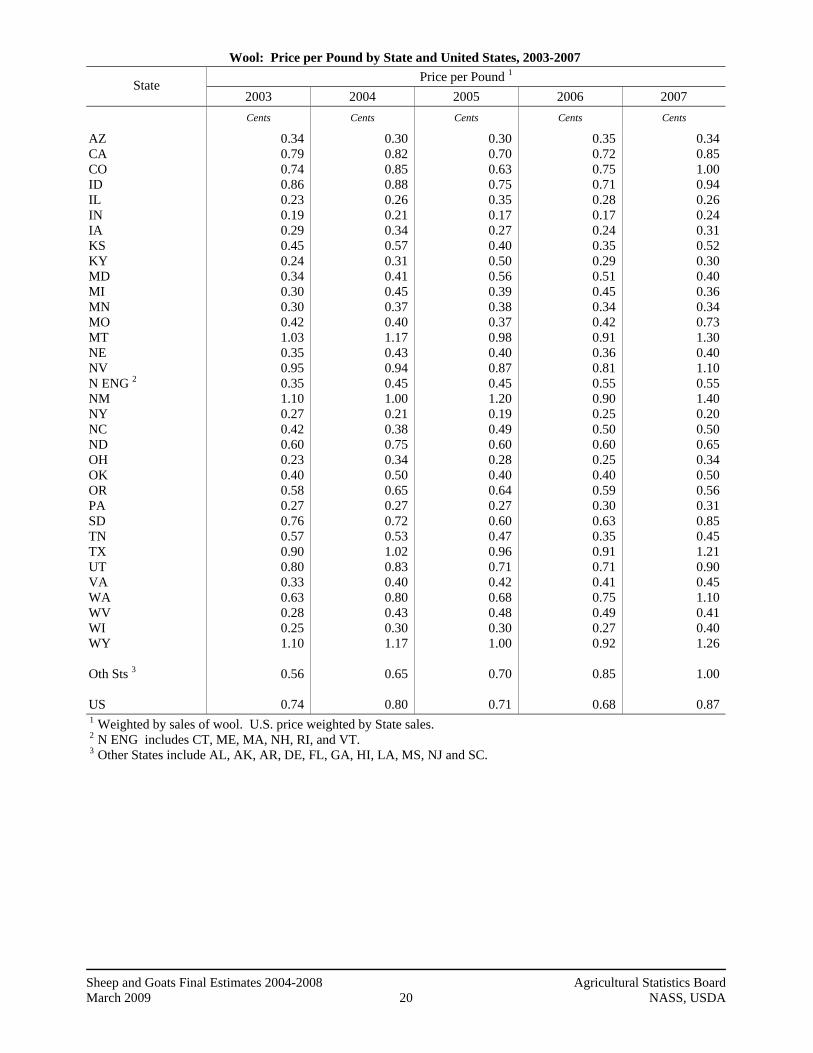
Wool: Price per Pound by State and United States, 2003-2007 Price per Pound 1 State
2003 2004 2005 2006 2007
Cents Cents Cents Cents Cents
AZ CA CO ID IL IN IA KS KY MD MI MN MO MT NE NV N ENG 2 NM NY NC ND OH OK OR PA SD TN TX UT VA WA WV WI WY Oth Sts 3 US
0.34 0.79 0.74 0.86 0.23 0.19 0.29 0.45 0.24 0.34 0.30 0.30 0.42 1.03 0.35 0.95 0.35 1.10 0.27 0.42 0.60 0.23 0.40 0.58 0.27 0.76 0.57 0.90 0.80 0.33 0.63 0.28 0.25 1.10
0.56
0.74
0.30 0.82 0.85 0.88 0.26 0.21 0.34 0.57 0.31 0.41 0.45 0.37 0.40 1.17 0.43 0.94 0.45 1.00 0.21 0.38 0.75 0.34 0.50 0.65 0.27 0.72 0.53 1.02 0.83 0.40 0.80 0.43 0.30 1.17
0.65
0.80
0.30 0.70 0.63 0.75 0.35 0.17 0.27 0.40 0.50 0.56 0.39 0.38 0.37 0.98 0.40 0.87 0.45 1.20 0.19 0.49 0.60 0.28 0.40 0.64 0.27 0.60 0.47 0.96 0.71 0.42 0.68 0.48 0.30 1.00
0.70
0.71
0.35 0.72 0.75 0.71 0.28 0.17 0.24 0.35 0.29 0.51 0.45 0.34 0.42 0.91 0.36 0.81 0.55 0.90 0.25 0.50 0.60 0.25 0.40 0.59 0.30 0.63 0.35 0.91 0.71 0.41 0.75 0.49 0.27 0.92
0.85
0.68
0.34 0.85 1.00 0.94 0.26 0.24 0.31 0.52 0.30 0.40 0.36 0.34 0.73 1.30 0.40 1.10 0.55 1.40 0.20 0.50 0.65 0.34 0.50 0.56 0.31 0.85 0.45 1.21 0.90 0.45 1.10 0.41 0.40 1.26
1.00
0.87
1 Weighted by sales of wool. U.S. price weighted by State sales. 2 N ENG includes CT, ME, MA, NH, RI, and VT. 3 Other States include AL, AK, AR, DE, FL, GA, HI, LA, MS, NJ and SC.
Sheep and Goats Final Estimates 2004-2008 Agricultural Statistics Board March 2009 21 NASS, USDA
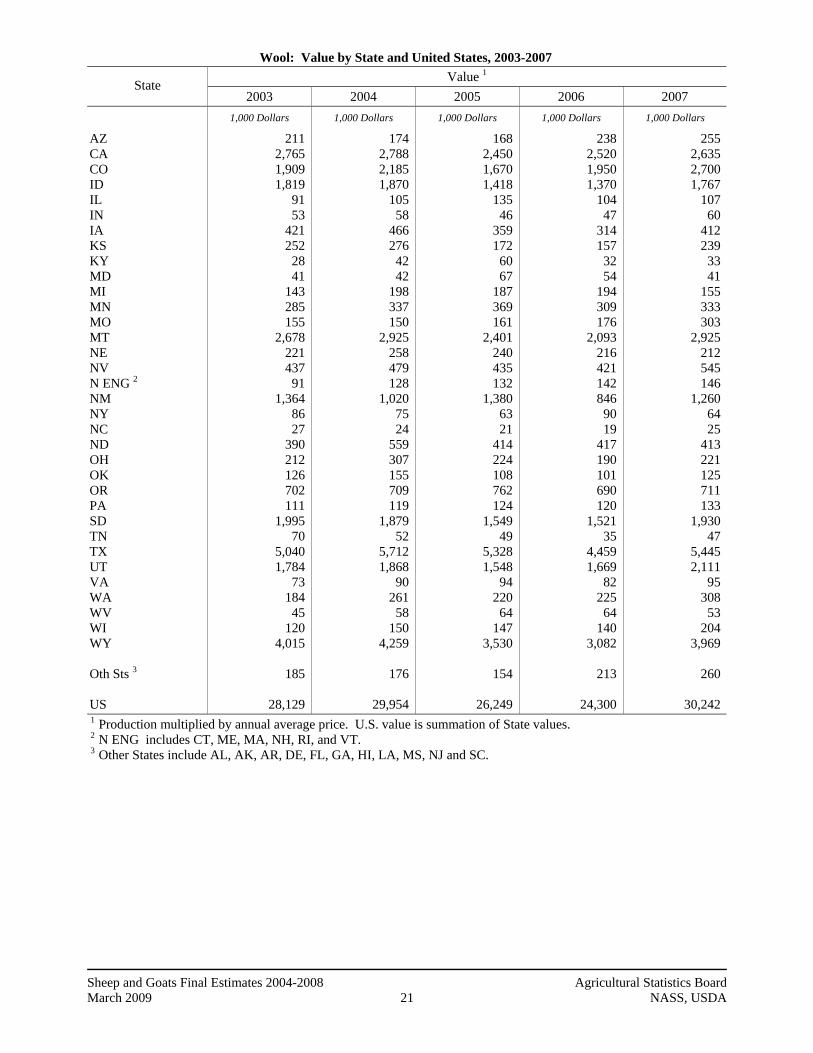
Wool: Value by State and United States, 2003-2007 Value 1 State
2003 2004 2005 2006 2007
1,000 Dollars 1,000 Dollars 1,000 Dollars 1,000 Dollars 1,000 Dollars
AZ CA CO ID IL IN IA KS KY MD MI MN MO MT NE NV N ENG 2 NM NY NC ND OH OK OR PA SD TN TX UT VA WA WV WI WY Oth Sts 3 US
211 2,765 1,909 1,819
91 53
421 252 28 41
143 285 155
2,678 221 437 91
1,364 86 27
390 212 126 702 111
1,995 70
5,040 1,784
73 184 45
120 4,015
185
28,129
174 2,788 2,185 1,870
105 58
466 276 42 42
198 337 150
2,925 258 479 128
1,020 75 24
559 307 155 709 119
1,879 52
5,712 1,868
90 261 58
150 4,259
176
29,954
168 2,450 1,670 1,418
135 46
359 172 60 67
187 369 161
2,401 240 435 132
1,380 63 21
414 224 108 762 124
1,549 49
5,328 1,548
94 220 64
147 3,530
154
26,249
238 2,520 1,950 1,370
104 47
314 157 32 54
194 309 176
2,093 216 421 142 846 90 19
417 190 101 690 120
1,521 35
4,459 1,669
82 225 64
140 3,082
213
24,300
255 2,635 2,700 1,767
107 60
412 239 33 41
155 333 303
2,925 212 545 146
1,260 64 25
413 221 125 711 133
1,930 47
5,445 2,111
95 308 53
204 3,969
260
30,242
1 Production multiplied by annual average price. U.S. value is summation of State values. 2 N ENG includes CT, ME, MA, NH, RI, and VT. 3 Other States include AL, AK, AR, DE, FL, GA, HI, LA, MS, NJ and SC.
Sheep and Goats Final Estimates 2004-2008 Agricultural Statistics Board March 2009 22 NASS, USDA
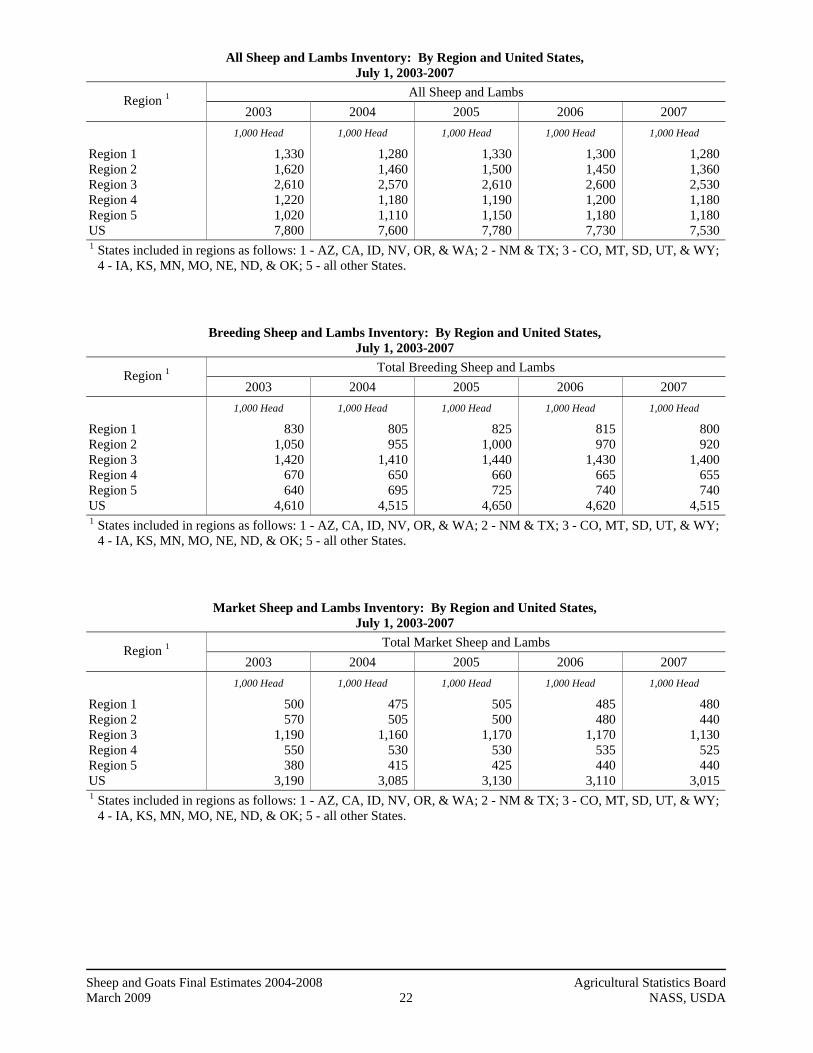
All Sheep and Lambs Inventory: By Region and United States, July 1, 2003-2007
All Sheep and Lambs Region 1 2003 2004 2005 2006 2007
1,000 Head 1,000 Head 1,000 Head 1,000 Head 1,000 Head
Region 1 Region 2 Region 3 Region 4 Region 5 US
1,330 1,620 2,610 1,220 1,020 7,800
1,280 1,460 2,570 1,180 1,110 7,600
1,330 1,500 2,610 1,190 1,150 7,780
1,300 1,450 2,600 1,200 1,180 7,730
1,280 1,360 2,530 1,180 1,180 7,530
1 States included in regions as follows: 1 - AZ, CA, ID, NV, OR, & WA; 2 - NM & TX; 3 - CO, MT, SD, UT, & WY; 4 - IA, KS, MN, MO, NE, ND, & OK; 5 - all other States.
Breeding Sheep and Lambs Inventory: By Region and United States, July 1, 2003-2007
Total Breeding Sheep and Lambs Region 1 2003 2004 2005 2006 2007
1,000 Head 1,000 Head 1,000 Head 1,000 Head 1,000 Head
Region 1 Region 2 Region 3 Region 4 Region 5 US
830 1,050 1,420
670 640
4,610
805 955
1,410 650 695
4,515
825 1,000 1,440
660 725
4,650
815 970
1,430 665 740
4,620
800 920
1,400 655 740
4,515 1 States included in regions as follows: 1 - AZ, CA, ID, NV, OR, & WA; 2 - NM & TX; 3 - CO, MT, SD, UT, & WY;
4 - IA, KS, MN, MO, NE, ND, & OK; 5 - all other States.
Market Sheep and Lambs Inventory: By Region and United States, July 1, 2003-2007
Total Market Sheep and Lambs Region 1 2003 2004 2005 2006 2007
1,000 Head 1,000 Head 1,000 Head 1,000 Head 1,000 Head
Region 1 Region 2 Region 3 Region 4 Region 5 US
500 570
1,190 550 380
3,190
475 505
1,160 530 415
3,085
505 500
1,170 530 425
3,130
485 480
1,170 535 440
3,110
480 440
1,130 525 440
3,015 1 States included in regions as follows: 1 - AZ, CA, ID, NV, OR, & WA; 2 - NM & TX; 3 - CO, MT, SD, UT, & WY;
4 - IA, KS, MN, MO, NE, ND, & OK; 5 - all other States.
Sheep and Goats Final Estimates 2004-2008 Agricultural Statistics Board March 2009 23 NASS, USDA
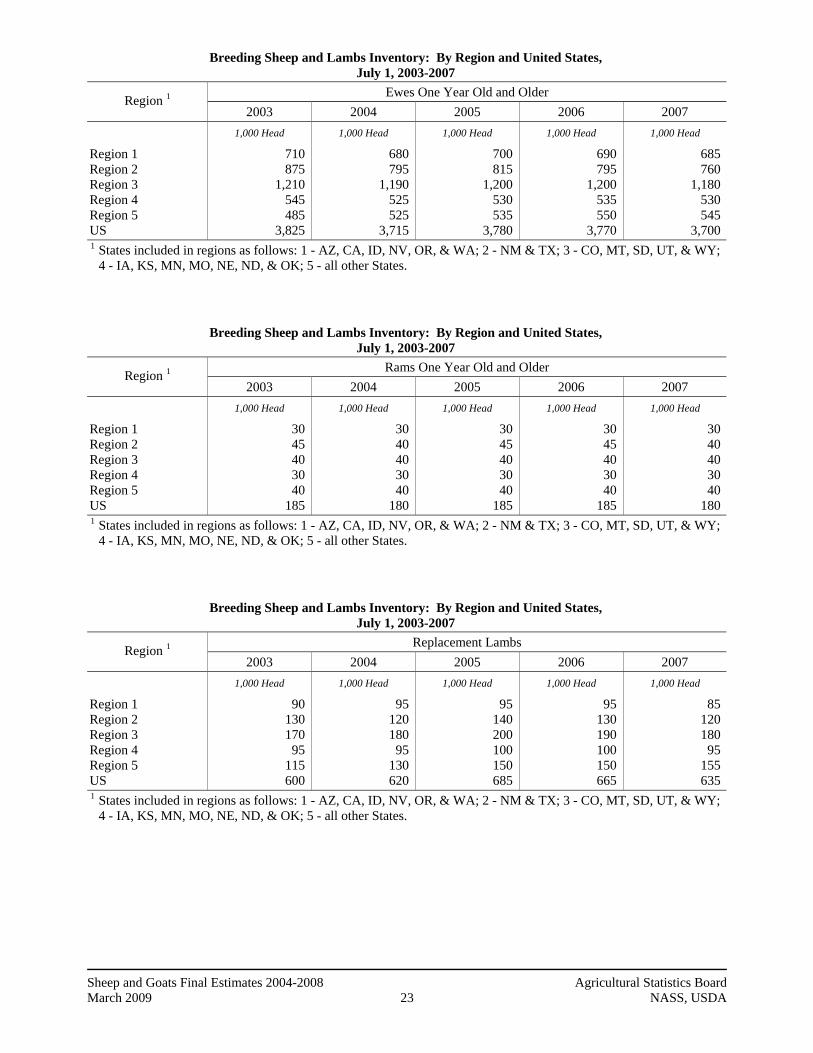
Breeding Sheep and Lambs Inventory: By Region and United States, July 1, 2003-2007
Ewes One Year Old and Older Region 1 2003 2004 2005 2006 2007
1,000 Head 1,000 Head 1,000 Head 1,000 Head 1,000 Head
Region 1 Region 2 Region 3 Region 4 Region 5 US
710 875
1,210 545 485
3,825
680 795
1,190 525 525
3,715
700 815
1,200 530 535
3,780
690 795
1,200 535 550
3,770
685 760
1,180 530 545
3,700 1 States included in regions as follows: 1 - AZ, CA, ID, NV, OR, & WA; 2 - NM & TX; 3 - CO, MT, SD, UT, & WY;
4 - IA, KS, MN, MO, NE, ND, & OK; 5 - all other States.
Breeding Sheep and Lambs Inventory: By Region and United States, July 1, 2003-2007
Rams One Year Old and Older Region 1 2003 2004 2005 2006 2007
1,000 Head 1,000 Head 1,000 Head 1,000 Head 1,000 Head
Region 1 Region 2 Region 3 Region 4 Region 5 US
30 45 40 30 40
185
30 40 40 30 40
180
30 45 40 30 40
185
30 45 40 30 40
185
30 40 40 30 40
180 1 States included in regions as follows: 1 - AZ, CA, ID, NV, OR, & WA; 2 - NM & TX; 3 - CO, MT, SD, UT, & WY;
4 - IA, KS, MN, MO, NE, ND, & OK; 5 - all other States.
Breeding Sheep and Lambs Inventory: By Region and United States, July 1, 2003-2007
Replacement Lambs Region 1 2003 2004 2005 2006 2007
1,000 Head 1,000 Head 1,000 Head 1,000 Head 1,000 Head
Region 1 Region 2 Region 3 Region 4 Region 5 US
90 130 170 95
115 600
95 120 180 95
130 620
95 140 200 100 150 685
95 130 190 100 150 665
85 120 180 95
155 635
1 States included in regions as follows: 1 - AZ, CA, ID, NV, OR, & WA; 2 - NM & TX; 3 - CO, MT, SD, UT, & WY; 4 - IA, KS, MN, MO, NE, ND, & OK; 5 - all other States.
Sheep and Goats Final Estimates 2004-2008 Agricultural Statistics Board March 2009 24 NASS, USDA
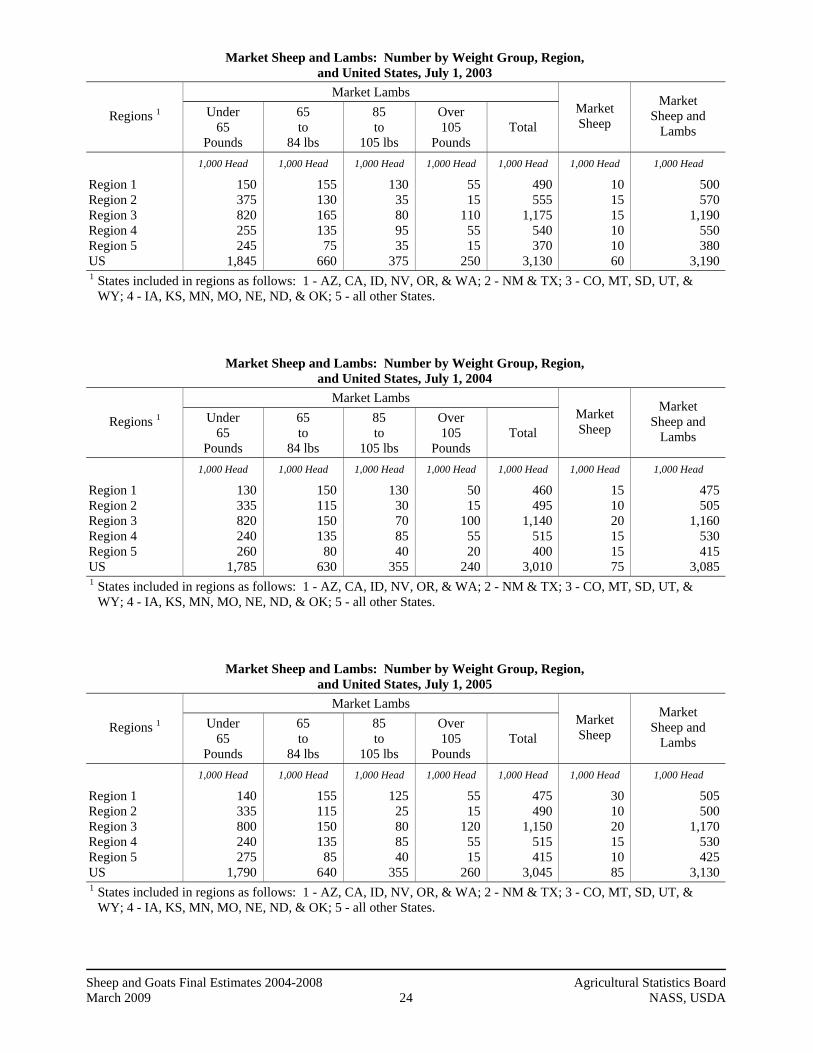
Market Sheep and Lambs: Number by Weight Group, Region, and United States, July 1, 2003
Market Lambs
Regions 1 Under 65
Pounds
65 to
84 lbs
85 to
105 lbs
Over 105
Pounds Total
Market Sheep
Market Sheep and
Lambs
1,000 Head 1,000 Head 1,000 Head 1,000 Head 1,000 Head 1,000 Head 1,000 Head
Region 1 Region 2 Region 3 Region 4 Region 5 US
150 375 820 255 245
1,845
155 130 165 135 75
660
130 35 80 95 35
375
55 15
110 55 15
250
490 555
1,175 540 370
3,130
10 15 15 10 10 60
500 570
1,190 550 380
3,190 1 States included in regions as follows: 1 - AZ, CA, ID, NV, OR, & WA; 2 - NM & TX; 3 - CO, MT, SD, UT, &
WY; 4 - IA, KS, MN, MO, NE, ND, & OK; 5 - all other States.
Market Sheep and Lambs: Number by Weight Group, Region, and United States, July 1, 2004
Market Lambs
Regions 1 Under 65
Pounds
65 to
84 lbs
85 to
105 lbs
Over 105
Pounds Total
Market Sheep
Market Sheep and
Lambs
1,000 Head 1,000 Head 1,000 Head 1,000 Head 1,000 Head 1,000 Head 1,000 Head
Region 1 Region 2 Region 3 Region 4 Region 5 US
130 335 820 240 260
1,785
150 115 150 135 80
630
130 30 70 85 40
355
50 15
100 55 20
240
460 495
1,140 515 400
3,010
15 10 20 15 15 75
475 505
1,160 530 415
3,085 1 States included in regions as follows: 1 - AZ, CA, ID, NV, OR, & WA; 2 - NM & TX; 3 - CO, MT, SD, UT, &
WY; 4 - IA, KS, MN, MO, NE, ND, & OK; 5 - all other States.
Market Sheep and Lambs: Number by Weight Group, Region, and United States, July 1, 2005
Market Lambs
Regions 1 Under 65
Pounds
65 to
84 lbs
85 to
105 lbs
Over 105
Pounds Total
Market Sheep
Market Sheep and
Lambs
1,000 Head 1,000 Head 1,000 Head 1,000 Head 1,000 Head 1,000 Head 1,000 Head
Region 1 Region 2 Region 3 Region 4 Region 5 US
140 335 800 240 275
1,790
155 115 150 135 85
640
125 25 80 85 40
355
55 15
120 55 15
260
475 490
1,150 515 415
3,045
30 10 20 15 10 85
505 500
1,170 530 425
3,130 1 States included in regions as follows: 1 - AZ, CA, ID, NV, OR, & WA; 2 - NM & TX; 3 - CO, MT, SD, UT, &
WY; 4 - IA, KS, MN, MO, NE, ND, & OK; 5 - all other States.
Sheep and Goats Final Estimates 2004-2008 Agricultural Statistics Board March 2009 25 NASS, USDA
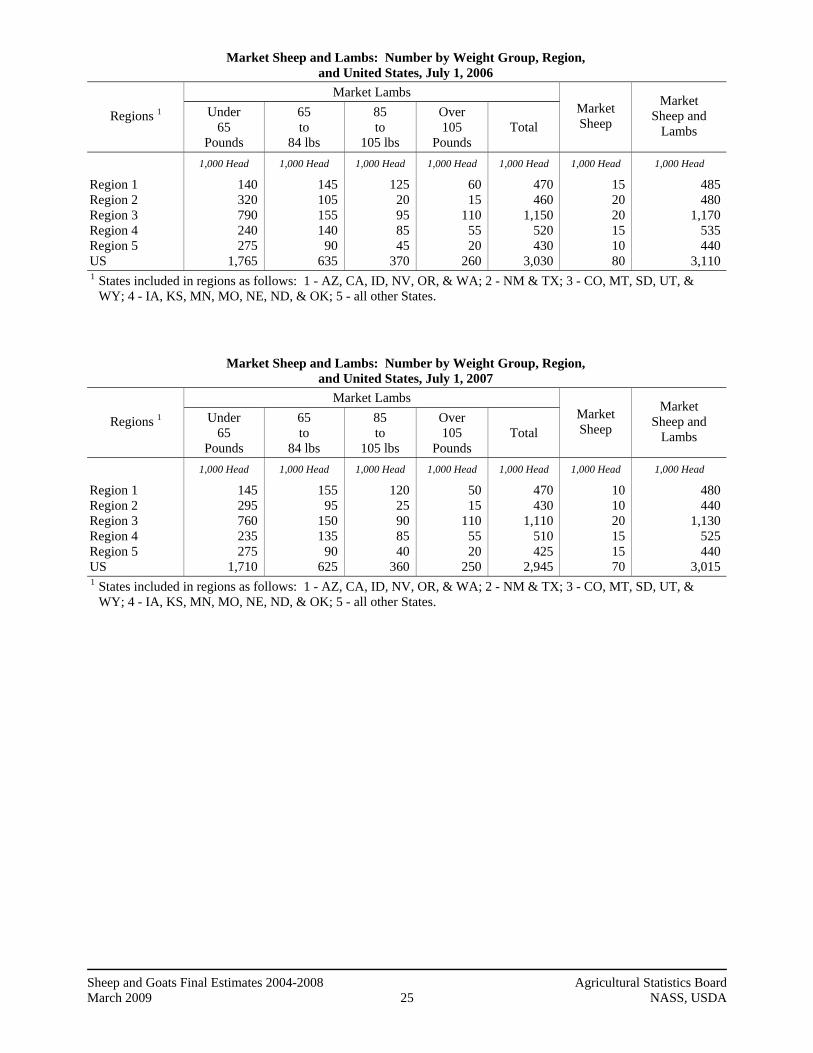
Market Sheep and Lambs: Number by Weight Group, Region, and United States, July 1, 2006
Market Lambs
Regions 1 Under 65
Pounds
65 to
84 lbs
85 to
105 lbs
Over 105
Pounds Total
Market Sheep
Market Sheep and
Lambs
1,000 Head 1,000 Head 1,000 Head 1,000 Head 1,000 Head 1,000 Head 1,000 Head
Region 1 Region 2 Region 3 Region 4 Region 5 US
140 320 790 240 275
1,765
145 105 155 140 90
635
125 20 95 85 45
370
60 15
110 55 20
260
470 460
1,150 520 430
3,030
15 20 20 15 10 80
485 480
1,170 535 440
3,110 1 States included in regions as follows: 1 - AZ, CA, ID, NV, OR, & WA; 2 - NM & TX; 3 - CO, MT, SD, UT, &
WY; 4 - IA, KS, MN, MO, NE, ND, & OK; 5 - all other States.
Market Sheep and Lambs: Number by Weight Group, Region, and United States, July 1, 2007
Market Lambs
Regions 1 Under 65
Pounds
65 to
84 lbs
85 to
105 lbs
Over 105
Pounds Total
Market Sheep
Market Sheep and
Lambs
1,000 Head 1,000 Head 1,000 Head 1,000 Head 1,000 Head 1,000 Head 1,000 Head
Region 1 Region 2 Region 3 Region 4 Region 5 US
145 295 760 235 275
1,710
155 95
150 135 90
625
120 25 90 85 40
360
50 15
110 55 20
250
470 430
1,110 510 425
2,945
10 10 20 15 15 70
480 440
1,130 525 440
3,015 1 States included in regions as follows: 1 - AZ, CA, ID, NV, OR, & WA; 2 - NM & TX; 3 - CO, MT, SD, UT, &
WY; 4 - IA, KS, MN, MO, NE, ND, & OK; 5 - all other States.
Sheep and Goats Final Estimates 2004-2008 Agricultural Statistics Board March 2009 26 NASS, USDA
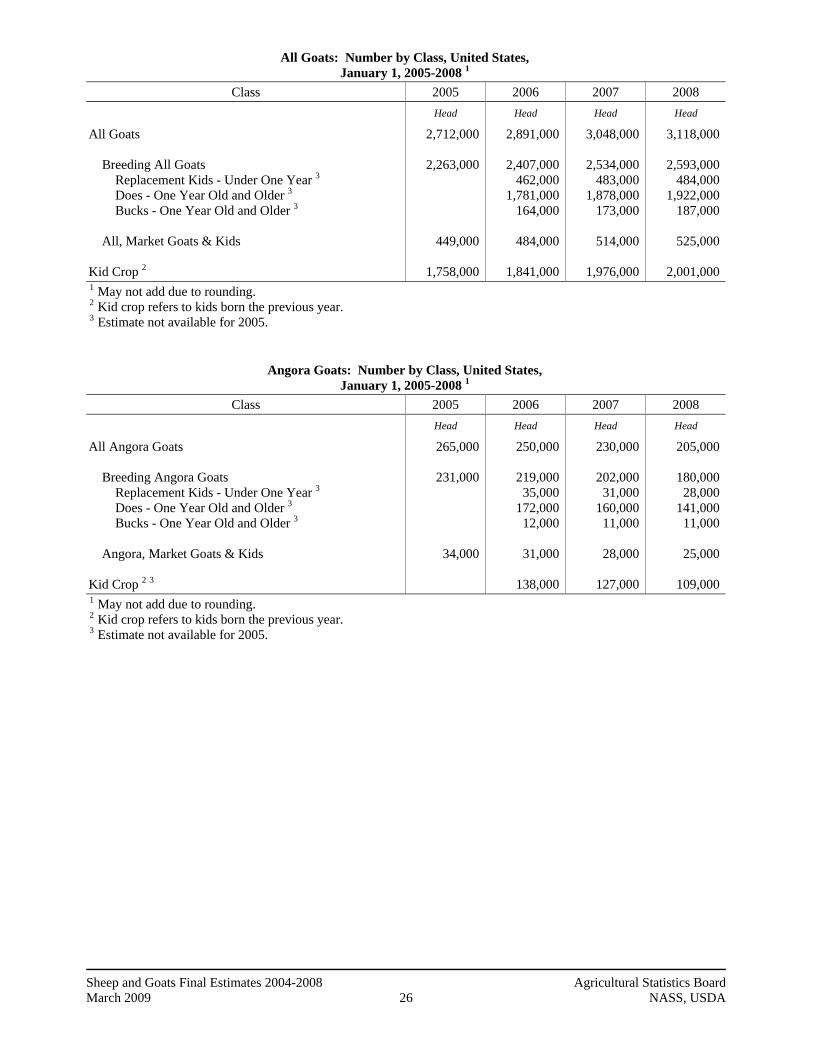
All Goats: Number by Class, United States, January 1, 2005-2008 1
Class 2005 2006 2007 2008 Head Head Head Head
All Goats Breeding All Goats Replacement Kids - Under One Year 3 Does - One Year Old and Older 3 Bucks - One Year Old and Older 3 All, Market Goats & Kids Kid Crop 2
2,712,000
2,263,000
449,000
1,758,000
2,891,000
2,407,000 462,000
1,781,000 164,000
484,000
1,841,000
3,048,000
2,534,000 483,000
1,878,000 173,000
514,000
1,976,000
3,118,000
2,593,000 484,000
1,922,000 187,000
525,000
2,001,000
1 May not add due to rounding. 2 Kid crop refers to kids born the previous year. 3 Estimate not available for 2005.
Angora Goats: Number by Class, United States, January 1, 2005-2008 1
Class 2005 2006 2007 2008 Head Head Head Head
All Angora Goats Breeding Angora Goats Replacement Kids - Under One Year 3 Does - One Year Old and Older 3 Bucks - One Year Old and Older 3 Angora, Market Goats & Kids Kid Crop 2 3
265,000
231,000
34,000
250,000
219,000 35,000
172,000 12,000
31,000
138,000
230,000
202,000 31,000
160,000 11,000
28,000
127,000
205,000
180,000 28,000
141,000 11,000
25,000
109,000
1 May not add due to rounding. 2 Kid crop refers to kids born the previous year. 3 Estimate not available for 2005.
Sheep and Goats Final Estimates 2004-2008 Agricultural Statistics Board March 2009 27 NASS, USDA
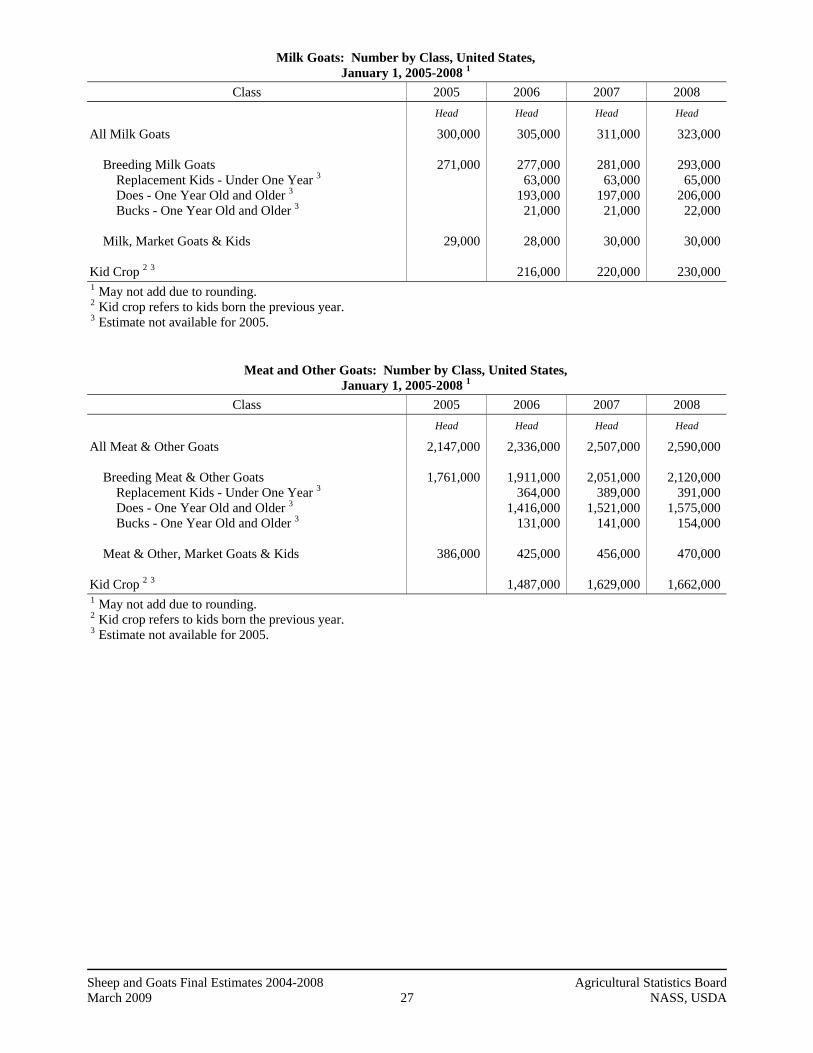
Milk Goats: Number by Class, United States, January 1, 2005-2008 1
Class 2005 2006 2007 2008 Head Head Head Head
All Milk Goats Breeding Milk Goats Replacement Kids - Under One Year 3 Does - One Year Old and Older 3 Bucks - One Year Old and Older 3 Milk, Market Goats & Kids Kid Crop 2 3
300,000
271,000
29,000
305,000
277,000 63,000
193,000 21,000
28,000
216,000
311,000
281,000 63,000
197,000 21,000
30,000
220,000
323,000
293,000 65,000
206,000 22,000
30,000
230,000
1 May not add due to rounding. 2 Kid crop refers to kids born the previous year. 3 Estimate not available for 2005.
Meat and Other Goats: Number by Class, United States, January 1, 2005-2008 1
Class 2005 2006 2007 2008 Head Head Head Head
All Meat & Other Goats Breeding Meat & Other Goats Replacement Kids - Under One Year 3 Does - One Year Old and Older 3 Bucks - One Year Old and Older 3 Meat & Other, Market Goats & Kids Kid Crop 2 3
2,147,000
1,761,000
386,000
2,336,000
1,911,000 364,000
1,416,000 131,000
425,000
1,487,000
2,507,000
2,051,000 389,000
1,521,000 141,000
456,000
1,629,000
2,590,000
2,120,000 391,000
1,575,000 154,000
470,000
1,662,000
1 May not add due to rounding. 2 Kid crop refers to kids born the previous year. 3 Estimate not available for 2005.
Sheep and Goats Final Estimates 2004-2008 Agricultural Statistics Board March 2009 28 NASS, USDA
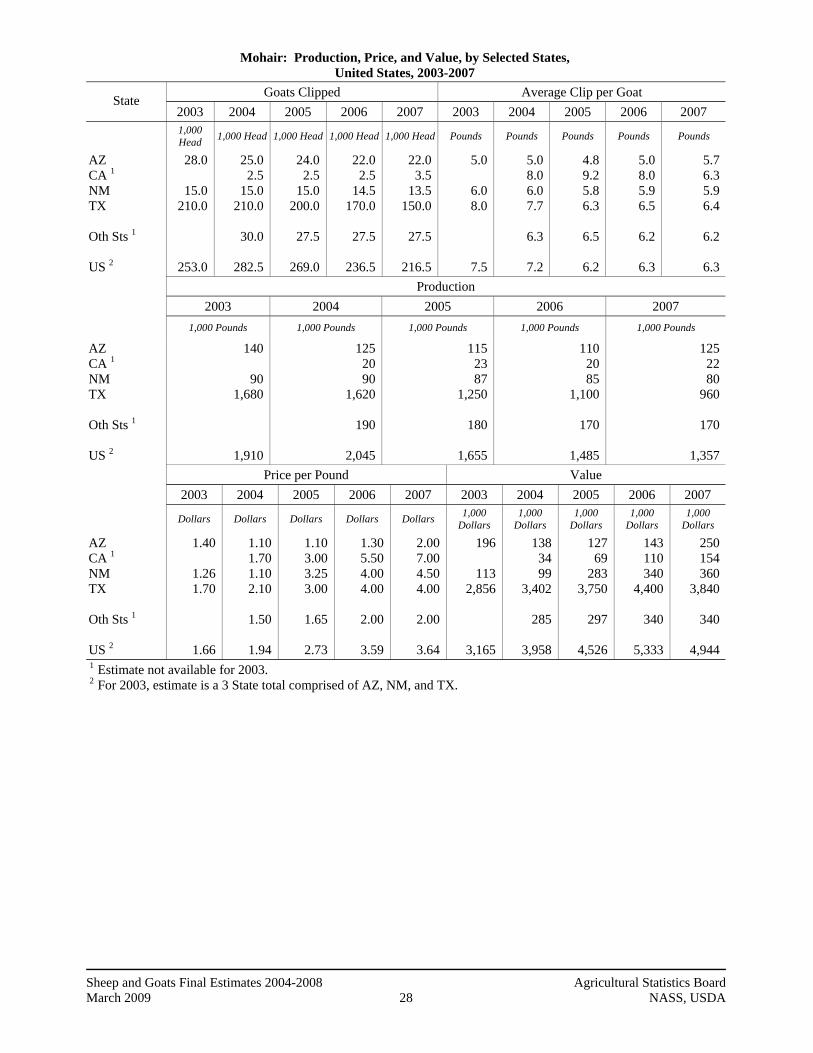
Mohair: Production, Price, and Value, by Selected States, United States, 2003-2007
Goats Clipped Average Clip per Goat State 2003 2004 2005 2006 2007 2003 2004 2005 2006 2007
1,000 Head 1,000 Head 1,000 Head 1,000 Head 1,000 Head Pounds Pounds Pounds Pounds Pounds
AZ CA 1 NM TX Oth Sts 1 US 2
28.0
15.0 210.0
253.0
25.0 2.5
15.0 210.0
30.0
282.5
24.0 2.5
15.0 200.0
27.5
269.0
22.0 2.5
14.5 170.0
27.5
236.5
22.0 3.5
13.5 150.0
27.5
216.5
5.0
6.0 8.0
7.5
5.0 8.0 6.0 7.7
6.3
7.2
4.8 9.2 5.8 6.3
6.5
6.2
5.0 8.0 5.9 6.5
6.2
6.3
5.7 6.3 5.9 6.4
6.2
6.3
Production
2003 2004 2005 2006 2007
1,000 Pounds 1,000 Pounds 1,000 Pounds 1,000 Pounds 1,000 Pounds
AZ CA 1 NM TX Oth Sts 1 US 2
140
90 1,680
1,910
125 20 90
1,620
190
2,045
115 23 87
1,250
180
1,655
110 20 85
1,100
170
1,485
125 22 80
960
170
1,357Price per Pound Value
2003 2004 2005 2006 2007 2003 2004 2005 2006 2007
Dollars Dollars Dollars Dollars Dollars 1,000 Dollars
1,000 Dollars
1,000 Dollars
1,000 Dollars
1,000 Dollars
AZ CA 1 NM TX Oth Sts 1 US 2
1.40
1.26 1.70
1.66
1.10 1.70 1.10 2.10
1.50
1.94
1.10 3.00 3.25 3.00
1.65
2.73
1.30 5.50 4.00 4.00
2.00
3.59
2.00 7.00 4.50 4.00
2.00
3.64
196
113 2,856
3,165
138 34 99
3,402
285
3,958
127 69
283 3,750
297
4,526
143 110 340
4,400
340
5,333
250 154 360
3,840
340
4,944 1 Estimate not available for 2003. 2 For 2003, estimate is a 3 State total comprised of AZ, NM, and TX.
Sheep and Goats Final Estimates 2004-2008 Agricultural Statistics Board March 2009 29 NASS, USDA
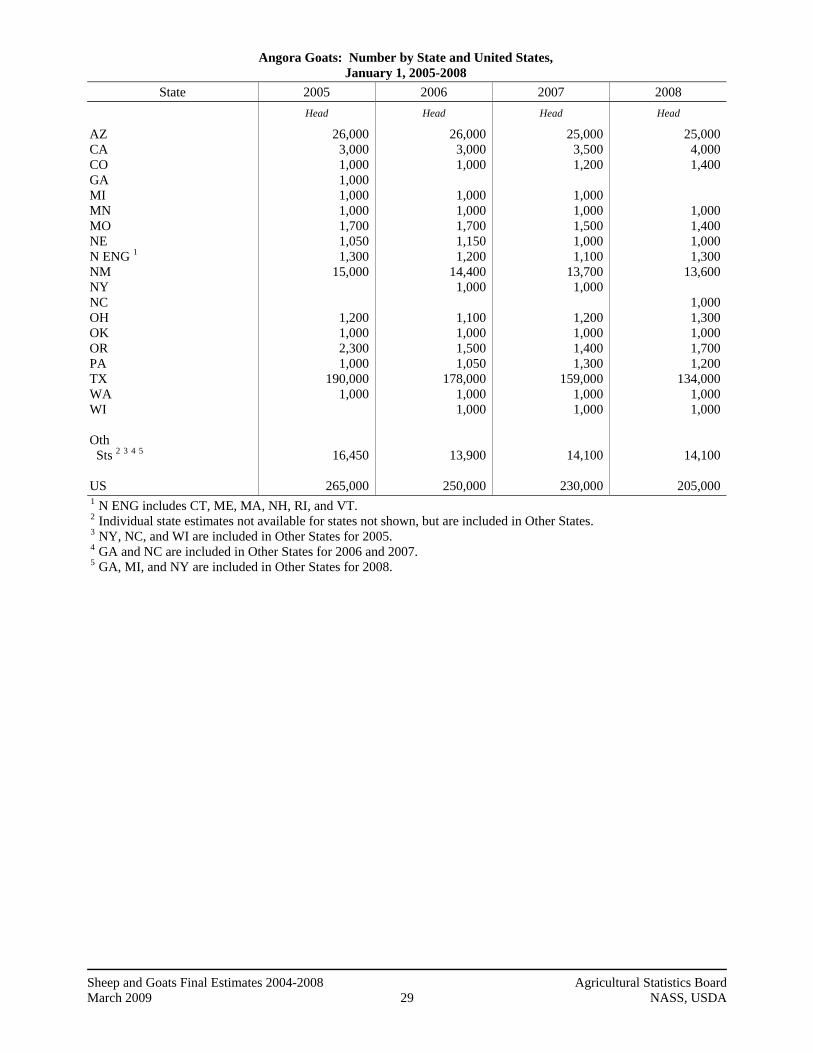
Angora Goats: Number by State and United States, January 1, 2005-2008
State 2005 2006 2007 2008
Head Head Head Head
AZ CA CO GA MI MN MO NE N ENG 1 NM NY NC OH OK OR PA TX WA WI Oth Sts 2 3 4 5 US
26,000 3,000 1,000 1,000 1,000 1,000 1,700 1,050 1,300
15,000
1,200 1,000 2,300 1,000
190,000 1,000
16,450
265,000
26,000 3,000 1,000
1,000 1,000 1,700 1,150 1,200
14,400 1,000
1,100 1,000 1,500 1,050
178,000 1,000 1,000
13,900
250,000
25,000 3,500 1,200
1,000 1,000 1,500 1,000 1,100
13,700 1,000
1,200 1,000 1,400 1,300
159,000 1,000 1,000
14,100
230,000
25,000 4,000 1,400
1,000 1,400 1,000 1,300
13,600
1,000 1,300 1,000 1,700 1,200
134,000 1,000 1,000
14,100
205,000 1 N ENG includes CT, ME, MA, NH, RI, and VT. 2 Individual state estimates not available for states not shown, but are included in Other States. 3 NY, NC, and WI are included in Other States for 2005. 4 GA and NC are included in Other States for 2006 and 2007. 5 GA, MI, and NY are included in Other States for 2008.
Sheep and Goats Final Estimates 2004-2008 Agricultural Statistics Board March 2009 30 NASS, USDA
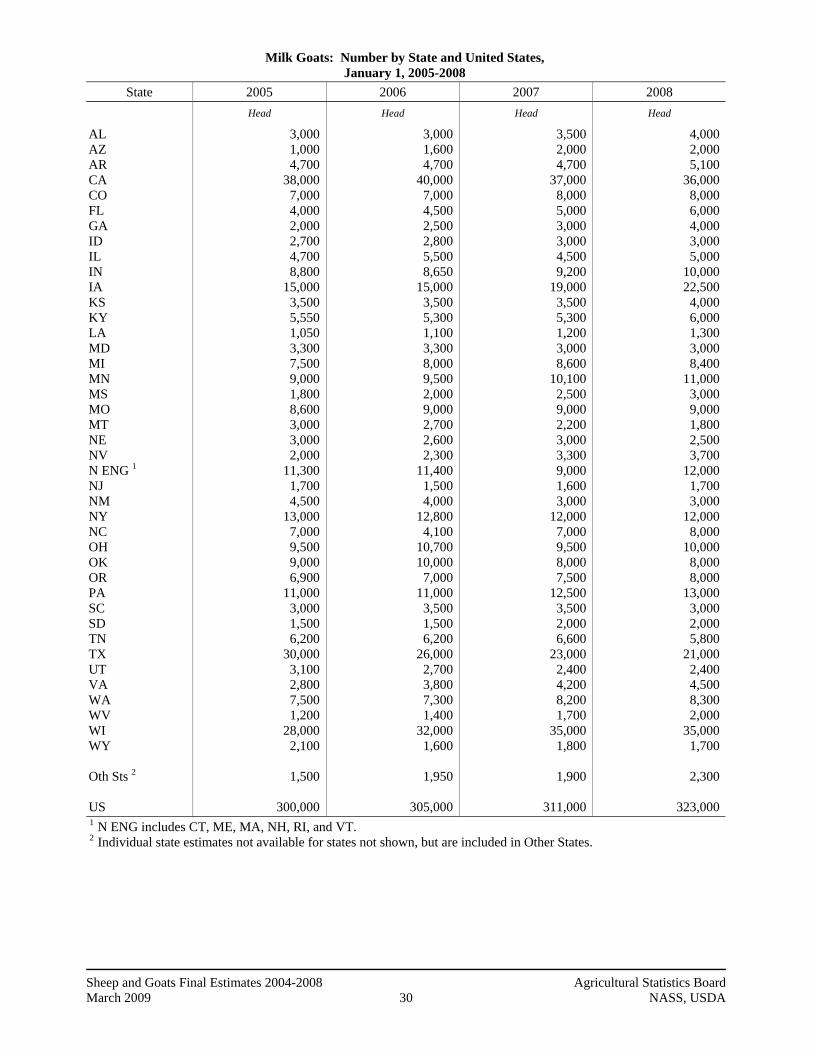
Milk Goats: Number by State and United States, January 1, 2005-2008
State 2005 2006 2007 2008
Head Head Head Head
AL AZ AR CA CO FL GA ID IL IN IA KS KY LA MD MI MN MS MO MT NE NV N ENG 1 NJ NM NY NC OH OK OR PA SC SD TN TX UT VA WA WV WI WY Oth Sts 2 US
3,000 1,000 4,700
38,000 7,000 4,000 2,000 2,700 4,700 8,800
15,000 3,500 5,550 1,050 3,300 7,500 9,000 1,800 8,600 3,000 3,000 2,000
11,300 1,700 4,500
13,000 7,000 9,500 9,000 6,900
11,000 3,000 1,500 6,200
30,000 3,100 2,800 7,500 1,200
28,000 2,100
1,500
300,000
3,000 1,600 4,700
40,000 7,000 4,500 2,500 2,800 5,500 8,650
15,000 3,500 5,300 1,100 3,300 8,000 9,500 2,000 9,000 2,700 2,600 2,300
11,400 1,500 4,000
12,800 4,100
10,700 10,000 7,000
11,000 3,500 1,500 6,200
26,000 2,700 3,800 7,300 1,400
32,000 1,600
1,950
305,000
3,500 2,000 4,700
37,000 8,000 5,000 3,000 3,000 4,500 9,200
19,000 3,500 5,300 1,200 3,000 8,600
10,100 2,500 9,000 2,200 3,000 3,300 9,000 1,600 3,000
12,000 7,000 9,500 8,000 7,500
12,500 3,500 2,000 6,600
23,000 2,400 4,200 8,200 1,700
35,000 1,800
1,900
311,000
4,000 2,000 5,100
36,000 8,000 6,000 4,000 3,000 5,000
10,000 22,500 4,000 6,000 1,300 3,000 8,400
11,000 3,000 9,000 1,800 2,500 3,700
12,000 1,700 3,000
12,000 8,000
10,000 8,000 8,000
13,000 3,000 2,000 5,800
21,000 2,400 4,500 8,300 2,000
35,000 1,700
2,300
323,000
1 N ENG includes CT, ME, MA, NH, RI, and VT. 2 Individual state estimates not available for states not shown, but are included in Other States.
Sheep and Goats Final Estimates 2004-2008 Agricultural Statistics Board March 2009 31 NASS, USDA
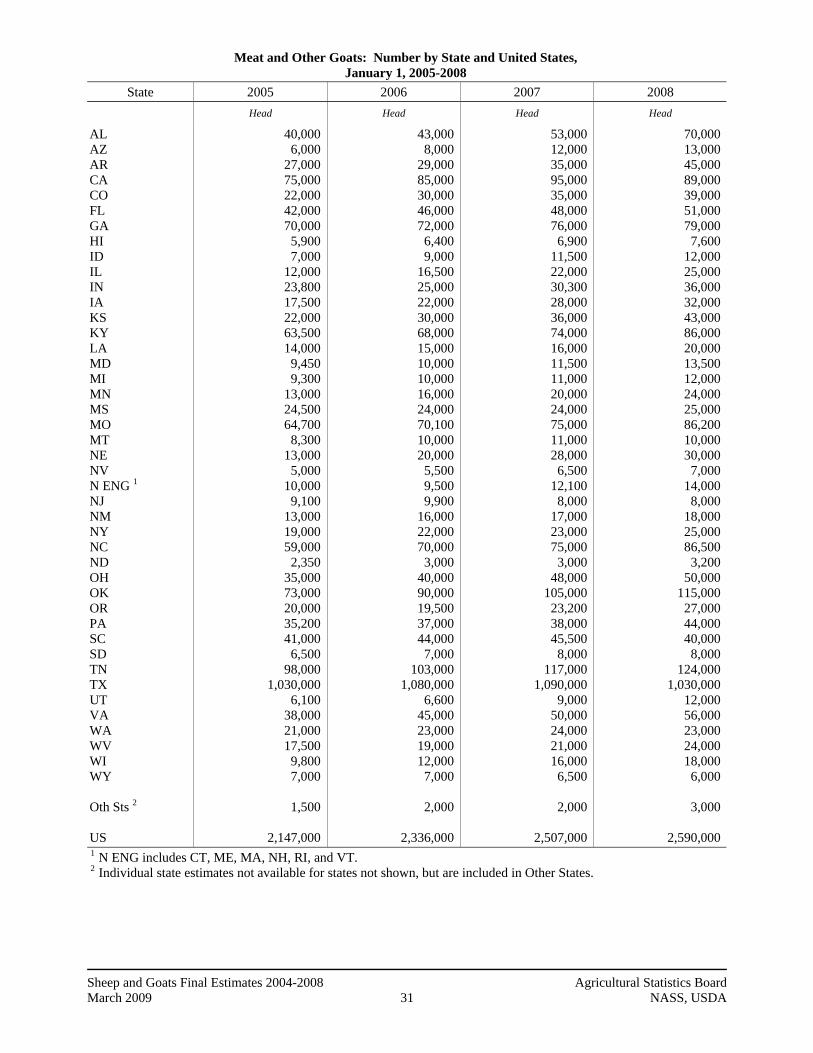
Meat and Other Goats: Number by State and United States, January 1, 2005-2008
State 2005 2006 2007 2008
Head Head Head Head
AL AZ AR CA CO FL GA HI ID IL IN IA KS KY LA MD MI MN MS MO MT NE NV N ENG 1 NJ NM NY NC ND OH OK OR PA SC SD TN TX UT VA WA WV WI WY Oth Sts 2 US
40,000 6,000
27,000 75,000 22,000 42,000 70,000 5,900 7,000
12,000 23,800 17,500 22,000 63,500 14,000 9,450 9,300
13,000 24,500 64,700 8,300
13,000 5,000
10,000 9,100
13,000 19,000 59,000 2,350
35,000 73,000 20,000 35,200 41,000 6,500
98,000 1,030,000
6,100 38,000 21,000 17,500 9,800 7,000
1,500
2,147,000
43,000 8,000
29,000 85,000 30,000 46,000 72,000 6,400 9,000
16,500 25,000 22,000 30,000 68,000 15,000 10,000 10,000 16,000 24,000 70,100 10,000 20,000 5,500 9,500 9,900
16,000 22,000 70,000 3,000
40,000 90,000 19,500 37,000 44,000 7,000
103,000 1,080,000
6,600 45,000 23,000 19,000 12,000 7,000
2,000
2,336,000
53,000 12,000 35,000 95,000 35,000 48,000 76,000 6,900
11,500 22,000 30,300 28,000 36,000 74,000 16,000 11,500 11,000 20,000 24,000 75,000 11,000 28,000 6,500
12,100 8,000
17,000 23,000 75,000 3,000
48,000 105,000
23,200 38,000 45,500 8,000
117,000 1,090,000
9,000 50,000 24,000 21,000 16,000 6,500
2,000
2,507,000
70,000 13,000 45,000 89,000 39,000 51,000 79,000 7,600
12,000 25,000 36,000 32,000 43,000 86,000 20,000 13,500 12,000 24,000 25,000 86,200 10,000 30,000 7,000
14,000 8,000
18,000 25,000 86,500 3,200
50,000 115,000
27,000 44,000 40,000 8,000
124,000 1,030,000
12,000 56,000 23,000 24,000 18,000 6,000
3,000
2,590,000
1 N ENG includes CT, ME, MA, NH, RI, and VT. 2 Individual state estimates not available for states not shown, but are included in Other States.
Sheep and Goats Final Estimates 2004-2008 Agricultural Statistics Board March 2009 32 NASS, USDA
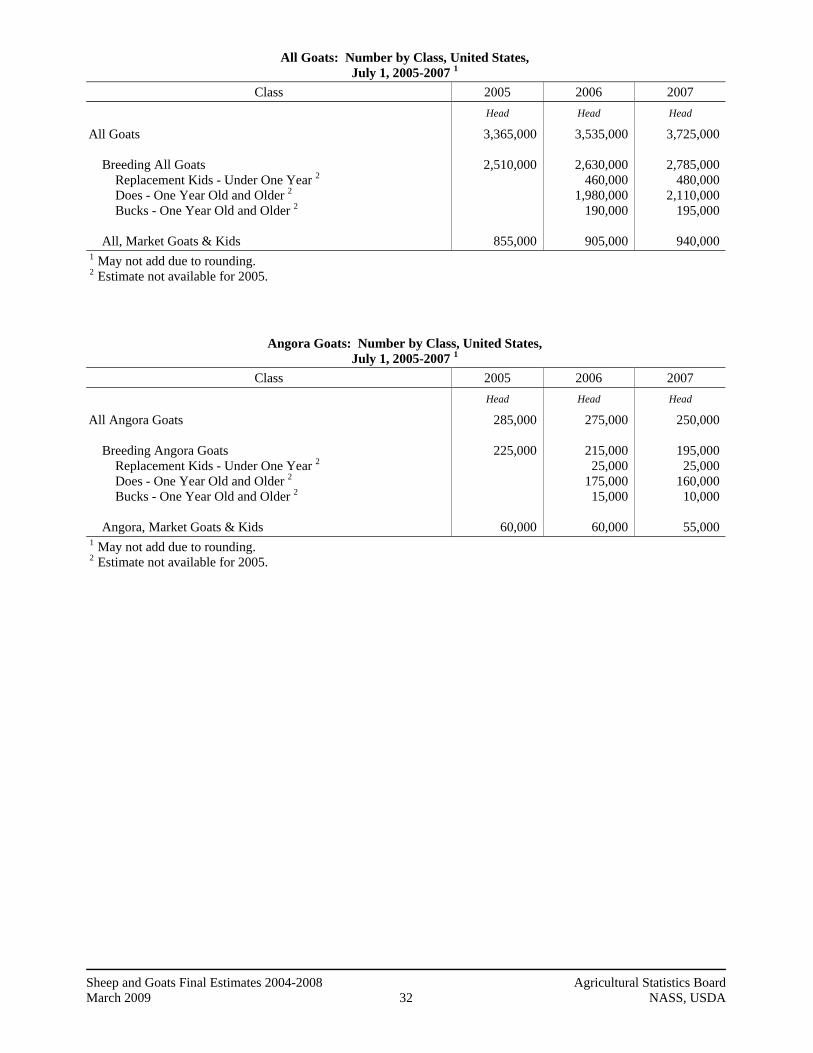
All Goats: Number by Class, United States, July 1, 2005-2007 1
Class 2005 2006 2007 Head Head Head
All Goats Breeding All Goats Replacement Kids - Under One Year 2 Does - One Year Old and Older 2 Bucks - One Year Old and Older 2 All, Market Goats & Kids
3,365,000
2,510,000
855,000
3,535,000
2,630,000 460,000
1,980,000 190,000
905,000
3,725,000
2,785,000 480,000
2,110,000 195,000
940,000
1 May not add due to rounding. 2 Estimate not available for 2005.
Angora Goats: Number by Class, United States, July 1, 2005-2007 1
Class 2005 2006 2007 Head Head Head
All Angora Goats Breeding Angora Goats Replacement Kids - Under One Year 2 Does - One Year Old and Older 2 Bucks - One Year Old and Older 2 Angora, Market Goats & Kids
285,000
225,000
60,000
275,000
215,000 25,000
175,000 15,000
60,000
250,000
195,000 25,000
160,000 10,000
55,000
1 May not add due to rounding. 2 Estimate not available for 2005.
Sheep and Goats Final Estimates 2004-2008 Agricultural Statistics Board March 2009 33 NASS, USDA
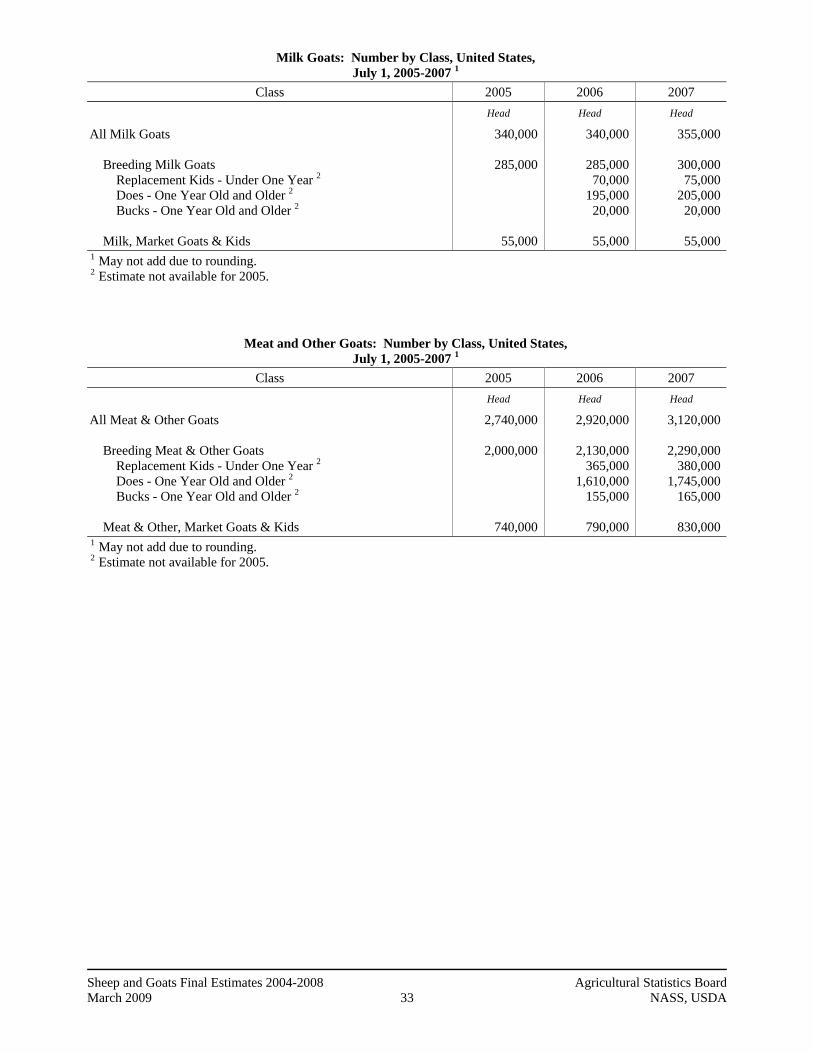
Milk Goats: Number by Class, United States, July 1, 2005-2007 1
Class 2005 2006 2007 Head Head Head
All Milk Goats Breeding Milk Goats Replacement Kids - Under One Year 2 Does - One Year Old and Older 2 Bucks - One Year Old and Older 2 Milk, Market Goats & Kids
340,000
285,000
55,000
340,000
285,000 70,000
195,000 20,000
55,000
355,000
300,000 75,000
205,000 20,000
55,000
1 May not add due to rounding. 2 Estimate not available for 2005.
Meat and Other Goats: Number by Class, United States, July 1, 2005-2007 1
Class 2005 2006 2007 Head Head Head
All Meat & Other Goats Breeding Meat & Other Goats Replacement Kids - Under One Year 2 Does - One Year Old and Older 2 Bucks - One Year Old and Older 2 Meat & Other, Market Goats & Kids
2,740,000
2,000,000
740,000
2,920,000
2,130,000 365,000
1,610,000 155,000
790,000
3,120,000
2,290,000 380,000
1,745,000 165,000
830,000
1 May not add due to rounding. 2 Estimate not available for 2005.
Sheep and Goats Final Estimates 2004-2008 Agricultural Statistics Board March 2009 34 NASS, USDA
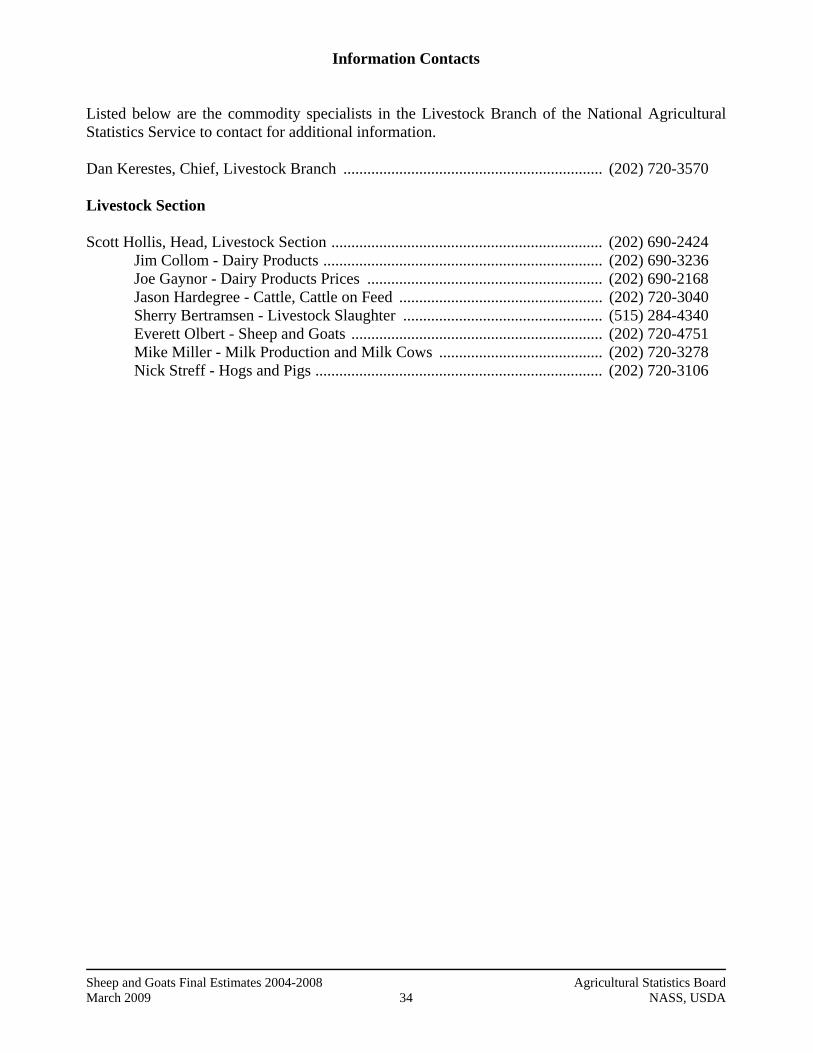
Information Contacts Listed below are the commodity specialists in the Livestock Branch of the National Agricultural Statistics Service to contact for additional information. Dan Kerestes, Chief, Livestock Branch ................................................................. (202) 720-3570 Livestock Section Scott Hollis, Head, Livestock Section .................................................................... (202) 690-2424 Jim Collom - Dairy Products ...................................................................... (202) 690-3236 Joe Gaynor - Dairy Products Prices ........................................................... (202) 690-2168 Jason Hardegree - Cattle, Cattle on Feed ................................................... (202) 720-3040 Sherry Bertramsen - Livestock Slaughter .................................................. (515) 284-4340 Everett Olbert - Sheep and Goats ............................................................... (202) 720-4751 Mike Miller - Milk Production and Milk Cows ......................................... (202) 720-3278 Nick Streff - Hogs and Pigs ........................................................................ (202) 720-3106
Sheep and Goats Final Estimates 2004-2008 Agricultural Statistics Board March 2009 35 NASS, USDA
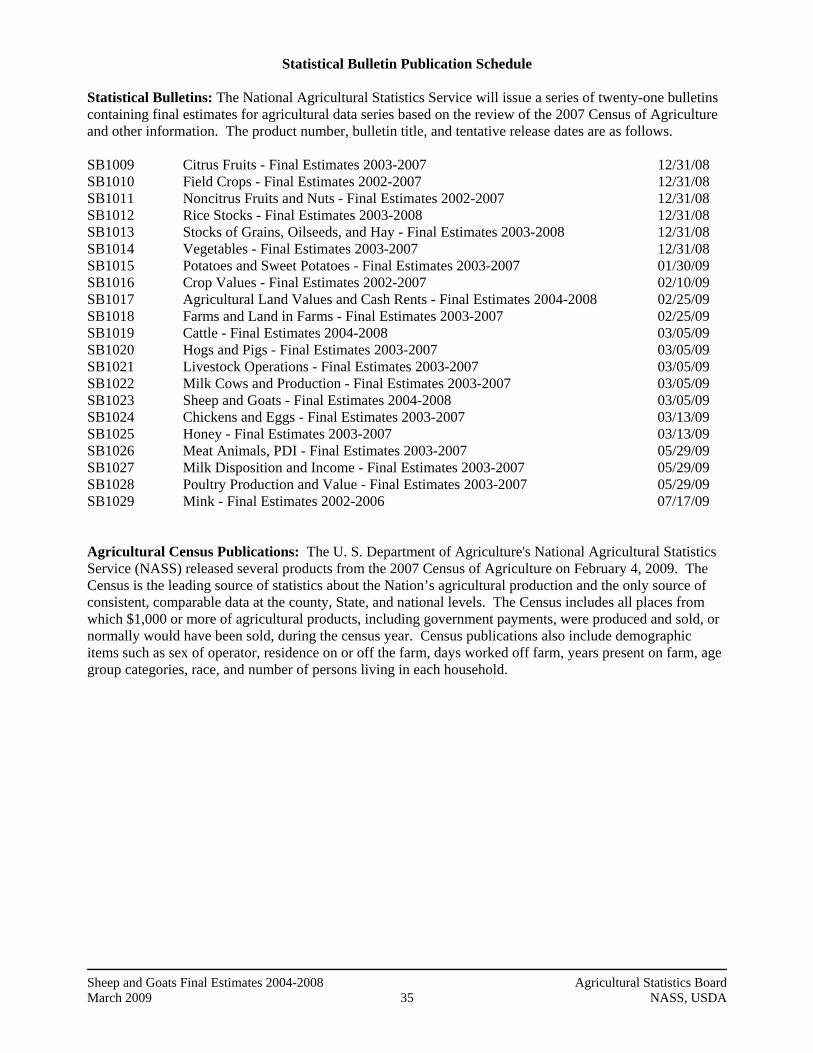
Statistical Bulletin Publication Schedule
Statistical Bulletins: The National Agricultural Statistics Service will issue a series of twenty-one bulletins containing final estimates for agricultural data series based on the review of the 2007 Census of Agriculture and other information. The product number, bulletin title, and tentative release dates are as follows. SB1009 Citrus Fruits - Final Estimates 2003-2007 12/31/08 SB1010 Field Crops - Final Estimates 2002-2007 12/31/08 SB1011 Noncitrus Fruits and Nuts - Final Estimates 2002-2007 12/31/08 SB1012 Rice Stocks - Final Estimates 2003-2008 12/31/08 SB1013 Stocks of Grains, Oilseeds, and Hay - Final Estimates 2003-2008 12/31/08 SB1014 Vegetables - Final Estimates 2003-2007 12/31/08 SB1015 Potatoes and Sweet Potatoes - Final Estimates 2003-2007 01/30/09 SB1016 Crop Values - Final Estimates 2002-2007 02/10/09 SB1017 Agricultural Land Values and Cash Rents - Final Estimates 2004-2008 02/25/09 SB1018 Farms and Land in Farms - Final Estimates 2003-2007 02/25/09 SB1019 Cattle - Final Estimates 2004-2008 03/05/09 SB1020 Hogs and Pigs - Final Estimates 2003-2007 03/05/09 SB1021 Livestock Operations - Final Estimates 2003-2007 03/05/09 SB1022 Milk Cows and Production - Final Estimates 2003-2007 03/05/09 SB1023 Sheep and Goats - Final Estimates 2004-2008 03/05/09 SB1024 Chickens and Eggs - Final Estimates 2003-2007 03/13/09 SB1025 Honey - Final Estimates 2003-2007 03/13/09 SB1026 Meat Animals, PDI - Final Estimates 2003-2007 05/29/09 SB1027 Milk Disposition and Income - Final Estimates 2003-2007 05/29/09 SB1028 Poultry Production and Value - Final Estimates 2003-2007 05/29/09 SB1029 Mink - Final Estimates 2002-2006 07/17/09 Agricultural Census Publications: The U. S. Department of Agriculture's National Agricultural Statistics Service (NASS) released several products from the 2007 Census of Agriculture on February 4, 2009. The Census is the leading source of statistics about the Nation’s agricultural production and the only source of consistent, comparable data at the county, State, and national levels. The Census includes all places from which $1,000 or more of agricultural products, including government payments, were produced and sold, or normally would have been sold, during the census year. Census publications also include demographic items such as sex of operator, residence on or off the farm, days worked off farm, years present on farm, age group categories, race, and number of persons living in each household.
ACCESS TO REPORTS!! For your convenience, there are several ways to obtain NASS reports, data products, and services:
INTERNET ACCESS All NASS reports are available free of charge on the worldwide Internet. For access, connect to the Internet and go to the NASS Home Page at: www.nass.usda.gov.
E-MAIL SUBSCRIPTION All NASS reports are available by subscription free of charge direct to your e-mail address. Starting with the NASS Home Page at www.nass.usda.gov, under the right navigation, Receive reports by Email, click on National or State. Follow the instructions on the screen.
- - - - - - - - - - - - - - - - - - - - - - - - - - - - - - - - -
PRINTED REPORTS OR DATA PRODUCTS
CALL OUR TOLL-FREE ORDER DESK: 800-999-6779 (U.S. and Canada) Other areas, please call 703-605-6220 FAX: 703-605-6900
(Visa, MasterCard, check, or money order acceptable for payment.)
- - - - - - - - - - - - - - - - - - - - - - - - - - - - - - - - - -
ASSISTANCE For assistance with general agricultural statistics or further information about NASS or its products or services, contact the Agricultural Statistics Hotline at 800-727-9540, 7:30 a.m. to 4:00 p.m. ET, or e-mail: [email protected]. The U.S. Department of Agriculture (USDA) prohibits discrimination in all its programs and activities on the basis of race, color, national origin, age, disability, and where applicable, sex, marital status, familial status, parental status, religion, sexual orientation, genetic information, political beliefs, reprisal, or because all or a part of an individual’s income is derived from any public assistance program. (Not all prohibited bases apply to all programs.) Persons with disabilities who require alternative means for communication of program information (Braille, large print, audiotape, etc.) should contact USDA’s TARGET Center at (202) 720-2600 (voice and TDD). To file a complaint of discrimination, write to USDA, Director, Office of Civil Rights, 1400 Independence Avenue, S.W., Washington, D.C. 20250-9410, or call (800) 795-3272 (voice) or (202) 720-6382 (TDD). USDA is an equal opportunity provider and employer.