Shear strength of reinforced concrete T-beams without stirrups
15
Journal of Engineering Science and Technology Vol. 11, No. 4 (2016) 548 - 562 © School of Engineering, Taylor’s University 548 SHEAR STRENGTH OF REINFORCED CONCRETE T-BEAMS WITHOUT STIRRUPS RENDY THAMRIN*, JAFRIL TANJUNG, RIZA ARYANTI, OSCAR FITRAH NUR, AZMU DEVINUS Department of Civil Engineering, Faculty of Engineering, Andalas University, Padang, 25163, West Sumatera, Indonesia *Corresponding Author: [email protected] Abstract This paper presents the test results of experimental study on shear strength of reinforced concrete beams without stirrups. The test variables in this study were type of beam cross section and ratio of longitudinal reinforcement. Six simple supported beams, consisting of three beams with rectangular cross section and three beams with T section, subjected to two point load were tested until failure. During the test, the values of the diagonal crack load and the maximum load were observed as well as the deformation of the beams. Existing empirical equations for shear strength of concrete presented in the literature and design codes were used and then compared to that value obtained from the test. Comparison between test results and theoretical shear capacity show that all of equations conservatively estimate the occurrence of shear failure with the values of the test results 10 to 90% higher than the theoretical values. It was confirmed from the test that the shear capacity of T-beams were higher than for rectangular beams, with the values ranging from 5 to 25%, depending on the ratio of longitudinal reinforcement. Also, it was observed that ratio of longitudinal reinforcement influences the shear capacity of the beam as well as the angle of diagonal shear crack. In addition, based on the test results, a simple model for predicting the contribution of flange to shear capacity in T-beam was presented. Keywords: Reinforced concrete, T-beam, shear crack, Longitudinal reinforcements ratio, Angle of diagonal crack. 1. Introduction Study on shear performance of reinforced concrete structures has been carried out by other researchers over the last 60 years [1-6]. The test variables used to investigate shear behavior of reinforced concrete structures frequently found in literature refer
Transcript of Shear strength of reinforced concrete T-beams without stirrups

Journal of Engineering Science and Technology Vol. 11, No. 4 (2016) 548 - 562 © School of Engineering, Taylor’s University
548
SHEAR STRENGTH OF REINFORCED CONCRETE T-BEAMS WITHOUT STIRRUPS
RENDY THAMRIN*, JAFRIL TANJUNG, RIZA ARYANTI, OSCAR FITRAH NUR, AZMU DEVINUS
Department of Civil Engineering, Faculty of Engineering, Andalas University,
Padang, 25163, West Sumatera, Indonesia
*Corresponding Author: [email protected]
Abstract
This paper presents the test results of experimental study on shear strength of
reinforced concrete beams without stirrups. The test variables in this study were type of beam cross section and ratio of longitudinal reinforcement. Six simple
supported beams, consisting of three beams with rectangular cross section and
three beams with T section, subjected to two point load were tested until failure.
During the test, the values of the diagonal crack load and the maximum load were
observed as well as the deformation of the beams. Existing empirical equations for shear strength of concrete presented in the literature and design codes were
used and then compared to that value obtained from the test. Comparison between
test results and theoretical shear capacity show that all of equations conservatively
estimate the occurrence of shear failure with the values of the test results 10 to
90% higher than the theoretical values. It was confirmed from the test that the
shear capacity of T-beams were higher than for rectangular beams, with the values ranging from 5 to 25%, depending on the ratio of longitudinal reinforcement.
Also, it was observed that ratio of longitudinal reinforcement influences the shear
capacity of the beam as well as the angle of diagonal shear crack. In addition,
based on the test results, a simple model for predicting the contribution of flange
to shear capacity in T-beam was presented.
Keywords: Reinforced concrete, T-beam, shear crack, Longitudinal reinforcements ratio, Angle of diagonal crack.
1. Introduction
Study on shear performance of reinforced concrete structures has been carried out by
other researchers over the last 60 years [1-6]. The test variables used to investigate
shear behavior of reinforced concrete structures frequently found in literature refer
Shear Strength of Reinforced Concrete T-Beams without Stirrups . . . . 549
Journal of Engineering Science and Technology April 2016, Vol. 11(4)
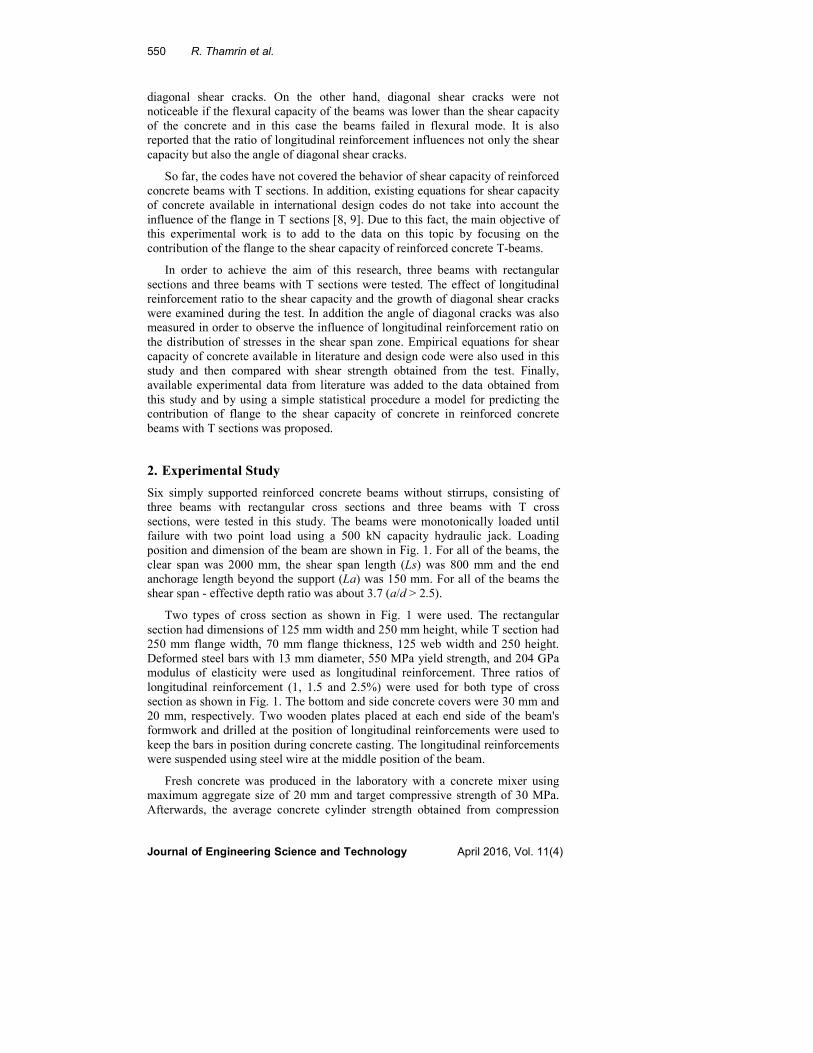
Nomenclatures
a shear span length
bf width of flange
bw width of web
c neutral axis depth
d effective depth
fc' concrete compressive strength
hf height of flange
k 0.2)200(0.1 ≤+ d
Vc shear capacity of concrete
Greek Symbols
α parameter taking into account the effect of flange in T section
ρw ratio of longitudinal reinforcement (%)
Abbreviations
ACI American Concrete Institute
SNI Standar Nasional Indonesia
LVDT Linear Variable Differential Transformer
RCCSA Reinforced Concrete Cross Section Analysis
to the main parameters affecting the occurrence of shear failure e.g. concrete
compressive strength, longitudinal reinforcement ratio, shear span to effective
depth ratio and effect of member size. Most studies in this area focused only on
reinforced concrete beams with rectangular cross section.
Bresler and McGregor [2] reported that shear failure is commonly initiated by
the occurrence of diagonal cracks developing in the shear span. It is also stated in
their paper that the flexural cracks always come before the occurrence of diagonal
cracks in rectangular, I or T sections. Bresler and McGregor noted that the shape
of the beam (I and T sections) influences the shear capacity and the behaviour of
propagation of diagonal cracking due to the different magnitude of shearing stress
developed in the web. However, not much attention has been given to the
behavior of reinforced concrete beams with T sections.
In another report, Swamy and Qureshi [5] proposed an analytical procedure to
calculate the ultimate shear strength of the compression zone of T-beams with long
shear span. The theory of this procedure was derived using the concept of biaxial stress
criterion and was based on Mohr's theory of failure. In this method the variables
affecting the ultimate shear strength of the compression zone of T-beams are concrete
compression strength, longitudinal reinforcement ratio, shear span length and effective
depth of the section. Even though Swamy and Qureshi stated that their theory showed
good agreement with test results their computation procedure is not simple, it needs
several steps of calculation and difficult to apply in practice.
A series of tests designed to study shear failure in reinforced concrete beams
without stirrups has been carried out previously [7]. In this earlier study, the type
of cross section was rectangular and the test variables were ratio of longitudinal
reinforcement and shear span to effective depth ratio. It is reported from this
study that most of the beams tested collapsed suddenly after the formation of
550 R. Thamrin et al.
Journal of Engineering Science and Technology April 2016, Vol. 11(4)
diagonal shear cracks. On the other hand, diagonal shear cracks were not
noticeable if the flexural capacity of the beams was lower than the shear capacity
of the concrete and in this case the beams failed in flexural mode. It is also
reported that the ratio of longitudinal reinforcement influences not only the shear
capacity but also the angle of diagonal shear cracks.
So far, the codes have not covered the behavior of shear capacity of reinforced
concrete beams with T sections. In addition, existing equations for shear capacity
of concrete available in international design codes do not take into account the
influence of the flange in T sections [8, 9]. Due to this fact, the main objective of
this experimental work is to add to the data on this topic by focusing on the
contribution of the flange to the shear capacity of reinforced concrete T-beams.
In order to achieve the aim of this research, three beams with rectangular
sections and three beams with T sections were tested. The effect of longitudinal
reinforcement ratio to the shear capacity and the growth of diagonal shear cracks
were examined during the test. In addition the angle of diagonal cracks was also
measured in order to observe the influence of longitudinal reinforcement ratio on
the distribution of stresses in the shear span zone. Empirical equations for shear
capacity of concrete available in literature and design code were also used in this
study and then compared with shear strength obtained from the test. Finally,
available experimental data from literature was added to the data obtained from
this study and by using a simple statistical procedure a model for predicting the
contribution of flange to the shear capacity of concrete in reinforced concrete
beams with T sections was proposed.
2. Experimental Study
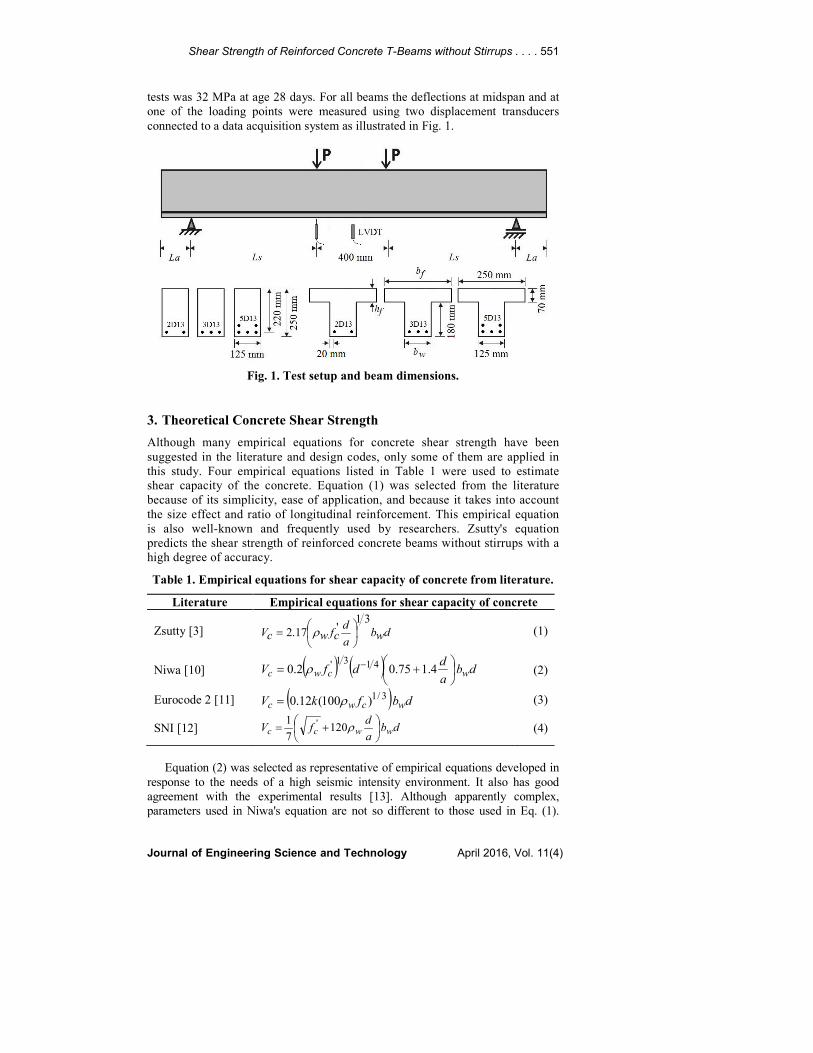
Six simply supported reinforced concrete beams without stirrups, consisting of
three beams with rectangular cross sections and three beams with T cross
sections, were tested in this study. The beams were monotonically loaded until
failure with two point load using a 500 kN capacity hydraulic jack. Loading
position and dimension of the beam are shown in Fig. 1. For all of the beams, the
clear span was 2000 mm, the shear span length (Ls) was 800 mm and the end
anchorage length beyond the support (La) was 150 mm. For all of the beams the
shear span - effective depth ratio was about 3.7 (a/d > 2.5).
Two types of cross section as shown in Fig. 1 were used. The rectangular
section had dimensions of 125 mm width and 250 mm height, while T section had
250 mm flange width, 70 mm flange thickness, 125 web width and 250 height.
Deformed steel bars with 13 mm diameter, 550 MPa yield strength, and 204 GPa
modulus of elasticity were used as longitudinal reinforcement. Three ratios of
longitudinal reinforcement (1, 1.5 and 2.5%) were used for both type of cross
section as shown in Fig. 1. The bottom and side concrete covers were 30 mm and
20 mm, respectively. Two wooden plates placed at each end side of the beam's
formwork and drilled at the position of longitudinal reinforcements were used to
keep the bars in position during concrete casting. The longitudinal reinforcements
were suspended using steel wire at the middle position of the beam.
Fresh concrete was produced in the laboratory with a concrete mixer using
maximum aggregate size of 20 mm and target compressive strength of 30 MPa.
Afterwards, the average concrete cylinder strength obtained from compression
Shear Strength of Reinforced Concrete T-Beams without Stirrups . . . . 551
Journal of Engineering Science and Technology April 2016, Vol. 11(4)
tests was 32 MPa at age 28 days. For all beams the deflections at midspan and at
one of the loading points were measured using two displacement transducers
connected to a data acquisition system as illustrated in Fig. 1.
Fig. 1. Test setup and beam dimensions.
3. Theoretical Concrete Shear Strength
Although many empirical equations for concrete shear strength have been
suggested in the literature and design codes, only some of them are applied in
this study. Four empirical equations listed in Table 1 were used to estimate
shear capacity of the concrete. Equation (1) was selected from the literature
because of its simplicity, ease of application, and because it takes into account
the size effect and ratio of longitudinal reinforcement. This empirical equation
is also well-known and frequently used by researchers. Zsutty's equation
predicts the shear strength of reinforced concrete beams without stirrups with a
high degree of accuracy.
Table 1. Empirical equations for shear capacity of concrete from literature.
Literature Empirical equations for shear capacity of concrete
Zsutty [3] dwba
dcfwcV
31'17.2
= ρ (1)
Niwa [10] ( ) ( ) dba
ddfV wcwc 4.175.02.0 4131'
+= −ρ (2)
Eurocode 2 [11] ( ) dbfkV wcwc )100(12.0 3/1ρ= (3)
SNI [12] dba
dfV wwcc 120
7
1 '
+= ρ (4)
Equation (2) was selected as representative of empirical equations developed in
response to the needs of a high seismic intensity environment. It also has good
agreement with the experimental results [13]. Although apparently complex,
parameters used in Niwa's equation are not so different to those used in Eq. (1).

552 R. Thamrin et al.
Journal of Engineering Science and Technology April 2016, Vol. 11(4)
Furthermore, Eq. (3) is an equation adopted from Eurocode2 [11] as representative
of the international codes and Eq. (4) is an equation adopted from SNI 03-2847-
2002 as representative of the local code [12]. SNI 03-2847-2002 has adopted a
similar expression with the equation for concrete shear strength suggested in ACI
318M-08 code [14]. It is shown in Table 1 that all listed equations take into account
the concrete compressive strength, longitudinal reinforcements ratio, shear span to
effective depth ratio, and size effect. The constant values in each of equation are
different due to the choice of mathematical function used to model the observed
data and statistical approaches used to analyse it.
4. Results and Discussion
It was observed from the test that the earliest flexural cracks, for both types of
beam cross section, developed in the pure moment zone when concrete reached its
tensile strength at an average load value of 26 kN. Then, as the load increased, the
flexural cracks extended to the shear span zone which then turned to become
diagonal shear cracks at an average load value of 36 kN. Soon after that, all of the
tested beams failed in shear (shear-tension failure) as expected. This type of shear
failure is indicated by rapid propagation of diagonal shear cracks in the shear span
zone shortly followed by sudden collapse of the beams. In addition, at failure
stage the diagonal cracks continued to develop rapidly towards the support and
compression surface of the shear span zone near the point load. The maximum
shear load for each tested beam is listed in Table 2. It is shown that the maximum
load for beams with T sections is higher than that for rectangular section with the
values ranging from 5 to 25%, depending on the ratio of longitudinal
reinforcement. This fact confirms that the flange in T beams affects the shear
stress distribution and propagation of the diagonal cracks in the web.
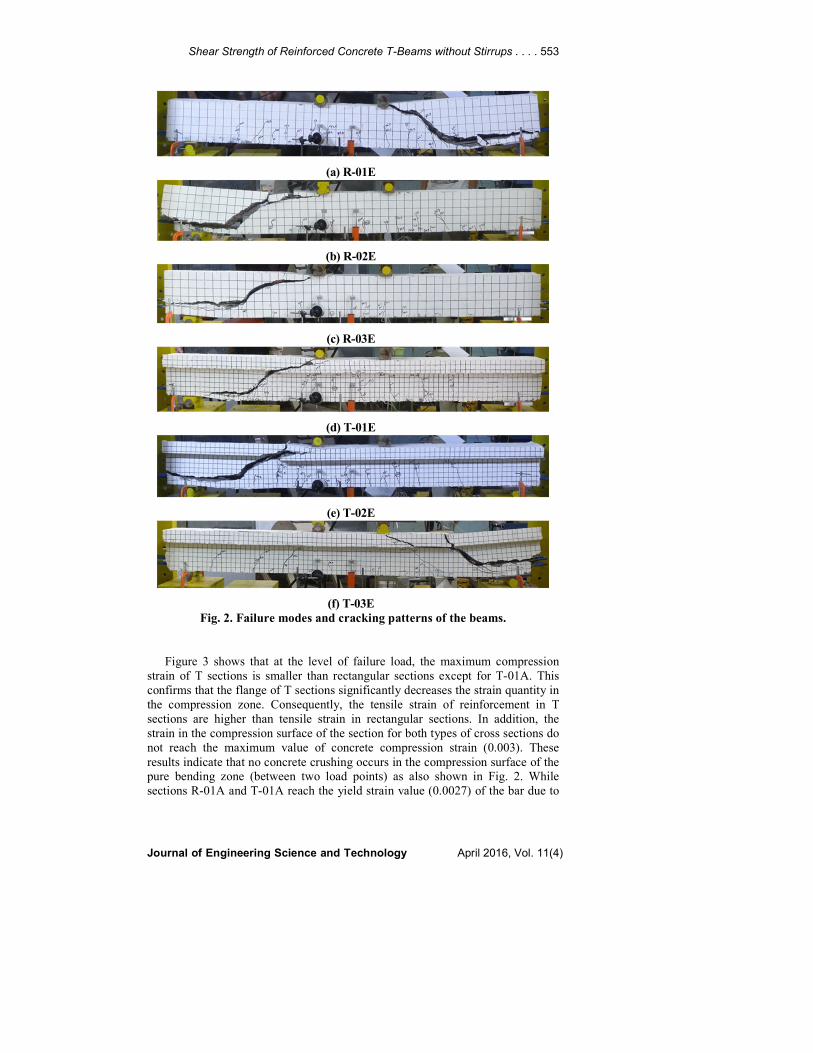
Failure modes and cracking patterns of the beams are shown in Fig. 2. The
diagonal shear cracks developed in the shear span zone for all beams tested. As
shown in Fig. 2, in case of beams with rectangular sections, the height of flexural
cracks along the beam length are relatively small especially for beams R-02E and
R-03E. On the other hand, in case of beam T-01E, the flexural cracks were
developed up to the flange. While for the other two beams with higher
reinforcement ratio (T-02E and T-03E) the height of flexural cracks are relatively
small. This indicates that the flange and ratio of longitudinal reinforcement not
only affects the shear capacity of the beams but also influences the crack
formation of the beams significantly.
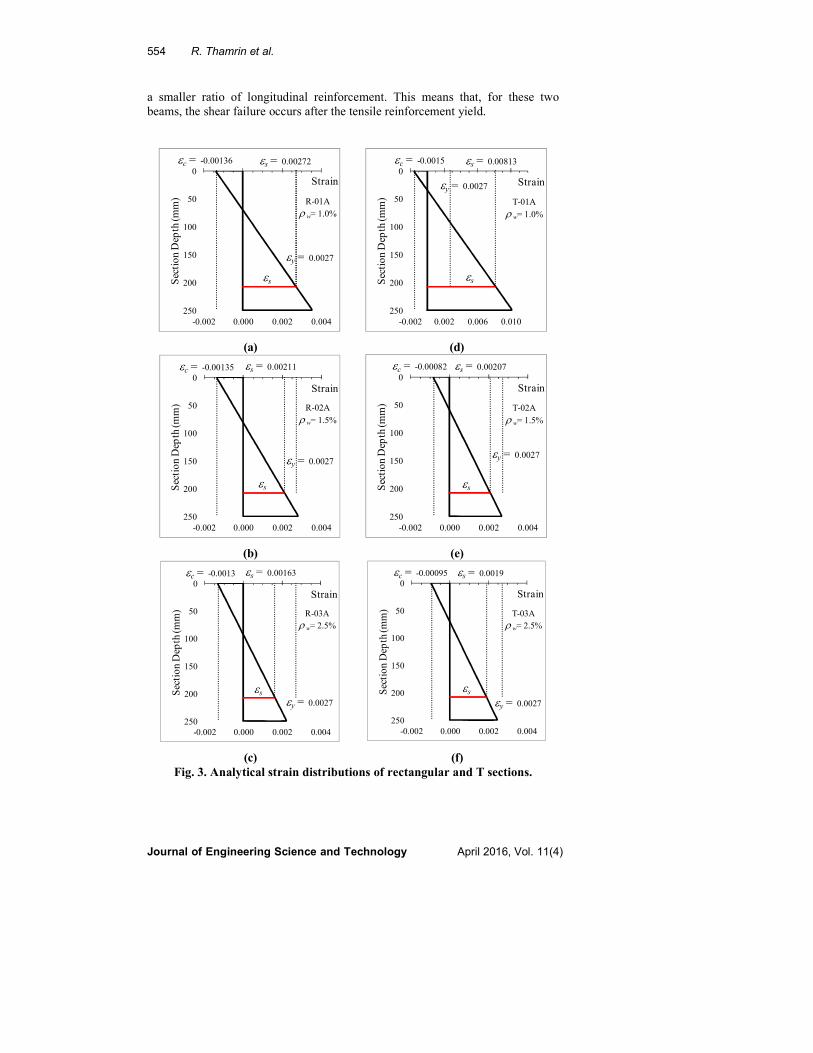
This can be explained using calculated strain distributions of rectangular (R-
01A, R-02A and R-03A) and T sections (T-01A, T-02A and T-03A) as shown in
Fig. 3. These strain distributions were obtained numerically based on layered
element method described in literature [15]. In this method, the reinforced concrete
cross section is divided into finite layer elements. A nonlinear stress-strain
relationships of concrete and steel should be used in the calculation process. The
strains and the corresponding stresses in both steel and concrete elements are then
predicted through an iterative procedure by estimating neutral axis depth for a given
curvature which satisfies the equilibrium conditions. A numerical procedure was
applied to determine the full response of a reinforced concrete cross section until the
failure load. This procedure was implemented using a computer program named
Reinforced Concrete Cross Section Analysis (RCCSA) developed by Thamrin [16].
Shear Strength of Reinforced Concrete T-Beams without Stirrups . . . . 553
Journal of Engineering Science and Technology April 2016, Vol. 11(4)
(a) R-01E
(b) R-02E
(c) R-03E
(d) T-01E
(e) T-02E
(f) T-03E
Fig. 2. Failure modes and cracking patterns of the beams.
Figure 3 shows that at the level of failure load, the maximum compression
strain of T sections is smaller than rectangular sections except for T-01A. This
confirms that the flange of T sections significantly decreases the strain quantity in
the compression zone. Consequently, the tensile strain of reinforcement in T
sections are higher than tensile strain in rectangular sections. In addition, the
strain in the compression surface of the section for both types of cross sections do
not reach the maximum value of concrete compression strain (0.003). These
results indicate that no concrete crushing occurs in the compression surface of the
pure bending zone (between two load points) as also shown in Fig. 2. While
sections R-01A and T-01A reach the yield strain value (0.0027) of the bar due to
554 R. Thamrin et al.
Journal of Engineering Science and Technology April 2016, Vol. 11(4)
a smaller ratio of longitudinal reinforcement. This means that, for these two
beams, the shear failure occurs after the tensile reinforcement yield.
(a) (d)
(b) (e)
(c) (f)
Fig. 3. Analytical strain distributions of rectangular and T sections.
0
50
100
150
200
250
-0.002 0.000 0.002 0.004
Section Depth (mm)
Strain
R-01A
ρ w= 1.0%
εc = -0.00136
εs
εs = 0.00272
εy = 0.0027
0
50
100
150
200
250
-0.002 0.002 0.006 0.010
Section Depth (mm)
Strain
T-01A
ρ w= 1.0%
εc = -0.0015
εs
εs = 0.00813
εy = 0.0027
0
50
100
150
200
250
-0.002 0.000 0.002 0.004
Section Dep
th (mm)
Strain
R-02A
ρ w= 1.5%
εc = -0.00135
εs
εs = 0.00211
εy = 0.0027
0
50
100
150
200
250
-0.002 0.000 0.002 0.004
Section Depth (mm)
Strain
T-02A
ρ w= 1.5%
εc = -0.00082
εs
εs = 0.00207
εy = 0.0027
0
50
100
150
200
250
-0.002 0.000 0.002 0.004
Section Depth (mm)
Strain
R-03A
ρ w= 2.5%
εc = -0.0013
εs
εs = 0.00163
εy = 0.0027
0
50
100
150
200
250
-0.002 0.000 0.002 0.004
Section Depth (mm)
Strain
T-03A
ρ w= 2.5%
εc = -0.00095
εs
εs = 0.0019
εy = 0.0027
Shear Strength of Reinforced Concrete T-Beams without Stirrups . . . . 555
Journal of Engineering Science and Technology April 2016, Vol. 11(4)
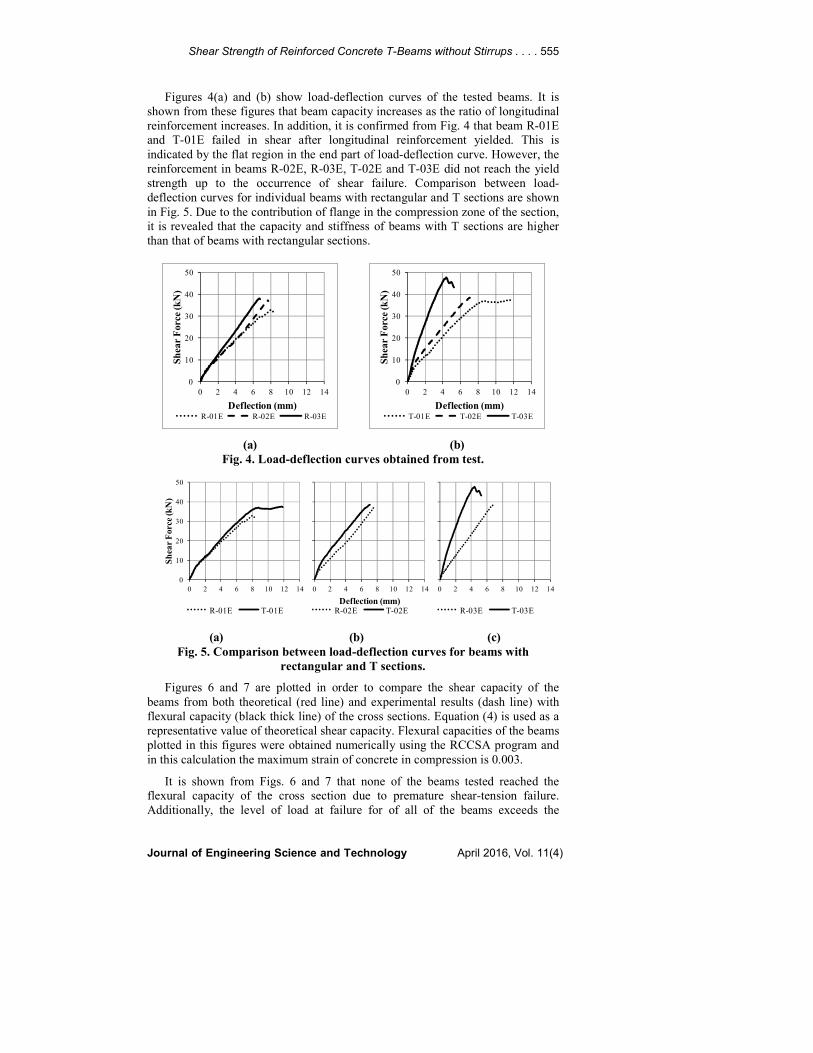
Figures 4(a) and (b) show load-deflection curves of the tested beams. It is
shown from these figures that beam capacity increases as the ratio of longitudinal
reinforcement increases. In addition, it is confirmed from Fig. 4 that beam R-01E
and T-01E failed in shear after longitudinal reinforcement yielded. This is
indicated by the flat region in the end part of load-deflection curve. However, the
reinforcement in beams R-02E, R-03E, T-02E and T-03E did not reach the yield
strength up to the occurrence of shear failure. Comparison between load-
deflection curves for individual beams with rectangular and T sections are shown
in Fig. 5. Due to the contribution of flange in the compression zone of the section,
it is revealed that the capacity and stiffness of beams with T sections are higher
than that of beams with rectangular sections.
(a) (b)
Fig. 4. Load-deflection curves obtained from test.
(a) (b) (c)
Fig. 5. Comparison between load-deflection curves for beams with
rectangular and T sections.
Figures 6 and 7 are plotted in order to compare the shear capacity of the
beams from both theoretical (red line) and experimental results (dash line) with
flexural capacity (black thick line) of the cross sections. Equation (4) is used as a
representative value of theoretical shear capacity. Flexural capacities of the beams
plotted in this figures were obtained numerically using the RCCSA program and
in this calculation the maximum strain of concrete in compression is 0.003.
It is shown from Figs. 6 and 7 that none of the beams tested reached the
flexural capacity of the cross section due to premature shear-tension failure.
Additionally, the level of load at failure for of all of the beams exceeds the
0
10
20
30
40
50
0 2 4 6 8 10 12 14
Shear Force (kN)
Deflection (mm)R-01E R-02E R-03E
0
10
20
30
40
50
0 2 4 6 8 10 12 14Shear Force (kN)
Deflection (mm)T-01E T-02E T-03E
0
10
20
30
40
50
0 2 4 6 8 10 12 14
Shear Force (kN)
Deflection (mm)R-03E T-03E
0
10
20
30
40
50
0 2 4 6 8 10 12 14
Shear Force (kN)
Deflection (mm)R-02E T-02E
0
10
20
30
40
50
0 2 4 6 8 10 12 14
Shear Force (kN)
Deflection (mm)R-01E T-01E

556 R. Thamrin et al.
Journal of Engineering Science and Technology April 2016, Vol. 11(4)
theoretical shear capacity of concrete calculated using Eq. (4). As well, flexural
capacity of cross section increases as the ratio of longitudinal reinforcement
increases. These figures also illustrate clearly the quantity of shear force needed
to achieve the flexural capacity for each increment of longitudinal reinforcement
ratio. The higher the ratio of longitudinal reinforcement, the higher the shear
strength required for failure.
(a) (b) (c)
Fig. 6. Experimental shear and flexural capacities of rectangular beams.
(a) (b) (c)
Fig. 7. Experimental shear and flexural capacities of T-beams.
(a) (b)
Fig. 8. Effect of reinforcement ratio on
shear capacity and angle of diagonal crack.
0
10
20
30
40
50
60
70
80
0 2 4 6 8 10 12
Shear Force (kN)
Deflection (mm)R-03E
0
10
20
30
40
50
60
70
80
0 2 4 6 8 10 12Shear Force (kN)
Deflection (mm)R-02E
0
10
20
30
40
50
60
70
80
0 2 4 6 8 10 12
Shear Force (kN)
Deflection (mm)R-01E
Flex. Capacity
Eqn. (4) Eqn. (4)Eqn. (4)
Flex. Capacity
Flex. Capacity
0
10
20
30
40
50
60
70
80
0 2 4 6 8 10 12
Shear Force (kN)
Deflection (mm)T-03E
0
10
20
30
40
50
60
70
80
0 2 4 6 8 10 12
Shear Force (kN)
Deflection (mm)T-02E
0
10
20
30
40
50
60
70
80
0 2 4 6 8 10 12
Shear Force (kN)
Deflection (mm)T-01E
Eqn. (4)Eqn. (4)Eqn. (4)
Flex. CapacityFlex. Capacity
Flex. Capacity
0
10
20
30
40
50
0.0 1.0 2.0 3.0
Shear Capacity (kN)
Reinforcement Ratio (%)
R-Beam T-Beam
0
10
20
30
40
50
0.0 1.0 2.0 3.0
Angle of Diagonal Crack
Reinforcement Ratio (%)
R-Beam T-Beam
Shear Strength of Reinforced Concrete T-Beams without Stirrups . . . . 557
Journal of Engineering Science and Technology April 2016, Vol. 11(4)
The effect of longitudinal reinforcement ratio on shear capacity and angle of
diagonal cracks are plotted in Fig. 8. It is shown that most of the beams failed
with the angle of diagonal crack around 450. However, as concrete is a non-
homogeneous material, a wide variation of angle of diagonal crack is shown in
beams R-03E and T-02E. Generally speaking the angle of diagonal crack
decreases as the ratio of longitudinal reinforcement increases. It is also
demonstrated that the ratio of longitudinal reinforcement significantly affects the
shear capacity and angle of diagonal crack.
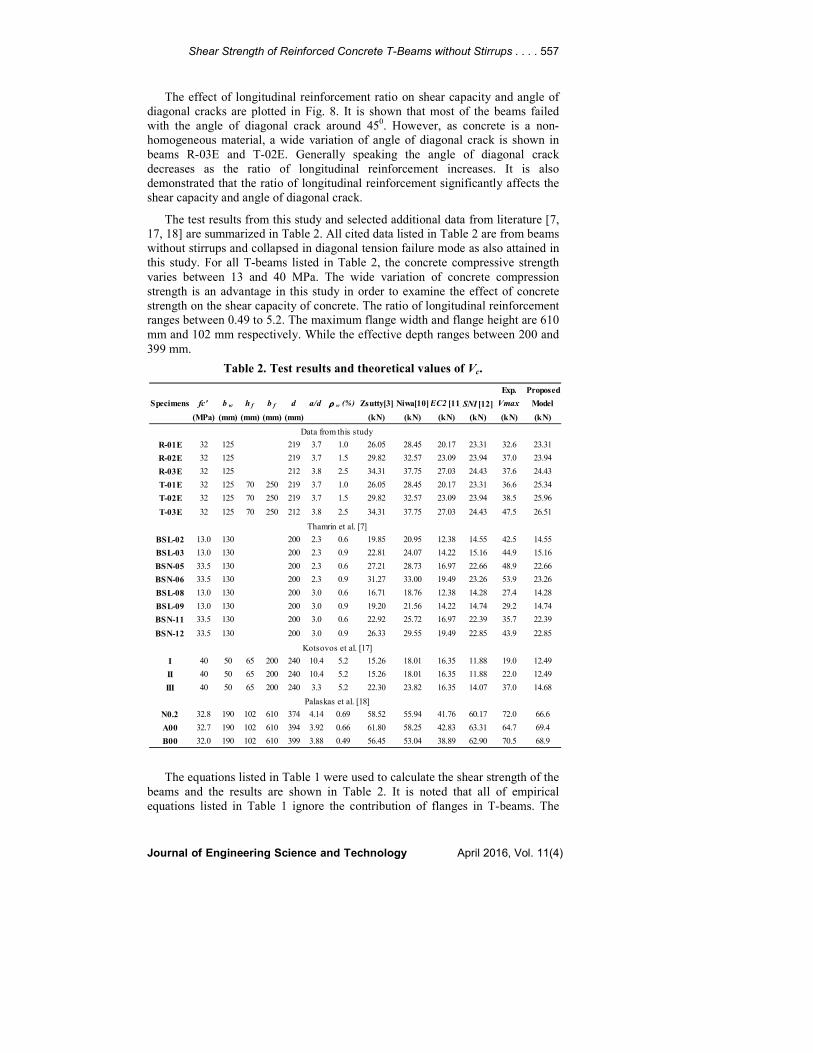
The test results from this study and selected additional data from literature [7,
17, 18] are summarized in Table 2. All cited data listed in Table 2 are from beams
without stirrups and collapsed in diagonal tension failure mode as also attained in
this study. For all T-beams listed in Table 2, the concrete compressive strength
varies between 13 and 40 MPa. The wide variation of concrete compression
strength is an advantage in this study in order to examine the effect of concrete
strength on the shear capacity of concrete. The ratio of longitudinal reinforcement
ranges between 0.49 to 5.2. The maximum flange width and flange height are 610
mm and 102 mm respectively. While the effective depth ranges between 200 and
399 mm.
Table 2. Test results and theoretical values of Vc.
The equations listed in Table 1 were used to calculate the shear strength of the
beams and the results are shown in Table 2. It is noted that all of empirical
equations listed in Table 1 ignore the contribution of flanges in T-beams. The
Exp. Proposed
Specimens fc' b w h f b f d a/d ρρρρ w (%) Zsutty[3] Niwa[10]EC2 [11]SNI [12] Vmax Model
(MPa) (mm) (mm) (mm) (mm) (kN) (kN) (kN) (kN) (kN) (kN)
R-01E 32 125 219 3.7 1.0 26.05 28.45 20.17 23.31 32.6 23.31
R-02E 32 125 219 3.7 1.5 29.82 32.57 23.09 23.94 37.0 23.94
R-03E 32 125 212 3.8 2.5 34.31 37.75 27.03 24.43 37.6 24.43
T-01E 32 125 70 250 219 3.7 1.0 26.05 28.45 20.17 23.31 36.6 25.34
T-02E 32 125 70 250 219 3.7 1.5 29.82 32.57 23.09 23.94 38.5 25.96
T-03E 32 125 70 250 212 3.8 2.5 34.31 37.75 27.03 24.43 47.5 26.51
BSL-02 13.0 130 200 2.3 0.6 19.85 20.95 12.38 14.55 42.5 14.55
BSL-03 13.0 130 200 2.3 0.9 22.81 24.07 14.22 15.16 44.9 15.16
BSN-05 33.5 130 200 2.3 0.6 27.21 28.73 16.97 22.66 48.9 22.66
BSN-06 33.5 130 200 2.3 0.9 31.27 33.00 19.49 23.26 53.9 23.26
BSL-08 13.0 130 200 3.0 0.6 16.71 18.76 12.38 14.28 27.4 14.28
BSL-09 13.0 130 200 3.0 0.9 19.20 21.56 14.22 14.74 29.2 14.74
BSN-11 33.5 130 200 3.0 0.6 22.92 25.72 16.97 22.39 35.7 22.39
BSN-12 33.5 130 200 3.0 0.9 26.33 29.55 19.49 22.85 43.9 22.85
I 40 50 65 200 240 10.4 5.2 15.26 18.01 16.35 11.88 19.0 12.49
II 40 50 65 200 240 10.4 5.2 15.26 18.01 16.35 11.88 22.0 12.49
III 40 50 65 200 240 3.3 5.2 22.30 23.82 16.35 14.07 37.0 14.68
N0.2 32.8 190 102 610 374 4.14 0.69 58.52 55.94 41.76 60.17 72.0 66.6
A00 32.7 190 102 610 394 3.92 0.66 61.80 58.25 42.83 63.31 64.7 69.4
B00 32.0 190 102 610 399 3.88 0.49 56.45 53.04 38.89 62.90 70.5 68.9
Kotsovos et al. [17]
Palaskas et al. [18]
Data from this study
Thamrin et al. [7]
558 R. Thamrin et al.
Journal of Engineering Science and Technology April 2016, Vol. 11(4)
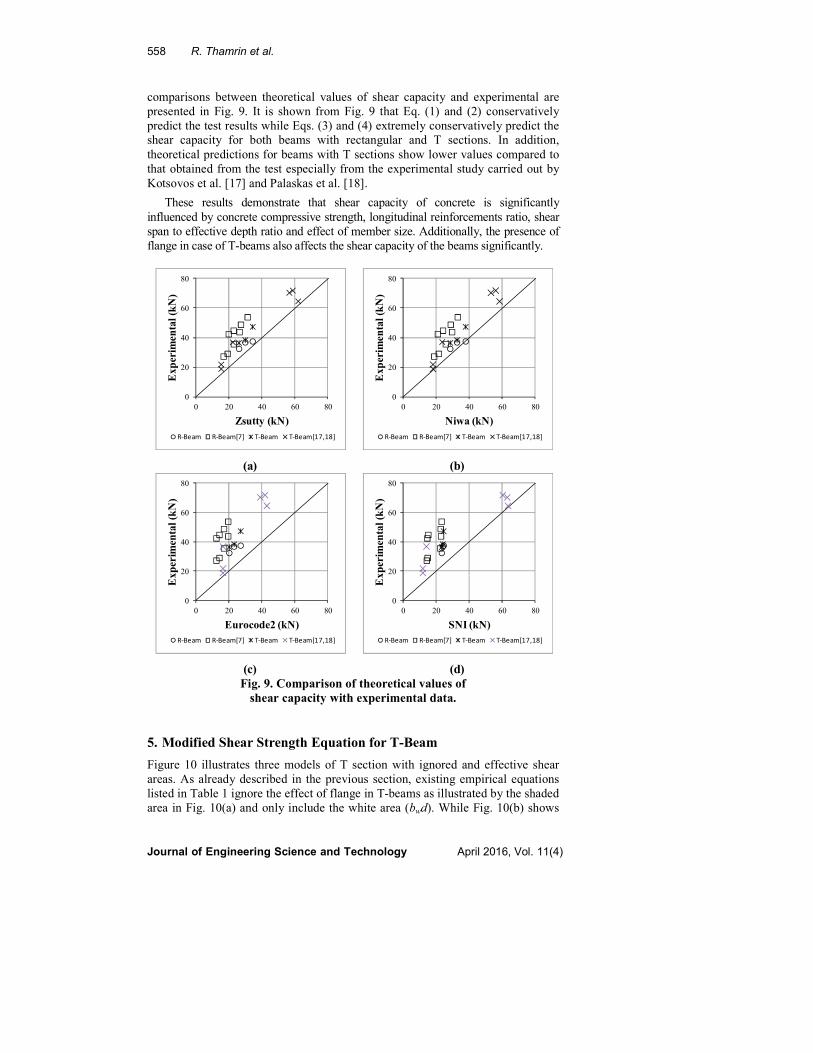
comparisons between theoretical values of shear capacity and experimental are
presented in Fig. 9. It is shown from Fig. 9 that Eq. (1) and (2) conservatively
predict the test results while Eqs. (3) and (4) extremely conservatively predict the
shear capacity for both beams with rectangular and T sections. In addition,
theoretical predictions for beams with T sections show lower values compared to
that obtained from the test especially from the experimental study carried out by
Kotsovos et al. [17] and Palaskas et al. [18].
These results demonstrate that shear capacity of concrete is significantly
influenced by concrete compressive strength, longitudinal reinforcements ratio, shear
span to effective depth ratio and effect of member size. Additionally, the presence of
flange in case of T-beams also affects the shear capacity of the beams significantly.
(a) (b)
(c) (d)
Fig. 9. Comparison of theoretical values of
shear capacity with experimental data.
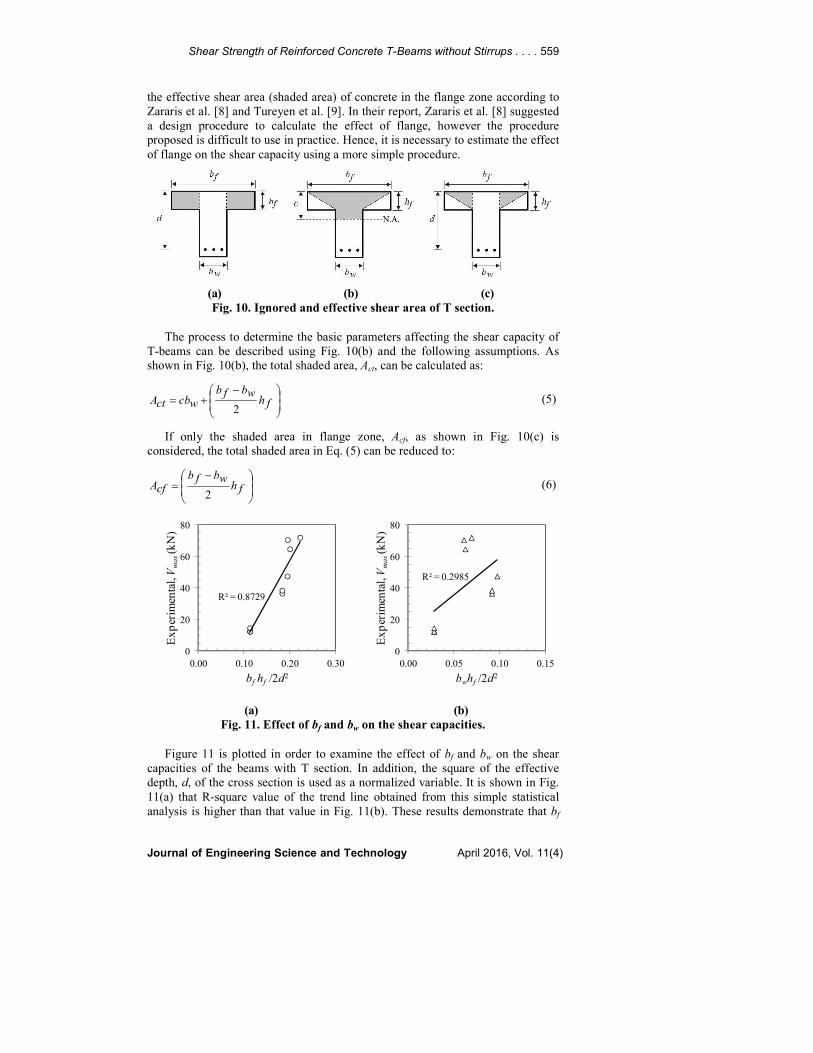
5. Modified Shear Strength Equation for T-Beam
Figure 10 illustrates three models of T section with ignored and effective shear
areas. As already described in the previous section, existing empirical equations
listed in Table 1 ignore the effect of flange in T-beams as illustrated by the shaded
area in Fig. 10(a) and only include the white area (bwd). While Fig. 10(b) shows
0
20
40
60
80
0 20 40 60 80
Experimental (kN)
Zsutty (kN)
R-Beam R-Beam[7] T-Beam T-Beam[17,18]
0
20
40
60
80
0 20 40 60 80
Experimental (kN)
Niwa (kN)
R-Beam R-Beam[7] T-Beam T-Beam[17,18]
0
20
40
60
80
0 20 40 60 80
Experimental (kN)
Eurocode2 (kN)
R-Beam R-Beam[7] T-Beam T-Beam[17,18]
0
20
40
60
80
0 20 40 60 80
Experimental (kN)
SNI (kN)
R-Beam R-Beam[7] T-Beam T-Beam[17,18]
Shear Strength of Reinforced Concrete T-Beams without Stirrups . . . . 559
Journal of Engineering Science and Technology April 2016, Vol. 11(4)
the effective shear area (shaded area) of concrete in the flange zone according to
Zararis et al. [8] and Tureyen et al. [9]. In their report, Zararis et al. [8] suggested
a design procedure to calculate the effect of flange, however the procedure
proposed is difficult to use in practice. Hence, it is necessary to estimate the effect
of flange on the shear capacity using a more simple procedure.
(a) (b) (c)
Fig. 10. Ignored and effective shear area of T section.
The process to determine the basic parameters affecting the shear capacity of
T-beams can be described using Fig. 10(b) and the following assumptions. As
shown in Fig. 10(b), the total shaded area, Act, can be calculated as:
−+= fh
wbfbwcbctA
2 (5)
If only the shaded area in flange zone, Acf, as shown in Fig. 10(c) is
considered, the total shaded area in Eq. (5) can be reduced to:
−= fh
wbfbcfA
2 (6)
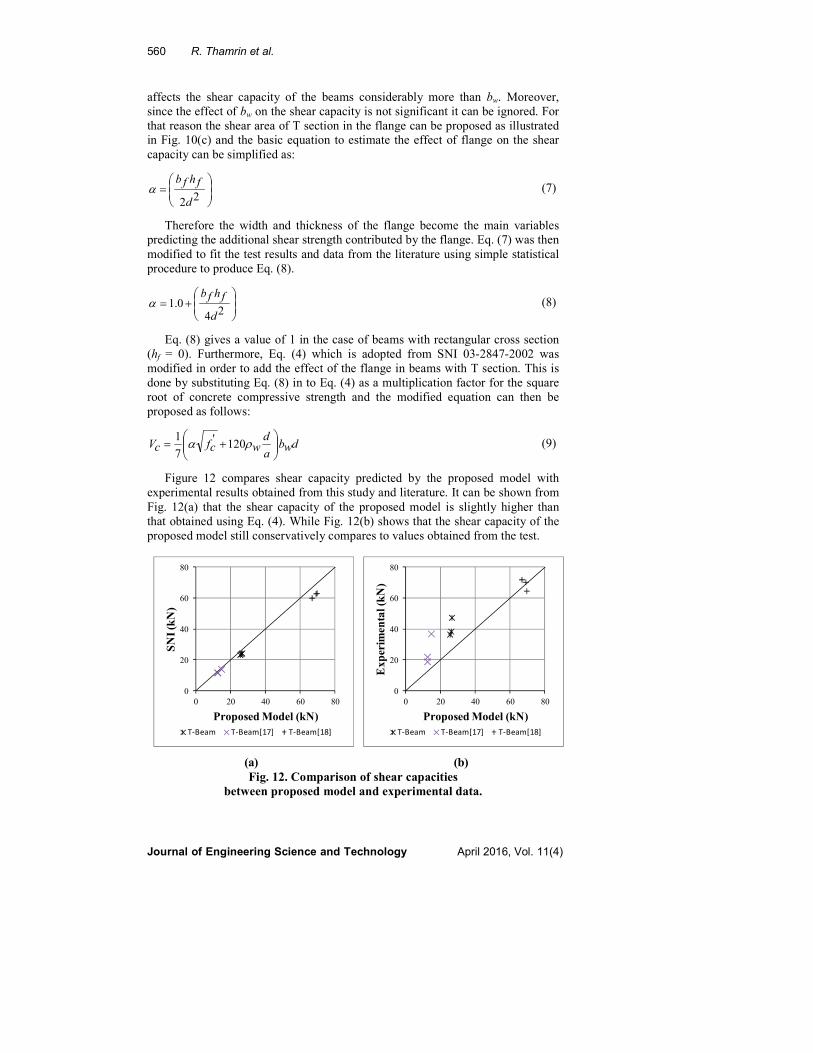
(a) (b)
Fig. 11. Effect of bf and bw on the shear capacities.
Figure 11 is plotted in order to examine the effect of bf and bw on the shear
capacities of the beams with T section. In addition, the square of the effective
depth, d, of the cross section is used as a normalized variable. It is shown in Fig.
11(a) that R-square value of the trend line obtained from this simple statistical
analysis is higher than that value in Fig. 11(b). These results demonstrate that bf
R² = 0.8729
0
20
40
60
80
0.00 0.10 0.20 0.30
Experim
ental, Vmax(kN)
bf hf /2d2
R² = 0.2985
0
20
40
60
80
0.00 0.05 0.10 0.15
Experim
ental, Vmax(kN)
bwhf /2d2
560 R. Thamrin et al.
Journal of Engineering Science and Technology April 2016, Vol. 11(4)
affects the shear capacity of the beams considerably more than bw. Moreover,
since the effect of bw on the shear capacity is not significant it can be ignored. For
that reason the shear area of T section in the flange can be proposed as illustrated
in Fig. 10(c) and the basic equation to estimate the effect of flange on the shear
capacity can be simplified as:
=
22d
fhfbα (7)
Therefore the width and thickness of the flange become the main variables
predicting the additional shear strength contributed by the flange. Eq. (7) was then
modified to fit the test results and data from the literature using simple statistical
procedure to produce Eq. (8).
+=
240.1
d
fhfbα (8)
Eq. (8) gives a value of 1 in the case of beams with rectangular cross section
(hf = 0). Furthermore, Eq. (4) which is adopted from SNI 03-2847-2002 was
modified in order to add the effect of the flange in beams with T section. This is
done by substituting Eq. (8) in to Eq. (4) as a multiplication factor for the square
root of concrete compressive strength and the modified equation can then be
proposed as follows:
dwba
dwcfcV 120'
7
1
+= ρα (9)
Figure 12 compares shear capacity predicted by the proposed model with
experimental results obtained from this study and literature. It can be shown from
Fig. 12(a) that the shear capacity of the proposed model is slightly higher than
that obtained using Eq. (4). While Fig. 12(b) shows that the shear capacity of the
proposed model still conservatively compares to values obtained from the test.
(a) (b)
Fig. 12. Comparison of shear capacities
between proposed model and experimental data.
0
20
40
60
80
0 20 40 60 80
SNI (kN)
Proposed Model (kN)
T-Beam T-Beam[17] T-Beam[18]
0
20
40
60
80
0 20 40 60 80
Experimental (kN)
Proposed Model (kN)
T-Beam T-Beam[17] T-Beam[18]
Shear Strength of Reinforced Concrete T-Beams without Stirrups . . . . 561
Journal of Engineering Science and Technology April 2016, Vol. 11(4)
6. Conclusions
Six reinforced concrete beams, consisting of three beams with rectangular cross
sections and three beams with T sections, were tested to study the effect of flange
and longitudinal reinforcement on the shear capacity. The following conclusions are
noted from this study:
• Shear capacity of the tested T-beams is significantly influenced by the flange
and the amount of longitudinal reinforcement ratio. The shear capacity of T-
beams is 5 to 20% higher than that of beams with rectangular cross section.
• The angle of diagonal crack in the shear span zone was also significantly influenced by the ratio of longitudinal reinforcement. Commonly, for both
rectangular and T sections, the angle of diagonal crack decreases as the
longitudinal reinforcement ratio increases.
• All of empirical equations used to calculate shear strength of concrete
conservatively predict the shear capacity of the beams especially for equations
suggested by the codes. Values of the test results are 10 to 90% higher than
the theoretical values.
• A new model is proposed to predict the shear strength of reinforced concrete
beams with T sections. Shear strength calculated using the proposed model
still compares conservatively to experimental values.
Acknowledgement
This experimental study was financially supported by Faculty of Engineering,
Andalas University with contract number 030/PL/SPK/PNP/FT-Unand/2014.
References
1. Kani, G.N.J. (1964). The riddle of shear failure and its solution. American
Concrete Institute Journal, 61(4), 441-467.
2. Bresler, B.; and MacGregor, J.G. (1967). Review of concrete beams failing in
shear. Journal of. Structural Division, ASCE, 93(ST1), 343-372.
3. Zsutty, T.C. (1968). Beam shear strength prediction by analysis of existing
data. American Concrete Institute Journal, 65(11), 942–951.
4. Placas, A.; and Regan, P.E. (1971). Shear failure of reinforced concrete
beams. American Concrete Institute Journal, 68(10), 763-773.
5. Swamy, R.N.; and Qureshi, S.A. (1974). An ultimate shear strength theory for
reinforced concrete T-beams without web reinforcement. Matériaux et
Construction, 7(39), 181-189.
6. Zararis, P.D. (2003). Shear strength and minimum shear reinforcement of
reinforced concrete slender beams, American Concrete Institute Structural
Journal, 100(2), 203–214.
7. Thamrin, R.; Aziz, A.; Yeoh, D.; Azlina, N.; and Ali, M. (2011).
Experimental study on diagonal shear cracks of concrete beams without
stirrups longitudinally reinforced with GFRP bars. Proceeding of FIB
Symposium ‘Concrete Engineering for Excellence and Efficiency’, Prague,
Czech Republic, 1177–1180.
562 R. Thamrin et al.
Journal of Engineering Science and Technology April 2016, Vol. 11(4)
8. Zararis, P.D. (2006). Shear strength of reinforced concrete T-beams.
American Concrete Institute Structural Journal, 103(5), 693-700.
9. Tureyen, A.K.; Wolf, T.S.; and Frosch, R.J. (2006). Shear strength of
reinforced concrete T-beams without transverse reinforcement. American
Concrete Institute Structural Journal, 103(5), 656-663.
10. Niwa, J.; Yamada, K.; Yokozawa, K.; and Okamura, H. (1987). Revaluation
of the equation for shear strength of reinforced concrete beams without web
reinforcement. Concrete Library International of JSCE, (9), 65-84.
11. British Standards Institution. (2014). Eurocode 2: Design of Concrete Structures - Part 1-1: General Rules and Rules for Buildings. BSI, London, UK.
12. Badan Standardisasi Nasional. (2002). Tata Cara Perhitungan Struktur Beton untuk Bangunan Gedung SNI 03-2847-2002. BSN, Jakarta, Indonesia.
13. Thamrin, R.; and Kaku, T. (2007). Bond behavior of CFRP bars in simply
supported reinforced concrete beam with hanging region. Journal of
Composites for Construction, ASCE, 11(2), 129-137.
14. American Concrete Institute. (2008). Building Code Requirements for
Structural Concrete (ACI 318M-08) and Commentary. ACI, Farmington
Hills, USA.
15. Park, R.; and Paulay T. (1975). Reinforced Concrete Structures. John Wiley,
New York.
16. Thamrin, R. (2014). User Manual of Reinforced Concrete Cross Section
Analysis (RCCSA) V4.2. Jurusan Teknik Sipil, Fakultas Teknik, Universitas
Andalas, Padang, Indonesia.
17. Kotsovos, M.D.; Bobrowski, J.; and Eibl, J. (1987). Behaviour of reinforced
concrete T-beams in shear. The Structural Engineer, 65B(1), 1-10.
18. Palaskas, M.N.; Attiogbe, E.K.; and Darwin, D. (1981). Shear strength of lightly
reinforced T-beams. American Concrete Institute Journal, 78(6), 447-455.