Service Load Deflections of High-Strength Fiber Reinforced ...
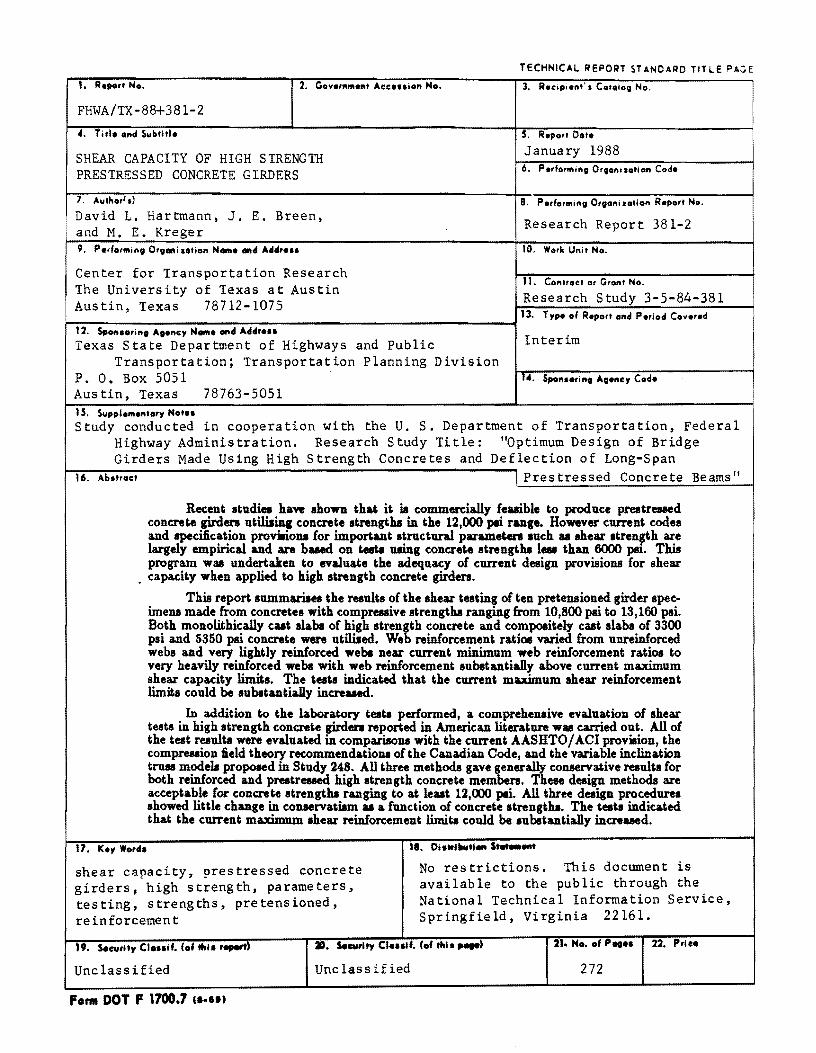
TECHNICAL REPORT STANDARD TITLE PACE
,. Roport No. 3. Roc.p,on". Co'olo, No.
FHWA/TX-88+381-2
.c. T,tlo ond S..,btitlo 5. Ropo,t DOlo
January 1988 SHEAR CAPACITY OF HIGH STRENGTH PRESTRESSED CONCRETE GIRDERS 6. Porform,n, Or,oni lotion Codo
7. A.."ho,l,l 8. Po,form,n, O"onilOl,on Ropo,' No. David L. Hartmann, J. E. Breen, and M. E. Kreger Research Report 381-2
9. Porfo,min, Or,ani lo'ion N_o and Add,o .. 10. Work Unit No.
Center for Transportation Research The University of Texas at Austin Austin, Texas 78712-1075
11. Controc, or Gronl No.
Research Study 3-5-84-381 13. T,po of Ropor' ond Poriod Co"orod
~~~---------------------~~-----------------------------------------1 12. Sponao,in, A,onc, 101_0 ... d Add,o ..
Texas State Department of Highways and Public Transportation; Transportation Planning Division
P.O. Box 5051
Interim
I •. Sponso"n, A,onc, Codo
Aus tin, Texas 78763-5051 15. S..,pplomon'o,., Not.a Study conducted in cooperation with the U. S. Department of Transportation, Federal
Highway Administration. Research Study Title: "Optimum Design of Bridge Girders Made USing High Strength Concretes and Deflection of Long-Span
16. Ab,troc' Prestressed Concrete Beams"
Recent studies haw shown thM it is commercially feasible to produce prestressed concrete girden utiJ.iIing concrete strengths in the 12,000 pli rug •• However current codes and specification proviliona for importut structural pII'ameten luch u shell' Itrength are lll'gely empirical ud are baaed on tests Dling concrete strengths 1 .. than 6000 psi. This program was undertaken to evaluate the adequacy of current design provisions for shell'
. capacity when applied to high strength concrete girders.
17. Ko, Wo,d.
This report summwes the results of the shell' testing of ten pretensioned girder specimens made from concretes with compressive strengths ranging from 10,800 psi to 13,160 psi. Both monolithically cut slabs of high strength concrete and compositely cut slabs of 3300 psi and 5350 psi concrete were utiJ.iIed. Web reinforcement rata varied from unreinforced webs and very lightly reinforced webs nell' current minimum web reinforcement ratios to very heavily reinforced webs with web reinforcement substantially above current ma.x.imum shell' capacity limiia. The tests indicated that the current maximum shell' reinforcement limits could be substantially increaaed.
In addition to the laboratory testa perfonned, a comprehenaive evaluation of shell' tests in high strength concrete girden reported in American literature was carried out. All of the test result. were evaluated in compU'isons with the current AASHTO I ACI provision, the compression field theory recommendations of the Canadian Code, and the variable inclination truss models proposed in Study 248. All three methods gave lenerally conservative results for both reinforced and prestressed high strength concrete members. These design methods lI'e acceptable for concrete strengthJ ranging to at leut 12,000 pli. All three design procedures showed little change in conservatism u a function of concrete strengthJ. The tests indicated that the current maximum shell' reinforcement limits could be aubstantially increased.
II. Oiatrilluth .... S"'_tlft'
shear capacity, prestressed concrete girders, high strength, parameters, testing, strengths, pretensioned,
No restrictions. This document is available to the public through the National Technical Information Service, Springfield, Virginia 22161. re in forcemen t
19. S.Cl.ltlt., CI ... ". (of thl. ,....,rt)
Unclas s i fled
For. DOT F 1700.7 c.· .. ,
3D. Security CI ... I'. (of thh ..... )
Unc las s if ied
21. No •• f p.... 22. P,lc.
272
SHEAR CAPACITY OF HIGH STRENGTH PRESTRESSED CONCRETE GIRDERS
by
David L. Hartmann
J.E. Breen
M.E. Kreger
Research Report 3-5-84-381-2
Research Project 3-5-84-381
"Optimum Design of Bridge Girders Made Using High Strength
Concretes and Deflection of Long-Span Prestressed Concrete Beams"
Conducted for
Texas State Department of Highways and Public Transportation
In Cooperation with the
U.S. Department of Transportation
Federal Highway Administration
by
CENTER FOR TRANSPORTATION RESEARCH BUREAU OF ENGINEERING RESEARCH
THE UNIVERSITY OF TEXAS AT AUSTIN
January 1988
The contents of this report reflect the views of the authors who are
responsible for the facts and accuracy of the data presented herein. The contents
do not necessarily reflect the official views or policies of the Federal Highway
Administration. This reports does not constitute a standard, specification, or
regulation.
ii
PREFACE
This report is the second report in a series which summarizes an investigation of
the feasibility of utilizing high strength concrete and improved low relaxation strands in
pretensioned bridge girders. The first report summarized results of a field measurement
program concerned primarily with the defonnation history of long span pretensioned
girders throughout their construction history. This report summarizes a laboratory
investigation of the shear capacity of large-scale pretensioned girders fabricated with
high strength concretes.
This work is part of Research Project 3-5-84-381 entitled, "Optimum Design of
Bridge Girders Made Using High-Strength Concrete and deflections of Long-Span Pre
stressed Concrete Beams." This report is specifically addressed to verifying the adequacy
of current design specification provisions for the shear strength of prestressed concrete
girders made with high strength concrete to ensure that they are applicable and safe at
the higher ranges of concrete strengths used. in the optimum design recommendations
of the subsequent reports. The research was conducted by the Phil M. Ferguson Struc
tural Engineering Laboratory as part of the overall research program of the Center for
Transportation Research of the University of Texas at Austin. The work was sponsored
jointly by the Texas State Department of Highways and Public Transportation and the
Federal Highway Administration under an agreement with the University of Texas at
Austin and the State Department of Highways and Public Transportation.
Liaison with the State Department of Highways and Public Transportation
was maintained through the contact representative, Mr. David P. Hohmann. Mr. R.E.
Stanford was the contact representative for the Federal Highway Administration. The
study was closely related and used some of the specimens fabricated in a parallel investigation of flexural strength of high strength concrete girders conducted by Reid W.
Castrodale. The authors appreciated his cooperation.
This portion of the overall study was directed by John E. Breen, who holds the
Nasser I. Al-Rashid Chair in Civil Engineering in cooperation with Michael E. Kreger,
Assistant Professor of Civil Engineering. C<>dir~tors supervising other portions of
Project 381 were Ned H. Burns and Michael E. Kreger. The design, fabricatipn and
testing of the girders were under the direction of David L. Hartmann, Research Engineer.
iii

!!!!!!!!!!!!!!!!!!!"#$%!&'()!*)&+',)%!'-!$-.)-.$/-'++0!1+'-2!&'()!$-!.#)!/*$($-'+3!
44!5"6!7$1*'*0!8$($.$9'.$/-!")':!
SUM::M'.ARY
Recent studies have shown that it is commercially feasible to produce pre
stressed concrete girders utilizing concrete strengths in the 12,000 psi range. However
current codes and specification provisiona for important structural parameters such as
shear strength are largely empirical and are based on tests using concrete strengths less
than 6CXX) psi. This program was undertaken to evaluate the adequacy of current design
provisiona for shear capacity when applied to high strength concrete girders.
This report summarizes the results of the shear testing of ten pretensioned
girder speQmena made from concretes with compressive strengths ranging from 10,800
psi to 13,160 psi. Both monolithically cast slabs of high strength concrete and compos
itely cast slabs of 3m psi and 5350 psi concrete were utilized. Web reinforcement ratios
varied from unreinforced webs and very lightly reinforced webs near current minimum
web reinforcement ratiCli to very heavily reinforced webs with web reinforcement su\)..
stantially above current maximum shear capacity limits. The tests indicated that the
current maximum shear reinforcement limits could be substantially increased.
In addition to the laboratory tests performed, a comprehenaive evaluation of
shear tests in high strength concrete girders reported in American literature was carried
out. All of the test results were evaluated in comparisons with the current AASHTO / ACI
provision, the compression field theory recommendationa of the Canadian Code, and
the variable inclination trwB models proposed in Study 248. All three methods gave
generally conservative results for both reinforced and prestressed high strength concrete
members. These design methods are acceptable for concrete strengths ranging to at
least 12,000 psi. All three design procedures showed little change in conservatism as a
function of concrete strengtha.
v

!!!!!!!!!!!!!!!!!!!"#$%!&'()!*)&+',)%!'-!$-.)-.$/-'++0!1+'-2!&'()!$-!.#)!/*$($-'+3!
44!5"6!7$1*'*0!8$($.$9'.$/-!")':!
IMPLEMENTATION
This report summarizes the results of a comprehensive evaluation of the shear
capacity of pretensioned concrete girders utilizing concrete strengths in the 10,000 to
13,000 psi range. It compares current test results and results reported in the literature
with current AASHTO / ACI Code provisions, current Canadian Code provisions based
on a compression field model, and a variable inclination truss model proposed in Study
248.
This report shows that current design procedures for shear in prestressed con
crete girders are safe when applied to girders with concrete strengths ranging to at least
12,000 psi. Furthermore, the test results indicate that the maximum shear strength lim
its of the current AASHTO / ACI provisions can be substantially increased provided that
an explicit check for web crushing is added. The present upper limit of web reinforce
ment contributions of 8/l!b",d could then be safely increased to 12/l!6",d or possibly
15/l!b", d. This would permit more efficient use of the web section of high strength
concrete in shear critical sections. The only other limits on such an increase would be
concern over visible inclined cracking since the V c term would be such a small portion
of the total sheal" strength.
This report clearly shows that there should be no substantial concern over the
shear strength adequacy of high strength concrete girders designed to current AASHTO
Standal"ds for concrete compressive strengths ranging to 12,000 psi.
vii

!!!!!!!!!!!!!!!!!!!"#$%!&'()!*)&+',)%!'-!$-.)-.$/-'++0!1+'-2!&'()!$-!.#)!/*$($-'+3!
44!5"6!7$1*'*0!8$($.$9'.$/-!")':!
TABLE OF CONTENTS
CHAPTER 1 - INTRODUCTION
1.1 Background . . ..
1.2 Objectives and Scope
CHAPTER 2 - HIGH STRENGTH CONCRETE
2.1 Introduction . . . . . . . . . . . .
2.2 Production of High Strength Concrete
2.3 Current Work ....
2.3.1 Trial Batches
2.3.1.1 Air dried versus moist curing
2.3.1.2 Effect of aggregate
2.3.2 Problems with Use ....
2.4 Properties of High Strength Concrete
2.4.1 General. . . . . . .
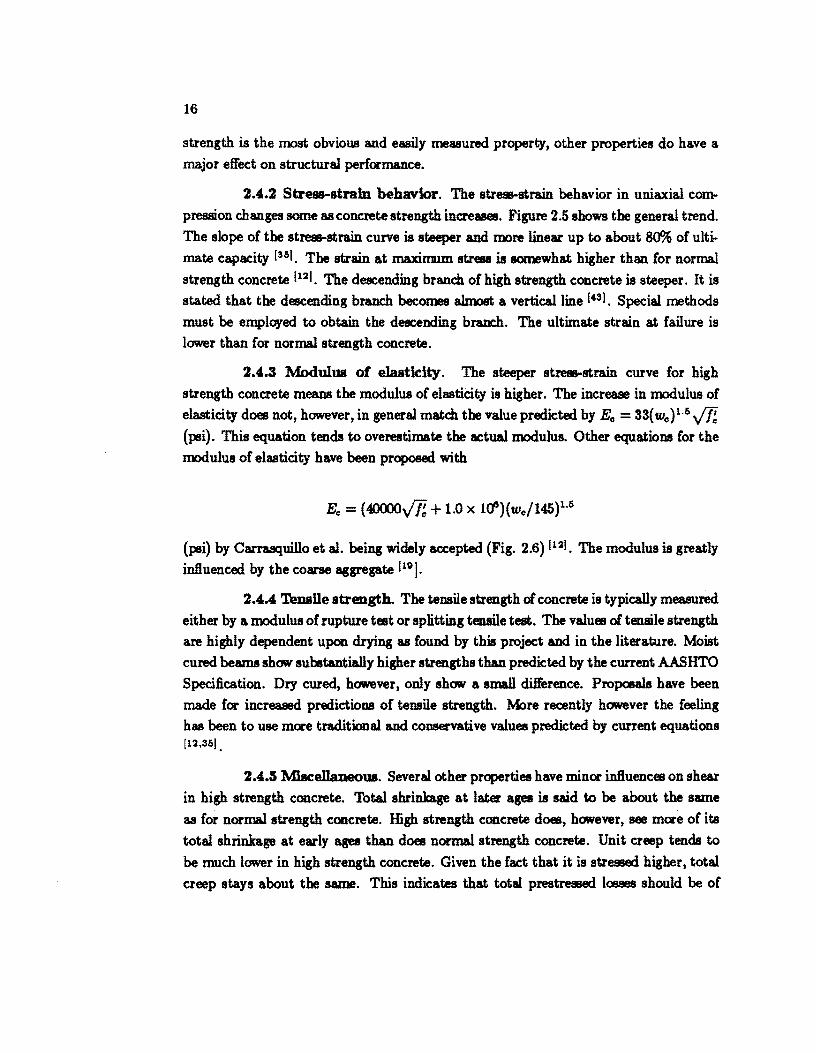
2.4.2 Stress-strain behavior
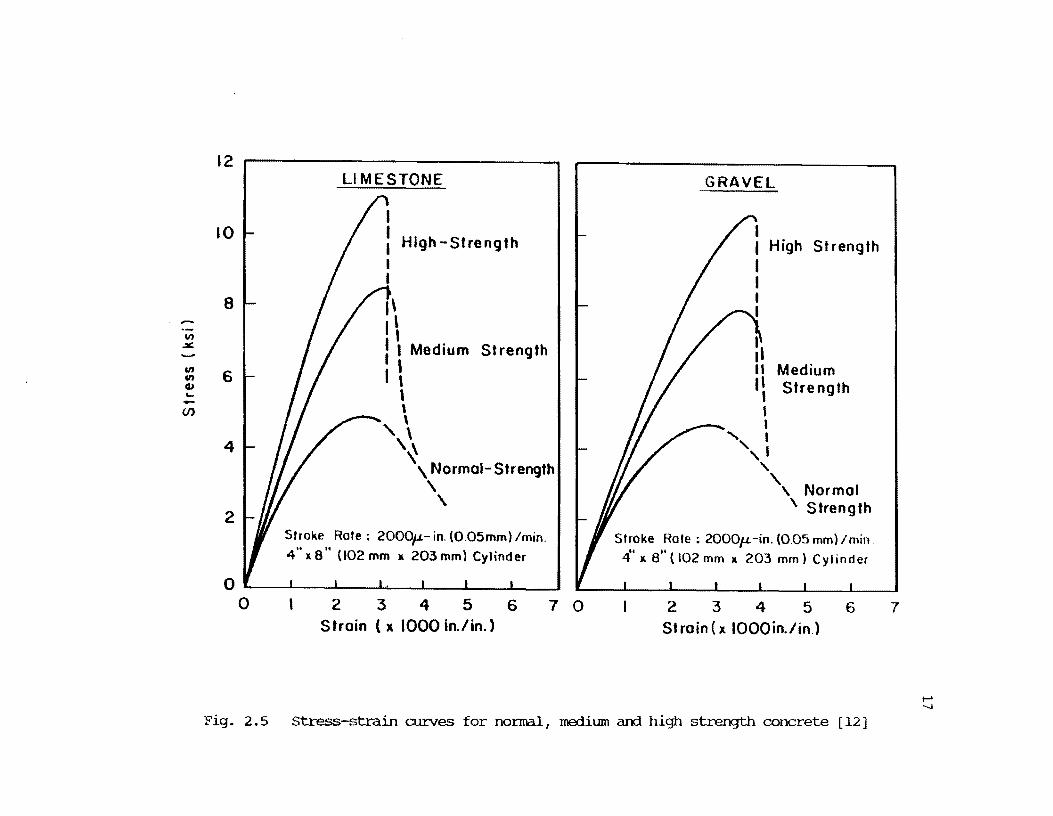
2.4.3 Modulus of elasticity
2.4.4 Tensile strength
2.4.5 Miscellaneous . .
CHAPTER 3 - SHEAR CAPACITY MODELS
3.1 Introduction . . . . . . . .
3.2 AASHTO and ACI (Current)
3.3 Plasticity Theories . .
3.3.1 Introduction
3.3.2 Danish model
3.3.3 Swi. model.
ix
Page
1
1
2
3
3
5
5
5
8
· 15
· 15
· 15
16
16
16
· 16
· 19
19
19
· 29
· 29
· 31
.39
TABLE OF CONTENTS (continued)
3.3.4 Diagonal compression field theory
3.4 Truss Models
3.4.1 Ftalnirez
3.4.2 Strut and tie model
3.5 Rationality and Ease of Use
3.6 Comparison with Test Results
3.6.1 Introduction
3.6.2 Current AASHTO and ACI Provisions
3.6.2.1 Reinforced, without stirrups .
3.6.2.2 Reinforced, with stirrups
3.6.2.3 Prestressed, without stirrups
3.6.2.4 Prestressed, with stirrups.
3.6.3 1984 Canadian Code .
3.6.3.1 No stirrups
3.6.3.2 Reinforced, with stirrups
3.6.3.3 Prestressed, with stirrups .
3.6.4 Truss Model. ...
3.6.4.1 Reinforced, no stirrups
3.6.4.2 Prestressed, no stirrups .
3.6.4.3 Reinforced, with stirrups
3.6.4.4 Prestressed, with stirrups .
3.6.5 Summary . .. ...
CHAPTER 4 - EXPERIMENTAL PROGRAM .
4.1 Introduction . .
x
Page
· 48
· 52
· 52
· 55
· 57
· 58
· 58
.59
· 59
.65
.65
· 72
.72
· 72
.79
· 79
· 86
.86
.86
.92
.92
.99
107
107
TABLE OF CONTENTS
4.2 Description and Design of Test Specimens
4.2.1 Series 1 .
4.2.2 Series 2 .
4.2.3 Series 3 .
4.3 Materials . . .
4.3.1 ~CIlcrete
4.3.2 Prestressing steel
4.3.3 Nonprestressed reinforcement
4.4 Fabrication. ..
4.4.1 Introduction
4.4.2 Formwork. .
4.4.3 Pretensioning procedure
4.4.4 Girder fabrication
4.4.5 ~asting procedures. .
4.5 Instrumentation . .
4.5.1 Internal strain gauges
4.5.2 Surfaces gauges . . .
4.5.3 Beam deftectiClls. . .
4.5.4 Strmd movement detection
4.6 Test Frame and Loading System
4.6.1 Test tnacb.ine . . . .
4.6.2 Loading system .
4.6.2.1 Two point loading
4.6.2.2 Fixed head
4.6.2.3 Test frame
4.7 Test procedure .
4.8 Data reduction.
Xl
Page
107
107
114
114
119
119
128
128
130
130
130
130
134
134
135
135
135
135
139
139
139
139
139
139
143
143
145
TABLE OF CONTENTS
Page
CHAPTER 5 - TEST R~ULTS 147
5.1 Introduction . 147
5.2 Test Behavior 147
5.2.1 Specimen 1-1 147
5.2.2 Specimen 1-2 153
5.2.3 Specimen 1-3 159
5.2.4 Specimen 2-1 163
5.2.5 Specimen 2-2 168
5.2.6 Specimen 2-3 173
5.2.7 Specimen 3-1 173
5.2.8 Specimen 3-2 181
5.2.9 Specimen 3-3 185
5.2.10 Specimen 3-4 195
5.3 Discussion of ':rest Results . 199
5.3.1 General •.... 199
5.3.2 Observations . . 199
5.3.2.1 Stirrup tensile failures 199
5.3.2.2 Concrete compression diagonals 203
5.3.2.3 Strand slip 205
5.3.2.4 Strands . 205
5.3.2.5 Cracking 206
5.3.2.6 Rosette strain gauges 207
5.3.3 Ccmpariaon with model assumptions . 207
5.3.4 Ccmpariaon of shear design models to test results 209
5.3.4.1 Introduction 209
5.3.4.2 JlAJSH1rC>/)lCI 209
Xli
TABLE OF CONTENTS
5.3.4.3 Canadian Code
5.3.4.4 Truss model. .
5.3.4.5 Comparison of model predictions
CHAPTER 6 - SUMMARY AND CONCLUSIONS
6.1 Swnmary of Results . . . . .
6.1.1 Experimental program
6.1.2 Model comparisons .
6.2 ConclusiCll.8
APPENDIX A
APPENDIX B
REFERENC~ .
xiii
Page
213
217
222
229
229
229
229
229
233
237
245

!!!!!!!!!!!!!!!!!!!"#$%!&'()!*)&+',)%!'-!$-.)-.$/-'++0!1+'-2!&'()!$-!.#)!/*$($-'+3!
44!5"6!7$1*'*0!8$($.$9'.$/-!")':!
LIST OF FIGURES
2.1 Normalized plot of air dry cured compressive strength at 28 days and later divided by 28 day moist cured strength . .. ...... 7
2.2 Tensile strength versus square root of moist cured compressive strength at 7 days . . . . . . . . . . . . . . . . . . . . 10
2.3 Tensile strength versus square root of moist cured compressive strength at 28 days . . . . . . . . . . . . . . . . . . . 11
2.4 Maximum compressive strength for each batch . . . . . . . 14 2.5 Stress-strain curves for normal, medium, and high strength concrete
[Ref. 12J . . . . . . . . . . . . . . . . . . . . . . 17 2.6 Modulus of elasticity versus compressive strength [Ref. 29] 18 3.1 Data points used in derivation of Eq. (3.3) [Ref.6] . 23 3.2 Data points used to formulate Eq. (3.7) [Ref. 27] . . 24 3.3 Model used in derivation of Eq. (3.8) [Ref. 6] . . . . 26 3.4 Data points used in calibration of Eq. (3.8) [Ref. 6] . 28 3.5 Comparison of derived and approximate formulas for Eq. (3.10)
[Ref.6J ......................... . 30 3.6 Comparison of rigid-plastic model to steel stress-strain curve . . . 32 3.7 Comparison of rigid-plastic model to high strength concrete stress-
strain curve ....... . 33 3.8 Concrete yield locus . . . . . . . . . . . . . . . . . 35 3.9 Rigid-plastic model for steel ............ . 36
3.10 Assumed failure mechanism for Danish model [Ref. 32J . . 37 3.11 Shear design zones using the Danish model [Ref. 32] . . . 38 3.12 Shear web element [Ref. 47J ............ . 41 3.13 Assumed failure mechanism for the Swiss model [Ref. 46] . 43 3.14 Mean crack strain Er [Ref. 47]. . . . . . . . . . . . . . 44 3.15 Change in mean crack strain with change in a [Ref. 47] . 45 3.16 Test/predicted values versus concrete strength for reinforced beams
without stirrups using AASJITO/ ACI . . . . . . . . . . . . . . 62 3.17 High strength test results plotted in form used to derive Eq. (3.3) . . 62
3.18 Test results/predicted values versus aid ratio for reinforced beams without stirrups using AASJITO/ ACI . . . . . . . . . . . . . . 63
xv
LIST OF FIGURES (cont.)
Figure Page
3.19 Test results/predicted values vel'lUl p for reinforced be8Jlll without stirrups using AASHTO / ACI . .. . 63
3.20 Test results/Eq. (3.6) vel'lUl concrete strength for reinforced bearm without stirrups. . . . . . . 64
3.21 Test results for reinforced be8Jlll with stirrups/(AASHTO/ACij using Eq. (3.3) vel'lUl concrete strength.. . 67
3.22 Test results/predicted values vel'lUl concrete strength for reinforced be8Jlll with stirrups using AASHTO/ ACI method. and Eq. (3.6) . 67
3.23 Test results/predicted values versus concrete strength for reinforced be8Jlll with stirrups (p.l. < SOps"). . . . 68
3.24 Test results/predicted values vel'lUl concrete strength for reinforced be8Jlll with stirrups (50 < p.l. < 1001'8") .. . . . 68
3.25 Tests results/predicted values vel'lUl concrete strength for reinforced be8Jlll with stirrups (100 < ptl/. < 150p8i) . .. . . 69
3.26 Prestresaed cracking load/Eq. (3.7) vel'lUl concrete strength . . . 71 3.27 Prestresaed web shear cracking/Eq. (3.10) versus concrete strength for
AASHTO/ ACI .. ... ....... .. . . 71 3.28 Prestresaed inclined cracking/Eq. (8.8) versus concrete strength for
AASHTO/ACI. .. . ....... . . 73 3.29 Test results/predicted values vel'lUl concrete strength for prestressed
be8Jlll with stirrups using AASHTO/ ACI . . ...... . 75 3.30 Concrete contribution in reinforced beams/Eq. (3.72) from Canadian
Code vel'lUl concrete strength. . ...... . 78 3.31 Concrete contribution in prestressed beams/Eq. (3.72) from Canadian
Code versus concrete strength. . . ... . 81 3.32 Cracking loads for reinforced and prestrealed beams Canadian
Code prediction, Eq. (3.72), versus concrete strength . . 81 3.33 Reinforced beams with stirrups/Canadian Code vel'lUl concrete
strength .. .. ... . 83 3.34 Reinforced beams with stirrups/Canadian Code vel'lUl P./. . 83 3.35 Prestressed beams with stirrups/Canadian Code vel'lUl concrete
strength . .. ... .. .. ... .. . 85 3.36 Prestresaed beams with stirrups/Canadian Code vel'lUl p.l. . 85
xvi
LIST OF FIGURES (cant.)
Figure Page
3.37 All specimens with stirrups/Canadian Code versua concrete strength. . 87
3.38 All specimens with stirrups/Canadian Code versua p"/,, . . . . . . 87 3.39 Reinforced beams without stirrups/Eq. (3.64) of truss model versus
concrete strength . . . . . . . . . . . . . . . . . . . . 90 3.40 Prestressed beams without stirrups/truss model predictions
versus concrete strength . . . . . . . . . . . . . . . . . 93 3.41 Truss contribution in the transition zone . . . . . . . . . . 95 3.42 Reinforced beams with stirrups/truss model versus concrete strength . 96
3.43 Reinforced beams with stirrups/truss model versua p"/,, . . . . ., . 96 3.44 Inclined compression diagonal stress at failure/ allowable versus P"/fl . 97 3.45 Prestressed beams with stirrups/truss model versua concrete strength 100
3.46 Prestressed beams with stirrups/truss model versus P"/fl . . 100 3.47 Inclined compression diagonal stress/allowable versua p"/,, . . . . 101 3.48 Relative scatter for well bunched and widely scattered data. . . . 102 3.49 Statistical comparison of the methods for reinforced and prestressed
concrete at ultimate . . . . 104 4.1 Series 1 and 2 crose-section . . . . . . 108
4.2 Series 1 reinforcement . . . . . . . . 109 4.3 Load and support locations for Series 1 110 4.4 Specimen 1-1 strain gauge locations V,=O 110 4.5 Specimen 1-2 stirrup and stain gauge locations V, = 50 b.,d 110
4.6 Specimen 1-3 stirrup and strain gauge locations V. = Iv'7fbw d = 1000",d. 110 4.7 End detail steel (all units in inches) . . 112 4.8 Texas SDHPT standard end details . . 113
4.9 Load and support locations for Series 2 115 4.10 Series 2 reinforcement . . . . . . . . 116 4.11 Modified stirrup detail, Specimen 2-3 . 117
4.12 Specimen 2-1 stirrup and strain gauge locations V. = 12v'iIb.,d . 118 4.13 Specimen 2-2 and 2-3 stirrup and strain gauge locations V. = 15v'iIbw d 118 4.14 Load and support locations for Series 3 ......... 120
4.15 Cross-section and strand locations for Specimens 3-1 and 3-2 121 4.16 Standard stirrup, Specimen 3-1 . . . . . . . . . . . . . 122 4.17 Modified stirrup, Specimen 3-2 . . . . . . . . . . . . . 123
4.18 Specimen 3-1 and 3-2 stirrup and strain gauge locations V. = 8v'lf:bw d 124
xvii
LIST OF FIG~ (cout.)
Figure Page
4.19 End detail steel for series 3 125 4.20 Strand locations and stirrup details for Specimens 3-3 and 3-4 .... 126 4.21 Specimens 3-3 and 3-4 stirrup and strain gauge locations V, = 4../1fbw d 127 4.22 Load-strain curve and data for prestressing strand. 129 4.23 Typical stress-strain curves for #2 defonned b8lS . 131 4.24 Typical stress-strain curves for #1.5 deformed b8lS 132 4.25 Typical stress-strain curves for #3 defonned b8lS 133 4.26 Strain gauge location ...... . . . . . . 136 4.27 Surface gauge locations ........... 137 4.28 Rosette strain gauge locations for Series 1 and 2 138 4.29 Instrumentation frame 140 4.30 General test setup. . . . . . . . . 141 4.31 Use of steel rollers. . . . . . . . . 142 4.32 Test setup for Specimens 3-1 and 3-2 144 5.1 Specimen 1-1 during testing ... . 149 5.2 Specimen 1-1 at failure. . . . . . . 150 5.3 Load-deftection behavior for Specimen 1-1 151 5.4 Strains measured by strand gauges through complete loading sequence for
Specimen 1-1 . . . . . . . . . . . . . . . . . . . . . . . 152 5.5 Strand strain gauge readings for final load cycle of Specimen 1-1 152
5.6 Specimen 1-2 during loading . . . . . 154 5.7 Specimen 1-2 at failure. . . . . . . . . . . . . . . . . . . 155 5.8 Load-deftection curve for Specimen 1-2 . . . . . . . . . . . . 156 5.9 Strand strain readings for Gauge 2 through complete loading cycle
for Specimen 1-2 . . . . . . . . . . . . . . . . . . 157 5.10 Strand strain readings for all gauges for last load cycle of
Specimen 1-2 . . . . . . . . . . . . . . . . . . . . 157 5.11 Stirrup strain for gauge 1 through complete loading of Specimen 1-2 . 158 5.12 Strirrup strains for last loading of Specimen 1-2 158 5.13 Specimen 1-3 at failure. . . . . . . . 160 5.14 Load-deftection curve for Specimen 1-3 . 161 5.15 Strand strains for Specimen 1-3 . . . . 161 5.16 Stirrup strains for Specimen 1-3 . . . . 162 5.17 Typical crack width versus load for Specimen 1-3 162
xviii
LIST OF FIGURES (cont.)
Figure Page
5.18 Specimen 2-1 during testing . . . . . 164 5.19 Specimen 2-1 at failure. . . . . . . . 165 5.20 Load-deftection curve for Specimen 2-1 . 166 5.21 Strand strains for Specimen 2-1 . . . . 166 5.22 Nonprestressed reinforcement strains for Specimen 2-1 167 5.23 Stirrup strains for Specimen 2-1 . . . . 167 5.24 Specimen 2-2 at failure. . . . . . . . . . . . . . 169 5.25 Load-deftection curve for Specimen 2-2 . . . . . . . 170 5.26 Strand strain from gauge 5 throughout the loading of Specimen 2-2 171 5.27 Strand strains for final load cycle of Specimen 2-2 . . . . . . . 171 5.28 Stirrup strains through complete loading cycle for Specimen 2-2
measured by gauge 2 ................. 172 5.29 Stirrup strains measured on 6.nalload cycle of Specimen 2-2 172 5.30 Specimen 2-3 at failure. . . . . . . . 174 5.31 Load-deftection curve for Specimen 2-3 . . . . . . . . . . 175 5.32 Strand strains for Specimen 2-3 . . . . . . . . . . . . . 175 5.33 Nonprestressed longitudinal reinforcement strains for Specimen 2-3 176 5.34 Stirrup strains for Specimen 2-3 . 176 5.35 Specimen 3-1 at failure. . . . . . . . . 178 5.36 Debonding of prestressing strands . . . . 179 5.37 Load-deftection behavior for Specimen 3-1 180 5.38 Strand behavior for Specimen 3-1 through the last two load cycles. 180 5.39 Stirrup strains through last two load cycles of Specimen 3-1 measured
by gauge 1 . . . . . . . . . . . . . . . . . 182 5.40 Stirrup strains for last load cycle of Specimen 3-1 182 5.41 Load-slip curve for Specimen 3-1 . . . . 183 5.42 Specimen 3-2 at failure. . . . . . . . . . . . 184 5.43 Load-deftection behavior for Specimen 3-2 . . . 186 5.44 Strand strains for final two load cycles of Specimen 3-2 . 186 5.45 Stirrup strain of gauge 1 for last two load cycles of Specimen 3-2 187 5.46 Stirrup strains for last load cycle of Specimen 3-2 187 5.47 Load-slip curve for Specimen 3-2 . . . 188 5.48 Specimen 3-3 at failure. . . . . . . . 190 5.49 J..oad..deftection curve for Specimen 3-3 . 191
xix
LIST OF FIGURES (cont.)
Figure Page
5.50 Strand strains for Specimen 3-3 . . . . . . . . . . . . 192 5.51 Strand strains along length of shear span for Specimen 3-3 192 5.52 Stirrup strains for Specimen 3-3 . . . . . . . . . . . . 193 • 5.53 Stirrup strains along the length of the shear span for Specimen 3-3 193 5.54 Load-slip curve for Specimen 3-3 . . . 194 5.55 Specimen 3-4 at failure. . . . . . . . 196
5.56 Load-deftection curve for Specimen 3-4 . 197 5.57 Strand strains for Specimen 3-4 . . . . 198
5.58 Strand strains versus location in shear span for Specimen 3-4 (support centerline x=8.5 in.) . . . . . . . . . . . . . . 198
5.59 Stirrup strains for Specimen 3-4. . . . . . . . . . . . . 200 5.60 Stirrups strains venus location in shear spand for Specimen 3-4 . 200 5.61 Order of strut crushing for Specimen 3-4 • • • • . • . . . . 204
5.62 Direction of principal compresmon stresa before and after web shear cracking ......................... 208
5.63 Relative conservatism of cracking loads versus AASHTO/ ACI equations
for concrete contribution plotted. against concrete strength . . . . 212 5.64 Relative conservatism of cracking loads divided by AASHTO / ACI
predictions versus strerB at centrcid due to prestress force .. . . 212 5.65 Test results/(AASHTO/ACI) predictions at ultimate plotted versus
concrete strength . . . . . . . . . . . . . . . . . . . . . . 214 5.66 Test results/(AASTHO/ACI) predictions at ultimate plotted against
P'III" . . . . . . . . . . . . . . . . . . . . . . . . . . . 214 5.67 Test results/Canadian Code at ultimate versus concrete strength 216
5.68 Test results/Canadian Code at ultimate versus P'III. . . 216 5.69 Cracking load/truss model concrete contribution versus
concrete strength . . . . . . . . . . . . . . . . . 219
5.70 Cracking load/truss model concrete contribution versus stress at centroid due to prestrerB . . . . . . . . . . . . . . . . 219
5.71 Test results/truss model at ultimate versus concrete strength . 221
5.72· Test results/truss model at ultimate versus p.l" ...... 221 5.73 Allowable diagonal compression strut stress II a percentage of
JIf. versus I; . . . . . . . . . . . . . . . . . . . . . . . . . . 223
xx
LIST OF FIGURES (cout.)
Figure
5.74 Test results/truss model at ultimate with Cd :$ O.51t!1c versus Pv I" . . . . . . . . . . . . . . . . . . . . . . .
5.75 Confidence ranges Cor the current test series at ultimate . .
xxi
Page
225 227
LIST OF TABLES
Table Page
2.1 Moist and Air Dry Cured Strengths at 28 Days and Later 6 2.2 Moist and Air Dry Cured Beam Strengths at 7 & 28 Days 9 2.3 Properties of Coarse Aggregates Used in High Strength Concrete Mixes 12 2.4 MaxilIDlm Compressive Strength for Each Mix 13 3.1 AASTHO/ACI Predictioos for Reinforced 8earrB without Stirrups .60 3.2 AASTHO/ACI Predictioos for Reinforced 8earrB with Stirrups · 66 3.3 AASTHO/ACI Predictioos for Prestressed 8earrB without Stirrups .70 3.4 AASTHO/ACI Predictioos for Prestressed 8earrB with Stirrups . · 74 3.5 Canadian Code Predictions for Reinforced 8earrB with Stirrups . · 76 3.6 Canadian Code Predictions for Cracking Load in Prestressed Beam! · 80 3.7 Canadian Code Predictions for Reinforced 8earrB with Stirrups . · 82 3.8 Canadian Code Predictions for Prestressed 8earrB with Stirrups . · 84 3.9 Truss Model Predictions for Reinforced BeILIIlJ without Stirrups . · 88
3.10 Truss Model Predictions for Prestressed Beams without Stirrups · 91 3.11 Truss Model Predictions for Reinforced BeILIIlJ with Stirrups .94
3.12 Truss Model Predictions for Prestressed Beams with Stirrups .98
.3.13 Statistical Comparison of Model Predictions 103
5.1 Member Properties for Current Test Series 210 5.2 Test Results and AASTHO/ ACI Predictions for Current Test Program 211
5.3 Test Results and Canadian Code General Method Predictions for Current
Test Series .. 215
5.4 Ramirez Truss Model Cracking Load Predictions 218
5.5 Test Results and Truss Model Ultimate Capacity Predictioos 220
5.6 Truss Model Predictions with fd ~ 0.5!! 224
5.7 Statistical Comparison for the Current Test Series . 226
xxii
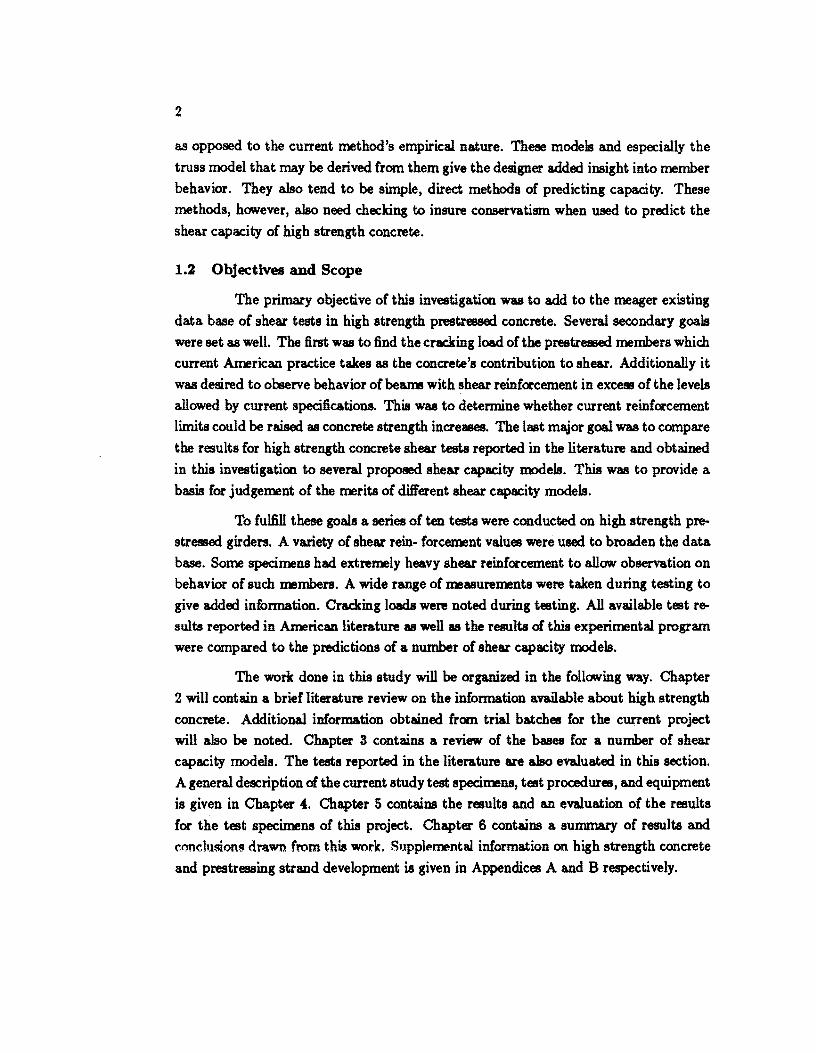
1.1 Background
CHAPTER 1 INTRODUCTION
Shear in high strength prestressed. concrete girders combines the well stud·
ied problem of shear in prestressed conaete with the less researched behavior of high
strength concrete. The use of high strength concrete, I! from 7000 to 13000 psi, is in·
creasing in bridge applications as well as in buildings and other structures. Presently the
normal AASHTO / ACI shear provisions are used to predict the capacity of high strength
prestressed concrete.
There are several reasons why current shear provisions must be re-examined or
used cautiously for high strength concrete. Current AASHTO / ACI shear equations are
quite empirical. The nature of current provisions have not changed substantially since
their introduction in the 1963 ACI Code. For the most part these empirical equations
were derived using results from tests having concrete strengths leal than 6(XX) psi. In many locations it is possible to mass produce concretes with useful compressive strengths
of 120()) psi or more. In all the shear equations for both reinforced and prestressed
concrete, concrete strength is a primary variable in capacity calculations. Extrapolating
empirical equations for concretes with twice the compressive strength of those used in the original formulation is dangerous. Another consideration is that some physical
properties are known to change with increasing conaete strength. The effect of changing
physical properties on empirical equations is difficult to predict without test data. The
shortage of test data is the third reason that caution must be exercised in the use of
current AASHTO / ACI shear pravisi<D8. 'lb date only 32 shear tests have been reported
in American literature for high strength prestressed. concrete. Those tests are for a
relatively narrow range of concrete strengths, shear reinforcement, prestreal foree, and
shear span to depth ratios. Additionally a number of tests have been conducted on high
strength reinforced concrete bear:m. While not of direct use they do provide information
as to whether trends exist for inaeasing concrete strength. The fact remains, however,
that test data for shear capacity of high strength prestressed concrete is currently quite
limited.
There is also some dissatisfaction with the current method of shear capacity
calculations due to its complexity. Over the last ten to fifteen years a number of shear
mode1s have been proposed as replacements for the current empirical equations. The
proposed methods are based on the theory of plasticity. This provides a rational basis
1
2
as opposed to the current method's empirical nature. These models and especially the
truss model that may be derived from them give the designer added insight into member
behavior. They also tend to be simple, direct methods of predicting capacity. These
methods, however, also need checking to insure conservatism when used to predict the
shear capacity of high strength concrete.
1.2 Objectives and Scope
The primary objective of this investigation was to add to the meager existing
data base of shear tests in high strength prestressed concrete. Several secondary goals
were set as well. The first was to find the cracking load of the prestressed members which
current American practice takes as the concrete's contribution to shear. Additionally it
was desired to observe behavior of beatn3 with shear reinforcement in exceI!B of the levels
allowed by current specifications. This was to detennine whether current reinforcement
limits could be raised as concrete strength increases. The last major goal was to compare
the results for high strength concrete shear tests reported in the literature and obtained
in this investigation to several proposed. shear capacity models. This was to provide a
basis for judgement of the merits of different shear capacity models.
To fulfill these goals a series of ten tests were conducted on high strength pre
stressed girders. A variety of shear rein- forcement values were used to broaden the data
base. Some specimens had extremely heavy shear reinforcement to allow observation on
behavior of such members. A wide range of measurements were taken during testing to
give added information. Cracking loads were noted during testing. All available test re
sults reported in American literature as well as the results of this experimental program
were compared to the predictions of a number of shear capacity models.
The work done in this study will be organized in the following way. Chapter
2 will contain a brief literature review on the information available about high strength
concrete. Additional information obtained from trial batches for the current project
will also be noted. Chapter 3 contains a review of the bases for a number of shear
capacity models. The tests reported in the literature are also evaluated in this section.
A general description of the current study test specimens, test procedures, and equipment
is given in Chapter 4. Chapter 5 contains the results and an evaluation of the results
for the test specimens of this project. Chapter 6 contains a summary of results and
conclusions drawn from this work. Sllpplp.lDmtal information on high strength concrete
and prestressing strand development is given in Appendices A and B respectively.
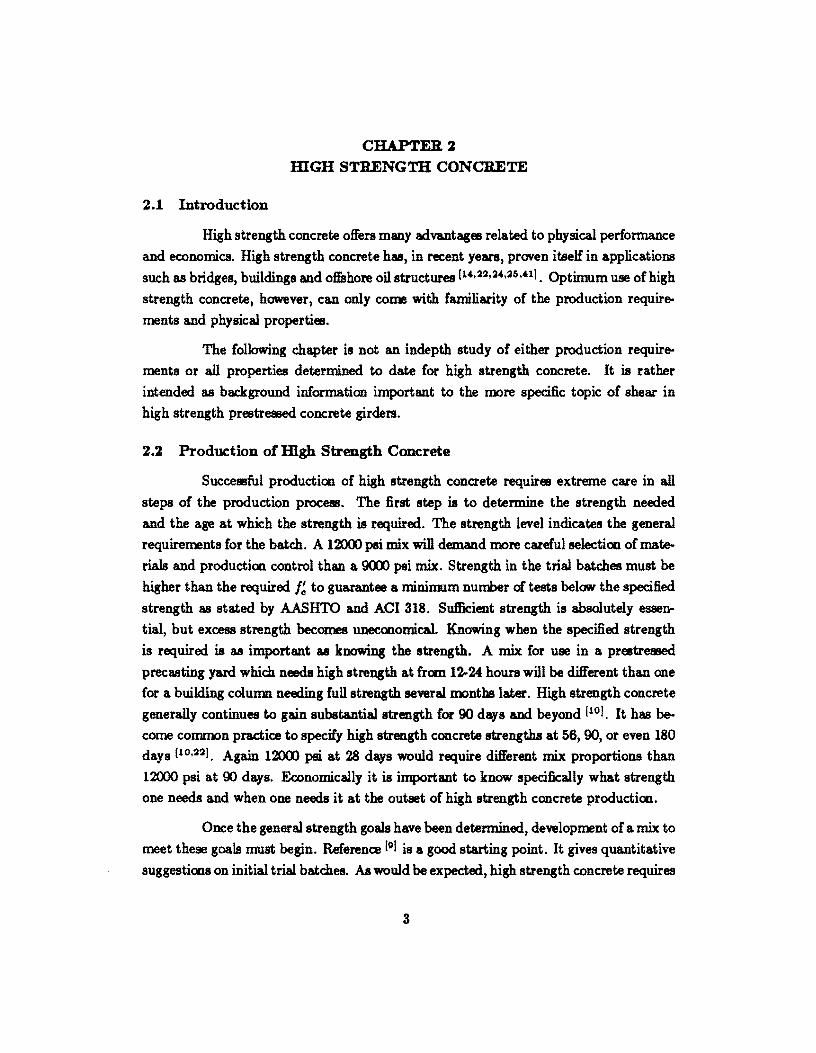
CHAPTER 2 mGn STRENGTH CONCRETE
2.1 Introduction
High strength concrete offers many advantages related to physical performance
and economics. High strength concrete has, in recent years, proven itself in applications such as bridges, buildings and offshore oil structures (1 •• 22.2.,25 •• 11. Optimum use of high
strength concrete, however, can only come with familiarity of the production require
ments and physical properties.
The following chapter is not an indepth study of either production require
ments or all properties determined to date for high strength concrete. It is rather
intended as background information important to the more specific topic of shear in
high strength prestreEfied concrete girders.
2.2 Production of IDgh Strength Concrete
Successful production of high strength concrete requires extreme care in all
steps of the production proceaJ. The first step is to determine the strength needed
and the age at which the strength is required. The strength level indicates the general
requirements for the batch. A 12000 psi mix will demand more careful selection of mate
rials and production control than a 9(XX) psi mix. Strength in the trial batches must be
higher than the required I~ to guarantee a minimum number of tests belOlN the specified
strength as stated by AASHTO and ACI 318. Sufficient strength is absolutely essen
tial, but excess strength becomes uneconomical. Knowing when the specified strength
is required is as important as knowing the strength. A mix for use in a prestreEfied
precasting yard which needs high strength at frOOl 12-24 hours will be different than one for a building column needing full strength 8ewral monthB later. High strength concrete
generally continues to gain substantial strength for 90 days and beyond [10). It has become common practice to specify high strength concrete strengths at 56, 90, or even 180 days 110,221. Again 12000 psi at 28 days would require different mix proportions than
12000 psi at 90 days. Economically it is important to know specifically what strength
one needs and when one needs it at the outset of high strength concrete production.
Once the general strength goals have been determined, dewlopment of a mix to
meet these goals must begin. Reference [01 is a good starting point. It gives quantitative
suggestions on initial trial batches. As would be expected, high strength concrete requires
3
4
a very low water to cement ratio. Ratios as low as 0.25 are not uncommon. The
production of high strength concrete requires good. quality for all constituents of the mix. For more information on the individual material requirements References [0,10,11,361 all
offer valuable suggestions. As suggested in Reference [01 it is best to try several different
mixes in the initial trial batches.
Trial batches with the initial mix designs are critical to successful application
of high strength concrete. First the trial batches indicate if sufficient strength can be
obtained from the mix proportions and materia1s used. If not, refinements must be made
to obtain greater strength. If sufficient strength has been obtained then decisions can be
made as to which mix will be the most ecoo.omical. Generally several trial batches are
required if an optimized mix design is desired. Trial batches serve other purposes as well.
They indicate if the various mix components, especially admixtures, are compatible.
Also a determination can be made whether the mix is providing sufficient workability.
Production of the trial batches under field conditions gives more realistic indications of
actual batch performance than laboratory mixes.
Control of production techniques must be strict for success with high strength concrete [10,221. Actual requirements are the same as normal strength concrete, but it is
imperative that they be adhered to without compromise. Batching weights nmst match
the mix design as accurately as poaJible. Steps need to be taken at the ready mix plant
to insure proper gradation of aggregates. Even more importantly the water content of
the aggregates nmst be closely monitored. Water content changes have the greatest
effect of all variables on concrete strength [201. Inaccurate estimation of the aggregates'
water content, which affects the quantity of additicnal water added at batching, can
result in either balling of the concrete due to lack of mixing water or too high a slump.
In general if balling 0CCUl'8, so nmch water must be added at the batch plint to break up
the balls that the batch nmst be discarded. If the slump is too high, the water content
is already too high and the mix must be rejected. Once the correct slump is obtained
at the batch plant further water additions nmst not be allowed. The order in which
materials are loaded into the truck can affect the resulting concrete. Mixing proves to
be critically important as well. For satisfactory perfonnance all the materials, especially
admixtures, nmst be thoroughly mixed. At the jobsite the additicn of water must be
strictly forbidden. Any admixtures added need to be carefully measured and thoroughly
mixed before casting begins. Casting high strength concrete requires proper manpower
and equipment. Due to the high cement content and low water content workability
time is often shortened even with the use of retarders, particularly during hot weather.
5
Provisions must be made to quickly cast and thoroughly consolidate the concrete upon
arrival. Curing becomes mc:re critical in high strength concrete production. Curing must
begin as soon as possible to insure good quality concrete. Given the already low water
content in high strength concrete, drying must be 'prevented to allow proper hydration.
High strength concrete tends to be mc:re susceptible to shrinkage cracking. This is
especially true if silica fume is used [371. The curing method whether ponding, spraying,
covering, etc. should keep the concrete moist during its initial curing.
2.3 Current Work
2.3.1 Trial Batches. A portion of the preliminary work for this project
involved doing a series of trial batches. The objective was to obtain a mix that satisfied
the strength requirements for the shear specimens. The general strength goal was 1~
psi at 28 days with a 9 inch slump and using a 3/8" aggregate. Much of the work was
done jointly with another project. Reference [111 contains complete coverage of these
and other batches. In the following paragraphs the same batch numbering system as
Reference [UI will be used. All told 22 trial batches were carried out. The last trial
batch was used for the test specimens which were cast on four separate occasions. The
following are some observations from these trial batches.
2.3.1.1 Air dried versus moist curing. Curing conditions were one of the van'ables investigated during the trial batch phase of this project. ACI 318 requires concrete
to meet the specified strength after curing as per ASTM C3t. The pertinent provision
is Section 9.3 which states that test specimens should be removed "from the molds at
the end of 20 ±" h and stored. in a moist condition at 13.4° ± 3° F. (23° ± 1° C.) until
the moment of test." Moist curing is defined as immersion in saturated lime water or
setting in a moist room. The Texas Department of Highways and Public Transportation
commonly specifies a seven day moist cured beam break for concrete acceptance. This
is not representative of actual field curing conditions. Tests were run on both beams
and cylinders which were moist cured. and ones which were air dry cured using a curing
compound.
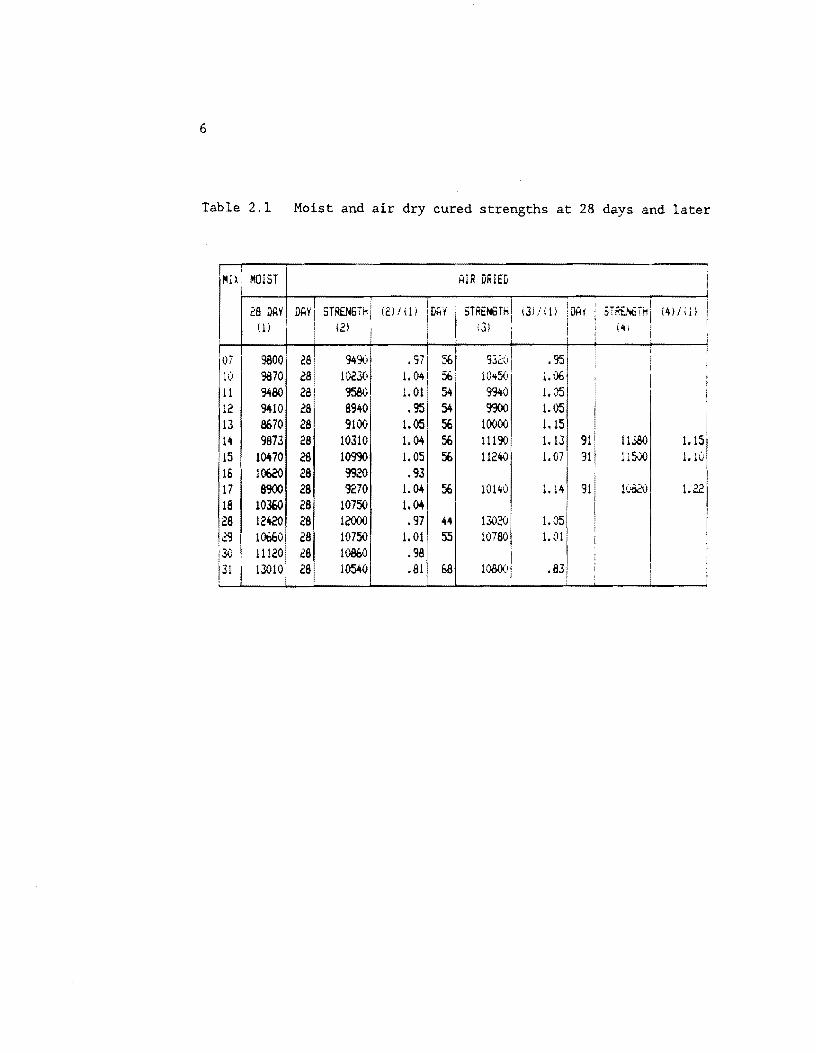
Table 2.1 gives moist cured. strength at 28 days and air dry cured. strengths
at 28 days and later. Mixes 28-31 are the four shear specimen casts corresponding to
Specimens 3-1 and 3-2, Specimens 3-3 and 3-4, Series 1, and Series 2. Figure 2.1 gives
normalized results of the strength of air cured cy Unders at various dates compared to
moist cured. strength at 28 days. It will be noted that mast values fall within 10% of
6
Table 2.1 Moist and air dry cured strengths at 28 days and later
I~IXi MOIST I AIR DRIED ,
28 DAV DAY I STRENGiH! (2l1(U IDI;( I STRENGTH I (3J/(1l IDAf 5TRtNiTHi (4)iijJ i (1) : (2) l i \3) i l (III !
:07 I 28\ I •97 1 56
1 932(J I i I
9800 3'!3(01 •95 1 I l~t
i i 10 9870 28 1. 04 1 56 10'+50· '\)6 I i J.. 1
11 9480 28 1. 01 54 9940 1.05 I 12 9410 28 8940 .95 54 9900 1.05
I 13 8670 2B 9100 1.05 56 10000 1. 15 14 9873 28 10310 1.04 56 11190 1.13 91 11380
1.15
1 .15 10470 28 10990 1.05 56 112401 1.07 91 11500 1. 10 16 106C0 28 9920 .93 17 8900 28 9270 1.04 56 10140 1. 14 91 1(~ 1.22 18 10360 28 10750 1.04 28 12420 28 12000 .97 44 13020 1.05 a 10660 28 10750 1.01 55 10780, 1.01
1
30 11120 28 10860 .98 I 31 13010 28 l()5.\O .81 G8 10800 1 .83 i
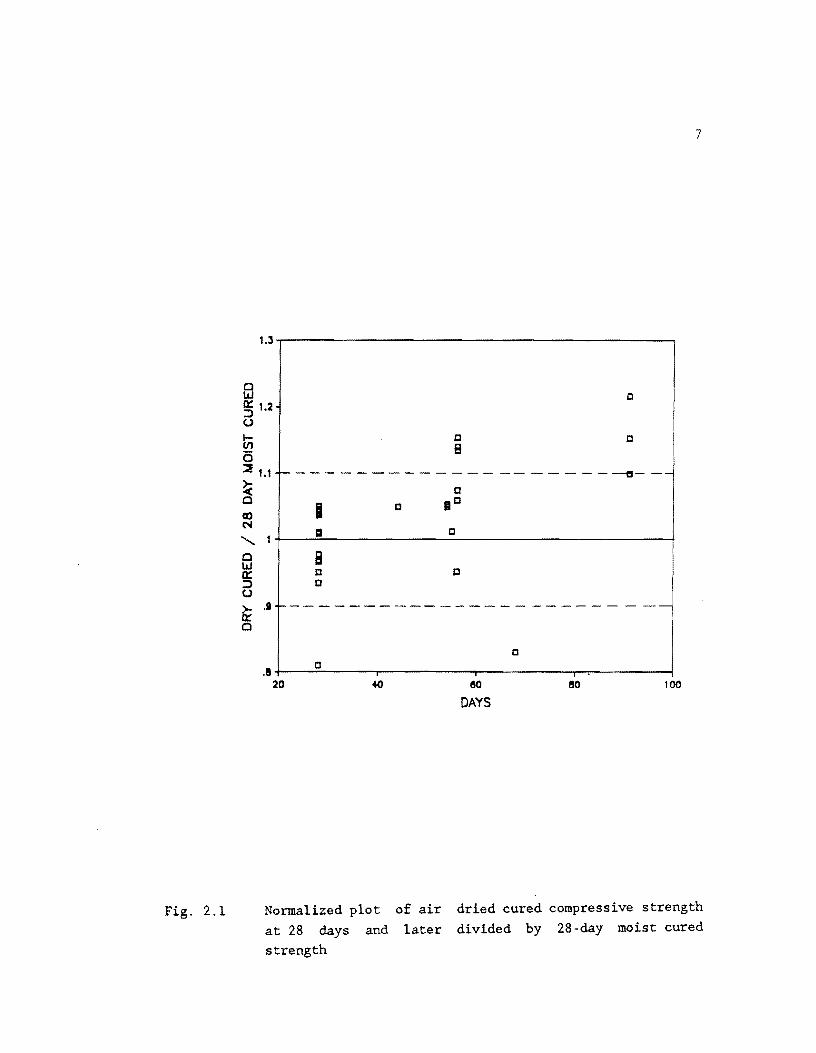
Fig. 2.1
1.3,.-----------------------
Q W ~ 1.2 U
In a
c B
:2 1.1 '--------------~ Q
CD N
"Q W a:: :::::> u ~ .• 1--
Q
I
B c D
D
D
c
c
c
- - ---e---
---~ I
c o
.a+---~----_.--------~----------~------~ 20 eo
DAYS 100
7
Normalized plot of air dried cured compressive strength at 28 days and later divided by 28-day moist cured
strength
8
unity. The higher values indicate slight conservatism while lower values are unconser
vative. The two very low values indicate a potential problem. The vast maJority of the
points shown are for concrete batches poured over the summer. The temperature range
was approximately 75° to 105° F daily for the first part of the curing. Based on the
maturity concept for strength development the dry cured specimens should have done
quite well. From further evaluation of the data Carrasquillo noted that up to 15 days
dry cured cylinders were stronger, but from 28 days until the end of testing moist cured
were stronger [111. It is reasonable to assume that the early heat helped the dry cured
concrete develop strength quickly, but that desiccation prevented the concrete from cur
ing completely. The two very low readings were for a batch cast during cold weather.
Due to the cold temperature, about 35° F at cast and less than 7fY F during curing, the
maturity of the concrete was low. The concrete still dried 80 that hydration slowed. The
net result is a mix in which the dry concrete was significantly lower than moist cured
cylinders.
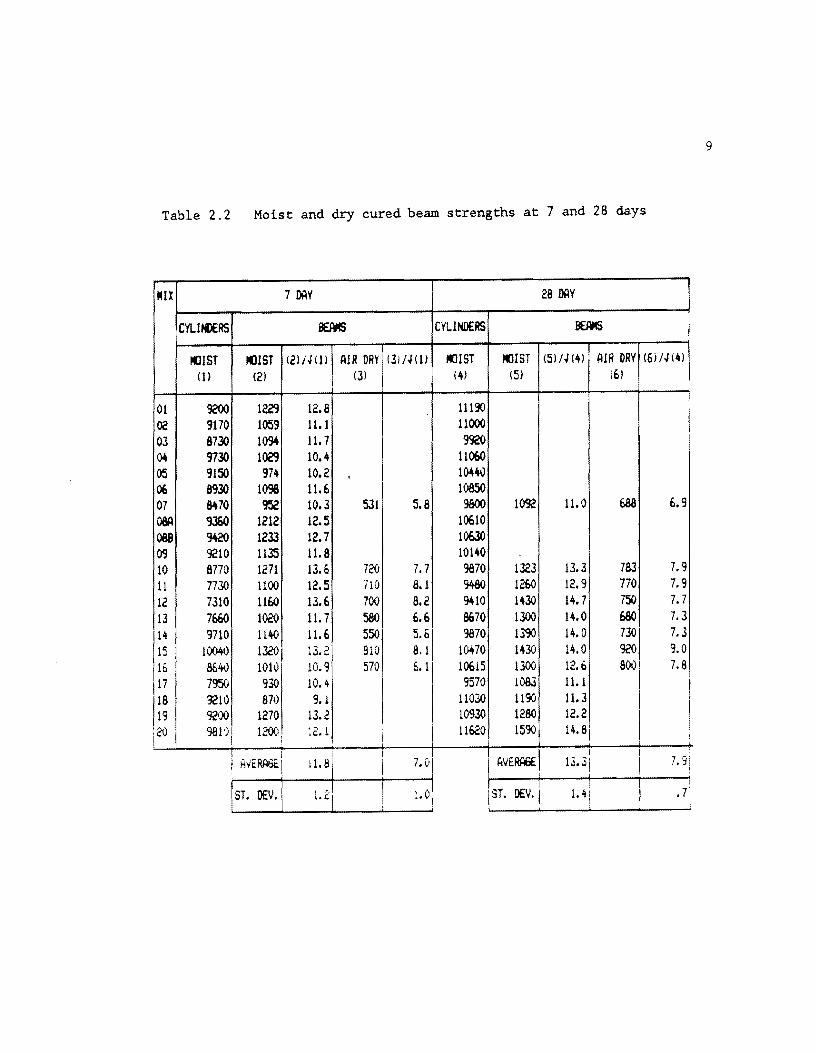
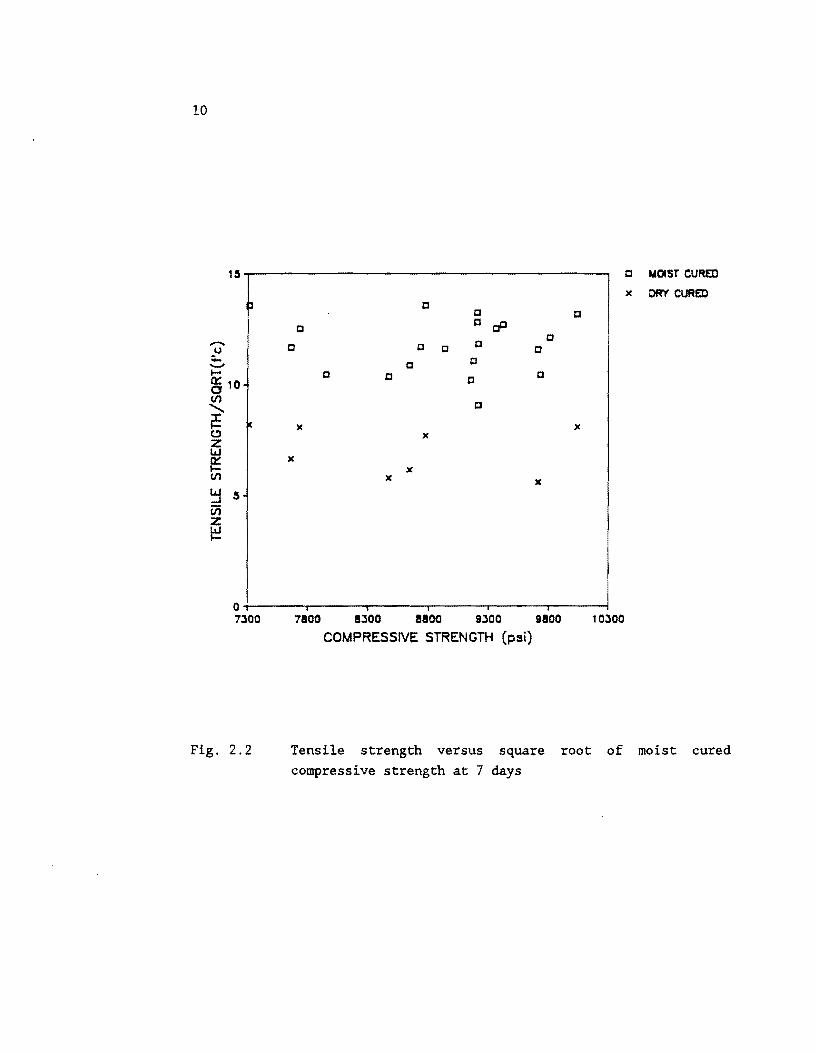
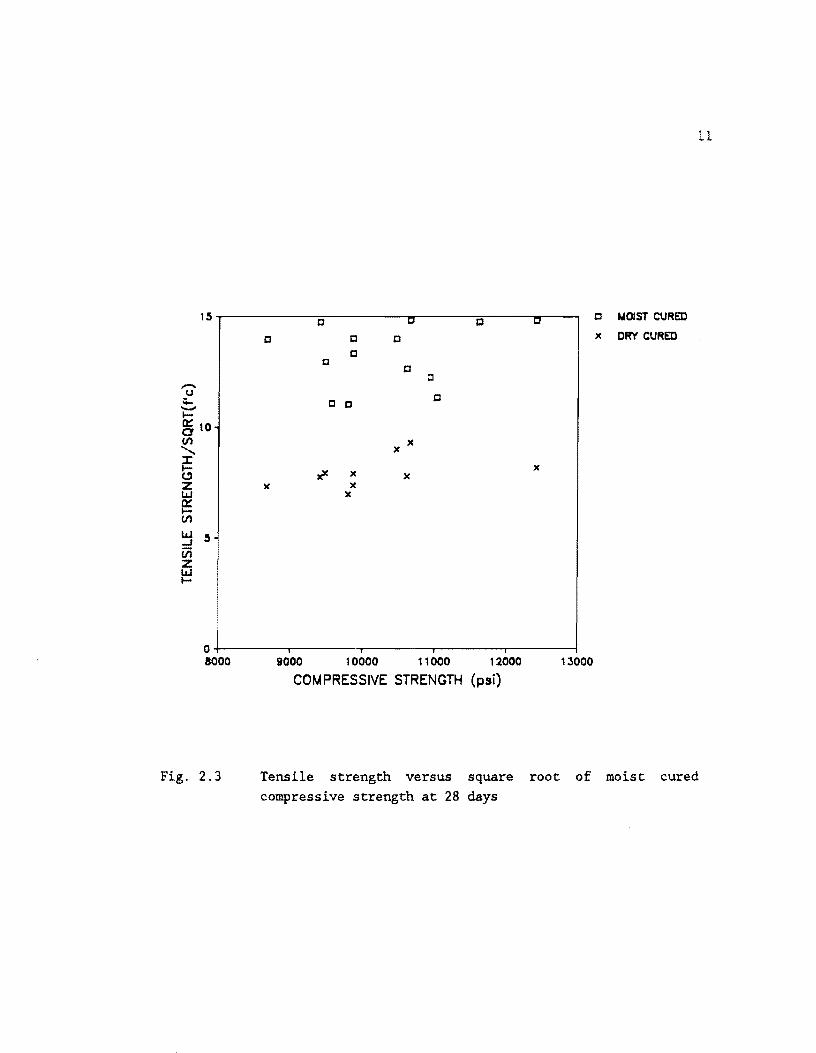
The literature has noted a significant link between curing conditions and tensile
strength ofhigb strength concrete. The tensile strength was measured using 6"x6"x2O" be&IIJ3 cast in steel molds. The data presented herein is for moist cured cylinders at 7
days and 28 days and moist and dry cured be&IIJ3 at 7 days and 28 days (Table 2.2).
The beam strengths are compared with the square root of the moist cured cylinders
"at a given date. Figures 2.2 and 2.3 show the results plotted against concrete strength
at 7 and 28 days respectively. There are several trends in the data. There is quite
obviously a difference between the moist cured and dry cured be&IIJ3. The dry cured
bealD!l had about 60% of the strength of moist cured beams at both 7 and 28 days.
There is a modest increase in the coefficient of tensile strength divided by the square
root of compressive strength as the age increases. The relative increase between moist
and dry cured is essentially the same. This would indicate that either tensile strength
increases more with age than the square root of the compressive strength or that the
tensile strength does not change as a square root function of the compressive strength.
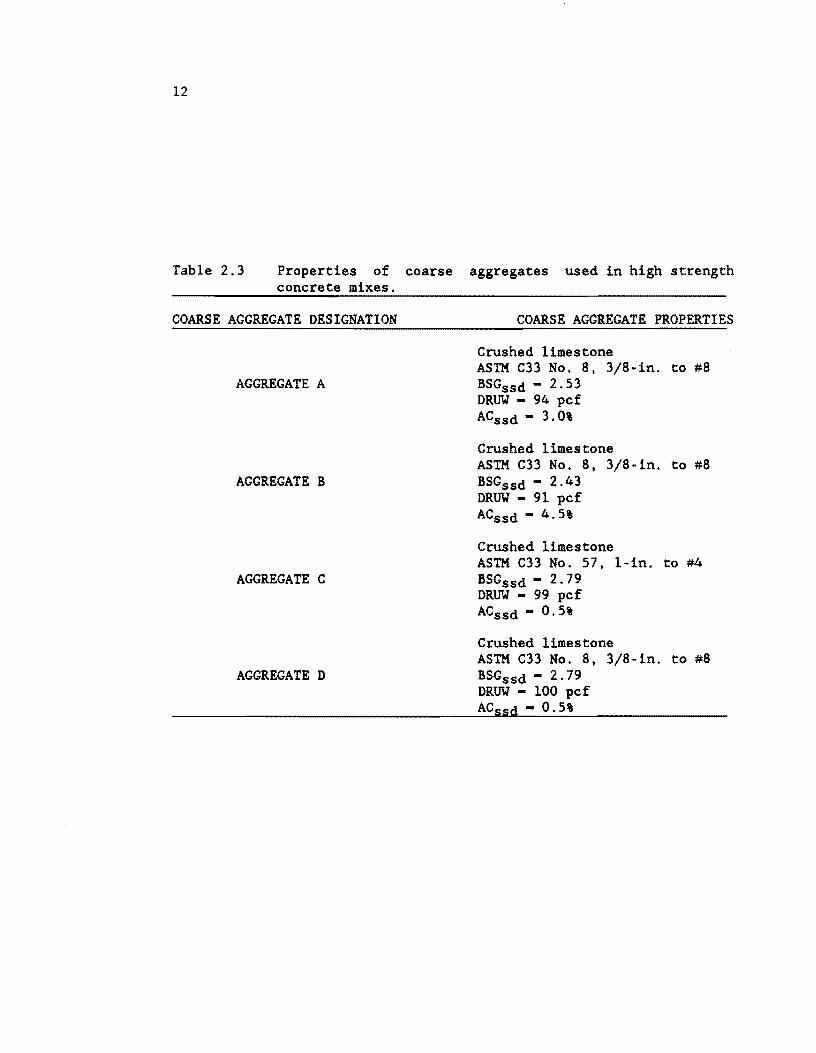
2.3.1.2 Effect of aggregate. The coarse aggregate can have a major influence
on the strength of concrete. Table 2.3 gives pertinent aggregate properties. After a
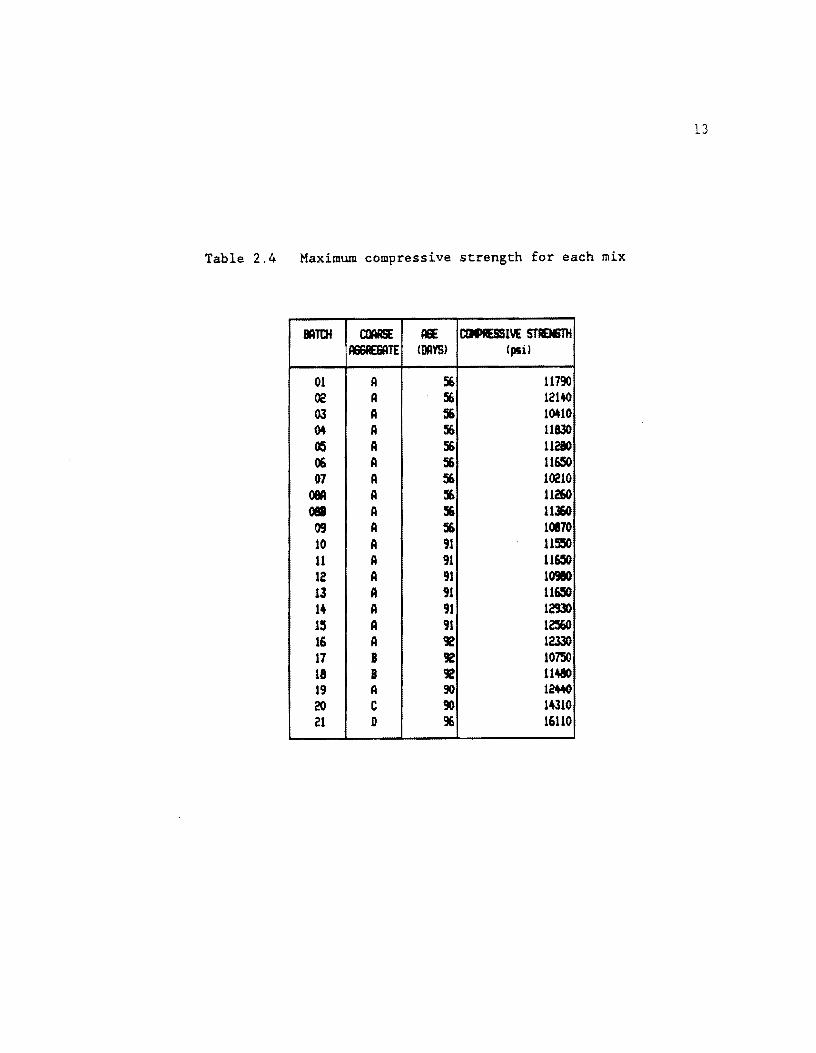
number of trial batches had been conducted it was decided that the aggregate was not
sufficiently strong to allow higher concrete strength. Table 2.4 contains the highest
strength obtained out of each batch. It should be noted that the date of the highest
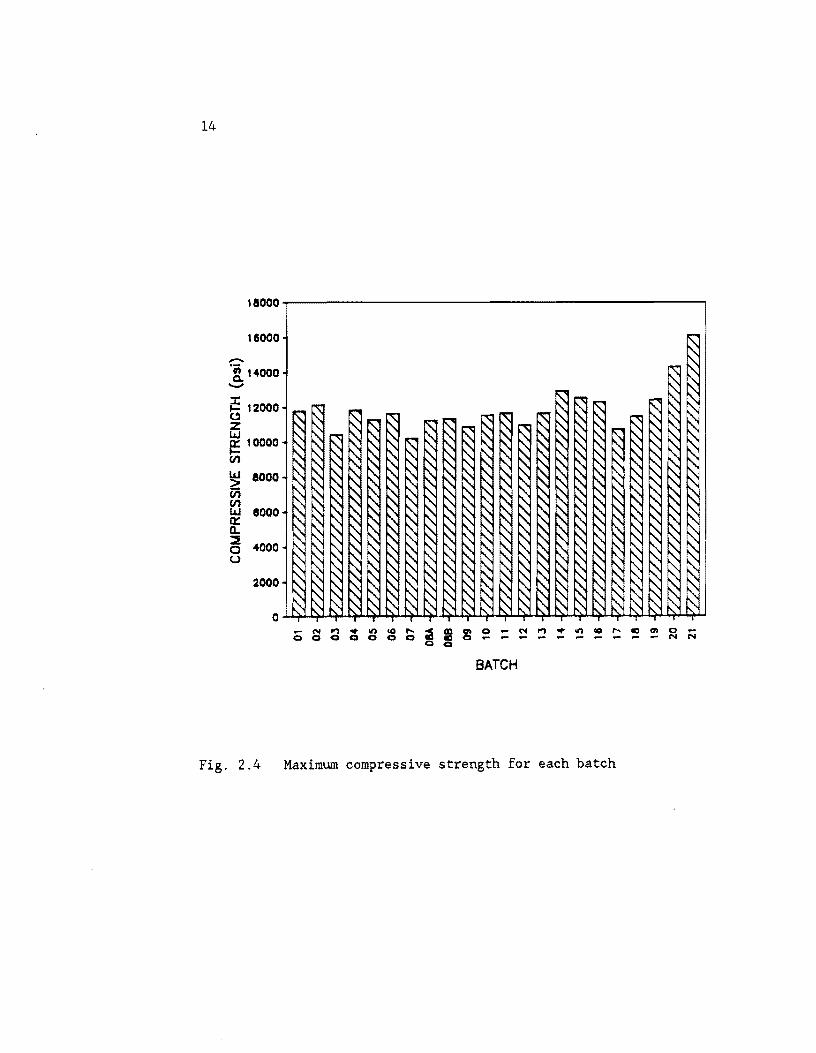
strength varied due to modifications in the testing schedule that occurred as the trial
batches proceeded. Figure 2.4 shows the results graphically. It will be noted that for
9
Table 2.2 Moist and dry cured beam strengths at 7 and 28 days
lUX 7 DAY 28 DAY
CYLINDERS ~ CYLINDERS ~
IIlIST IIlIST (2) j.J (11 AIR DRY (3J/.J(1) IIlIST !(lIST (51 /.J (4) AIR DRY (6) /.J (4) (1) (2) (3) (4) (5) (6)
01 9200 1229 12.8 11190 02 9170 1059 11.1 11000 03 8730 1094 11.7 9920 00\ 9730 102'9 10.4 11060 05 9150 974 10.2 . 10440 06 8930 1098 11.6 10850 07 &\70 952 10.3 531 5.8 9800 1092 11.0 6aa 6.9 08A 9360 1212 12.5 10610 068 ~ 1233 12.7 10610 09 9210 1135 11.8 10140 10 8770 1271 13.6 72fJ 7.7 9870 1323 13.3 783 7.9 11 7730 1100 12.5 710 8.1 S480 1260 12.9 770 7.9 12 7310 1160 13.6 700 8.2 9410 1430 14.7 750 7.7 13 7660 1020 11.7 580 6.6 8670 1300 14.0 680 7.3 14 9710 1140 11.6 550 5.61 9870 1390 14.0 :1 7.3 15 1(J(W) 1320 13.2 910 B.l l0it70 1430 14.0 9.0
1
16 8640 1010 10.9 570 6.1 10615 1300 12. b BOO 7.8 17 7950 930 10.4 9570 1083 11.1
1
18 3210 870 9.1 11030 1190 11.3 19 9200 1270 13.2 10930 1280 12.2
'2fJ 981') I 12fJO, :2. 1 i 11620 15901
14.81 I , !
AYERAGt.! I !
7. ('i I I I 1l.8 I I I1vEAAGEI 13.3i
I 7.9
1 ~. (I! I I I I ST. DEV. ' .", 1ST. DEV'I 1.41 I .7: \. Co
I I I I I I
10
Hi e MOIST CURED
x DRY CURED ~ e e
e e cC ......... u e e e e
e e ;;.... e e ....... l- e e e ct: 10 e 0 (f) e ......... :r l- x x (!) x Z UJ
~ x
x (f) x x ~ S Vi z ~
0+-------,~----~------~------~----_.------_1
7JOO
Fig. 2.2
7800 8JOO 880C 9JOO 9800 10300
COMPRESSIVE STRENGTH (psi)
Tensile strength versus square root of moist cured compressive strength at 7 days
11
t5~----------~----------~------~----~~--~ c c t.tOIST CURED
....... u ;;.. -I-et: to 0 (fI
"'" ~ c.!) Z LLJ e: (fI
LLJ 5 ..J iii z LLJ I-
o I 8000
Fig. 2.3
c c c x DRY CURED c c c
c
c c c
x x
r x x x
)( x x
9000 1 0000 11 000 1 2000 1 JOOO
COMPRESSIVE STRENGTH (psi)
Tensile strength versus square root of moist cured compressive strength at 28 days
12
Table 2.3 Properties of coarse aggregates used in high strength concrete mixes.
COARSE AGGREGATE DESIGNATION
AGGREGATE A
AGGREGATE B
AGGREGATE C
AGGREGATE D
COARSE AGGREGATE PROPERTIES
Crushed limestone ASTM C33 No.8, 3/8·in. to #8 BSGssd - 2.53 DRUW - 94 pcf ACssd - 3.0%
Crushed limestone ASTM C33 No.8, 3/8-in. to #8 BSGssd - 2.43 DRUW - 91 pcf ACssd - 4.5%
Crushed limestone ASTM Cll No. 57, 1-in. to #4 BSGssd - 2.79 DRUW - 99 pcf ACssd - 0.5%
Crushed limestone ASTM C3l No.8, 3/8·in. to #8 BSGssd - 2.79 DRUW - 100 pcf ACssd - 0.5%
13
Table 2.4 Maximum compressive strength for each mix
BATDf aR1SE 1& CtlRESSllJE STAaIiTH Ali6l&ATE (DAYS) (psi!
01 A 56 11790 ~ A 56 12140 03 A 56 10.10 0. A 56 11830 05 A 56 11280 06 A 56 11650 07 A 56 1~10
08A A 56 11260 OM A 5 11360
09 A 56 10170 10 A 91 U5l5O 11 A 91 11650 12 A 91 10980 13 A 91 11650 14 A 91 12930 1~ A 91 1~
16 A 92 12.330 17 B 92 10750 18 B 92 11480 19 A 90 12W1 20 C 90 14310 21 D 96 16110
14
\aooo~------------------------------------------------~
16000
-.~ t4000 ...... ~ 12000
Z
~ 10000 CI1
~ aooo CI1 CI1 ~ 8000 a. ~ 4000 U
2000
BATCH
Fig. 2.4 Maximum compressive strength for each batch
15
batchs 01 through 19, using Aggregates A and B, maximum strength was between lCXXXl
psi and 13000 psi with the madority below 12000 psi. The breaks were going through
the aggregate without bond failure. Se'Veral batches were conducted with a stronger
limestone. The 1" maxilIl1m size, Aggregate C, used in trial batch 20 gave a high
strength of 14300 psi. The 3/8" maximwn size, Aggregate D, used in trial batch 21
gave strengths up to 16110 psi. The coarse aggregate appears to have limited concrete
strength in batches 01-19. This provides further evidence that the coarse aggregate has
a mador effect on the strength of high strength concrete.
2.3.2 ProblelDl with use. For all of high strength concrete's advantages
there are certain problems which should be considered.. Batching concrete with a very
low water to cementitious materials ratio, about 0.25, is delicate. Good knowledge of
the aggregates' water content is essential. If too little water is added during batching
the concrete will form balls and not mix properly. Generally if this occurs so much
water must be added to break up the balls that the resulting batch is unacceptable. If too much water is added initially the slump will be out of the acceptance range and the
batch must be discarded. Once a good mix has been obtained several casting difficulties
can occur. The mixes can become quite stiff in only a short time, especially in hot
weather. Redosing with superplasticizer is an option, but speed in casting is better
policy. Crusting between lifts is poaIible in hot, dry weather; therefore, compaction
must penetrate the previous lift. Finishing holds even greater trouble. Workability in
the forms is sh<rllived and the rocky nature of the mix makes finishing more difficult.
Curing must be done very well or problellll can occur. In the laboratory plastic shrinkage
cracks occurred in se'Veral instances while the formwork was still on. Thin sections are
especially vulnerable to this. In other C81e8 surface cracking was visible within a few
minutes of final screeding. Curing must be quick and thorough. SucceadW use of high
strength concrete requires care in hatching, casting, and curing.
2.4 Properties of mgh Strength Concrete
2.4.1 General. The physical properties of high strength concrete tend to be
somewhat different than for normal strength concrete. Only thcee properties pertinent to shear in prestressed concrete will be discussed herein. References [lO,13.36[ all have
additional information. The m08t important property is the higher compressive strength.
High strength is actually a fairly locee term implying greater strength than is generally
used at a certain location. Usually this means strengths in exce&!! of 6000 psi. While
16
strength is the most obvious and easily measured property, other properties do have a
major effect on structural performance.
2.4.2 Stress-stram behavior. The str .... strain behavior in uniaxial com
pression changes some as concrete strength increases. Figure 2.5 shows the general trend.
The slope of the stress-strain curve is steeper and more lineal' up to about 80% of ulti
mate capacity 13&1. The strain at maximum strE88 is somewhat higher than for normal
strength concrete [121. The descending branch of high strength concrete is steeper. It is
stated that the descending branch becomes almost a vertical line [.3J. Special methods
must be employed to obtain the descending branch. The ultimate strain at failure is
lower than for normal strength concrete.
2.4.3 MDdulus of elasticity. The steeper stress-strain curve for high
strength concrete means the modulus of elasticity is higher. The increase in modulus of
elasticity does not, however, in general match the value predicted by Ec = 33( wc)l.& VTf: (psi). This equation tends to overestimate the actual modulus. Other equations for the
modulus of elasticity have been proposed with
(psi) by Cal'rasquillo et al. being widely accepted. (Fig. 2.6) [12J. The modulus is greatly
influenced by the coarse aggregate 110].
2.4.4 TeDsUe strength. The tensile strength of concrete is typically measured
either by a modulus of rupture test or splitting tensile test. The values of tensile strength
are highly dependent upon drying as found by this project and in the literature. Moist
cured beams show substantially higher strengths than predicted by the current AASHTO
Specification. Dry cured, however, only show a small difference. Proposals have been
made for increased predictions of tensile strength. More recently however the feeling
has been to use more traditional and conservative valuea predicted by ClllTfmt equations 112,3&].
2.4.5 MsceDaneous. Several other propertiea have minor influences on shear
in high strength concrete. Total shrin1cage at later ages is said to be about the same
as for normal strength concrete. High strength concrete does, however, see more of its total shrinkage at eal'ly ages than does normal strength concrete. Unit creep tends to
be much lower in high strength concrete. Given the fact that it is stressed higher, total
creep stays about the same. This indicates that total prestressed losses should be of
-en
.!III:
12
10
8
::; 6 CI.I ... (j)
4
2
High-Strength
1\
I ' , I ' Medium Strength
I \ , \ , \
" ~ \ Normal- Strength , , Stroke Rote: 2000fL- in. (005mm) Imin.
4"x8" (102 mm x 203mm) Cylinder
o I I,
o 2 3 4 5 6 7 0 Strain (x 1000 in.lin.)
GRAVEL
High Strength
h II Medium I~ Strength
I I
'" I " I , ,
, Normal \ Strength
Stroke Rote; 2000ft-in. (0.05 mm) Imin
4" x 8" (102 mm x 203 mm) Cylinder
2 3 4 5 6 Strain (It IOOOin./in.)
Fig. 2.5 stress-strain curves for norn:al, medium and high strength concrete (12]
7
I-'
"
1
I 6
;; 5 C\.
• • 0 4
>< .. --~I u q :. 3r
.. w
2~ • ,
020
AASHTO 6 ACI
RanQa for which, formula was der ived
• •
..
,;. MPa
•
• •
.rI'
• •
Ec ,. (40,OOO./C" .. 1.0 X 10⁶)
(Wc/145}1.5 psi j::ornell f. ~}l!Q!jol'l.
l· III. • ....... !,.". • , ..... . •• - v .hc"., •• " .... .
.U -"',. • t {
..... 11 ...... '1 ..... 51 .. .
....... • 'ftu. c .... .. reACt,.. • ...... "
A H ..... .
• 0 • . ., t • • • • ~t •• • • • -• f~ • psi
• S ..... I ..
\
e ........... ltll •••• SI... 0 Swarlz eta!. l124] • ( .. ,. .......... II ..... 51 ••• • ..... H ...... £.,.11
........ A •• 'oc ...... 11 ••••
....... .. Itle ....... '." ... 01 ..... H.n ..... eNc,.'. • P.w •
• H .... .. • I ...... v~ ••• · ......... " ..... ..
1000 2000 3000 4000 5000 6000 8000 10000 12000 14000
30 40 50 60 10 80 90 100 110 120
,;;:. psi
Fig. 2.6 Modulus of elasticity versus canpressive st.re.rgth [29]
130
...... 00
CHAPTER 3 SHEAR CAPACITY MODELS
3.1 Introduction
Shear is one of the primary modes of failure in structural concrete. For over 30
years shear has been extensively researched and discussed [7,81. A number of empirical
and conceptual models have been presented over the course of time. Given all of this
effort I however, a completely satisfactory solution has not been attained.
A number of currently popular shear capacity models will be discussed herein.
The models range from highly empirical to highly theoretic:al. The assumptions of each
model will be discussed and some comments will be made on their rationality and ease
of use. The three most popular models will be compared with the test results available
for shear in high strength concrete.
3.2 AASBTO and ACI (Current)
Current AASHTO and ACI shear provisioD8 are highly empirical. The major
provisions of the two are identicall~ul. A full histcxy of the development of each can be
found in Reference [401. For the present purpose only the bases of current provisions are
discussed.
The general basis of the Code provisions, Code referring to both ACI and
AASHTO in this discussion, is summarized in
where
v. s t/>(Vc + V.)
V. = factored shear foree at a section
V c = nominal shear strength provided by concrete
V. = nominal shear strength provided by shear reinforcement
t/> = strength reduction factor equal to 0.85 for shear
(3.1)
This explicitly states that total shear resistance is the sum of a concrete contribution
and a steel contribution.
19
20
The steel contribution to shear is baaed on a 45° truss model. The original
forIIDllation came from W. Ritter in 1899 and was extended by E. Morsch. An assump
tion was made that the crack angle was 45°. From equilibrium., and rearranging terms
the familiar equation for the steel contribution is '
where
v. = A.llld • d
(3.2)
A" = area of shear reinforcement within a distance s
fll = specified yield strength of shear reinforcement
d = distance from extreme compression fiber to centroid of longitudinal
reinforcement
s = spacing of shear reinforcement in direction parallel to longitudinal
reinforcement
The basic philoaophy for the current design procedure is that
"shear reinforcement restrains growth of inclined cracking, providing
increaaed ductility, and a warning in situations in which the sudden
formatioo. of inclined cracking in an unreinforced web may lead di
rectly to distress (8) ."
ACI-ASCE Committee 426 goes on to state:
"In addition to any shear carried by the stirrup itself, when an in
clined crack Croale8 shear reinforcement, the steel may contribute
significantly to the capacity of the member by increasing or main
taining the shear transferred by interface shear transfer, dowel action,
and arch action." [8]
The underlying conceptual tl'Wll model has thus been pushed to the background. The
shear reinforcement is seen to a significant degree as a means of maintaining the concrete
contribution at ultimate.
While there is an underlying physical model for the steel contribution, the
concrete contribution consists c:l empirical equations which try to include the most im
portant parameters affecting behavior. The Ve term as used in the Code is an attempt
21
to account for the four mitior shear tran.sfA!r mechanisms 181. The four mechanisIIl8 are
shear transfer by concrete shear stre&l, interface shear transfer, dowel shear, and arch
action. Each of these four mechanisms can have a varying influence under different
circumstances. The practicality of the situation is that the Vc terms were derived to
correlate sufficiently well with the t.t results available. A mitior assumption is that the
shear taken by the concrete at cracking can be carried at ultimate in a reinforced beam
and that this shear supplements the shear contribution of the truE model &8 reflected
in the V, term 171.
For reinforced concrete there are two equations for V c, under normal. loading
conditions. One equation is
where
v'T£ = square root of specified compre.ive strength of concrete
p. = A,/b.d
A, = area of longitudinal reinforcement
V u = factored shear load at a section
Mu = factored moment at section
b. = web width
(3.3)
d = distance from extreme compression fiber to centroid of longitudinal
tension reinfCl'cement
The origin of this equation dates back to the early lQ60's and ACI-ASCE Committee
326. This equation tried to realistically indicate the influence of three primary variables:
the ratio of longitudinal reinforcement P., the quantity M/V d, and the concrete strength
I~ which repralented the concrete quality. From the starting point of
(3.4)
tI = tI/bd (3.5)
22
where
v = total shear
v = shear stress
f. = tensile strength of concrete,
the equations were m8D.ipul&ted. into two dimensionless parameters. The available test
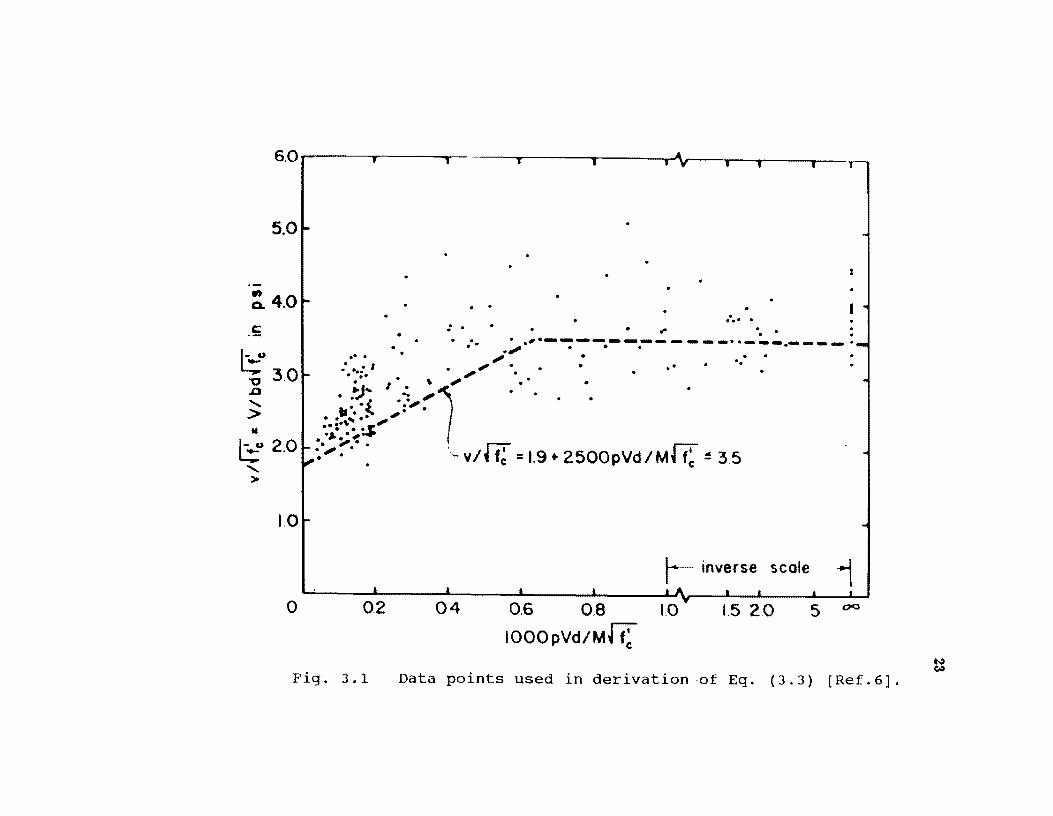
data was then plotted in terms of these two parameters (Fig. 3.1). A bilinear curve was chosen to represent the data. The lower portion of the curve was chosen to be almost a
lower bound since failures in this r8D.ge were observed to have little reserve strength after
diagonal cracking. The upper limit on the curve was chosen more as an average value since these specimens demonstrated substantial reserve strength. The tests from which
this equation was derived were alI reported. by January 1, 1960. Thus this equation was derived by curve fitting the available data using what was considered the three most
important parameters.
The second equation for shear in reinf<lrCed concrete is
(3.6)
This equation was first used in the 1963 Building Code. The equation gave a simple,
reasonably conservative estimate to the tests used to obtain Equation (3.3). The only
advantage to Equation (3.6) is its extreme simplicity. The current equations for the concrete contribution in reinforced concrete stem from empirical curve fitting done in
the early 1960's.
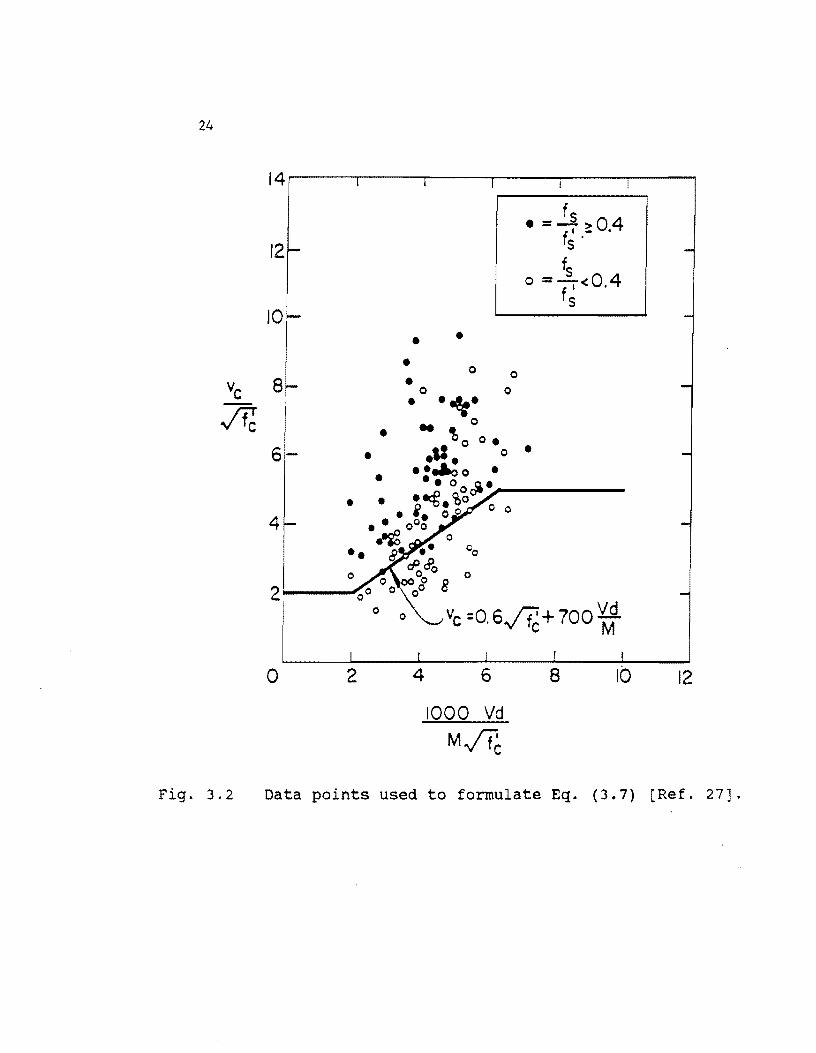
Three separate equations are given for the concrete contribution in prestressed members. The first equation is
Several additional limitations include V"d/M". $ 1.0 and the value given must be less
than that given for web shear cracking inside the development length. This equation
was added in the 1W1 ACI Code 88 a simplified method of computing V c compared to the more detailed equations [.1. Figure 3.2 showl the data used to obtain this equation.
It should be noted that the nondimensional parameters used for the derivation are the
6.0. I , ,. y y • ~_,..--__ - __ - ____ _
5.0
., Q. 4.0 c::
~u "'C 3.0 .a
" > II t:: 2.0
" >
1.0
o
. ... . : . ...
• • 1# -- - - - - ________ •• ___ • ____ •
• • .tIf/II- • • • .- . " :~I , • .... ,
• .", t • ": ." .. ~ .' . . . " ... :.- ,. ·-r'. ':$'
.0 . '.
;.,... I • ~ /'
..... ~~ r:T
.:"'.' 0 ',- v I ~ f~ = 1.9 + 2500pVd I M ~ f~ :!£ 3.5
r- inverse scale --1 0.2 0.4 0.6 0.8 1.0. 1.5 2.0 5 0<)
IOOOPVd/M~
Fig. 3.1 Data points used in derivation of Eq. (3.3) [Ref.6]. N W
24
Fig. 3.2
14r----.-----r----~----~--~~--~
6-
4
• • • o • o . ..".
• .. 0
o o
f • =~ >04
f~'- .
fs o =-<04 fl'
S
~o o • •• o· . ... • . ·.0 ·
• •• 00 oi • .,.. _____ _ • • .tc€. ~o
• i. 0 0 ° 0 •• 0°0 ~ 0
•• 8... •• 00
~c?o o 0 000 8 0 2 i-__ ,-- 0 00
o 0 Vc =0.6~+700 ~
0 2 4 6 8 10
1000 Vd
M~
Data points used to formulate Eq. (3.7)
12
[Ref. 27] •
25
same as for Equation (3.3). Furtherroore there is no tenn in the equation related to
the prestress force. The equation restriction that the effective prestress force be greater
than 40% of the tensile strength of the ftexural reinforcement was required to maintain
conservatism. The Vc ~ 5JlIb.,d was an attempt to prevent web shear cracking.
crete.
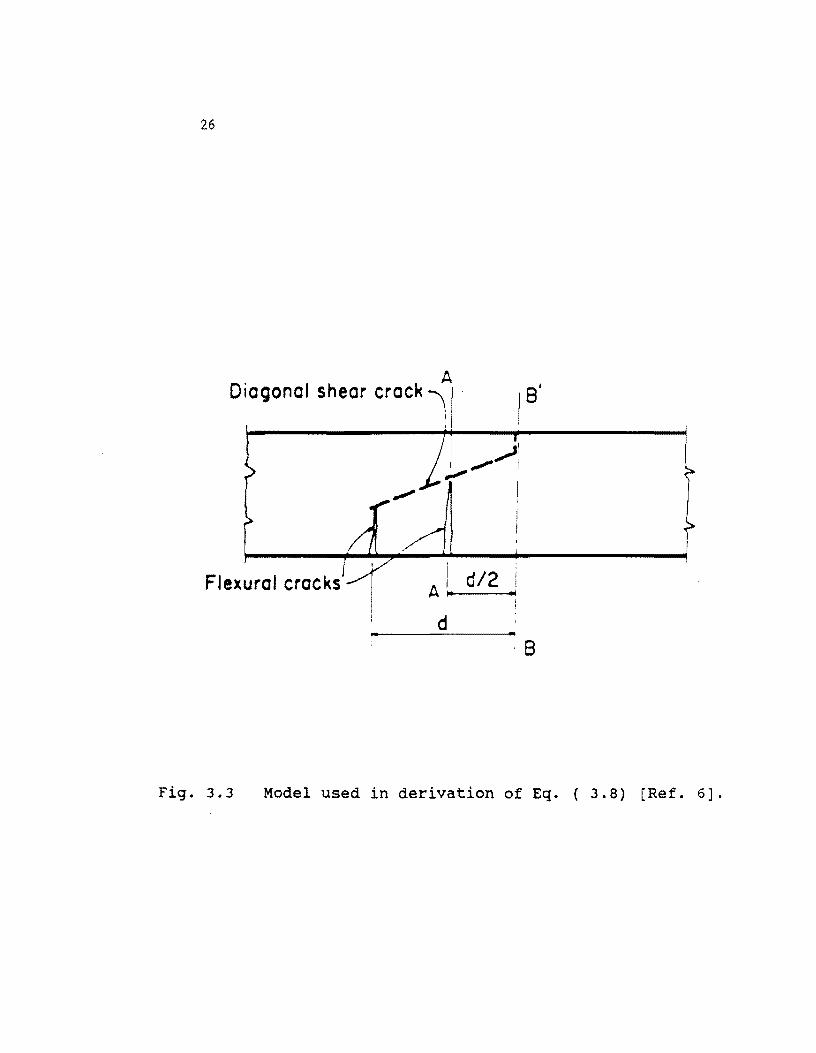
A more detailed calculation is given for inclined cracking in prestressed con-
(3.8)
where
(3.9)
I:: IIlOment of inertia of the section resisting externally applied factored
loads
y, :: distance from centrcXdal axis of gl'Olll section, neglecting reinforce
ment, to extreme fiber in tension
V d. = shear force at section due to unf&etored dead load
Vi = factored shear force at section due to externally applied loads occur
ring simultaneously with Mm_
MmG.lI = maximum factored moment at section due to externally applied loads
Me,. = IIlOment caU8ing cracking at section due to externally applied loads
fp41 :: compressive stre. in concrete due to effective prestre. force only
(after allowance for all prestre. losses) at extreme fiber of section
where tensile stre. is caused by externally applied loads
fd. = stresa due to unf&etored dead load at extreme fiber of section where
tensile sue. is caUBed by externally applied loads
This equation has been e.entially the same since the 1963 ACI Code. The major term
ofthis equation is ViMcr/Mmu' In the original formulation by Sozen and Hawkins I,ASI
and later used by ACl318-63 131 the term was Mer/(M/V) - (d/2)}. This can be derived
with reference to Figure 3.3. Section B-B represents the section to be considered and
has a shear and moment of V and M. The shear crack is assumed to have a horizontal
projection equal to d. The occurrence of a flexure crack at d/2 tawvds the support from
26
A Diagonal shear crock \ I I B'
I -11 I ........--.......... 1
",.,.. .
I I
Flexural crocks A ~ d/2 J ,
d •• ..
·8
Fig. 3.3 Model used in derivation of Eq. ( 3.8) [Ref. 6].
27
B-B was taken as a sign of impending inclined cracking. Assuming that the moment at
A-A is Mer and the difference in shear at A-A and B-B is small one gets M-M;:,,=Vd/2
which can be rearranged to the form used. This was changed in the 1971 ACI Code by
the removal of the d /2 term. This effectively causes one to compute the Hexural cracking
load at the point of interest rather than d/2 back towards the support. The dead load
shear, Vd was considered separately for two reasons 161:
1. Dead load is usually uniformly distributed, whereas live load can have any
distribution.
2. The dead load effect is always computed for the prestressed section alone. The
live load effect is computed for the composite section in composite construction.
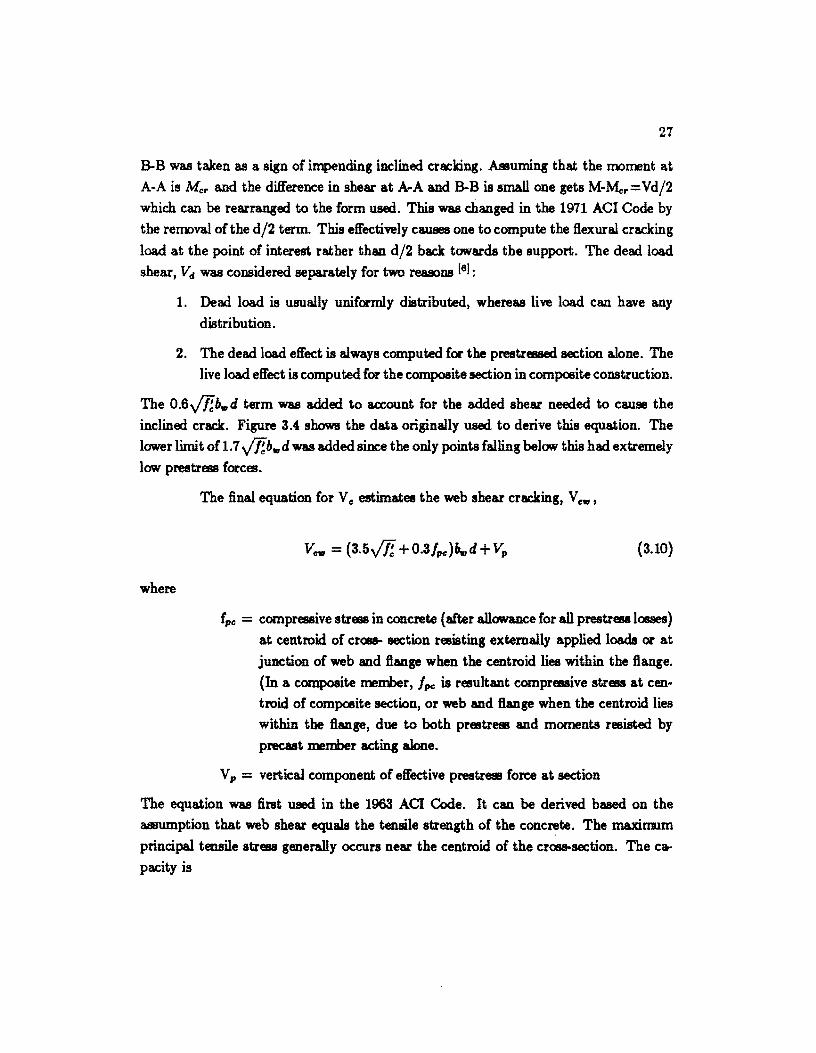
The O.s.Jfcb.d term was added to account for the added shear needed to cause the
inclined crack. Figure 3.4 shows the data originally used to derive this equation. The
lower limit of 1.7 .Jfcb.d was added since the only points falling below this had extremely
low prestress forces.
where
The final equation for Ve estimates the web shear cracking, Vetil'
(3.10)
fpc = compressive stress in concrete (alter allowance for all prestress losses)
at centroid of CI'Oll8- section resisting externally applied loads or at
junction of web and Hange when the centroid lies within the Hange.
(In a composite member, I IX! is resultant compressive stress at cen
troid of composite section, or web and Hange when the centroid lies
within the Hange, due to both prestress and moments resisted by
precast member acting alone.
V p = vertical component of effective prestress force at section
The equation was first used in the 1963 ACI Code. It can be derived based on the
&8Bumption that web shear equals the tensile strength of the concrete. The maximum
principal tensile stress generally occurs near the centroid of the cross-section. The ca
pacity is
9-. ------------------~------~----~----~
8
Vci-Vd
b'd~ 4
3
o
Fig. 3.4
• • • • • • ••• . .: . • • ••• • ••• •• • •
••
•
• •
( I J:i Mer )
Vci = O.6bdv' fc +(~_ttVd
2 3 4 5 6
Mer / (~-~) b"d./f;;
Data points used in calibration of Eq. ( 3.8) [Ref. 6].
tv ex>
29
(3.11)
where
f, = tensile strength of concrete
v C1II = shear stre8!l
By rearrangement this becomes
(3.12)
The tensile stress was set 80 ft = 3.5v'lI which yields
(3.13)
This equation was simplified to the Code equatioo. (Fig 3.5). The V p term was added
to account for shear balanced by the prestress force.
3.3 Plasticity Theories
3.3.1 Introduction. The theory of plasticity provides a mathematical basis
for collapse load calculations. While the mathematical proofs are beyond the scope
of this work and indeed would prove to be of little help, several basic concepts provide
background for the work done using the theory of plasticity [2. ,33, 481. The yield condition
for a material is a central concept. It is a mathematical description of which stresses
are allowable. Given a set of generalized. stresses, Ql, Q2, ... Q .. the yield condition is
defined as f(Ql, Q, ... Q .. ) = O. The yield condition can be visualized as a surface in
n-dimensional space. If f,O, the point determined by the generalized stre88E8 lies within
the surface and does not give yielding. If f=O, the point lies on the yield surface and
hence yielding occurs. The condition £>0 implies a point outside the yield surface which
corresponds to stresses that cannot occur. The flow law is a second major concept in
plasticity. The flow law is defined as
('=1,2, ... n) (3.14)
where
10. 9
8
7
6 vew 5 Hc 4
2
o
Fig. 3.5
2
.,
Vew = 3.5./f~[vf + ~~] -:;.....-
---~ =3.5ftc+O.3fpe Yew
4 6 8 fpc 10 12 14 16 18
Hc Comparison of derived and approximate formulas for Eq. ( 3.10 ) [Ref. 6].
L.J o
31
q. = the generalized strain corresponding to Qi
A = a nonnegative number
The flow law governs the plastic strain changes at- constant stretr:l.
Starting from the yield condition and flow rules it is possible to derive the
theorelIlB of limit analysis. The lower bound theorem states: "A load system based on
a statically admissible stress field which does not violate the yield condition is a lower
bound on the ultimate load 1481." "A statically admissible stress distribution is a distri
bution which satisfies the equilibrium equations and the statistical boundary conditions
[331." This essentially says that any asaumed internal distribution of stresses which does
not exceed yield at any point gives a load carrying capacity leas than or equal to the
actual capacity. Use of the lower bound theorem will in all cases be conservative. The
upper bound theorem states: "A load system which is in equilibrium with a kinemati
cally ad:miasible velocity field (Le. a mechanism) is an upper bound of the ultimate load
[481." A kinematically admissible velocity field is a displacement field compatible with
the geometrical boundary conditions. A mechanism satisfying the upper bound theorem
gives a load equal to or greater than the actual capacity and is therefore unconservative.
The theory of plasticity also states that there is a unique and exact solution such that
both the upper and lower bound theorelIlB are satisfied.
The solution procedures are different for the two limit theorelIlB. Solution for
a lower bound is accomplished by use of the equations of equilibrium. Upper bound
solutions are derived by equating the external work done to the internal dissipation for
the asaumed mechanism.
While the framework for plastic analysis is in place, the quality of the results
is extremely dependent upon the quality of the constitutive equations. The constitutive
model defines the yield condition which determines failure of the plastic model. In
Figure 3.6 it can be seen that steel can be reasonably well modelled as either elastic
plastic or rigid-plastic. Concrete on the other hand does not show plastic tendencies
(Fig. 3.7). The way constitutive equations are handled by the various plastic models
will be discU88ed for each model.
3.3.2 Danish model Nielsen and his co-workers at the Technical University
of Denmark have been among the leaders in applying the theory of plasticity to shear
problelIlB [32,33,341. A number of assumptions were made in the derivation of the plastic
models. Most important are the ones dealing with the constitutive models for concrete
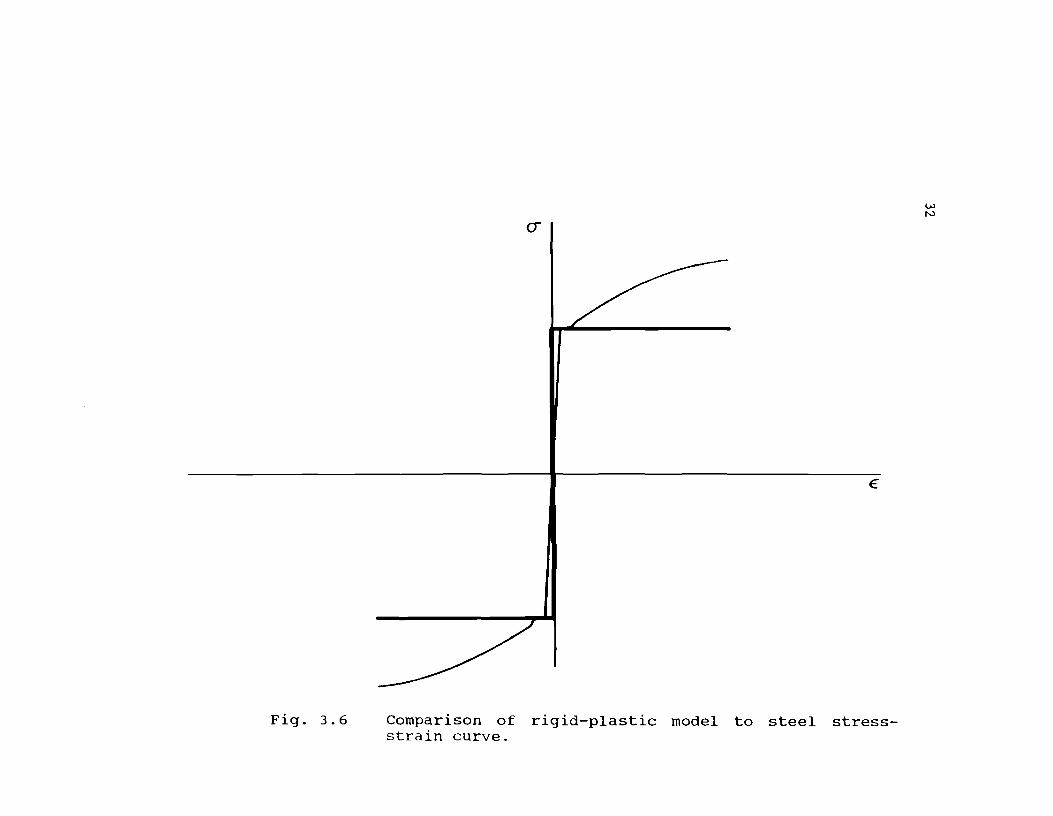
Fig. 3.6
(J
€
Comparison of rigid-plastic model to steel stressstrain curve.
I..U tv
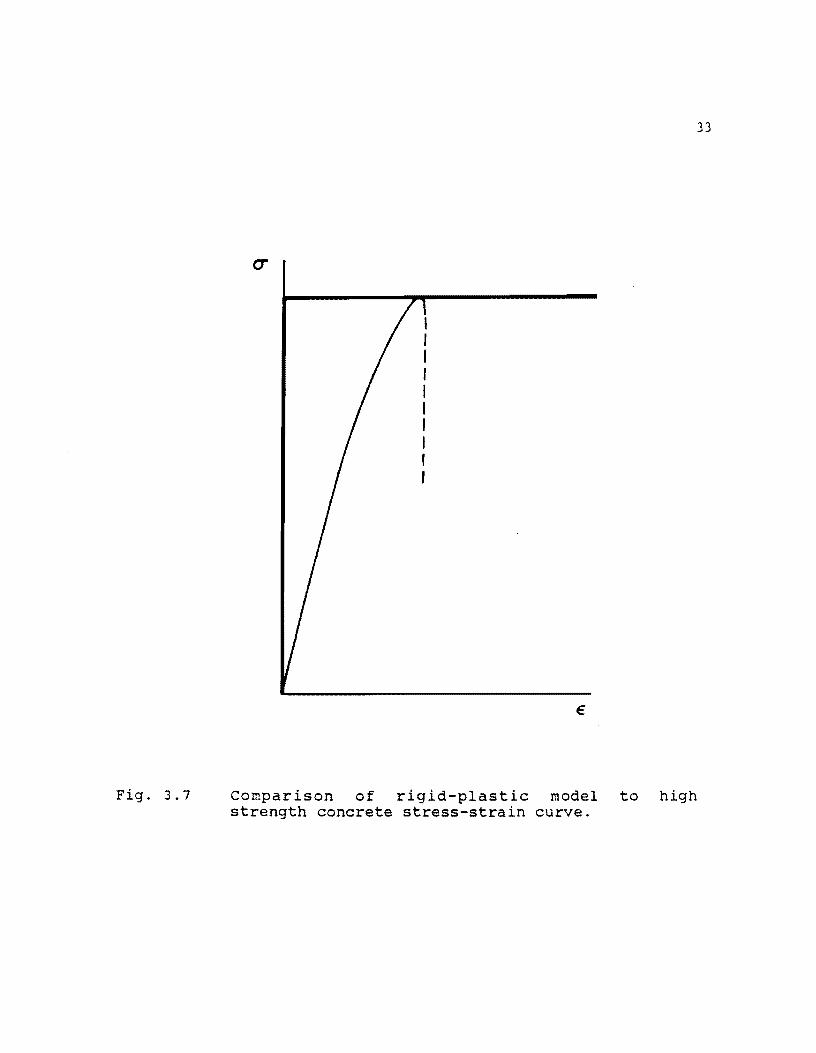
Fig. 3.7
E
Comparison of rigid-plastic model to high strength concrete stress-strain curve.
33
34
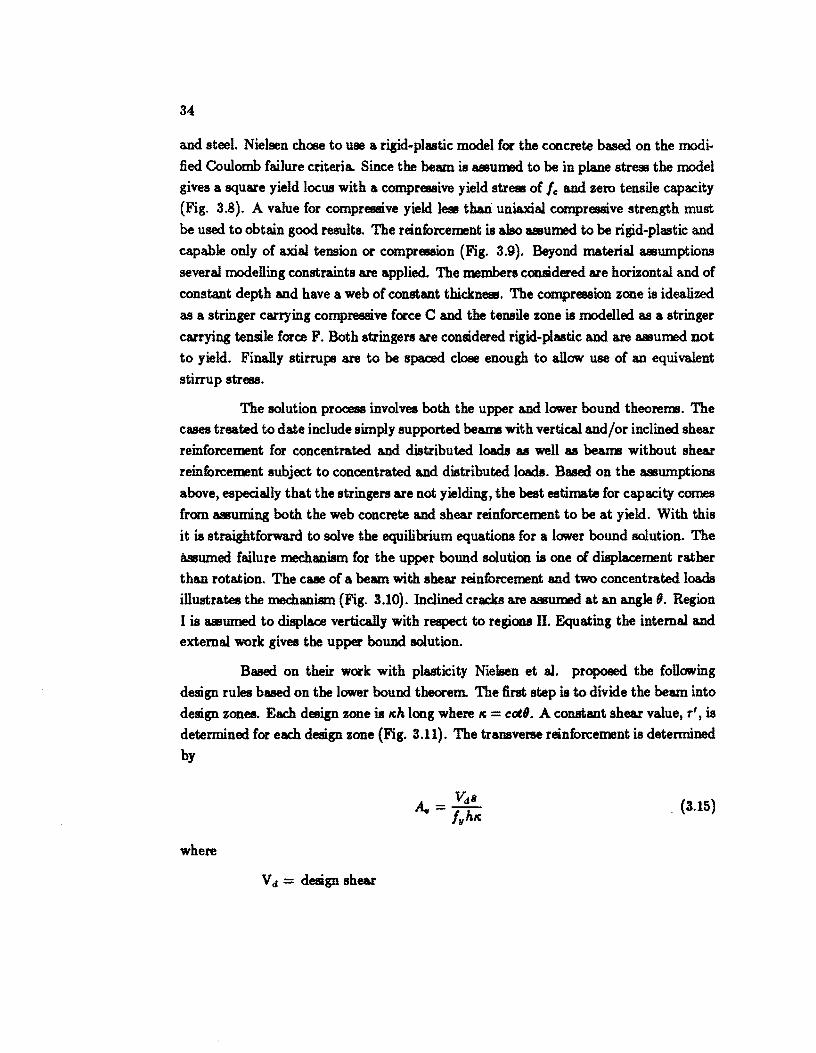
and steel. Nielsen chose to use a rigid-plastic model for the concrete based on the modi-
6ed Coulomb failure criteria. Since the beam is assumed. to be in plane stress the model
gives a square yield locus with a compressive yield stress of Ie and zero tensile capacity
(Fig. 3.8). A value for compressive yield. less than: uniaxial compressive strength must
be used to obtain good results. The reinforcement is also assumed. to be rigid-plastic and
capable only of axial tension or compression (Fig. 3.9). Beyond material assumptions
several modelling constraints are applied. The members considered are horizontal and of
constant depth and have a web of constant thickness. The compression zone is idealized
as a stringer carrying compressive force C and the tensile zone is modelled as a stringer
carrying tensile force F. Both stringers are considered rigid-plastic and are assumed not to yield. Finally stirrups are to be spaced close enough to allow use of an equivalent
stirrup stress.
The solution pr0ce88 involves both the upper and lower bound theorems. The
cases treated to date include simply supported be8Jll!l with vertical and/or inclined shear
reinforcement for concentrated and distributed loads as well as be8Jll!l without shear
reinforcement subject to concentrated and distributed loads. Based on the assumptions
above, especially that the stringers are not yielding, the best estimate for capacity comes
from Uluming both the web concrete and shear reinforcement to be at yield. With this
it is straightforward to solve the equilibrium equations for a lower bound solution. The
assumed failure mechanism for the upper bound solution is one of displacement rather
than rotation. The case of a beam with shear reinforcement and two concentrated loads
illustrates the mechanism (Fig. 3.10). Inclined cracks are UlUmed. at an angle 9. Region
I is Ulumed to displace vertically with respect to regions II. Equating the internal and
external work gives the upper bound solution.
Based on their work with plasticity Nielsen et al. proposed the following
design rules based on the lower bound theorem. The first step is to divide the beam into
design zones. Each design zone is leh long where Ie = cat'. A constant shear value, r' , is
determined for each design zone (Fig. 3.11). The transverse reinforcement is determined
by
. (3.15)
where
V d = design shear
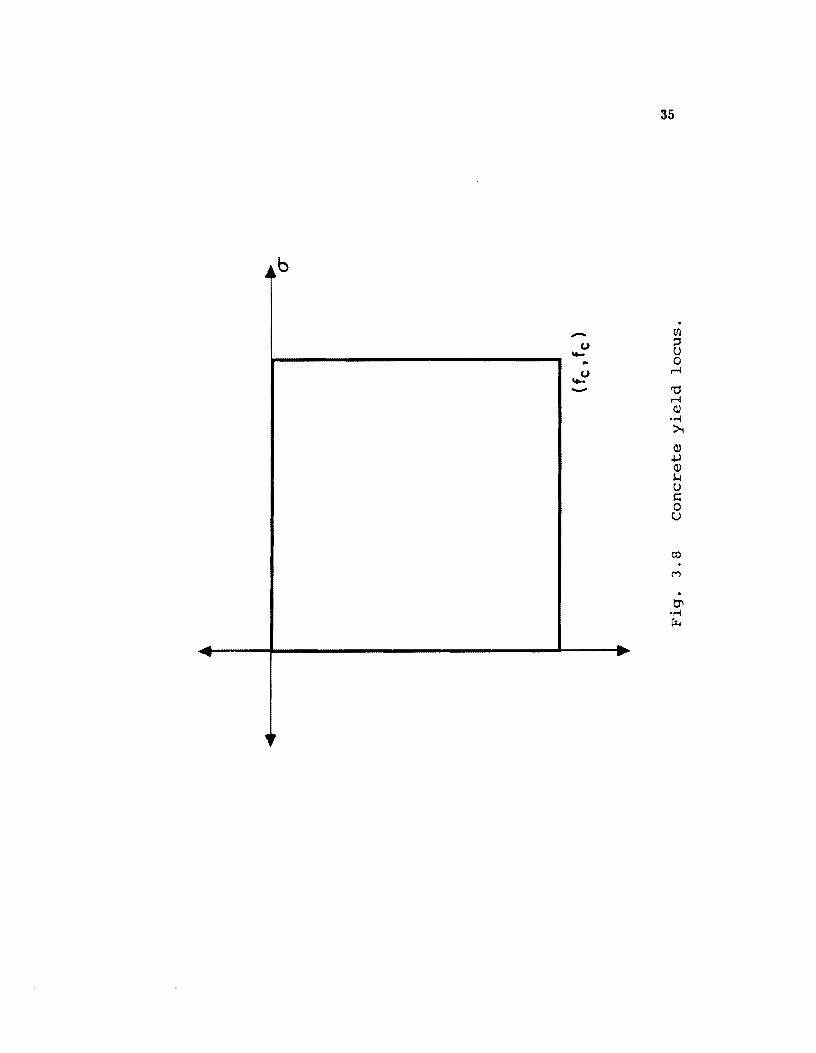
-u L-_________________________________ ---, ~ -
..... po
35
co
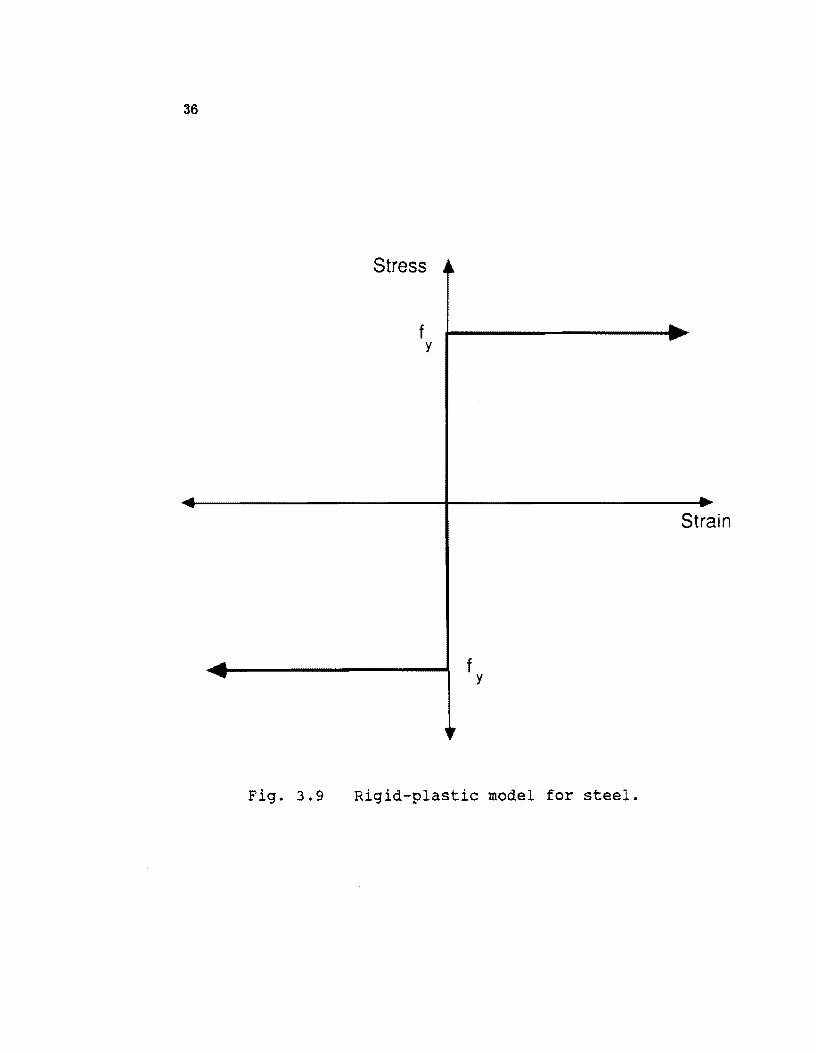
36
Stress
f y
f y
Fig. 3.9 Rigid-plastic model for steel.
Strain
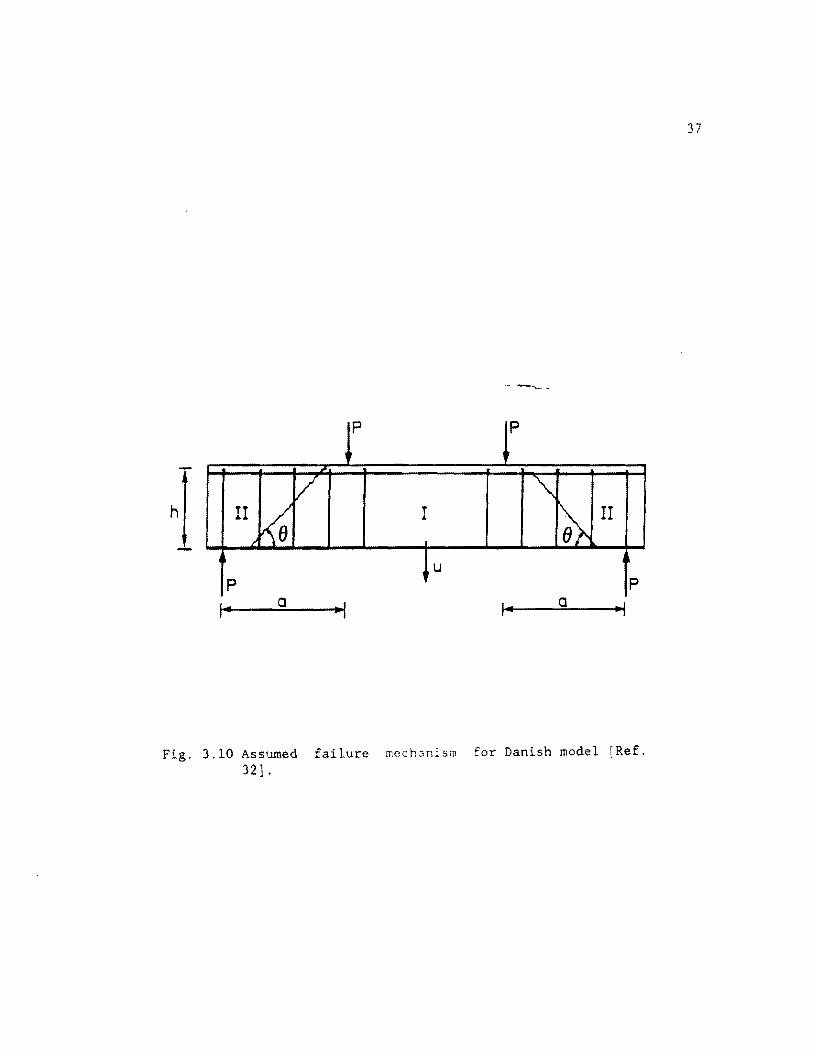
-- ---p p
v "-II k8' I ~ II ,-
u p p
a "I
a "I
Fig. 3.10 Assumed failure mechanism for Danish model [Ref. 32] •
37
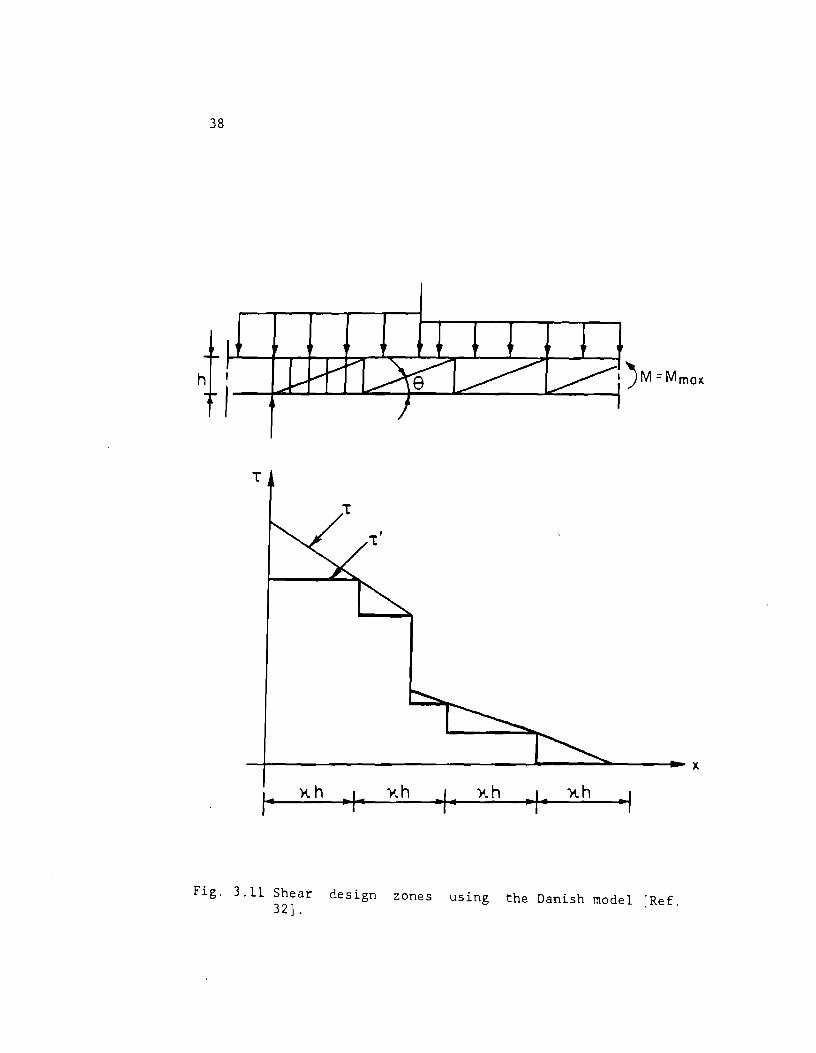
38
h
-l----------------------~----~----~x xh xh xh xh
Fig. 3.11 Shear design zones using the Danish model [Ref. 32] .
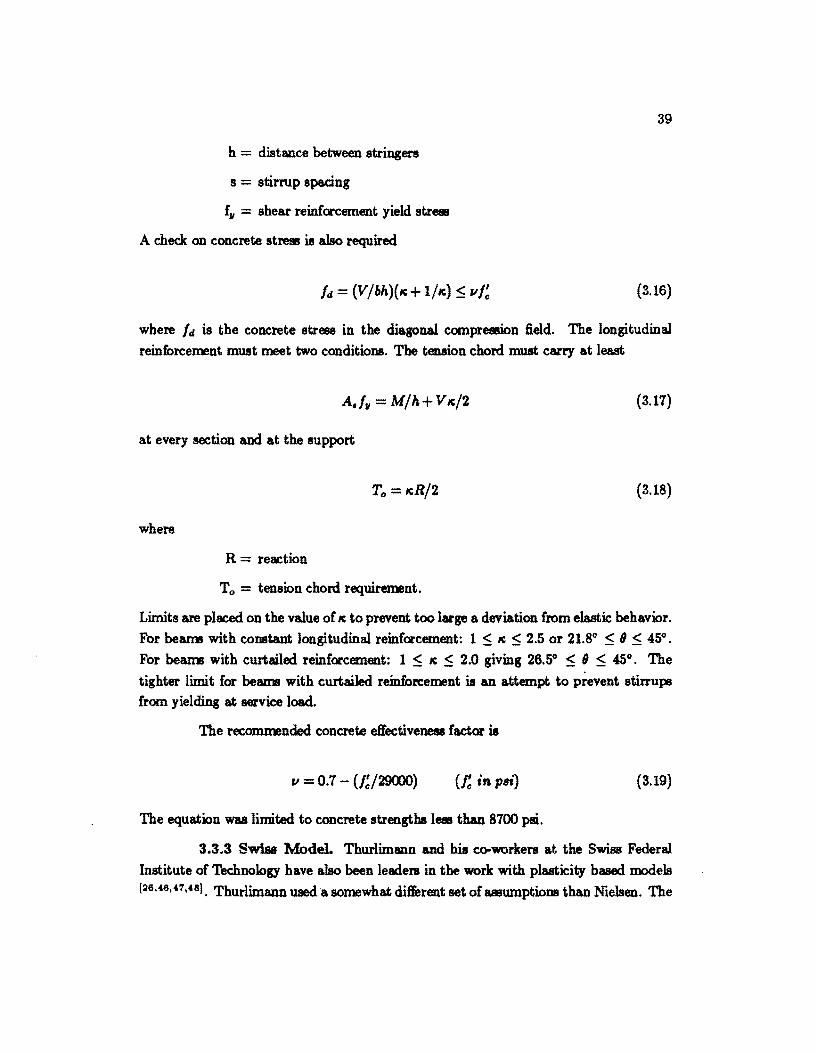
h = distance between stringers
s = stirrup spacing
f., = shear reinforcement yield stress
A check on concrete stre9J is a1so required
39
(3.16)
where /d. is the concrete stress in the diagonal compression field. The longitudinal
reinforcement must meet two conditions. The tension chord must carry at least
(3.17)
at every section and at the support
(3.18)
where
R = reaction
To = tension chord requirement.
Limits are placed on the value of It to prevent too large a deviation from elastic behavior.
For be&l1J3 with constant longitudinal reinforcement: 1 :::;; It :::;; 2.5 or 21.8" :::;; , :::;; 45".
For be&l1J3 with curtailed reinforcement: 1 :::;; It :::;; 2.0 giving 26.5" :::;; , :::;; 45". The
tighter limit for beams with curtailed reinforcement is an attempt to p~event stirruPJ from yielding at service load.
The recommended concrete eft'ectiveDe88 factor is
II = 0.7 - (/!/29WJ) (fc in psi) (3.19)
The equation was limited to concrete strengths less than 8700 pai.
3.S.S Swiea ModeL Thurlimann and his cc>worke1'8 at the Swi88 Federal
Institute of Technology have a1so been leaders in the work with plasticity based models
1:36 •• 6 •• 7.<&8). Thurlimann used a somewhat different set of assumptions than Nielsen. The
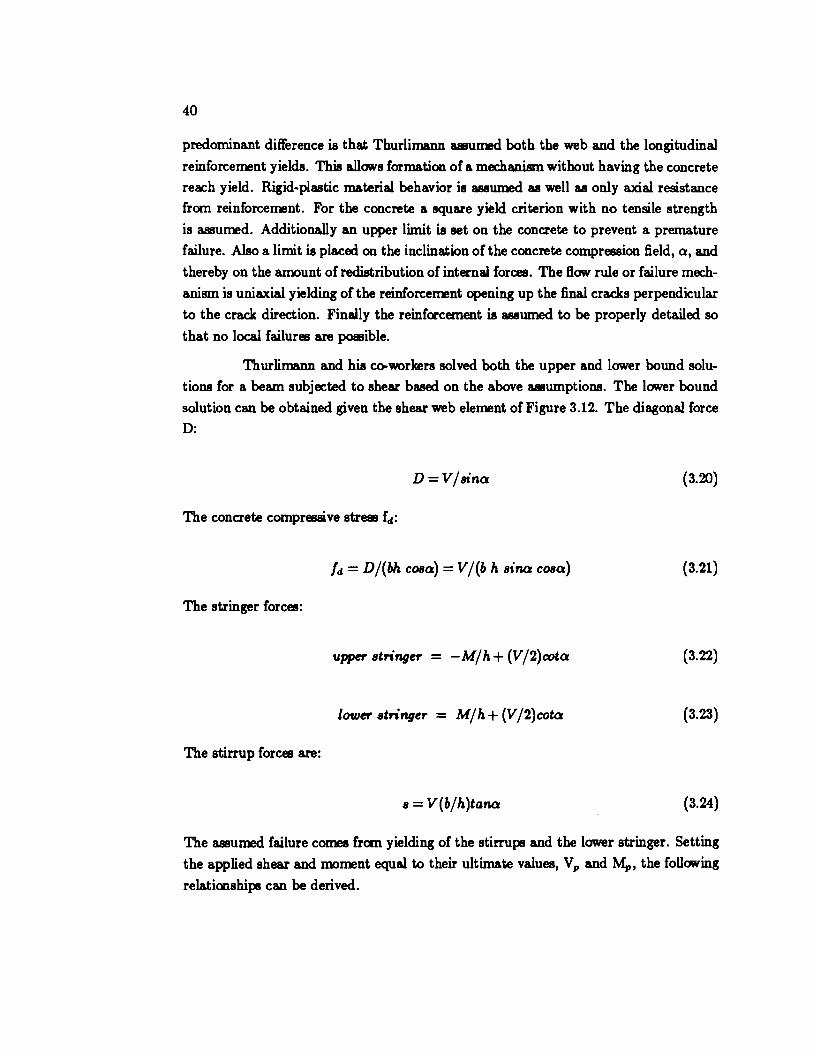
40
predominant difference is that Thurlimann assumed both the web and the longitudinal
reinforcement yields. This allows formation of a mechanism without having the concrete
reach yield. Rigid-plastic material behavior is assumed as well as only axial resistance
from reinforcement. For the concrete a square yield criterion with no tensile strength
is assumed. Additionally an upper limit is set on the concrete to prevent a premature
failure. Also a limit is placed on the inclination of the concrete compression field, a, and
thereby on the amount of redistribution of internal forces. The flaw rule or failure mech
anism is uniaxial yielding of the reinforcement opening up the final cracks perpendicular
to the crack direction. Finally the reinforcement is assumed to be properly detailed so
that no local failures are possible.
Thurlimann and his cc>workers solved both the upper and lower bound solu
tions for a beam subjected to shear based on the above assumptions. The lower bound
solution can be obtained given the shear web element of Figure 3.12. The diagonal force
D:
D=V/sina (3.20)
The concrete compressive stress f .. :
/ .. = D/(bh. c08a) = V/(b h sina c08a) (3.21)
The stringer forces:
upper stringer - -M/h+ (V/2)cota (3.22)
lower stringer = M/h+ (V/2)cota (3.23)
The stirrup forces are:
s = V(b/h)tQna (3.24)
The assumed failure comes frem yielding of the stirrups and the lower stringer. Setting
the applied shear and moment equal to their ultimate values, Vp and M", the following
relationships can be derived.
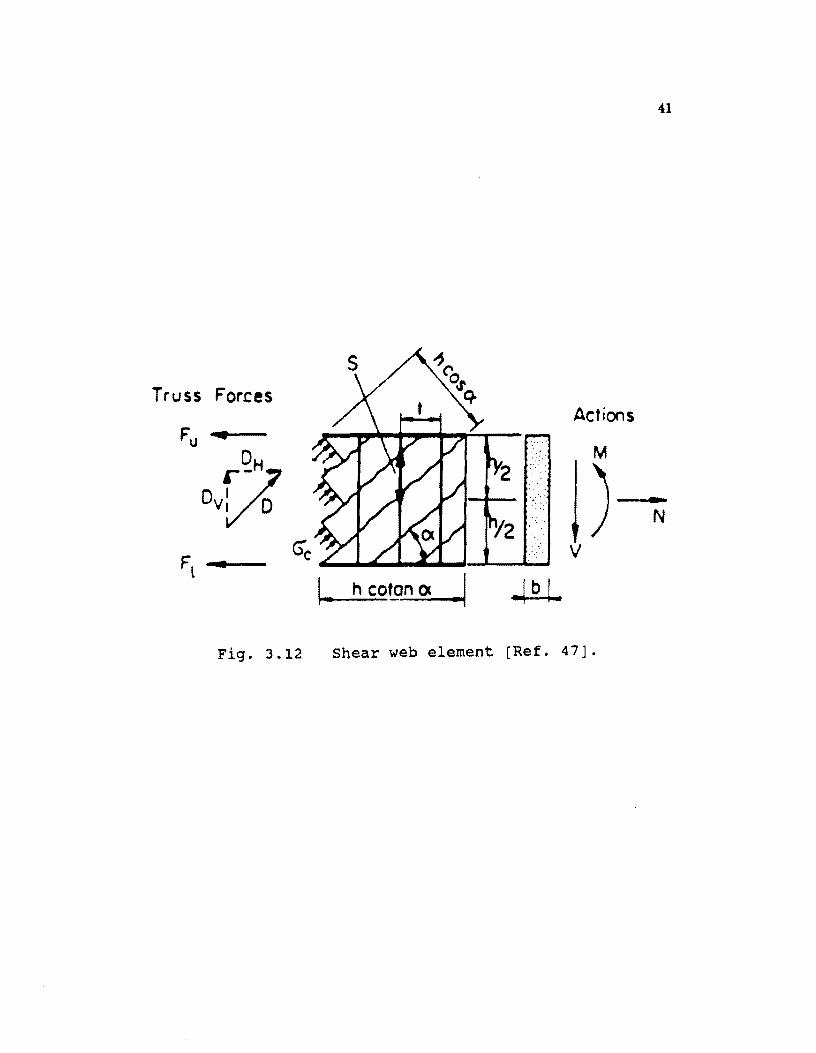
41
Truss Forces Actions
M
)---N v
~_ hcoto~
Fig. 3.12 Shear web element [Ref. 47].
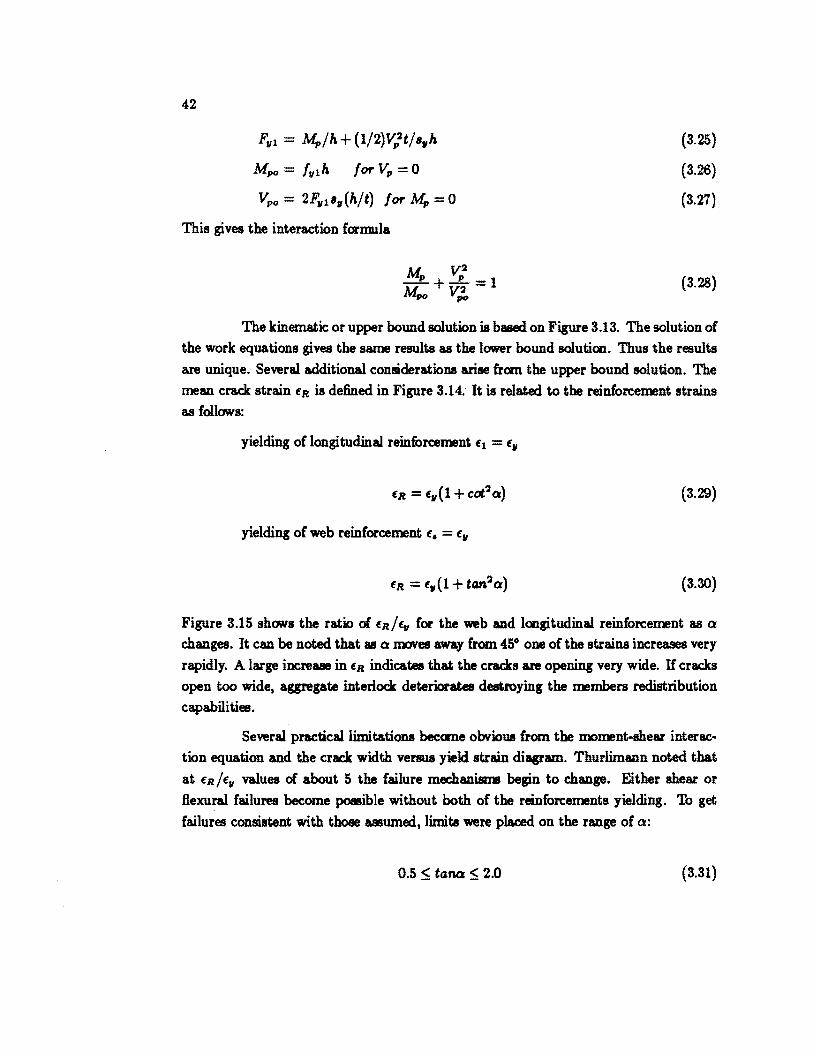
42
Fill = Mp/h+ (1/2)V;t/s"h
Mpo = flllh for vp = 0
Vpo = 2F"lS,,(h/t) for Mp = 0
This gives the interaction forlJllla
(3.25)
(3.26)
(3.27)
(3.28)
The kinematic or upper bound solution is baaed on Figure 3.13. The solution of
the work equations gives the same results as the lower bound soluticn. Thus the results
are unique. Several additional considerations arise fram the upper bound solution. The
mean crack strain (R is defined in Figure 3.14. It is related to the reinCorcement strains
as follows:
yielding of longitudinal reinforcement (1 = £"
(3.29)
yielding of web reinforcement (. = ("
(3.30)
Figure 3.15 shows the ratio of (R/f:" for the web and lcngitudinal reinforcement as a changes. It can be noted that 88 a moves away from 45° one of the strains increases very
rapidly. A large increase in (R indicates that the cracks are opening very wide. If cracks
open too wide, aggregate interlock deteriorates destroying the members redistribution
capabilities.
Several practical limitations became obvious from the moment-shear interac
tion equation and the crack width versus yield strain diagram. Thurlimann noted that
at (R/£" values of about 5 the failure mechanisms begin to change. Either shear or
flexural failures become possible without both of the reinforcements yielding. To get
failures consistent with those aasumed, limits were plac:ed on the range of a:
0.5 S tana S 2.0 (3.31)
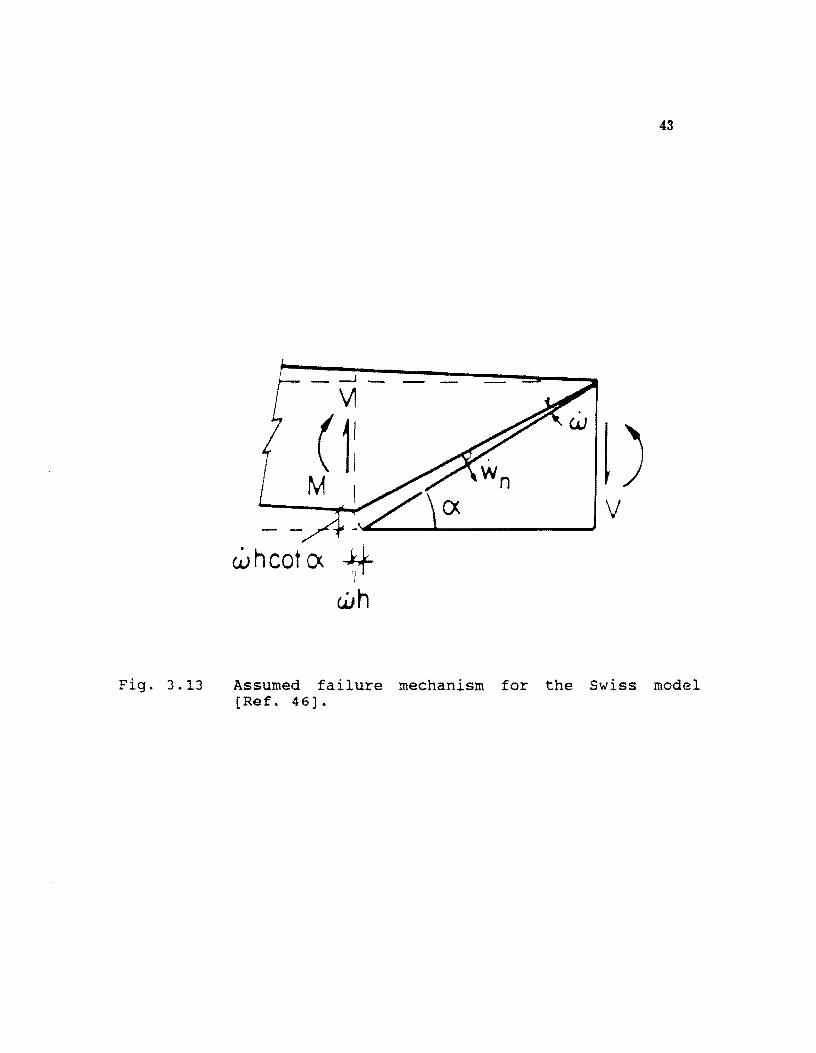
_ --l
V1
( 1: M
whcoto. ~1 iii wh
43
v
Fig. 3.13 Assumed failure mechanism for the Swiss model [Ref. 46].
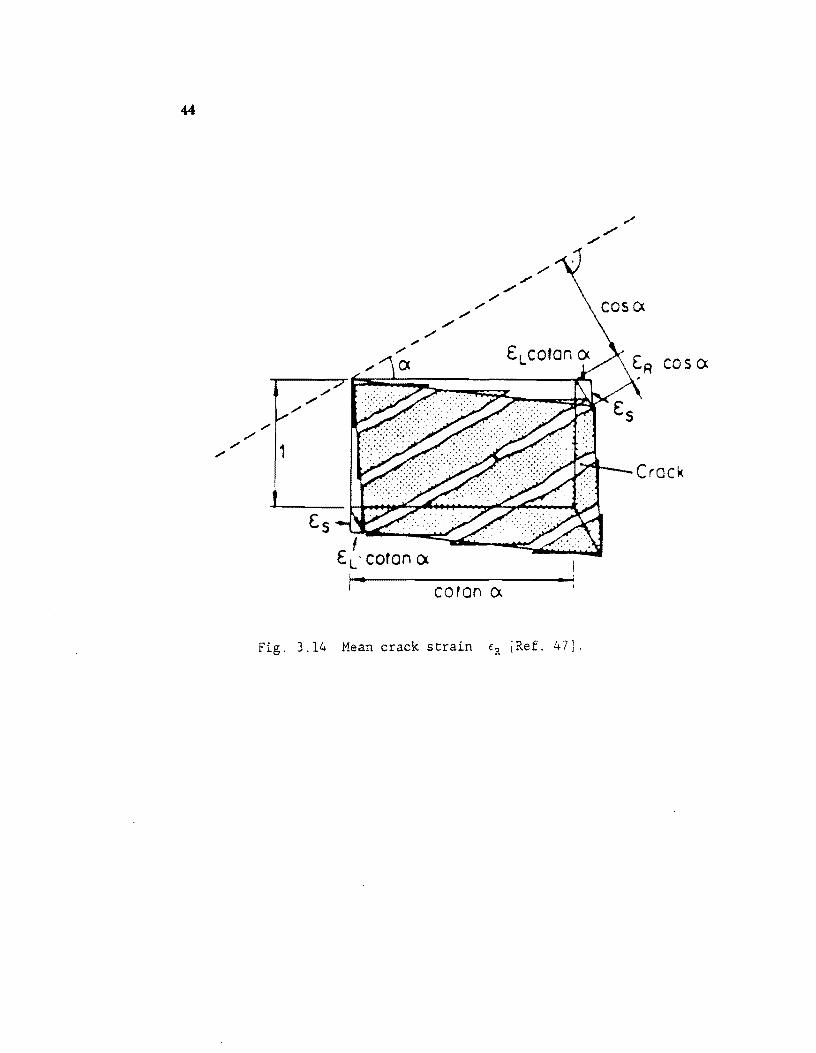
44
cos ex
t Cs
I E L' coron ().
•• coron ex
Fig, 3.14 Mean crack strain tR [Ref. 47].
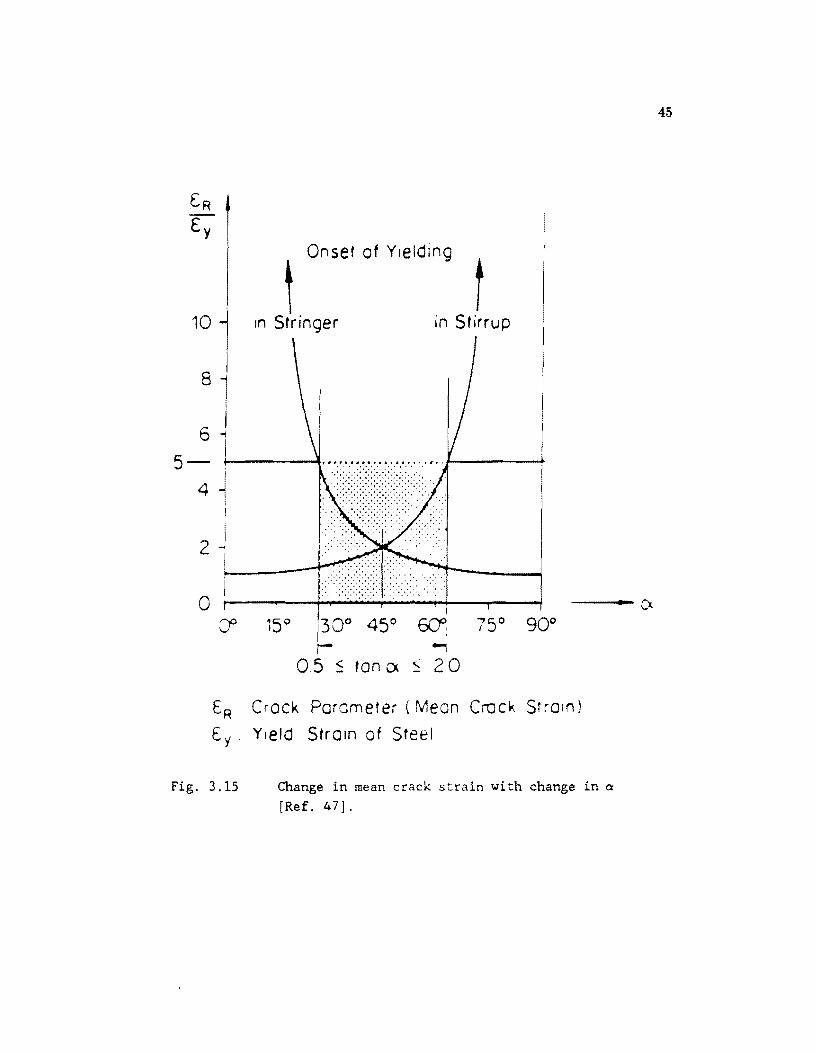
t Onsel of Yielding t In Stringer in Sr irrup
o ~I ____ ~~~~--~--~~ --... - ().
Cf ~oo 45° ~
05 ~ ran ex ~ 20
ER . Crack Parameter (Mean Crock Strain)
E y: Yield Srraln of Steel
Fig. 3.15 Change in mean crack strain with change in Q
[Ref. 47].
45
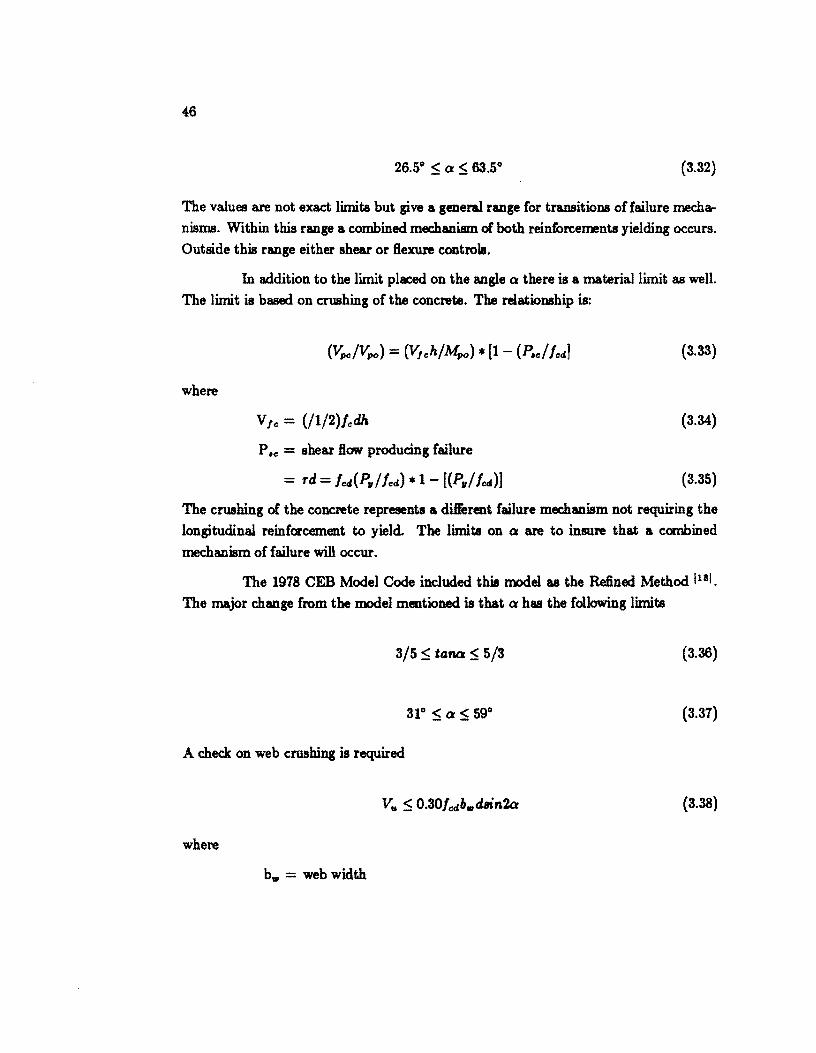
46
(3.32)
The values are not exact limits but give a general range for transitions of failure mecha
nisms. Within this range a combined mechanism c:l both reinforcements yielding occurs.
Outside this range either shear or flexure controls.
In addition to the limit placed on the angle a there is a material limit as well
The limit is based on crushing of the concrete. The relationship is:
(3.33)
where
(3.34)
p.e = shear flaw producing failure
(3.35)
The crushing of the concrete represents a different failure mechanism not requiring the
longitudinal reinforcement to yield. The limits on a are to insu.re that a combined
mechanism of failure will occur.
The 1978 CEB Model Code included this model as the Refined Method 1181.
The major change from the model mentioned is that a has the following limits
3/5 S tana S 5/3 (3.36)
(3.37)
A check on web crushing is required
(3.38)
where
b., = web width
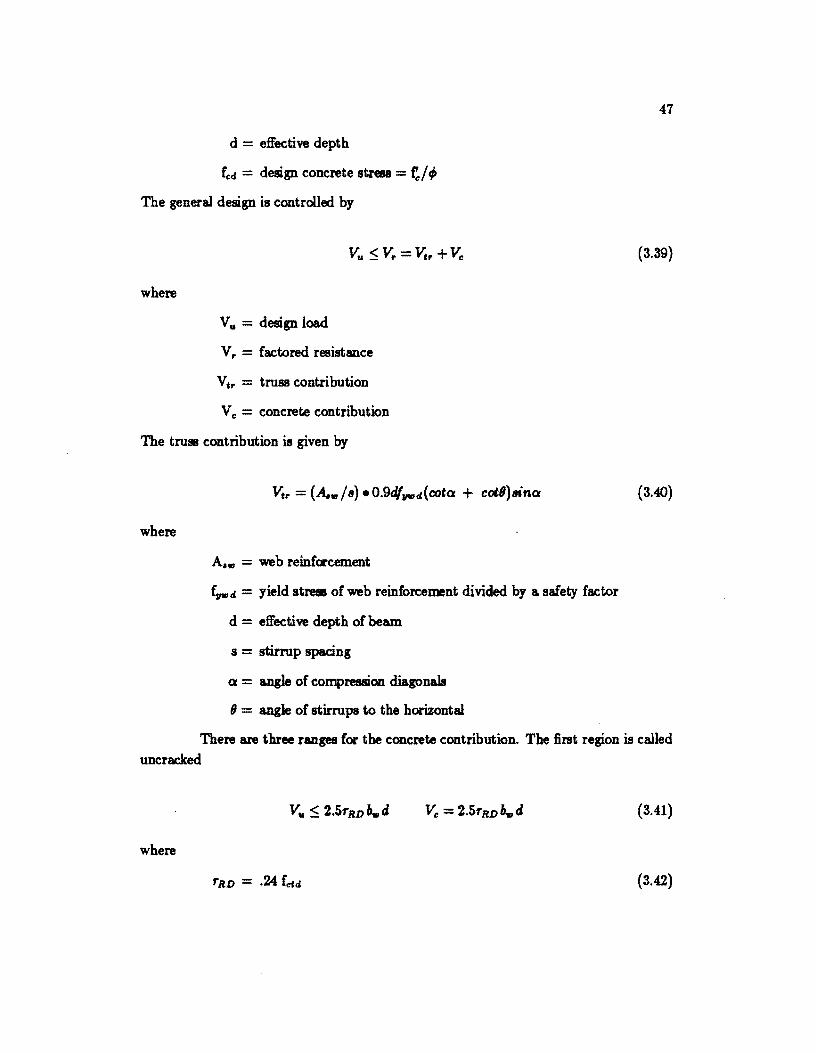
d = effective depth
fed = design concrete stress = ~ / t/>
The general design is controlled by
where
v u. = design load
V,. = factored resistance
Vt ,. = tI'1l88 contribution
v c = concrete contribution
The truss contribution is given by
where
A,. = web reinfcrcement
fJlfDd = yield streI!IB of web reinforcement divided by a safety factor
d = effective depth of beam.
s = stirrup spacing
a = angle of compression diagonals
(J = angle of stirrups to the horizontal
47
(3.39)
(3.40)
There are three ranges for the concrete contribution. The first region is called uncracked
(3.41)
where
(3.42)
48
fdd = design concrete tensile strength
= tensile strength divided by resistance safety factor
The next region is the transition zone
The last region is the full truss zone:
(3.43)
(3.44)
Finally there is a provision to increase the longitudinal reinforcement over the value
required for ftexure by the amount
A J:I _ v.~s v: ~.t"U - 2 A I d' - .dcota
n... Ipd slna (3.45)
where
Vie' = design shear force
~Fu = design stress of longitudinal reinforcement
S.S.4 Diagonal compression field theory. Diagonal compression field the
ory has its origin in plasticity models such as that of Thurlimann (115,16,17). Collins and
his co-workers, however, diverged !rem strict application of the theory of plasticity. The
major assumption is that concrete can carry no tension and that the shear will be carried
by a diagonal compression field. At this level all three plasticity models are the same.
Rather than formally following the limit analysis theorems of plasticity, Collins et al.
chose to develop a procedure where equilibrium and compatibility are satisfied at all load
stages rather than just at ultimate. The procedure is analogous to a momenkurvature
analysis for ftexure.
Diagonal comprefl!Jion field theory requlles that appropriate relations for
stresses, strains, and constitutive equations be determined. For this work the stresses
are assumed to act over an effective area defined by 6.id where 6. is web width and
jd is the effective depth for shear. The model requires the presence of stirrups. From
49
equilibrium considerations three generalized str ... are deri'Ved tTc, average transverse
compressive streaJ, tT, average longitudinal compressive stress, and /d average principle
compressive stress. Each of these average stre.ee can be written in terms of an average
shear streaJ, v, and the angle of inclination of fd to the horizontal, a where
v = V /(b.,jd) (3.46)
and V = total applied shear
The average strains are considered in a similar manner. The compatibility condition can
be stated as
where
E, = average value of longitudinal tensile strain
Ec = average value of transverse tensile strain
Ed = average value of principal compressive strain
(3.47)
For the diagonal compreaJion field to work, the average streaJ must be tied to the av
erage strain through constitutive equati0D8. For steel the average streal-average strain
relati0D8hips can be pictured as elaati~plastic. The use of elaati~plastic relationships
are required if compatibility is considered since rigid-plaatic materials only deform at
yield. The concrete constitutiw equations are, 81 always, more subject to uncertainty. Several suggestions have been made as to the proper model for this use. Reference [11J
had two relationships given for an average concrete modulus. The recommended one
was simply a straight line function whose value was the crushing strength of concrete divided by the strain at peak streaJ. In the same paper the limit on concrete stress was determined as a function of the diameter of the Mohr's circles for streat and strain at
ultimate. It was felt that size of the stress circle that causes failure is related to the size of the coexisting strain circle. Reference [1411 carried the upper limit out to the following
simple expression
(3.48)
where
50
f"" = limiting concrete stress
£" = 0.002 aaJumed
More recently the following constitutive equations were proposed [491.
where
lc2maa _ 1 < 1.0 I~ 0.8 - 0.34(£1/£0) -
fc2 = principle compressive stress in concrete
£2 = principle compressive strain in concrete
£1 = principle tensile strain in concrete
£0 = strain at peak concrete stress
(3.49)
(3.50)
(3.51)
That equation also had prc:wisims for considering tensile strength of concrete. The ac
curacy of the concrete constitutive model effects the capabilities of diagonal compression field theory.
Given the preceding relationships it is poIBible to determine full behavior of members subject to shear. Collins considered three phases of behavior. The Brst is prior to steel yielding. Compression field theory can predict the angle of the initial cracks. The next stage of behavic:r had the transver8e lteel yielding. This is followed. by a change in Q up to the ultimate load. Compresalon field theory allowl failure to be caused by either yielding of the longitudinal reinforcement or by crushing of the web. It is poIBible to track through beam behavior from zero load to ultimate and to determine the failure mechanism all using compreuion field theory.
Compression field theory formed the basis of the General Method in the 1984 Canadian Code [211. That Code is set up 80 that a design is acceptable if it satisfies a series of Code provisions. The angle of the diagonal compression strut I (J, can be chailen as 6I1y valUE: between 15/1 and 75°. To prevent premature diagonal crushing
where
f, = tanl + (l/tanl)](V, /b.d.)
f'mGs = At;c/!/(0.8 + 1'lO€1) S ~./!
unless concrete is triaxially confined
V, = factored shear force at section
b" = minimum effective web width within depth d.
51
(3.52)
(3.53)
(3.54)
(3.55)
d. = effective shear depth, which can be taken as the distance, measured perpendicular to the neutral axis, between the resultants of the tensile and compressive forces due to flexure but need not be taken leas than 0.9 d.
A = factor to account for lOW' density concrete
t;c = resistance factor for concrete
In Equation (3.55) E'x may be taken as 0.002 or calculated from a plane section analysis under factored loads. H
(3.56)
b.., may be used for b •.
To insure yielding of the transverse reinforcement
E't > 1,/ E. (3.57)
where E't = E'1 - E'x - 0.002 (3.58)
The transverse reinfOlcement is designed 80 that
52
where
(3.59)
(3.60)
Au = area of shear reinforcement perpendicular to the axis of a member
within a distance, s
f1/ = specified yield streIB of nonprestreased reinforcement
s = spacing of shear reinforcement measured parallel to the longitudinal
axis of the member
? = resistance factor for reinforcement
?p = resistance factor for prestrelBing tendms
V p = component in the direction of the applied shear of the effective pre
strelBing force.
An additional aImunt of longitudinal reinforcement over that needed for flexure alone
is required at a section. The added tensile load, N", is
(3.61)
The Canadian Code h. two added aectiona in the General Method. The
first is for handling probleIDI near geometric discontinuities or concentrated loads. The
procedure calls for the use of concrete struts and tension ties joined at. nodal regions.
Provisions are given for allowable streBSeI. This type of model will be discussed further
in Section 3.4.2 The second added provision is one on serviceability. This is included to
ensure reasonably small crack widths at service loads.
3.4 Truss Models
3.4.1 RamiN .. In recent work done at the University of Texas Ramirez and
Breen proposed a design procedure baaed on the tnlll model. The work was baaed on
the plasticity models previously discussed but principally on the work of Thurlimann.
In Ramirez)s work the emphasis was shifted from the plasticity baaed proofS to the
conceptual use of a truss model to shaw the flaw of forces. The detailed work was
53
reported in Referencea [38.30.4°1 and only a briefsummary of the conceptual basis and
design procedures will be given herein.
The basic asaumptions for the truss model are the same as used by Thurlimann.
Yielding of both the longitudinal and transverse reinforcement is required. This requires
an upper limit on the diagonal concrete stresses to prevent crushing. The reinforcement
can only resist axial loads. The reinforcement is properly detailed so that local crushing
and bond failures are prevented.
The truss model can be used in a six step design procedure. The first step
is to pick an appropriate truss system for the loading and support conditions under
consideration. This basically entails dividing the beam into convenient design segments.
The second step requires asawnmg an angle for the compression diagonal inclination, Q.
Acceptable values are 25° :::; Q :::; 65° and a value which fits the truss system should be
chosen. The lower Q values require leas shear reinforcement. The next step is to check
the concrete streas in the compression diagonals. This is to insure that web crushing
does not occur. The web reinforcement can then be calculated. Consideration needs to
be given to spacing limits and to make certain mininmm reinforcement values are met.
The area of longitudinal reinforcement must be calculated for the combined actions of
flexure and shear. Finally, all reinforcement must be properly detailed. Since the model
relies on both web and longitudinal reinforcement reaching yield, poor details resulting
'in premature failure would be extremely serious.
Numerical guidelines were added to the conceptual framework given above.
The member's shear resistance comes from three components, the concrete contribution
Ve , the truss contribution Vi,., and the component in the direction of applied shear
of the effective prestress force Vp • The model is equally applicable to reinforced and
prestretlled concrete. The angle of inclination for the compression diagonals is
(3.62)
The compressive stress in the compression diagonals, t. shall be less than
30J]! where:
(3.63)
54
z = distance between stringers
The concrete contribution can be calculated 88
a) reinforced concrete members
b) prestressed concrete members
where
Vc = (K/2)[(4+2K)J/! - ""Ib.,z
but 0 S Vc S 2KViib.,z
(3.64)
(3.65)
(3.66)
but 1.0 S K S 2.0 and K=1.0 if stre. at extreme tension fiber at
the section exceeds 6Vfc due to the computed ultimate load and the
applied effective prestrese force.
If V" exceeds IVlIb.,z then minimum web reinforcement equal to
must be added. The truss contribution is given by
Vir ;:::; (S"zl/[tOnQ.']
where
SIt = total stirrup force over spacing s
The bottom reinforcement is calculated by
(3.67)
(3.68)
(3.69)
55
Additional detailing requirements as well as provisions for torsion can be found in Reference (301.
3.4.2 Strut aDd tie modeL Schlaich et aI. at the Institut fur Massivbau at
Stuttgart have a more refined truss model called the strut and tie model (.2]. The strut
and tie model condenses &ll stresses into compn!l8ion and tension members and joins
them by nodes. The model is based on the lower bound theory of plasticity. The authors
themselves describe the method as ODe of sufficient, not perfect, accuracy. The real aim
of the strut and tie method is to determiDe the ftow of forces in a member. Given this
flow of forces, struts and ties can be sized to cover the required forces. In this way the
entire structure can be designed for a consistent level of safety.
The strut and tie model defines two types of regions in a structure. The ~
regions are areas where the internal state of stress can easily be derived from sectional
forces such as moments, shears, and axial forces. In these regions stresses can be cal
culated based on section properties up to cracking. In the cracked state a normal truss
model gives the desired results. The second type is the D- region. The D-regions include
&ll areas where the strain distribution is significantly nonlinear such as at concentrated
loads, corners, openings, etc. In the uncracked state such regions can be designed based
on linear elastic stress analysis. In the cracked state typical current design is based
on "experience" or "standard practice." The strut and tie model &llows a reasonable
design of such regions since the compression and tensile forces are followed throughout
the region. From this it can be seen that the strut and tie model is an extension or the
truss model.
The strut and tie model &llows for a consistent design of the entire structure.
A first step is to perfcrm a sufficiently accurate structural analysis. Schliach et aI. had
several suggestions for appropriate types of analysis. The structure should also be broken up into B and D-regiona. In general, D-regions extend a distance approximately equal to
the effective depth of the member on either side of the discontinuity. The ~regions may
be dimensioned using the results from the structural analysis and the truss model. The
D- regions are where the true advantages or the strut and tie model become apparent.
Using the sectional forces that occur at the edge of the D-region and any externally applied forces a ftow path needs to be developed. The recommendation is to adapt "the
struts and ties of the model to the direction and size of the internal forces as they would
a.ppear from the theory of elasticity." This provides for adequate serviceability as well
as a conservative estimation of ultimate capacity. The loadpaths should begin and end
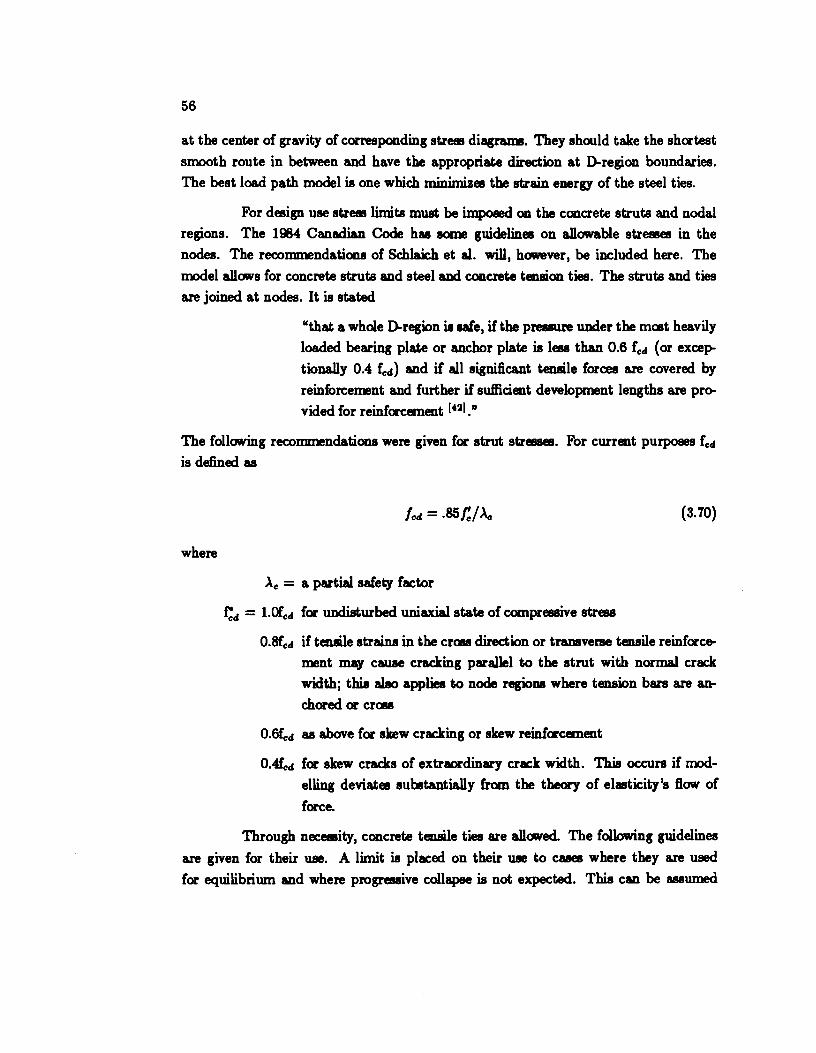
56
at the center of gravity of corresponding stress diagrams. They should take the shortest
smooth route in between and have the appropriate direction at D-region boundaries.
The best load path model is one which minimizes the strain energy of the steel ties.
For design use stress limits must be imposed on the concrete struts and nodal
regions. The 1984 Canadian Code hu I!IOIDe guidelines on allowable stresses in the
nodes. The recommendations of Schlaich et al. will, however, be included here. The
model allows for concrete struts and steel and concrete tension ties. The struts and ties
are joined at nodes. It is stated
"that a whole D-region is safe, if the pressure under the mast heavily
loaded bearing plate or anchor plate is less than 0.6 fed (or excep
tionally 0.4 td) and if all significant tensile forces are covered by
reinforcement and further if sufficient development lengths are provided for reinforcement [4~1."
The following recommendations were given for strut stresses. For current purposes fed
is defined as
where
(3.70)
le = a partial safety factor
f;d = 1.00ed for undisturbed uniaxial state of compressive stress
O.Bfed if tensile straina in the crC118 direction or transverse tensile reinforce
ment may cause cracking parallel to the strut with normal crack
width; this also applies to node regions where tension bars are an
chored or crOll8
O.6fed as above for skew cracking or skew reinforcement
O.Med for skew cracks of extraordinary crack width. This occurs if mod
elling deviates substantially from the theory of elasticity's flow of
force.
Through necessity, concrete tensile ties are allowed. The following guidelines
are given for their use. A limit is placed on their use to cases where they are used
for equilibrium and where progressive collapse is not expected. This can be assumed
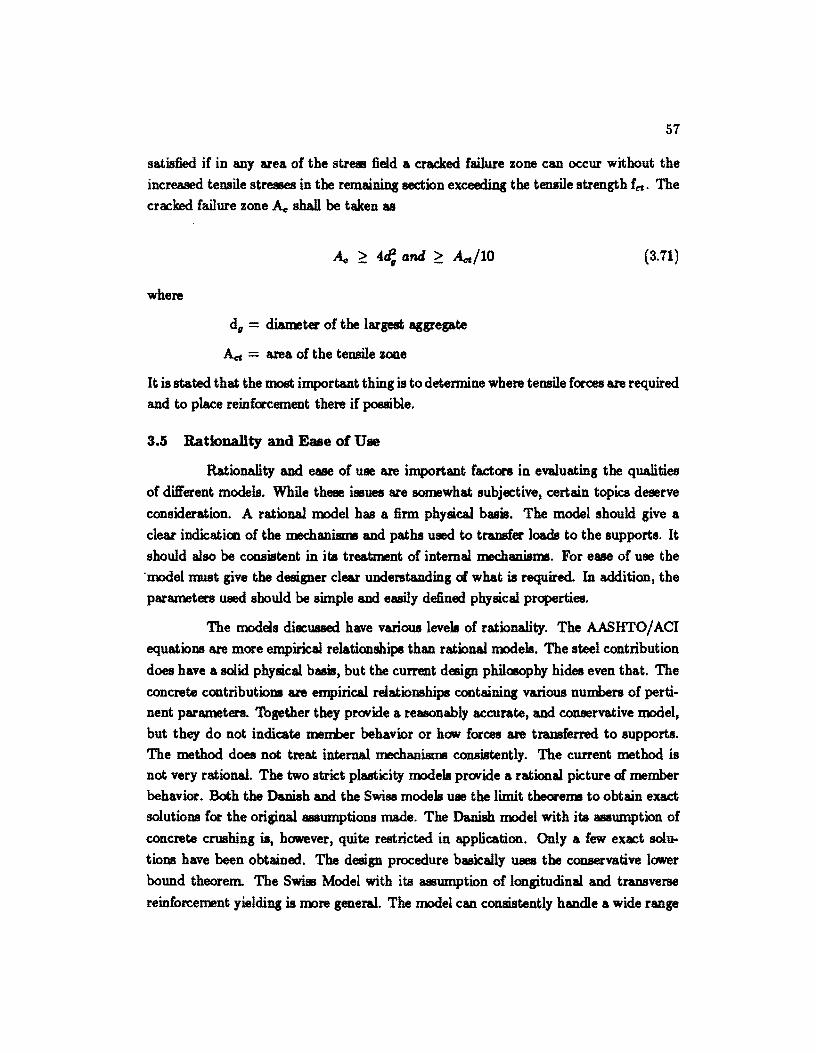
57
satisfied if in any area of the streas field a cracked failure zone can occur without the
increased tensile streases in the remaining section exceeding the tensile strength fet • The
cracked failure zone A" shall be taken as
where
d, = diameter of the largest aggregate
A.:c = area of the tensile zone
(3.71)
It is stated that the most important thing is to detennine where tensile forces are required
and to place reinfc:rcement there if possible.
3.5 Ratlonallty and Ease of Use
Rationality and ease of use are important factors in evaluating the qualities
of different models. While these issues are somewhat subjective, certain topics deserve
consideration. A rational model has a firm physical basis. The model should give a
clear indicatim of the mechanisms and paths used to transfer loads to the supports. It
should also be consistent in ita treatment of intemal mechanisms. For ease of use the
'model IllU8t give the designer clear understanding of what is required. In addition, the
parameters used should be simple and easily defined physical properties.
The models discussed have various levels of rationality. The AASlITO/ ACI
equations are more empirical relationships than rational models. The steel contribution
does have a solid physical basis, but the current design philosophy hides even that. The
concrete contributioDi are empirical relationships containing various numbers of perti
nent parameters. Together they provide a reasonably accurate, and conservative model,
but they do not indicate member behavior or how forces are transferred to supports.
The method does not treat internal mechanisms consistently. The current method is
not very rational. The two strict pluticity models provide a rational picture of member
behavior. Both the Danish and the Swise models use the limit theorems to obtain exact
solutions for the original assumptions made, The Danish model with ita assumption of
concrete crushing is, however, quite restricted in application. Only a few exact solu
tions have been obtained. The design procedure basically uses the conservative lower
bound theorem. The Swiss Model with ita assumption of longitudinal and transverse
reinforcement yielding is more general. The model can consistently handle a wide range
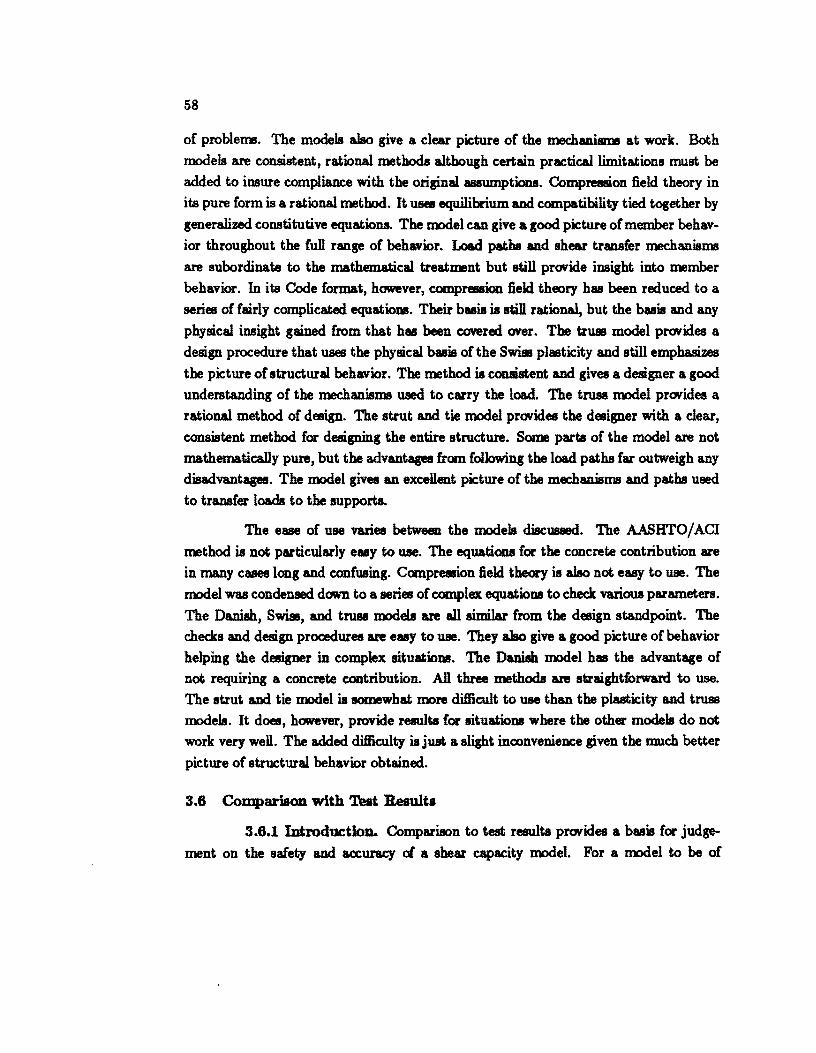
58
of problems. The models also give a clear picture of the mechanisms at work. Both
models are consistent, rational methods although certain practical limitations must be
added to insure compliance with the original assumptions. Compression field theory in
its pure form is a rational method. It uses equilibrium and compatibility tied together by generalized constitutive equations. The model can give a good picture of member behav
ior throughout the full range of behavior. Load paths and Ihear transfer mechanisms
are subordinate to the mathematical treatment but ltill provide insight into member
behavior. In its Code format, however, compreuion field theory has been reduced to a
series of fairly complicated equatio ... Their basil illtill rational, but the basis and any
physical insight gained from that has been covered over. The truss model provides a
design procedure that uses the physical basis of the SwiaJ plasticity and still emphasizes
the picture of Itructural behavior. The method iI consistent and gives a designer a good
understanding of the mechanisms used to carry the load. The trusa model provides a
rational method of design. The strut and tie model provides the designer with a clear,
consistent method for designing the entire structure. Some parte of the model are not
mathematically pure, but the advantages from following the load paths far outweigh any
disadvantages. The model gives an excellent picture of the mechanisms and paths used
to transfer loada to the supports.
The ease of use varies between the models discussed. The AASHTO/ACI
method iI not particularly easy to use. The equatiOll8 for the concrete contribution are
in many cases long and confusing. CompreIBion field theory is also not easy to use. The
model was condensed dawn to a series of complex equatio .. to check variOUl parametera.
The Danish, SwiaJ, and truBl modela are all similar from the design standpoint. The
checks and design procedures are easy to use. They also give a good picture of behavior
helping the designer in complex situatio... The Danish model has the advantage of
not requiring a concrete contribution. All three methode are straightforward to use.
The strut and tie model illOIDBWhat more difficult to use than the plasticity and trusa
models. It does, however, provide results for lituatio .. where the other models do not
work very well. The added difficulty iI just a slight inconvenience given the much better
picture of structural behavior obtained.
3.6 Comparison with Test Result.
3.6.1 IDtroductlon. Comparison to test results provides a basis for judge
ment on the safety and accuracy of a shear capacity model. For a model to be of
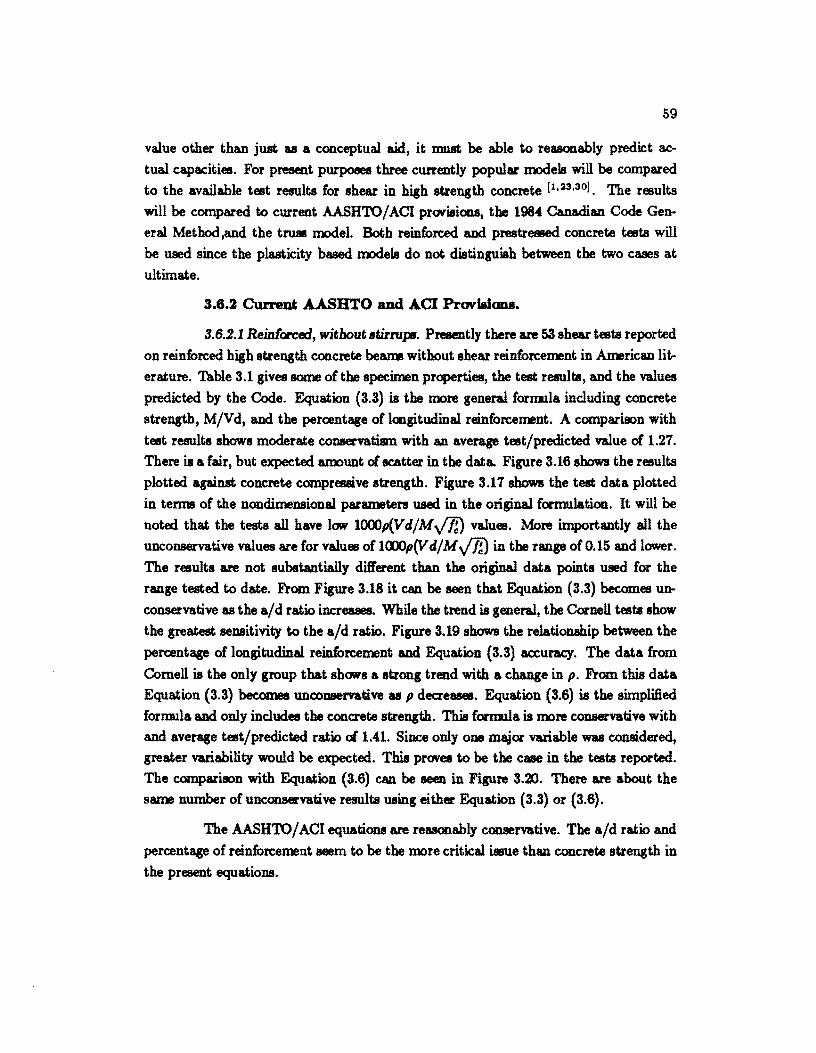
59
value other than just as a conceptual aid, it must be able to reasonably predict ac
tual capacities. For present purposes three currently popular models will be compared
to the available test results for shear in high strength concrete [1,23,301. The results
will be compared to current AASHTO/ACI provisions, the 1984 Canadian Code Gen
eral Method ,and the trwa model. Both reinforced and prestressed concrete tests will
be used since the plasticity baaed models do not distinguish between the two cases at
ultimate.
3.6.2 Current AASHTO aDd ACI Provlslcma.
3.6.2.1 Reinforeed, without stirrups. Presently there are 53 shear tests reported
on reinforced high strength concrete be&ll1! without shear reinforcement in American lit,. erature. Table 3.1 gives some of the specimen prq>erties, the test results, and the values
predicted by the Code. Equation (3.3) is the more general formula including concrete
strength, M/Vd, and the percentage of loogitudinal reinforcement. A comparison with
test results shows moderate conservatism with an average test/predicted value of 1.27.
There is a fair, but expected amount of scatter in the data. Figure 3.16 shows the results
plotted against concrete compressive strength. Figure 3.17 shows the test data plotted
in tenns of the nondimensional parameters used in the original formulation. It will be
noted that the tests all have lOW' 1000p(V d/M.;m values. More importantly all the
unconservative values are for values of 1 CJX)p (V d/ M.;m in the range of 0.15 and lower.
The results are not substantially different than the original data points used for the
range tested to date. From Figure 3.18 it can be seen that Equation (3.3) becomes un
conservative as the a/ d ratio increases. While the trend is general, the Cornell tests show
the greatest sensitivity to the aid ratio. Figure 3.19 shows the relationship between the
percentage of longitudinal reinforcement and Equation (3.3) accuracy. The data from
Cornell is the only group that shOW's a strong trend with a change in p. From this data
Equation (3.3) becomes unCODBervative as p decreases. Equation (3.6) is the simplified
formula and only includes the concrete strength. This formula is more conservative with
and average test/predicted ratio of 1.41. Since only one mador variable was considered,
greater variability would be expected. This proves to be the case in the tests reported.
The comparison with Equation (3.6) can be seen in Figure 3.20. There are about the
same number ofunconservative results using either Equation (3.3) or (3.6).
The AASHTO/ACI equations are reasonably CODBervative. The aid ratio and
percentage of reinforcement seem to be the more critical issue than concrete strength in
the present equations.
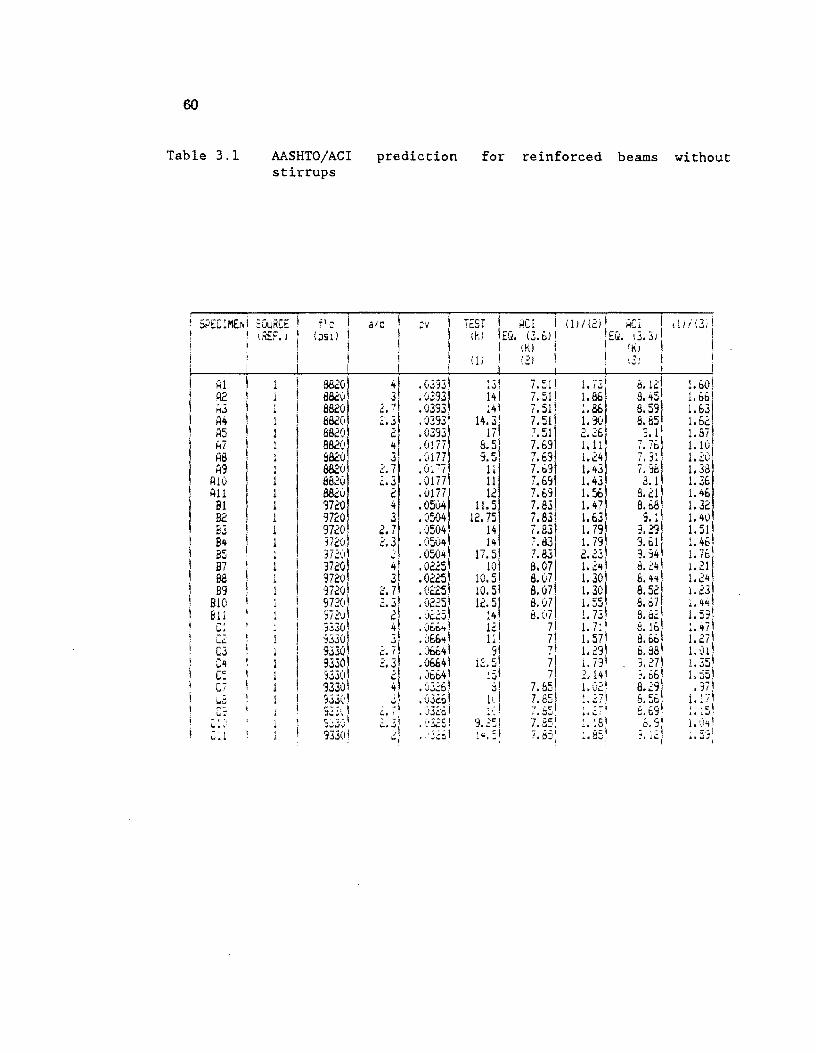
60
Table 3.1 AASHTOjACI stirrups
• 5~'EC :ME.r.! ~OuRCE ! ! I iRE:: J I i I" I I I I I I Al \ \ A2 I I H3 I I A4 I AS
A7 A8 A3
AIO Ali
91 .B2 B-3 84 B5 B7 B8 89
BlO B11 c: c;: C3 Cit C~ C7
flc I (pSI) i
I I
882°1 8820 882°1 882(, 8820 8820 88C:O 8820 8820 8820 3720 9720 9720 37201 372(11 37201 97201 '37201 97201 972',:li 'E301 ---°1 ~330 93301 '~~3(d 93301 9i3C, I S~~~ \ S~3:.:)\ 933(11
prediction for reinforced beams without
ale I
2.7 2.3
2 4 3
2.7 2.3
I I
TEST I AeI I (k) )EQ.(Z.b)11
I ',K) , (j) I 12; \
j !
dJ/Ui!
I i
! 1. bO I 1. bGI 1. 63
1 !. ?~I ... i) I
1.10 1.20 1. 38 1. 36 1.46 1.32 1. ~Ol 1. ~11 1. 46! 1. 7E. 1.21 1.24
\. 231 ,. '+'1,
!.5Z! .... , 1.271 1. (Jd 1. ~51 1. ;:;51 .37,
. \,.\ 1 •• ! I I ,~ •• ,u.):
I. \)'1 I , =,;;1 .. ..; !
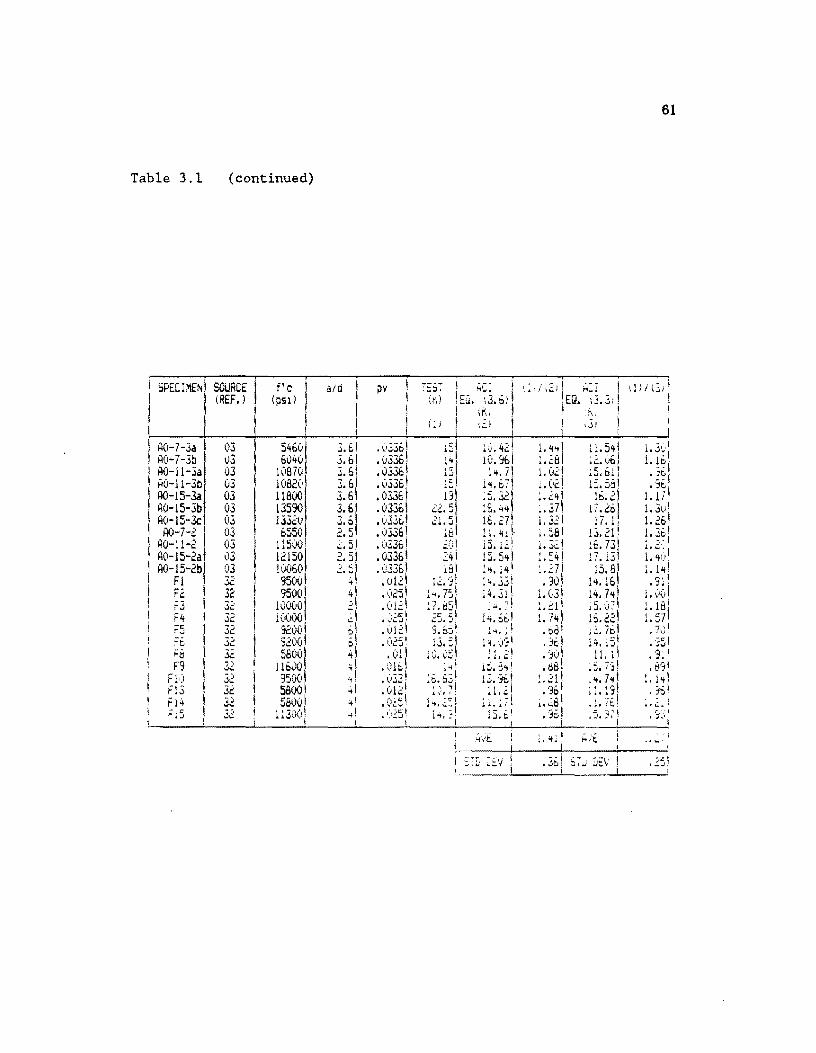
Table 3.1 (continued)
I 5PEC;~E~1 SOURCE ! I (REF.)
I
f'c (pSI)
aid I pv
61
11) I L:. i !
, "
do.:.·
I I
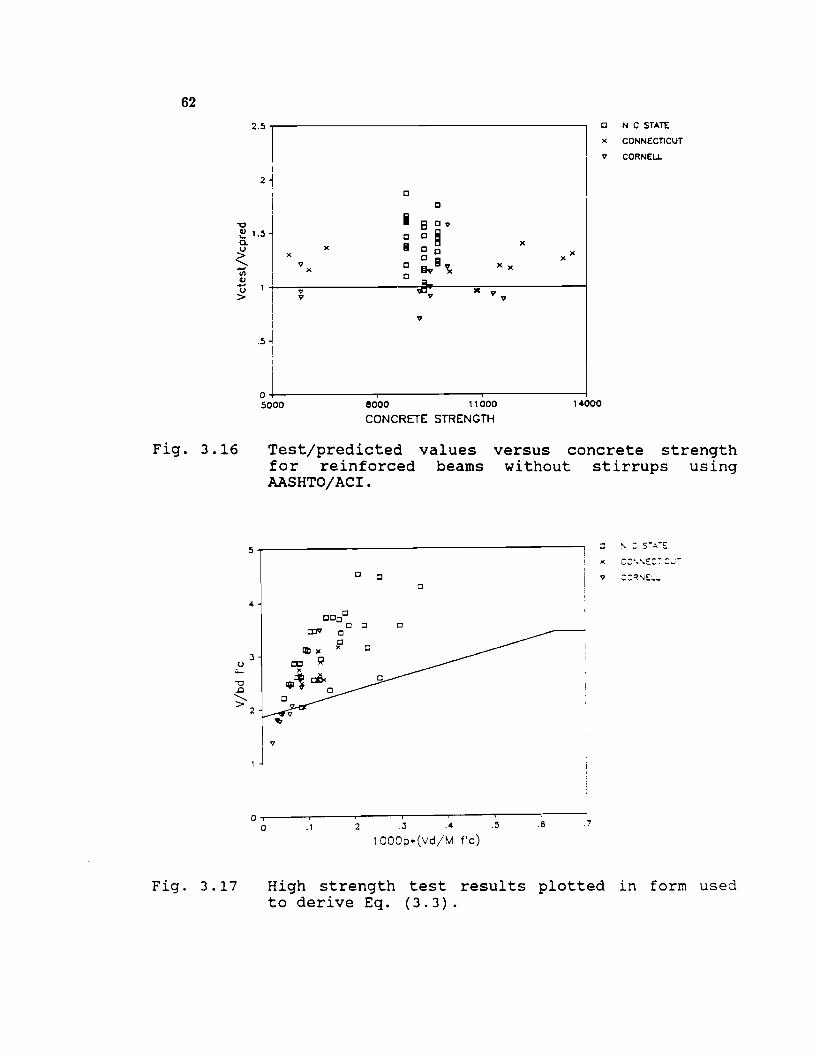
62
2.51 I
Cl N C STATE
x CONNECTICUT
I
v CORNELL I
21 Cl
c
"0 iii Cv 8 e1.5 C C ~ Co u > ~
en v U >
Fig. 3.16
_u
"0 ~ '-.. >
Fig. 3.17
iii )(
)( C C )( x
~I!I~ x
v C )( )( x C
v • v v v v
v
.5
O+-------------r-----------~r_----------~ 5000 8000 11000
CONCRETE STRENGTH 14000
Test/predicted values for reinforced beams AASHTO/ACI.
versus concrete strength without stirrups using
5~-------------------------------------:
4
3
2
1 J
I
o I 0
Cl CJ
~
v
I
.1 .2 .3 .4 .5 .6 .7
,OOOp.(Vd/M f'c)
High strength test results plotted in form used to derive Eq. (3.3).
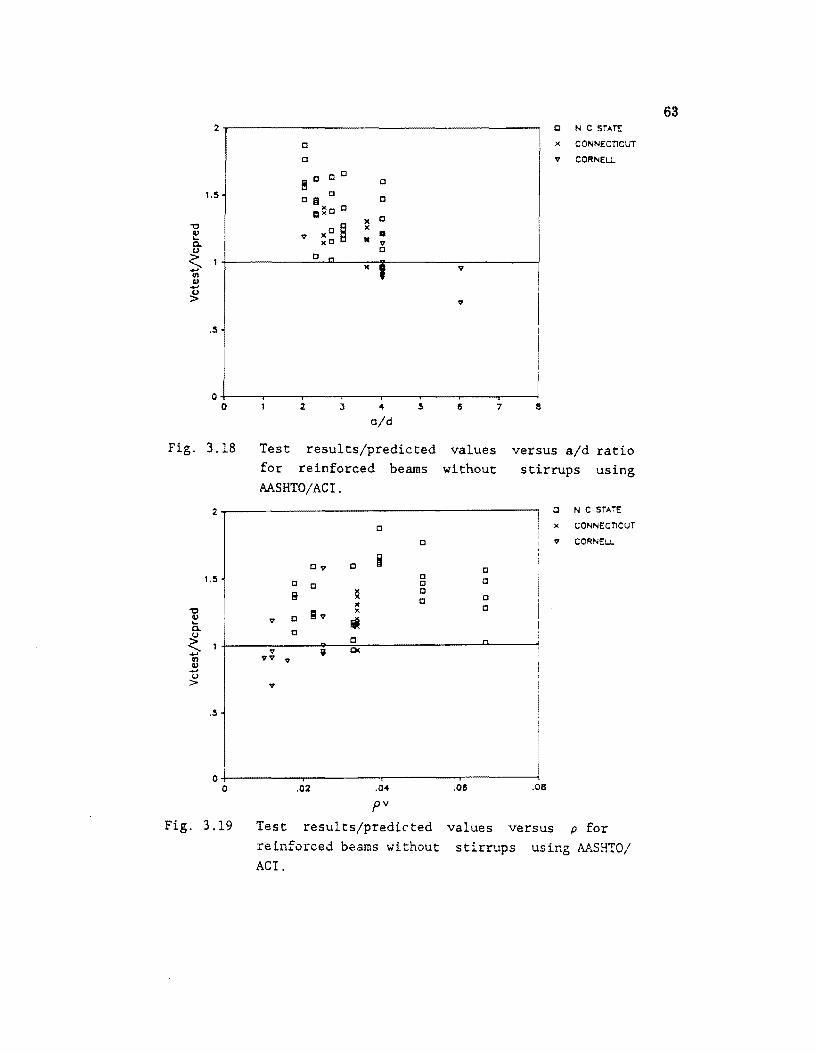
." cu "-a. U
<: ... ." II.) ... ~
2
0
0
III 0 o 0
0
1.5 0 0 0111
CI~O 0 0 )(
xO ~ x
V D .. xO v 0
1 o ,.,
x ,
.5
I
I O+---~~---r----~--~.----r----~--~.---~ o 2 4
old 6 7 8
o N C STATE
x CONNECTICUT
v CORNELL
Fig. 3.18 Test for
results/predicted values reinforced beams without
versus aid ratio stirrups using
AASHTO/ACI.
2 c N C STATE
0 x CONNECTICUT
c v CORNELL
Ov 0 Iii c 1.5 0 c 0 c c x 0
B x c 0 lC 0 ." Rv x
II) v c iii "-a. 0 u
<: 0 1 v 9 Ck ... vv ." V
II.) .-u > v
.5
O~I------~i------~i------~i------~ o .02 .04 .06 .08
pv
Fig. 3.19 Test results/predicted values versus p for reinforced beams without stirrups using &~S~TO/ ACI.
63
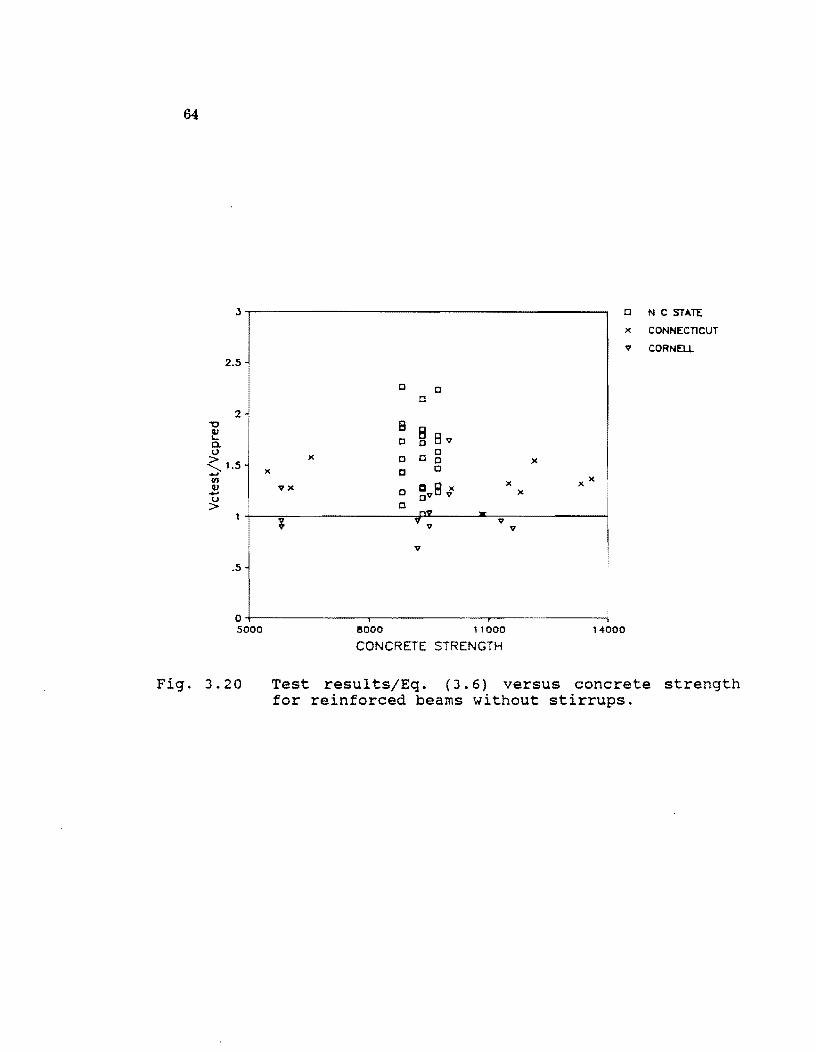
64
2.5
2 "'0
~ C. U x >
" 1.5 )( .... U)
" V)( ..... U >
;
.5
o 0 c
B o § 8 v
o c g c o
a 8 )( o OV v C
v
v
v
a N eSTATE
x CONNEcnCUT
v CORNELL
)(
)( XX x
v
o+-------------~--------------~------------~ 5000
Fig. 3.2Q
8000 11000 14000
CONCRETE STRENGTH
Test results/Eq. (3.6) versus concrete strength for reinforced beams without stirrups.
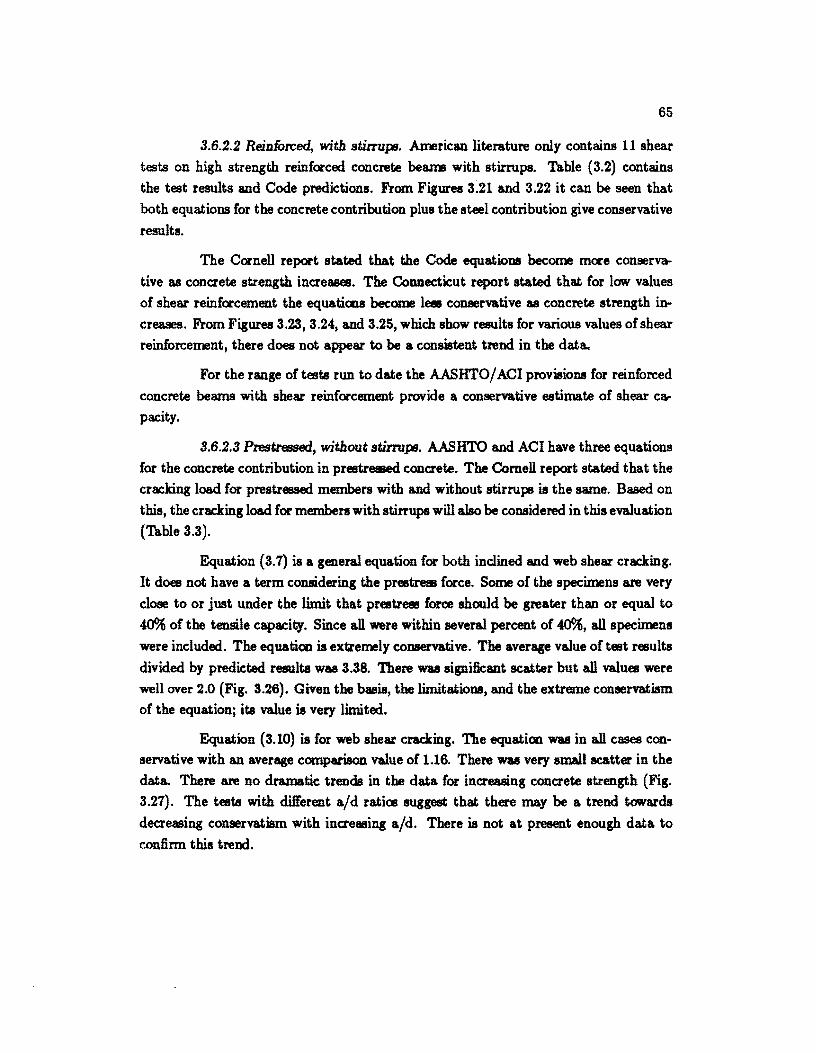
65
3.6.2.2 Reinforced, with stirrupB. American literature only contains 11 shear
tests on high strength reinforced concrete beartB with stirrups. Table (3.2) contains
the test results and Code predictions. From Figures 3.21 and 3.22 it can be seen that
both equations for the concrete contribution plus the steel contribution give conservative
results.
The Cornell report stated that the Code equations become more conserva.
tive as conaete strength inaeases. The Connecticut report stated that for low values
of she8l' reinforcement the equations become leal conservative as concrete strength in
creases. From Figures 3.23, 3.24, and 3.25, which show results for various values of shear
reinforcement, there does not appe8l' to be a consistent trend in the data.
For the range of tests run to date the AASJ:ITO/ ACI provisions for reinforced
concrete beams with shear reinforcement provide a conservative estimate of shear ca.
pacity.
3.6.2.3 Prestressed, without stil'lUpB. AASHTO and ACI have three equations
for the concrete contribution in prestreEeCi conaete. The Comell report stated that the
cracking load for prestressed members with and without stirrups is the same. Based. on
this, the cracking load for members with stirrups will also be considered in this evaluation
(Table 3.3).
Equation (3.7) is a general equation for both inclined and web she8l' cracking.
It does not have a term considering the prestress force. Some of the specimens are very
close to or just under the limit that prestress force should be greater than or equal to
40% of the tensile capacity. Since all were within several percent of 40%, all specimens
were included. The equatim is extremely conservative. The average value of test results
divided by predicted results was 3.38. There was significant scatter but all values were
well over 2.0 (Fig. 3.26). Given the basis, the limitations, and the extreme conservatism
of the equation; its value is very limited.
Equation (3.10) is for web she8l' cracking. The equatim was in all cases con
servative with an average comparison value of 1.16. There was very small scatter in the
data. There are no dramatic trends in the data for inaeasing conaete strength (Fig.
3.27). The tests with different aId ratiO!! suggest that there may be a trend towards
deaeasing conservatism with inaeasing a/d. There is not at present enough data to
confirm this trend.
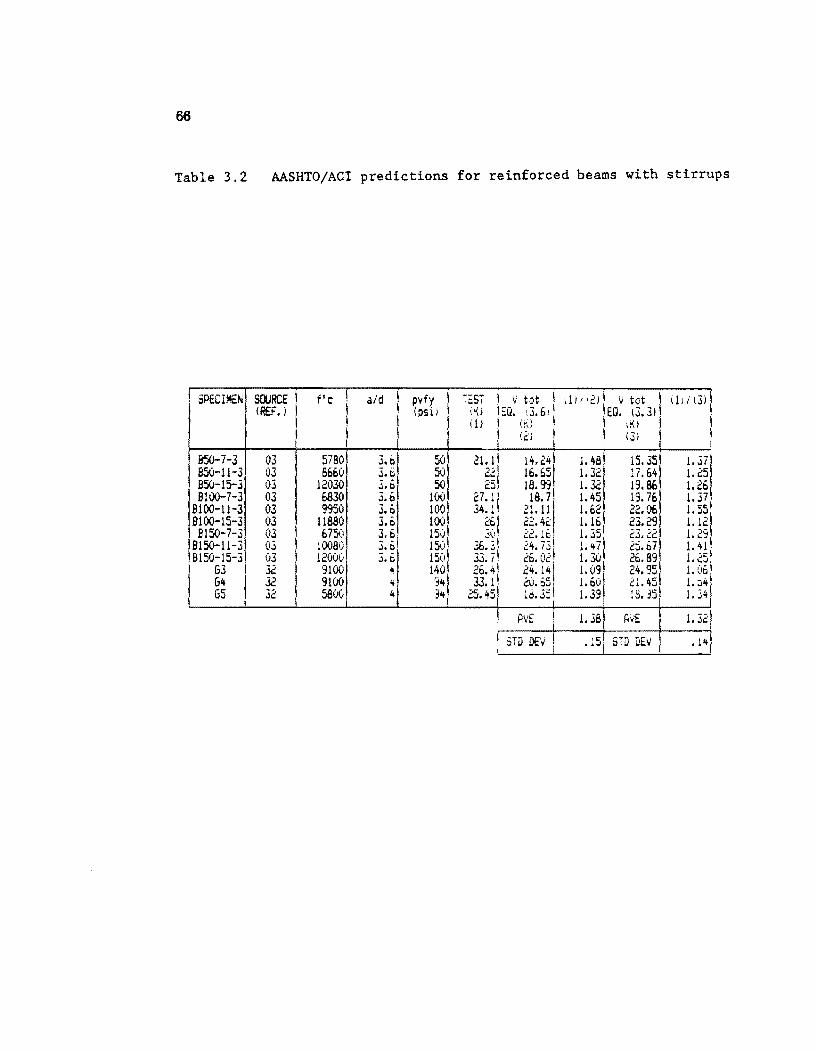
66
Table 3.2 AASHTO/ACI predictions for reinforced beams with stirrups
I SPECIMEN SOORCE \ flc : aid i pvfy I 7C:Si 1 V tot \ 11Il'.2)\ V tc·t I ilJ1 (3) I (REF.) I \
(pSll I \,\) ! Ea.'~ 3.61 I I EQ.\3. 3) i (lJ (~) IK) i I \ ("'J I ,~, I i ., j IJI
850-7-3 03 5780 ~. ~I 5°1 21.11 14. 24 1 1.48 15.35 1.37 850-11-3 OJ 8660 5(1 J" 16.65 1.32 17.64 1.25 ~. ~I ... .:: 850-15-3 03 12030 J..b 50 2" 18.99\ 1.32 19. BE. 1.26 B1(.1O-7-3 03 &830 !.6
1
1001 27.1/ 18. 7 1. -45 19.76 1.371 B100-11-3 OJ 9950 J.o 10°1 34.1 21. 111 1.62 22.06 1. 55
1 9100-15-3 03 11880 3.6 100 ~61 22.42 1.16 23.29 1. 12 8150-7-3 03 675(1 ~'~I 1501 'I.' ~2·l~i 1. 35 23,22 1. 2~ I
BI50-11-3 03 10080 !'~I 15°1
36 ~;I .:4.IJ 1.1t7 2:i.67 1. 41\ BI50-15-3 03 12000 15(! ~~. -; \
26.02\ 1.3(1 26.89 J.t:. JJ. I· 1.25; 63 32 9100 4 14°1 26.41 21t. 14 1 1. 091 24.95 1. 061 G't J2 9100 4 ':lit 33.1, ~~'~~I 1.60 21. 45 1. j4 65 32 5600 41 3't ;''' 4"j 1. J3 lB.351 1.34 i 1 It.o'-'. tJ i .d. J';I
i AVE I 1.38 AVE 1. J': i ! 5TD DE.... I ," sm DEV I • lit 1 .... .J
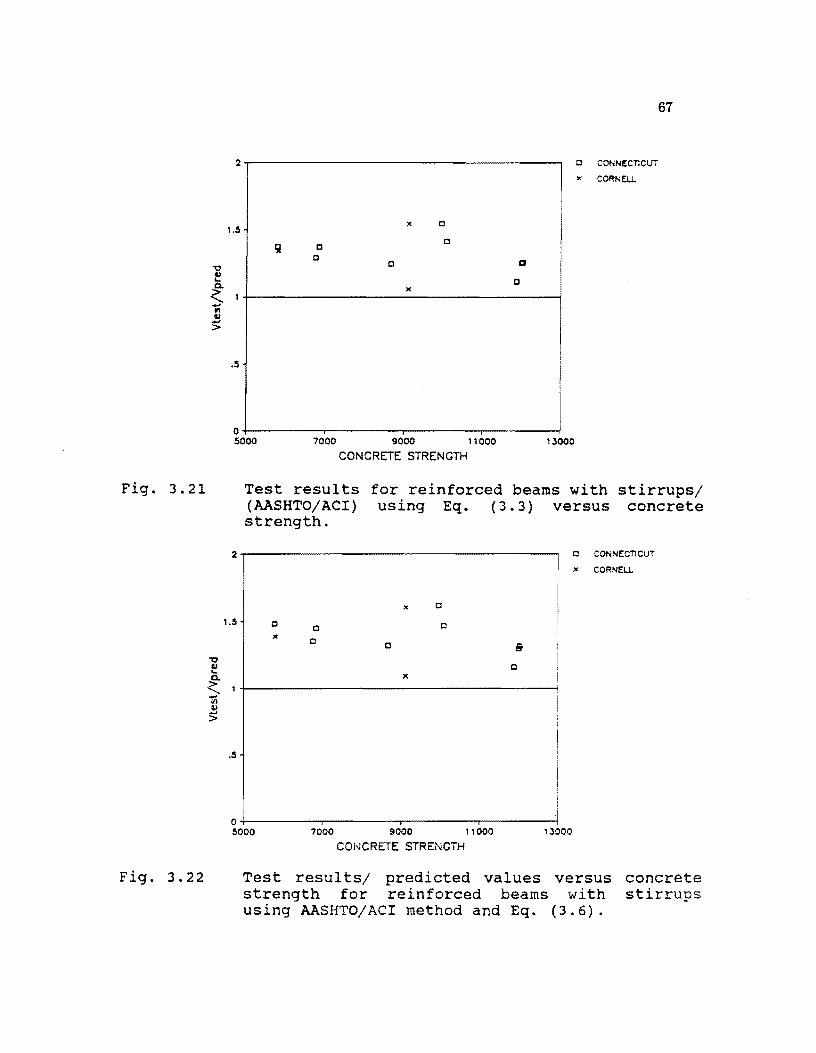
67
2~------------------------------------~ C CONNECTICUT
)C CORNEL.!.
1.!I )( 0
D 0
C '1:? 0 II
f! D
~ )(
I
VI CU .... >
.5
O+---------~--------~------~r_------~ 5000 7000 9000 11000 I JOOO
CONCRETE STRENGTH
Fig. 3.21 Test results for reinforced beams with stirrups/ (AASHTO/ACI) using Eq. (3.3) versus concrete strength.
'1:? cu ... .t ....
C1I cu :>
Fig. 3.22
2 C CONNECTICUT
)C CORNEL.!.
)C 0
1.5 c 0 C x
C 0 B
C )(
1
.5
O+---------~--------r_------~--------~ 5000 7000 9000 11000 IJOOO
COI-JCRETE STRENGiH
Test results/ predicted values versus concrete strength for reinforced beams with stirrups using AASHTO/ACI method and Eq. (3.6).
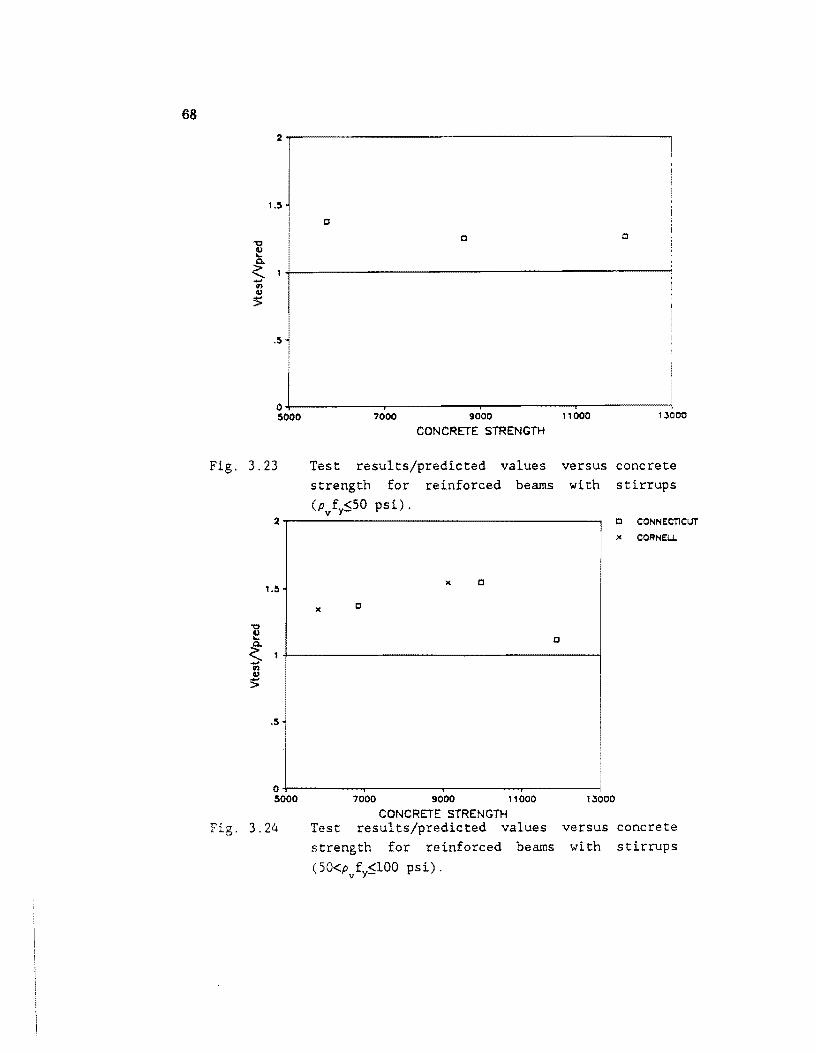
68
2~-----------------------------------------------
1.5
0
0 C "0
CU ... Q.
<: 1 .... en CU
:>
.5
O+-----------~----------~----------~--------~
5000 7000 9000 11 000
CONCRETE STRENGTH
Fig. 3.23 Test results/predicted values versus concrete strength for reinforced beams with stirrups (pvfy~SO psi).
2 ..,.----------------------.1, ~ CONNECTICUT
• ~ CORNElJ..
1.5 l( o
l( c
"0
o ~ Q.
<: 1+-------------------------------~ -en cu :>
.5
O+-----~----_r----~--------~ 5000 7000 9000 1 1 000 1 JOOO
CONCRETE STRENGTH Fig. 3.24 Test results/predicted values versus concrete
strength for reinforced beams with stirrups
(50<pvfy~lOO psi).
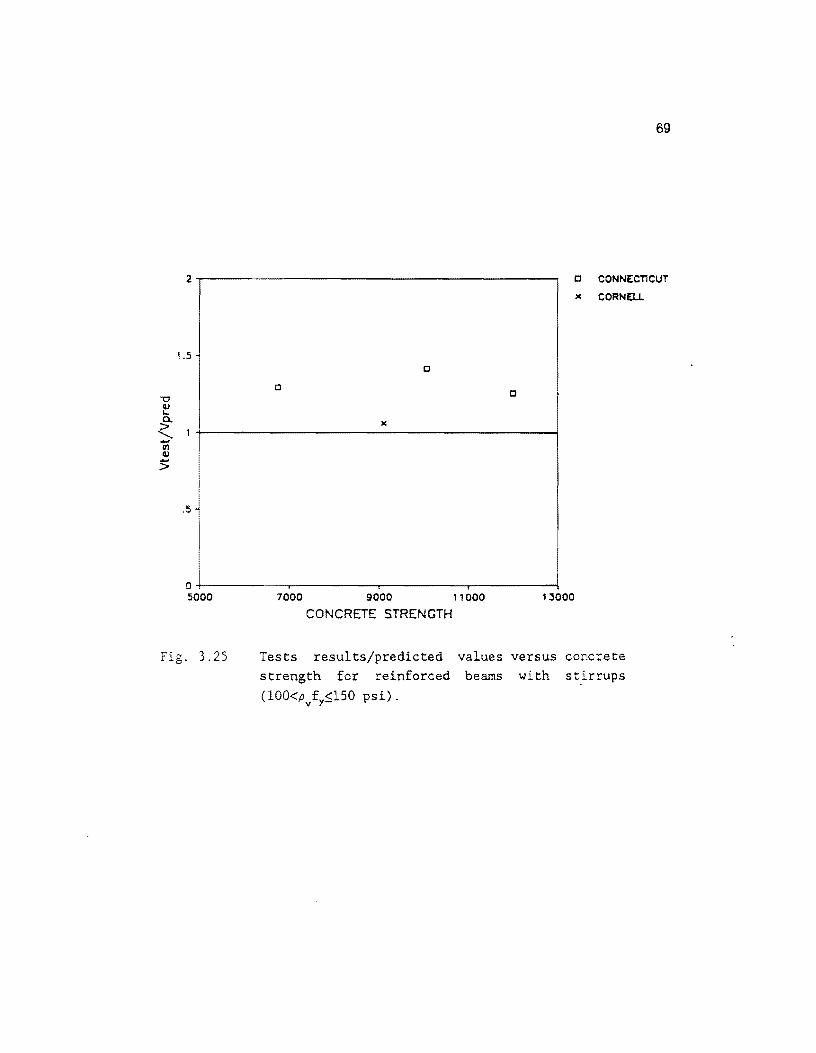
69
2~--------------------------------------------~ C CONNECTlCUT
-0 V ...
1.5
o
>< CORNELL
C
C
~ ><
<: 1 +---------------------------------------------~ ..... III V
>
.5
o+----------,----------~----------_.--------~ 5000
Fig. 3.25
7000 9000 11000 13000
CONCRETE STRENGTH
Tests results/predicted values versus concrete strength for reinforced beams wi th s t.irrups (lOO<pvfy~150 psi).
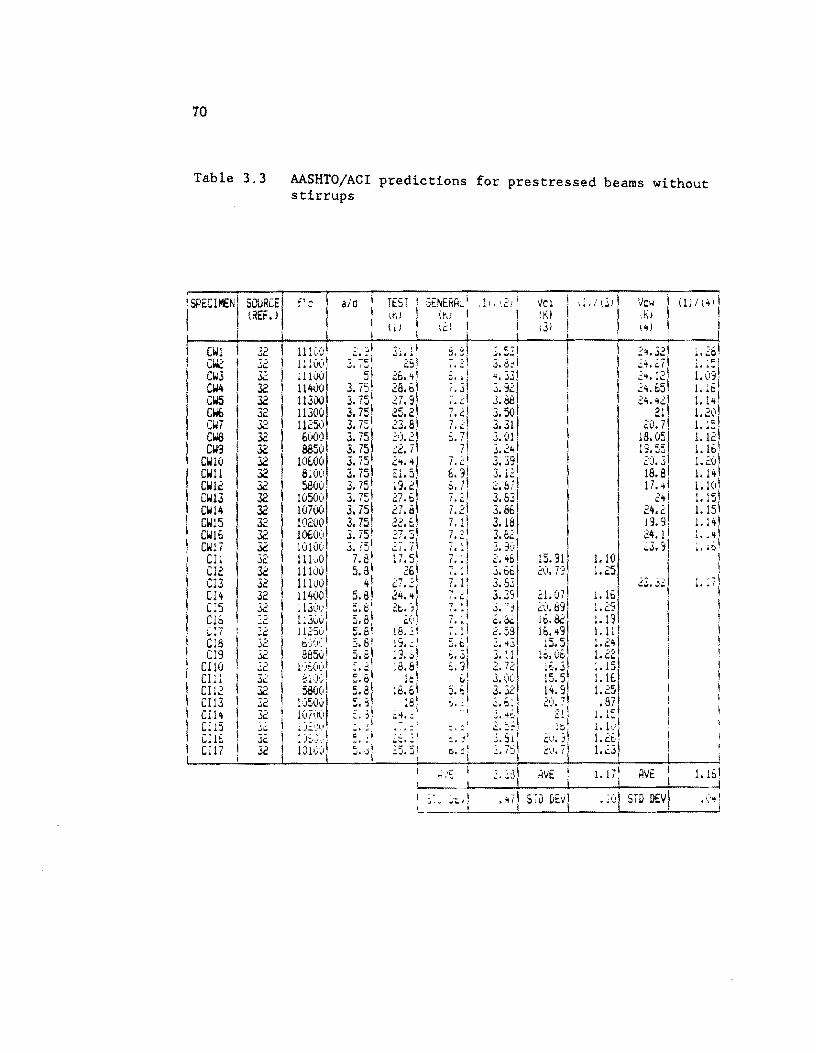
70
Table 3.3 AASHTO/ACI predictions for prestressed beams without stirrups
iSPECllit:NI SDUiK.EI f~ =: I a/a \ TEST
I SE~ERA; .. I , -, I Vel ,; , I ,', I Vcr; I (1) I ('+1: ,,l j i Ie!
! , (~EF')I I I 11',1 (1',) , I (K) ..1\/ I I (i1 12) , ,3) I'll t
I I , I I I I I \ [WI I 32 I 111 ~o I 2. ~, ~. ,I a. ~\ 3. S~I 2~. 3~1 1. ~al ..: .. I •
I CW2 I ';~ I 1 : ! (.(d 3. 7~' 2~1 - "
j. ~~I • '''I \ I
wI.
I ~b. ~l : . .:.( ':'1 • .:/
1 j # .~ I
CW3 .32 ' 11'1 51 1. (J3, i 14t::
::.. ! ' ",' ..1..1\ 2'1.12, 1 CW4 32 3. i5! 7.31 2'1.65, 1 ,- I
~~.bl 3.921 • • b i I CWS I 32 I 11300 3.75, ':1.9 , :-• .::1 3.88 24' 2fl 1. 1 'I
\ CWO
! 32 I 1130°1
jC" '=' 7.2\ 3.501 1. 2(d 3.75 , ~~ ..... ,
I CW7 32 1 1125(1 23.8t 7 .. ,:1 3.31 ! 20.7\ 1 .cd 3. 7~ I · ,-: I cwe 32 I 60001 3.75\ ..,., -,' ~. 7\ ~'911 I~'~~I I CW9 1 32 88501 ~. Z~I ~-:.~
7\ I. Ie: I
c.c.. { ..1 • .:'+ 1:~ ..I~, 1. !~\ CWlO
I 32 I 10£0°1 J. (oJ
, 2'1''+1 7.2: ~. ~;I ':::lJ • ..I, 1. '::U1 I CWll 32 8:00\
~, . 3.751
.: ... -:\ ~. ~, ~. ~71 18.8 , 1. 14 CW12 32 5800 3.75
1 ~ 3. ~I ~. / \ .:.l:L i 17~ <j I 1.101 1 CW13 32 I 105001 ~ "" 1. 15 1 ..I. '"'1 ~Z'~I l ~ C ~. ~~I '::'1
I CW14 32 I 107001 3.75 cl.d, 7.21 J.db! 24.21 1. 15 CW15 32 I 1020°1 ~. ?~I 22.£: 7 '~.! 3.1B 19.9
1 1. 14'
I CW16 32 1060(/ ,~ ~t
~'h 1 •• ~: ~. ~:I .:::. :i \ ? .::, ?~'~I I CW17 ;k: I 1010(1 ' , ..I. iJi 27. 'II j. ~ , ~. ;j~1 .:..1. :1\ .. , J.O'
CII 32 I 111')°1 7.BI 17.5, 7. : I ~. ~~I 15.31 ! 1. 1O I
CI2 32 I 1110°1 5'~1 26 7. 1 J.be
l 20. n 1.25 I \
CI3 32 111\10\ -'7 -,I 7. 1 \ 3.83 :,~ .:i "1 1 ·-1 ~'. '::1
21. 071 .... .,. ~ •• 1 i
[1'+ 32 11400 5.81 ~ '.1 3.35 1. 161 .::4.,+1 ~. 7,
I G:S ~ ! ; 13(11)' ::.6~ 2t. ,I 3. ~'~I 20.B9! L 2-5 I CI6 ~2 1 :~~01 5. BI 7' ; i i. 13 2(1;
"I .:;.0.:: 16.82
1 C!7 ' ~ 5.S1 lB.2! 2.5:31 11).'19 1. PI .'" 1 !'7~~ I ;. 1 CHl "';' :. 5.BI l'~ • .: ,I '" . I !5.5 1.'::'1 \
"'I. b',fi', ~'~I 2.~31 .... 5.61 3 . .:;1 lb~0§1 1. 221 eI9 j2 8850' ;: 3; 3. ; 1
CliO ' -' 1 'j6(.() I ;;1 ~8. Bl 2. 721 w'" .. '" I :~. ~I : .15
1 CI:l 32 btl.',t· , 1~1 - I 3. (tCl 1. 1 £ 5.6 t;" 1",. JI CI12 32 580(:1 5.81 lB.61 5.61 ~'~~l 1 -" CI13 3e: 1,)5(
1°1 " ' ':I •• \ t~· ~! .,::oJ\ ... ~I 18 ~.I:l: \ ..... ' I .87\
CIl4 32 1(1 ?',I1I -I "I 1 ," :, :1.' ~'I • .:: ~.~?\ c: ~ , " .-:/ I C· ,,, ~ ,:;f:~~~: , c ,I . , , . •. 1,.), 1 • .1 ..... ..' - -. ~ . ..::"
~(:~I C~ IE. 0 .' :. :;' ."i. 81 \ 1 . - I ..Ie.
<' - I -_. .... '. ",1 ''=~I CIl7 32 lCli':~1 i .:::J • " , ;, l:l! 20.7' .. "j, c. _I 1 • .::..1
i - Ii: , , '; 'I ilVE I I~I \ 1. Ib I "'- -' ~-! I
1. (I I ! I ::. ... J::'I) • 'I {I .-- f;;VI • j i)1 STD DEVI • \:'4 ~ ,- I
:l11J _ I ,
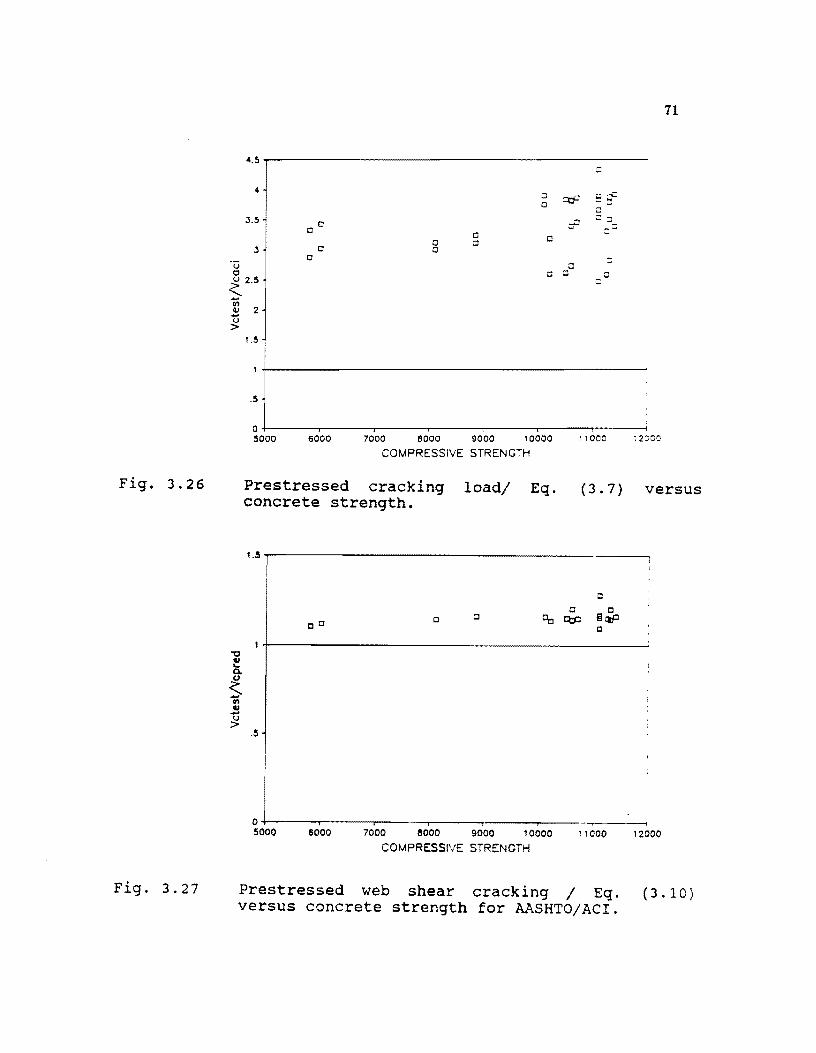
Fig. 3.26
Fig. 3.27
71
4.5 :::
4 :::l '::ti= w ;;;P 0
" J.5 0 0
J 0
...:J :J
"" ::::::J 0 0 0 0
0 0
'0 0 ~ 2.5
:J
C cP ::: ::
in QJ 2 ti >
1.5 ,
.5
O+-----~----_r----_.----_,------r_----~--~ 5000 6000 7000 !lOOO 9000 10000 1 1 000 ~ 2::00
COMPRESSIVE STRENGTH
Prestressed cracking load/ Eq. concrete strength.
(3.7) versus
1.5/ I
0
0 0 0 Cc qj:J @tIP
00 0
"0 ~ Q.
~ -en QJ -51-
.5
o+l----~I----~I----~I----~I-----~I~---._--~ 5000 6000 7000 8000 9000 10000 11000 12000
COMPRESSIVE STRENGTH
Prestressed web shear cracking / Eq. versus concrete strength for AASHTOjACI.
(3.10)
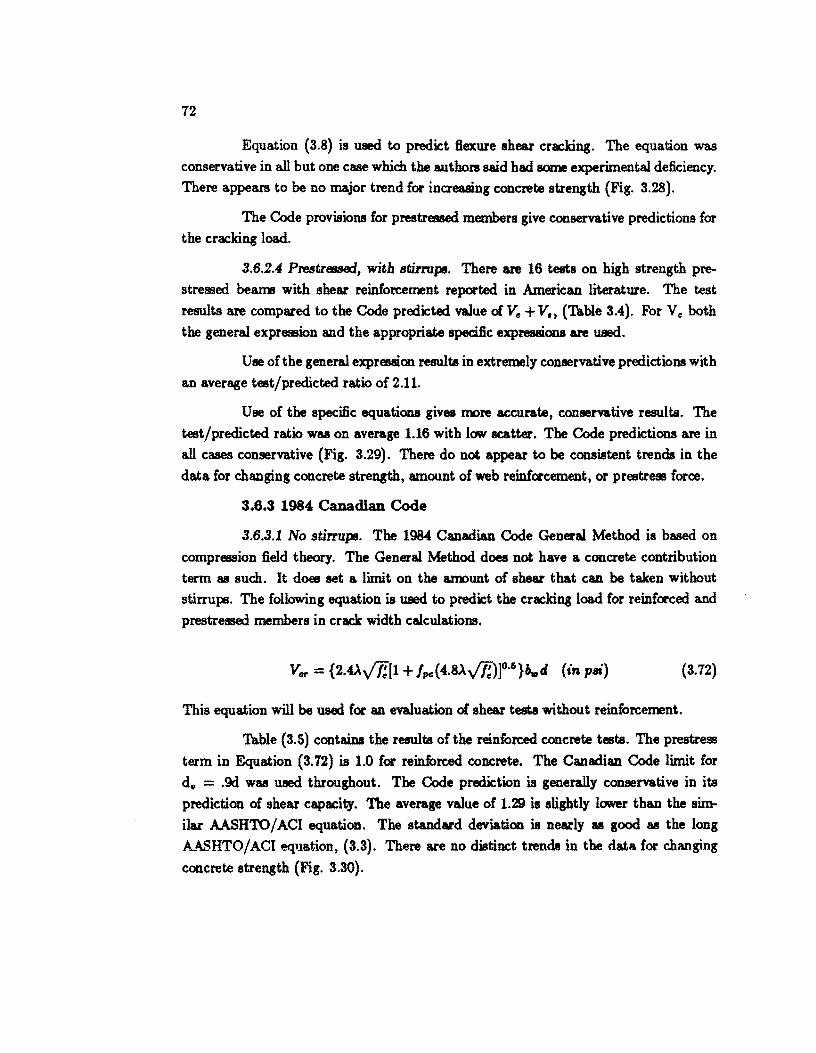
72
Equation (3.8) is used. to predict fiexure shear cracking. The equation was
conservative in all but one case which the authors said had some experimental deficiency.
There appears to be no major trend for increasing concrete strength (Fig. 3.28).
The Code provisions for prestressed members give conservative predictions for the cracking load.
3.6.2.4 Prestressed, with stirrups. There are 16 tests on high strength pre
stressed beams with shear reinforcement reported in American literature. The test
results are compared to the Code predicted value of Ve + V" (Table 3.4). For V c both the general expression and the appropriate specific expressions are used.
Use of the general expression results in extremely conservative predictions with
an average test/predicted ratio of 2.11.
Use of the specific equations gives more accurate, conservative results. The
test/predicted ratio was on average 1.16 with low acatter. The Code predictions are in
all cases conservative (Fig. 3.29). There do not appear to be consistent trends in the
data for changing concrete strength, amount of web reinforcement, or prestress force.
3.6.3 1984: C8.D8.dlan Code
3.6.3.1 No stirrups. The 1984 Canadian Code General Method is based on
compression field theory. The General Method does not have a concrete contribution
term as such. It does set a limit on the amount of shear that can be taken without stirrups. The following equation is used to predict the cracking load for reinforced and
prestressed members in crack width calculations.
(3.72)
This equation will be used for an evaluation of shear tests without reinforcement.
Table (3.5) contains the results of the reinforced concrete tests. The prestress
term in Equation (3.72) is 1.0 for reinforced concrete. The Canadian Code limit for
dv = .9d was used throughout. The Code prediction is generally conservative in its
prediction of shear capacity. The average value of 1.29 is slightly lower than the sim
ilar AASHTO / ACI equation. The standard deviation is nearly as good as the long
AASHTO/ACI equation, (3.3). There are no distinct trends in the data for ('.hanging
concrete strength (Fig. 3.30).
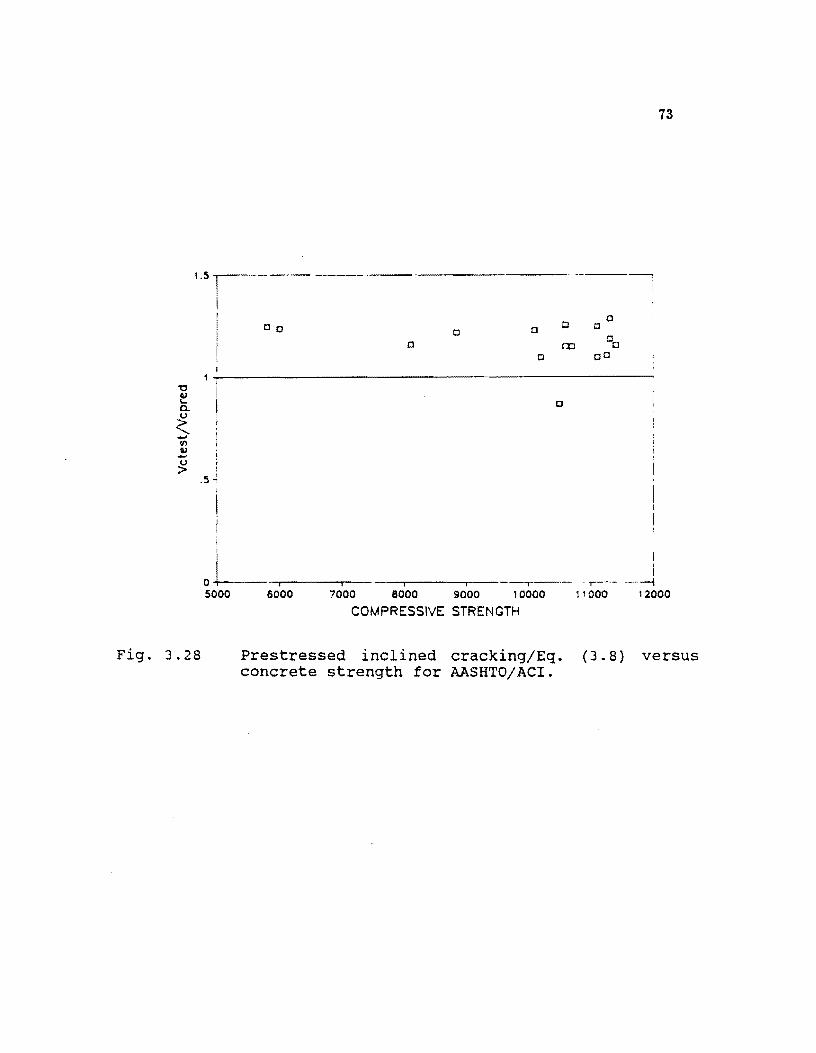
73
1.51 ----
f i
Cc
I
.5
o L--.-, ---...,..., --, , --,--- ,--.--J
Fig. 3.28
5000 6000 7000 8000 9000 1 0000 11 000 1 2000
COMPRESSIVE STRENGTH
Prestressed inclined cracking/Eq. (3.8) versus concrete strength for AASHTO/ACI.
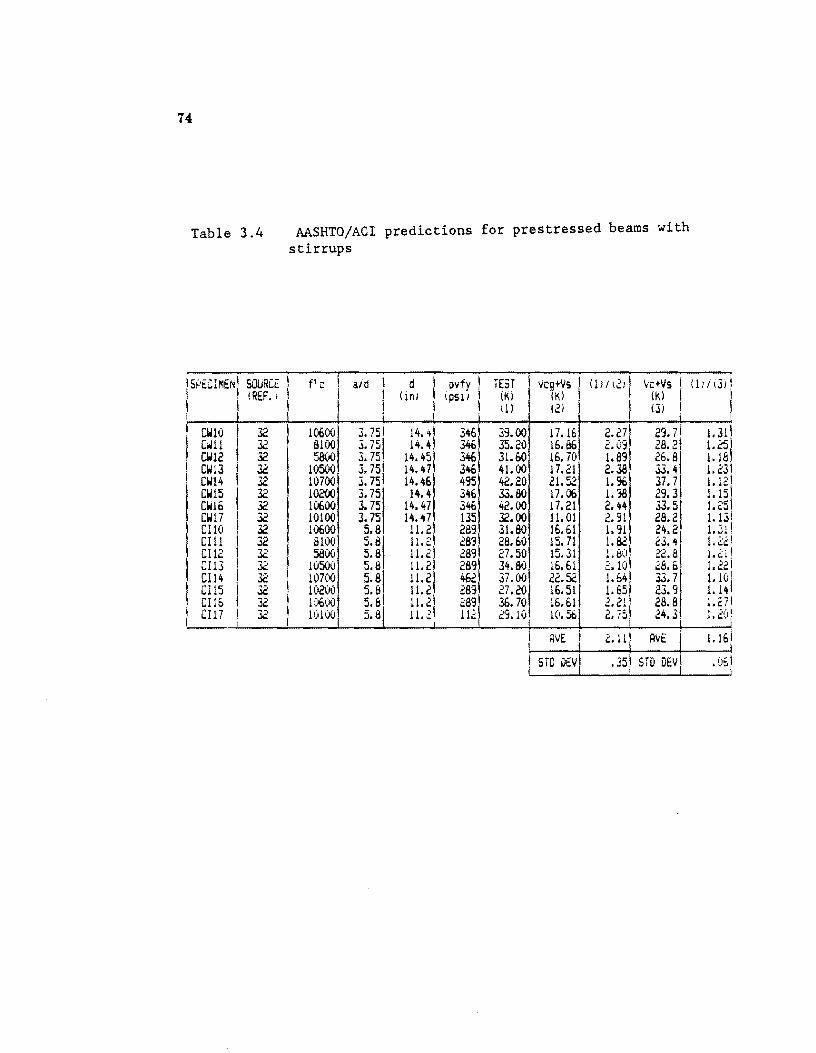
74
Table 3.4 AASHTO/ACI predictions for prestressed beams with stirrups
15~'ECIMENI SOURCE \ f' c I . I I I aid \ d \ Dvfy \ TEST 'Vcg+Vs I (1) I i2d Ve+Vs I (1' i l3J1
I I ipslI 1 I I I \
I (REF. I
1 I (i nl
CWlO 32 10600 3.75! 14. <+1 3461 CWl1 32 8100 3. 75 14.4
346! CW12 32 5800 3.75\ 14.45 346 CW13
\ 32 10500 3.75, 14.47 JItG
CW14 32 10700 3. 75 14.46 495 CW15 32 10200 3. 75 14.4 346 CW16 32 10600 3.75 14.47 346 CW17 32 10100 3. 75 14.47 135 CIlO 32 10600 5.8 11. 2 289 CIlI 32 8100 5.81 11.2 283 Cl12 32 5800 5.8 11.2 289 CIIJ 32 10500 5.8, 11. 2. 289 CI14 32 10700 5.8\ 11. 2 462 CI1S 32
! I020l) 5.8 11. ~I 28'3
Cllb 32 1(16(10 5'~1 11 • .:: 289 ~ CI17 32 1(l100 S.B 11.21 112 I
(Kl (K) III (2)
3':t.OO 17.16 35.20 16.86 31. GO 16.70\ 41.00 17.21 42.20 21.52 33.80 17.06 42.00 17.21 32.00 11.01 Jl.80 16.61 28.60 15.71 27.50 15.31 34.80 16.61 37.00 22.52 27.20 16.51 36.70 16.61 29.11\ 1(1.56
, AVE \ I I I STD DEV\ I 1
(Kl (3)
2.27 29.7\ 1.31 2.09 28.2 1.25 1.89 26.8 1.18 2.38 33.4 1. 23 1.96 37.7 1.1'1 1.38 29.3 1. 15 2.44 33.5 1.25 2.91 28.2 1. !3i 1.91 24.2 1. .jl. 1.82 23.'+ 1. 22! !. 8(11 22.8 1. 2i I 2.10 28.6 1.22
1 1.&4 3J. 7 1.10 I 1. 65 2J.9 1. 14. 2.21 28.8 1. 271 2. 75 1 24.J f ';)( I ..... ) i
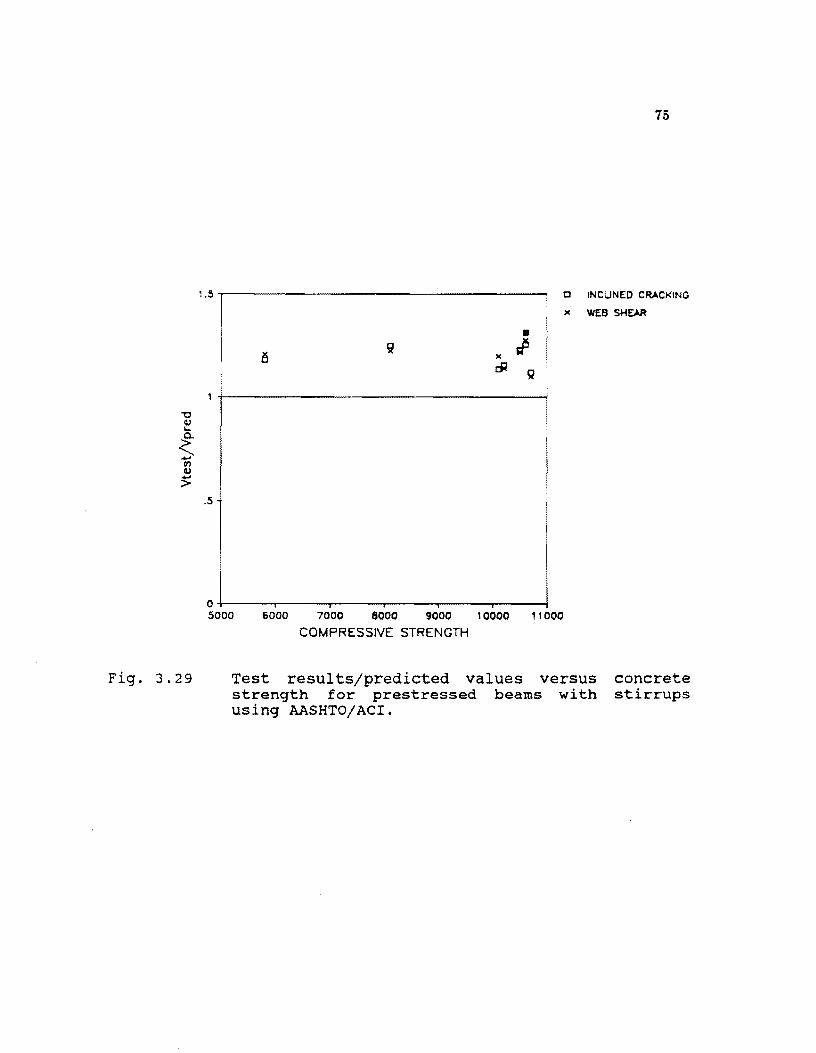
"0 lI) ... 0-
<:. .... 0'1 lI) .... >
Fig. 3.29
75
1.5 0 INCUNED CRACKING
)( WEB SHEAR
• )( J ~ 2
.5
O+------r----~------r_----._----_r----~
5000 6000 7000 8000 9000 , 0000 , 1 000
COMPRESSIVE STRENGTH
Test results/predicted values versus strength for prestressed beams with using AASHTO/ACI.
concrete stirrups
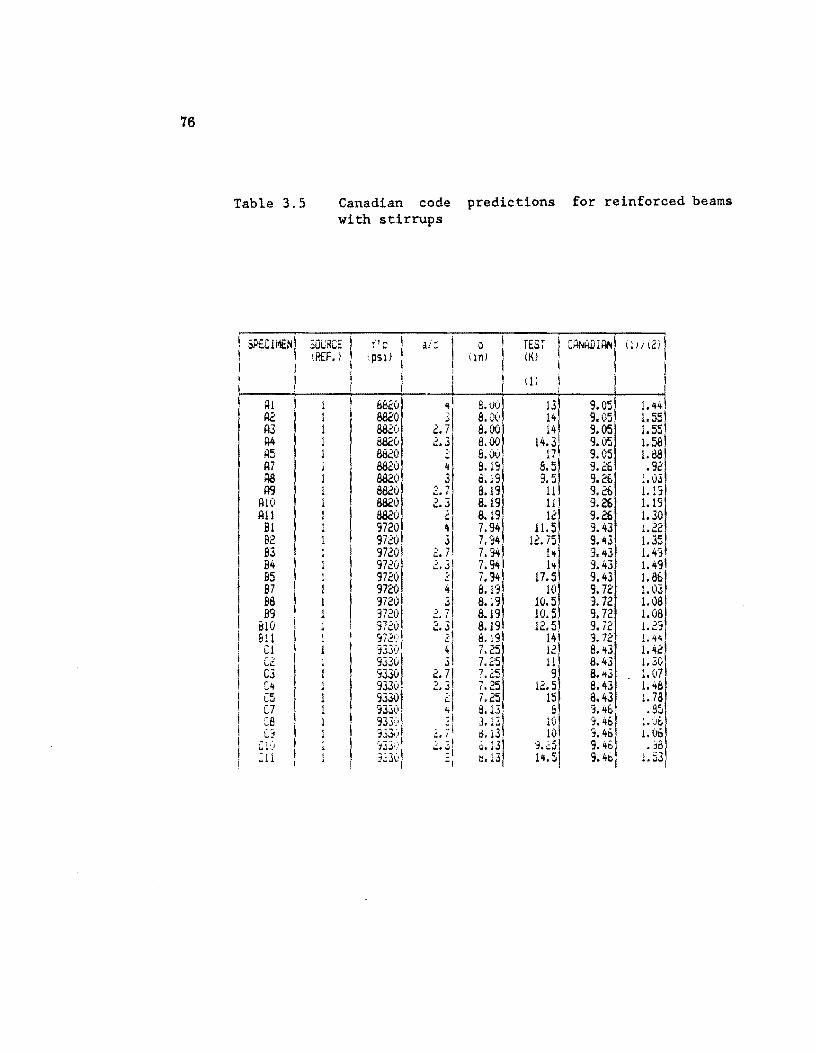
76
Table 3.5
I ! I I ; , I I Al
! A2 A3 A4 A5 A7 AS A9
AIO All
B1 B2 83 B4 85 97 .88 B9
BIO 811 Cl C2 C3 C4 -'" 1..,; C7 :::8 (J
C 1 ',~1 :li
Canadian code predictions for reinforced beams with stirrups
a ~ [1 C , aiJ 1 ! i I (REF. ) (PS1J ( lll) IK)
I I I I , i I
I ! 1 I &82(1 1 8820 1 8820 1 8820 1 8820 j 8820 1 8820 1 8820 1 8820 1 8820 1 ~~~~! 1 1 I 97201
972(iI 9720
1 9720 97201 37201 37201 S72,:,1 333(11 9330 'j3301 93301
~ml 933:,1 'E3<:.1 ':t";~)' I :;~~(;, .~'" I
1
i ,,\
2. ~I . ,I '::.J
;, -~ .3
2.7
1
j ~
... j
2 4
2. ~I 2.3' ;.\
2.l1 'J 'I ... ;\
~l ?,. I I .:.. ;\
'-, ~,
. :, ~ ... I
2.3' ;.1 '-I
B.OO 8.00 8.00 8.00 8.00 8.1~ a.1S 8.19 8.19 8.19 7.94 7.94 7.3'+ 7.941\ 7.94, 8.19
1
B.19 8.19 8.19 8.191
1
7.25 7.25 7. 25 , 7.25 7.25
8.1~.1' 3. 1.:. ,:).13
1 0.13 ti.13
(j) i
13 14 14
14.3
':;1 '3.5 11
11! 12 11.5
12.751 1 .. 14
17.5 10
10.5 to. 5 12.51
14 12 11 9
12.5 15 B
10 hI
i4~gl
9. 05 1 9.05 9.05 9.05 9.05 9.26 9.2E. 9.26 9.26 9.26 9.43 9.43 9 ... 3 9.431 9.43 9. 72 3. 72 9.72, 9.72 , 9. 72 8.1+3 B.43 8.,+3 B.43 B.43 ,~ .• I+§\ J. '1~1 9.413
1 9.'16 9.461
1.1+1+ j 1.55 1.55 1.58 1.88 .92
:.0.3 1.13 1. 19 1.30 !.22 1.35, 1. 49 1. 491 1. 86 1.03 1. 08 1.08 1.23 1. it'!
1.421 1.30
1.07 1. 4& 1.78 .85
1. (1i,
1.06 • ';'8
1. 53
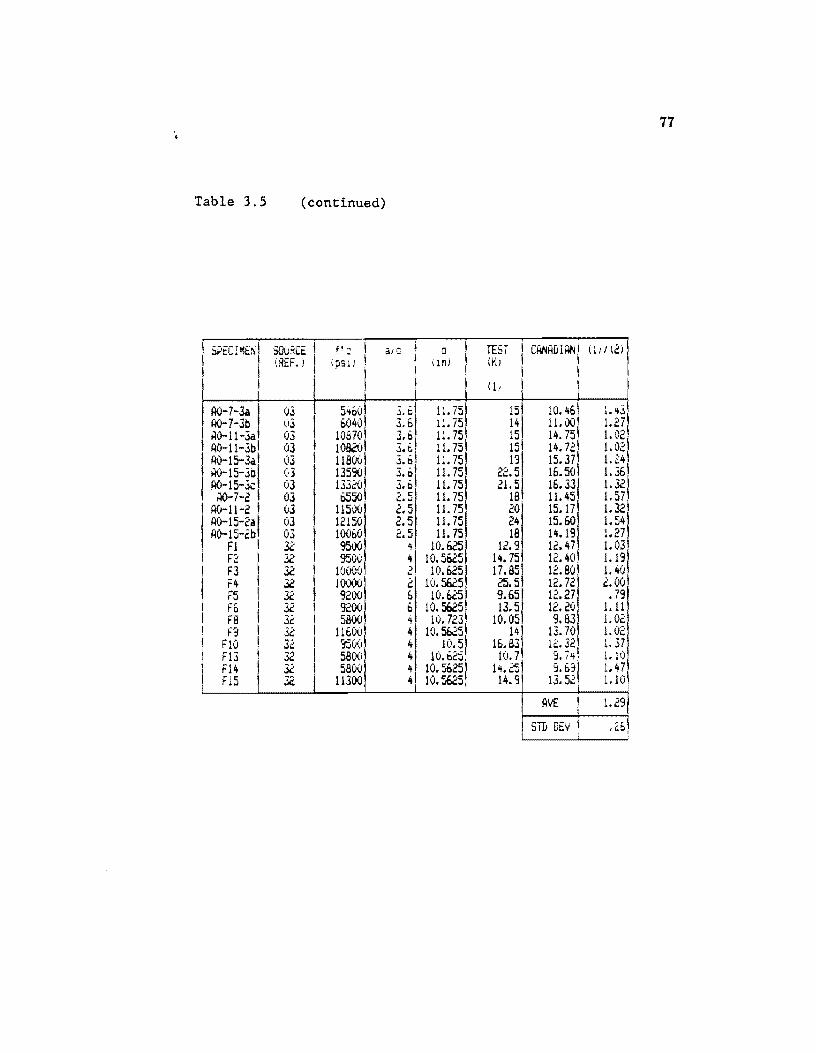
77
Table 3.5 (continued)
I ----rrri SOuRCE 1 f' c at 'J \ a TEST I CkNAliIANI (11/ (2) I i ;,I-'t' •• tN I (REF. J I ipSll I ilnJ (K! , \
I i , I I \ I I I I I i
I
AO-7-3a I 5 .. 60 3.61 l' '''1 15
1 10. 461 1.'13 •• I.;
AO-7-.3b (13 6040 .3.6\ 11.75
1
14 11.00, 1.27 AQ-11-3a1 03 10870 3.6 11. 75 IS, 14. 751 1.02\
I AQ-11-3bl 03 1082(11 ~'~I 11.751
15 14.72, 1.021 I Ao-1S-3a l (13 1180°1 ~'~l
11.75
1
19\ 15.37 1.24, AO-1S-3i:l! 03 13590 11. 75 "'j 5 16.50 j.D
~1:51 1. 36
1 I AO-15-3c 03 1332°1 3.6 11.75 16.33 1.32 t¥>-7-2 I OJ b550 2.5 11.75 18 11.45 1.57\
140-11-2 I 03 115(1°1 2.5 11.75 20 15.17 1.32 AO-15-2a! 03 12150 2.5 11.75 24 15.60 1.54 AO-15-2b 03 10060
1
2.5 11.75 18 14.19 1.27 F1 \ 32 9500
;1 10.625 12.9 12.47 1.03
I F2 ~ 32 9500 10.5625 14.75 12.40 1.19
I ~3 1 32 1uoOui ... 10.625 17.85 12.80 1.4u
r4 I x 100(l0 2 10.5625 6.5 12. 72 2.00 FS 32 9200 5 10.66 9.65 12.27 .79
I Fti I 32 9200 6 10.5625 13.5 12.20 1.11 ! Fa I 32 5800
:1 10.723 10.05 9.83 1.02
F9 I 32 1160v 10.5625 lit 13. 701 1.02 FlO \ -) 950(1 10.5 16.eJ 1;' -2 1.37 j .. 4, ... j I F13 \ -~ 58u(; 4! 10.625 to. 7' 1.10 j .. 9. /'+: F14 32 5800 :, 10.566 lit. 25 9. 631 1.47 F1S 32 11300 10.5625 14.9 .... r:;-, 1.10 1J • ..I';,
AVE 1.29
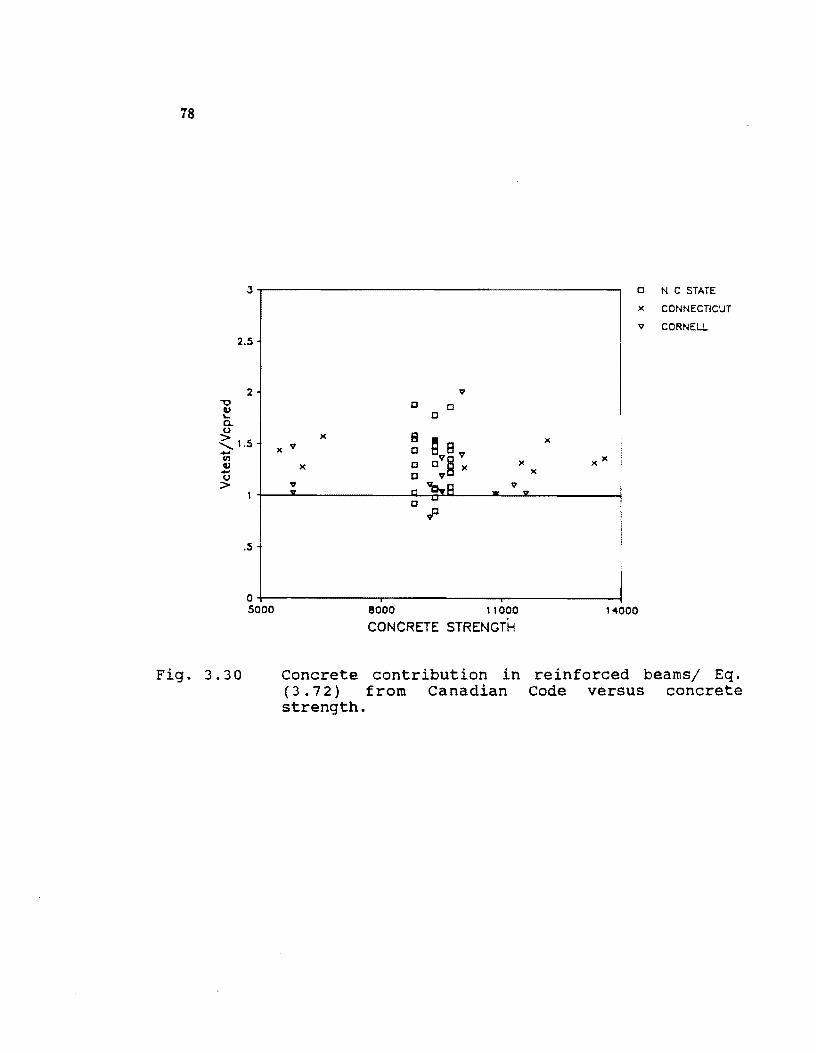
78
J~----------------------------------------~ o N C STATE
x CONNECTiCUT
v CORNEll 2.5
2 v ""C 0 0
" .... 0 c.. u x 8 >
~ B v x '- 1.5 x V 0 ....
en
" ..... u >
o OV§ x x o v
: n "i::lvR o ...
.p
.5
x
V - .. XX
x
i I
I o+-------------~------------~------------~ 5000 8000 11000
CONCRETE STRENGTH 14000
Fig. 3.30 concrete contribution in reinforced beams/ Eq. (3.72) from Canadian Code versus concrete strength.
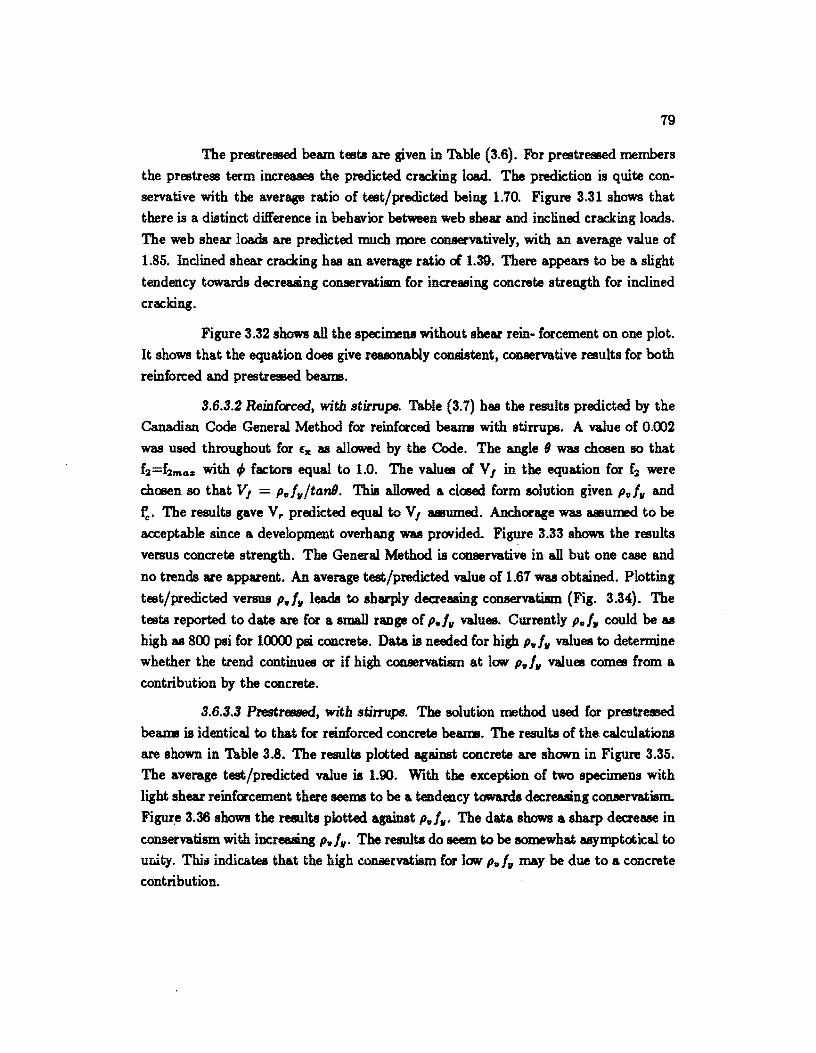
79
The prestressed beam tests are given in Table (3.6). For prestressed members
the prestress term increases the predicted cracking load. The prediction is quite con
servative with the average ratio of test/predicted being 1.70. Figure 3.31 shows that
there is a distinct difference in behavior between web shell' and inclined cracking loads.
The web shell' loads are predicted much more conservatively, with an average value of
1.SS. Inclined shear cracking has an average ratio of 1.39. There appears to be a slight
tendency towards decreasing conservatism for increasing concrete strength for inclined
cracking.
Figure 3.32 shows all the specimens without shell' rein- forcement on one plot.
It shows that the equation does give reasonably consistent, conservative results for both
reinforced and prestressed beams.
3.6.3.2 Reinforced, with st.irrups. Table (3.7) has the results predicted by the
Canadian Code General Method for reinforced be&ml with stirrups. A value of 0.002
was used throughout for €x as allowed by the Code. The angle' was chosen 80 that
f2=f2ma.1I: with 4» factors equal to 1.0. The values of V I in the equation for f2 were
chosen 80 that VI = p.I,/tanD. This allowed a closed form solution given p.I, and
£::. The results gave V,. predicted equal to VI aasumed. Anchorage was aasumed to be
acceptable since a development overhang was provided. Figure 3.33 shows the results
versus concrete strength. The General Method is conservative in all but one case and
no trends Il'e appll'ent. An average test/predicted value of 1.67 was obtained. Plotting
test/predicted versus p.I, leads to sharply decreasing conservatism (Fig. 3.34). The
tests reported to date are for a small range of p.I, values. Currently p.l" could be as
high as SOO psi for 10000 psi concrete. Data is needed for high p.l" values to detennine
whether the trend continues or if high conservatism at low p.l" values comes from a
contribution by the concrete.
3.6.3.3 Prestressed, wit.h stirrups. The solution method used for prestressed
be&ml is identical to that for reinforced concrete be&ml. The results of the calculations
are shown in Table 3.S. The results plotted against concrete are shown in Figure 3.35.
The average test/predicted value is 1.90. With the exception of two specimens with
light shear reinforcement there seems to be a tendency towards decreasing conservatism.
Figur~ 3.36 shows the results plotted against p.I". The data shows a sharp decrease in
conservatism with increasing p.I". The results do seem to be somewhat asymptotical to unity. This indicates that the high cooaervatism for low P. I" may be due to a concrete
contribution.
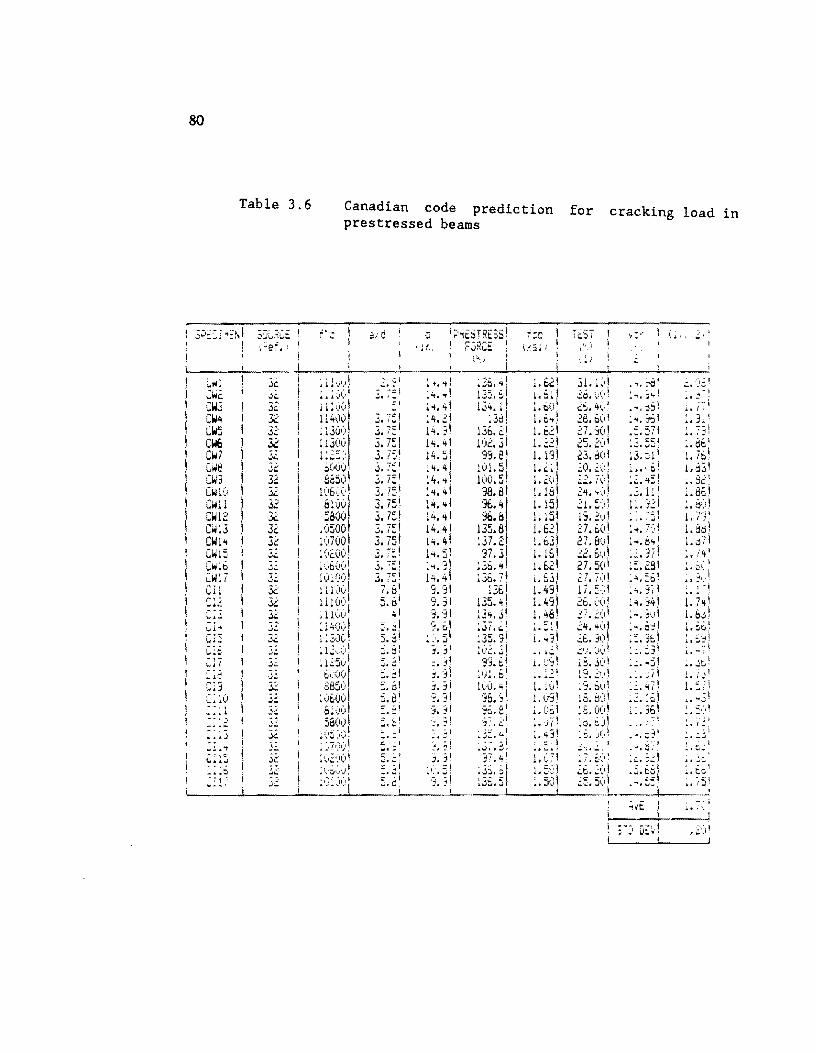
80
Table 3.6
3~E::~~~1 5QL~CE ! ,"ef.;
""w: ~w2 CW,j CWI.! CW5 CW6 CIoI7 CI'I8 CW3 CW1') CW11 CWI2 CW13 CW14 Ci-H5 CW:b ~w17 CII
1-· *: '".~ Cl ... Cl:: t,.''"',
~~7 ... J.e CIj C; 10
100 i3
I
32 &: 32 32
. ., " ... 32 32 32 32 32 32
, . ...... 32 32 32
Canadian code prediction for cracking load in prestressed beams
~. ~~l J.I::i 3.75! 3. 75~ ~ ,,:;', J •. ~, • -=1 .J. I w j. is ~ 3.751 3.75) 3.75' 3. is' , ~;;I w. I ... '
TiSi
.~. :'6 ~ ~"'!. j"" .... :16: ~'+. ~6' .5.57! i; =c:- ~ .~ • .J";,
:3.51' ~ •• ,.t, i ~: :;: I -::-lt7i ."j.l,l,' 1 :.12' ;:.75 ! : 'i. 7!:~ t
l~·~~l .. ;;,. j.' I
;5.28' : ,+, :.c.! • ~.j; I :;;.~4! ,,~_ ,:11.)1
:'" ii~\ ;:.3t.\ : .. :a i
;~. ~~I . : • .: II :~. -i71 ; ,; I ::. :"' \ L. :16,
"-:t
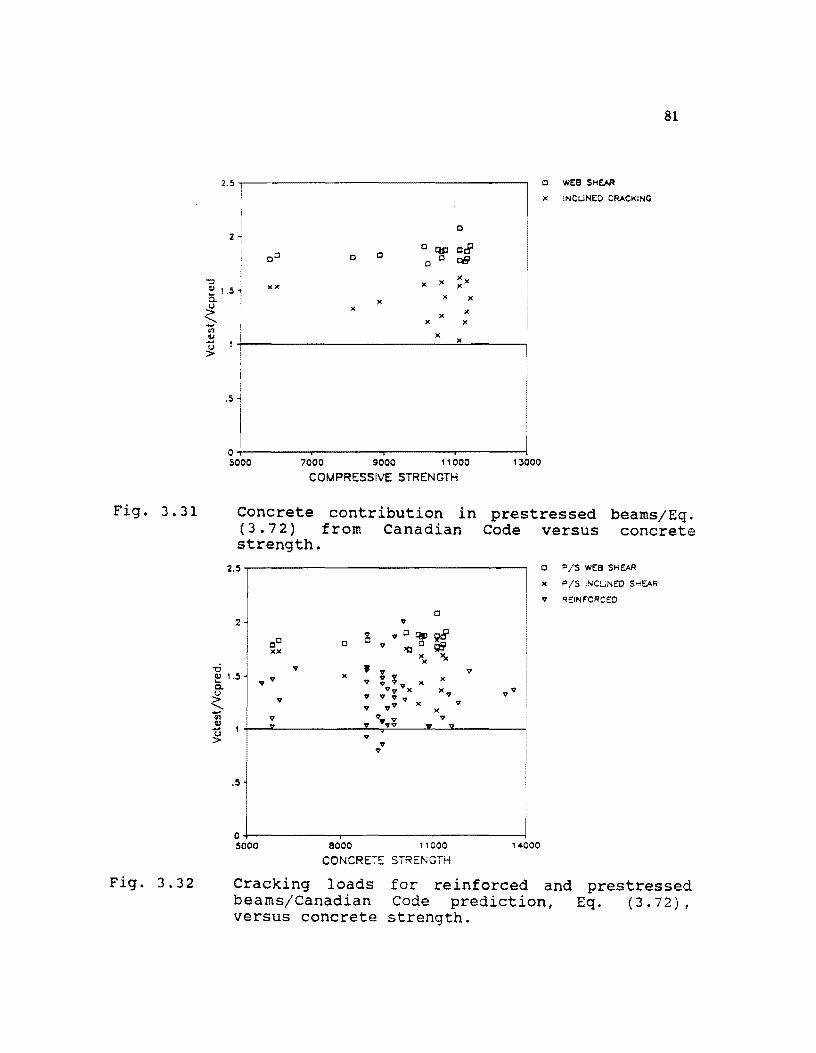
Fig. 3.31
Fig. 3.32
81
2.5 c WEB SHEAR
X INCUNEO CRACKING
0 2
0 0 c CCUJ cdl 0 0 Q§l 0
"C X Xx x
~L5 xx x x a.
u > ':::;-
<11
"" U >
-c
x x x x x
x X
X X
i .5 i
I I a I , ,
5000 7000 9000 '1000
COMPRESSIVE STRENGTH
concrete contribution in (3.72) from Canadian strength.
13000
prestressed Code versus
beams/Eq. concrete
2.!I ~--------------------,
I
c F' /S WEB SHEAR
x p /S INCI...NED SHEAR
v REINFORCED
c 2 v
CC xx
0 ~ v C G1Jp 9dl v )(J 0 ;til
x ,.,. x
v , ~u VV
v v x ;;'1 x x v a.
u <:. -en
QJ .-u >
v
v "
.!I
V '1'1 X
V v .. V '1'1
v '1.'1;
v v
v
Xv '1'1
X V )(
... v"
o+-----------~--------~----------~ 5000 8000 1 1000 14000
CONCRET:: STRENGTH
Cracking loads beams/Canadian versus concrete
for reinforced and Code prediction, strength.
prestressed Eq. (3.72) ,
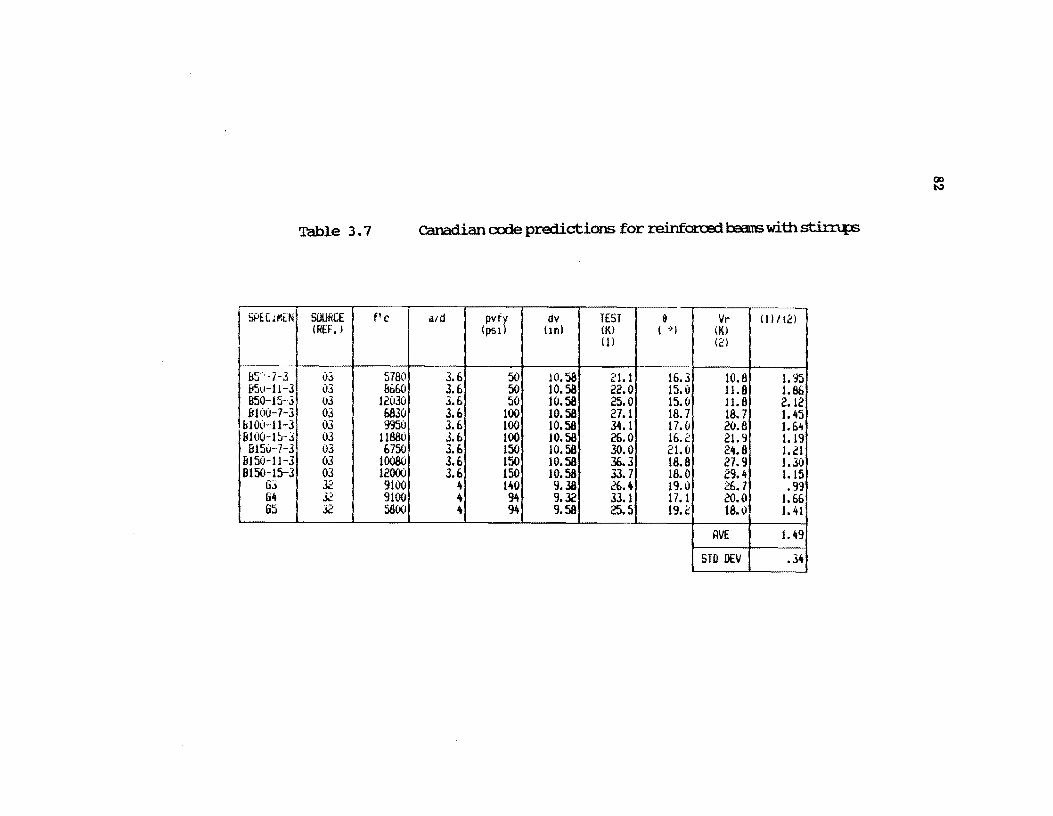
'!able 3.7
I 5PlClMt:N SOURCE flc (REF. )
1:5]-]
03 5780 it5t1-11-J 03 &b60 850-15-3 03 12030 I BlOO-7-3 03 6830
&1O(1-11-J 03 9950 B100-1~-j 03 11880 B15li-7-3 03 6750
8150-11-3 03 10080 8150-15-3 OJ 12000
63 32 9100 64 Q 9100 65 32 5800
canadian code predictions for reinfarc:ai b:lans with st.ir.np;
aid pvfy dv TEST & IJr (III (2) (pSI) !In) (K) ( Ii I (Kl
(J) (c:l
3.6 50 10.58 21.1 16.3 10.8 1.95 3.6 50 10.58 22.0 15.0 11.8 1.86 3.6 50 10.58 25.0 15.0 11.8 2.12 3.6 100 10.58 27.1 18.7 18. 7 1. 45 3.6 100 10.58 311. 1 17.0 20.8 1.6'1 ' 3.6 100 10.58 lb. 0 16.2 21.9 1.19 3.6 150 10.58 30.0 21. (I 24.8 1. ~1 3.6 150 10.58 36.3 18.8 27.9 1.30 3.6 150 10.58 33. 7 18.0 29.4 1.15
4 140 9.38 26.4 19.0 26.7 .99' 4 94 9.32 33.1 17. 1 20.0 1.66 4 94 9.58 25.5 19.2 18.0 1. '11
AVE 1.49
STD DEIJ .34
00 l.,;)
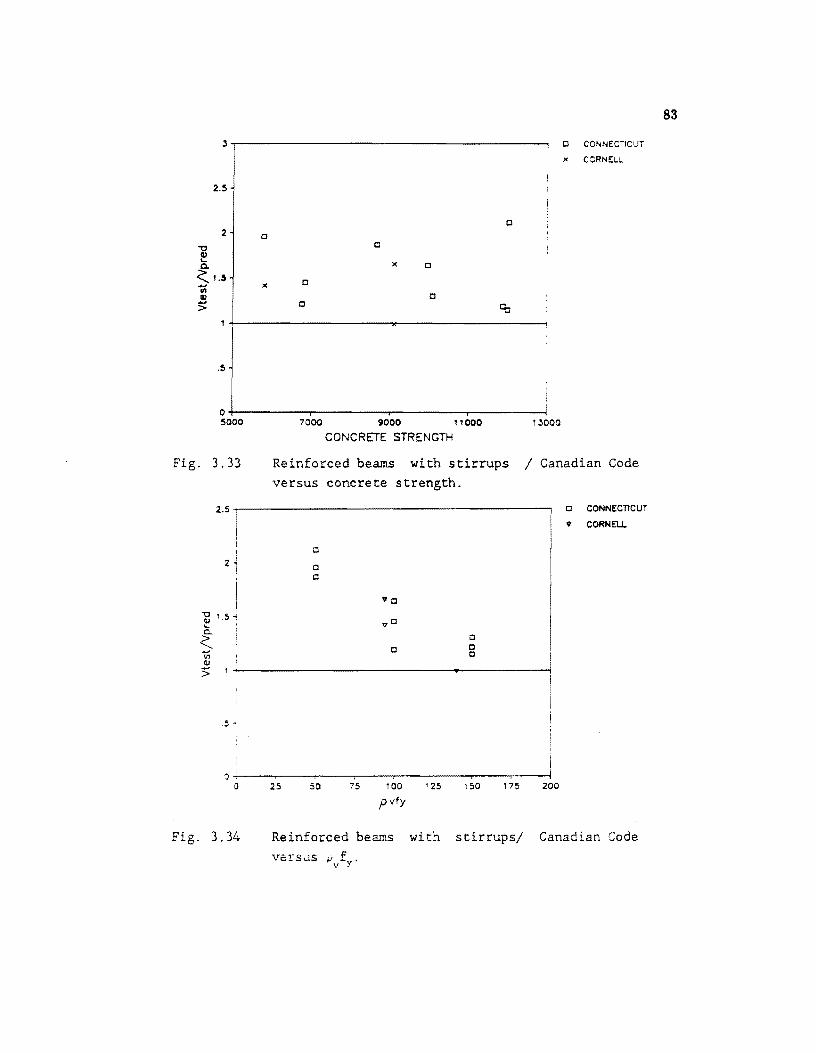
3 o CONNECTICUT
)( CORNELL
2.5
0 2 0
"'0 0 41) L-
X 0. 0
<:. 1.5 x 0 .,
41) 0
> 0
.5
O+---------~----------~--------~r_--------~ 5000 7000 9000 11000 13000
CONCRETE STRENGTH
Fig. 3.33 Reinforced beams with stirrups ! Canadian Code versus concrete strength.
"'0 ~ ~
~ '" Q)
>
2.5~----------------------------------------,
! 2';
i
1.5 ~
CI
o o
"'0
".0
c 0 0 c
•
i ~T---~-----r----.---~-----r----~--~----~I
o 25 50 75 100 '25 150 175 200
pvfy
o CONNECTICUT
". CORNEll.
Fig. 3.34 Reinforced beams with stirrups! Canadian Code
versus iJvfy'
83
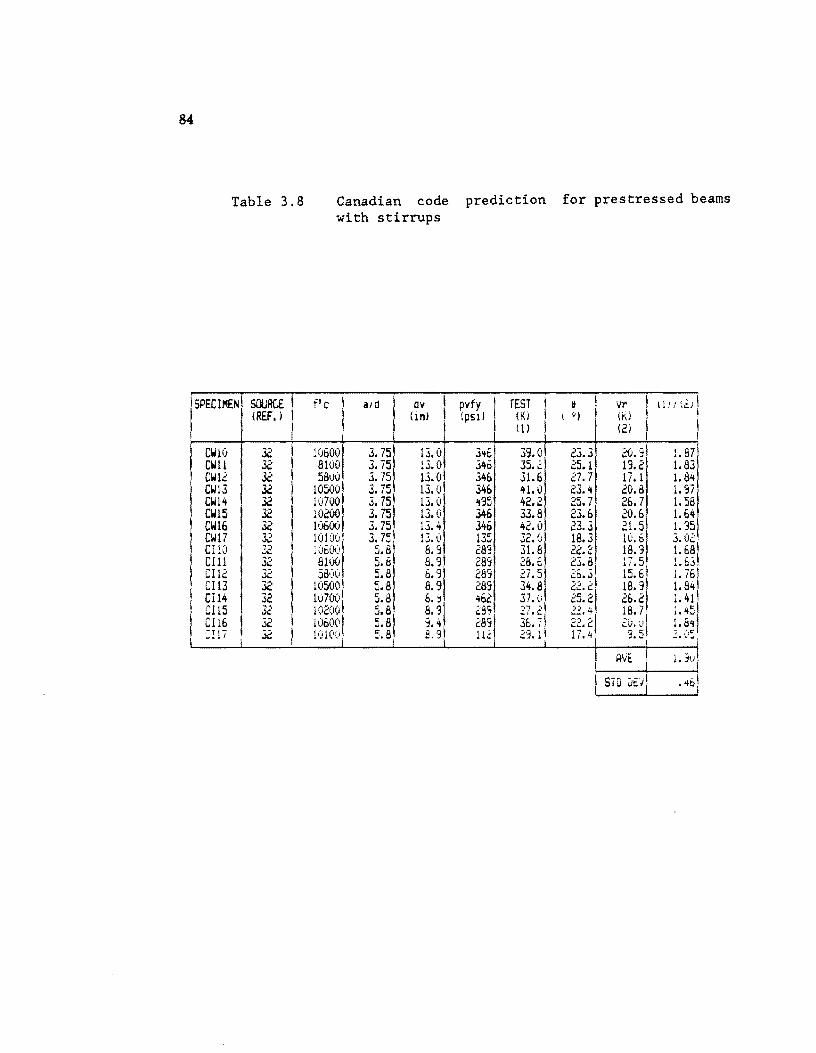
84
Table 3.8 Canadian code prediction for prestressed beams with stirrups
I SPECIMEN I SOURCE 1 fl c I aid ! dv I pvfy I TEST! e 1
1 I I !
I I I i
I I I
CWiv CWll CW12 CW13 CW14 CW15 CW16 CW17 crw Cl11 CI12 C113 CI14 c 115 Cll6
(REF.)
32 I 10600 32 I 8100 3C: 581)0 32 I 105001 32 107001 32 10200 32 10600 32 101(10 32 lOE,(lt) 32 8100 32 58-](1 32 10500 32 107001 ~', 10-no Je: 32
(In) (pSI)
I 3. 751 13.01 3,+61 3. 75 13.01 34D 3.75
1 13·°1 .346 3.75
1 13.0 346
3.75, 13. (l ,+'35 3.75 13.0 .346 3.75\ 13.4 346 ~ 7" 13.0 1~" J:. ~! J,J
:J.t! 8.9 28'3 5.6 a.9
1
289 5.8 8.9 289 5.8 8.9 289 5.8\ &. :; 462 " . 8. :' G
(Kl ( 0) n\i (1) I !2J I
I
39.0 23.3 .::0.31 1. 67 35.2 25.1 1'3.2 1.83 31.6 27.7 17.1 1.84
1 41. (I 23.4 20.8 1. S7 42.2 25.7 26. 7 1.58 33.8 23.6 20.6 1.64! 42.0 23.3 21.5 1. 35 32.0 18.3 1(:.t. 3.02\ 31. 8 22.2 18.'3 1.68, 28.t. ?~. ~I 17.5 1.63 27.51 15·'1 1. 76 1 34.8 ~~'~I 18.9 1. 84
1 ':'':''':'1 37.0 25.2 26.2 1.411 )7.:' I 2,). tt 18.7 ;.'15
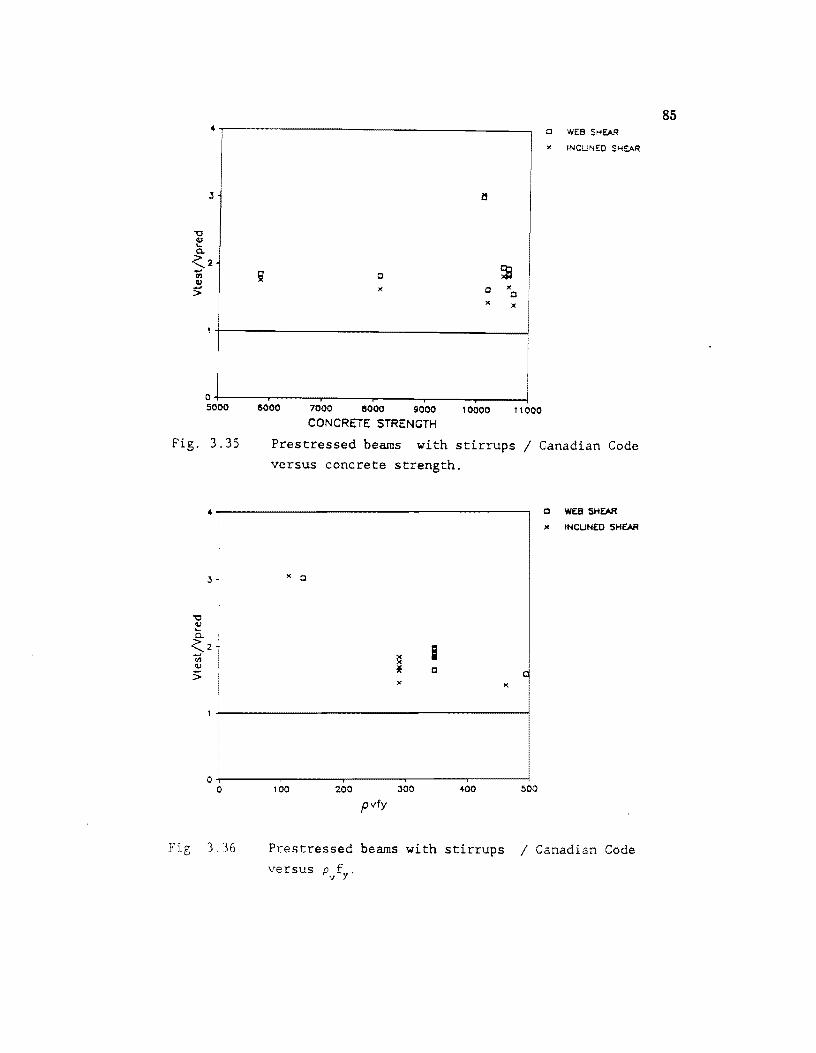
4~----------------______________________ ~ ::J WES SHEAR
x INCLiNEO SHEAR
J
-0 V .... 0-
<:2 ;S ....
til 0 V :> x 0 X
0 x x
O+---~--~----~ __ ~ __ ~ __ ~I 5000 15000 7000 8000 9000 1 0000 11 000
CONCRETE STRENGTH
Fig. 3.35 Prestressed beams with stirrups I Canadian Code versus concrete strength.
4~----------------------------------------,
i I I
I
x C
x
i ><
i O+I--------~i--------~'--------r' ------~------~ o 1 00 200 300 400 500
pvfy
o WEB SHEAR
x INCUNEO SHEAR
Fig 1.16 Pr.estressed beams with stirrups I Canadian Code
versus Pvf'1.
85
86
Figure 3.37 shows all the specimens with shear reinforcement plotted against
concrete strength. The figure indicates that the Canadian Code General Method is
consistent in its prediction of both reinforced and prestressed members. Figure 3.38
shows aJl the tests plotted versus '''/'1/' Plotted in this fashion there appears to be a distinction in perfonnance not accounted for by the method. Reinforced and prestressed
members show similar behavior for increasinc '''/'1/' A strong possibility for the origin of this change in agreement as previously mentioned is that the method does not consider a concrete contribution. This would also explain why the prestressed specimens were so
conservative. Prestress increases the amount of shear resisted by the concrete increasing
the conservatism of the results.
3.6.4 Truss Model
3.6.4.1 Reinforced, no stirrups. Table 3.9 gives the predicted values for the
concrete contribution for the truss model proposed by Ramirez. For specimens with low
shear reinforcement values the truss contribution to V." is considered to be supplemented
by a concrete contribution. In beam.s with no reinforcement, a case that is strictly
not allowed in the truss model, the concrete must carry both compression and tension
associated with the shear. The current purpose is to determine if the maxiIl'llm allowable
concrete contribution is conservative for high strength concrete. Since most of the beams
were not close to yielding of the longitudinal rein- forcement at the shear failure loads,
'assumptions were made for z values. A common assumption is that z=7/8 d. For
current purposes the smaller of 7/8 d or z at ftexural ultimate was used as z. The
average test/predicted value was 1.67 with a substantial amount of scatter (Fig. 3.39).
The limiting value of concrete contribution to shear is generally conservative.
3.6.4.2 Prestressed, no stirrups. Table 3.10 contains the truss model predictions
for prestressed. girders with no shear reinforcement. Again the lower estimate of z at ultimate or 7/8 d was used for z. The I at ultimate was based on Code calculations
for moment capacity. The d used was a best estimate considerinc both prestressed. and non-prestressed. reinforcement. This was necessary since the report did not explicitly
state the d for the specimens. A zero value was assumed for v." in the calculations. All
calculated K values were greater than the limit value of 2.0. Ramirez further limited K
to 1.0 at sections where the extreme tension fiber stress exceeded 6.flI. As a practical
matter K-2.0 was chosen and Vc calculated. This value was used to back calculate a
moment and stresses to check the limit on K.
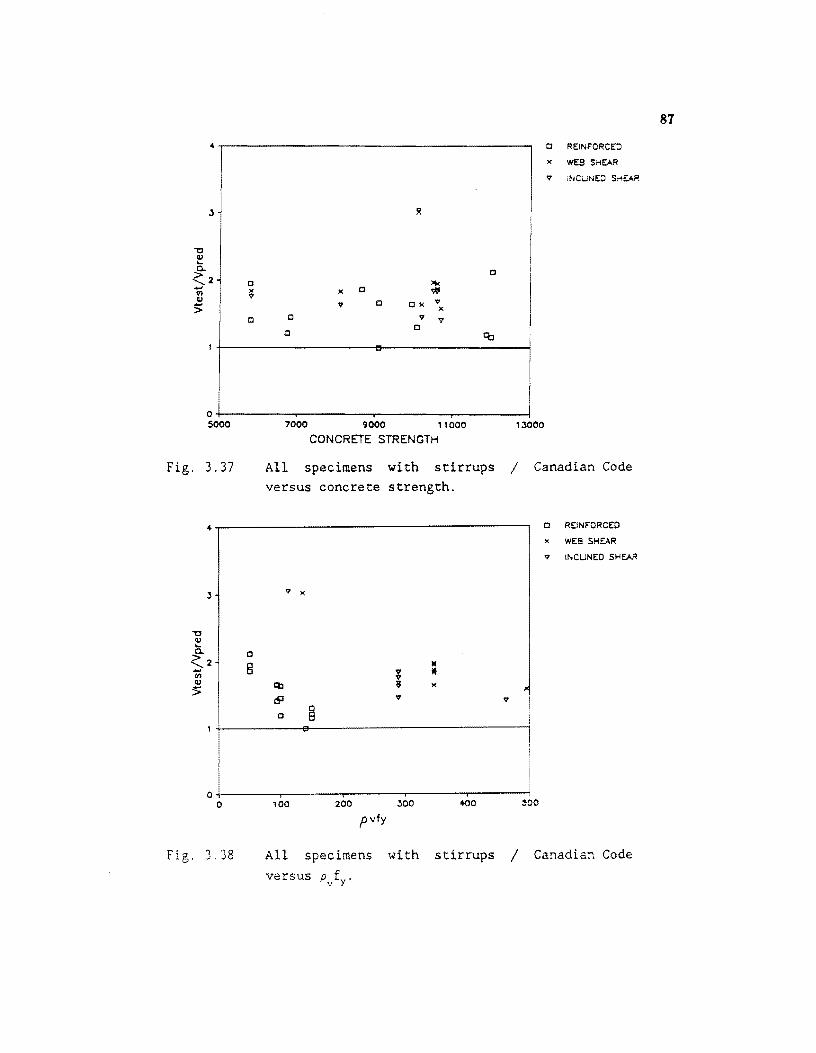
87
4~----------------------------------------~ o REINFORCED
x WEB S",EAR
v iNCUNEO SMEAR
"" '1/ .... Q.
C <2 0 >t< - x x c <M rn u V
:> V 0 ox V x
0 0 V V
0 0
0 5000 7000 9000 11000 13000
CONCRETE STRENGTH
Fig. 3.37 All specimens with stirrups / Canadian Code versus concrete strength.
c REINFORCED
x WEB SHEAR
V INCUNED SHEAR
v x
"" '1/ .... Q. 0
~2 8 II
rn , If '1/ ~
, x ~ ;;.
cP V V I 0 ~
I !
0 0 100 200 300 400 500
pvfy
Fig. 3.38 All specimens with stirrups / Canadian Code
versus Pvfy'
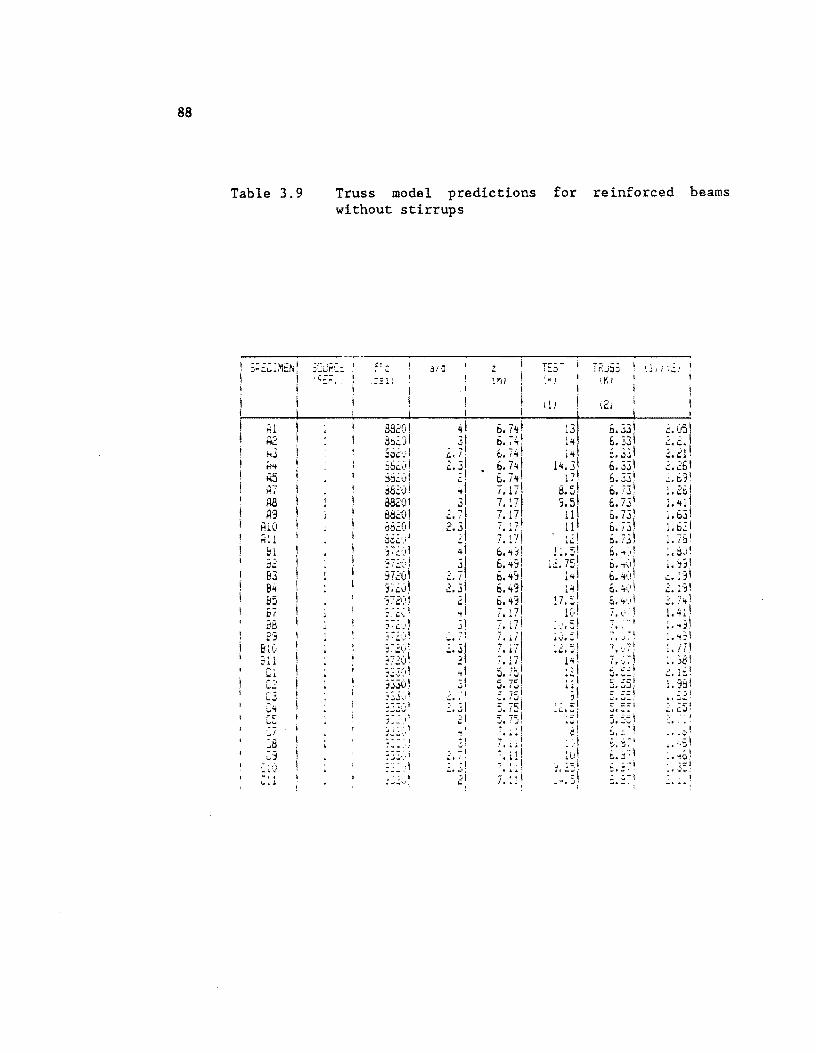
88
Table 3.9
':;1 I A2 I ;,j !
i Hit AS Ai A8 A',
;\10
I ! I i I
Truss model predictions for reinforced beams without stirrups
: ' I .,'-_.' ;
?~~.I \
: ~.j" .. 1
" _.
z i ,rd I
I !
T~·-- • ;t~
:~ i I I
i 11 j
, -I
r;:.;5S \ ;j(,
b. ~3! ~. ~~\I ~.J.j
6.331
t~~~ 6.73 1 .. ..,-)
~. ~:i ~. ~:I c. I j I
b, .,.I! b. 'T(ri 6.I+(;! 6 • .,,) 1 6.'1.'\ 7. \.1'"
I
... ,'-l i l \.1, '
',','1 \
7, ":! ~ ~ ;; .~I ... ""-= :r:} ..J • ...;,.;" ==, ,-' . ...;-:::- ==1 "" ... -" ==\ J. -':! ~.
ttl - I
f.. I t. -i
1. • I ;2 ~
-,t;" I .:., C.J.' :', ,. ,
" .c, ' ,. "S I
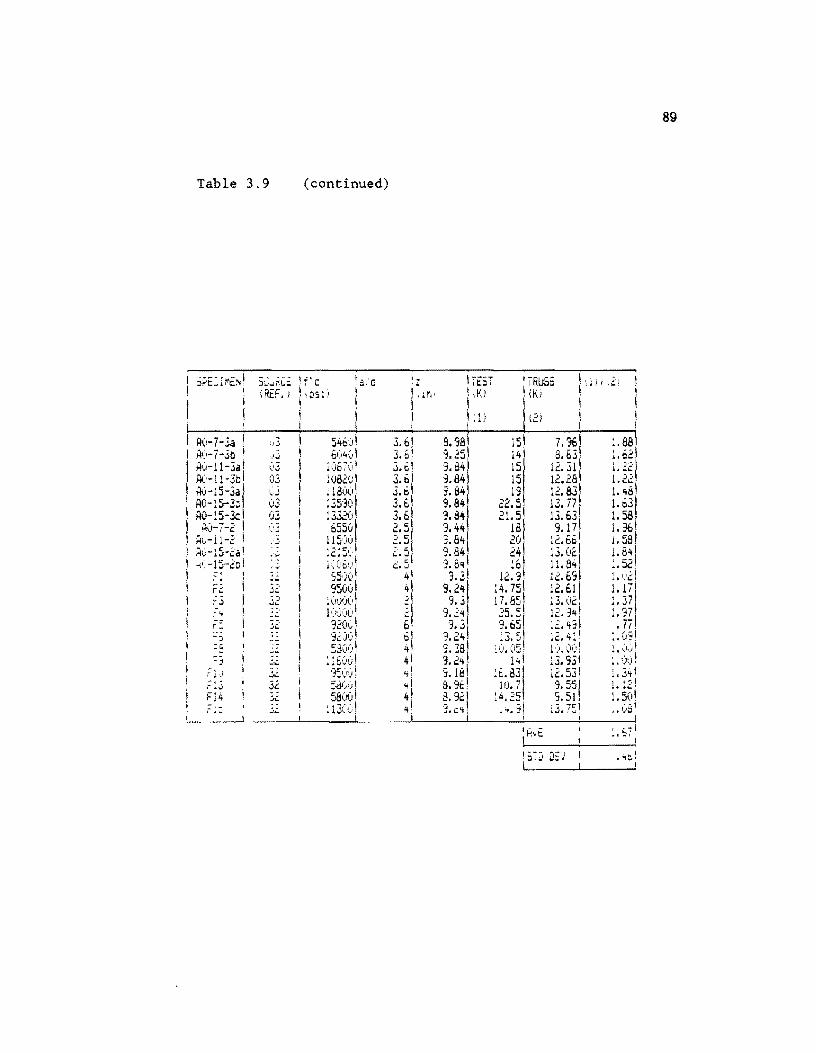
89
Table 3.9 (continued)
6~E;ME!'4! 'a'G ,
I ' : it : I 3,~u~C:; \f'c I. 'TRUSS '" ,\. do .. "
I (REF. ) , \OS~} ! I dTI! \ (K) i I I I I \ i I (2) 1 , I I I
I ACl-7-Za I :,ij I SI+6()i 3.6! ~.;~, '''"I 7.96\ :.88 1.J ,
I A(I-7-30 I - , 6(,<;01 ~'I '41 8.631 !. ~?! ).,j J. c- l:i'l ! A(I-I1-3 .. I (13 I 1067(,1 - -I 15 12. 31 1 J.c· i .. :''::
)1(1-11-3b I 03 108201 3.61 9.84 15 1 ~ ~ 12.28, t~lr,;"
! HtH5-3a\ C.j ! 118(11)1 3.61 S.64
1
19 12.83 1. '18 AO-15-3:;1 03 I :35'30 3.~1 9.84 22.5 13.771 1.63\ AO-i5-x OZ 1 !'33...JO 3.61 3.M ), 5 1.58
i AO-i-2 I !.~ j \ 6550 J "" 9.44
1 "'181
13.63, 1.%1 ... .J 1~' !?, I All-1l-2 I ;.j
I 115,)) 2.51
3.84 1. 58! i ~?, ,C:.bb-;\(!-15-2 .. I .,.~ !2;5(jl -, " ·~.~4, 13.02! 1. B4
i ~ • ..J ~~I h'-15-20 \ LC,e.)\ :' r:.: :.52 i
..... ..J. .:i.jj'l .0 11.8'1 F: I 55.;01 1+\ 3.3\ 12.91 12.69 1. (i2J
i --~J 32 I 95001 41 9.24 14.75! l~.~! ! 1. 17 r ...
! -:; )
1 ; (1t)Ij(J 1
11 9.3 17.85 1.37 ~,j ...... i~. 0'1
~ ~ . - I 1 (;');)l)! 9.2'1 25.5, 1':. 3'1 1.97 F"5 .. ' j 92(H~ , '3.3 9.65 :2.45\ .77, ~ ...
I .~ gav! ~I -:j -'4 ,- -I 12. ,,:I : I CJ'~' -- -.~ I :J., ~i :g .. I :;.300\ '3.38 1).001 1. i),)t I iV.U:i1
:';, ~ ... ! : 160tj' 4\ ~.2~1 1 It! 13.93' :. 'j,)! Fl,) I '3:,(11)' Ifl :C.83!
• -, ,,-I 1. 3'i \ wI.. ';I. !~, !c.. ~~ ~ -.. 32 I 5d('<:,! 'I! 1 Ii. 7 1 • ~,I r .. J B. ':ii:, 9. ;).;, F14 \ 5BOOI 4\ 8.921 l4 'c 1: 501
J1- . ~ ~~l 9.51, i~: :13(1~i; 'Ii 3. ~'t I ~3. 7S~
--, t ,.j~ .. -f. "', •. ,'0
,~- ! i , , I 1- - , ;:-:1 \Hyl;. ..... 'j
t
I S7:J J:'J I - , ."'+t,;1
1 t
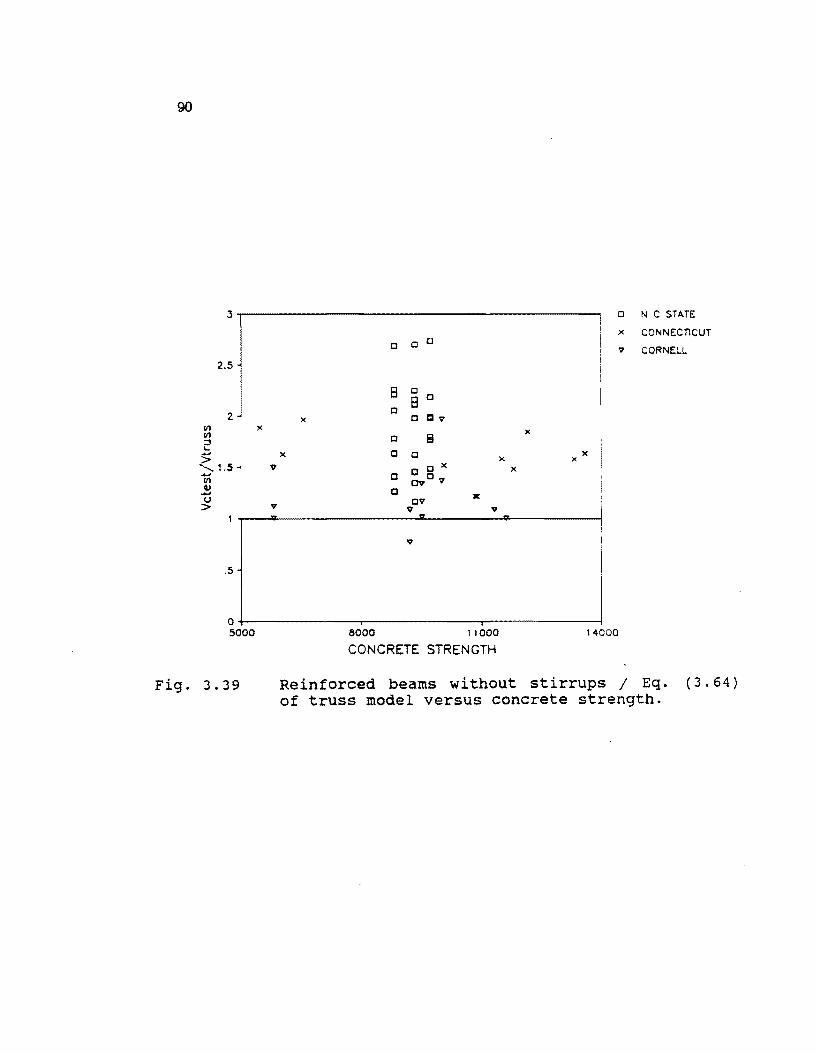
90
2.5
2 )(
III )(
III ::;) .... ...... x > '1.5 V ....
III Q) ...... c.J > V
.5
o 0 0
o CI v
o B o 0
o x o c 0
CV v o
OV V v
x x
x
)( x
o N C STATE
x CONNECnCUT
v CORNELL
O+-------------~------------_T------------~ 5000
Fig. 3.39
8000 11000
CONCRETE STRENGTH 14000
Reinforced beams without stirrups / Eq. (3.64) of truss model versus concrete strength.
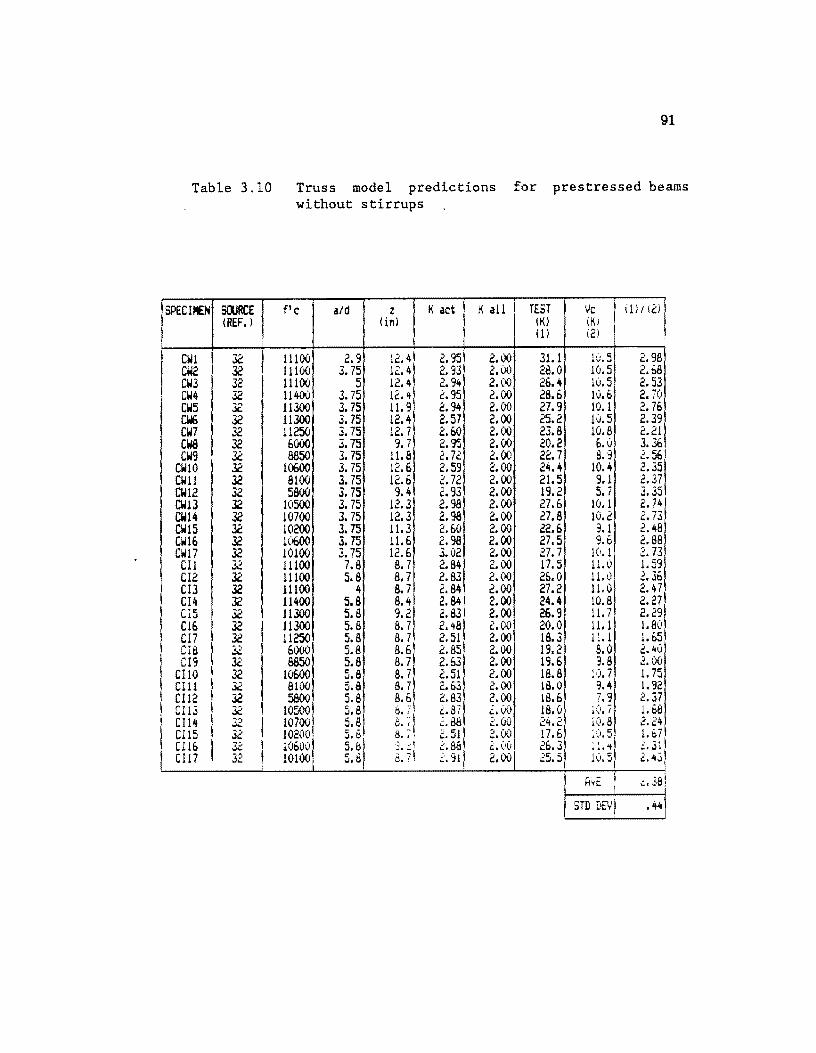
I
\ I
I
91
Table 3.10 Truss model predictions for prestressed beams without stirrups
SPEC 110 StlJRCE flc: aId z K ac:t K all I TEST Vc I il) I (2) I (REF.l (in) (Kl IKi
(1) (2) I
eWI 32 I 11100 2.9 1~. 4! 2.9~1 2.00 31. 1 10.5 2.98 ewe ae 11100 3. 75 1.:.4 2. '3J
1
2.00 28.0 10.5 2.:;8 CW3
1 32 11100 5 12.1+, 2.9 .. 2.00 26.4 10.5 2.53
CW4 32 11400 3.75 12. "\ 2.95 2.00 28.6 10. b 2. 70 eW5 32 11300 3.75 11. 9 2.94 2.00 27.9 10. 1 2. 76 CW6 ae 11300 3. 75 12.4 2.57 2.00 25.2 10.5 2.39 eW7 32 11250 3. 75 12.7 2.60 2.00 23.8 10.8 2.21 ewe 32 6000 3. 75 9. 7 2.95 2.00 20.2 D.0 3.36 eW9 32 8850 3.75 11.8 2.72 2.00 22. 7 8.9 2.56
eWI0 32 10600 3. 75 12.6 2.59 2.00 24.4 10.4 2.35 CWl1 ae 8100 3. 75 12.6 2. 72 2.00 21.5 9.1 2.37 ~12 32 5800 3. 75 9.4 2.93 2.00 19.2 5.7 3.35 CW13 ae 10500 3.75 12.3 2.98 2.00 27.6 10. 1 2.74 ~14 ae 10700 3.75 12.3 2.98 2.00 27.8 10.2 2. 73 CWI5 32 10200 3. 75 11.3 2.w 2.00 22.6 9.1 2.48 eWI6 ae 1(1600 3. 75 11.6 2.98 2.00 27.5 9. b 2.88 CWI7 ae 10100 3. 75 12.6 3.02 2.00 27.7 HI. 1 2. 73 CII ""J J ... 11100 7.B 8.7 2.B4 2.00 17.5 11. (I 1. 59 eI2 32 11100 5. B 8.7 2.83 2.00 26.0 11.0 j ........
... Jb
CI3 ae 11100 4 8.7 2.84 2.00 27.2 11.0 2.47 e14 ae 11'+00 5.8 8.4 2.84 2.00 24.4 10.8 2.27 CIS 32 11300 5.8 9.21 2.83 2.00 26.9 11.7 2.29! eI6 ae 11300 5.8 8. 7 ~:;ll 2.00 20.0 11. 1 1.80 Cl7 32 11250 5.8 8.7 2.00 18 • .3 1:.1 1.65 CIS 32 6000 5.8 8.6 2.85 2.00 19.2 8.0 2.40 CI9
I 32 8850 5.8 8. 7 2.53 2.00 19.6 3.8 2.00
eIlO 32 10600 5.8 8.7 2.51
1
2.00 18.8 !'j,7 1.75 GIll 32 8100 5.8 B. 7 2.53 2.00 18.0 3.4 1.92 CIl2 ae 5800 5.8
1 8.§\ 2.83 2.00 18.6 7.9 2.37
C11.3 i 32 \ 105001 5.8 ~. {I 2.87 ':.00 ;~. ~I ;(1. i 1. b8 CIl" ! 32 I 10700 5.81 I:l. I 2.88 2.00 iO.8 2.24
I .......
ell5 32 10200 5'1,
B. 7 \ 2.51 2.00 17.6 :il: ~ I 1. f.1 CIl6
1 32 I 1060~! 5.8 3 • .:' 2.88 2.00 26.3 ~. 3~1 C117 ~., 10100 5.8 8.7! 2. '31 2.00 -.r ;;;
1(i. 5/ J ... ,"""" • .J .:.4,)
r~ I .' - i I Hvt, ~.J8:
I STD D€VI .44!
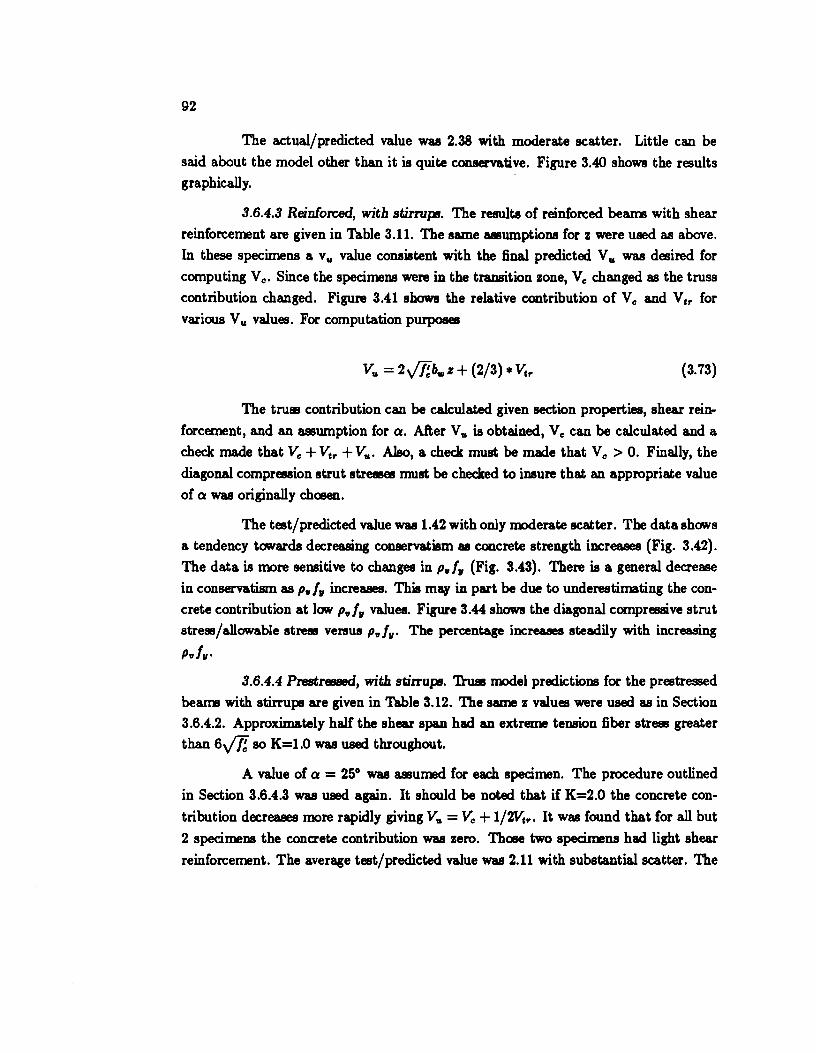
92
The actual/predicted value was 2.38 with moderate scatter. Little can be
said about the model other than it is quite conservative. Figure 3.40 shows the results graphically.
3.6.4.3 Reinforced, with stirrups. The results of reinforced beams with shear
reinforcement are given in Table 3.11. The same 811Jumptions for z were used as above.
In these specimens a v u value consistent with the final predicted V u was desired for
computing Ve. Since the specimens were in the transition zone, Ve changed as the truss
contribution changed. Figure 3.41 shows the relative contribution of Ve and V,,. for
various V u values. For computation purposes
(3.73)
The truss contribution can be calculated given section properties, shear rein
forcement, and an 811Jumption for Q. After V. is obtained, Ve can be calculated and a
check made that Ve + vt,. + Vu. Also, a check must be made that Ve > o. Finally, the
diagonal compression strut stresses must be checked to insure that an appropriate value
of Q was originally chosen.
The test/predicted value was 1.42 with only moderate scatter. The data shows
a tendency towards decreasing conservatism 88 concrete strength increases (Fig. 3.42).
The data is more sensitive to changes in P./" (Fig. 3.43). There is a general decrease
in conservatism as P./" increases. This may in part be due to underestimating the con
crete contribution at low P./" values. Figure 3.44 shows the diagonal compressive strut
stress/allowable stress Ve1'8U8 P./71. The percentage increases steadily with increasing
P./71·
3.6.4.4 Prestressed, with stirrups. ']}uas model predictions for the prestrelmed
beams with stirrups are given in Table 3.12. The same z values were used as in Section
3.6.4.2. Approximately half the shear span had an extreme tension fiber stress greater
than 6VH 80 K=I.0 was used throughout.
A value of Q = 25° was 811Jumed for each specimen. The procedure outlined
in Section 3.6.4.3 was used again. It should be noted that if K=2.0 the concrete con
tribution decreases more rapidly giving V. = Ve + 1/2Vt,.. It was found that for all but
2 specimens the conaete contribution was zero. Those two specimens had light shear
reinforcement. The average test/predicted value was 2.11 with substantial scatter. The
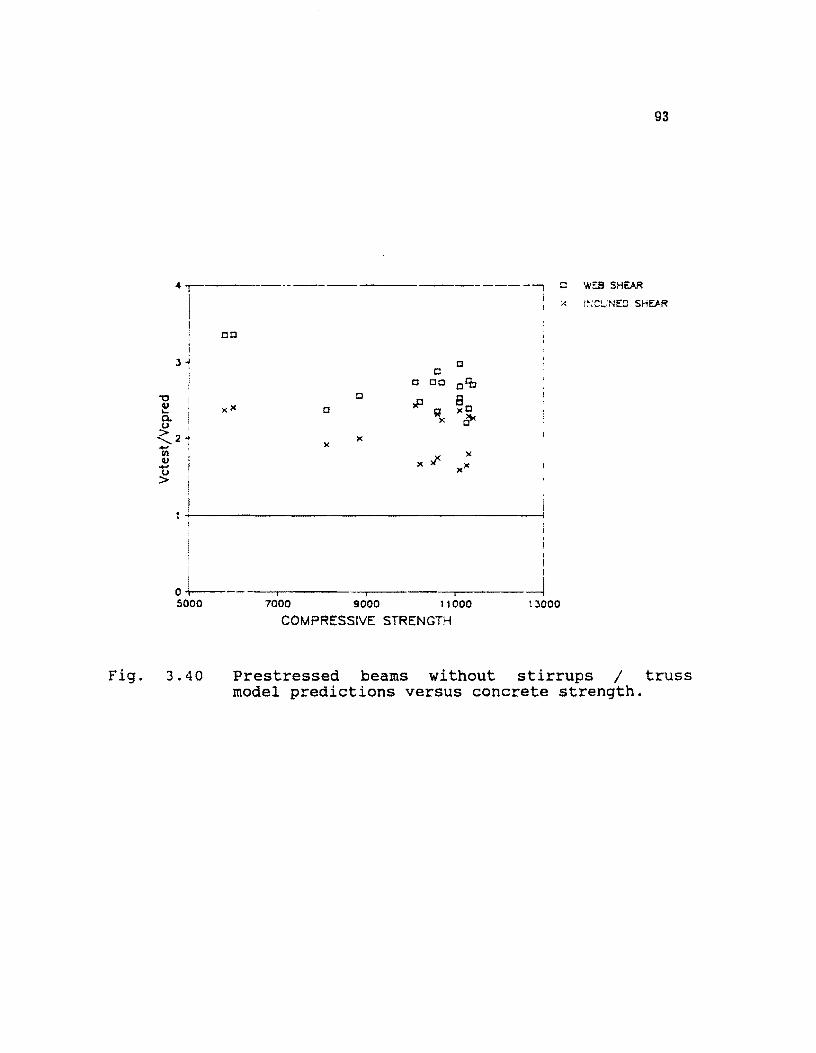
Fig.
4 ~----------------
-0 cu l-e.
I , ; cO
1 J-l
I
CJ I
> 2--~! III
~ i > I
c c 00
,p ~x
CJ
c
)(
X.J<
c
c lb
~o ~
)(
)(><
I+I--------------------------------------~ I i
I
oL Iii I I I
~
93
:::: W=:a SHEAR
A 1~~Ct..INEO SH~.R
5000 7000 9000 1 1000 13000
3.40
COMPRESSIVE STRENGTH
Prestressed beams without stirrups / truss model predictions versus concrete strength.
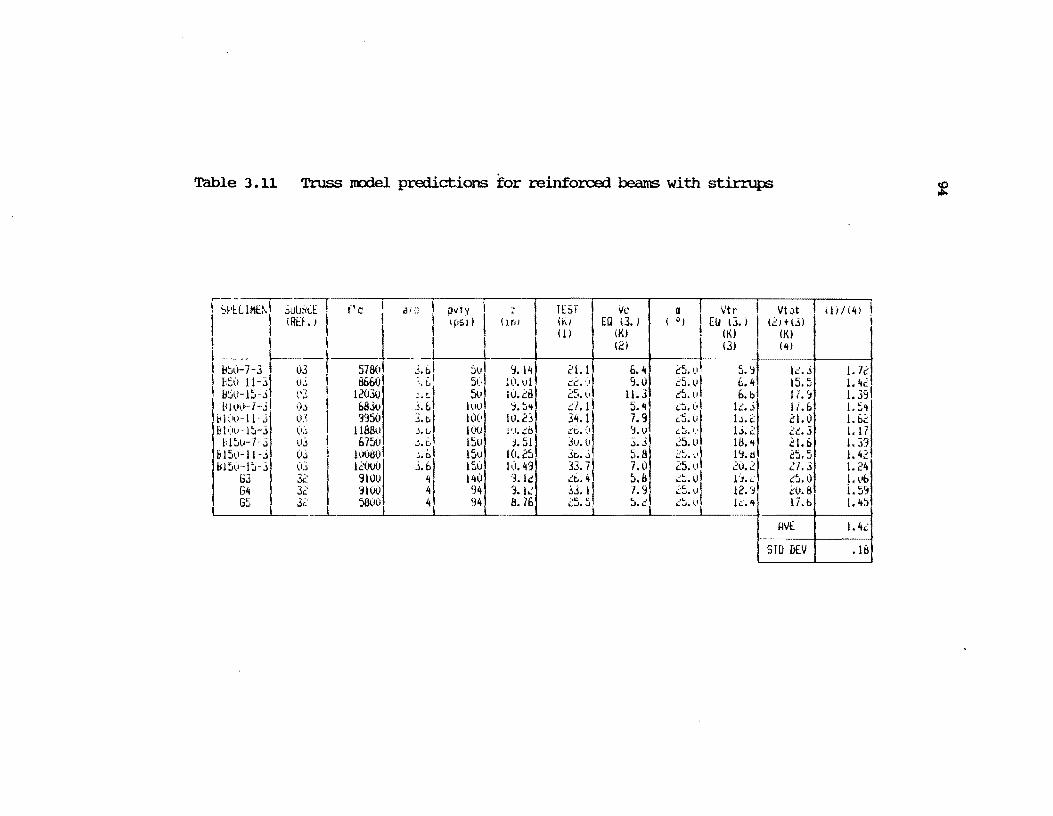
Table 3.11 Truss IOOdel predictions for reinforced beams with stirrup:;
! S~'lUME~J ;~-LJ!iI.I! f' c ! a/o I p"ry I I I (REI.) I 1 I \ psil I ! I I I I 1----1 1 -- I , I [i~(J-7-3 1 03 I 5780 3.bl ::,vl I i'5(l--11-31 u.'. i 86601 ; .. t:. 1 51 .. 1 ! 1150-15-JI !\~ I 1203°1 ;. tl 5(11
li JtlI.H - .. :d ,)j I hiUu d, t<L'tl-ll- 3 (13 I Bhl(l-l~-3 (I~ fISu-]-j ll~ t
BI5v-ll-j 03 I
---'I J. ~I .. -
9950 1O(!
I I 88tl J.t" 1(1(1
b750 ~" t.l 15u 1(10801 ~.ol ISu
1115(1-1:,-j (13 12000 3.6 150 G3 32 9100 4 14(1 G4 32 910\) 4 94 G5 32 58(1(1 4 94
(1 rll
1(1: 231
':I. 14\ W. til
IV. 2dl I'). ,b 1.51
10.25 1(1.49 3.1~ 9. 1.:' 8. 7&
H5T 0';) (1)
21. I ~2. ,) -.t:' . .::,..·.0 27.11 34.1 C'b, (I 3'J.ll 3r..3 3~. ?I ':::1:. ... 33. II w.c I::"
C..J • ..J,
lie ECl \3.)
(K) (2)
b.4 9.0
11.3
5. "I 7.9 ':J. V 3.31 5.8 7.0 5.8 7.9 ~ ~ ..J ....
tJ I Vtr W/(4) Vtot 121+(3)
(Kl (4)
( Ii) I I Ell 13.) I 00
~3) +I-----+----~ .::5. til 5. ':l .:::5. vt 6.4 25.,,1 6.bl '::::'. (.1 1.::.3 2~. 01 IJ.2 ,,:,;,1,1 13.2 25.v IB.'+ ',c I I ':I. Ii 25:(: 2(),2 25.1I1 l'j'L ·c I 12.'1 .:-..).\.1
25. t}, 12. 'I
--. -I 11. b
12.3 15.5 11. ':i
21.0 2i.3 21.b ".5
1
t·~ ...., .:/. J c:5.() 20.& 17.6
AVE
SrD DEV
1.72 1.42
1 1.3':1 1. 5,+ 1. 62 1. 17 1.39 1.42 1.24 I. tl6 i. 59 I.ltj
1.4':::
• 18
f
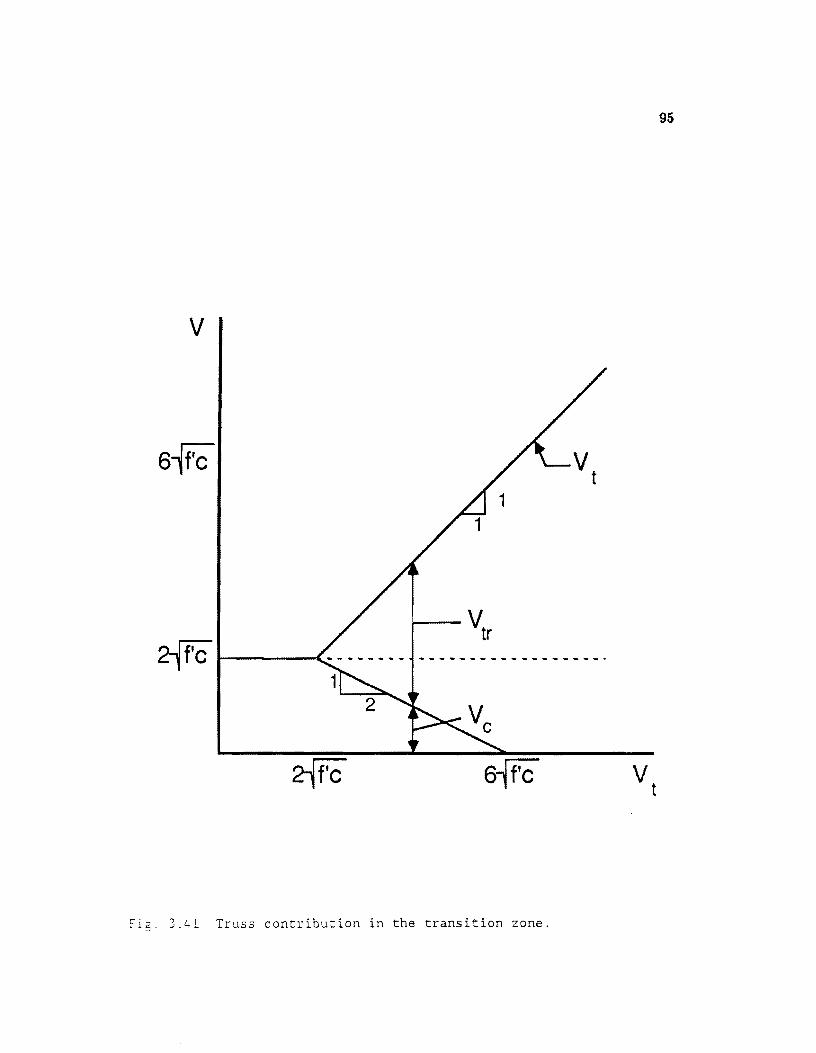
95
v
61fC
2-{fC 1----<-
6{rC
fig. 3.41 Truss contribution in the transition zone.
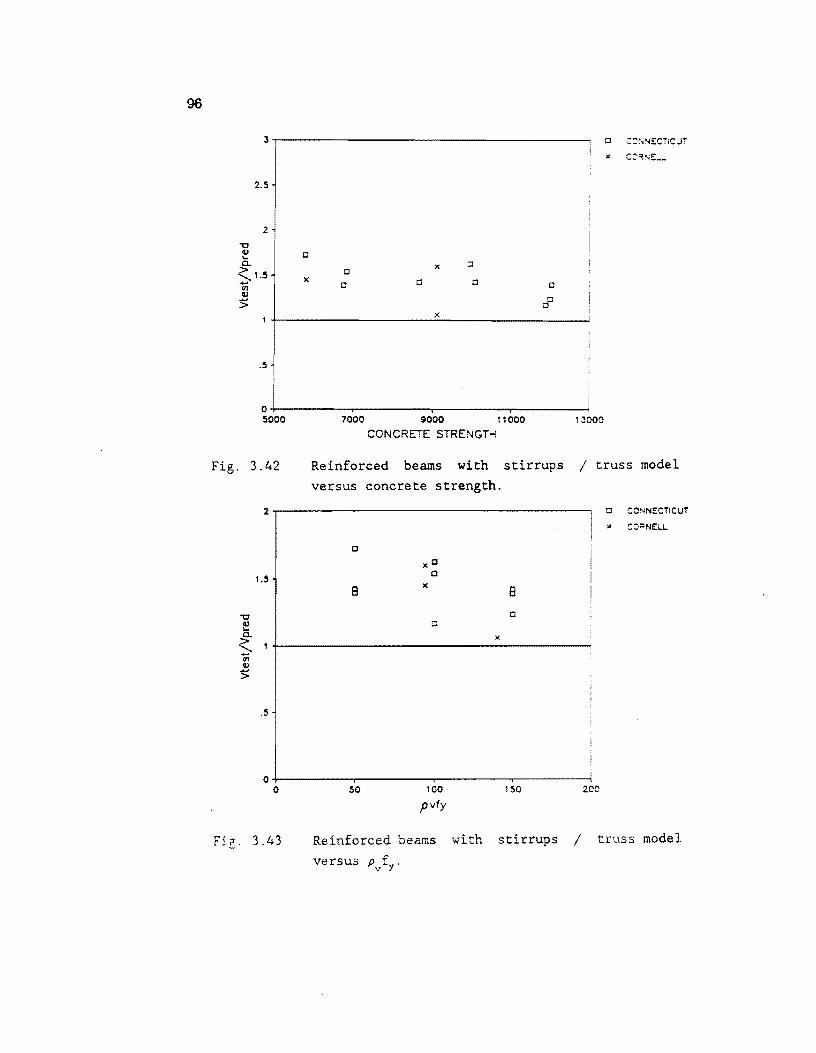
96
2.5
2
-0 41 0 '-c.. x D <:. 1.5 0
x Cl 0 ..... 0 0 (II 41
:> r.:P x
.5
O+---------~--------~--------r_------~ 5000
Fig. 3.42
7000 9000 11 000 1JOOO CONCRETE STRENGTH
Reinforced beams with stirrups / truss model versus concrete strength.
2~----------------------------------------~ o CONNECTICUT
)( CJRNEu...
C
xC
1.5 c
8 l(
8
-0 0
I!:! 0 c.. )( <:. 1
'" 41
:>
.5
0 0 50 100 150 200
pvfy
Fig. 3.43 Reinforced beams with stirrups / truss model
versus p .. / y •
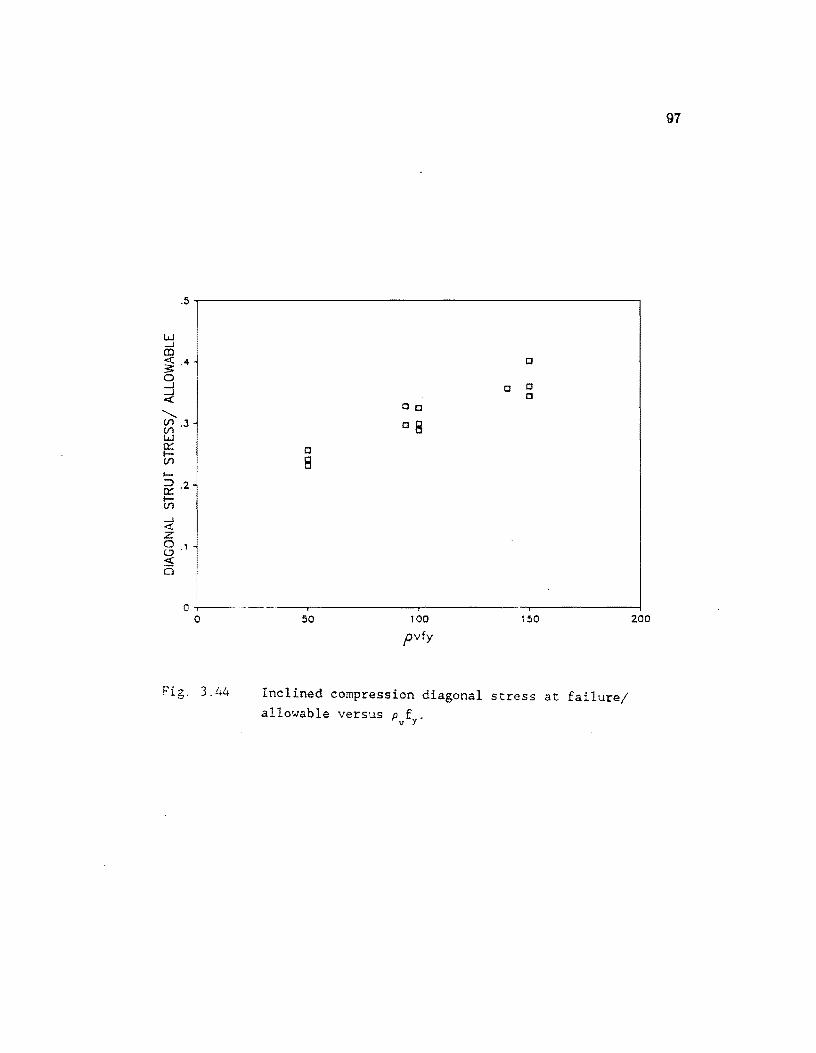
.5
W ...J OJ ~.4 0 ...J ...J « "-(/l . .3 (/l W ~ I-(/l
I-
~ .2 I-(/l
...J « z 8. 1
« (5
0 0
Fig. 3.44
CJ
CJ CJ a
00
08
a 8
- .. __ . , 50 tOO 150
pvfy
Inclined compression diagonal stress at failure/ allowable versus Pvfy'
97
200
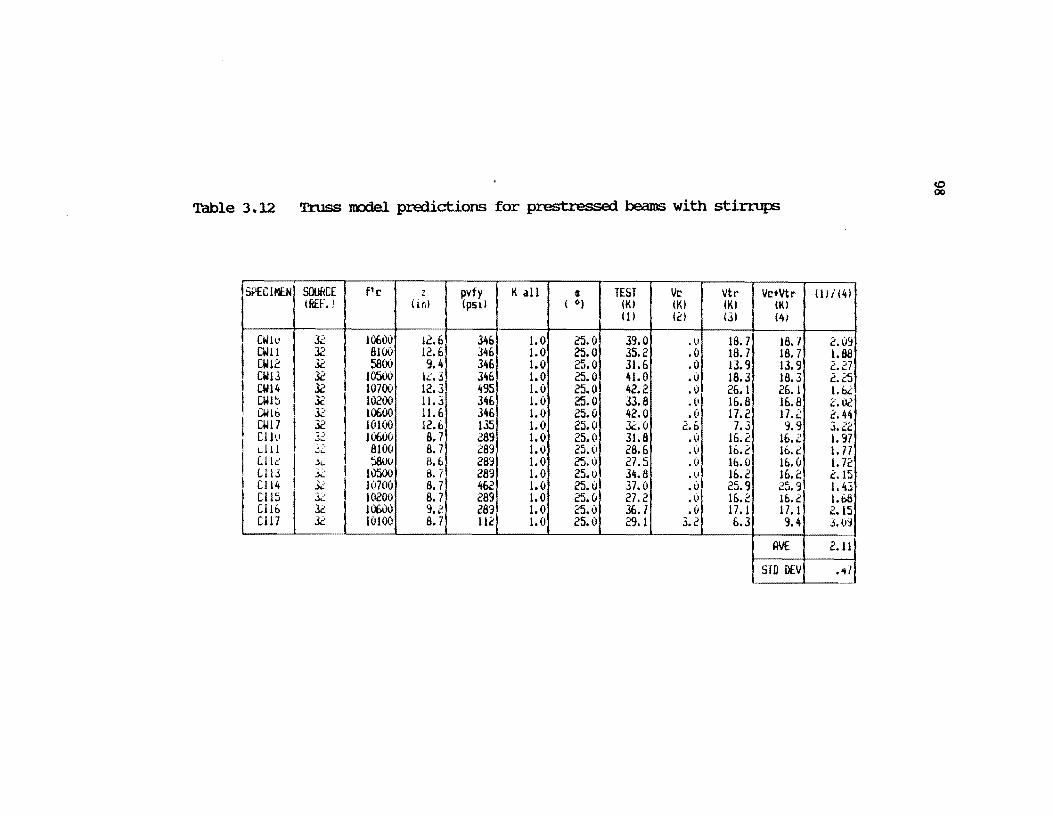
Table 3.12 Truss model predictions for prestressed beams with stirrup:;
SPECIMEN SOURCE fIe z pvfy K all I TEST Vc vtr Vc+Vtr (REF. ) (i rd (pSI) ( 0) (K) (K) (K) (K)
III (i:' ) ti) (4)
I (Wit' 32 IObOO 12.6 346 1.0 25.0 39.0 .ll 18.7 18.7 CWll J2 8100 12.6 346 1.0 25.0 35.2 .0 18.7 18.7 CWI2 3C: 5800 9.4 346 1.0 25.0 31.6 .0 13.9 13.9 CW13 32 10500 12.3, 31t6 1.0 25.0 41.0 .0 18.3 18.3
I CW14 I 32 10700 12.3 495 1.0 25.0 42.2 .0 26. 1 21i. I , ~Wl~ I 3C: 10200 11 • .:i 346 1.0 25.0 33.8 .0 16.8 Iii. 8 l..Wlb 32 10600 11.6 341i 1.0 25.0 1t2.0 .0 17.2 17.2
I CW17 I J2 10100 12.£> 135 1.0 25.0 32.0 2.6 7.3 9.9 Ciltl -;y 10600 8.7 289 1.0 25.0 31.8 .0 16.2 Iii. 2 I
... ~ Lill 22 8100 8.7 289 1.0,) 25.0 28. Ii .V 16.2 16.2
I C112 I ,k I
580(1 B.b 289 1.0 25.0 27.5 .0 16.0 16.0 LIlJ 32 10500 B.7 289 1.0 25.0, 31t.S .li 16.2 Iii. 2
I ClIlt 32 1(1700 8.7 ItIi2 1. (I 25.0 37.0 .0 25.9 25.9 Cl15 32 10200 8.7 289 1.0 25.0 27.2 • (I 16.2 Iii. 2 ClIb 32 10600 9 C) .1- Z89 1.0 25.0 JIi.7 .0 17. 1 17.1 C1l7 32 10100 8.7 112 1. (I 25.0 29. 1 3. Z 6.3 9.4
AVE
STD DEV
HI/(4)
2.09 1.88 2.27: 2.25 1. be: 2.02 2.44 3.22 1. 97 1.77' 1.7'21 2.15 1. 43 1.66 2.15 J. (1':1
2.11
.41
<0 00
99
results are plotted against concrete strength in Figure 3.45. The results were also plot
ted against PV/lI (Fig. 3.46). The trend or decreasing conservatism as PV/lI increases is again apparent. Shear failures originating frem inclined cracking are somewhat less
conservatively predicted than those originating from web shear cracking. The extreme
conservatism at low Pv /11 values would indicate that the method substantially underes
timates the concrete's contribution. Figure 3.47 shows the concrete compression strut
stress/allO'NB.ble versus PV/lI'
3.6.5 Sl1nvnary. The numerical. predictiona for each of the three models have
been compared to the available teat results. On average all models were conservative
for all cases. There were, however, a number of teste that were unconservative. The
amount of scatter in the data as indicated by the standard deviation varied considerably
between models and between types of beams.
The different methods will be evaluated statistically as a means of comparing
relative accuracies. For present purposes values at which there is 95% confidence that
90% of the values are above and that 90% of the values are below will be computed.
This particular choice of confidence level and limits is somewhat arbitrary, but will serve
current purposes. The values computed give an indication on haw closely the model
predicte behavior. Line 1 of Figure 3.48 showa data that is very tightly bunched about
the mean. This indicates a model that is highly accurate. Line 2 on the other hand
would represent a model with considerable scatter in its predictions.
Table 3.13 contains the resulta of the statistical evaluation. Upper and lower
confidence limits were computed by:
X=z±Kp.
where K is a factc% dependent on the confidence level, percent of members above or below, and the number of test pointa [Sl[. Values of K not explicitly given
were obtained. through interpolation. The resulte given for reinforced beams are based
on Equation 3.3. The reaulta for prestressed beams are based on using the appropriate
values or V cO or V ctII. The ccmparison will only be conducted for members with shear
reinforcement at ultimate since both Canadian and tl'lB methods are not meant for
unreinforced members.
The results are shawn graphically in Figure 3.49. It is quite obvious that the
AASHTO/ACI equations give accurate resulta and that they give the smallest scatter.
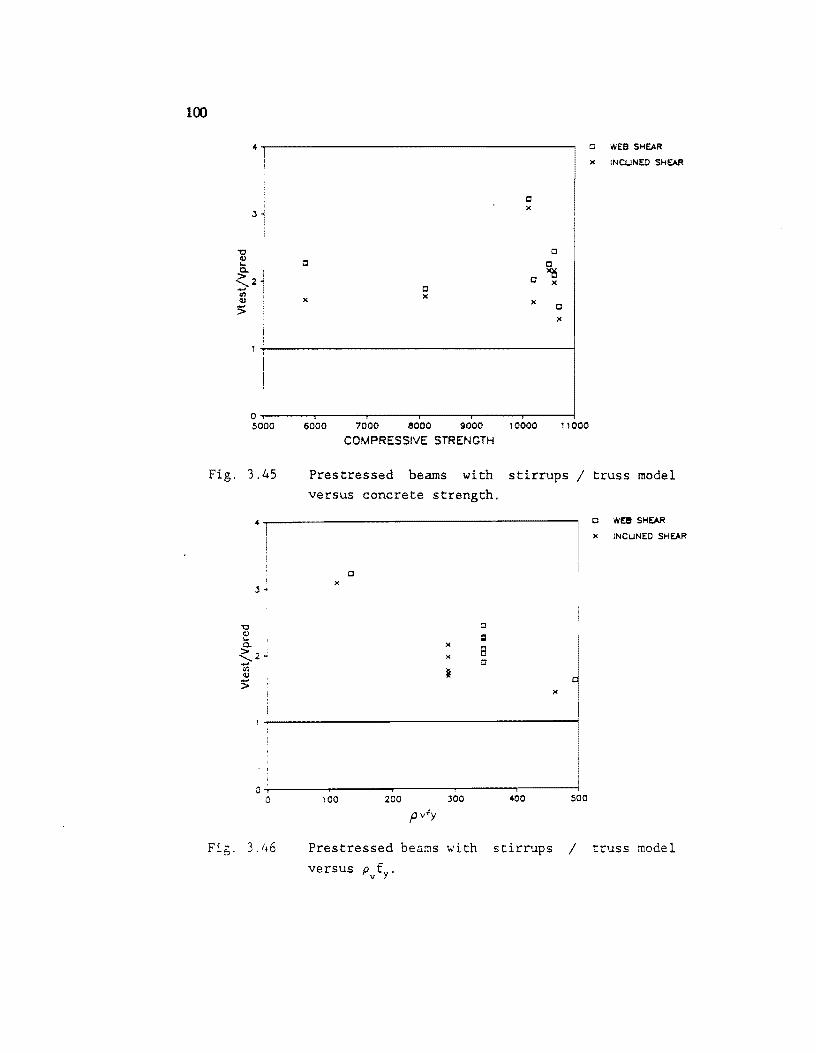
100
Cl
" Cl
"
c
"
C
"
Cl WEe SHEAR
" INCUNEO SHEAR
Cl
Cl ~ "
Cl
"
O+-----~r-----~------~------r_----~------~
5000
Fig. 3.45
6000 7000 8000 9000 10000 11000
COMPRESSIVE STRENGTH
Prestressed beams with stirrups / truss model versus concrete strength.
Cl
"
" "
c 1:1
8 Cl
C wEe SHEAR
" INCUNEO SHEAR
"
O~:--------r--------r--------~-------r------~i o 100 200 JOO 400 500
Fig. 3. /,6
pvfy
Prestressed beams with stirrups / truss model
versus Pvfy'
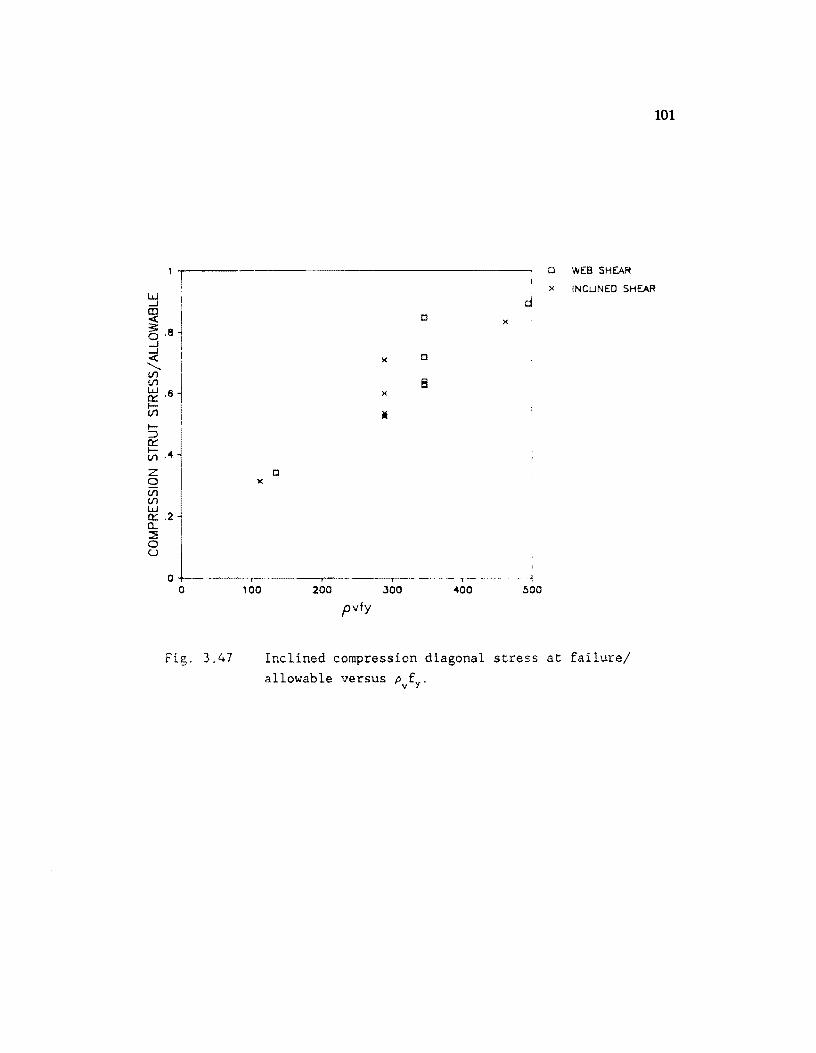
W -l CD
3§ 0.8 -l -l « '-... Vl Vl ~ .6
Iii I::J a::: Iii .4
Z o Vl Vl w a::: .2 a.. :::; o u
a a
Fig. 3.47
x
100
101
o WEB SHEAR
x INCUNED SHEAR
d o x
)( o
x
o
I
- -,-- -~ 200 JOO 400 500
pvfy
Inclined compression diagonal stress at failure/
allowable versus Pvfy'
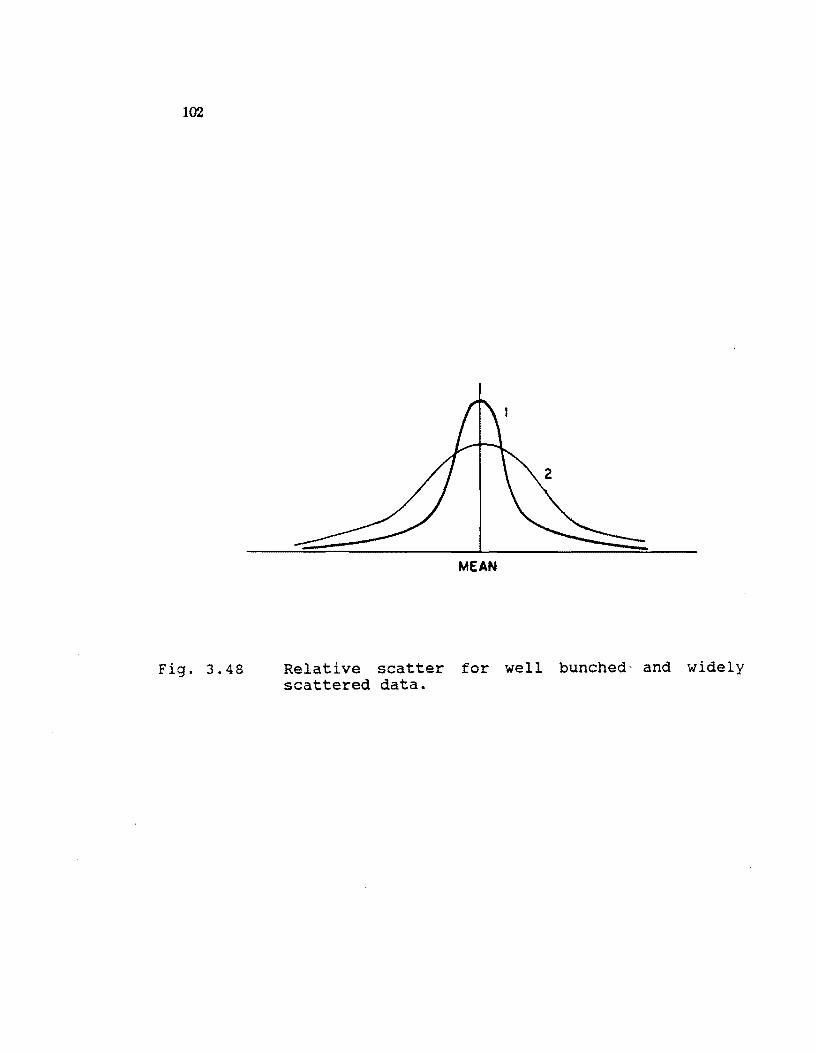
102
Fig. 3.48
MEAN
Relative scatter for well bunched - and widely scattered data.
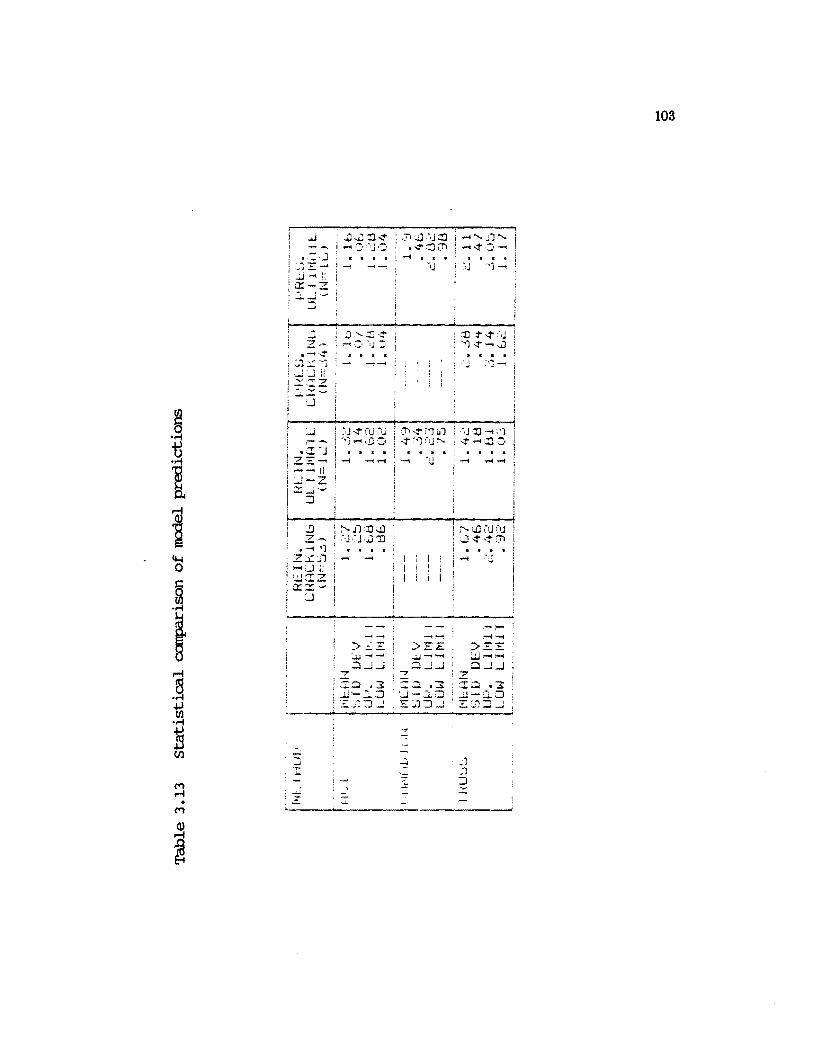
M ~ •
M
Q)
~
. ::.J ..J ~!l a:::-z .:.......: .• -~ : .J~~"~ '2 6_, ; ~ '..-' Ij _'
• -t ... :t' ! :,,::.:: ~'1j -t -t ~
! -....!:..J it t :t:~:r z !~G-
,)1 <JJ~J ::::J • ..:- ::J ;J"1
.....
..... ,.;1,
..-.4"<:, -t . ~'J'j -
::0 :t ..;t"J i "1 -;;r-...J
i 'Jl..;t :'1 in ,"J::O""; '1 ; ~ :~1 (IJ ~ ~ ~.,...... OJ '=1
z
::>.::::=: ~-4-';
~..J-' 7' "7
--t ~
:>:E:E "..,j-;""""!
::;-J-l
l~;) .3::::~.3 "Il_', 0 ; '.J '-':" 0 ! ~.,;:S..J ,E:.tJ:J.J
i ....... ..... ..... ,
I ! ;'- <JJ ('J ctj ; ~..:t~~(T'a
'Z
~""""'f
::>;:-;::..w-,.... ::l_L..I
:I~ .3 .j .. i'-;"O
, :=: Ui O....l
~------------------------------~
103
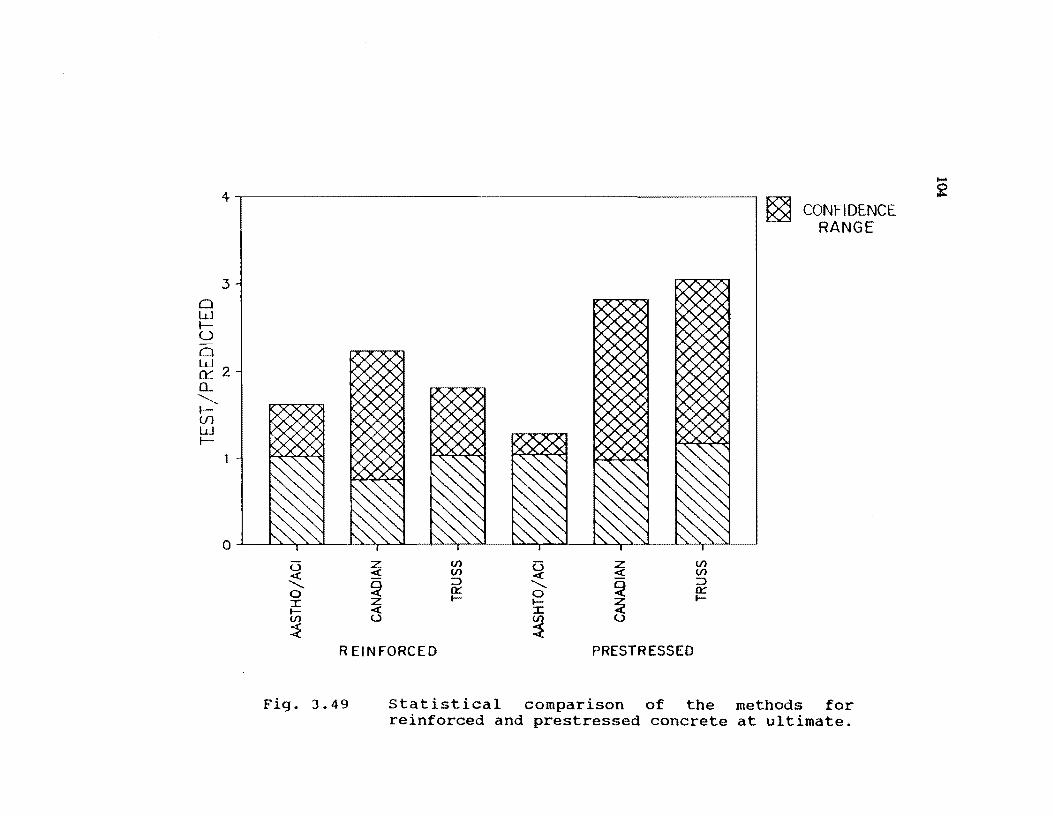
4.-------------------------------------------------------------.
~
o W IU
3
o w c:t: 2 (L
~ IUl W I-
0
0 z r.n < < r.n ........... ~
::::> 0 a::: I Z I--
I-- < r.n 0
~
[5 z < <
........... ~ 0 I- ~ I
~ 0
r.n r.n ::::> 0::: I--
CONFIDENCE RANGE
REINFORCED PRESTRESSED
Fig. 3.49 statistical comparison of the methods for reinforced and prestressed concrete at ultimate.
..... ~
105
The Canadian Code General Method givel substantial scatter. Furthermore the limit
values for both reinforced and prestre88ed be&ml are below one. The truss model gives
substantial scatter. The truss model does, however, give limit values greater than one.
So fal.' as accuracy goes AASHTOI ACI does the best job for high strength members
reported failing in sheal.'.
One important question at the outeet of this investigation was what trends
would form in the data as concrete strength increaaea. While a few isolated tests con~
ducted holding all but the concrete strength constant may show some trend, the data
base taken as a body shows little change in conservatism with changing concrete strength.
Factors such as aid ratio, percentage of longitudinal reinforcement, and level of shear re
inforcement all showed much greater influences than concrete strength. For the available
test results, increasing concrete strength has not made the current methods evaluated
unconservative.

!!!!!!!!!!!!!!!!!!!"#$%!&'()!*)&+',)%!'-!$-.)-.$/-'++0!1+'-2!&'()!$-!.#)!/*$($-'+3!
44!5"6!7$1*'*0!8$($.$9'.$/-!")':!
CHAPTER 4. EXPEBIMENTAL PROGRAM
4..1 Introduction
The goal of the experimental portion of this program was to detennine the
failure loads and behavior in shear of prestressed girders made of high strength concrete.
The specimens were designed to examine a wide range of shear reinforcement values. The
reinforcement values were chosen to fill gaps in the meqer existing data base for shear
tests of high strength prestressed concrete be8.118.
Ten shear tests were perfonned in this project. Six girders were cast specifically
as shear specimens. The other four shear tests were conducted on end sections of the
ftexural specimens tested by Castrodale [131. Further information on the ftexural tests of
these specimens are contained. in the companion report 381-3. The six shear specimens
were a modified version of the ftexural specimens. The six shear specimens had a shear
span to depth ratio, aid, of 3.0 while the end sections of the ftexuralspecimens had an
aid ratio of 3.2.
The amount of shear reinforcement was the primary variable in this investiga.
tion. Shear reinforcement values, V" ranged from zero to ISv7!6.,d. The quantity of
s~ear reinforcement had a direct effect on the size and spacing of the web reinforcement.
Several minor variables were considered. as well. The location of supports
proved critical to behavior. Several stirrup details were evaluated.. The effects of concrete
strength and prestress force on shear cracking were also studied.
4.2 Description and Design of Test Specimens
4.2.1 Series 1. Series 1 consisted of three girders. Figure 4.1 sheM's the C1'08!J
section dimensions and properties of the section used in Series 1 and 2. All girders were
16 ft long. The shear and ftexural reinforcement used in Series 1 is shown in Figure 4.2.
Throughout the project the prestressing strands were plac:ed in a grid pattern 11/4" on
center. Load points and support locations are illustrated in Figure 4.3. All three girders
of this series were cast at one time using a long line prestressing bed. This aasured
identical concrete and prestress force in all three girders.
The primary variable was the amount of shear reinforcement. Specimen I
I had no shear reinforcement excluding end detail steel which extended from the end
of the girder to 7.5 inches into the shear span past the support centerline (Fig. 4.4).
107
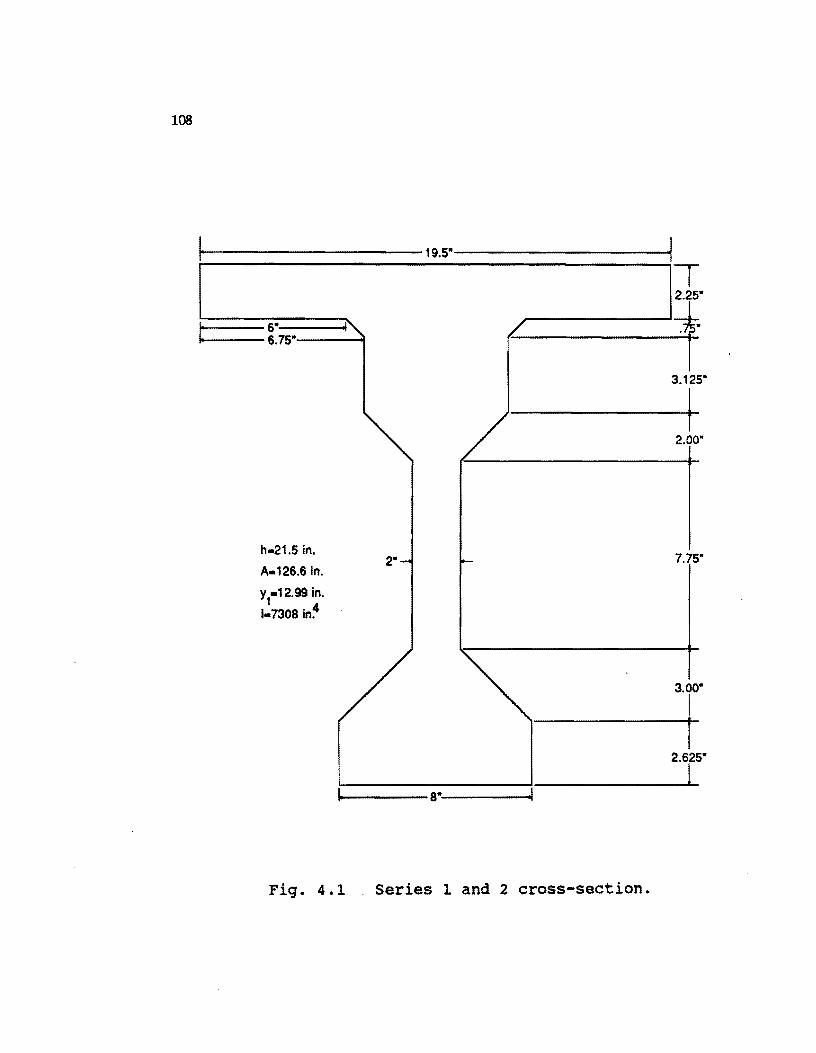
108
,.
t 6" 6.75"
h.21.5 in.
A.126.6 in.
Yt12.99 in.
1.7308 in~
19.5"
~-------8·~------~
Fig. 4.1 Series 1 and 2 cross-section.
I I 2.25·
I~ 3.125"
I 2.00·
T 2.625"
1
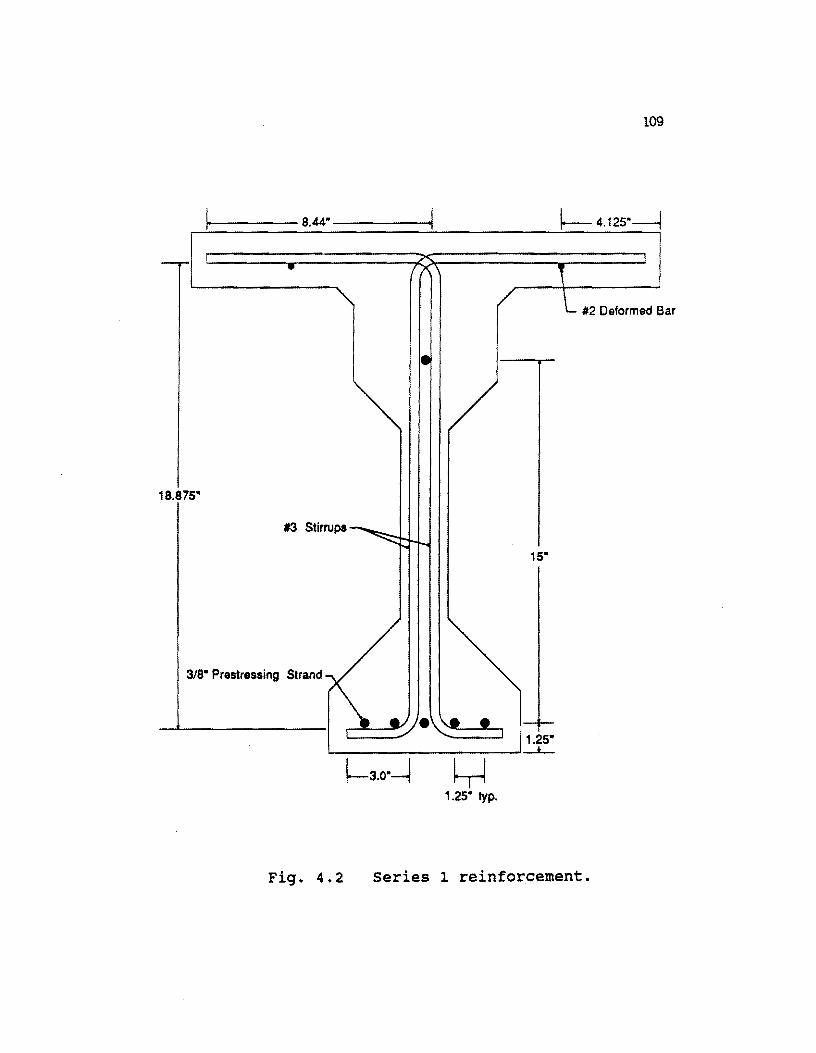
109
l-~ ---8.44"---...-j~
#2 Deformed Bar
18.875-
'3 Stirrups
3/8- Prestressing Strand
1.25-L--_________ ....J~
~3.0"~ ~ 1.25- typo
Fig. 4.2 Series 1 reinforcement.
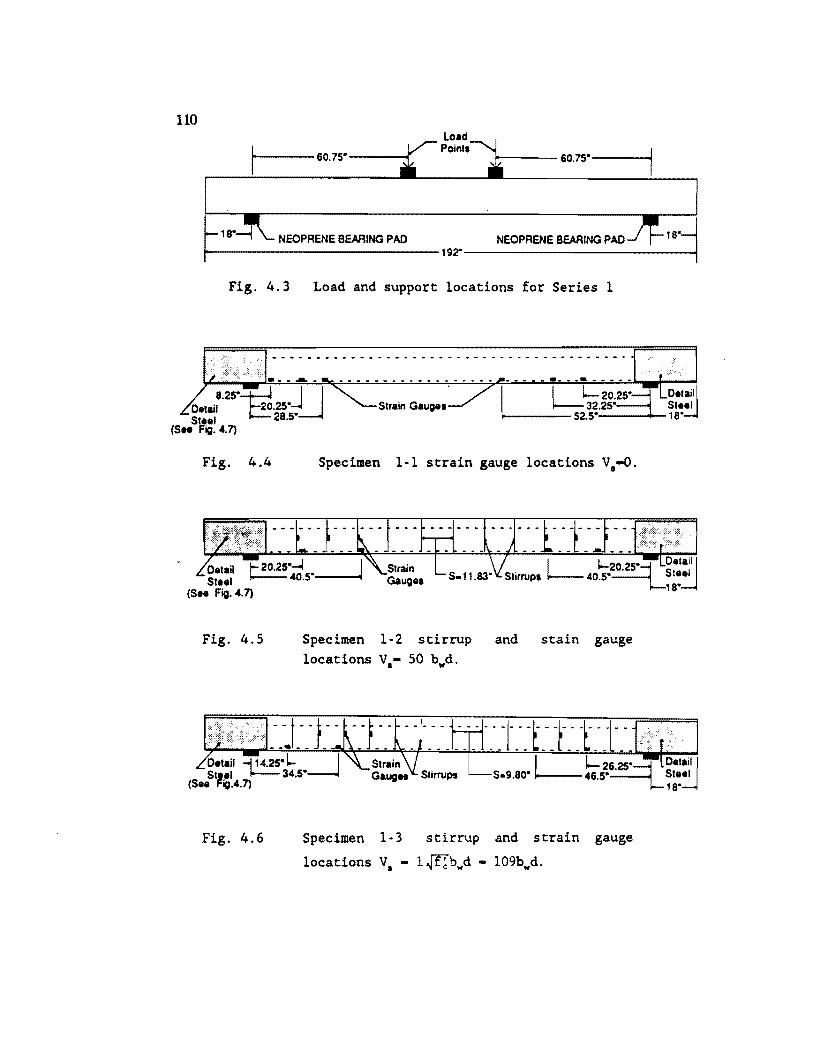
110
1-----60.75" ----I'"
NEOPRENE BEARING PAD
load Point.
1-----60.75"----1
NEOPRENE BEARING PAD ~--------------19~--------------~
Fig. 4.3
Fig. 4.4
Fig. 4.5
Load and support locations for Series 1
- ....... ..... .... --- .. "'" ...
Strain Gaug ••
Specimen 1-1 strain gauge locations V.-o.
Specimen 1-2 stirrup locations V.- 50 bwd.
and stain gauge
O.tail 1.14.~:1-" --I - -- - -- -- -- -- -- ,-- -- C.;6~-S: O.ljil SI •• I 34.5"----1 5-9.80· I--- 46.5" . St •• 1
(S.. Fig.4.7) 18"
Fig. 4.6 Specimen 1-3 stirrup and strain gauge
locations VI - 1 ~b .. d - 109b .. d.
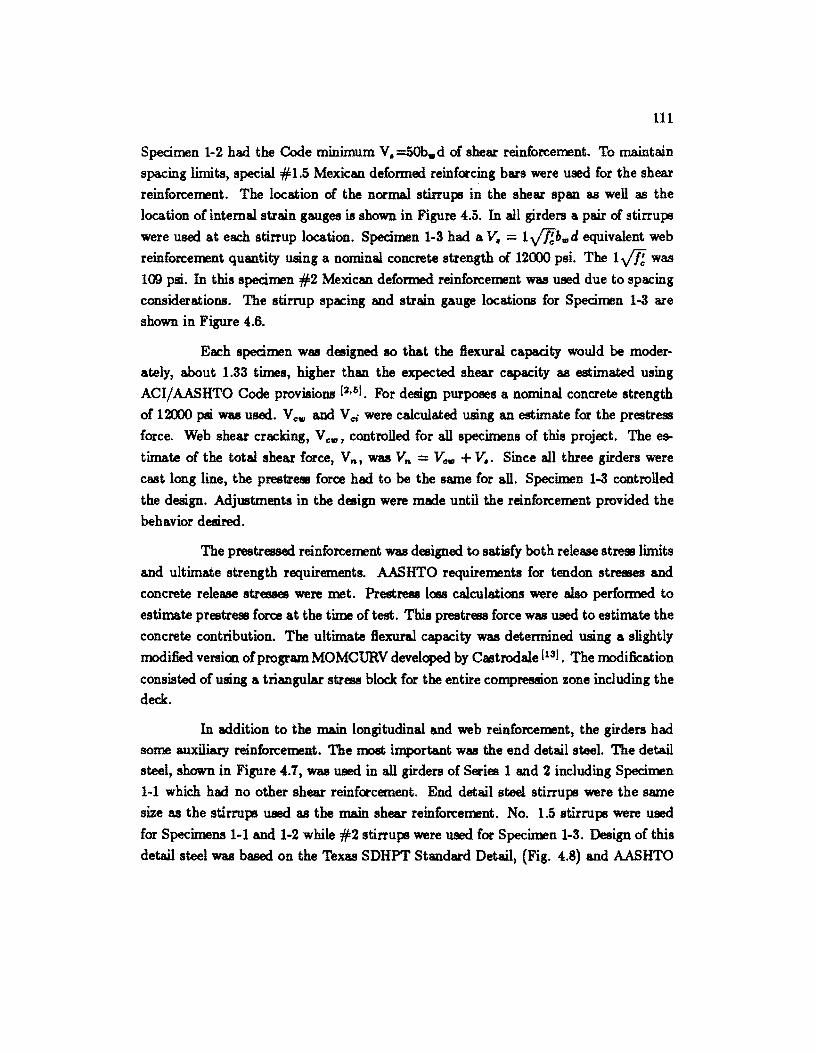
111
Specimen 1-2 had the Code minimum V,=50b.d of she8l' reinforcement. To maintain
spacing limits, special #1.5 Mexican deformed reinforcing b8l'S were used for the shear
reinforcement. The location of the normal stirrups in the she8l' span as well as the
location of internal strain gauges is shown in Figure 4.5. In all girders a pair of stirrups
were used at each stirrup location. Specimen 1-3 had a V, = 1 Jlfb. d equivalent web
reinforcement quantity using a nominal concrete strength of 12000 psi. The 1 Jlf was
109 psi. In this specimen #2 Mexican defonned reinforcement was used due to spacing
considerations. The stirrup spacing and strain gauge locations for Specimen 1-3 are
shown in Figure 4.6.
Each specimen was designed 80 that the ftexural capacity would be moder
ately, about 1.33 times, higher than the expected shear capacity as estimated using
ACI/ AASHTO Code provisions [:MI. For design purposes a nominal concrete strength
of 12000 psi was used. Vc• and V ci were calculated using an estimate for the prestress
force. Web shear cracking, V c., controlled for all specimens of this project. The es
timate of the total shear force, V'll' was V'll = V CWI + V,. Since all three girders were
cast long line, the prestreSB force had to be the same for all. Specimen 1-3 controlled
the design. Adjustments in the design were made until the reinforcement provided the
behavior desired.
The prestressed reinforcement was designed to satisfy both release streSB limits
and ultimate strength requirements. AASHTO requirements for tendon streSBeS and
concrete release stresses were met. Prestress 1088 calculations were also perfonned to
estimate prestreSB force at the time of test. This prestress force was used to estimate the
concrete contribution. The ultimate ftexural capacity was determined using a slightly
modified version of program MOMCURV developed by Castrodale [131, The modification
consisted of using a triangular stress block for the entire compression zone including the
deck.
In addition to the main longitudinal and web reinforcement, the girders had
some auxiliary reinforcement. The most important was the end detail steel. The detail
steel, shown in Figure 4.7, was used in all girders of Series 1 and 2 including Specimen
1-1 which had no other shear reinforcement. End detail steel stirrups were the same
size as the stirrups used as the main shear reinforcement. No. 1.5 stirrups were used
for Specimens 1-1 and 1-2 while #2 stirrups were used for Specimen 1-3. Design of this
detail steel was based on the Texas SDHPT Stand8l'd Detail, (Fig. 4.8) and AASHTO
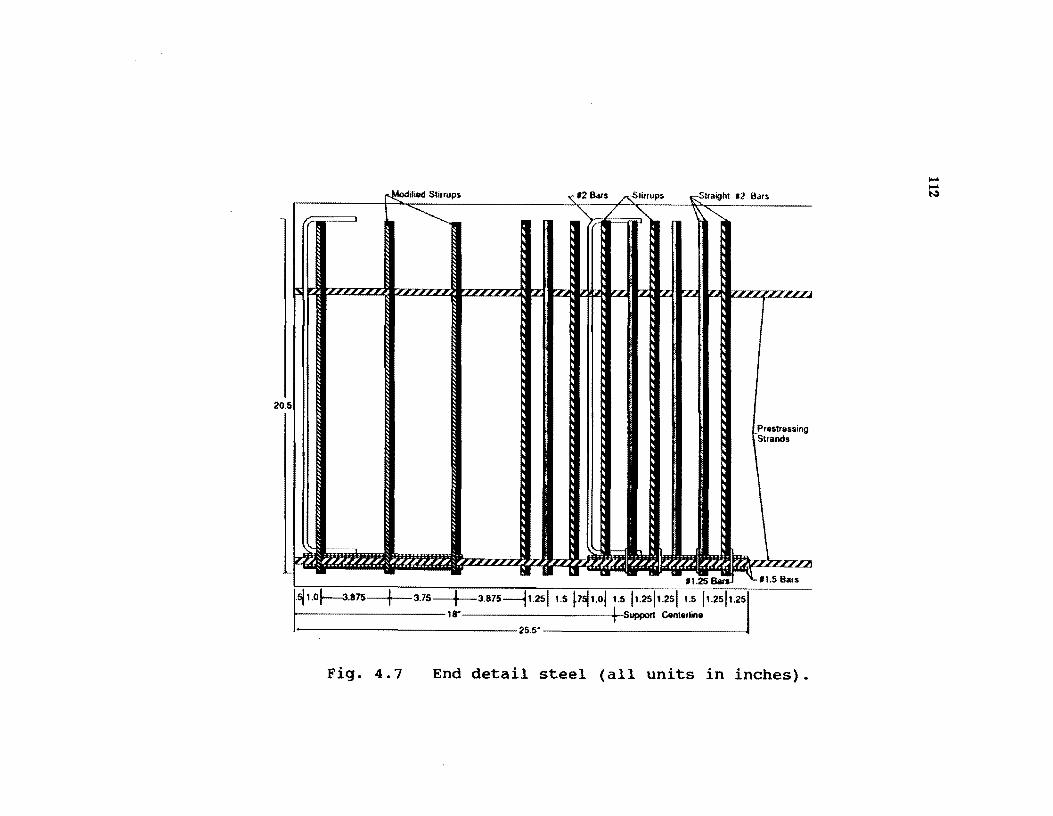
20.5
• UndiliAli Stirrups ",'2 Bars LS>lilrups _~""inht '2 Bars
~ ':'r-~" ~"""
~jr;lZZZZZZr.flZZZ7Z7Z~~tz4~
r~ 1~1IZ7.
tPreSlrllSSing Strands
\
. 11.25 a;;1~'1.5 Bars
1·~1.0~.875 3.75 f 3.875---11.2511.5 ~7~1.011.5 11.2511.2511.5 11.2511.25'
1----------18" + Support Centerline
-------------25.5' ~
Fig. 4.7 End detail steel (all units in inches).
.... .... t.:>
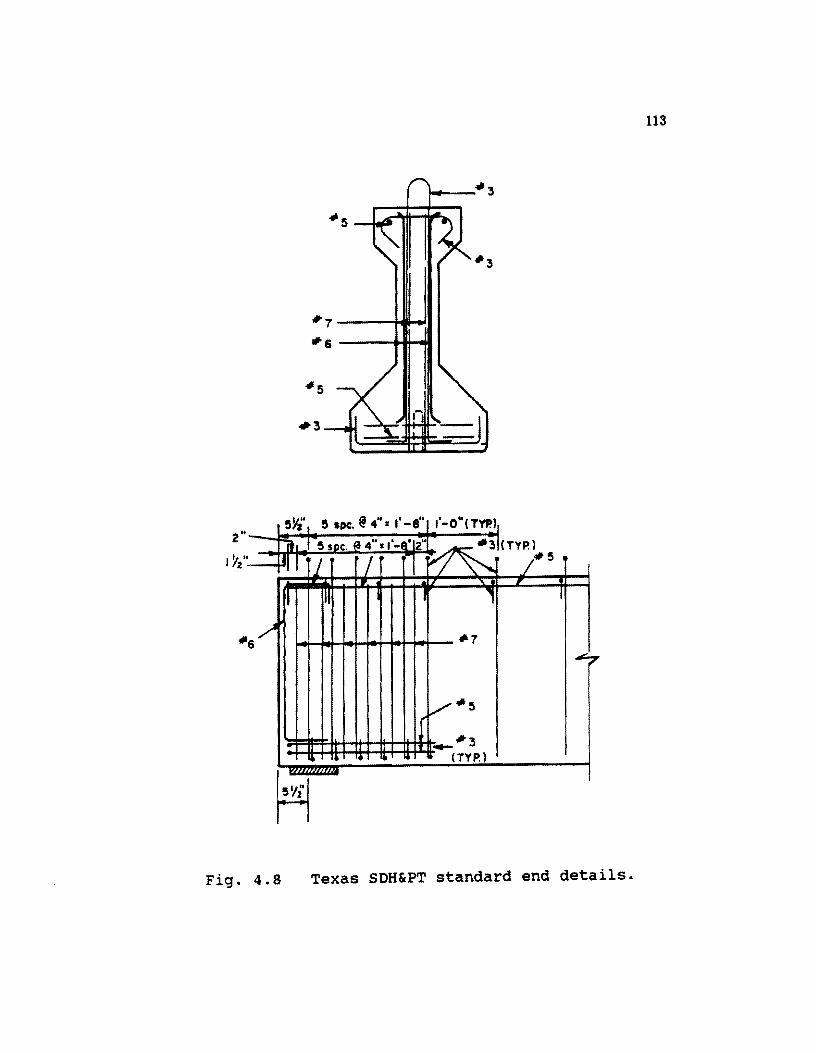
# 7 -----'~.,.
#6----40 .........
!5 I I. 5 apc. @ It • It , .. 4 I I -8 1-0 (TYP.), - it, t· 5 soc. (a 4"1,'-8· 2" ~l(TYp.) ,
~ll j I /:#5
II II , ., r
# 6/ fl!7
.:.
If /#5
..... #3 " • • •• • • (TY P.)
~
Fig. 4.8 Texas SOH&PT standard end details.
113
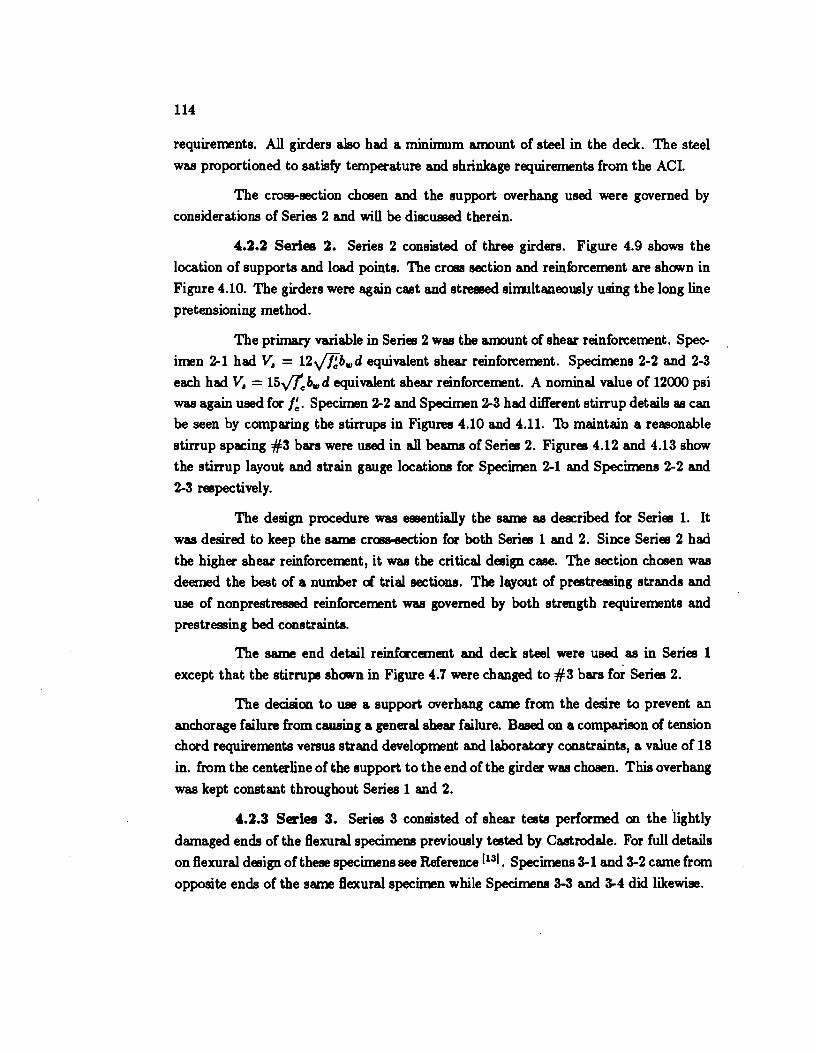
114
requirements. All girders also had a minimum aImunt of steel in the deck. The steel
was proportioned to satisfy temperature and shrinkage requirements from the ACI.
The cross-section chosen and the support overhang used were governed by
considerations of Series 2 and will be discussed therein.
4.2.2 Series 2. Series 2 consisted of three girders. Figure 4.9 shows the
location of supports and load points. The cross section and reinforcement are shawn in
Figure 4.10. The girders were again cast and stressed siImltaneously using the long line
pre tensioning method.
The primary variable in Series 2 was the amount of shear reinforcement. Spec
imen 2-1 had V, = 12V/Ibfl}d equivalent shear reinforcement. Specimens 2-2 and 2-3
each had V, = 15v'fcb.,d equivalent shear reinforcement. A nominal value of 12000 psi
was again used for I~. Specimen 2-2 and Specimen 2-3 had different stirrup details as can
be seen by comparing the stirrups in Figures 4.10 and 4.11. To maintain a reasonable
stirrup spacing #3 bars were used in all beams of Series 2. Figures 4.12 and 4.13 show
the stirrup layout and strain gauge locations for Specimen 2-1 and Specimens 2-2 and
2-3 respectively.
The design procedure was essentially the same as described for Series 1. It
was desired to keep the same cross-eedion for both Series 1 and 2. Since Series 2 had
the higher shear reinforcement, it was the critical design case. The section chosen was
deemed the best of a number c:l trial sections. The layout of prestre88ing strands and
use of non prestressed reinforcement was governed by both strength requirements and
prestressing bed constraints.
The same end detail reinforcement and deck steel were used as in Series 1
except that the stirrups shown in Figure 4.7 were changed to #3 bars for Series 2.
The decision to use a support overhang came from the desire to prevent an
anchorage failure from causing a general shear failure. Based on a comparison c:l tension
chord requirements versus strand development and laboratory constraints, a value of 18
in. from the centerline of the support to the end of the girder was chosen. This overhang
was kept constant throughout Series 1 and 2.
4.2.3 Series 3. Series 3 consisted of shear tests performed on the 'tightly
damaged ends of the 8exural specimens previously tested by Castrodale. For full details
on 8exural design ofthese specimens see Reference 1131. Specimens 3-1 and 3-2 came from
opposite ends of the same 8exural specimen while Specimens 3-3 and 3-4 did likewise.
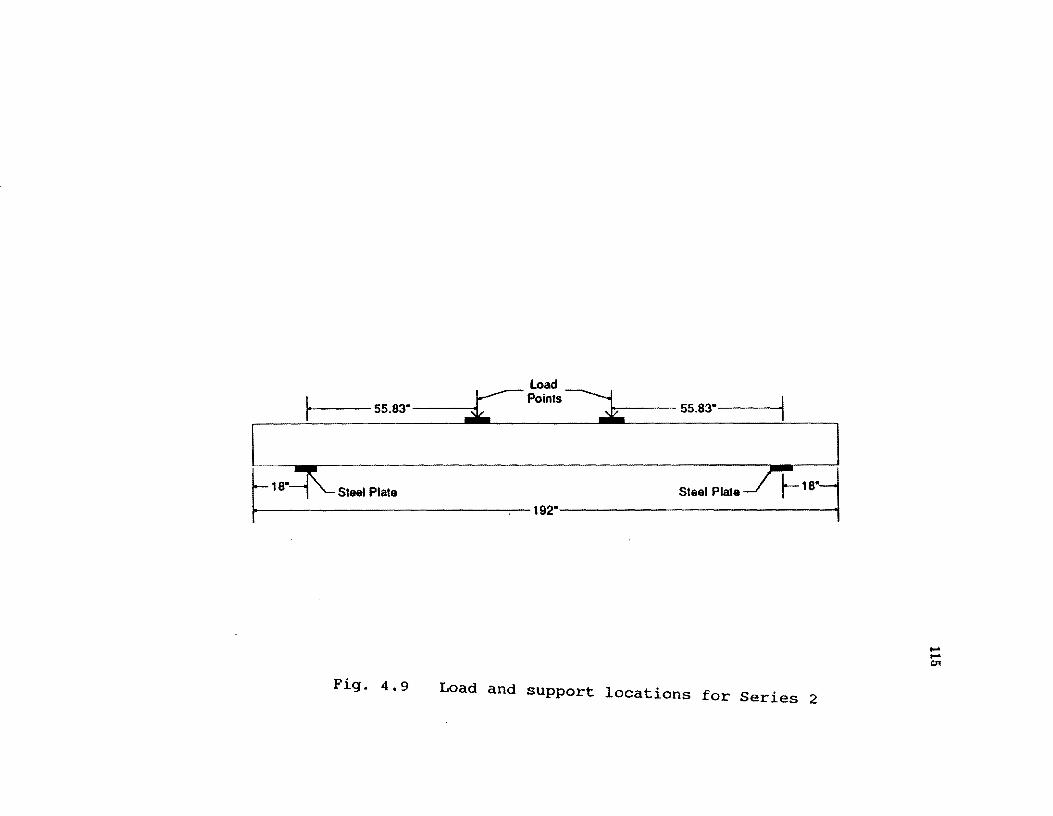
~ 55.83- .~ load Points
r 18", '-- 51881 Pial. 192"
k 55.83- 1
Steel Plate
Fig. 4.9 Load and support locations for Series 2
1
--01
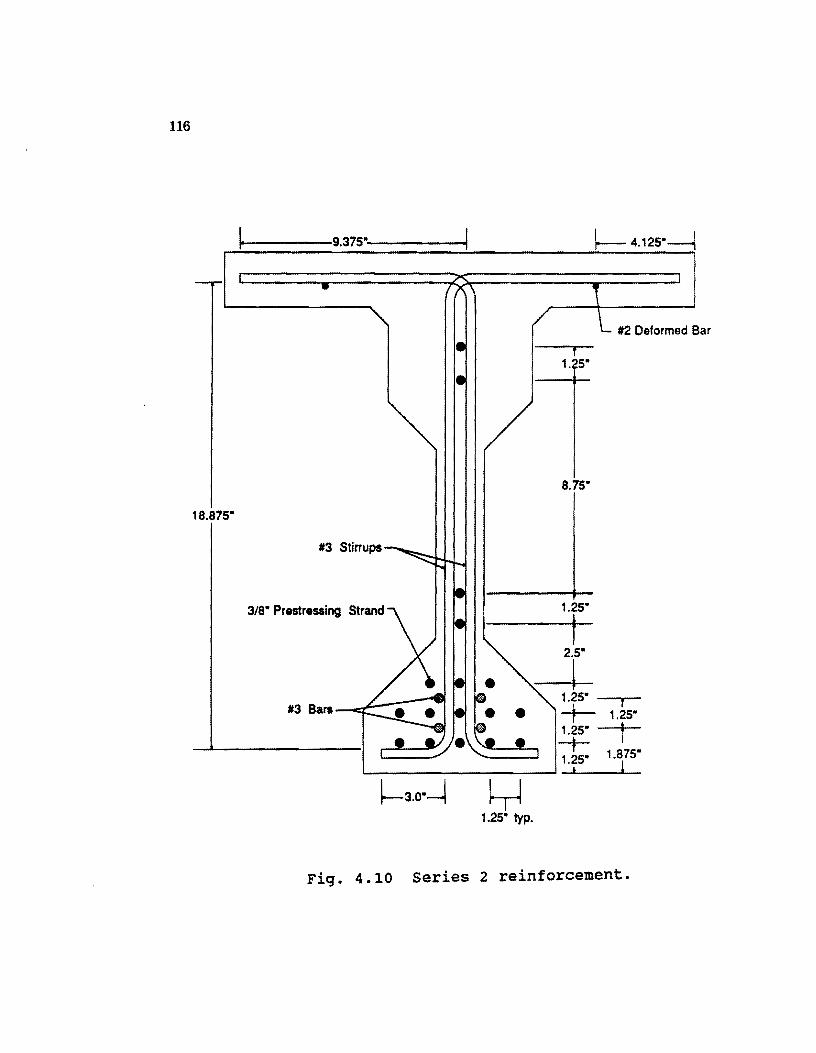
116
~ .... ----9.375· ,I
#2 Deformed Bar
T 1. 5·
18.875·
3/8· Prestressing Strand
#3 Bars -~:..--::::--:.,
Fig. 4.10 Series 2 reinforcement.
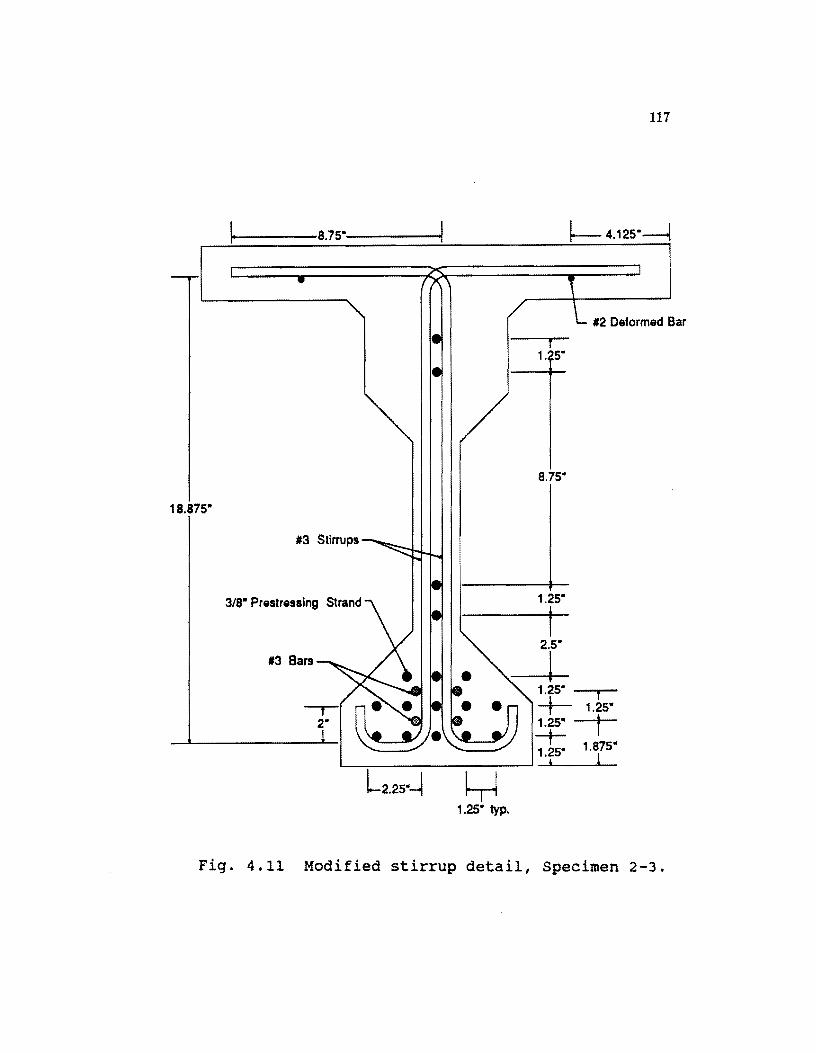
117
.... 1. ----8.75"'-------1
#2 Deformed Bar
f 1. 5"
18.875-
3/8- Prestressing Strand
#3 Bars
~ 1.25" typo
Fig. 4.11 Modified stirrup detail, Specimen 2-3.
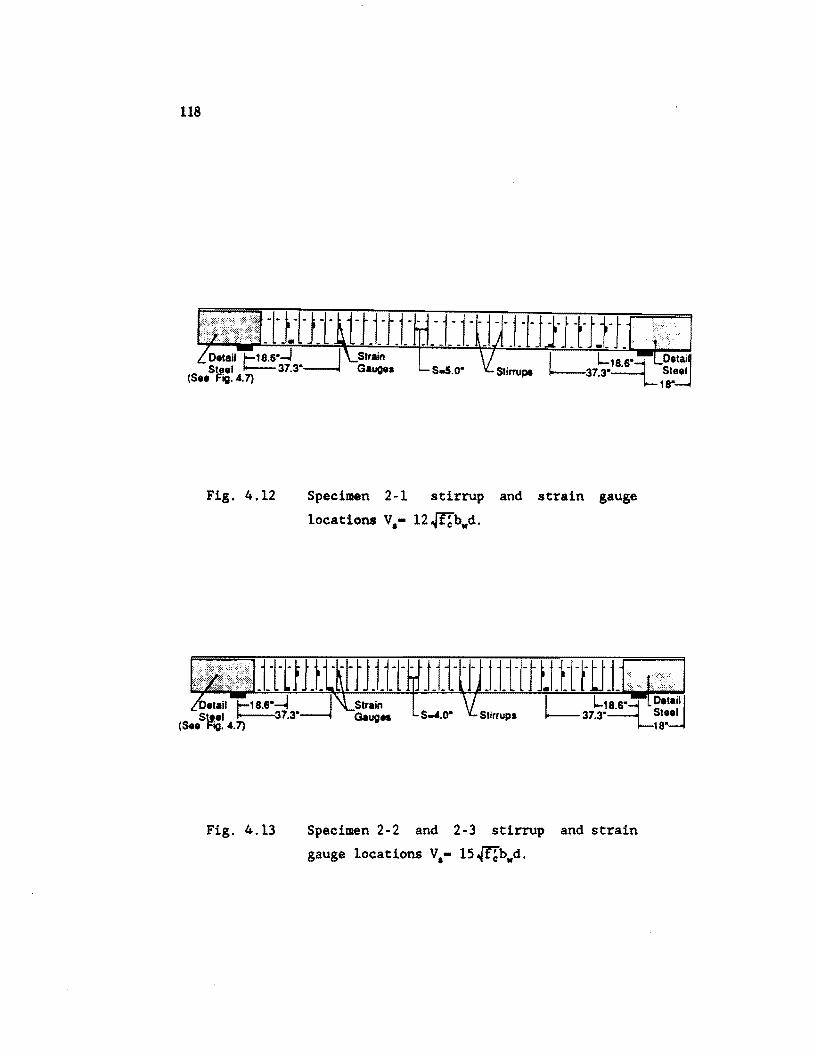
118
Delail t '8.S--J .-J Sirain Steel 37.3- Gauge. S-5.O"
(Se. Fig. 4.7)
Fig. 4.12
Fig. 4.13
Specimen 2-1 stirrup and strain gauge
locations V.- l2..J"IIb"d.
Specimen 2-2 and 2-3 stirrup and strain
gauge locations V.- l5~b"d.
119
Since the specimens were principally designed for flexural tests, there were sev
eral major differences between the speci.meDB of Series 3 and of Series 1 and 2. The most
important was that the Series 3 specimens had the girders and decks cast compasiteiy.
The high strength girders were cast and then much lower strength decks were added
later. The decks had different widths than the noncomposite Series 1 and 2 specimens.
The girders of Series 3 also had inclined prestressing tendons.
Because the specimens were first tested in flexure they had sustained some
damage. The original girders were 49 feet long. The concrete at the location of flexu
ral failure basically exploded leaving the prestressing strands exposed. Any remaining
concrete was removed and the strands were cut separating the two ends. A total span
of 17 ft 4 in. was used during the shear tests with one test having an additional 6" for
development (Fig. 4.14). The ends used as shear specimens were appraximately half the
original 49 feet in length. The additional length was not used in the test and it extended
UDBUpported as an overhang. The observable damage consisted principally of transverse
cracks through the deck, some of which went into the girder. The cracks formed during
the flexural failure and are likely due both to the dynamics of the failure and the shed
ding of the dead load blocks used during the flexural strength test. Other damage was
suspected, but unobservable since the prestressing closed many of the cracks.
SpecimeDB 3-1 and 3-2 had shear reinforcement of V, = 8.ff£b.,d which is the
inaxiIIllm allowed by AASHTO. The cl'Ofll-section and prestressing strands are shown in Figure 4.15. The major difference between these two specimens was the stirrup details
as can be seen by comparing Figures 4.16 and 4.17. The stirrups were all #2 Mexican
defonned bar. The stirrup layout and strain gauge locations are shown in Figure 4.18. In both tests actual support locatioDB were modelled. For these speci.meDB slightly different
end details were used as illusirated in Figure 4.19a.
Speci.meDB 3-3 and 3-4 had V, = 4.ff£b.,d. The strand locations and stirrup
detail are shawn in Fipre 4.20. The stirrups were #2 Mexican defonned bar. Specimen
3-3, like SpecimeDB 3-1 and 3-2, had the support location and detail steel modelling
that of actual field conditions (Fig. 4. 19a) . Specimen 3-4 was provided with a 6 inch
overhang. The stirrup layout and strain gauge locatiClll are illustrated in Figure 4.21.
A special end detail was provided for Specimen 3-4 and it is illustrated in Figure 4.19b.
4..3.1 Concrete. The concrete mix was designed to give a 28 day strength
of 1';)(x) psi. All batches of concrete were obtained from a local ready mix plant. The
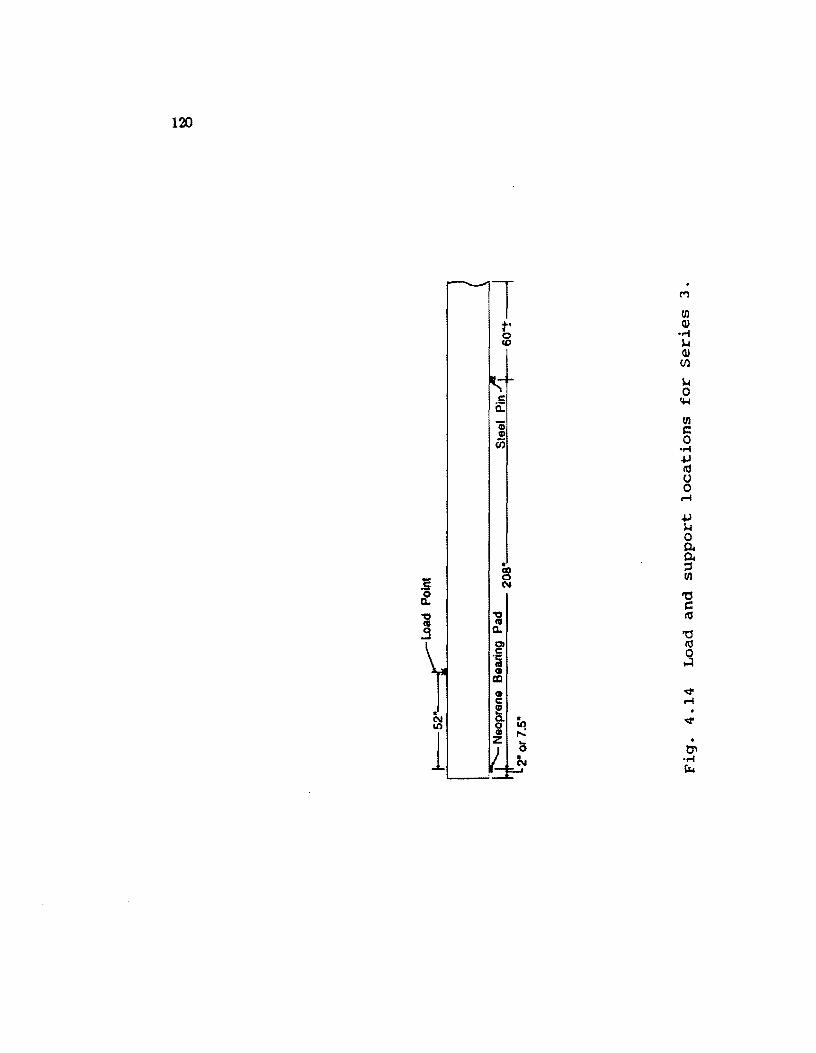
120
~+ .50 a.
1 ;;;
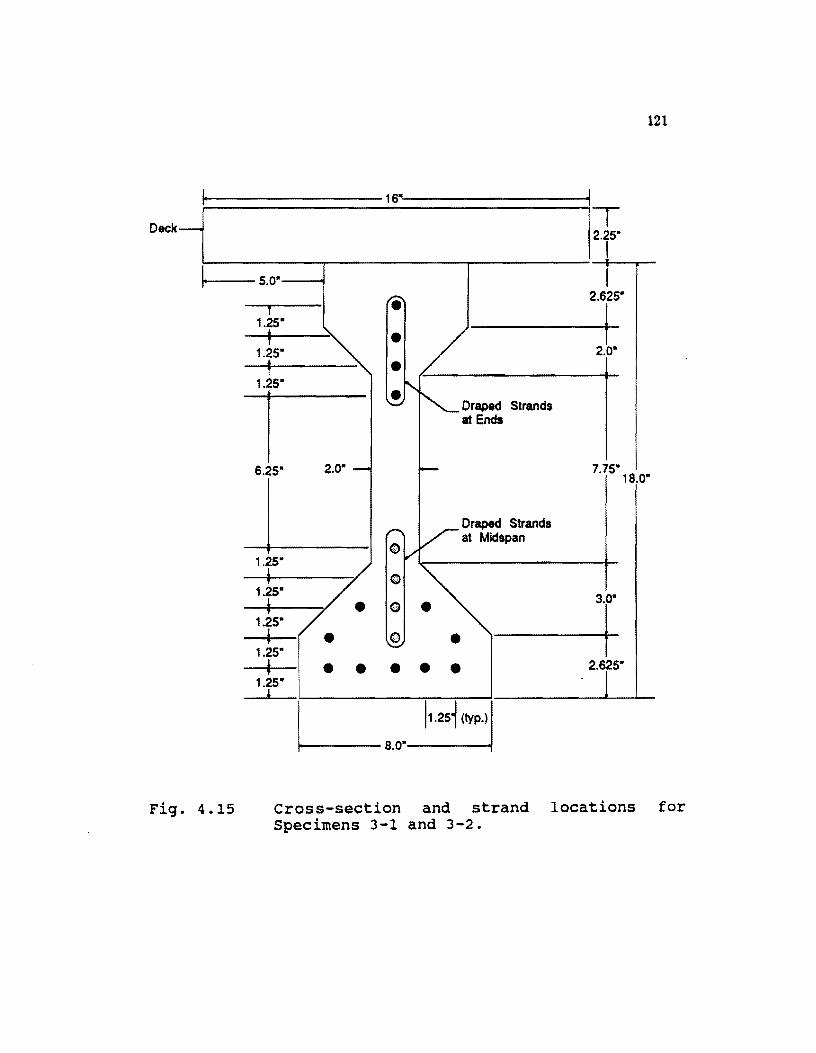
. Deck -
~
Fig. 4.15
121
16 . T 2.25w
5.0·
'i 2.625w
t ! 1.25w
t • / '" 1.25- 2.0w
t • 1.25- .' "'-Draped Strands ~
at Ends
6.25W 2.0· - /0-- 7.75W
18.0W
/""0 V- Draped Strands
at Midspan
1.25w 0 V , G
~ 1.25- /. 3.0· , G 1.25· /. I , 0 • 1.25w "-=-'
i • • • • • .2.615w
1.25-,
Cross-section and strand locations for Specimens 3-1 and 3-2.
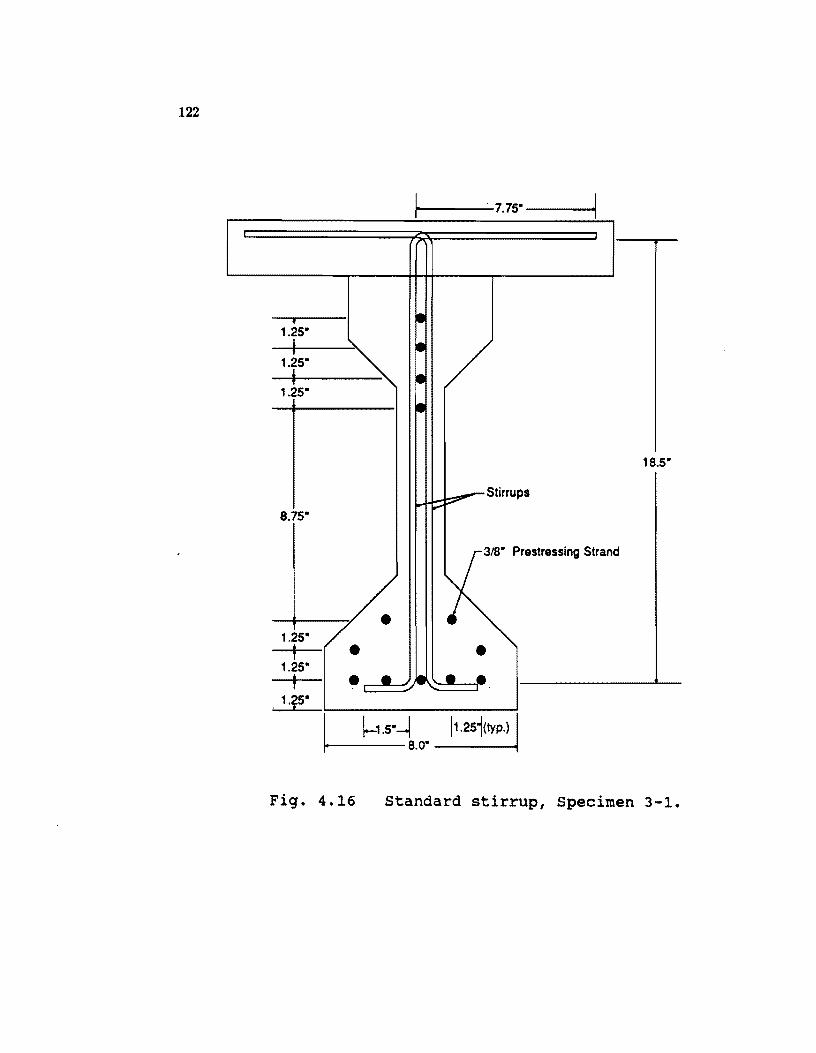
122
/. 1.25-t
1.25-t •
. 1·iS-
Fig- 4.16
~ . 7.75-----i
II
II
II
• _ ~~ Stirrups
3/8- Prestressing Strand
• •
• . )11 • •
!-1.5---I 11.251(tyP.) 8.0-
18.5-
Standard stirrup, Specimen 3-1.
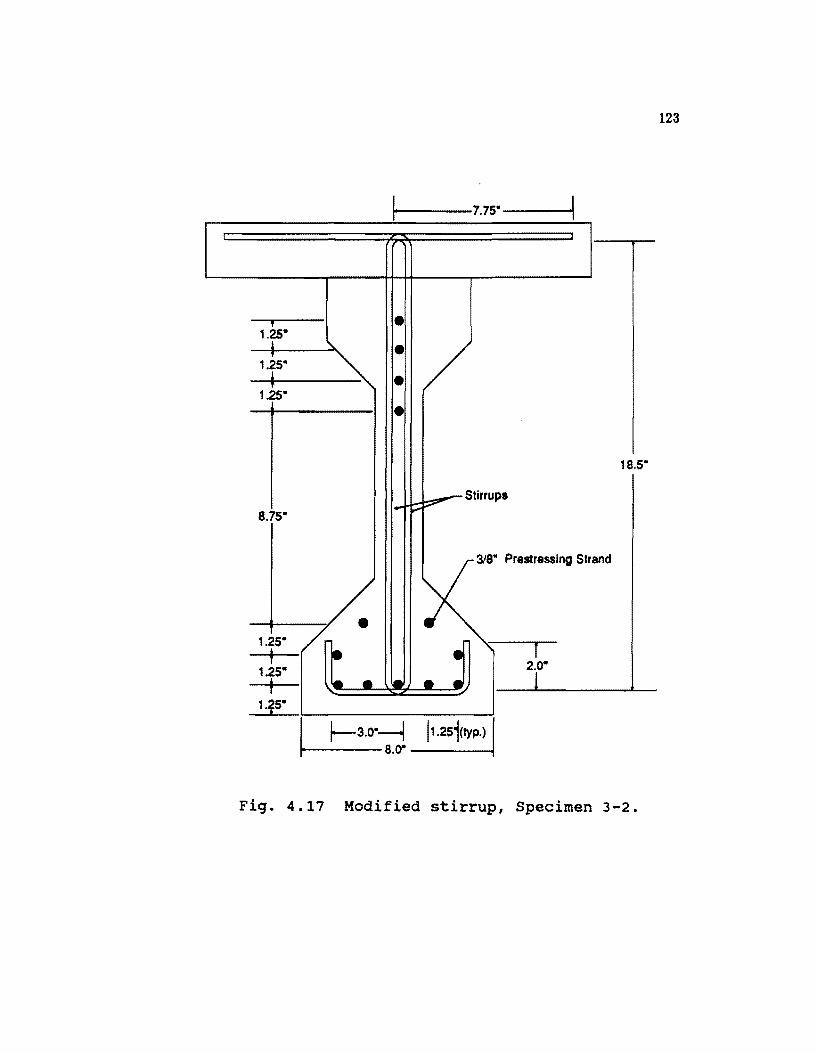
123
1-----7.75- ·1
f • 1 25-'1 ..... • 1.25- ~ , • 1.25-
• 18.5-
~Stirrups
8.75-1- io-"
318- Prestressing Strand
• 1.25- ,.0. t • "- r 1.25-
\a 2t t .. .. • •
1·fS-
I 1-. _~_3,O_--;j _11._25_i(tY_P • .......j) j
Fig. 4.17 Modified stirrup, Specimen 3-2.
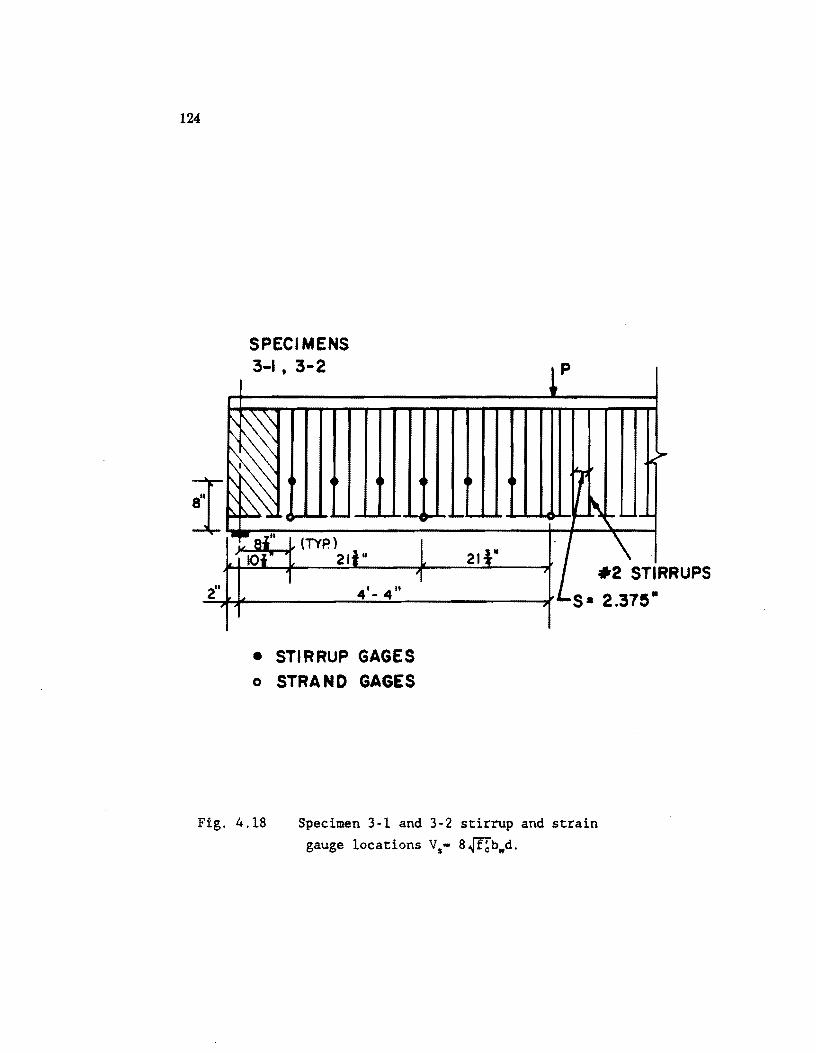
124
I
2" T
SPECIMENS 3 I 3 2 - -•
~~
~ ~~
~~ .....
-- ai" (TYP.) Ii IOi~ 21 II
4'- 4"
• STIRRUP GAGES
o STRAND GAGES
1 P
>-
• ~\ ... _i_
21"· \ ~ #2 STIR
, S· 2.375-
Fig. 4.18 Specimen 3·1 and 3·2 stirrup and strain gauge locations V,. 8 .J1'·~·hwd.
RUPS
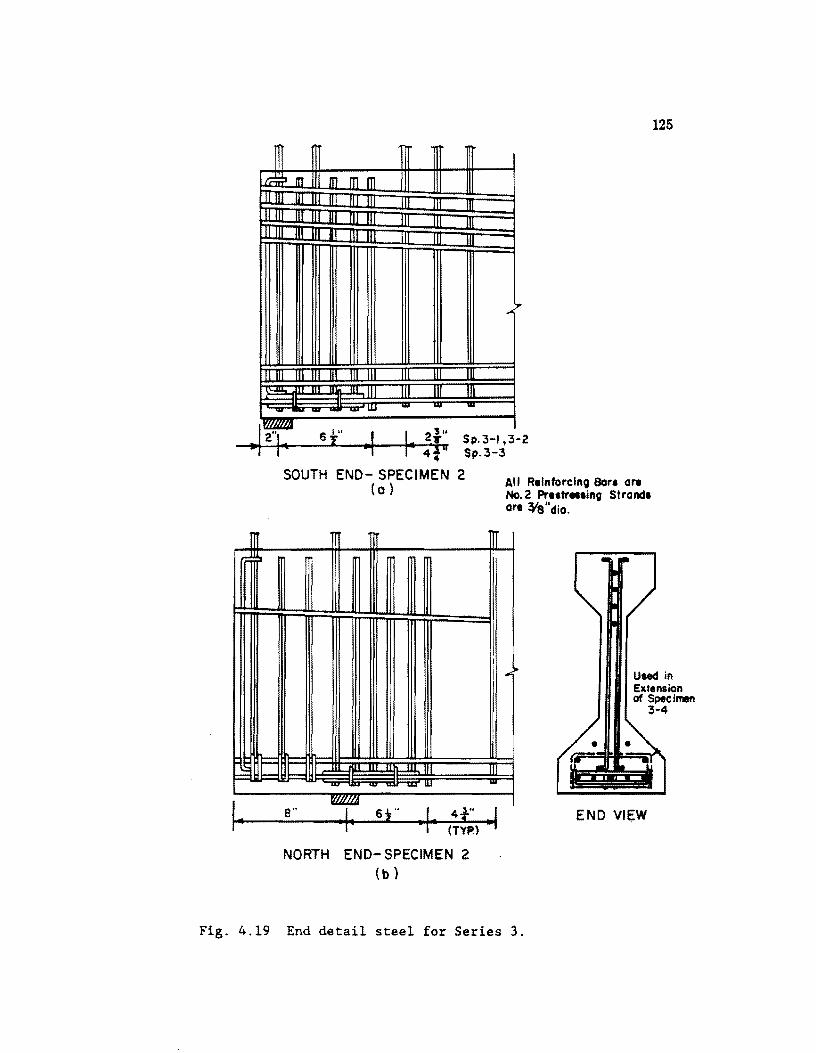
125
ill ~ rn m m_ffi Jl Jll ill III JlJIll III JII 111 Jll JI III IIIUI UI III III III JlI W Jll 1.11 III II 1\1 III II III III
... "
ililU UlJl III III III II III JJi nlot It III III III III
_____ 'W ... -I rtIillIA
It .! 2"1 " 6 f' J I. 2J 5p. 3-1,3-2 --4..lt..:....jk--":"'L---,.,-+---t---4:""ft'lrll $p. 3-3
SOUTH END- SPECIMEN 2 (0 ) All Relnforclno 80rt are
No.2 Pre,tr .. ,inO Strand, or. ~8"dia.
~
t:::IE
f·
[
I? I
I I
IE II ~ III _ _ w ...
fUUI./J 8" , 4'f" I to • •
hyp.)
NORTH END- SPECIMEN 2 (b )
Fi 4 19 End detail steel for Series 3. g. .
Used in Extension of Spec lIMn
3-4
END VIe:W
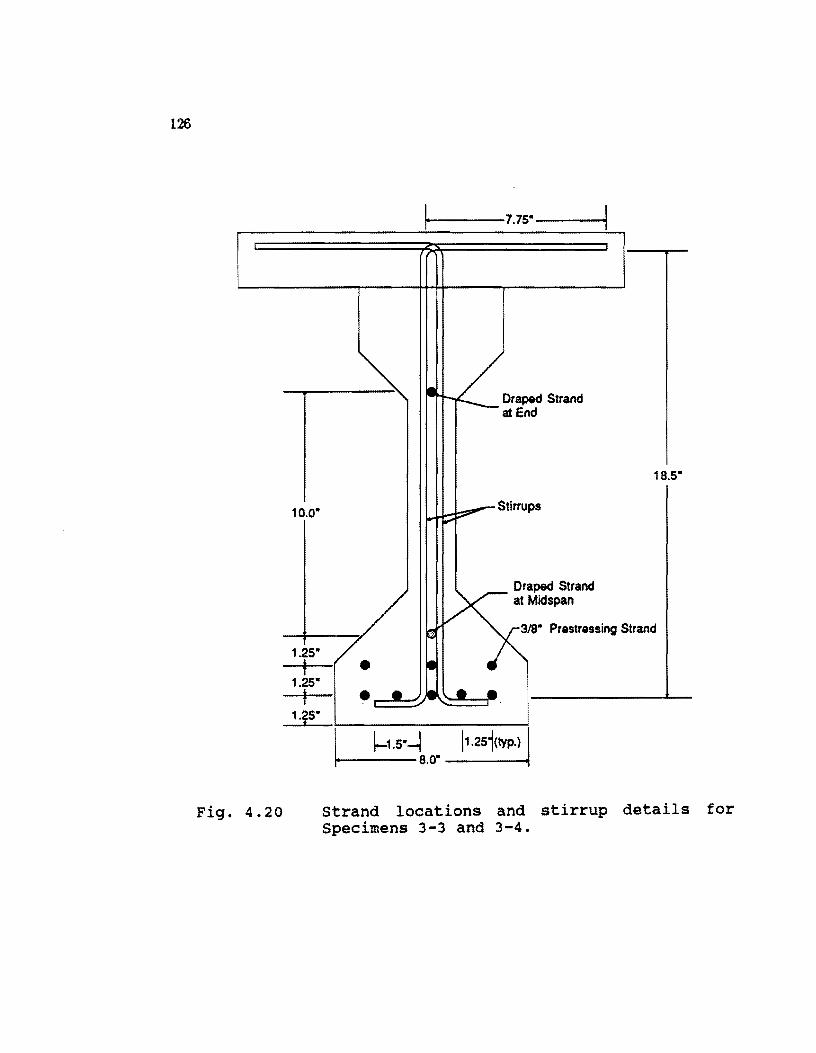
126
10.0-
1.25-
t 1.25-
t 1·iS-
Fig. 4.20
7. • •
I.
10-1· ----7.75----~
• t-"--- Draped Strand at End
:...~Stirrups ;..
Draped Strand
18.5-
K:~·pan : I '" 3/8" Pr_ ... ing Strand
strand locations and stirrup details for Specimens 3-3 and 3-4.
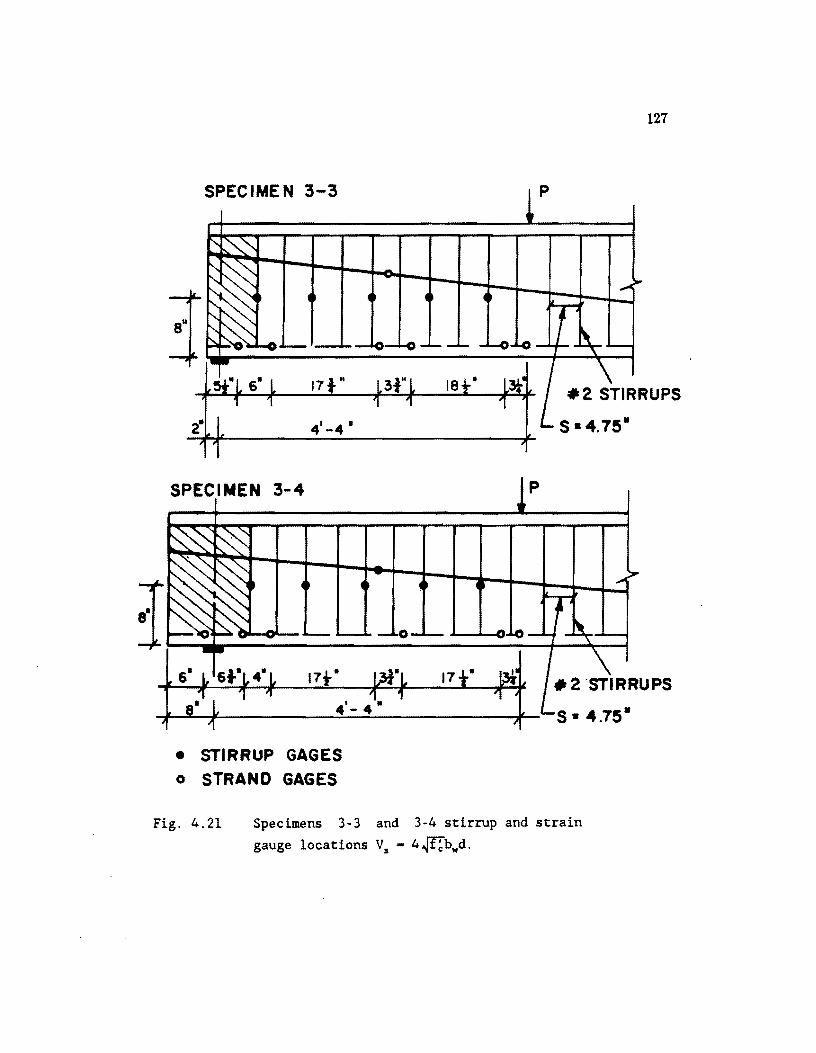
SPECIMEN 3-3
SPECIMEN 3-4 P
• STIRRUP GAGES o STRAN 0 GAGES
p
Fig. 4.21 Specimens 3-3 and 3-4 stirrup and strain
gauge locations Va - 4~bwd.
127
128
mix used was developed through a series of trial batches reported in Chapter 2 and
Reference (l1J. The mix proportions and other pertinent data on the actual batches
used are given in Appendix A. A very hard 3/8" crushed limestone was used to prevent
aggregate failures from limiting concrete strength: Fly ash was used to replace 30% of
the cement by weight.
The specimens of SeriES 3 had a composite low strength deck:. The deck
strength was approximately 4000 psi at 28 days. The properties and mix proportions of
this concrete can be found in Reference (131.
A total of 14 6"x12" plastic mold cylinders, 196"x12" steel mold cylinders,
and 10 6"x6" x20" steel mold beaIm were cast for each of Series 1 and 2. The beams
and steel mold cylinders were tested at 7 days, 28 days, at release, and on each tESt day.
Plastic mold cylinders were used to check strength gain. The 7 day beam specimens
and 28 day cylinders were moist cured in a saturated lime bath. All other cylinders and
beaIm were stored in the laboratory with the shear specimens. The shear specimens as
well as cylinders were dry cured. They were, however, covered with a curing compound.
Tests were run with a mechanical compreseometer on the release day and a
couple of days after the last shear tESt to determine the modulus of elasticity of the
concrete.
Similar steps were taken with SeriES 3 specimens. Full details can be found in
Reference [131. Strengths at test days, however, are included in Chapter 5.
4..3.2 Prestressing steeL A 3/8" diameter Grade 270 ksi seven wire low relaxation prestrESSing strand was used for all shear specimens. The strand was donated
by Florida Wire and Cable Company. The load-strain behavior 88 given by the mill
report is shown in Figure 4.22. The modulus of elasticity given by the mill report is
28,400,(X)(} psi. Additional tESts were run in the laboratory using strain gauges attached
to one of the seven wirES. The apparent modulus using this method is 30,SOO,OCO psi.
From this an appropriate conversion between strain gauge readings and actual strain
could be determined.
The strand had been stored in the lab for approximately a year. Over this
time it had become lightly rusted.
4..3.3 NODprestressed reinforcement. Nonprestressed reinforcement was used both as shear reinforcement and longitudinal reinforcement. Because of the small
specimen size and in some cases very light shear reinforcement, very small bars were
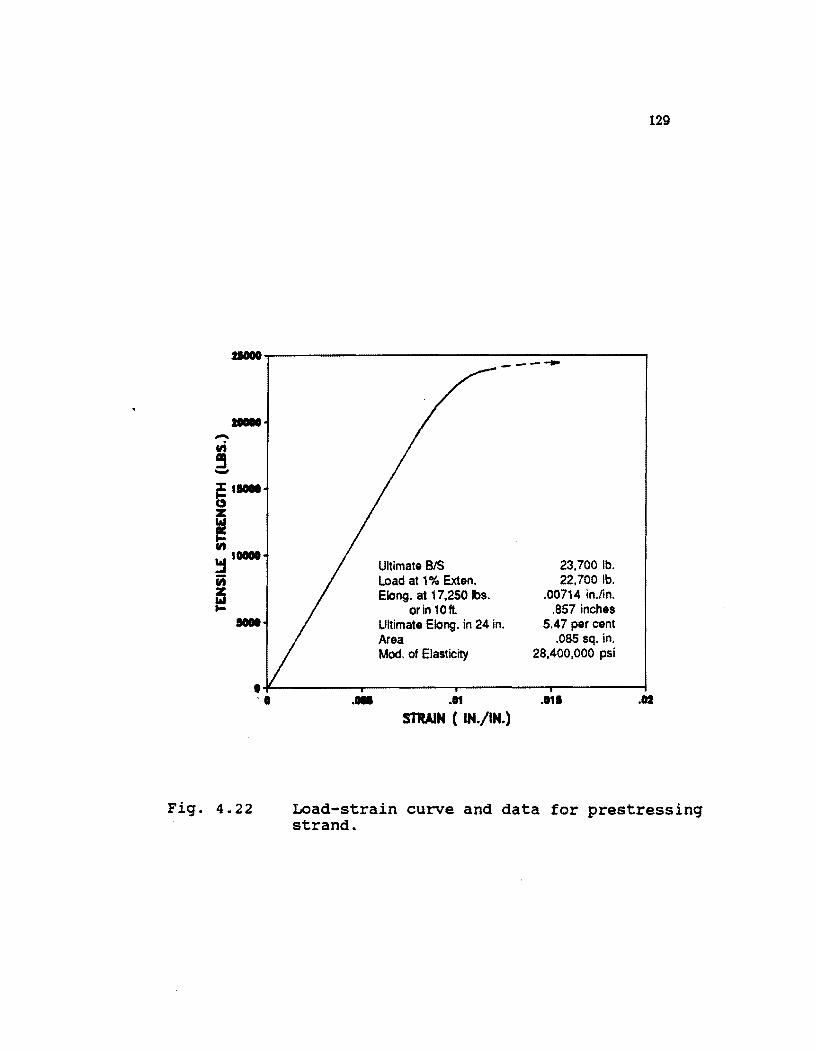
129
... ~--------------------------------------~ --- .....
Fig. 4.22
Ultimate BIS Load at 1% Exten. Elang. at 17,250 Ibs.
orin 10ft. Ultimate Elang. in 24 in. Area Mod. of Elasticity
23,700 lb. 22,700 lb.
.00714 in.lin. .857 inches
5.47 per cent .085 sq. in.
28,400,000 psi
'~---------r--------~----------~------~ '. •• .11 .111 .02
STRAIN ( IN./IN.)
Load-strain curve and data for prestressing strand.
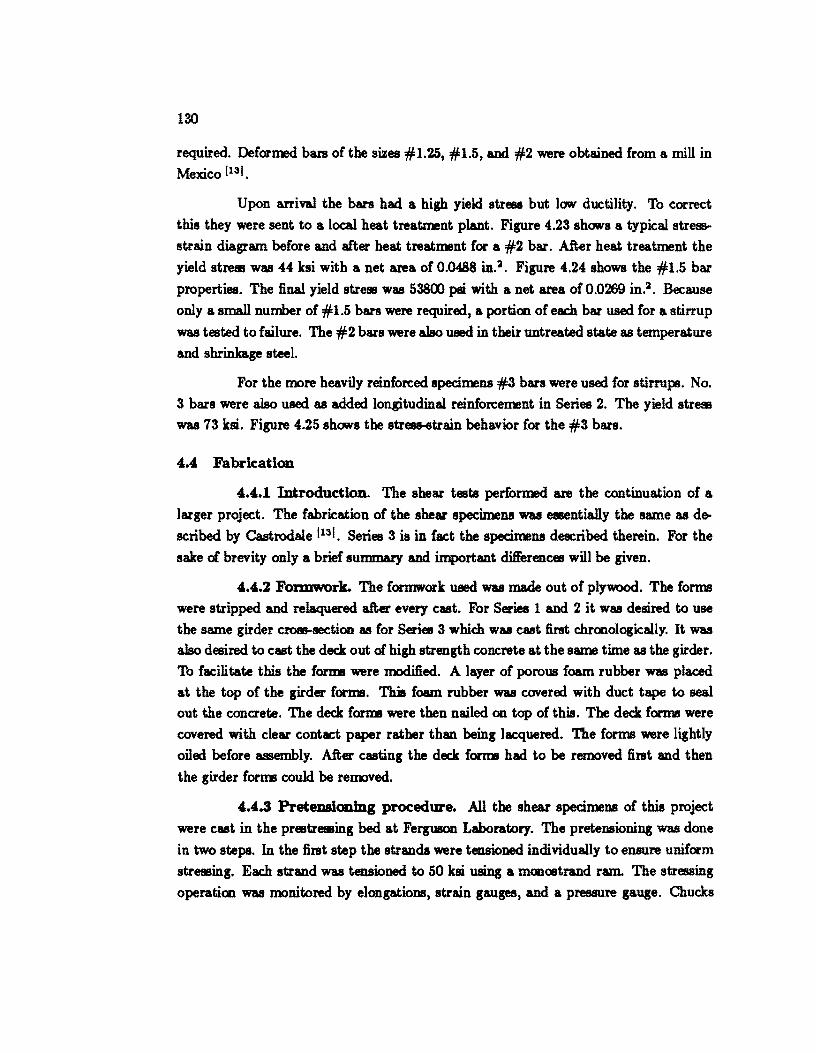
130
required. Deformed bars of the sizes #1.25, #1.5, and #2 were obtained from a mill in Mexico [131.
Upon arrival the b8l'8 had a high yield stress but law ductility. To correct
this they were sent to a local heat treatment plant. Figure 4.23 shows a typical stre.
strain diagram before and after heat treatment for a #2 bar. After heat treatment the
yield strese was 44 ksi with a net area of 0.0488 in.~. Figure 4.24 shows the #1.5 bar
properties. The final yield streS! was 53800 psi with a net area of 0.0269 in.~. Because
only a small number of #1.5 b8l'8 were required, a portiCD of each bar used for a stirrup
was tested to failure. The #2 bars were also U8ed in their untreated state as temperature
and shrinkage steel.
For the more heavily reinforced specimens #3 b8l'8 were used for stirrups. No.
3 bars were also used as added longitudinal reinforcement in Series 2. The yield streS!
was 73 ksi. Figure 4.25 shows the strese-etrain behavior for the #3 bars.
4.4 Fabrication
4.4.1 Introduction. The shear testa performed are the continuation of a
larger project. The fabrication of the shear SpecimeDl was elllentially the same as de
scribed by Castrodale \131. Series 3 is in fact the specimeDl described therein. For the
sake of brevity only a brief summary and important differences will be given.
4.4.2 Formwork. The fOl'IllW'Ol'k U8ed was made out of plywood.. The forms
were stripped and relaquered after every cast. For Series 1 and 2 it was desired to use
the same girder ~section as for Series 3 which was cast first chrCIDologically. It was
also desired to cast the deck out of high strength concrete at the same time as the girder.
To facilitate this the forma were modified. A layer of porous foam rubber was placed
at the top of the girder forms. This foam rubber was covered with duct tape to seal
out the concrete. The deck forma were then nailed on top of this. The deck forms were
covered with clear contact paper rather than being lacquered. The forms were lightly
oiled before assembly. After casting the deck forma had to be removed first and then
the girder forIIIJ could be removed.
4.4.3 PreteD8lonJng procedure. All the shear specimens of this project
were cast in the prestre9!ling bed at Ferguson Laboratory. The pretensioning was done
in two steps. In the first step the strands were tensioned individually to ensure uniform
stre9!ling. Each strand was tensioned to 50 ksi using a mCIDostrand ram. The stressing
operatiCD was monitored by elongations, strain gauges, and a pressure gauge. Chucks
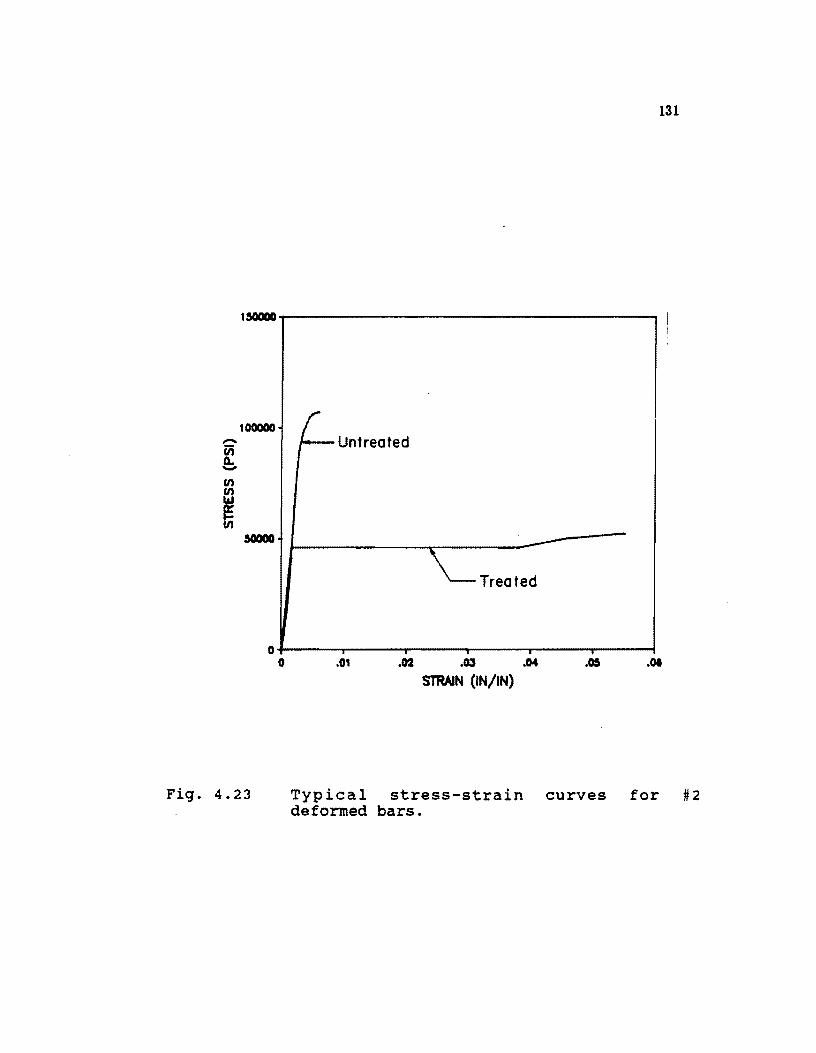
131
t~~------------------------------------~
tOOOOO -iii Untreated 0.. -
-~Treated
O+-----~----~----~.~----T.----~~--~ o .01 .02 .03 .04 .OS .01
STRAIN (IN/IN)
Fig. 4.23 Typical stress-strain curves for #2 deformed bars.
132
-II)
0. -
150000~----------------------------------------~
100000 t-Untreated
50000 Treated
O+--------r--------r-------~------~l------~ o .01 .02 .03 .04 .05
Strain (in. / in. )
Fig. 4.24 Typical stress-strain curves for #1.5 deformed bars.
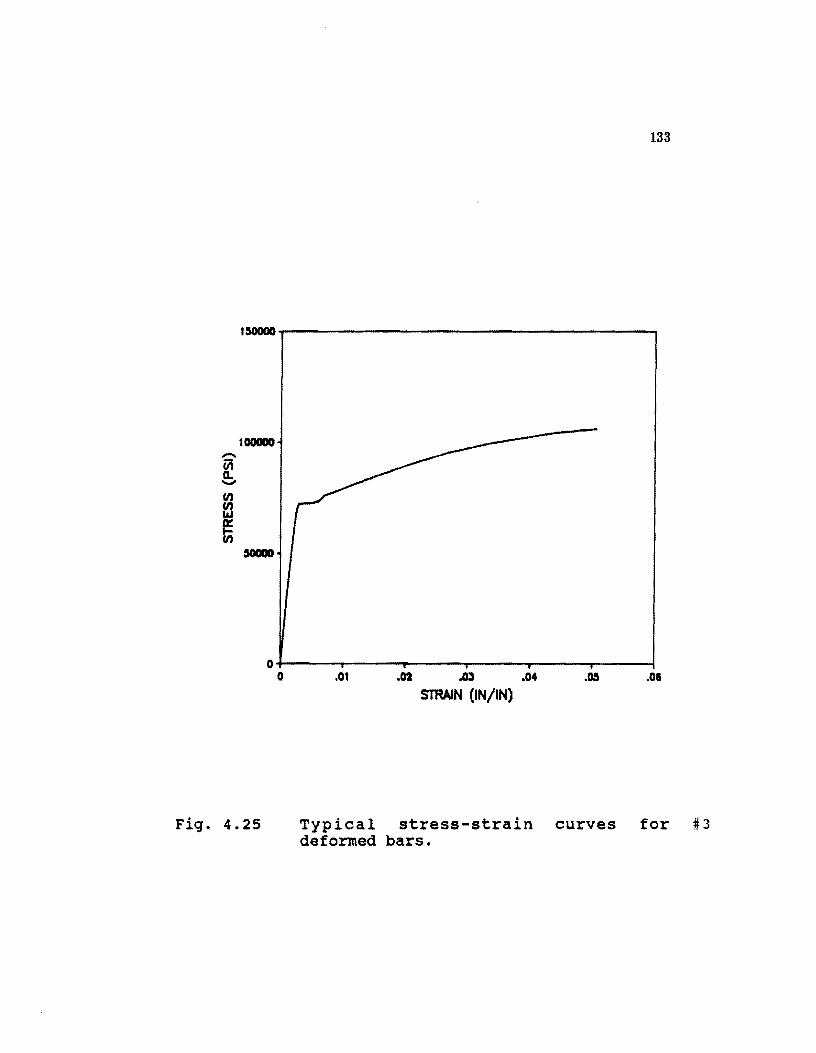
133
I~~------------------------------------~
laoaoo -iii D.. ....., en en Lt.I
~ 5OGOO
O+-----~----~----~------r_----~----~ o .0' .02 .Q .04 .05 .01
STRAIN (IN/IN)
Fig. 4.25 Typical stress-strain curves for #3 deformed bars.
134
and wedges donated by Great Southwest Marketing Company were used throughout the
project. Due to the size oC the chuck and the small strand spacing a two tiered anchorage
system was required. Chairs were Cabricated at the laboratory to Cacilitate this.
The second pretensioning operation used the large hydraulic ram in the pre
stressing bed. The ram pulled all the strands at once. Tensioning was controlled by elongations and strain readings. Friction in the bed prevented accurate readings using
a pressure gauge. The strands were tensioned to approximately 216 ksi (0.8 £"u), then
the bed was locked off and the ram unloaded.
At final release after the concrete girders achieved their specified strength the
ram was again loaded until the nuts used to lock off the bed loosened. The nuts were
backed off and the load was then gradually transCerred to the specimens.
4.4.4 Girder Fabrication. All stirrups and end detail steel were prepared
in the laboratory. Prestressing strands were cut, strain gauges placed, and then the
strands were first tensioned. After this the stirrups and end detail steel were installed.
Final tensioning was then done, and the CorIDI were oiled and assembled. The girders
were cast either one or two days after final tensioning.
4.4.5 Casting procedures. Project personnel inspected the ready mix batch
ing to supervise the mix design and add the retarder and superplasticizer. An additional
dose or superplasticizer was added to the truck at the laboratory to obtain a slump oC about 9 in. The girders were cast in two lifts. The concrete was consolidated using
small internal vibrators. Compaction was good even with the small clearances and large
amounts of steel.
All three girders of a series were cast simultaneously. Ply'WOO<i blockouts were
used to separate the girders. Upon completion or the casting the concrete was screeded
off. Smooth finishing was difficult due to the rocky nature oC the mix. The concrete was then covered with wet burlap and plastic.
One to two days later, depending on strength gain, the Conns were stripped
and the specimens covered with a curing compound. Cylinders and beams were also
stripped and coated on the same day.
When the specimens had gained sufficient strength, about one week later, the
prestress was released and the strands between the girders were cut.
135
4.5. Instrumentation
4.5.1 Intemal strain gauges. Internal stram gauges were mounted on both
the shear and longitudinal reinforcement. Figures 4.4, 4.5, 4.6, 4.12, and 4.13 give the
locations in the beams. The stirrup strain gauges were located. near midheight of the
specimens as illustrated in Figure 4.26. The gauges were applied and waterproofed using
standard laboratory methods.
Some of the gauges of each series were continuously connected to strain indi
cator boxes from initial tensioning until testing. Readings were taken periodically to
monitor behavior.
Strand gauges were attached to one of the seven wires. The wire gauges gave
an apparent modulus of elasticity of 30.5x10⁶ psi although the correct strand modulus
was 28.4x:1Q6 psi. These values were used to adjust strain readings to indicate strand
stress.
In Series 1 and 2 a Hewlett-Packard data acquisition system was used to obtain
and record the strain readings. For Series 3 both internal and surface strain gauges were
read manually using a switch and balance box and a strain indicator box.
4.5.2 Surface gauges. Concrete strains were measured with surface strain
gauges. AB a check on the prestress force, surface gauges were placed at five locations
at the centerline of one girder of each series (Fig. 4.27). These gauges were monitored
continuously from release through the test. The girder so instrumented was the last
girder of each series tested.
For the girders of Series 1 and 2 strain rosette gauges were also used. In most
cases the rosettes were placed 10 in. up from the bottom of the girder and 1 d and 2 d
away from the support (Fig. 4.28). The one exceptiOD to this was Specimen 2-3 which
had gauges 1.5 d and 2 d from the support.
4.5.3 Beam deflectloDS. For the specimens of Series 1 and 2 linear poten
tiometers were used to measure deflections. The Riehle test machine had a potentiometer
that measured head displacements. Readings were also taken to measure midspan girder
displacement and pad compression in the tests which used neoprene bearing p~s. The
potentiometers were hooked up to the data acquisition system.
In Series 3 the readings were taken using dial gauges. The machine head
displacement was recorded manually.
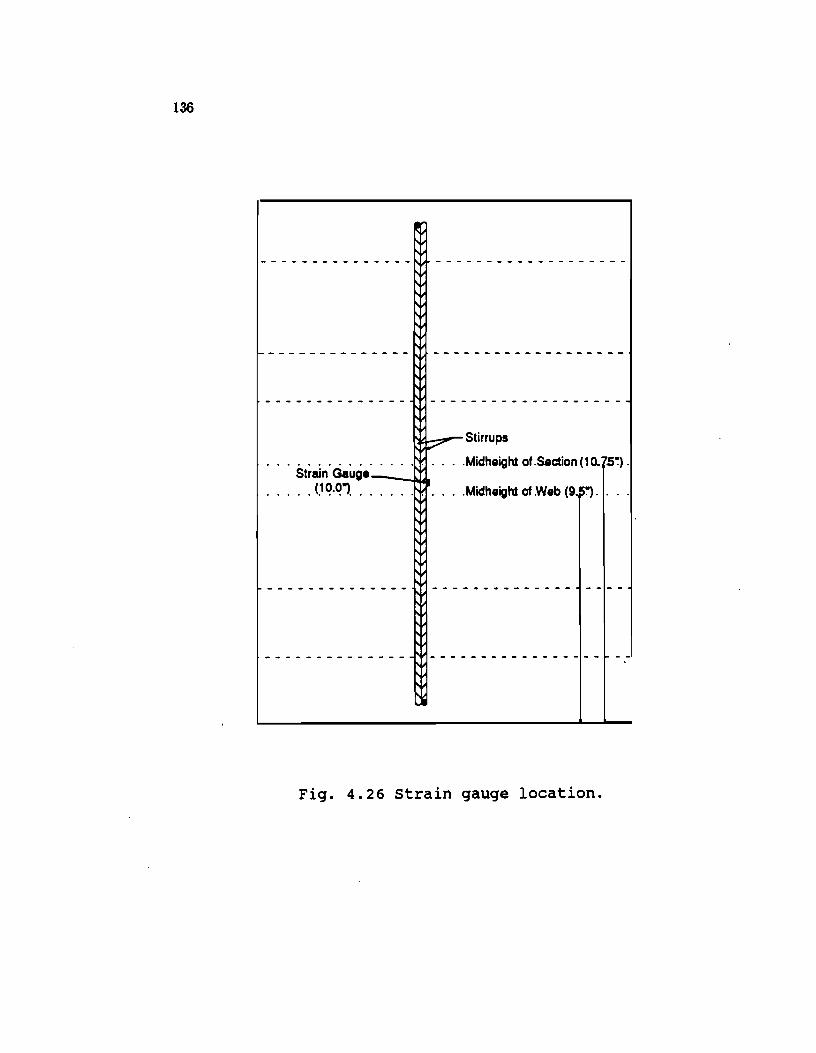
136
~Stirrups
. . . . . . . . . . . . . . . . . . . .Midheight of .Saction (1 a. :S~). Strain Gauge --_...IO.IA.
. . . . . <.1 q.q1. . . . . . . . . . . .Midheight of .Web (9S'). . . .
Fig. 4.26 strain gauge location.
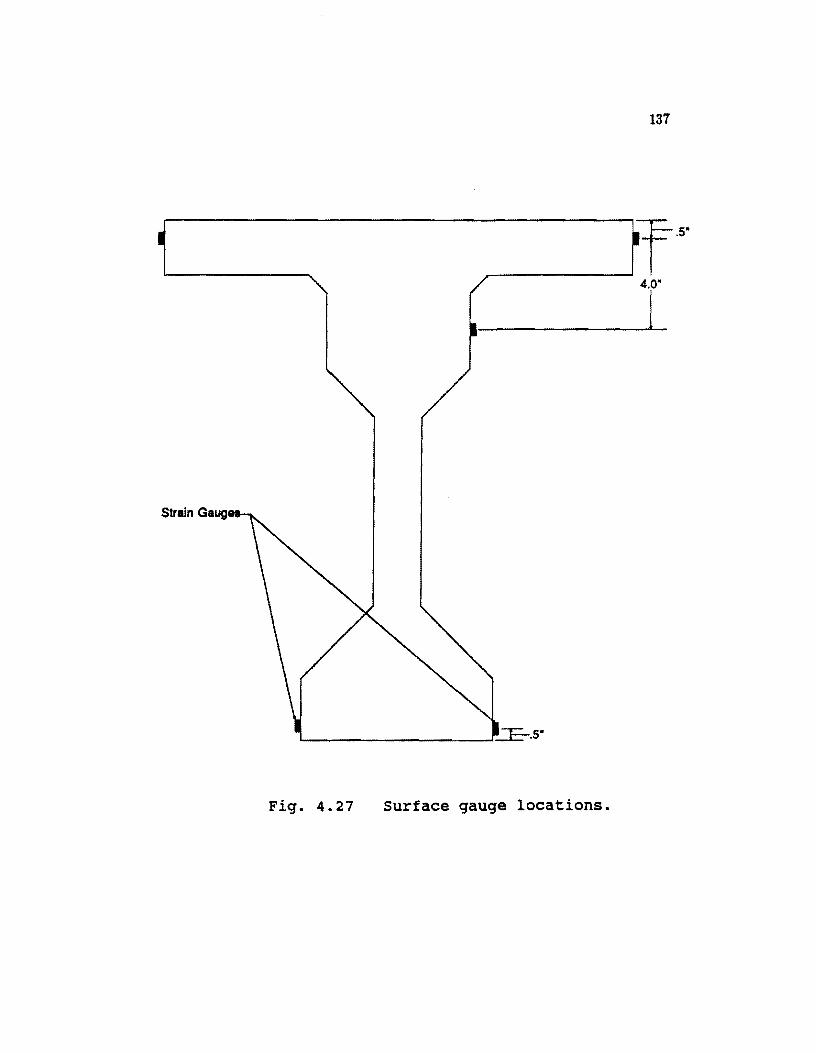
137
---------,r·· T
Strain Gaug
Fig. 4.27 Surface gauge locations.
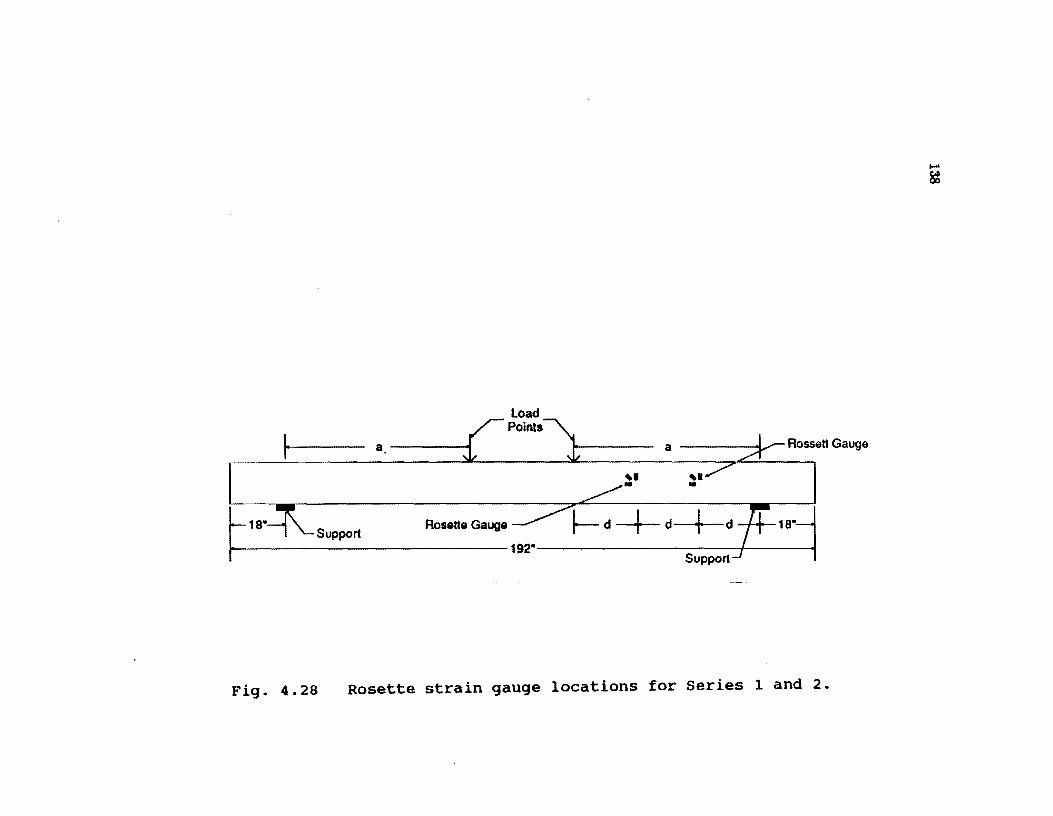
.... ~
Load Points
~ a ( ,. a -I...--- Rossett Gauge
L ,. ,. -- -~18~ Rosette Gauge ~ ~ d -+-- d + d -1-+-18"
Support 192-
Support
Fig. 4.28 Rosette strain gauge locations for Series 1 and 2.
139
4.5.4 Strand movement detection. Measurements were taken to determine
the existence and amount of strand end slip. A frame was epoxied to each specimen as
shown in Figure 4.29. Again either linear potentiometers or dial gauges were used to
monitor slip.
4.8 Test Frame and Loading System
4.8.1 Test machine. For the majority of these shear tests, the large 600
kip Riehle test machine at Ferguson Laboratory was utilized. The test machine is of
the screw type. The load and head displacement could be read on a digital display.
Figure 4.30 shCMts the general layout of the test machine and loading system. Due to the location of the supports, a system had to be devised to span the trench that surrounds
the Riehle test machine. Four W sections were paired and then bolted to the base of the
test machine. The support pedesta1s then rested on the top of these spanning beams.
4.8.2 Loading system. Several different loading systems were needed because of the different loading requirements for Series 1 and 2 and for Series 3.
4.6.2.1 TM:> point loading. For the tests of Series 1 and 2 a two point loading
system was used. A large spreader beam was attached to the test machine. The load
points were set at the appropriate locations for the two series (Fig. 4.3 and 4.9).
Neoprene bearing pads were used for all of the tests of Series 1 and Specimen 2-1. The pads were used both under the load points and under each support. The pads
were 2"x3"x7" and had nine 14 gao steel shims in them. The pads gave little resis
tance to longitudinal beam displacement relative to the test machine. In several cases
a small keeper was used to resist longitudinal movement. The pad use was eventually
discontinued after a pad failure occurred.
After the neoprene pads proved to be ineffective for the high loads of Series 2,
steel rollers were used. A pin support was placed under one end and 1 3/4" diameter
steel rollers were used under the other support and both loads points (Fig. 4.31). Steel bearing plates 1"x4"xlO" were used with the rollers. A layer of Hydrastone was placed
between the specimen and the plates to insure even bearing.
4.6.2.2 Fixed bead. For Specimen 3-3 and 3-4 a single unsymmetrical load
point was used (See Fig. 4.14). The shear load was only critical in one shear span
because the other shear span had only one third of the load. For these tests a fixed
loading head was inserted into the test machine. The load was then applied through a
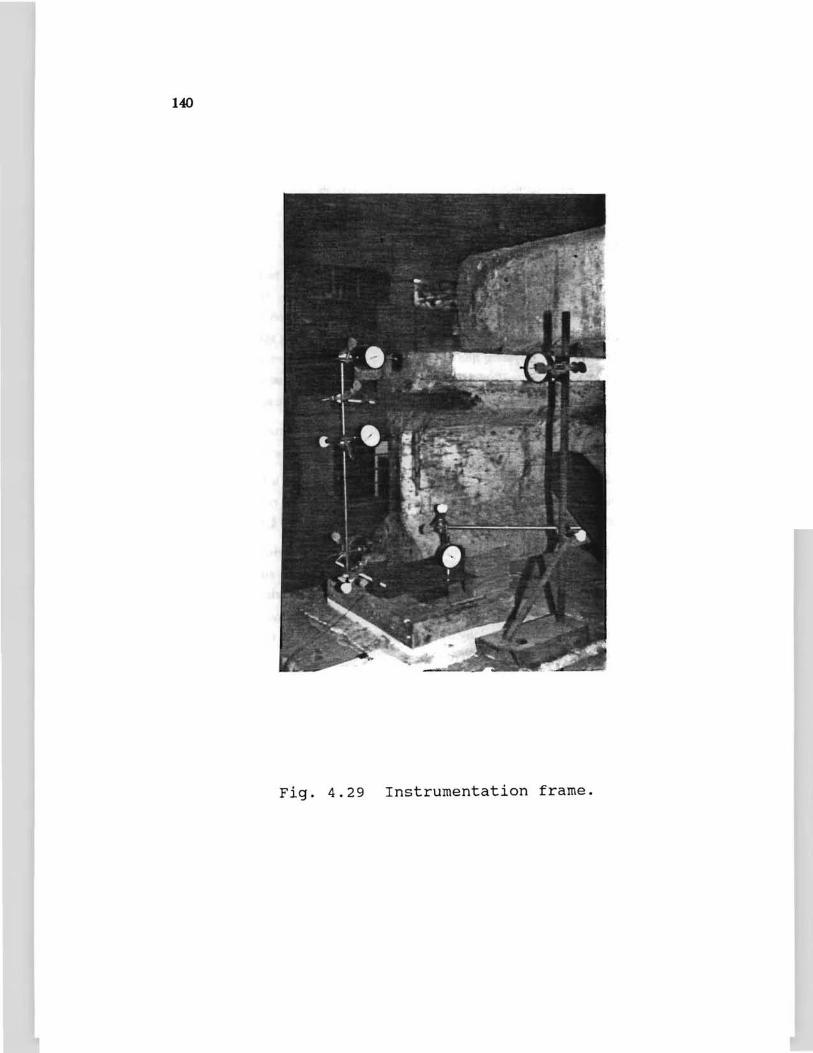
1~
Fig. 4.29 Instrumentation frame.
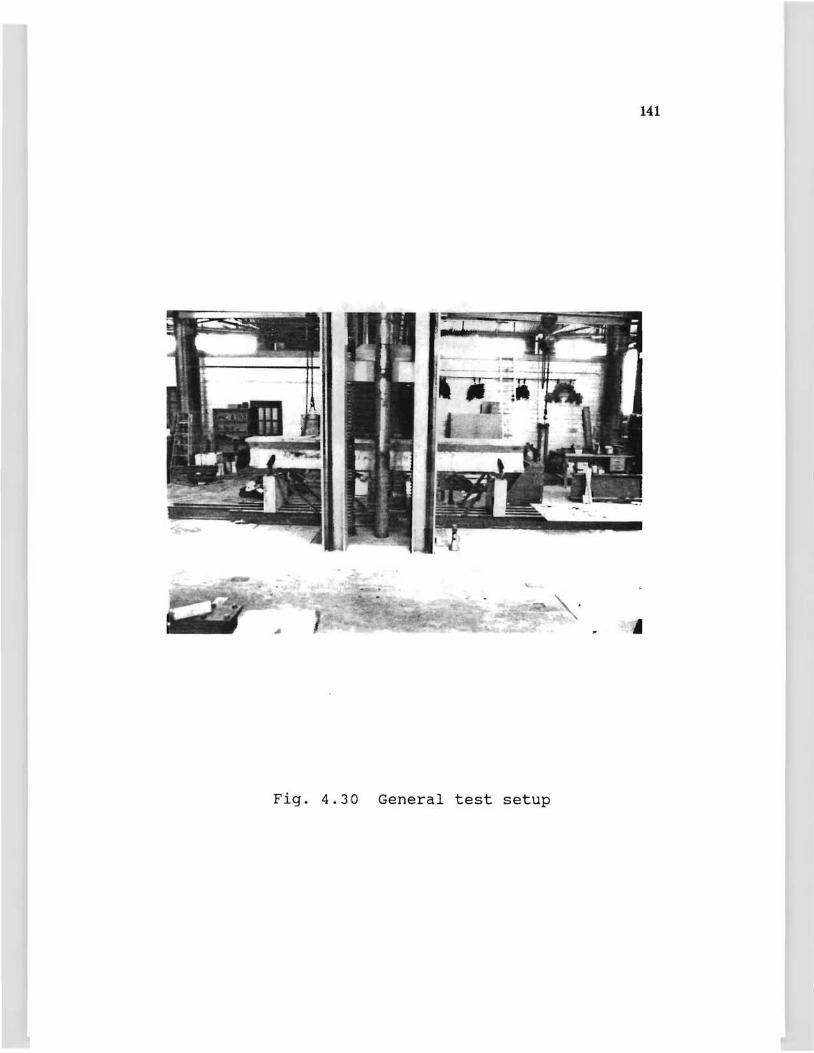
141
Fig. 4.30 General test setup
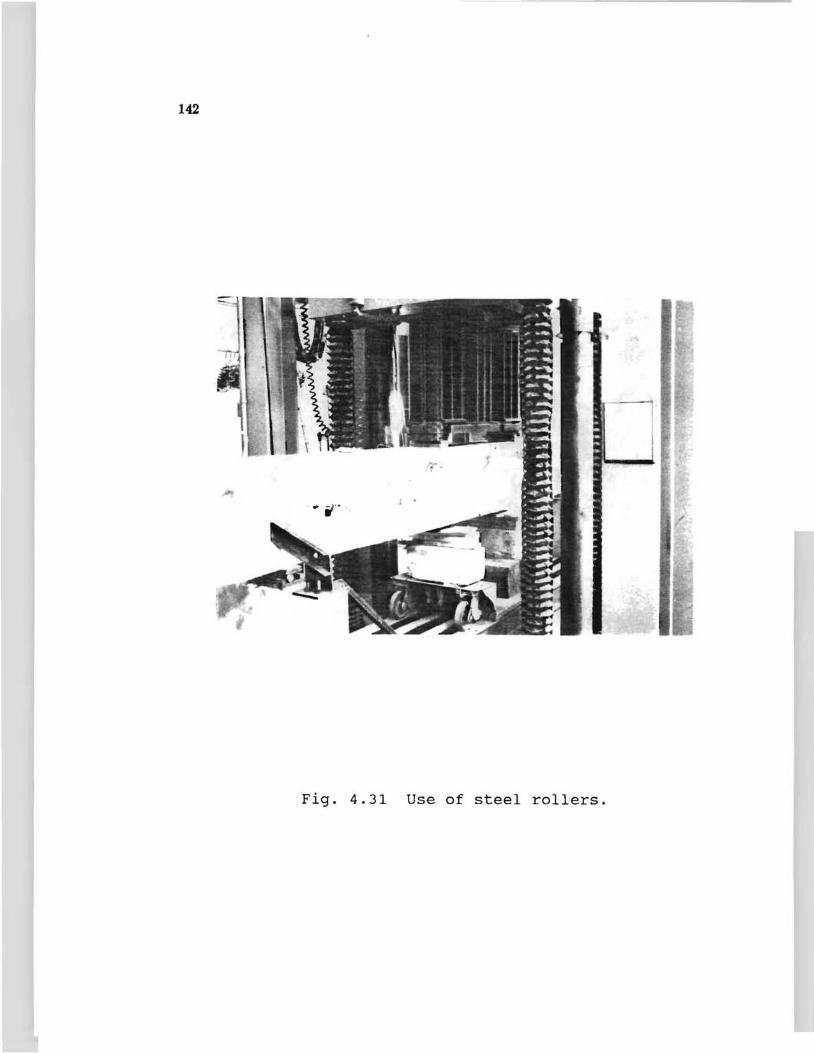
142
Fig. 4.31 Use of steel rollers.
143
neoprene bearing pad. Another neoprene pad was used as a support under the critical
shear span. A steel pin connection was used at the other support.
4.6.2.3 Test frame. For Specimens 3-1 and 3-2 a completely independent load
system was used (Fig. 4.32). The system consisted of Dywidag bars and a braced load
head. The Dywidag bars were tied to the loading floor. A ram and load cell were
suspended from the load head. Load was applied through a spherical head. The general
load and support locations were the same as shawn in Figure 4.14.
4. T Test procedure
A general loading plan was detennined prior to the beginning of each test.
This generally involved steps of moderate fractions of the predicted cradeing load. Near
the predicted cracking load, single kip shear increments were used until craclcing was
noted. The load increments were then increased acx:ording to the predicted ultimate
load. For Specimens 3-1 and 3-2, after the cradeing load was reached the specimens
were unloaded and then reloaded to failure. In several other tests loading had to be
suspended, unloaded, and reloaded due to problems with the loading system such as
excessive bearing pad displacements.
At each load stage a series of specimen strain and displacement readings were
taken. The readings were either taken manually or by the data acquisition system
depending on which system was in use for a given test.
Test set up checks were also made at the various load stages. These chedes
involved monitoring pedestal movements, beam roll, and beam displacement relative
to the test machine. These readings gave an indication of test system stability and in
several cases indicated the existence of problems.
At first cradeing and then at regular intervals crade growth was marked. This
allowed observance of crack pattern changes with load. In addition the angle the crack
made to the horizontal was measured and crack width readings were taken on a number
of crades.
Pictures were taken of the beam at the same interval as cracks were marked.
This allowed a permanent record to be kept of beam behavior.
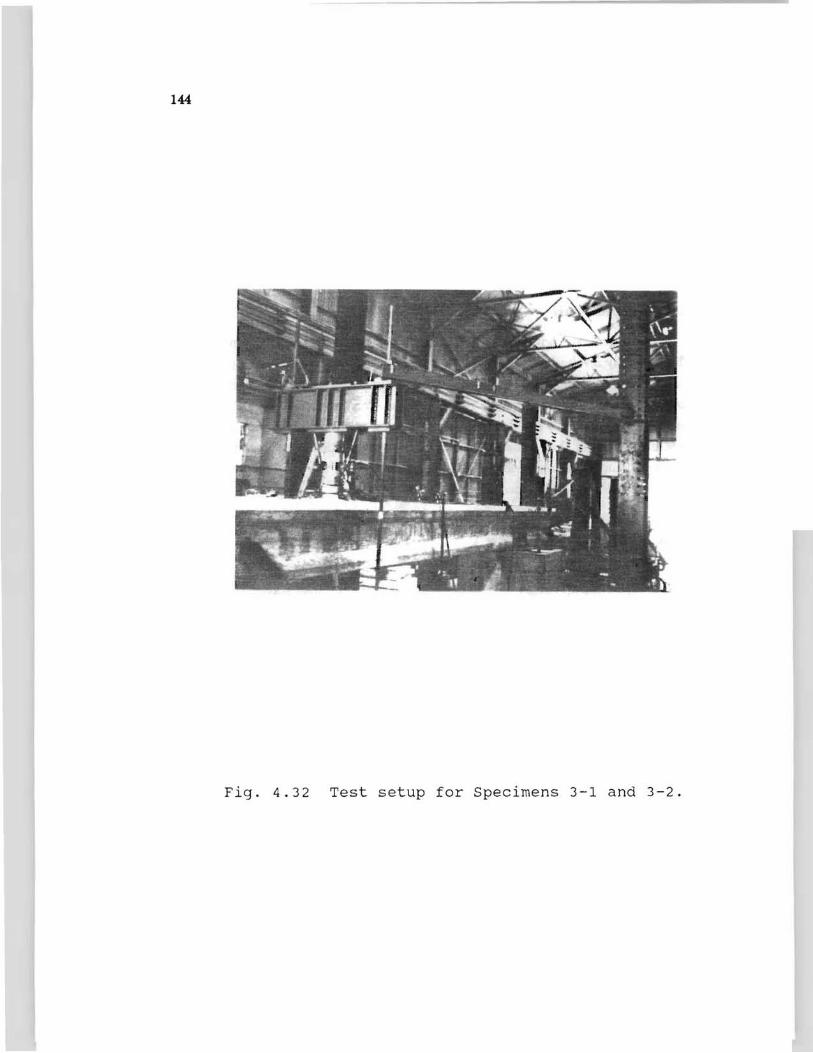
1«
Fig. 4.32 Test setup for Specimens 3-1 and 3-2.
145
4.8 Data Reduction
The data from Series 1 and 2 testa were stored directly onto disk by the data
acquisition system. Data were converted to a form usable on the laboratory's microcOI'Il
puten. The data from the tensioning operations aa well aa losses over time were taken
manually. Data from Series #3 was all taken manually and then input into a computer.
The majority of the data reduction waa done using the laboratory's computers.
The calculation of effective prestresa was done manually.

!!!!!!!!!!!!!!!!!!!"#$%!&'()!*)&+',)%!'-!$-.)-.$/-'++0!1+'-2!&'()!$-!.#)!/*$($-'+3!
44!5"6!7$1*'*0!8$($.$9'.$/-!")':!
5.1 Introduction
CHAPTER 5 TEST RESULTS
This chapter contains the results and observations from the ten shear tests
conducted in this project. All ten specimens were pretensioned high strength concrete
girders. Six specimens had high strength monolithically cast decks while the other four
had low strength composite decks. The principal goal of this program was to obtain
data on the shear capacity of high strength prestressed concrete girders.
The primary variable was the quantity of shear reinforcement provided. Se
ries 1 was designed with very light shear reinforcement. These tests were intended to
check behavior of girders with no or very light shear reinforcement. These specimens
were selected to be at the lower limits of AASHTO/ACI and are quite typical of shear
reinforcement used in full scale long span structures. Series 2 was designed for ex
tremely heavy shear reinforcement. The heavy reinforcement was intended to determine
if maxinnm shear reinforcement levels can be raised for use with high strength concrete.
Series 3 was designed to check intermediate behavior. Two specimens had the current
AASHTO/ACI maximum reinforcement of V. = 8.Jff,bw d. The other two specimens
had an intermediate level of shear reinforcement.
In the following section the individual tests will be discussed. Specimen per
formance will be described including cracking loads and load deflection behavior. Infor
mation from internal strain gauges and crack measurements will a1so be included.
The third section of this chapter will cover the tests as a group. General be
havior of high strength prestressed concrete girders will be noted. The general behavior
will then be compared to the assumptions of the shear capacity models of Chapter 3. Fi
nally, the test data will be compared with the numerical predictions of the shear capacity
models.
5.2 Test Behavior
5.2.1 Specimen 1-1. Specimen 1-1 was a prestressed girder with no shear
reinforcement. The principle goal was to evaluate the cracking load of this type member.
The load was applied in two kip shear increments to 10.0 kips and in one kip shear
increments to 21.0 kips. Mter this the load was increased by 0.5 kip shear increments
until each end cracked. First inclined cracking occurred in the web at a shear of 26.0
147
148
kips. The load dropped substantially, but returned to the cracking load. Load was
then increased until the second end cracked at 27.0 kips. On each end the first cracks
extended from the bottom flange all the way up to the top flange. Several cracks formed
on each end (Fig. 5.1 (a)). After each end cracked' the beam was unloaded.
The beam was reloaded to the previoua cracking load of 27 kips. Some ex
tension of the cracks was noted during the reloading. The beam was then loaded in
0.5 kip shear increments until failure. Relatively few additional cracks were noted. The
existing cracks did, however, open extremely wide as the load increased. Crack widths
were on the order of 1/4 in. at failure. Flexure cracks were noted at a shear of 32.0 kips.
Flexure-like cracks formed in the shear span at a shear of 29.0 kips (Fig. 5.1 (b)). At
this stage, however, there were no cracks in the constant moment region. As the load
increased the shear cracks propagated into the bottom flange. Shortly prior to failure
they had progressed nearly through the bottom flange.
There were no flexure-shear cracks. The ultimate shear capacity was 34.5 kips
(Fig. 5.2). At failure the crack went completely through the bottom flange just outside
the detail steel. The web exploded with the concrete struts basically intact. There was
no debonding or slip of the prestressing strands prior to failure.
The load-deflection behavior of Speciment 1-1 is shown in Figure 5.3. The
displacements were determined based on the measured head displacement of the test
ma.clline corrected by an estimate of the compression of the neoprene pads used. This
was required due to difficulties with linear potentiomenters. It can be noted that there
were substantial drops in load after each end cracked. Upon reloading the beam was
not as stiff. This was due to the presence of shear cracking since the beam had not
cracked flexurally. The load-deflection curve did flatten appreciably before shear failure
occurred.
Measurements were taken on strand strain during the test. Figure 5.4 shows
the strand strain given by gauge 5 through the two load cycles. On the second cycle
the strains were higher for a given load. As the flexure-like cracks formed in the shear
span the strand strains began to increase more rapidly as the load increased. Figure 5.5
shows the strain in all the strand gauges for the second cycle. The estimated pretension
strain was 6<XX)pe. Assuming yield to be at 1% strain the strands in Specimen 1-1 did
not yield prior to failure.
Measurements of the angle of inclination were taken for some of the cracks
that formed. The cracks claJeSt to the support and load point ranged from about 35°
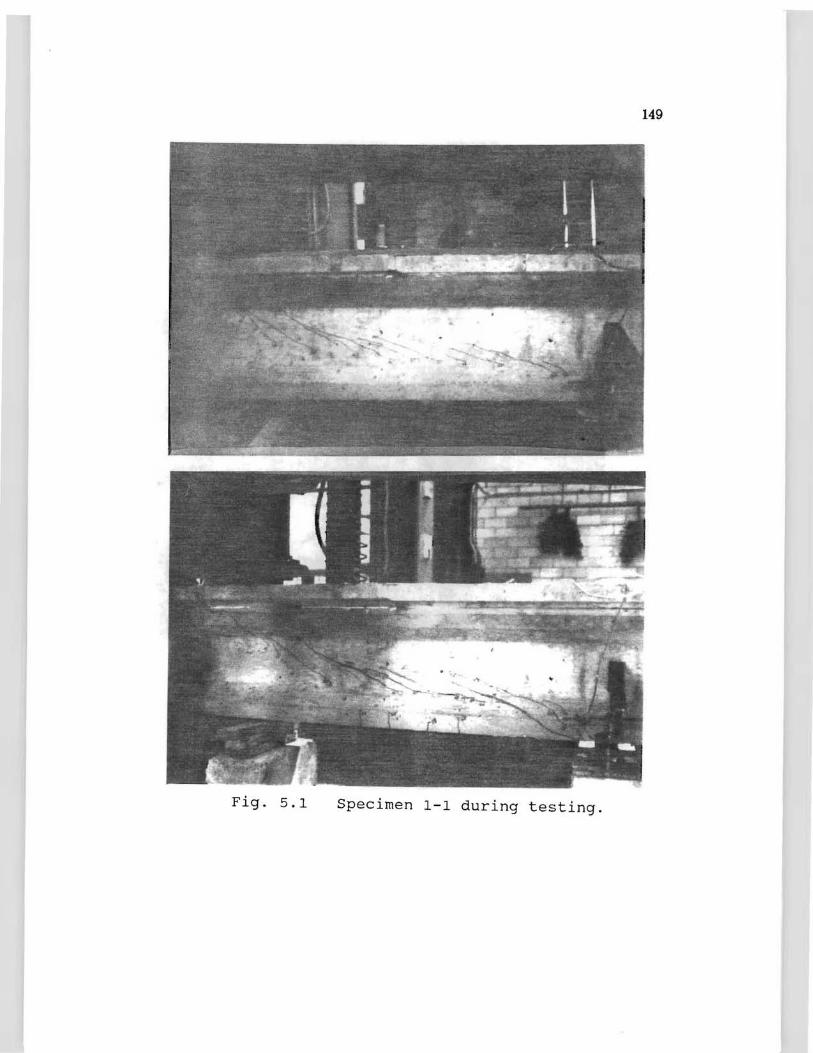
149
Fig. 5.1 Specimen 1-1 during testing.
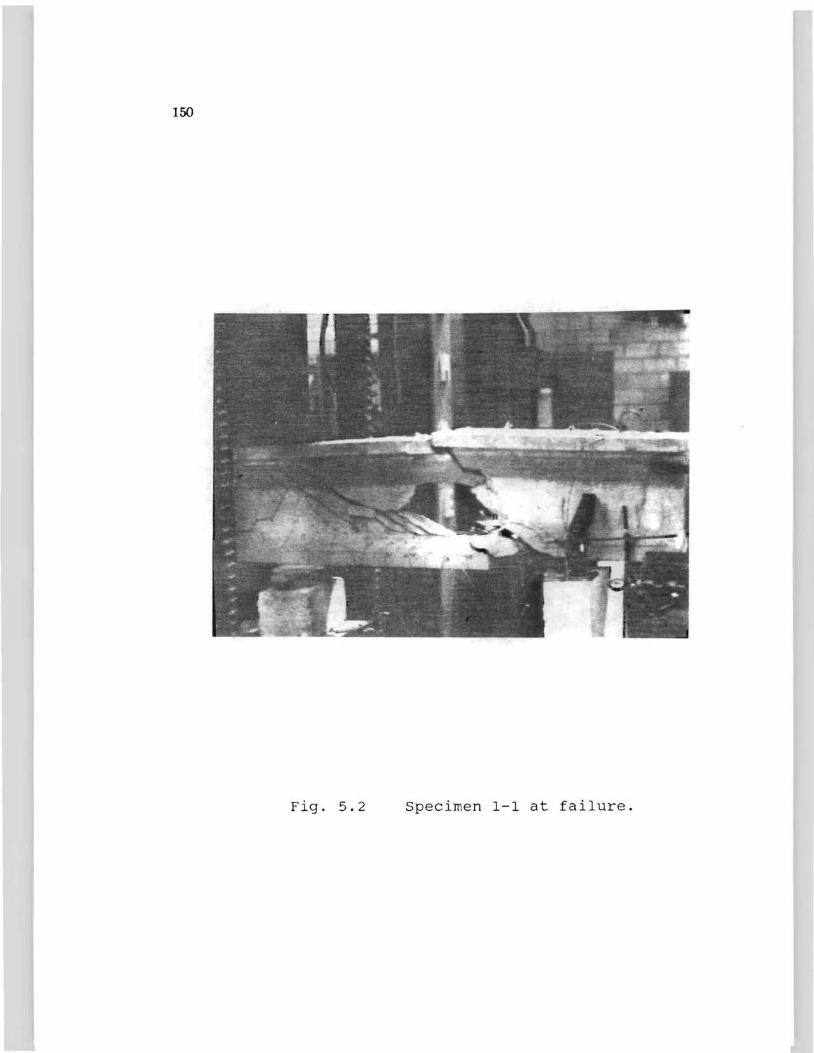
150
Fig. 5.2 Specimen 1-1 at failure.
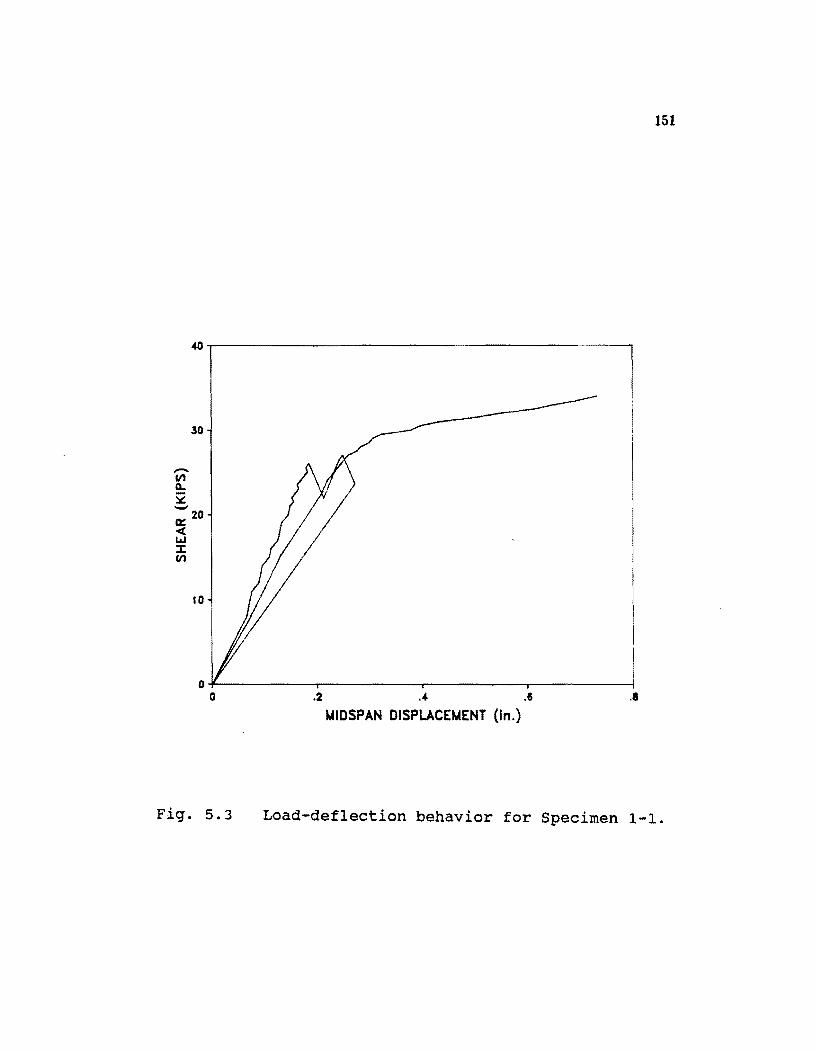
151
30
-VI Q.
52 -0::: 20
< ..... :J: VI
10
.2 ... .6 .8
UIDSPAN DISPLACEMENT (In.)
Fig. 5.3 Load-deflection behavior for Specimen 1-1.
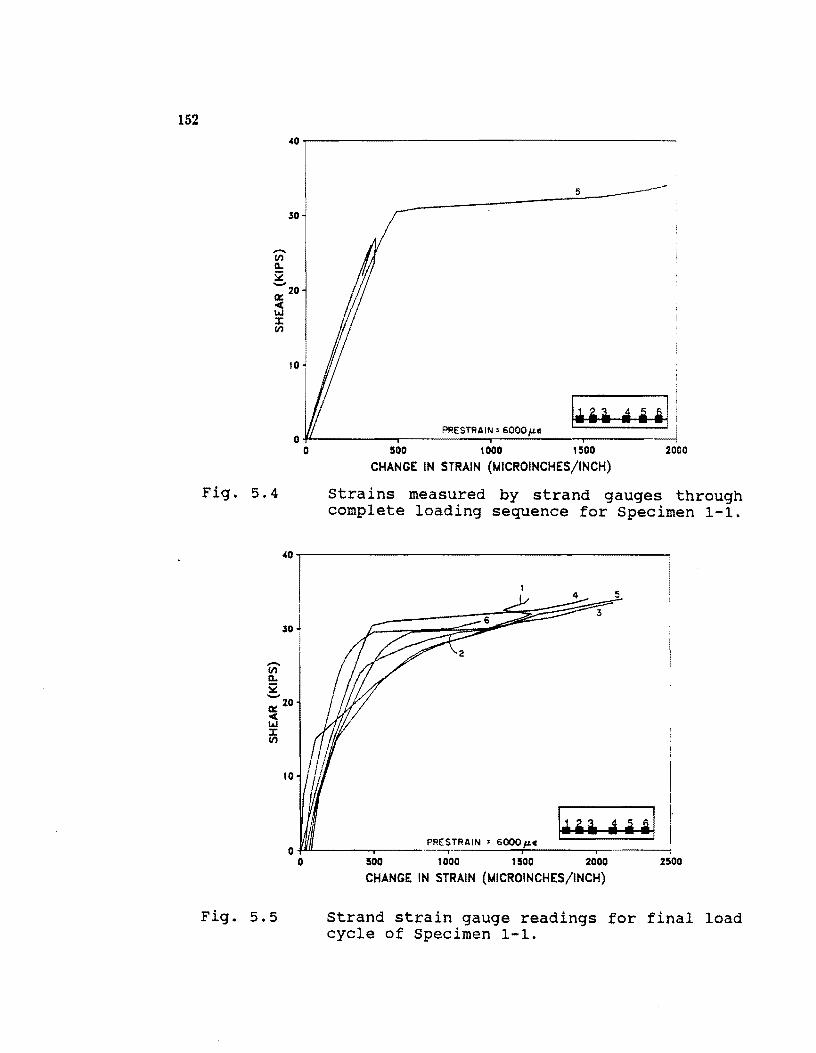
152 40~----------------------------------------
5
30
-III a.. i: -a:: 20 -< I.IJ J: III
Fig. 5.4
Fig. 5.5
10
10
r--------, ,
I .. , ... a iii ! PRESTRAIN=6000~E I
O~----~--------~--~----~I------~ o SOD 1000 1500 2000
CHANGE IN STRAIN (~ICROINCHES/INCH)
strains measured by strand gauges through complete loading sequence for Specimen 1-1.
I .. '~ "ul PRE_~ST_R_AI~N_=_6_~~~~E~ ____ ~~ ______ ~ 0.J.I.U.-----....,...-------, I
a 500 1000 1500 2000 2500
CHANGE IN STRAIN (~ICROINCHES/INCH)
Strand strain gauge readings for final load cycle of Specimen 1-1.
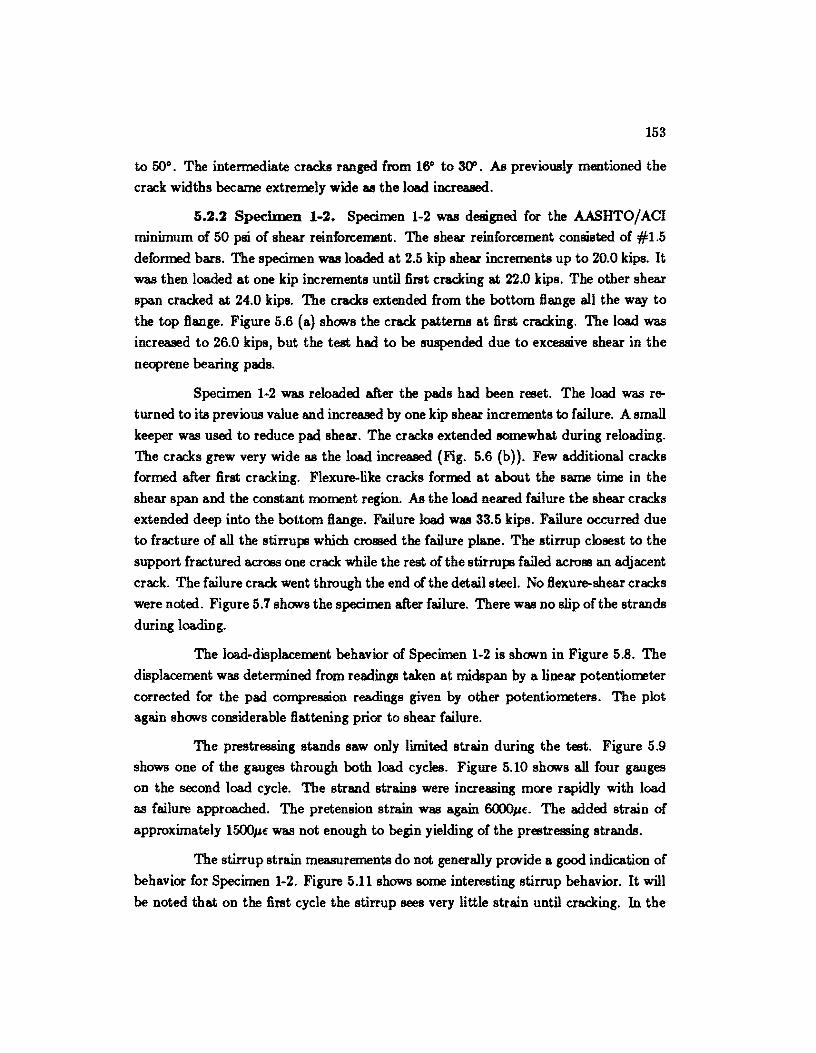
153
to 50°. The intennediate cracks ranged from 16° to 3()D. As previously mentioned the
crack widths became extremely wide 88 the load increased.
5.2.2 Specimen 1-2. Specimen 1-2 was designed for the AASHTO/ACI
minimum of 50 psi of shear reinforcement. The shear reinforcement consisted of #1.5
defonned bars. The specimen was loaded at 2.5 kip shear increments up to 20.0 kips. It
was then loaded at one kip increments until first cracking at 22.0 kips. The other shear
span cracked at 24.0 kips. The cracks extended from the bottom flange all the way to
the top flange. Figure 5.6 (a) shaws the crack patterns at first cracking. The load was
increased to 26.0 kips, but the test had to be suspended due to excessive shear in the
neoprene bearing pads.
Specimen 1-2 was reloaded after the pads had been reset. The load was re
turned to its previous value and increased by one kip shear increments to failure. A small
keeper was used to reduce pad shear. The cracks extended somewhat during reloading.
The cracks grew very wide as the load increased (Fig. 5.6 (b)). Few additional cracks
formed after first cracking. Flexure-like cracks formed at about the same time in the
shear span and the constant moment region. As the load neared failure the shear cracks
extended deep into the bottom flange. Failure load was 33.5 kips. Failure occurred due
to fracture of all the stirrups which crossed the failure plane. The stirrup closest to the
support fractured &Cfca one crack while the rest of the stirrups failed across an adjacent
crack. The failure crack went through the end of the detail steel. No flexure-shear cracks
were noted. Figure 5.7 shaws the specimen after failure. There was no slip of the strands
during loading.
The load-displacement behavior of Specimen 1-2 is shawn in Figure 5.S. The
displacement was determined from readings taken at midspan by a linear potentiometer
corrected for the pad compression readings given by other potentiometers. The plot
again shaws considerable flattening prior to shear failure.
The prestressing stands saw only limited strain during the test. Figure 5.9
shows one of the gauges through both load cycles. Figure 5.10 shaws all four gauges
on the second load cycle. The strand strains were increasing more rapidly with load
as failure approached. The pretension strain was again 600010'£. The added strain of
approximately 150010'£ was not enough to begin yielding of the prestressing strands.
The stirrup strain measurements do not generally provide a good indication of
behavior for Specimen 1-2. Figure 5.11 shows some interesting stirrup behavior. It will
be noted that on the first cycle the stirrup sees very little strain until cracking. In the
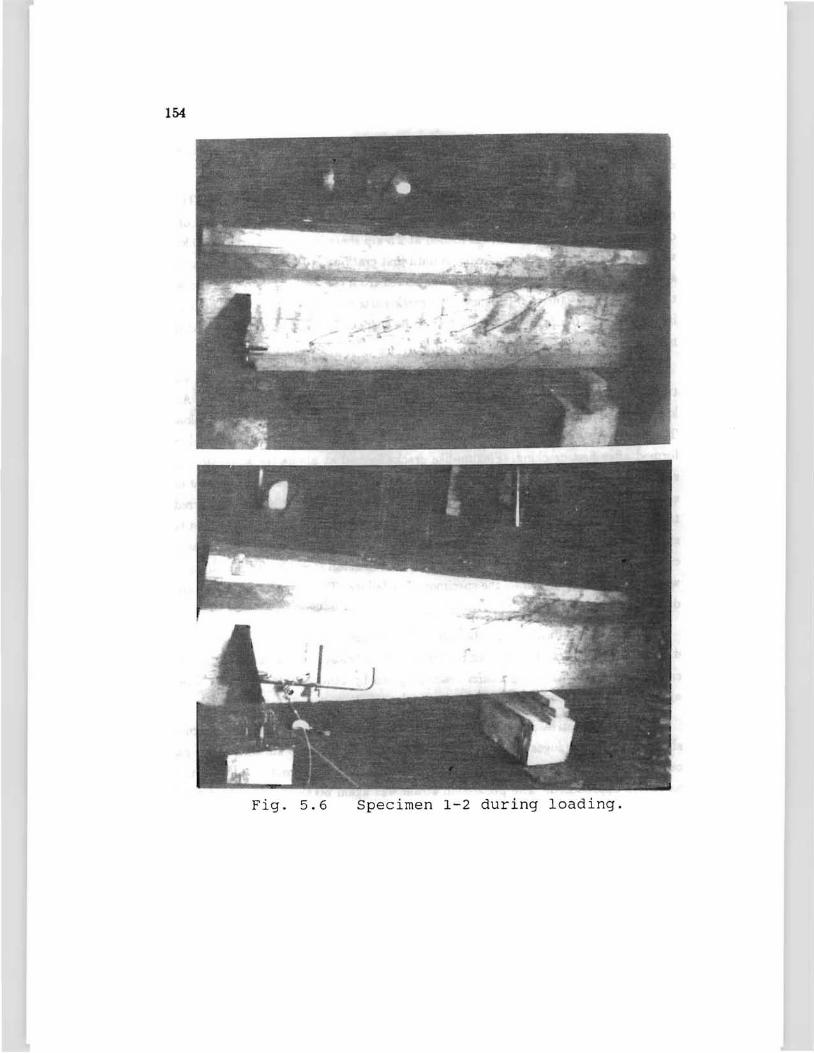
154
Fig. 5.6 Specimen 1-2 during loading.
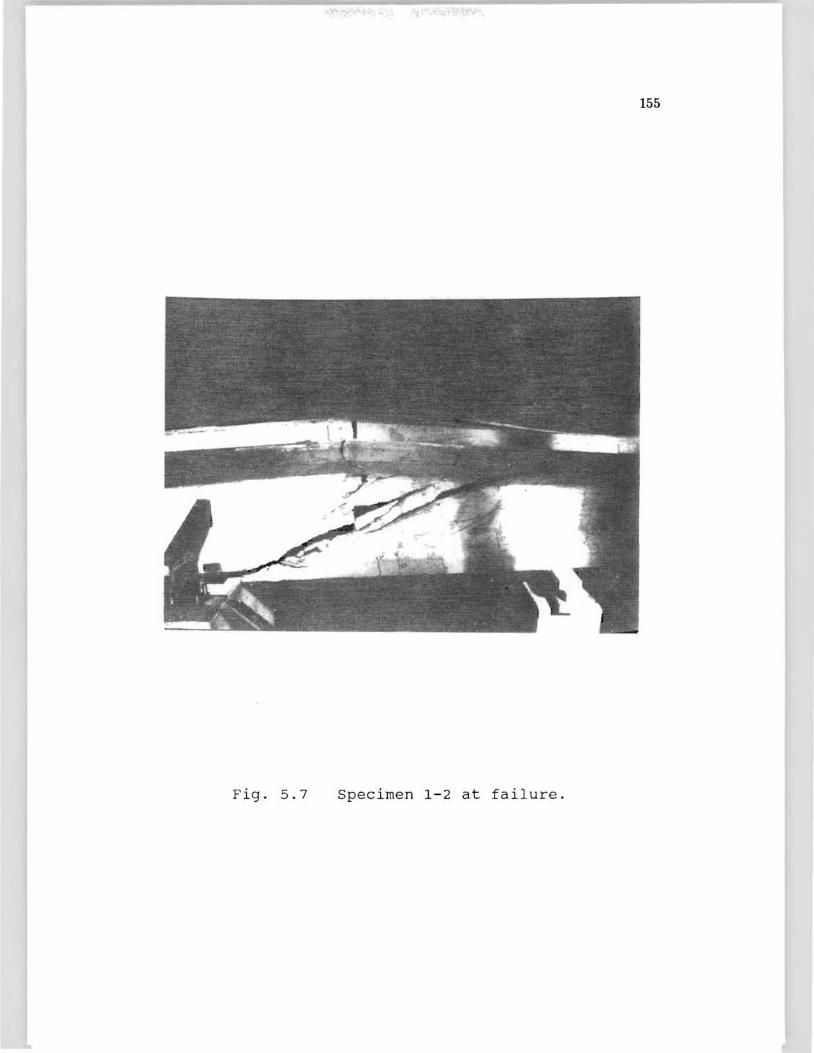
155
Fig. 5.7 Specimen 1-2 at failure.
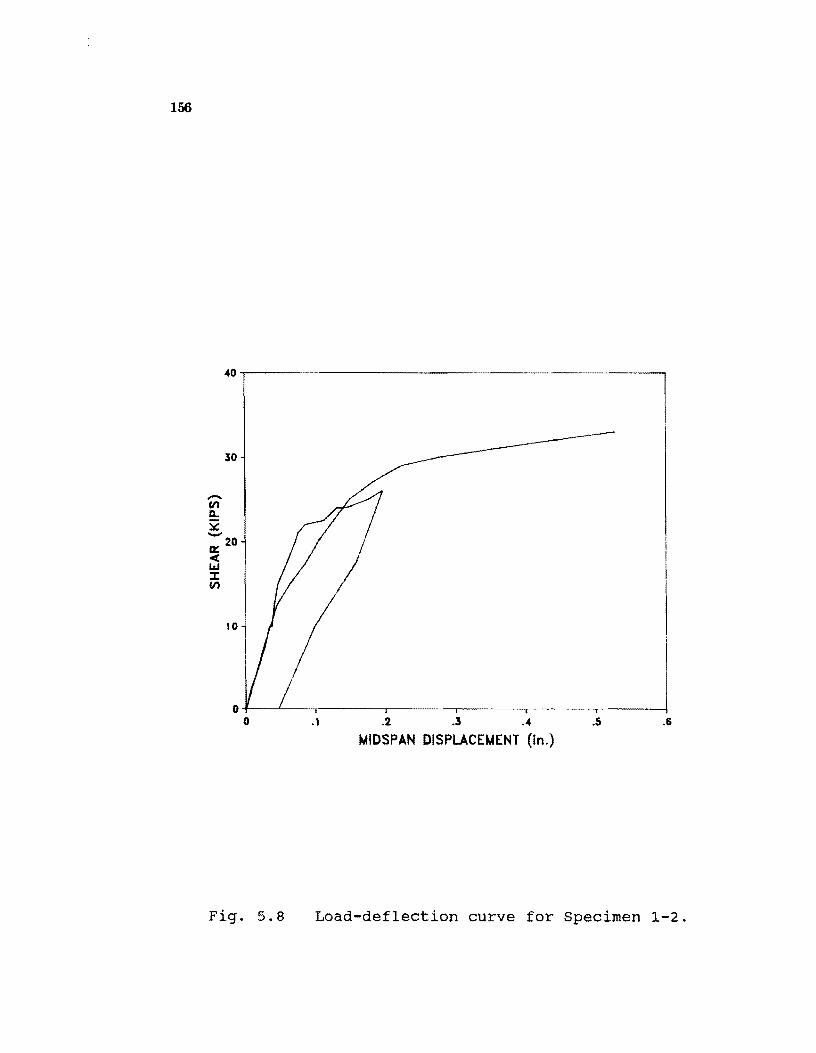
156
40T---------------------------------------------~
..-en Il..
52 -
30
D! 20 <C( LaJ :I: en
I
I
I
~~_.__-.-----,--, J .1 .2 .3 .4 .5 .6
UIDSPAN DISPLACEUENT (in.)
Fig. 5.8 Load-deflection curve for Specimen 1-2.
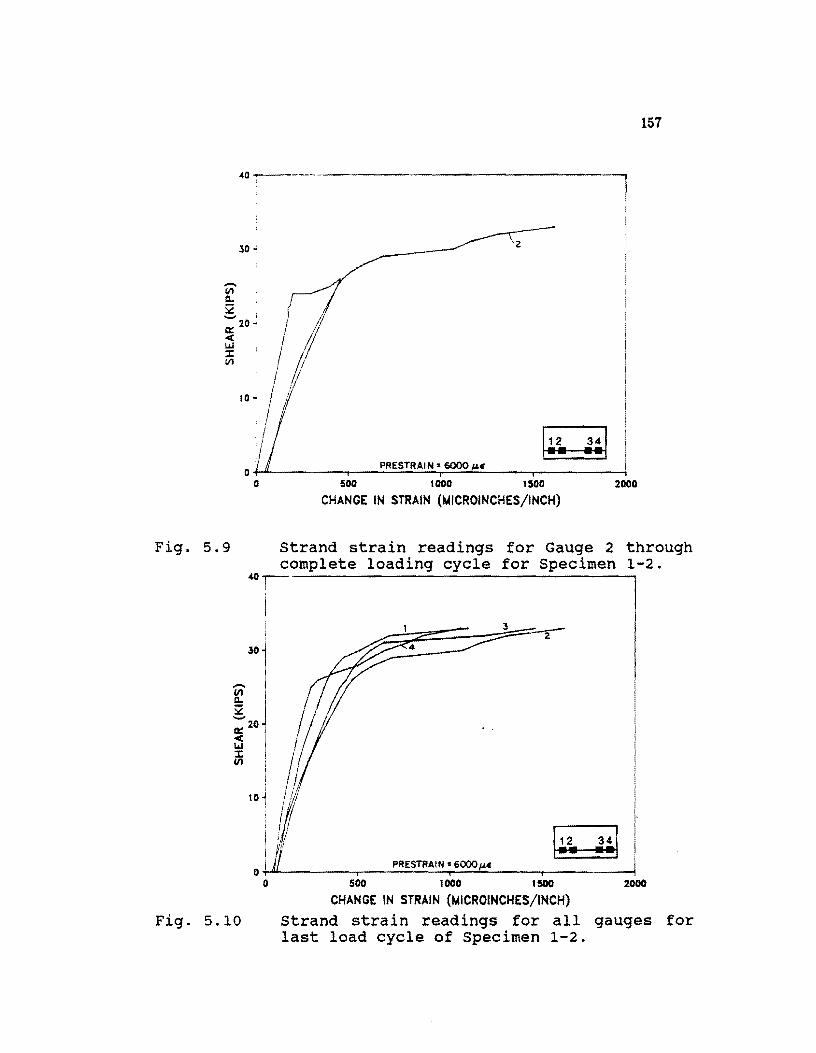
:so ~
-(Il a.. g I a::: 20-:
~ "1 /
'I
157
2
O~ ________ ~ ___ P~RE~S~TR~A~IN~:~~~~.~ __ ~ ________ --1
o 500 1000 1500 2000
CHANGE IN STRAIN (t.4ICROINCHES/INCH)
Fig. 5.9 Strand strain readings for Gauge 2 through
Fig. 5.10
complete loading cycle for Specimen 1-2. 40, I
4
PRESTRAIN : 6000
500 1000 1500 2000
CHANGE IN STRAIN (t.4ICROINCHES/INCH)
Strand strain readings for all gauges for last load cycle of Specimen 1-2.
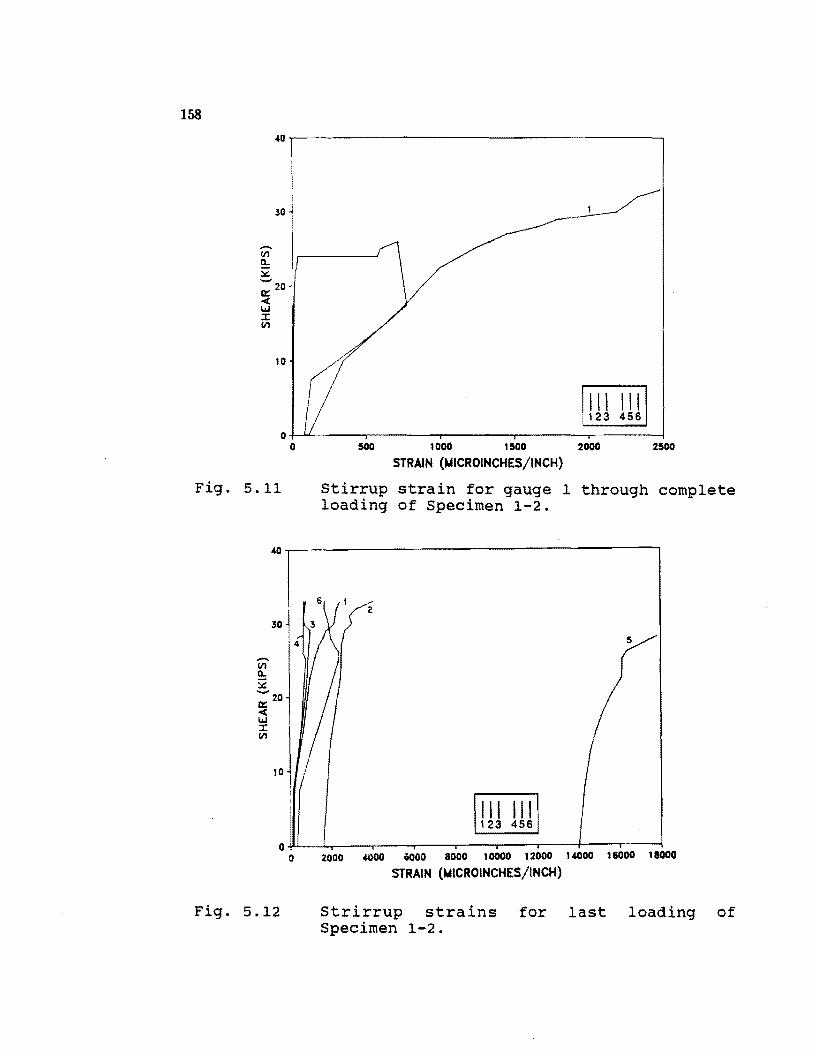
158
i 30 ~
-VI a.. ~ ! - : It: 20-0« UJ :.I: VI
10
Fig. 5.11
III III 123 456
500 1000 1500 2000 2500
STRAIN (MICROINCHES/INCH)
Stirrup strain for gauge 1 through complete loading of Specimen 1-2.
III III 123 456
O~~~---r---.----r---'----r---+--~'-~ o ~ ~ ~ ~ 1~1~1~1~1~
Fig. 5.12
STRAIN (MICROINCHES/INCH)
Strirrup strains for last loading of Specimen 1-2.
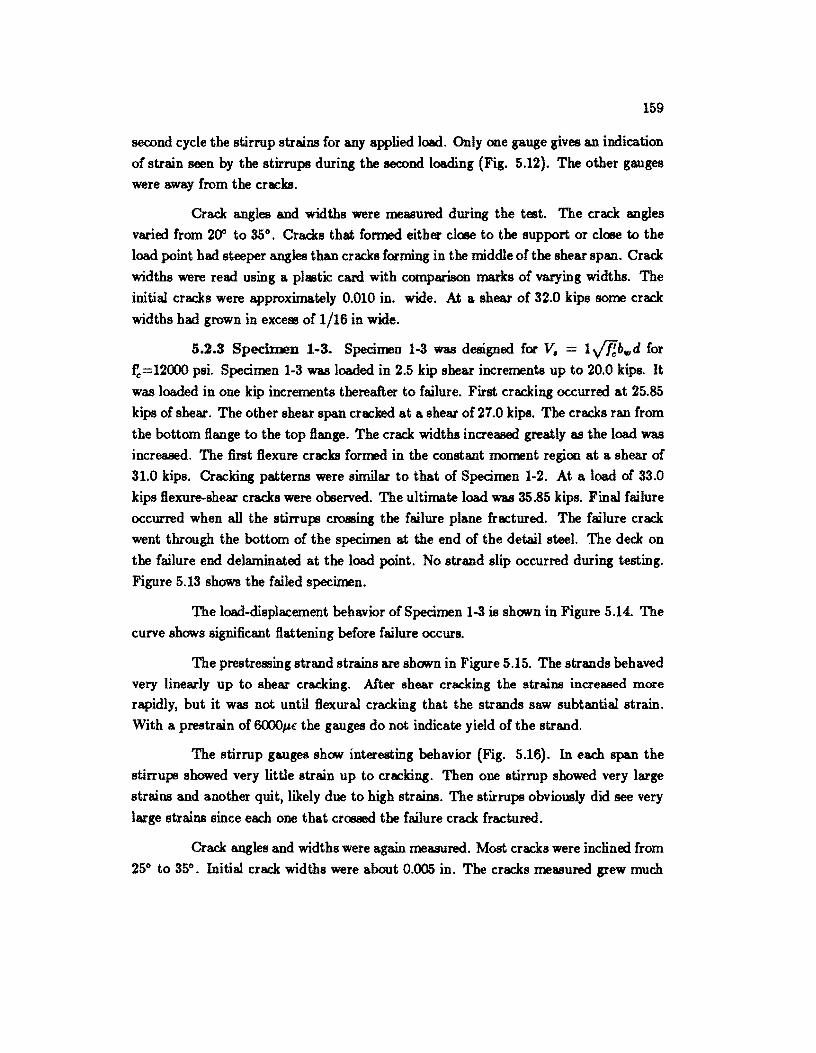
159
second cycle the stirrup strains for any appJied load. Only one gauge gives an indication
of strain seen by the stirrups during the second loading (Fig. 5.12). The other gauges
were away from the cracks.
Crack angles and widths were measured during the test. The crack angles
varied from 200 to 35°. Cracks that fonned either close to the support or close to the
load point had steeper angles than cracks forming in the middle of the shear span. Crack
widths were read using a plastic card with comparison marks of varying widths. The
initial cracks were approximately 0.010 in. wide. At a shear of 32.0 kips some crack
widths had grown in excess of 1/16 in wide.
5.2.3 Specimen 1-3. Specimen 1-3 was designed for V. = 1v'l!blll d for
~=12000 psi. Specimen 1-3 was loaded in 2.5 kip shear increments up to 20.0 kips. It
was loaded in one kip increments thereafter to failure. First cracking occurred at 25.85
kips of shear. The other shear span cracked at a shear of 27.0 kips. The cracks ran from
the bottom flange to the top flange. The crack widths increased greatly as the load was
increased. The first flexure cracks formed in the constant moment region at a shear of
31.0 kips. Cracking patterns were similar to that of Specimen 1-2. At a load of 33.0
kips flexure-shear cracks were observed. The ultimate load was 35.85 kips. Final failure
occurred when all the stirrups crossing the failure plane fractured. The failure crack
went through the bottom of the specimen at the end of the detail steel. The deck on
the failure end delaminated at the load point. No strand slip occurred during testing.
Figure 5.13 shows the failed specimen.
The load-displacement behavior of Specimen 1-3 is shown in Figure 5.14. The
curve shows significant flattening before failure occurs.
The prestressing strand strains are shown in Figure 5.15. The strands behaved
very linearly up to shear cracking. After shear cracking the strains increased mare rapidly, but it was not until flexural cracking that the strands saw subtantial strain.
With a prestrain of 60001'£ the gauges do not indicate yield of the strand.
The stirrup gauges shaw interesting behavior (Fig. 5.16). In eacll span the
stirrups showed very little strain up to cracking. Then one stirrup showed very large
strains and another quit, likely due to high strains. The stirrups obviously did see very
large strains since each one that crossed the failure crack fractured.
Crack angles and widths were again measured. Most cracks were incJined from
25° to 35°. Initial crack widths were about 0.005 in. The cracks measured grew much
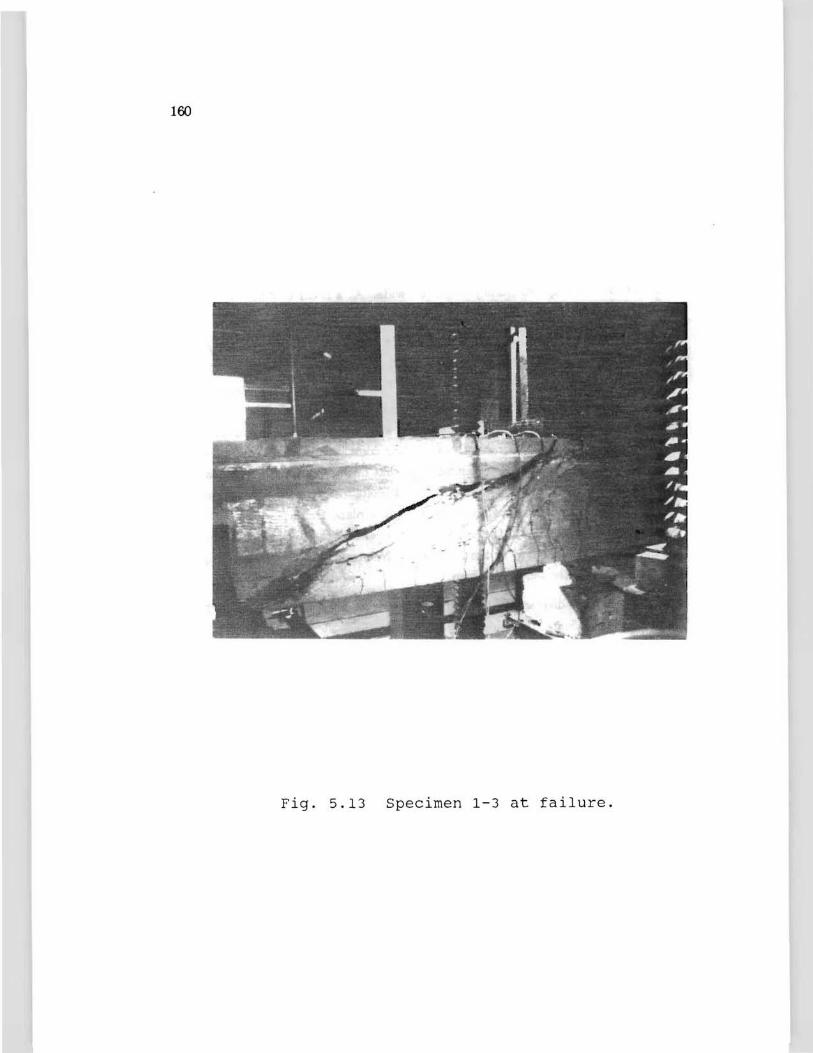
100
Fig. 5.13 Specimen 1-3 at failure.
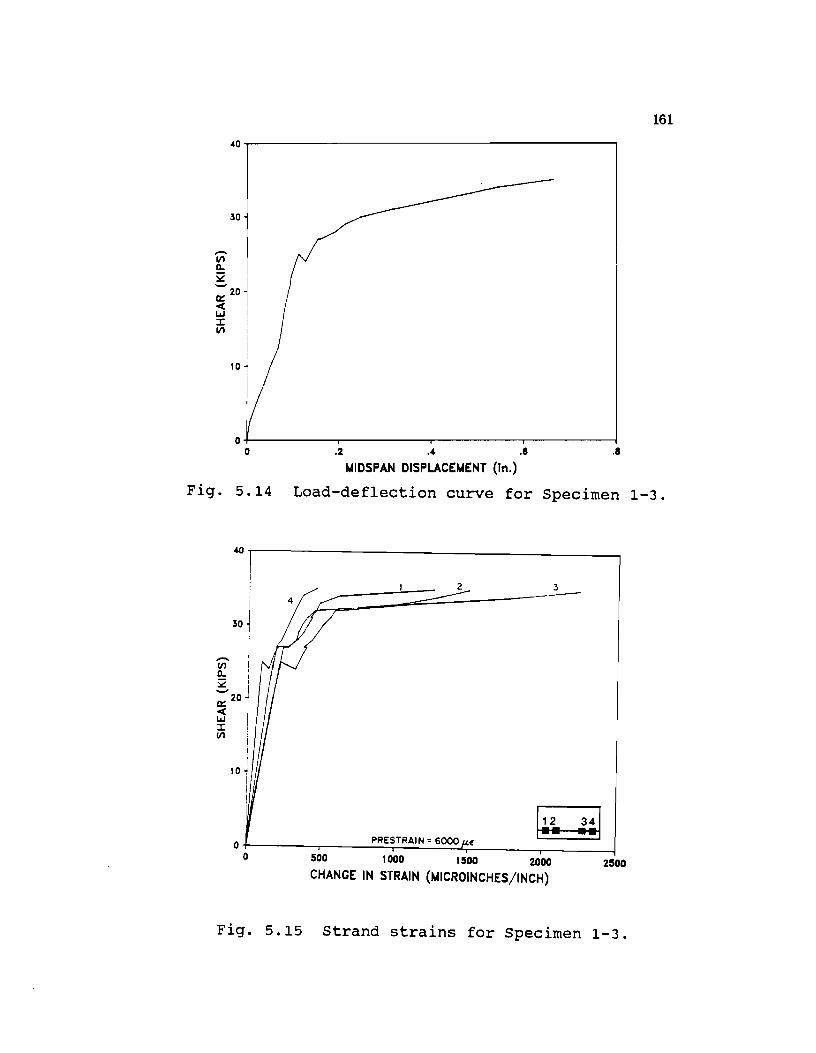
161
40~------------------------------------------1
o+---------.---------.---------.-------~ o .2 .4 .S .1
~IDSPAN DISPLACE~ENT (In.)
Fig. 5.14 Load-deflection curve for Specimen 1-3.
2 3
.c::::.=---=:::::::::=-----30
10
~ 0+-______ -. ______ P_R~ErST_R_A~IN_=~6~OO~O~~~------r_------~
o 500 1 000 1500 2000
CHANGE IN STRAIN (MICROINCHES/INCH) 2500
Fig. 5.15 Strand strains for Specimen 1-3.
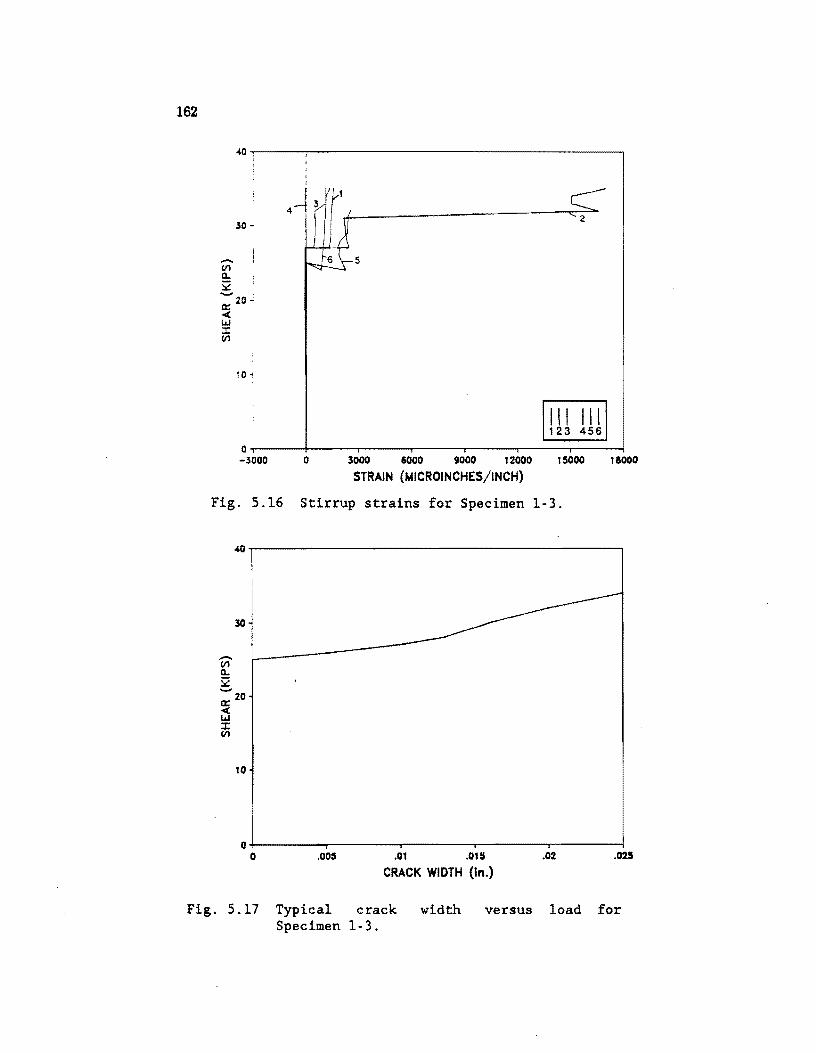
162
40,-----~----------------------------------__,
30
- 5 VI a.. !II:: -0:: 20 < I.tJ J: VI
to
0 -3000 0 3000 1000 9000 12000
STRAIN (MICROINCHES/INCH)
Fig. 5.16 Stirrup strains for Specimen
Fig.
--. VI a.. i: -
30
0:: 20 < I.tJ J: VI
10
0 0
5.17
.005 .01 .015
CRACK WIDTH (In.)
Typical crack width versus Specimen 1-3.
2
III III 123 456
15000 11000
1-3.
.02 .025
load for
163
wider as load increased. At a shear of 34.0 kips most cracks measured were 0.25 in. or
more in width. Figure 5.17 shows the change in width for a typical crack.
5.2.4: Specimen 2-1. Specimen 2-1 was designed for a V. = 12V7fb.d with
t::=12000 psi. Specimen 2-1 was loaded in 2.5 kip increments up to a shear load of 30.0
kips. At a shear value of 32.0 kips shear cracks were noted. The specimen had suffered
from shrinkage cradeing before to formwork removal. All shrinkage cracks were closed at
the time of the shear cracking. The second shear span cracked at 34.0 kips. Figure 5.18
(a) shows the initial cradeing. The cracks were short and very fine with widths about
0.002 in. The load was increased in two kip increments to 80 kips and then by one kip
until failure. The number of cracks increased greatly as the load increased (Fig. 5.18
(b)). The crack widths stayed very small. The first flexural cracks became apparent
at 60.0 kips. The flexural crades that opened formed at the existing shrinkage cracks.
The cracks rapidly increased in height. Flexure- shear cradeing was observed at 70 kips.
Failure came from web crushing at 97 kips. Much of the web was blown off' explalively
at failure. Concrete spalled off' over a region about 50 inches long (Fig. 5.19). The shear
span was just under 56 inches long. Most of the concrete that blew off' came from clale
to the bottom flange. In one location there was a hole completely through the web.
After failure a large crack was observed just behind the support in the overhang. Prior
to failure no slip was noted in the strands. After failure a number of strands pulled
in. This was due to loss of bond because the strands were exposed in some areas. The
bottom layer of steel did not slip to any significant degree.
Figure 5.20 shows the load-deflection curve for Specimen 2-1. The displace
ments are corrected for pad compression. The curve indicates a loss of stiffness for
increasing load. It does not, however, show really pronounced flattening near failure.
The strand behavior is shown in Figure 5.21. The two gauges shown are for
similar locations in the beam. The initial pretension strain was 5300~. With an added
strain of only approximately 1000~ the strands were not near yield in the shear span.
One of the nonprestressed reinforcing bars was also gauged (Fig. 5.22). The
bar underwent 2890 micraltrains during testing. Yield strain was 2520~. The bar was
precompressed by 19001'£ due to prestressing. The bar did not yield.
Stirrup perfonnance is indicated in Figure 5.23. Very small strains occurred up
to cracking. After cracking the stirrup strains increased steadily with load. The figure
shows that some but not all of the instrumented stirrups yielded. The outer stirrup on
each end gave readings below yield.
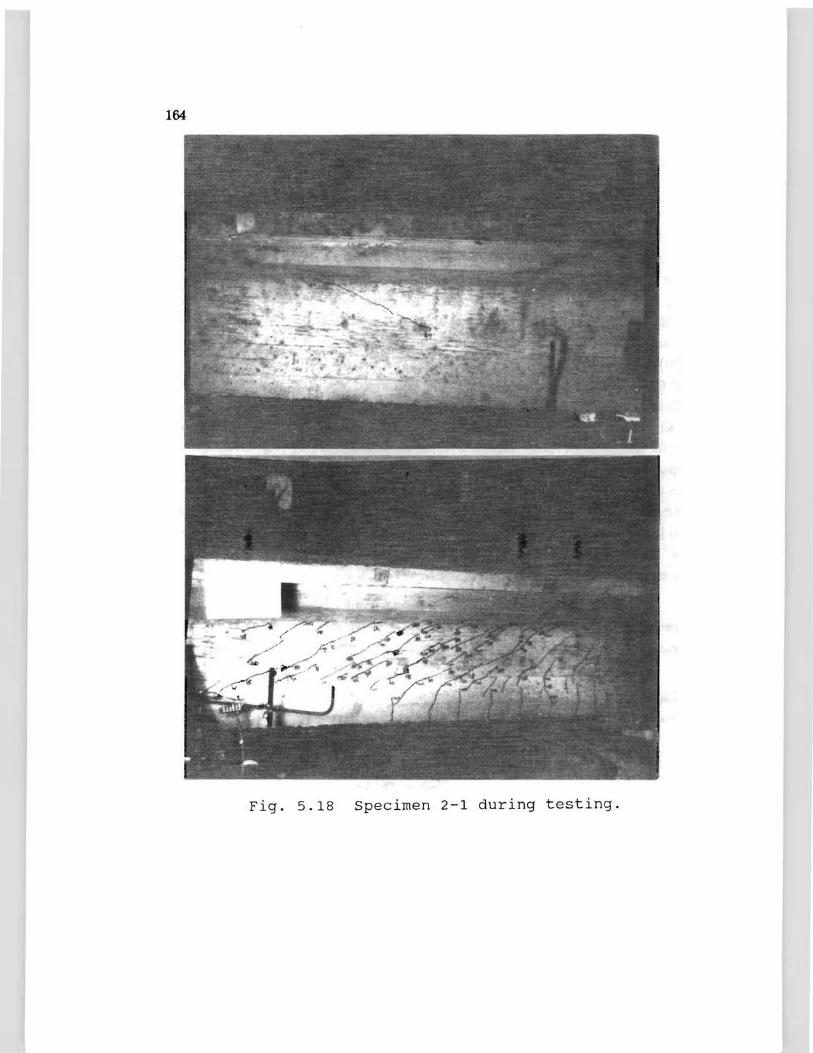
164
Fig. 5.18 specimen 2-1 during testing.
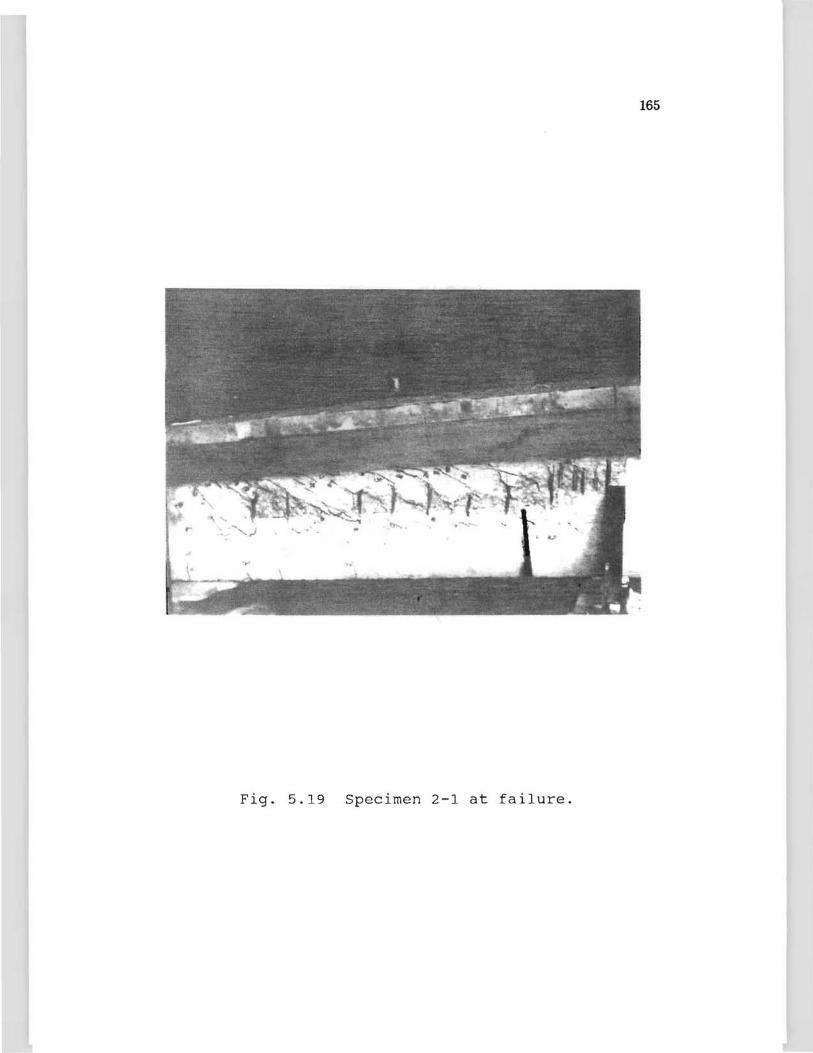
165
Fig. 5.19 Specimen 2-1 at failure.
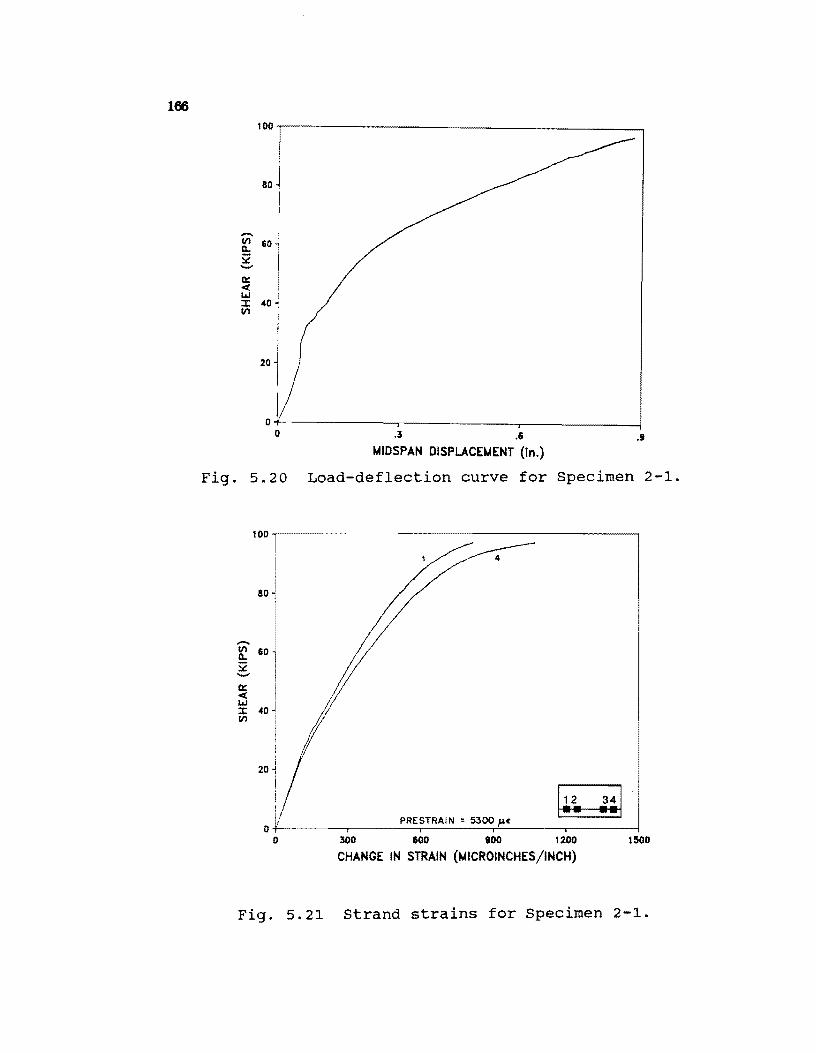
166 100~----------------------__________________ ~
80
-~ 60 S2 -
20
I O~-----------.------------~------____ -J
o .3 .6 .9
~IDSPAN DISPLACE~ENT (In.)
Fig. 5.20 Load-deflection curve for Specimen 2-1.
-VI a.. S2 -Q: « w ::t VI
100~---------- -------------------------------
80
60
40
20
o o 300 600 100 1200
CHANGE IN STRAIN (MICROINCHES/INCH) 1500
Fig. 5.21 Strand strains for specimen 2-1.
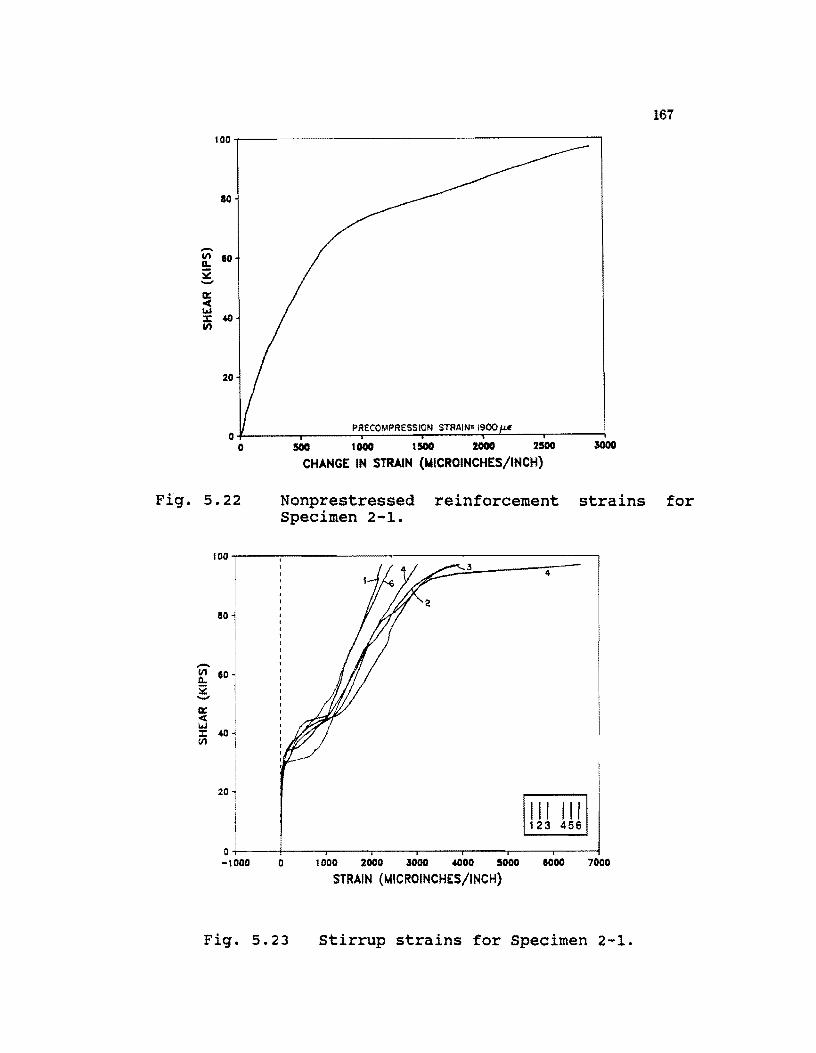
100~----------------------------------------'
ao
Ii) 80 D.. :;2 -
20
PRECOMPRESSION STRAIN'" 1900 fI-*
_ 1~ 1_ 2~ 2~ ~~
CHANGE IN STRAIN (NICROINCHES/INCH)
167
Fig. 5.22 Nonprestressed reinforcement strains for Specimen 2-1.
100~--~----------------------------------~ :3
4
80
-~ 60
S2 -
20
III III 123 456
O+---~----~----r----.----.---~'----.--~ -1000 o 1000 2000 3000 4000 5000 &000 7000
STRAIN (~ICROINCHES/INCH)
Fig. 5.23 Stirrup strains for Specimen 2-1.
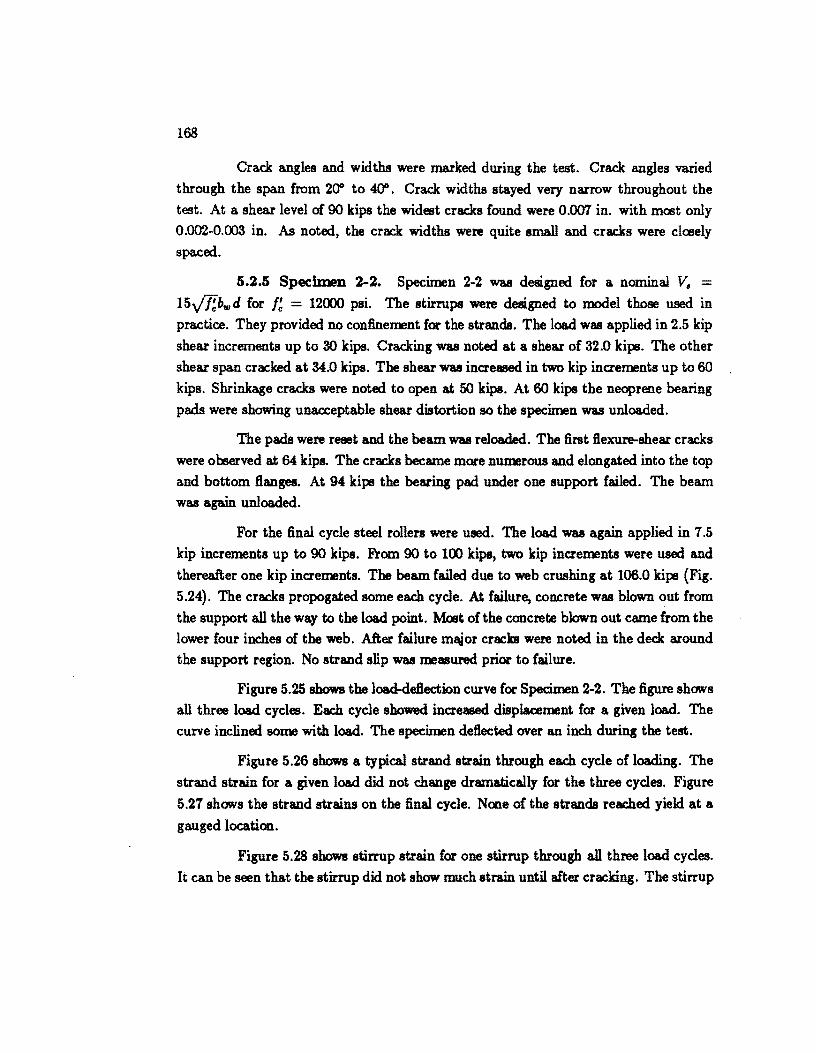
168
Crack angles and widths were marked during the test. Crack angles varied
through the span from 200 to 400. Crack widths stayed very narrow throughout the
test. At a shear level of 90 kips the widest cracks found were 0.007 in. with mcst only
0.002-0.003 in. As noted, the crack widths were quite small and cracks were clcsely
spaced.
5.2.5 Specimen 2-2. Specimen 2-2 was designed for a nominal V. ::::;
15...(/fbw d for f! ::::; 12000 psi. The stirrups were designed to model those used in
practice. They provided no confinelmnt for the strands. The load was applied in 2.5 kip
shear increments up to 30 kips. Cracking was noted at a shear of 32.0 kips. The other
shear span cracked at 34.0 kips. The shear was increased in two kip increlmnts up to 60
kips. Shrinkage cracks were noted to open at 50 kips. At 60 kips the neoprene bearing
pads were showing unacceptable shear distortion so the specimen was unloaded.
The pads were reset and the beam was reloaded. The first Bexure-shear cracks
were observed at 64 kips. The cracks became more nUlmrous and elongated into the top
and bottom Banges. At 94 kips the bearing pad under one support failed. The beam
was again unloaded.
For the final cycle steel rollers were used. The load was again applied in 7.5
kip increments up to 90 kips. From 90 to 100 kips, two kip increlmnts were used and
thereafter one kip increlmnts. The beam failed due to web crushing at 106.0 kips (Fig.
5.24). The cracks propogated some each cycle. At failure, concrete was blown out from
the support all the way to the load point. Moat of the concrete blown out came from the
lower four inches of the web. After failure meJor cracks were noted in the deck around
the support region. No strand slip was Imasured prior to failure.
Figure 5.25 shows the load-deBection curve for Specimen 2-2. The figure shows
all three load cycles. Each cycle showed increased displacement for a given load. The
curve inclined some with load. The specimen deBected over an inch during the test.
Figure 5.26 shows a typical strand strain through each cycle of loading. The
strand strain for a given load did not change dramatically for the three cycles. Figure
5.27 shows the strand strains on the final cycle. None of the strands reached yield at a
gauged location.
Figure 5.28 shows stirrup strain for one stirrup through all three load cycles.
It can be seen that the stirrup did not show much strain until after cracking. The stirrup
169
Fig. 5.24 Specimen 2-2 at failure.
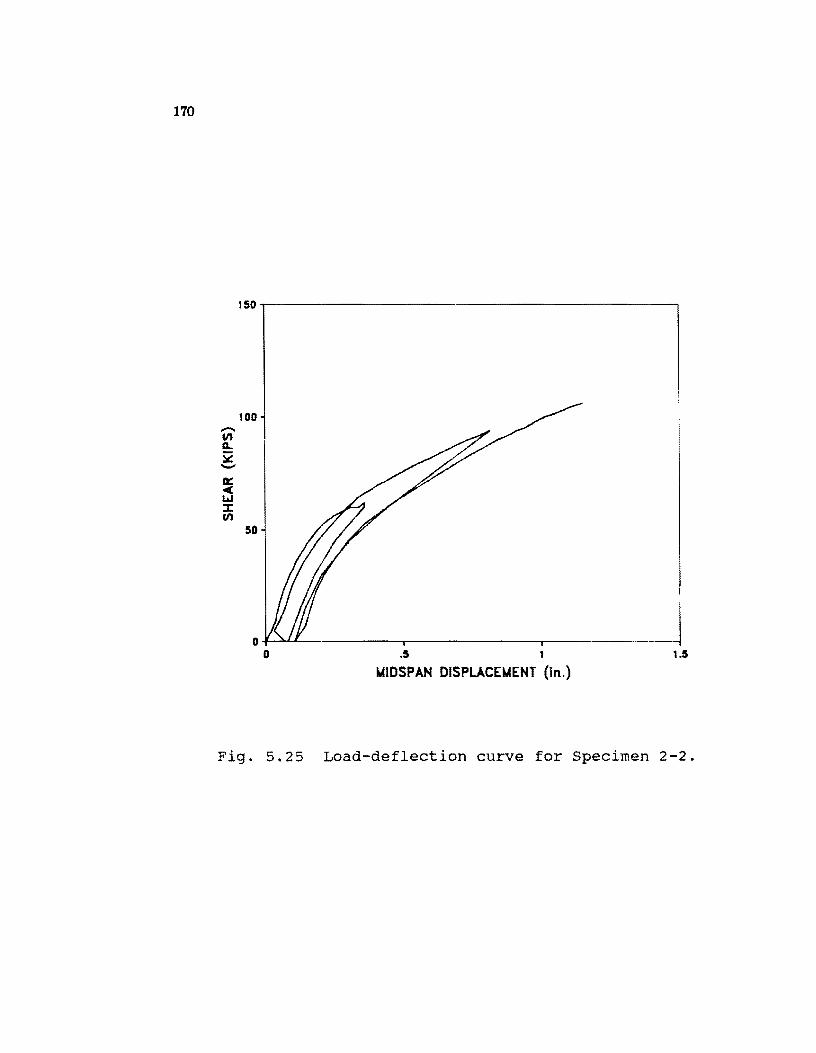
170
150T--------------------------------------------~
100 -VI CL. 52 -a::: oct Y.I J: VI
50
I
~~-,------J ~ 1 1.5
t.tIDSPAN DISPLACEt.tENT (In.)
Fig. 5.25 Load-deflection curve for Specimen 2-2.
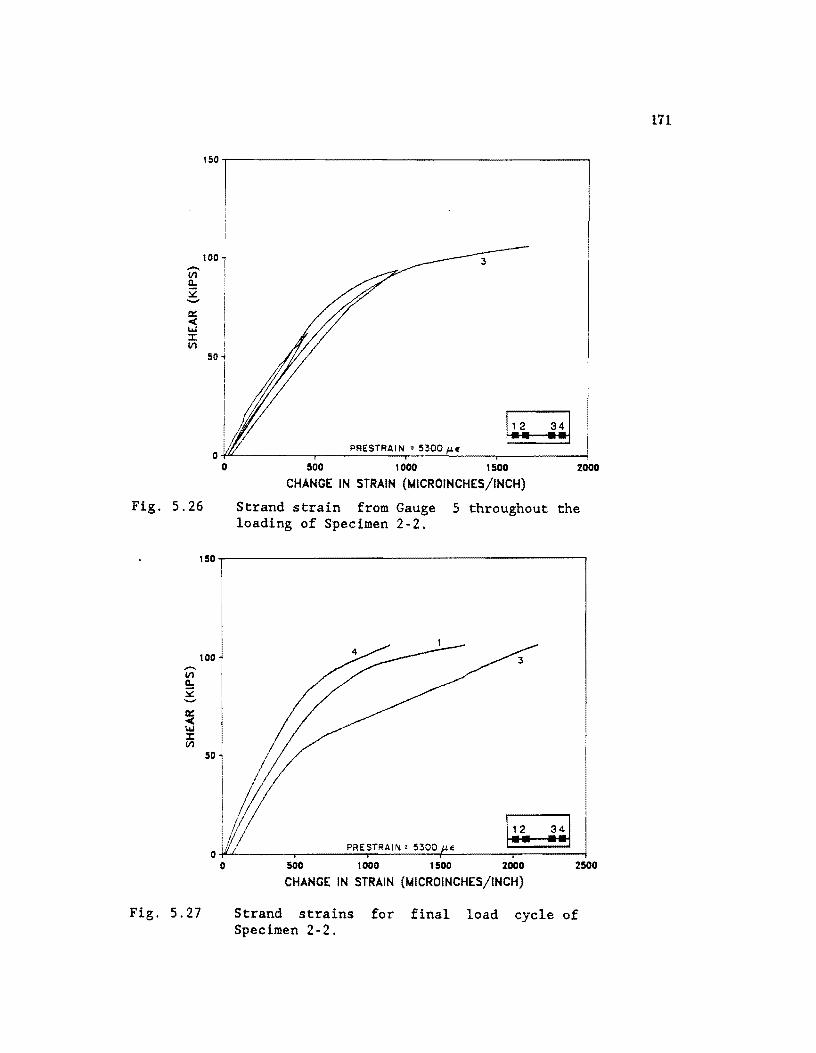
-III a.. ::.:: -a:: "" I.iJ ::r: III
Fig. 5.26
150~-------------------------------------------.
100
50
PFiESTFIAI N : 5300 fl.f! O~---------"----~~~~i·~~~----~--------~
o 500 1000 1500 2000
CHANGE IN STRAIN (MICROINCHES/INCH)
Strand strain from Gauge 5 throughout the loading of Specimen 2-2.
150~-------------------------------------------.
tOO -III a.. ~ -a::
"'" I.iJ ::r: III
50
o
Fig. 5.27
o PRESTRAIN: 5300 f!
500 1000 1 500 2000
CHANGE IN STRAIN (MICRO INCHES/INCH) 2500
Strand strains for final load cycle of Specimen 2-2.
171
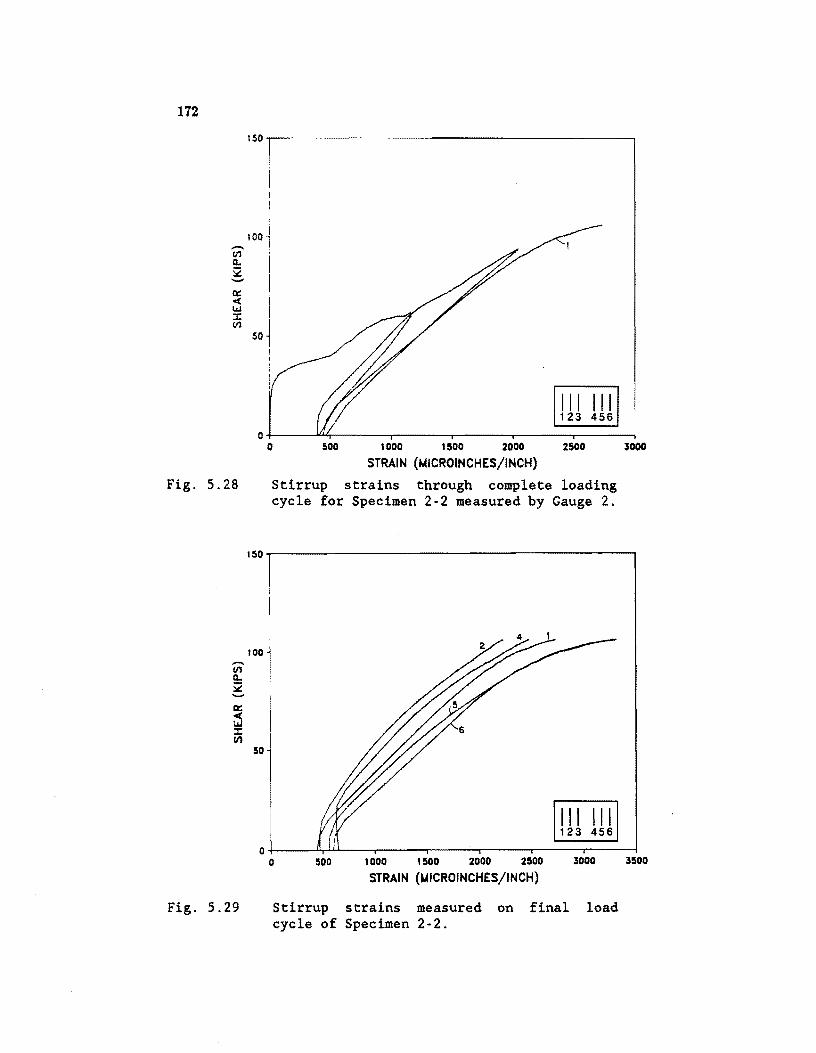
172
-(fj Q. 2 -0:: « UJ ::z: (fj
Fig. 5.28
Fig. 5.29
150~----------------------------------------~
100
50
III III 123 456
O+-----~------_r------~----~------~----~ o 500 1000 1500 2000 2500
STRAIN (MICROINCHES!INCH)
Stirrup strains through complete loading cycle for Specimen 2-2 measured by Gauge 2.
3000
150~------------------------------------------'
50
III III 123 456
o~--~~~--~--~----~~~~~ o 500 1000 1500 2000 2500 3000
STRAIN (MICROINCHES!INCH)
Stirrup strains measured on final load cycle of Specimen 2-2.
3500
173
held some strain between cycles of load. Figure 5.29 shows all the stirrups during the
last cycle. Some of the stirrups did reach yield.
Specimen 2-2 had a very large number of cracks. Crack widths in general were
0.004 in. or less out to failure. Crack angles were generally from 28° to 35°.
5.2.6 Specimen 2-3. Specimen 2-3 had a nominal V, = 15v'7ibllld for f~ = 12000 psi. Specimen 2-3 stirrups were designed to provide the prestressing strands
with added confinement. It was loaded in 2.5 kip increments to 30 kips. Cracking was
noted at 34.0 kips. The cracking was very limited. The other shear span cracked at 38.0
kips. The load was then increased in two kip shear increments to 100 kips and one kip
increments thereafter. The number and length of cracks increased with loading. Flexure
cracks were noted at 60.0 kips. Flexure-shear cracks were noted at 90.0 kips. The cracks
propagated as the load increased. Failure occurred at 104.0 kips. The mode of failure
was web crushing (Fig. 5.30). The web crushed throughout the shear span. There were
cracks in the deck at the support after failure. The crushed concrete extended about
five inches up the web. Prior to failure no strand slip was measured.
The load-deflection plot for Specimen 2-3 is shown in Figure 5.31. The curve
indicates that the member had substantial stiffness remaining up to final shear failure.
Final deflection was slightly less than one inch.
Strand strains are shown in Figure 5.32. The gauges were placed in two sym
metrical locations along the beam. The gauges farther into the shear span showed much
larger strains for a given load. Nooe of the gauges show enough strain to indicate yielding
of the strands.
Figure 5.33 shows the performance of the nonprestressed reinforcement. The
gauge was located at the same place as the outer strand gauges. The bar was not close
to yield at ultimate.
The stirrups did not pick up load until after shear cracking. Figure 5.34 shows
stirrup strains thoughout the loading. All but the first stirrups in from the support
showed yielding at failure.
Specimen 2-3 had a large number of very fine cracks. Crack widths near failure
were generally 0.004 in. or less. Individual crack angles varied from 25° to 45°. Crack
angles were generally about 28°.
5.2.'1 Specimen 3-1. Specimen 3-1 was one end of the first flexura.lspecimen
tested by Castrodale. The specimen had a nominal shear reinforcement of 8v'7iblll d.
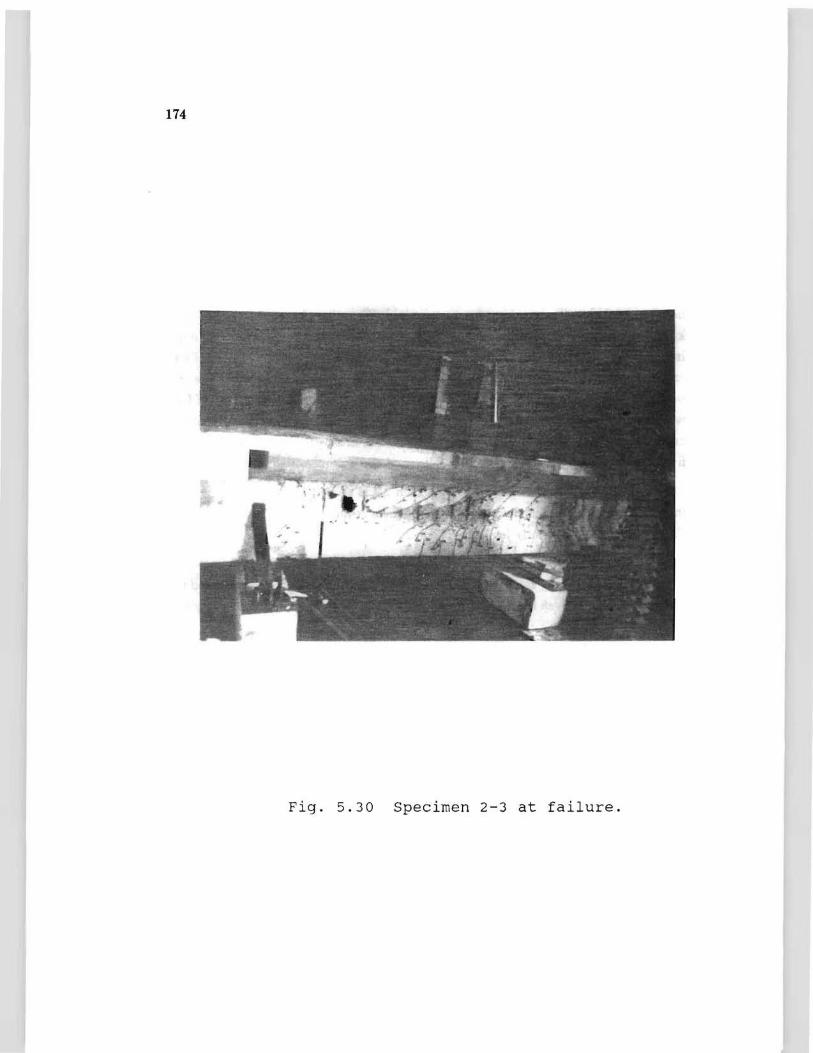
IU
Fig. 5.30 Specimen 2-3 at failure.
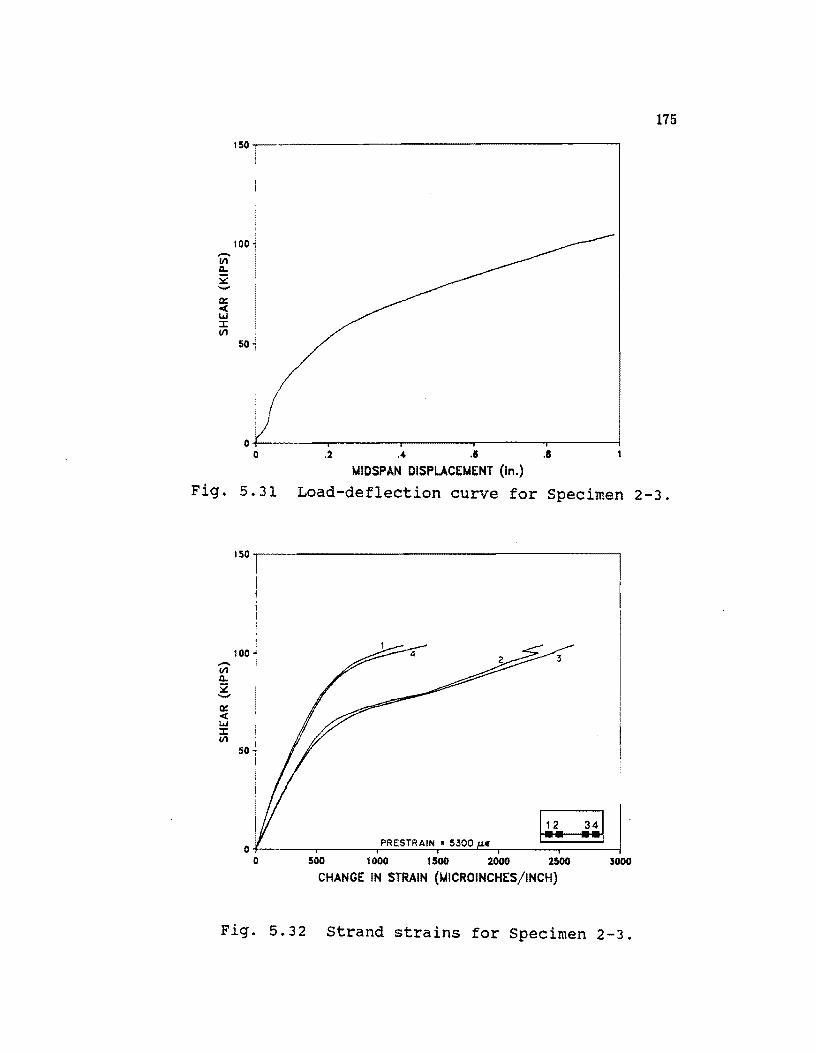
175
150~--------------------------------------~
100 -/I) !!:: ~ -D:: < LU ::I: /I)
50
~ A ~ ~
t.AIDSPAN DISPLACEMENT (in.)
Fig. 5.31 Load-deflection curve for Specimen 2-3.
-/I) Q.. 52 -D:: < LU ::I: /I)
100
50
PRESTRAIN : 5300 « O~----~------~~~~~~~.------.----~
o 500 tOOO 1500 2000 2500 3000
CHANGE IN STRAIN (t.AICROINCHESjINCH)
Fig. 5.32 Strand strains for Specimen 2-3.
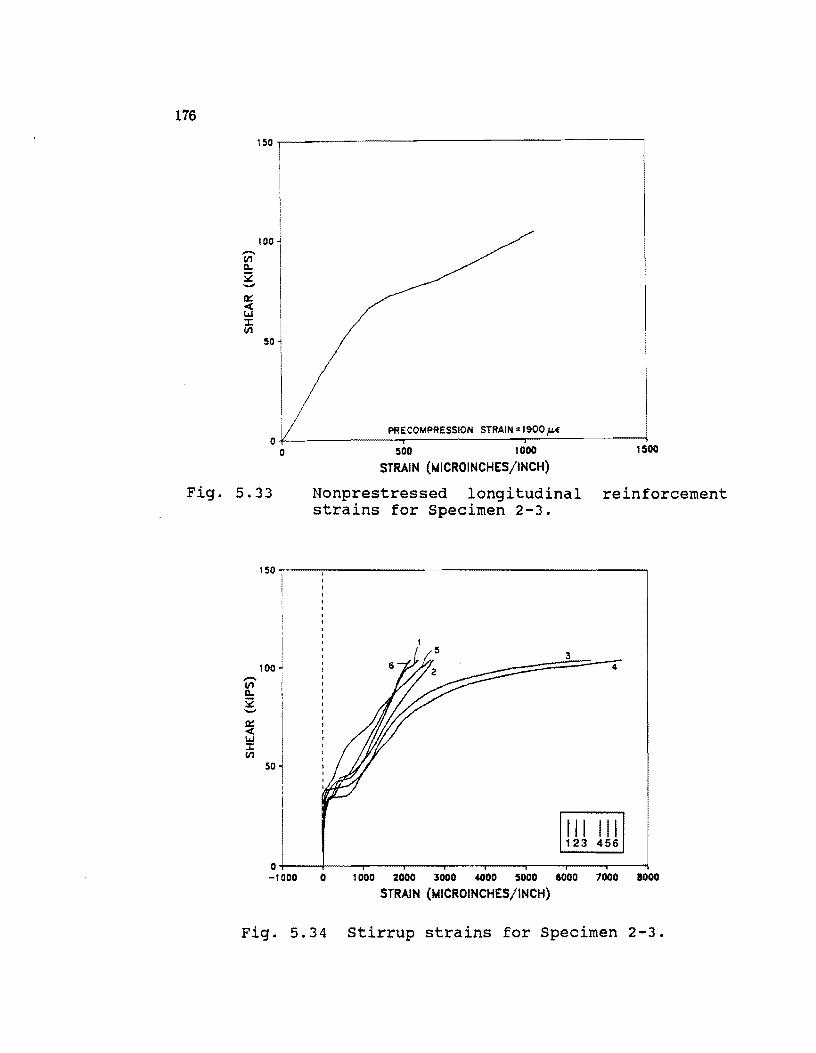
176
,.-.. III a.. ::.:: ...... It: -< LtJ ::t III
150~------------------------------------------'
100
50
PRE COMPRESSION STRAIN; 1900 !-LIE O+-------------~------------~~--------~
o 500 1000 1500
STRAIN (~ICROINCHES/INCH)
Fig. 5.33 Nonprestressed longitudinal reinforcement strains for Specimen 2-3.
,.-.. III a.. S2 ...... It: -< LtJ ::t III
150~--~----------------------------------~
:3 100 4
50
III III 123 456
O+---~--~----~---r--~~--'----r----~~ -1000 0 1000 2000 3000 4000 5000 8000 7000 1000
STRAIN (~ICROINCHES/INCH)
Fig. 5.34 Stirrup strains for Specimen 2-3.
177
Standwd type stirrup details were used. The support location was modelled after that
used in actual practice. Since the specimen had previously been tested in 8exure it had
suffered some damage. The malt observable damage consisted of transverse cracks that
extended through the deck and in some cases into the top 8ange. Additional damage due
to the violent 8exural failure was likely but not observed due to the prestress. Initially
several load cycles were applied and discootinued due to load system difficulties. The
loads exceeded those which were finally observed to cause cracking. In these preliminwy
cycles no crack observations were made. For these reasons the cracking load observed is
of little value.
For the actual test, two load cycles were run. The first cycle was intended to
determine the cracking load and the second to observe cracked behavior at low loads
and then to determine the ultimate load. The first cycle went up to a shear load of 34.8
kips. Cracking was noted at a shew of 19.5 kips. The cracks were all very fine. Given
the preceeding events described above it is likely that this was the reopening of existing
cracks. The cracks noted extended somewhat and a few new cracks were noted during
this cycle. The beam was then unloaded.
On the second cycle the specimen was loaded in five kip nominal shear in
crements. At 38.6 kips the test had to be suspended, the girder unloaded, and a new
pressure gauge installed. The girder was then reloaded without any reading being taken
until 40 kips. The first 8exural cracks were observed at 44.5 kips. At 49.4 kips additional
8exural cracks were observed. Shew cracks also entered into the bottom 8ange at this
load. Failure occurred at a shew of 63.2 kips (Fig. 5.35). The failure was induced by
slip of the prestressing strands (Fig. 5.36). The failure was not catastrophic since the
applied load dropped rapidly with added displacement. The member still held load even
after slip. Very large cracks formed right at the end of the detail steel when debonding occurred.
The load-de8ection behavior of Specimen 3--1 through the last two load cycles is shown in Figure 5.37. The behavior is very consistent between the two cycles. This is
pwtly due to the lack of 8exural cracking.
Strand behaviOl' can be seen in Figure 5.38. It will be noted that strand
behavior is basically identical in both cycles. The beam was quite elastic. The gauges
which were separated by 21 3/8 inches show a marked difference in behavior. Gauge 2
exhibits much mOl'e strain than gauge 1 at all load stages. Neither gauge was clale to
yielding of the strand.
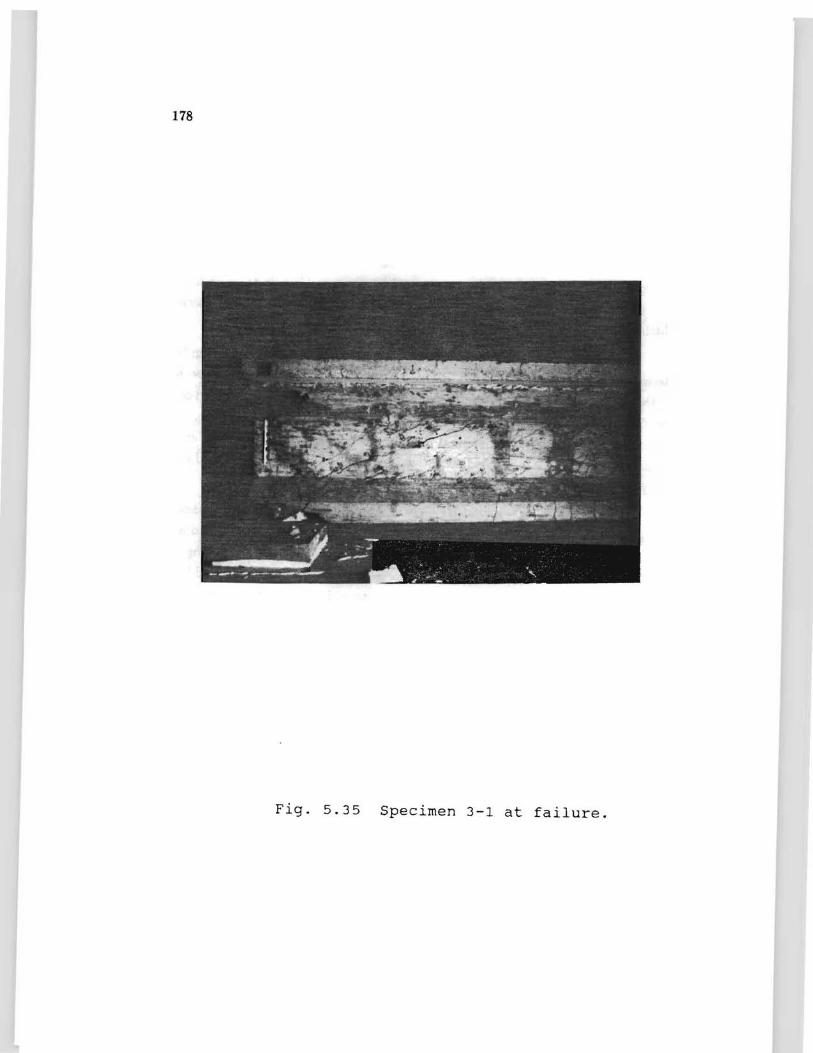
178
Fig. 5.35 Specimen 3-1 at failure.
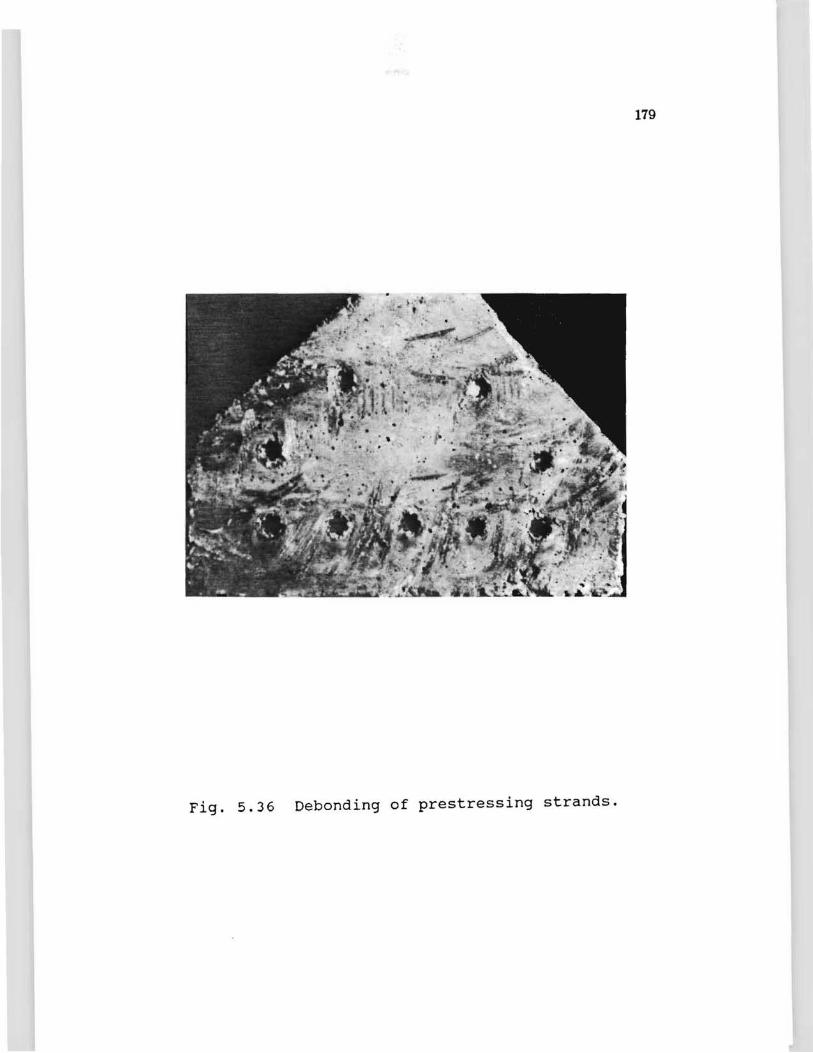
179
Fig. 5.36 Debonding of prestressing strands.
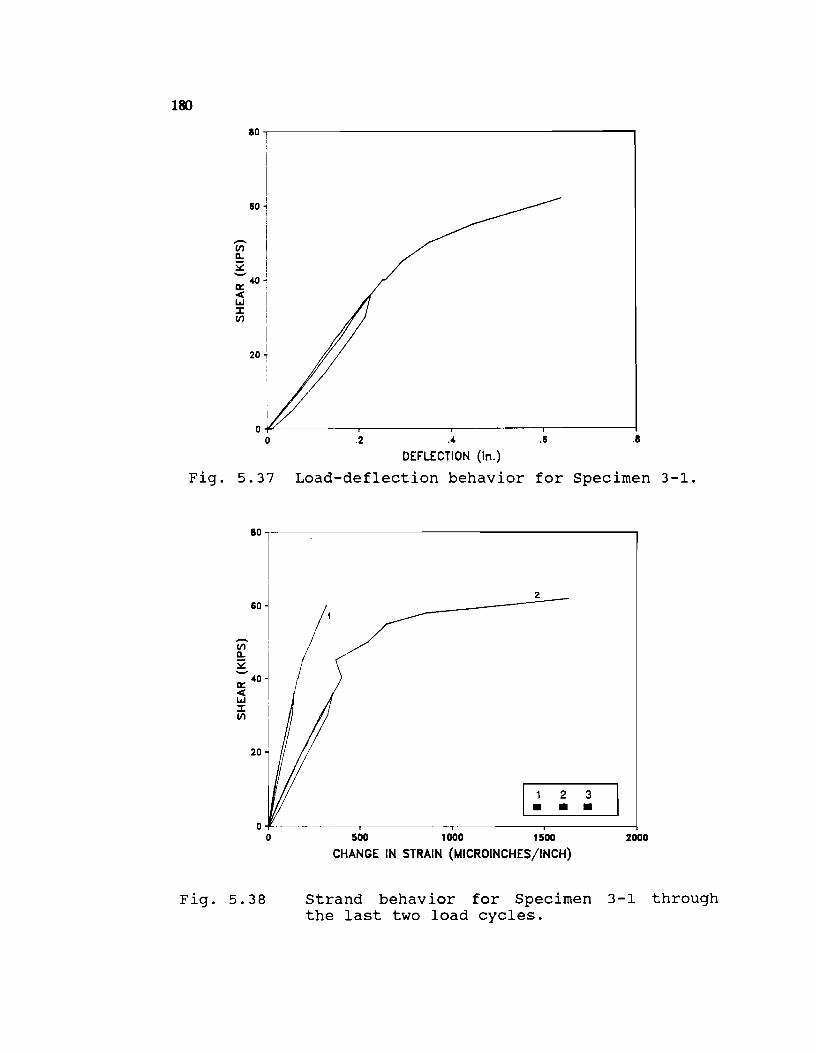
ISO
10~----------------------------------------~
60
20
.2 .4
DEFLECTION (In.)
.6 .1
Fig. 5.37 Load-deflection behavior for Specimen 3-1.
10,--------------------------------------------~
60
20
Fig. 5.38
2
I~ 2 3 • •
500 1000 1500 2000
CHANGE IN STRAIN (MICROINCHES/INCH)
Strand behavior for Specimen 3-1 through the last two load cycles.
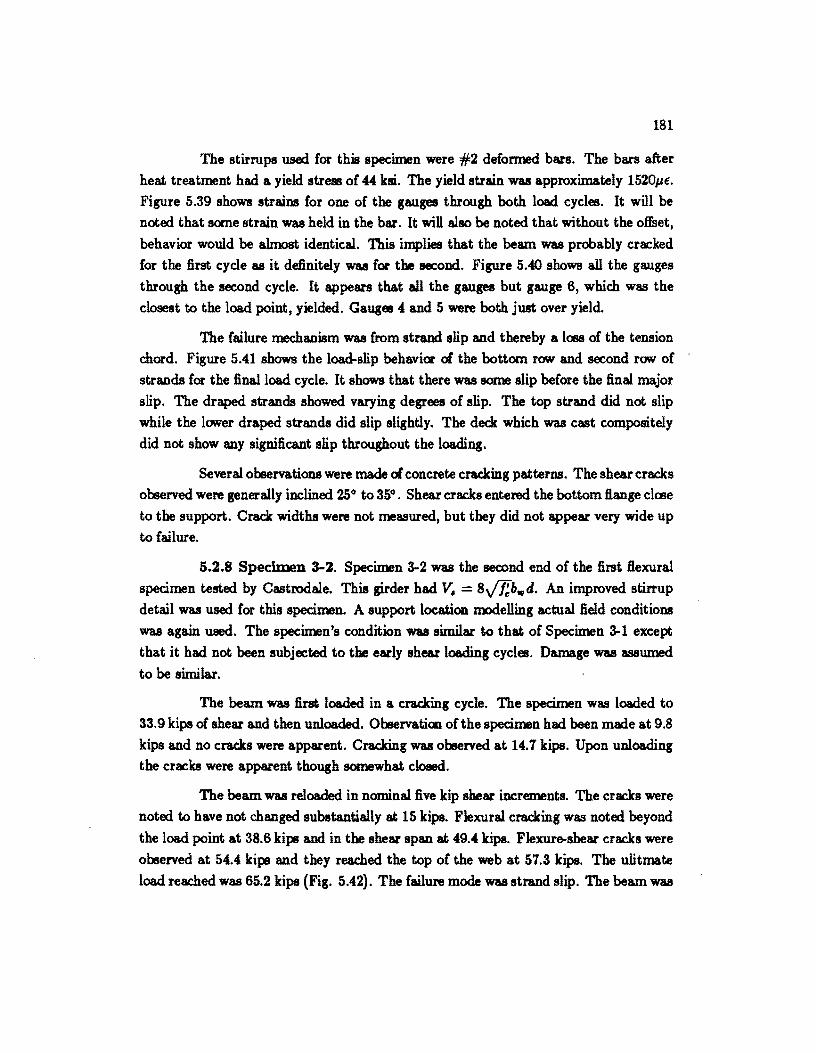
181
The stirrups used for this specimen were #2 deformed bars. The bal's after
heat treatment had a yield stress of 44 ksi. The yield strain was approximately 1520pt:.
Figure 5.39 shows strains for one of the gauges through both load cycles. It will be
noted that some strain was held in the bal'. It will also be noted that without the offset,
behavior would be almost identical. This implies that the beam was probably cracked
for the first cycle as it definitely was for the second. Figure 5.40 shows all the gauges
through the second cycle. It appears that all the gauges but gauge 6, which was the
closest to the load point, yielded. Gauges 4 and 5 were both just over yield.
The failure mechanism was from strand slip and thereby a 1068 of the tension
chord. Figure 5.41 shows the load-slip behavicr cl. the bottom raw and second row of
strands for the final load cycle. It shows that there was some slip before the final major
slip. The draped strands showed varying degrees of slip. The top strand did not slip
while the lower draped strands did slip slightly. The deck which was cast compositely
did not show any significant slip throughout the loading.
Several observations were made cl. concrete cracking patterns. The shear cracks
observed were generally inclined 25° to 35°. Shear cracks entered the bottom Bange claJe to the support. Crack widths were not measured, but they did not appeal' very wide up
to failure.
5.2.8 Specb:rJen 3-2. Specimen 3-2 was the second end of the first Bexural
specimen tested by Castrodale. This girder had V. = 8v'lfb.,d. An improved stirrup
detail was used for this specimen. A support location modelling actual field conditions
was again used. The specimen's condition was similal' to that of Specimen 3-1 except
that it had not been subjected to the early shear loading cycles. Damage was assumed to be similar.
The beam was first loaded in a cracking cycle. The specimen was loaded to
33.9 kips of shear and then unloaded. Observatioo of the specimen had been made at 9.8
kips and no cracks were apparent. Cracking was observed at 14.7 kips. Upon unloading
the cracks were apparent though somewhat closed.
The beam was reloaded in nominal five kip shear increments. The cracks were
noted to have not changed substantially at 15 kips. Flexural cracking was noted beyond
the load point at 38.6 kips and in the shear span at 49.4 kips. Flexur~shear cracks were
observed at 54.4 kips and they reached the top of the web at 57.3 kips. The ulitmate
load reached was 65.2 kips (Fig. 5.42). The failure mode was strand slip. The beam was
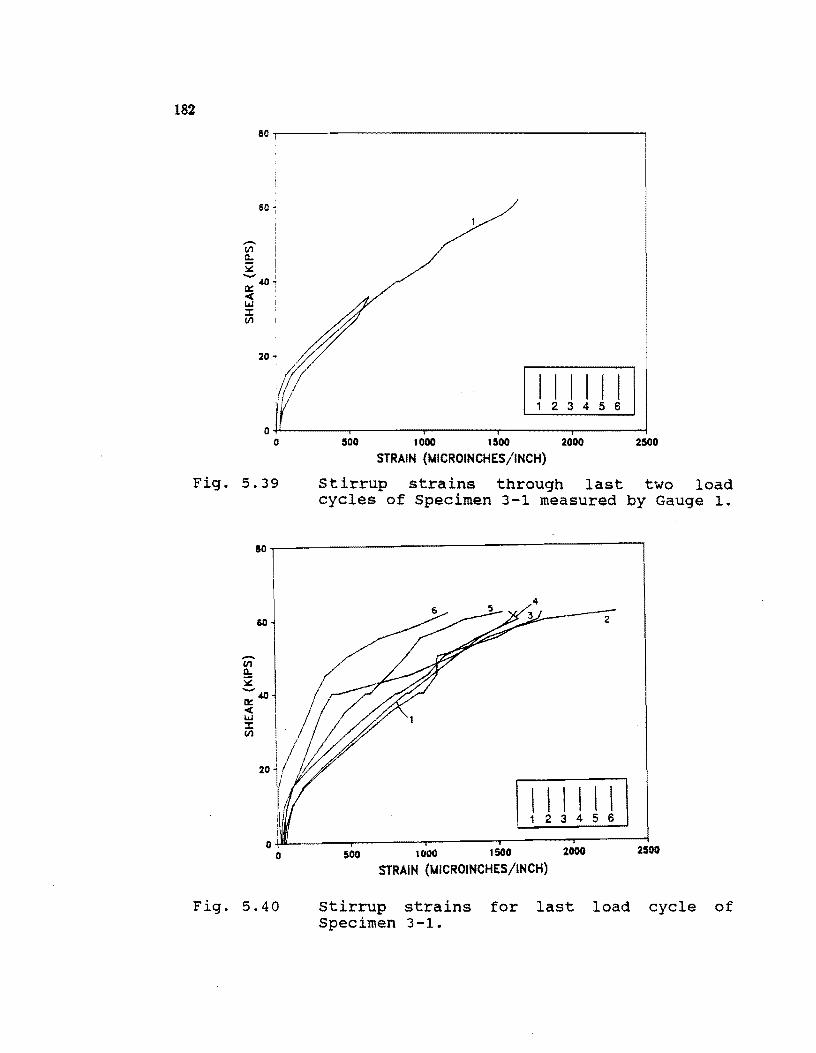
182
80,,-------------------------------------------.
20 .;
'f/; I I I I I I " 123 4 5 6
O~------_r------~--------r_------~------~ o 500 1000 1500 2000 2500
STRAIN (UICROINCHES/INCH)
Fig. 5.39 stirrup strains through last two load cycles of Specimen 3-1 measured by Gauge 1.
ao~----------------------------------------~
60
-1/1 Il.. ~ :;~ .:( L.J ~ 1/1
20
I I I I I I 1 2 3 4 5 6
0~------~------~--------r-------~------::2500 o 500 1000 1 SOO 2000
STRAIN (UICROINCHES/INCH)
Fig. 5.40 stirrup strains for last load cycle of Specimen 3-1.
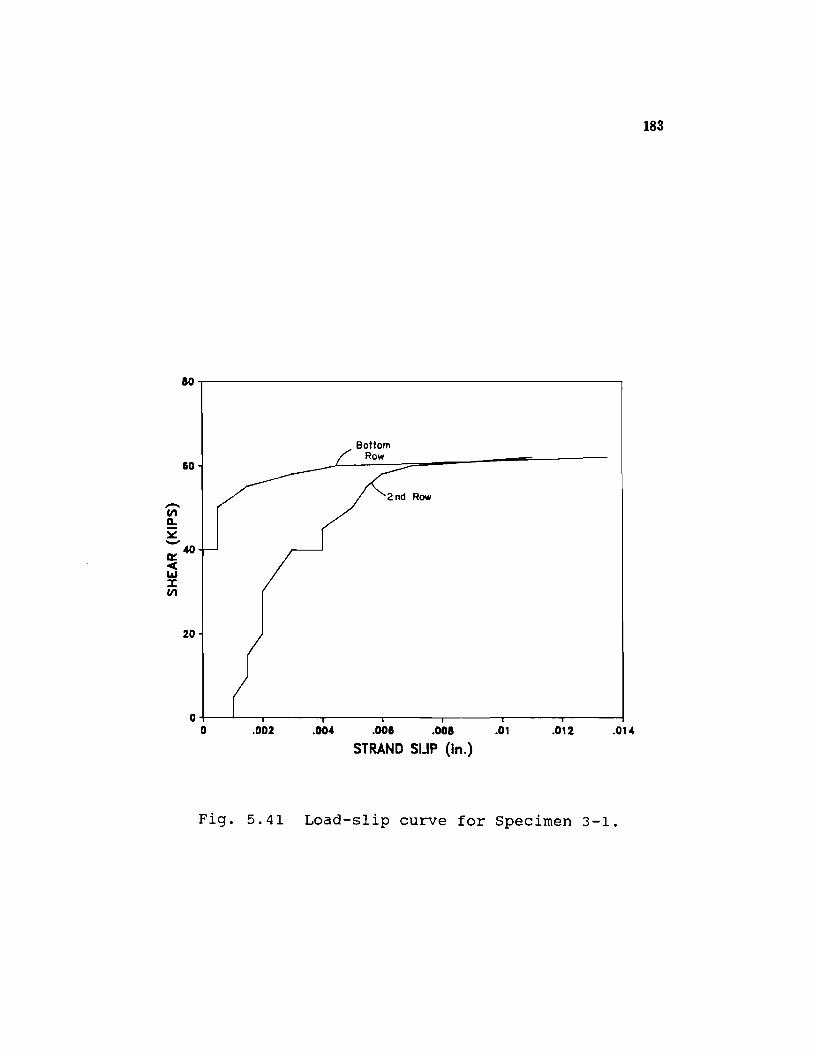
183
ao~------------------------------------------------,
60
20
o~~--L-__ ------~------~----~--____ ~ ____ -, ______ ~ o .002 .004 .0011 .ooa .01 .012 .014
STRAND SUP (In.)
Fig. 5.41 Load-slip curve for Specimen 3-1.
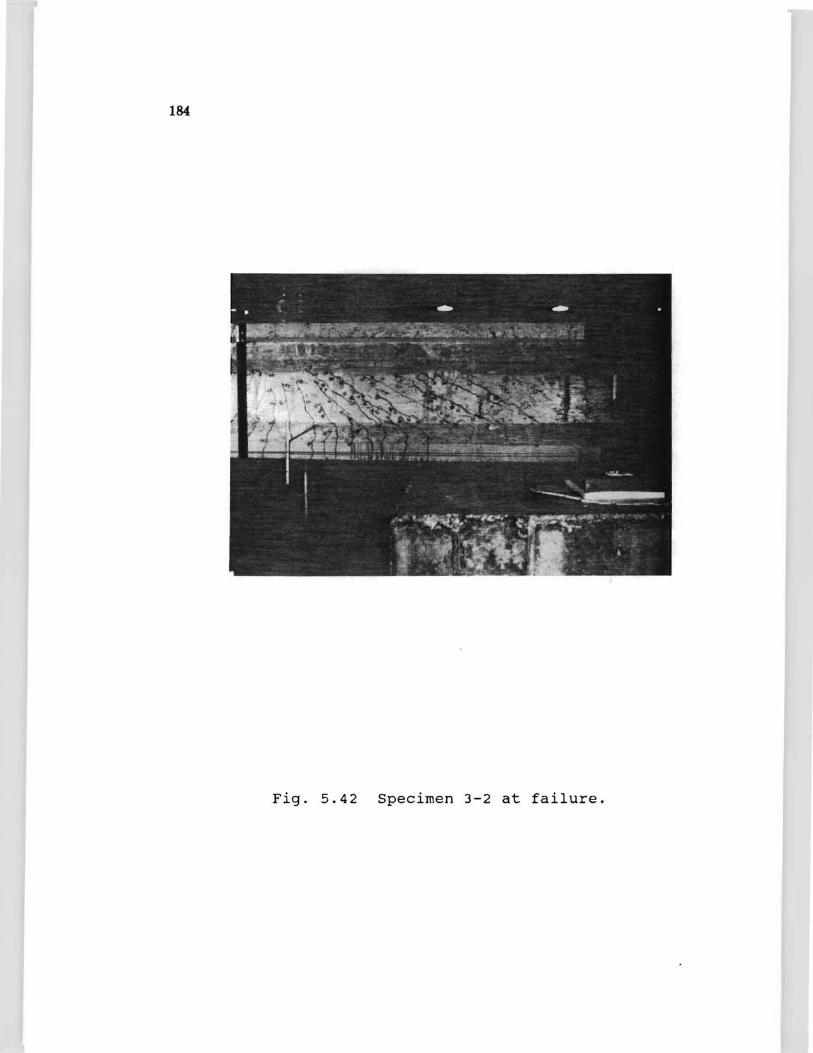
1~
Fig. 5.42 Specimen 3-2 at failure.
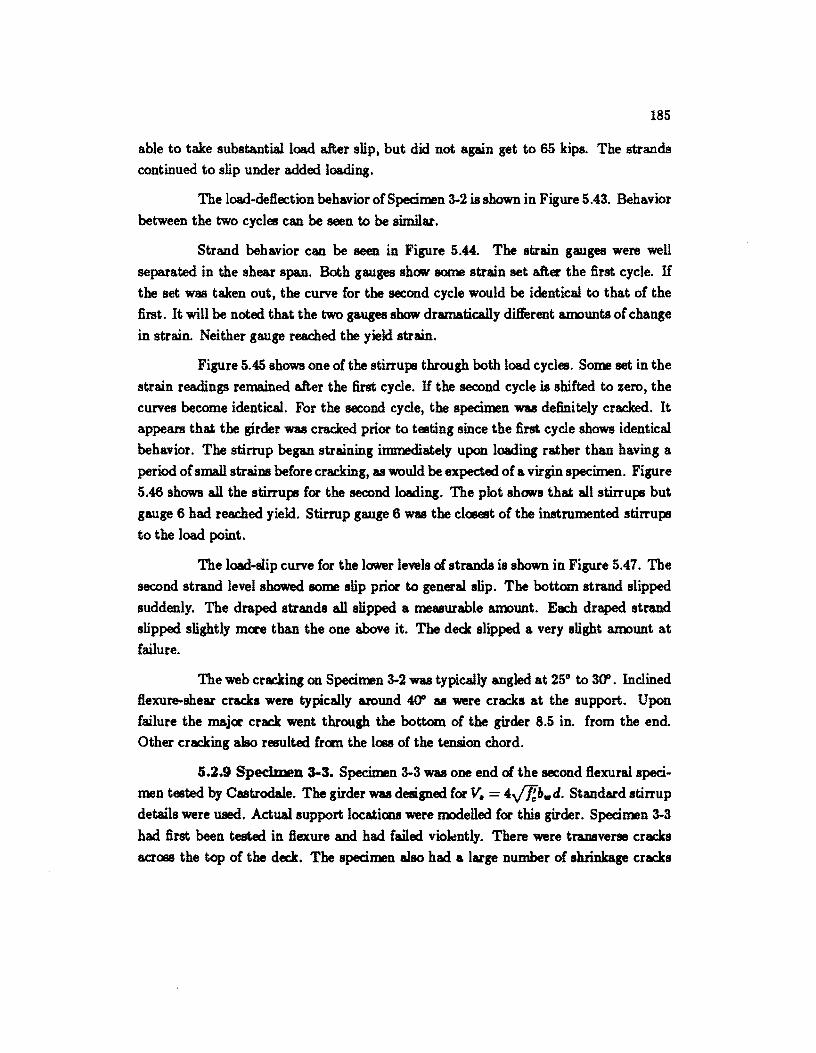
185
able to take substantial load after slip, but did not again get to 65 kips. The strands
continued to slip under added loading.
The load-deftection behavior of Specimen 3-2 is shown in Figure 5.43. Behavior
between the two cycles can be seen to be similar.
Strand behavior can be seen in Figure 5.44. The strain gauges were well
separated in the shear span. Both gauges shaw some strain set after the first cycle. IT
the set was taken out, the curve for the second cycle would be identical to that of the
first. It will be noted that the two gauges show dramatically different amounts of change
in strain. Neither gauge reached the yield strain.
Figure 5.45 shows one of the stirrups through both load cycles. Some set in the
strain readings remained after the first cycle. IT the second cycle is shifted to zero, the
curves become identical. For the second cycle, the specimen was definitely cracked. It
appears that the girder was cracked prior to testing since the first cycle shows identical
behavior. The stirrup began straining immediately upon loading rather than having a
period of smaJlstrains before cracking, as would be expected of a virgin specimen. Figure
5.46 shows all the stirrups for the second loading. The plot shaws that all stirrups but
gauge 6 had reached yield. Stirrup gauge 6 was the closest of the instrumented stirrups
to the load point.
The load-slip curve for the lower levels of strands is shown in Figure 5.47. The
second strand level showed some slip prior to general slip. The bottom strand slipped
suddenly. The draped strands all slipped a measurable amount. Each draped strand
slipped slightly more than the one above it. The deck slipped a very slight amount at
failure.
The web cracking on Specimen 3-2 was typically angled at 25° to 300. Inclined ftexure-shear crack. were typically around 400 as were crack. at the support. Upon
failure the major crack went through the bottom of the girder 8.5 in. from the end.
Other cracking also resulted frc:m the loss of the tension chord.
5.2.9 SpeclmeD 3-3. Specimen 3-3 was one end of the second ftexuralspeci
men tested by Castrodale. The girder was designed for V. = 4V1!b.d. Standard .tirrup
details were used. Actual support locations were modelled for this girder. Specimen 3-3
had first been tested in ftexure and had failed viowntly. There were transverse cracks
across the top of the deck. The specimen also had a large number of shrinkage cracks
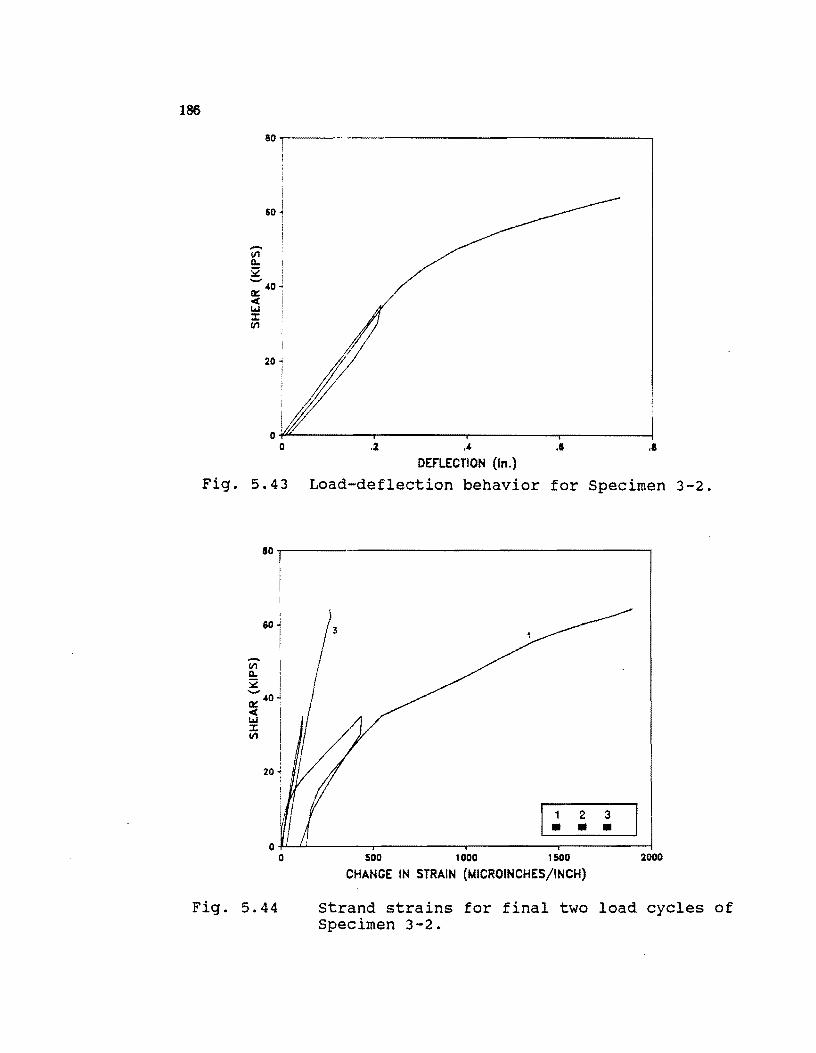
186
80r-----·----------------------------------~
60
20
O+'~------~----------r_--------~------~ a .2 ·4
DEFLECTION (In.) •• ••
Fig. 5.43 Load-deflection behavior for Specimen 3-2.
ISO I I I
I !
60
-11'1 a.. ~ -a:: 40 <C WJ J: 11'1
20
3
I~ 2 3 • •
500 1000 1500 2000
CHANGE IN STRAIN (t.tICROINCHES/INCH)
Fig. 5.44 Strand strains for final two load cycles of Specimen 3-2.
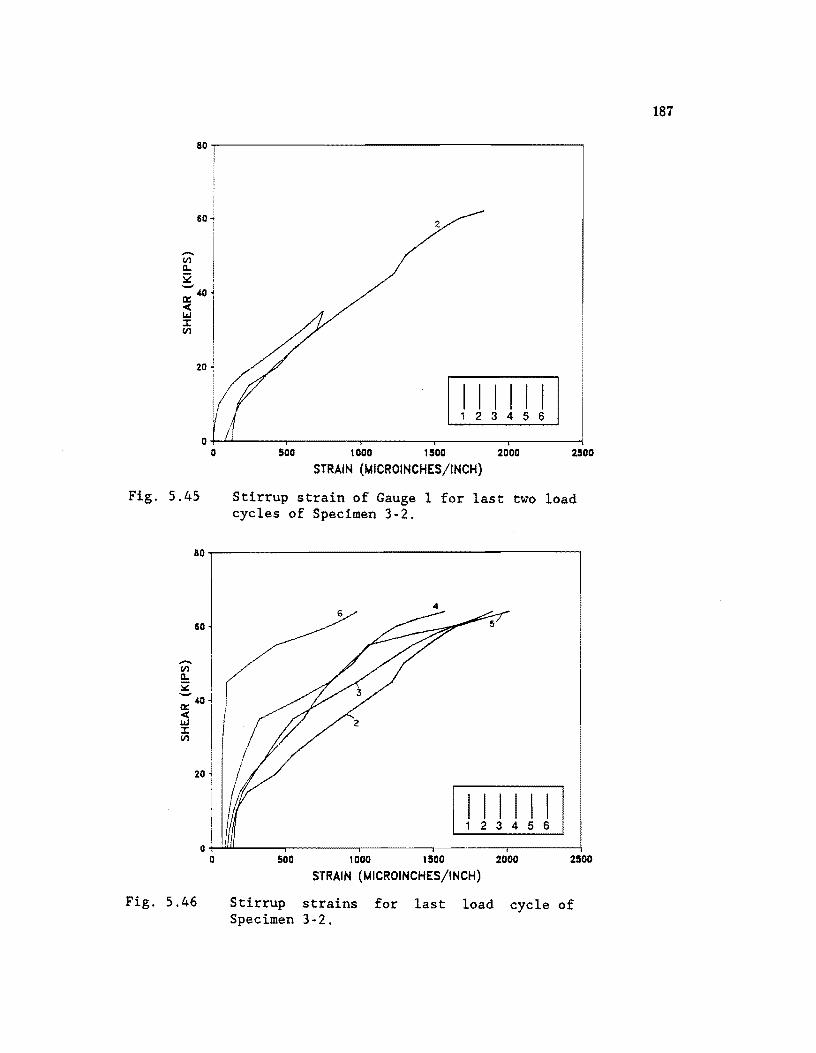
80~------------------------------------------,
60
Fig. 5.45
2
I I I I I I 1 2 345 6
500 1000 1500 2000 2500
STRAIN (MICROINCHES/INCH)
Stirrup strain of Gauge 1 for last two load cycles of Specimen 3-2.
80~------------------------------------------,
50
I I
20 ~
4
I I I I I I 1 2 3 4 5 6
o ~.iW...------r--------'----------'--'--"--r-----I o
Fig. 5.46
500 1 000 1 500 2000 2500
STRAIN (MICROINCHES/INCH)
Stirrup strains for last load cycle of Specimen 3-2.
187
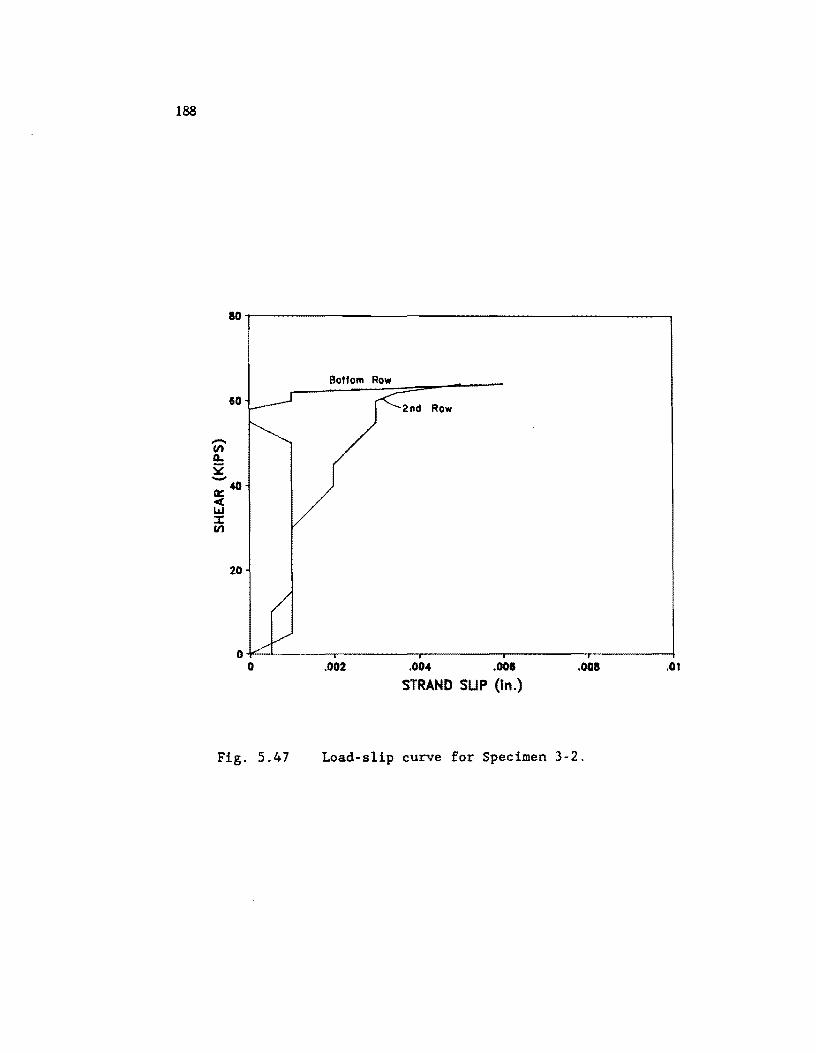
188
ao~----------------------------------------------~
Bottom Row
60
20
.002 .004 .00' .ooa .01
STRAND SUP (tn.)
Fig. 5.47 Load-slip curve for Specimen 3-2.
189
throughout the section. The prestress effectively claJed cracks in the web and it is
believed prevented detection of existing cracks prior to the test.
The specimen was loaded in one cycle to failure. The specimen was loaded in
four kip shear increments to 20 kips then two kip increments to 34 kips and one kip after
that to failure. Cracks were observed near the end of the beam at eight kips. AB the
load increased the cracks were noted to increase in number and width. Flexure cracks
were noted at 38.0 kips. Failure occurred at 41.0 kips (Fig. 5.48). The failure mode
was strand slip. Prior to failure shear cracks had extended deep into the bottom Bange.
Shrinkage cracks close to the support were noted to not be open.
Figure 5.49 shows the load-deftection behavior of the specimens. It can be seen
that the specimen had lost little stiffness up to failure. This was mainly due to the small
am:mnt of Bexural cracking that occurred.
Strand behavior was measured at a number of locations along the shear span.
Figure 5.50 shows gauge readings versus load through the cycle. The gauges were placed
80 that two gauges were relatively close to each other. The two "pair" gauges gave very
similar results. The three distinctly different locations gave quite different load versus
strain curves. The further away from the support that the gauge was, the greater the
strain. Gauge 7 was located on the draped strand at roughly the same location as gauge
4. The gauge saw some compression early and did not go into appreciable tension until
the load was about 3/4 of ultimate. Figure 5.51 shaws the strains through the shear
span at various load stages. None of the gauges indicated that the strand yielded prior
to failure.
Stirrup gauge readings are illustrated in Figure 5.52. The gauges began to
strain as soon as load was applied. This indicates that the beam was likely precracked
before the shear test began. Only two of the gauges reached yield prior to the strand
slip. Figure 5.53 shows the strand strains along the shear span at various loads. It shaws
that the stirrups near the center of the shear span yielded while the stirrups near the
load point and support did not.
The failure mode was strand slip. The load-slip curve for the bottom and second raws are shown in Figure 5.54. It can be seen that the second raw strand began
to slip early in the loading and continued to do so by small increments until a final large
slip. The bottom raw stayed steady until 38.0 kips. It then slipped slightly for several
load stages followed by a large and then catastrophic slip. The draped strand did not
slip throughout the test. The deck did slip 0.000 in. during the test.
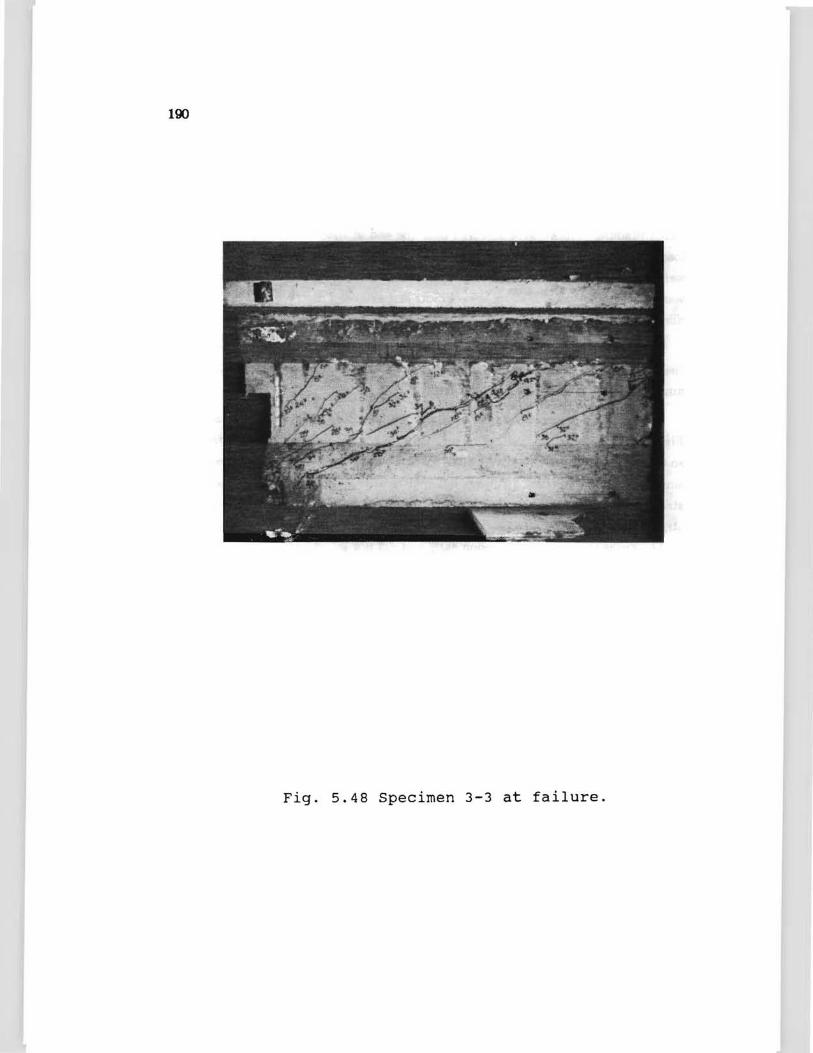
100
Fig. 5.48 Specimen 3-3 at failure.
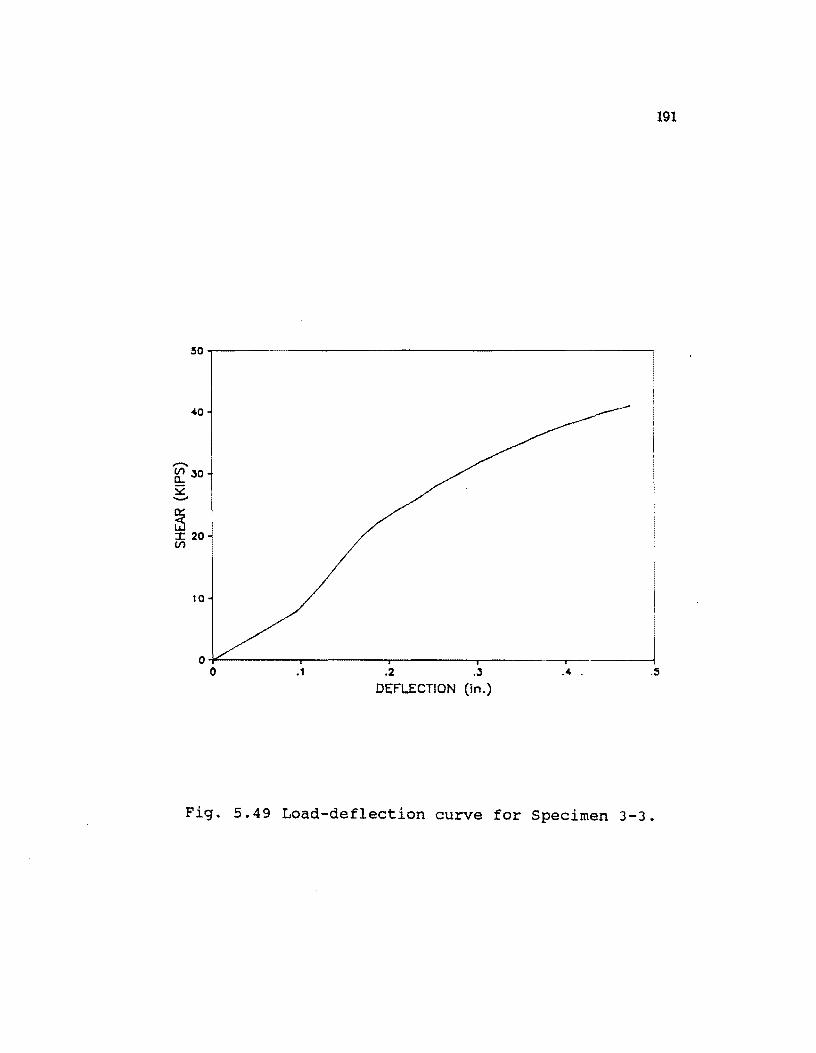
50~------------------------------------------------~
.,......, (/) 30 0... s:2 .........
~ :t: 20 (I)
10
191
.1 . 2 .3 ..... .5
DEFLECTION (in.)
Fig. 5.49 Load-deflection curve for Specimen 3-3.
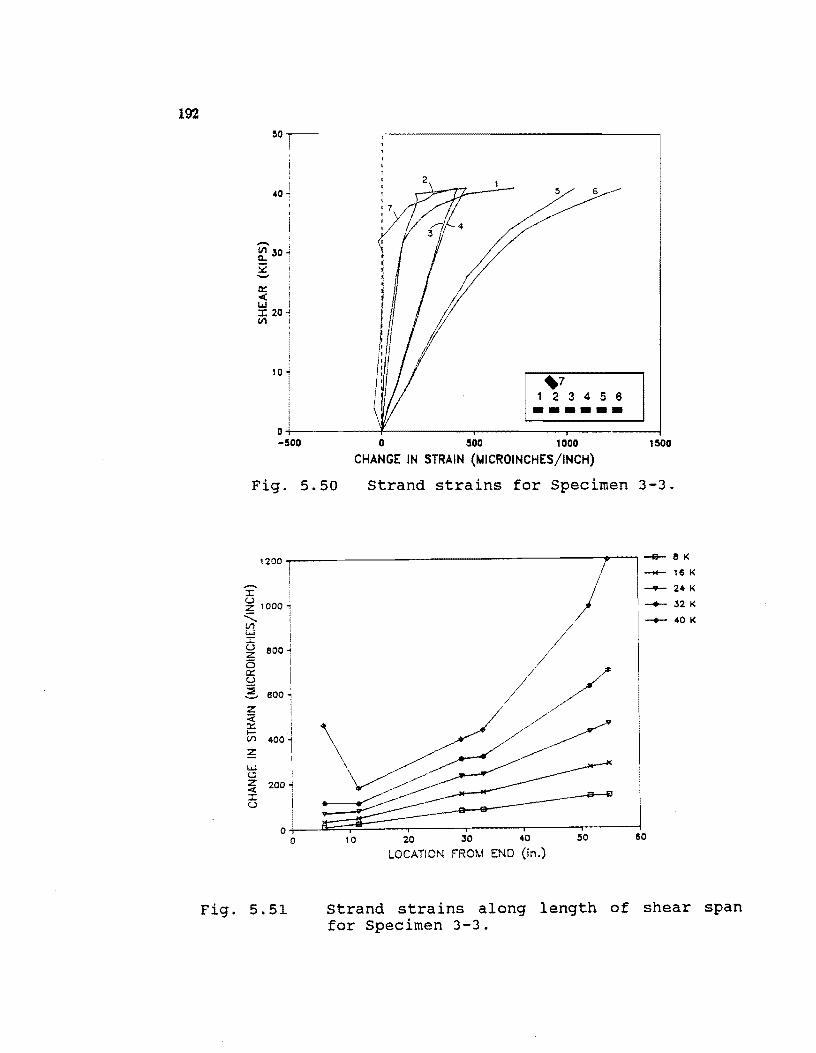
192 :\0 1
10., , !
I I
6
~7 1 234 5 6 ------
O~----_;~----~------~------~ -500 o 500 1000 1500
CHANGE IN STRAIN (hAICROINCHES/INCH)
Fig. 5.50 Strand strains for Specimen 3-3.
, I 1 u ' Z 10001
~ I ~ I ~ 800 J
6 tl:: U
2. 800
Z « i ~ i .... 400 l ~ I
t5 I ~ 200.,
o i oi
o
Fig. 5.51
10 20 30 40 50 60
LOCATION FROM END (in.)
Strand strains along length of shear span for Specimen 3-3.
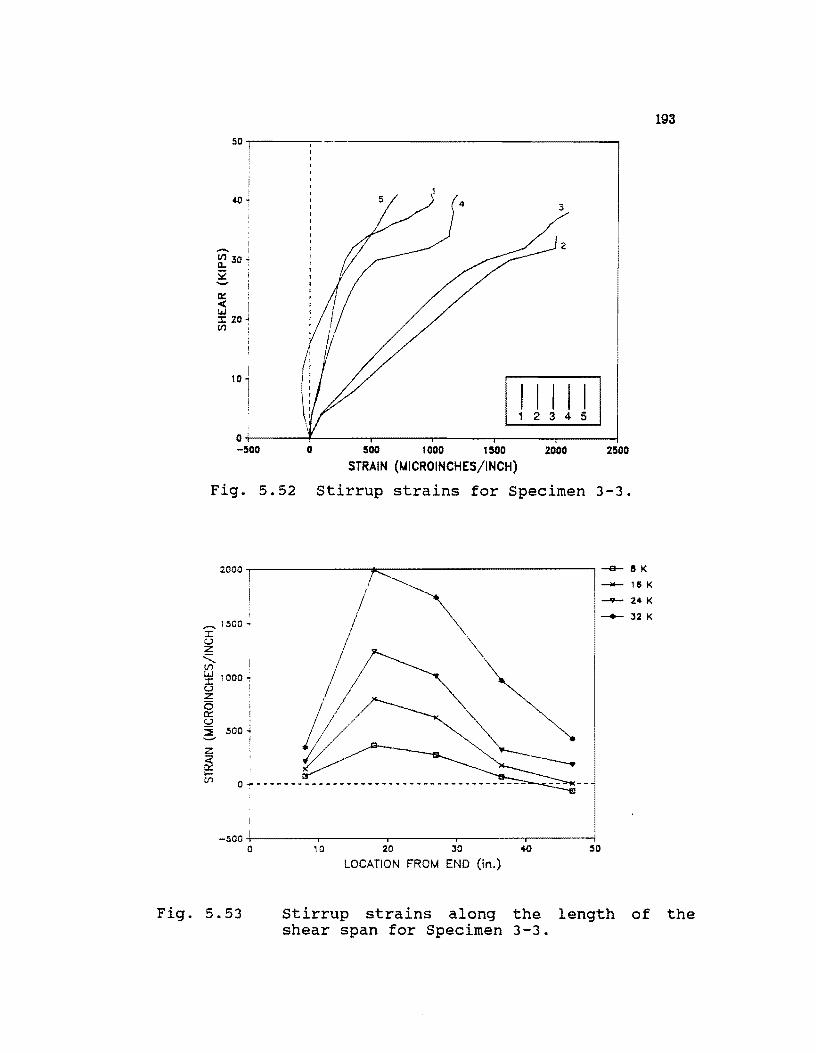
Fig.
'in 30.; 0-s;: . -a::: -< i I.J I ::I: 20.J ~ :
10
:3
2
I I I I I 234 5
O+-----~L-----_.------~----~._----~----~ -500 o 500 1000 1500 2000 2500
STRAIN (t.AICROINCHES/INCH)
Fig. 5.52 Stirrup strains for Specimen 3-3.
2000 -e- e K
i ....... 1500 ~ I U Z
'-(/) ~ 1000, U z 15 a::: u 2. 500 i z
~
-500 0
5.53
/
10 20 30
LOCATION FROM END (in.)
Stirrup strains along shear span for Specimen
40
the 3-3.
50
-- 16K __ 24K
__ 32 K
length of
193
the
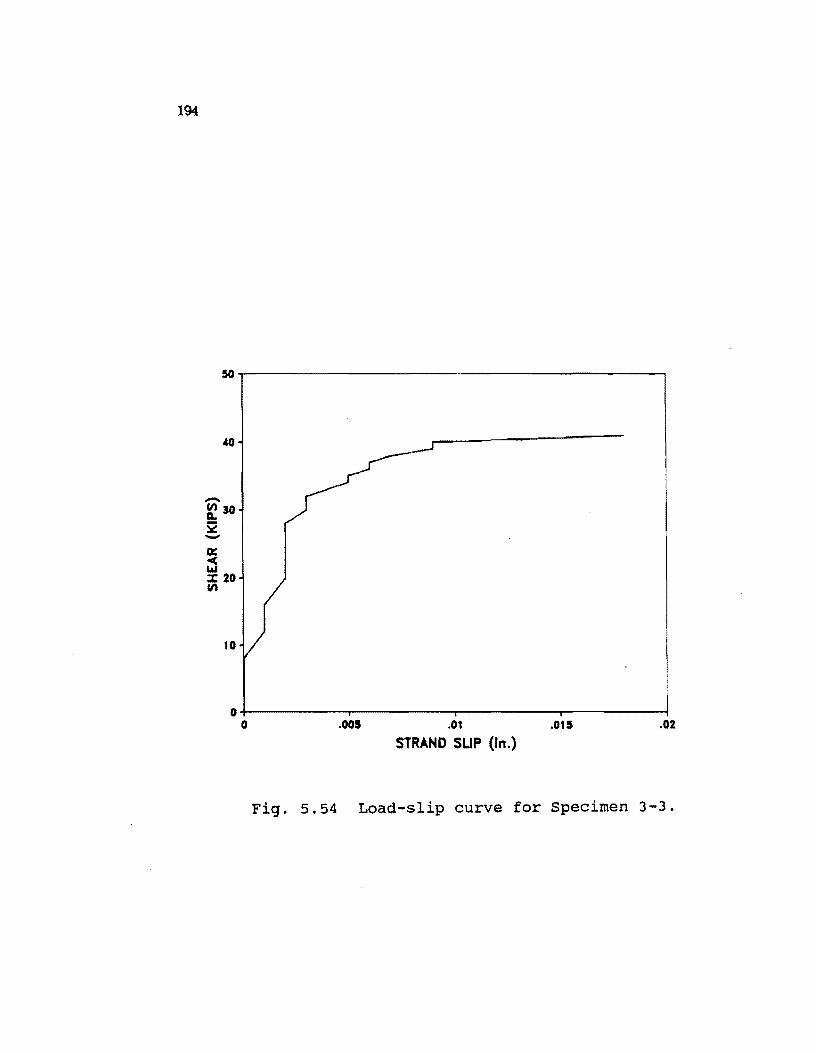
194
50~-------------------------------------------~
-II) 30 CL :'II:: -a:: 4: Lr.I :t 20 II)
10
O+----------.r----------.----------~--------~ o .005 .01 .015 .02
STRAND SUP {In.}
Fig. 5.54 Load-slip curve for Specimen 3-3.
195
Readings were taken of both crack angle and crack width. Crack angles in the
middle of the shear span ranged from about 2a' to 350• Crack angles near the support
and load point ranged from 400 to 550• Crack readings were taken in the final five load
stages. Crack widths on measured cracks ranged from 0.010 to 0.050 inmes. These
cracks were read since they were the widest ones. Other cracks had lesser widths.
5.2.10 Specimen 3-4. Speci..r:tEn 3-t was an end of the second Oexural test
perfomed by Castrodale. The girder was designed for a nominal V" = 4J7Ib. d. Stan
dard stirrup details were used. For this speci..r:tEn an overhang to allow for more de
velopment was included. The support centerline was 8.5 in. from the specimen end.
Specimen 3-t is the second end of the girder from whim Specimen 3-3 was taken. The
observations about damage to 3-3 &re also true for this specimen.
Specimen 3-4 was loaded in four kip shear increments to 20 kips, two kip
increments to 36 kips, and one kip increments there- after. Cracks were observed at
8.0 kips. AB the load was increased, cracks were marked and measured at load stages.
At 34.0 kips some of the shrinkage cracks began to open as OexuraJ cracks. Flexural
cracks were observed at 40.0 kips. At 47.9 kips web crushing was observed in a localized
&rea at the top of the web. The crushing was a slow spalling rather than the explosive
failure expected with high strength concrete. The crushing originally occurred between
two cracks. It appeared that the top of a diagonal compression strut was crushing.
The crushing also brought about a decrease in load. Upon further loading, the load
increased to 48.9 kips. At this level a second &rea of crushing formed. Further loading
caused a third and fourth &rea to crush giving fairly general crushing of the web and
greatly reduced capacity (Fig. 5.55). Strand sliIE on the order of 0.004 and 0.002 in.
were noted for the second and bottom rows respectively. The slip was not of sufficient
magnitude to affect the failure mode. The draped strand and deck showed no measurable
slip.
The loa.d-deOection behavior for Specimen 3-t is shown in Figure 5.56. It will
be noted that as the specimen neared the crushing load, the slope of the loa.d-de8ection
curve decreased dramatically. The curve became fairly Oat for about 0.15 in. and then
entered a descending branch. The Oat portion of the curve corresponds to the period of
crushing.
Strand behavior versus load is shown in Figure 5.57. The gallles were placed
throughout the shear span. The location had a significant effect on the strain measured.
Those located closer to the load point had greater strain in general. A gauge was placed
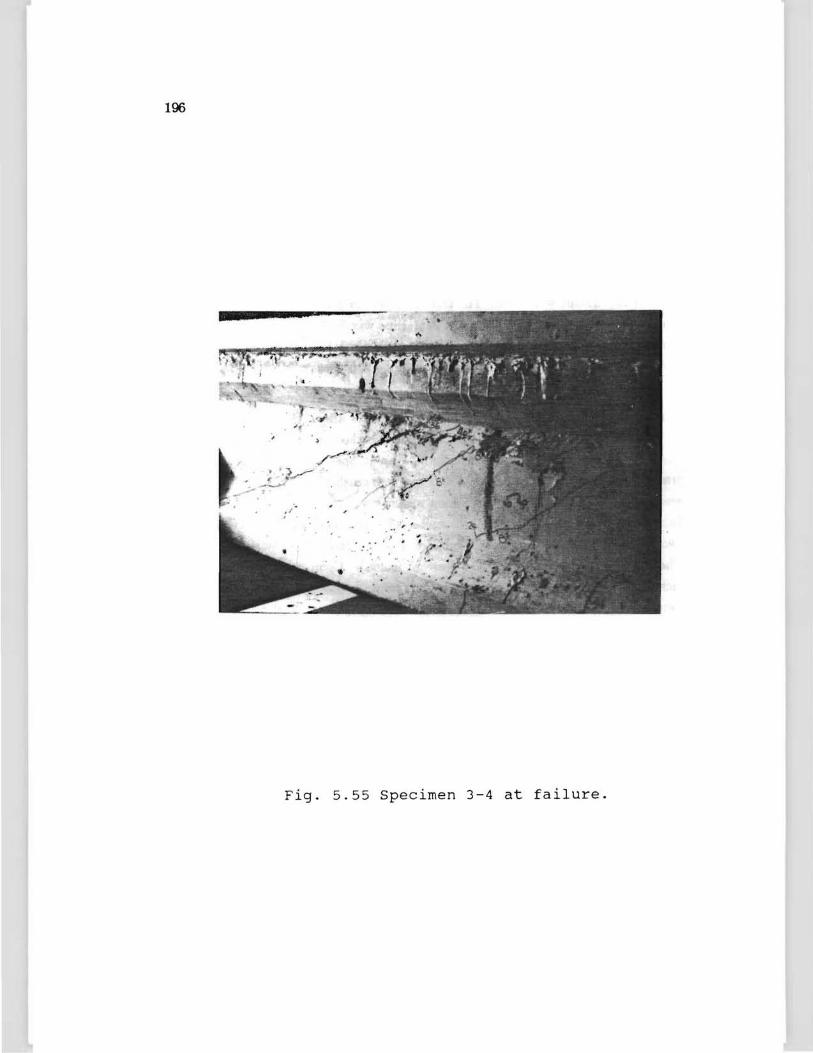
100
Fig. 5.55 Specimen 3-4 at failure.
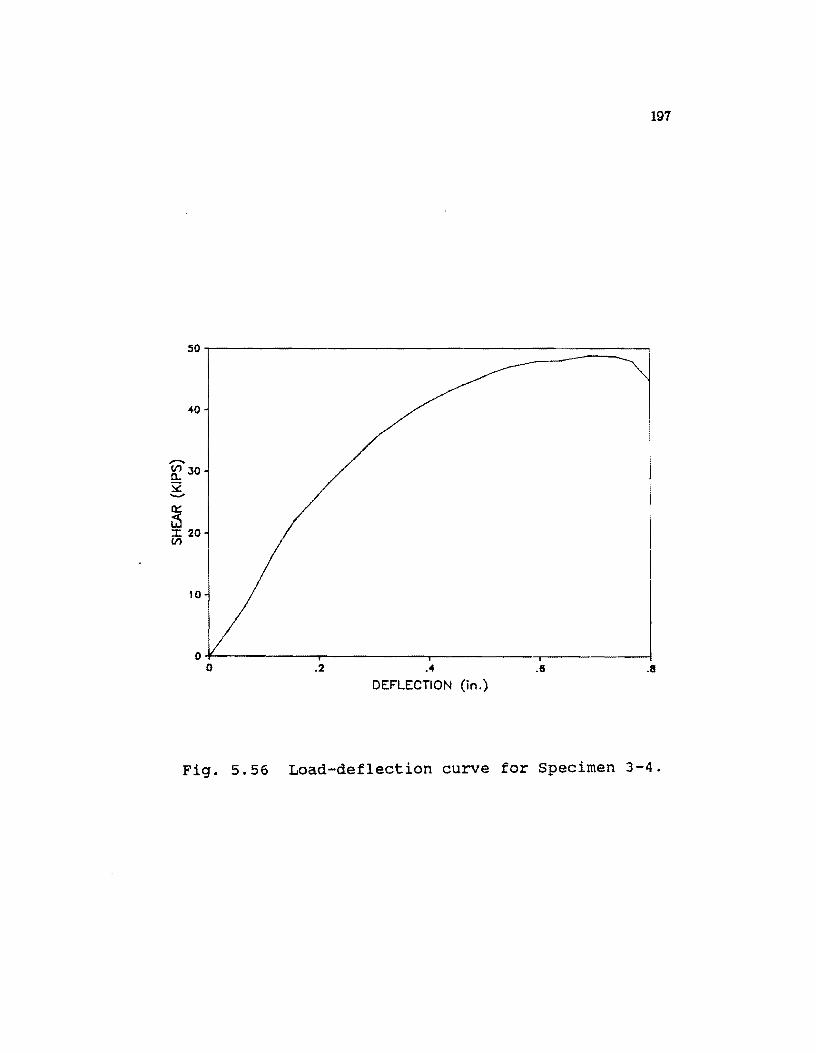
197
50,------------------------------------------------~
40
....."
(/) JO 0... ~ ........
~ ::r: 20 (/)
10
O~----------~----------~----------~----------~ o .2 .4
DEFLECTION (in.) .8 .8
Fig. 5.56 Load-deflection curve for Specimen 3-4.
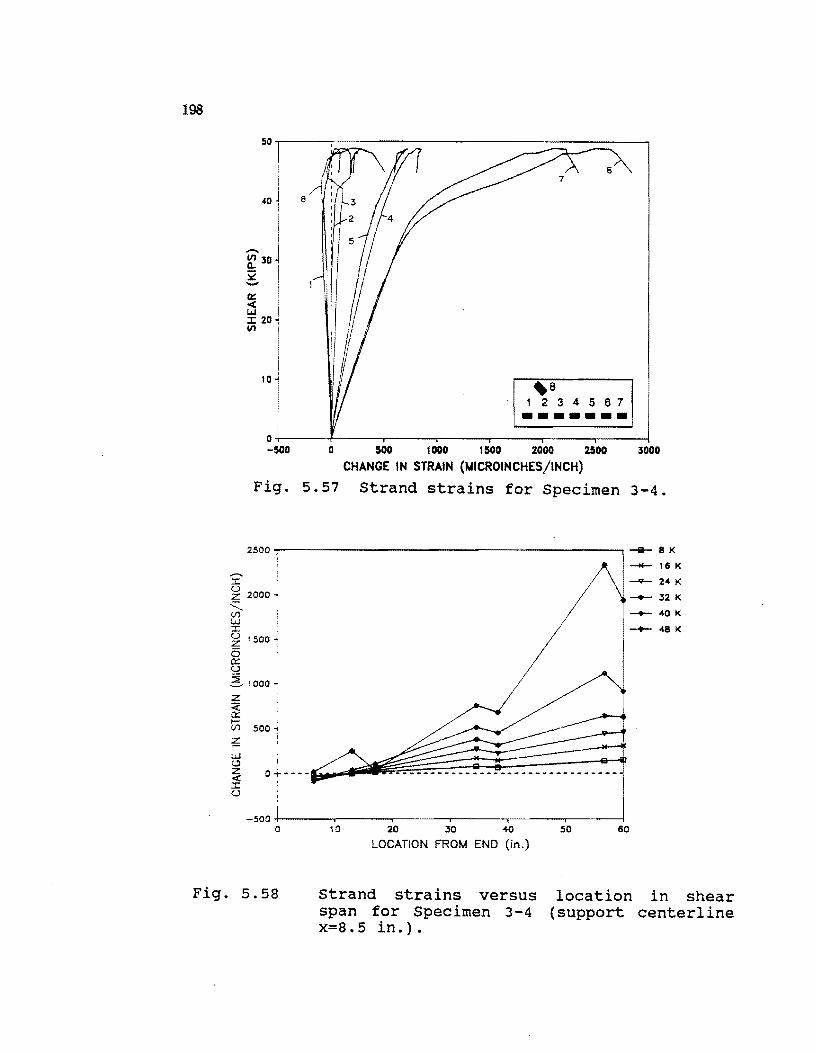
198
50~----~------------------------------------~
a::: -< LIJ
40
:J: 20 (I)
10 ~8
1234567
••••••• O+-----~----~------~----~----~------r_----~ -500 0 500 1000 1500 2000 2500 3000
CHANGE IN STRAIN (MICROINCHES/INCH)
Fig. 5.57 Strand strains for Specimen 3-4.
2500 ...-------------------------------------------, __ 8 K
........ :c ~ 2000 ~ "-V'l :...J :c ' u 1500 ~ Z , 6 a::: u ~ 1000-: z g V'l 500..,
i
-500+-----~------~----~r_----_r------~----~ o 10 20 30 40 50 60
LOCATION FROM END (in.)
__ 16 K
-- 24K
-- 32 K __ 40K
-- 48K
Fig. 5.58 Strand strains versus span for Specimen 3-4 x=8.5 in.).
location in shear (support centerline
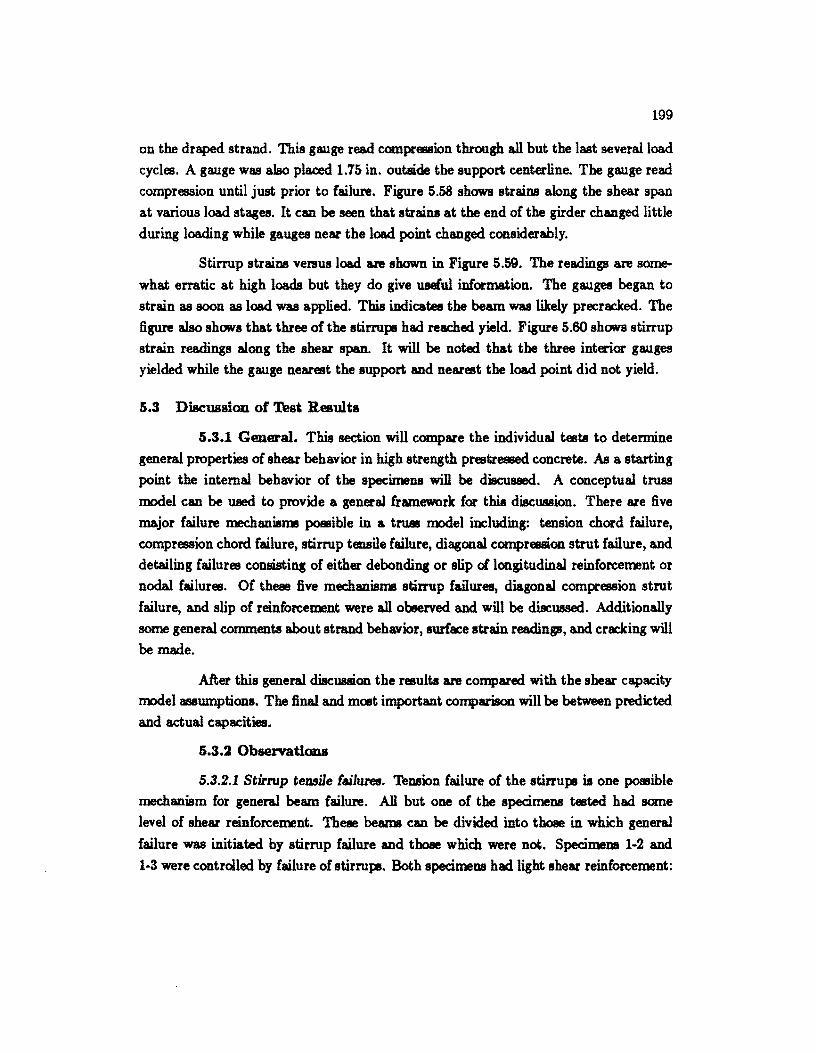
199
on the draped strand. This gauge read compression through all but the last several load
cycles. A gauge was also placed 1.75 in. outside the support centerline. The gauge read
compression until just prior to failure. Figure 5.58 shows strains along the shear span
at various load stages. It can be seen that strains at the end of the girder changed little
during loading while gauges near the load point changed considerably.
Stirrup strains versus load are shown in Figure 5.59. The readings are some
what erratic at high loads but they do give useful information. The gauges began to
strain as soon as load was applied. This indicates the beam was likely precracked. The
figure also shows that three of the stirrups had reached yield. Figure 5.60 shows stirrup
strain readings along the shear span. It will be noted that the three interior gauges
yielded while the gauge nearest the support and nearest the load point did not yield.
5.3 Discussion of Test Results
5.3.1 General. This section will compare the individual tests to determine
general properties of shear behavior in high strength prestre&ied concrete. As a starting
point the internal behavior of the specimens will be discussed. A conceptual truss
model can be used to provide a general framework for this discussion. There are five
major failure mechanisms poaIible in a tl'Wll model including: tension chord failure,
compression chord failure, stirrup tensile failure, diagonal compression strut failure, and
detailing failures consisting of either debonding or slip of longitudinal reinforcement or
nodal failures. Of these five mechanisms stirrup failures, diagonal compression strut
failure, and slip of reinforcement were all observed and will be discussed. Additionally
some general comments about strand behavior, surface strain readings, and cracking will
be made.
After this general discussion the results are compared with the shear capacity
model assumptions. The final and mOlt important comparison will be between predicted
and actual capacities.
5.3.2 Observations
5.3.2.1 Stirrup temile failures. Tension failure of the stirrups is one poaIible
mechanism for general beam failure. All but one of the specimens tested had some
level of shear reinforcement. These beams can be divided into those in which general
failure was initiated by stirrup failure and those which were not. Specimens 1-2 and
1-3 were controlled by failure of stirrups. Both specimens had light shear reinforcement:
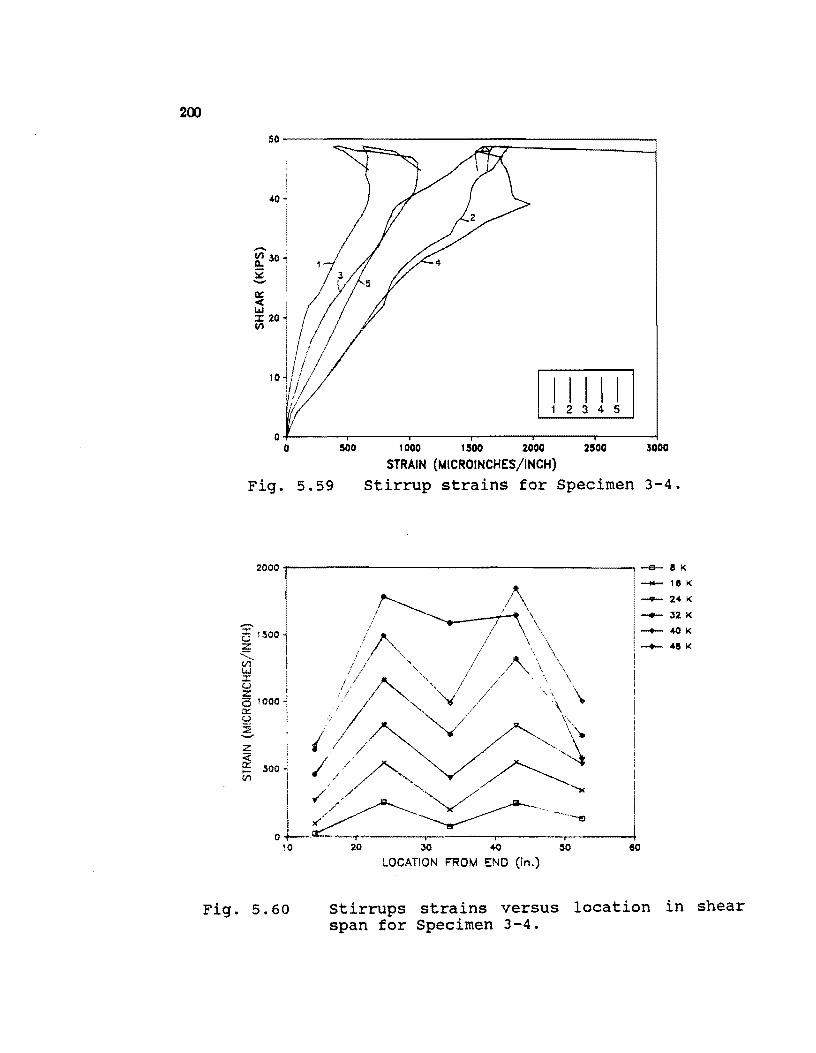
200
50r---~~;:~----~~==========:J
-~ 30
S2 -0::: <0( 1.1.1 :::z:: 20 en
500
I I I I I 12345
1 000 1500 2000 2500 3000
STRAIN (MICROINCHES/INCH)
Fig. 5.59 Stirrup strains for Specimen 3-4.
2000 1---------------------1 -e- 8 K 1-- 18 K 1\ 1-- 24 K
j ! \ __ 32 I<
-g I SOO /A \ 1-- 40 K Z /;" / \ \\, _ I : __ 48K
, I A I
~ 'I / "- / /" \ ! ..... /'; A "- / / \ \ ~! ' / ""-.' / ,
1""1 if ~/'\~ ~ so,, ~'/ ~ ~ -<~~ U1 I / / '''.'" / ~
! /// ''V __ , 'x
,L~-~~ 10 20 30 40 50 60
LOCATION FROM END (in.)
Fig. 5.60 Stirrups strains versus location in shear span for Specimen 3-4.
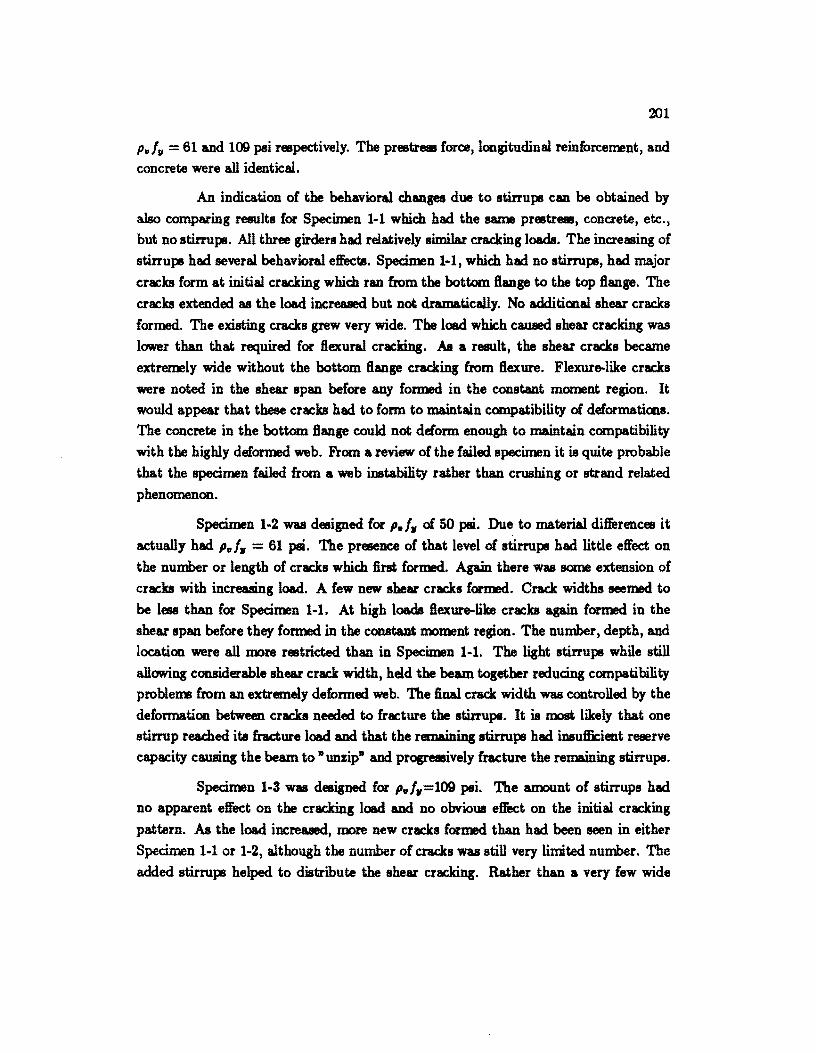
201
PilI" = 61 and 109 pei respectively. The prestreas force, longitudinal reinforcement, and
concrete were all identical.
An indication of the behavioral changes due to stirrups can be obtained by
also comparing results for Specimen 1-1 which had the same prestreas, concrete, etc.,
but no stirrups. All three girders had relatively similar cracking loads. The increasing of
stirrups had several behavioral effects. Specimen 1-1, which had no stirrups, had major
cracks form at initial cracking which ran bom the bottom Bange to the top Bange. The
cracks extended as the load increased but not dramatically. No additional shear cracks
formed. The existing cracks grew very wide. The load which caused shear cracking was lower than that required for Bexural cracking. As a result, the shear cracks became
extremely wide without the bottom Bange cracking from Bexure. Flexure-like cracks
were noted in the shear span before any formed in the constant moment region. It
would appear that these cracks had to form to maintain compatibility of deformations.
The concrete in the bottom Bange could not deform enough to maintain compatibility
with the highly deformed web. From a review of the failed specimen it is quite probable
that the specimen failed from a web instability rather than crushing or strand related
phenomenon.
Specimen 1-2 was designed for p.l, of 50 psi. Due to material differences it
actually had PilI, = 61 psi. The presence of that level of stirrups had little effect on
the number or length of cracks which first formed. Again there was some extension of
cracks with increasing load. A few new shear cracks formed. Crack widths seemed to
be less than for Specimen 1-1. At high loads Bexure-Hke cracks again formed in the
shear span before they formed in the constant moment region. The number, depth, and
location were all more restricted than in Specimen 1-1. The light stirrups while still
allowing considerable shear crack width, held the beam together reducing compatibility
probletnl born an extremely deformed web. The final crack width was controlled by the
deformation between cracks needed to fracture the stirrups. It is most likely that one
stirrup reached ita fracture load and that the remaining stirrups had insufficient reserve
capacity causing the beam to "unzip" and progreasively fracture the remaining stirrups.
Specimen 1-3 was designed for p.I,=109 psi. The amount of stirrups had
no apparent effect on the cracking load and no obvious effect on the initial cracking
pattern. As the load increased, more new cracks formed than had been seen in either
Specimen 1-1 or 1-2, although the number of cracks was still very limited number. The
added stirrups helped to distribute the shear cracking. Rather than a very few wide
202
cracks, there were a greater number of relatively lIIIJ&ller cracks. For Specimen 1-3,
flexure cracks first appeared in the constant moment region and then later in the shear
span. The increase in stirrups decreased the web defonnatioo. at a given load. Crack
widths did grow very wide as failure apprOlChed. At ultimate the collapse sequence was undoubtedly the same as for Specimen 1·2 with progressive fracturing of the stirrups.
The ultimate shear span loads were 34.5, 33.5, and 35.85 kips for Specimens I-
1,1·2, and 1-3 respectively. For all practical PUl'pOl!llel the failure loads were independent
of shear reinfa:'cement. Note that Specimen 1·2 did slightly poorer and Specimen 1-3
did oo1y slightly better than Specimen 1-1 which had no stirrups. This certaio1y is counter to expected behavior, and it is Specimen 1·1 that behaved quite differently than
expected. Between web cracking and ultimate, the beam took 8.5 kips additional shear
load. The ultimate load was 1.33 times ita initial inclined cracking load. The general
assumption in shear design is that cracking and ultimate are the same value for members
without shear reinfa:'cement. In this beam at inclined cracking, however, both the top
and bottom flanges were uncracked. The beam W8I able to find stable internal load
paths to carry the loading. This remained true until failure. In Specimens 1-2 and 1-3
the stirrups provided the necessary hangers for the conceptual truss model. The stirrups
helped to carry the load from cracking to ultimate. At stirrup fracture the stable internal
mechanism lost a component. The 8pecimeu was unable to find an alternate mechanism
and failed.
The stirrup strain gauges in Specimen 1·2 and 1-3 did not in general show
strains of the magnitude that were obviously occurring. The gauges were slightly away
from the major cracks. This also indicates that the small bars used had good bonding
ability. The stirrup action crotlJing an extremely wide crack had essentially a localized
effect on stirrup behavior.
The deformations observed and the final fracture of shear reinforcement were
dependent upon no other failure mechanism occurring prematurely. Proper anchorage
of the longitudinal reinforcement was essential to allOW' loads and deformation of the
magnitude observed.
Stirrup behavior was quite different for the seven other tests. The shear rein
forcement capacity V. varied from" to 15v'!:6.d. Several general trends were observed
as the level of shear reinfa:'cement increased: a) The number of initial cracks varied
but their length and width decreased; b) The number ci new cracks increased while the
crack width declined. In these seven tests no compatibility cracks formed in the tension
203
flange like those in Specimens 1-1 and 1-2. The use of heavier stirrups reduced the shear
defonnations.
In general the instrumented stirrups yielded even for the beams with V. = 15v'ftb'IDd. Generally the stirrups that did not yield were either clale to the support
or the load point. It is possible that a portion of the stirrup above or below the gauge
was yielding and that the gauge location W8I outside the primary load resisting region.
From the observations made earlier it is quite possible one portion of the bar yielded
while another portion a small distance away had not reached yield.
S.S.2.2 Concrete COlDpl'888ioll diagonals. Crushing of the conaete compression diagona1s was the failure mode in four of the shear tests. Of those four tests three
had extremely heavy shear reinforcement. The three tests of Series 2 had 15.5v'ftb'IDd
and 19.3v'ftb'IDd actual shear reinforcement. The beams were provided with a support overhang to insure proper development of the flexural reinforcement. EKh specimen
had a large number of very fine cracks in the web prior to failure. At failure the web
blew out explosively. The concrete spalled for nearly the full shear span in eKh case.
The crushed. zone was highly irregular but tended to be in the lawer portion of the web.
The concrete was generally blown out down as deep as the level of the stirrups. In places
it was destroyed all the way through the web. The failure gave a clear indication that
for such heavy shear reinforcement values the beam set up a diagonal compression field.
The cracking and crushing was distributed uniformly over the shear span. The action
was that of a field rather than discrete strufB.
Specimen 3-4 displayed a different mode of web crushing. This specimen had
V. = 4v'ftb'IDd of shear reinforcement. A small overhang was provided to improve
anchorage. In this specimen four m~or cracks defined three principle str:uts. There was
some secondary cracking but it was limited. The major cracks had substantial width.
The web crushing sequence is shown in Figure 5.61. Region 1 was the first to crush and
spall. There was a significant drop in load. Upon further loading, a higher load was
attained until Regions 2 and then 3 both crushed and spalled. Finally, Region 4 crushed.
By the time Region 4 crushed the specimen had obviously lost the majority of its load
carrying capacity. The specimen appeared to have three distinct diagonal compression
struts. When strut B failed, the extra load was transferred to struts A and C. Further
loading crushed eKh of these struts, finally destroying the member's capacity. This
type of c.rushing may be a partial result of using high strength concrete. High strength
concrete has limited capacity beyond the strain value at peak streaJ. It is possible that
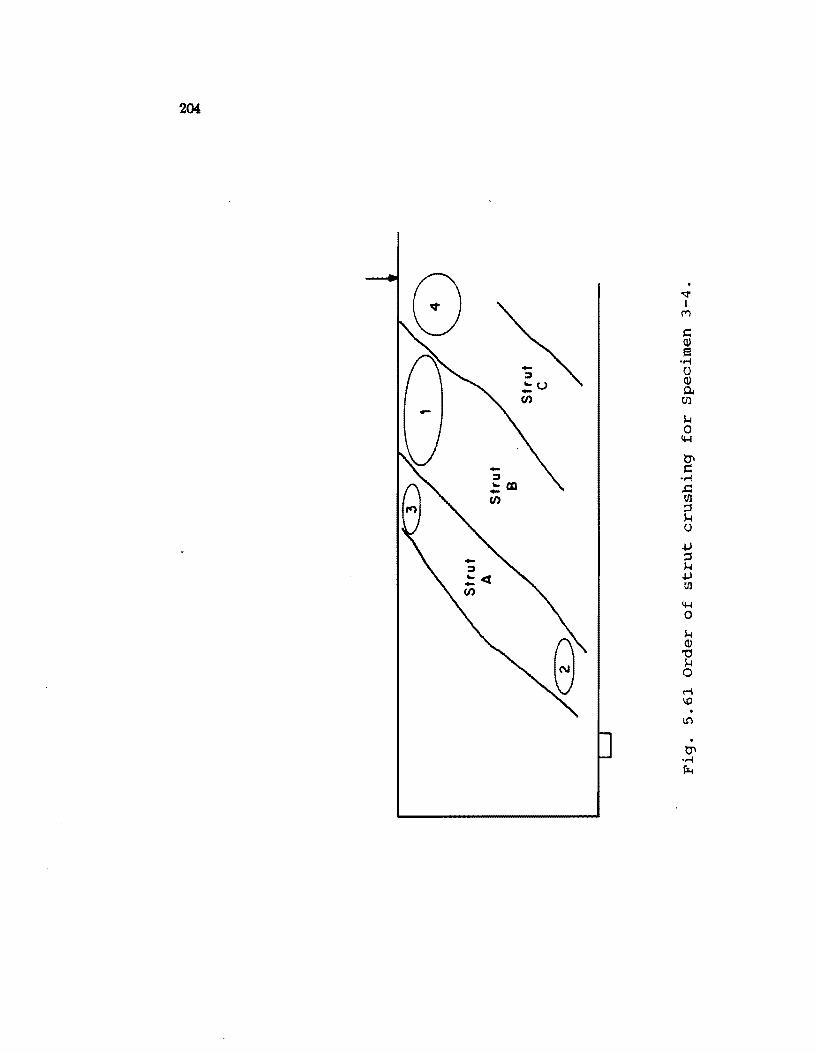
204
-:J "-U -(f)
-:J "-Ql -(f)
205
strut B reached its peak strain. This strut would have reduced capacity thereafter. The
load was then transferred to struts A and C where the same thing eventually happened.
5.3.2.3 Strand slip. Strand slip or node anchorage failures proved to be a
common failure mode. Specimens 3-1, 3-2, and 3-3 were the ends of 1/3 scale model
tests of long span bridge girders. For the flexural tests, section parameters and stresses
were modelled as accurately as possible including the use of dead load blocks to properly
model internal dead load stresses. Due to the limited number of available sizes, a smaller
number of relatively larger prestressing strands had to be used. The dead load blocks
were not used in the shear tests for practical reasons but should not have affected the
anchorage of the strand. Actual support conditions for typical pretenaioned girders were
modelled. For the model tests the support centerline was two inches from the end of the
girder.
Each girder behaved normally up to the point of strand slippage. Cracking
loads and patterns did not appear affected and neither did internal strain measurements.
Dial gauges placed on the ends of the strand did, however, indicate impending problems.
In all three girders the second raw of strands showed slight slip at relatively law load
stages. The slip stayed quite small, about 0.00; in., until just prior to general slip. The
bottom strand raw tended not to slip at all until just before general failure. Draped
strands tended not to slip as much or slipped as secondary effects.
Anchorage failure signals the end of a member's capacity. As the strand slips,
the prestress force in the end of the girder dropa rapidly. As the slip proceeds, the entire
tension chord becomes ineffective leaving easentially unreinforced concrete just past the
support. In the specimens tested, the failure crack generally went through the bottom
flange at the end of the detail steel.
This mode of failure raises questions about current design practice. Each test
girder which modelled actual end support conditions failed due to anchorage failure.
Thus anchorage seemI to be the weak link in the shear resisting mechanism of model
specimens. While the development characteristics of the model and prototype strands
are different, the behavior noted in the model tests is serious enough to warrant caution
and further testing of prototype specimens. Appendix B has a more in-depth look at
the problem of development of prestressing strands.
5.3.2.4 Strands. General strand behavior indicates the general internal state
of the member. The tension chord is easier to define and evaluate than the compression
chord. A number of strain gauges were placed on the prestressing strands of each spec
imen as well as on nonprestressed longitudinal reinforcement when it was used. For the
prestressed reinforcement a best estimate was made of the state of stress and strain in
the strand at the time of test. During the teat the change in strain was measured. The
cumulative strain is primarily important in this discussion since it governs if the strand
reached yield. So far, as internal behavior is concerned, the change in strain under load
is more important.
A review of the strain readinp for the preatressing strands reveals several
facts. The first is that at the locations gauged the strand did not reach yield. A second
observation is that change in strain readings varied along the length of the shear span.
5.3.2.5 Cracking. The cracking pattern indicated the internal reaponse of the
concrete. Some comments were made earlier with reference to the level of the shear
reinforcement. This will be expanded upon in addition to the comments made on crack
angles and crack widths.
The number and extent of cracks at first cracking is largely governed by the
aImunt of shear reinforcement present. The specimens of Seriea 1 had a very law level
of shear reinforcement. The initial inclined cracks extended from the bottom flange all
the way to the top flange. For Seriea 2 with very heavy shear reinforcement the initial
inclined cracks were very short and extremely narrow. Series 3 was very likely precracked
before the shear loading 80 the reaulting initial cracking is of little value.
The level of shear reinforcement greatly affected cracking as the load increased.
In Seriea 1 very few additional cracks formed after initial cracking. The crack width,
however, grew to extreme widths in exce. of 1/8 in. Series 2 beams had a very large
number of new cracks and crack extensions as the load increased. Throughout the loading
most cracks were less than 0.005 in. wide. Series 3 behavior was within the bounds set
by Series 1 and 2. Specimens 3-1 and 3-2, with V. = 8..jl!6.d, had a considerable
increase in cracking as the load increased. No crack width measurements were taken.
Specimens 3-3 and 3-4, V. = 4 ..jl!6 .. d, had substantially less cracking. There were a few
primary cracks as well as some secondary cracking. Crack widths reached 0.050 inches.
The quantity of shear reinforcement provided affects the spacing, number, and width of
the shear cracks.
The angle of inclination of cracks varied somewhat throughout the program.
The angle of inclination varied along the length of each beam. The angles at the end
and near the load points tended to be higher. Angles as high as 55° were noted in these
207
regions. Away from load points and supports the cracks flattened out somewhat. There
was some variation from specimen to specimen but the average crack inclination varied
from 25° to 300. The quantity of shear reinforcement and prestress did not correlate
consistently with the crack angle.
5.3.2.6 &sette strain gauges. RaJette strain gauges were used on the beams of
Series 1 and 2. The rosette gauges were used in an attempt to obtain the direction and
magnitude of principal stresses in the web of the girders. The gauges gave only limited
success and will therefore be disc1.l88ed as a group rather than for each individual girders.
The results for Series 1 were fairly consistent. Prior to cracking the principal
compressive stress was inclined from about 3go to 45° tawards the load point. Prior to
cracking the tensile stresses indicated ranged from 300 psi to 900 psi with most values
about 675 psi. This is 6.35J7f. After cracking, the principal compression axis was in the
range of 25° pointed away from the load point (Fig. 5.62). No good explaination for the
principal axis inclination after cracking has been obtained. Given the strange principal
direction indicated after cracking the compression strut stresses must be vie'W'ed with
caution. There was considerable scatter but the average principal compression stress
was 2000 psi.
The results from Series 2 are nmch poorer. Only Specimen 2-1 gave any results.
The same trend of a large switch in principal angle direction as noted for Series 1 was
again indicated. The gauges indicate that the principal tensile stress at cracking was
around Hxx) psi or 9.6.../1£. The higher coefficient would be expected since the beam
had higher prestress than Series 1. The angle of the principal compression stress at
failure was indicated to be about 3SO directed away from the load point. The principal
stress was about 5100 psi or just under a.5f::. Due to the low level of confidence in these
measurements they will not be discussed further.
5.3.3 ComparlaOll with Model Assumptions. Comparison of actual behavior with the assumptions used for the various shear capacity models gives an indi
cation of the appropriateness of each model. The current test series gives only limited
information so far as the AASH:rO/ ACI V c tenn is concerned. Only the web shear equa
tion, V C1D, is involved. Furthermore, only two concrete strengths and prestress forces
were tested. Both results will be shown in Section 5.3.4.1. The AASHTO / ACI steel con
tribution assumes a 45° truss and that the shear reinforcement yields. From the cracking
patterns the first assumption is not correct, but it is conservative. The assumption that
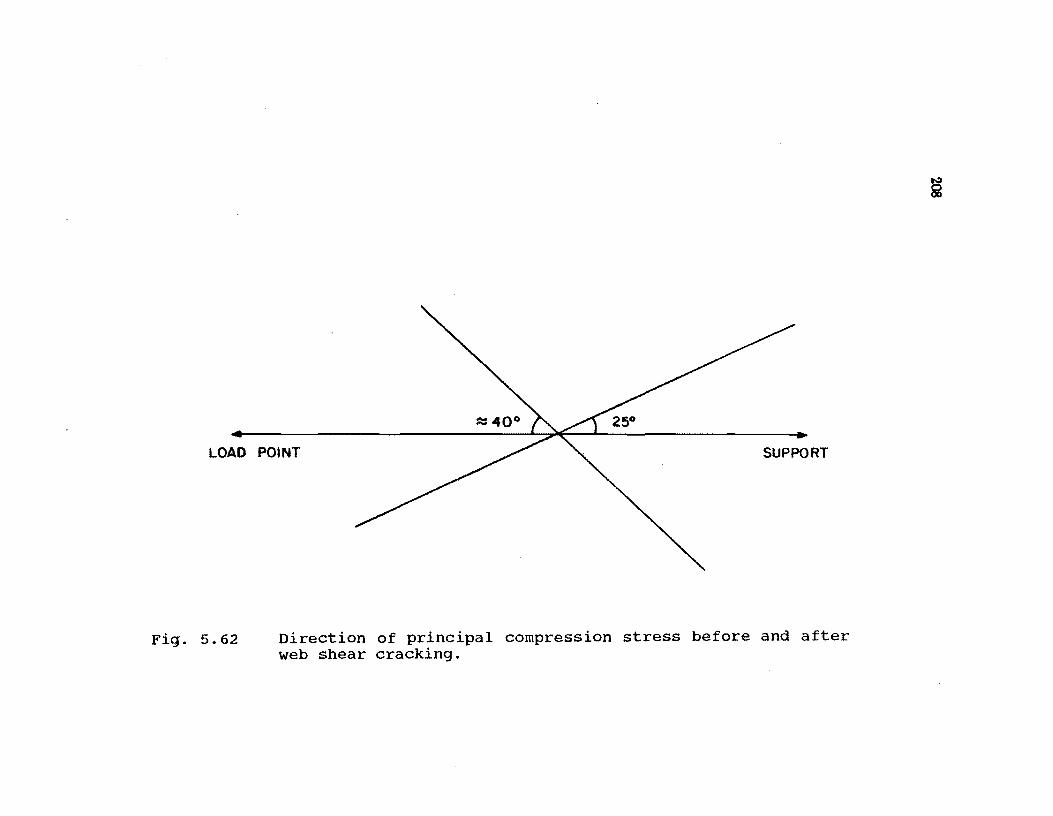
LOAD POINT SUPPORT
Fig. 5.62 Direction of principal compression stress before and after web shear cracking.
i
209
the stirrups yield is generally a good one even for beaDII reinforced well beyond current
allowable limits.
The primary U!lwnptions for the Danish plasticity model were stirrup yielding
and concrete web crushing along with no yielding of the longitudinal reinforcement.
As previously noted, stirrup yielding is a good U!lumption. Web crushing occurred
principally in beams with very heavy shear reinforcement. Specimen 3-4 shawed web
crushing would occur for lawer shear reinforcement values, but only if proper anchor&«e
of the longitudinal reinforcement was provided. The 888umption of no tension chord
yielding was a good one for this program.
The Swiss plasticity model and the trU88 model of Ramirez are very similar
and will be discussed together. The primary U!lumptiona are that both the web and longitudinal reinforcement yield and that the concrete does not crush. Yielding of the
longitudinal reinforcement was not observed in the shear span. This comes from the fact
that the members are over-reinforced to insure the occurrence of a shear failure. In an
actual member the shear and ftexural reinforcements are designed for the same load 80
the U!lumption is not a problem. Typical failure mechanisma were stirrup fracture and concrete crushing. Both cases can be modelled with the tlU8l!l model but are restricted by
supplementary provisions. The case of anchor&«e failure is also recogni2d as a potential
problem. The models indicate that a definite tensile requirement exists at the support.
5.3." Comparison of shear design models to test results
5.3.4.1 IntnxiuctioD. The tests results of this project will be compared to the
numerical predictions of AASHTO / ACI, the truss model, and the 1984 Canadian Code
General Method. Table 5.1 contains pertinent member properties for the ten specimens
of this program.
5.3.4.2 AASHTO/ACL The AASHTO/ACI provisions are the IIlO8t empirical
ofthe three methods. Table 5.2 contains the test results and AASHTO / ACIpredictions.
The concrete contribution could be compared only for Series 1 and 2. All the initial
cracking was web shear cracking. The AASJ:ITO/ACI equation for V cw was very clQ!le
in three tests and conservative in the other three tests. The average test/predicted value
was 1.06. The two primary variables in the V cw equation are concrete strength and
level Of concrete prestress at the centrad. Figure 5.63 shClW'S that for the data of this
program no conclusions can drawn for the effect of changes in concrete strength. Figure
5.64 shows the results plotted against fpc. Again, no trencls are apparent.
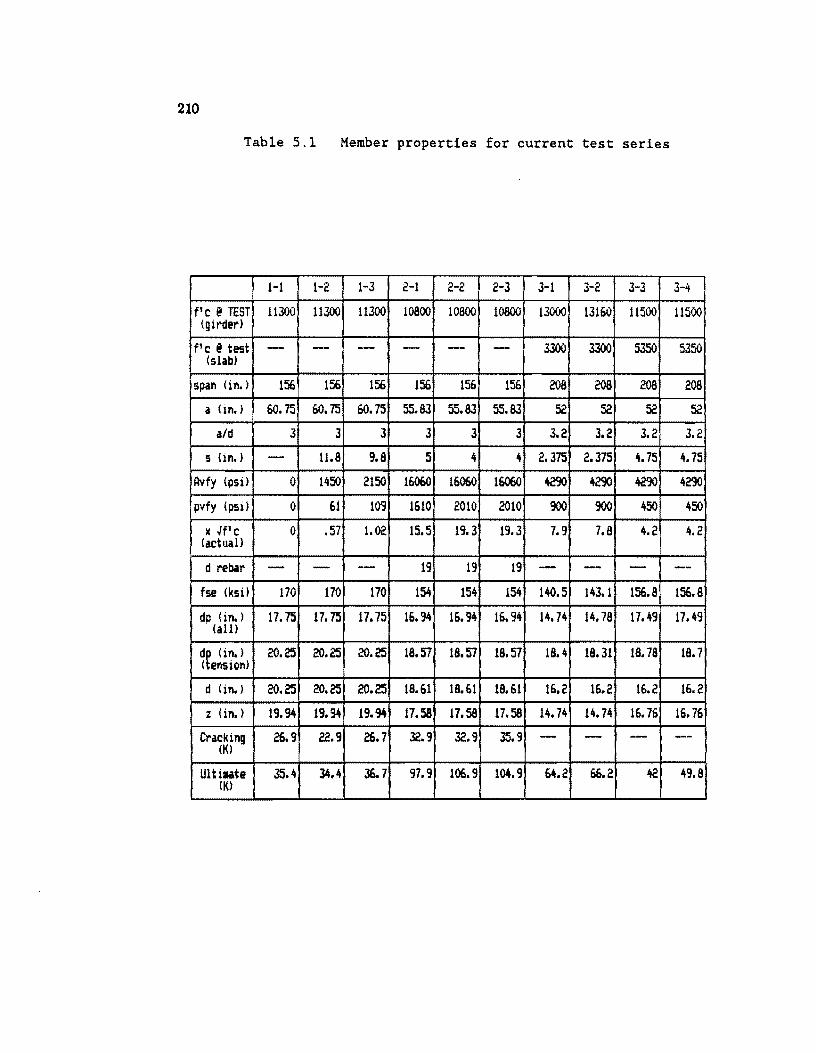
210
Table 5.1 Member properties for current test series
1-1 1-2 1-3 2-1 2-2 2-3 3-1 3-2 3-3 3-4
f'c ~ TEST 11300 11300 11300 10800 10BOO 10800 13000 13160 11500 11500 (girder)
f'c f test - -- -- - -- - 3300 3300 53SO 5350 (slab)
span (in.) 156 156 156 156 156 156 208 208 208 208
a (in.) 60. 75 60.75 60. 75 55.83 55.83 55.83 52 52 52 52
aId 3 3 3 3 3 3 3.2 3.2 3.2 3.2
s (in.) - 11.8 9.8 5 4 4 2.375 2.375 4.75 4.75
Avfy (pSi) 0 1450 2150 160G0 16060 16060 4290 4290 4290 429()
pvfy (psi) 0 61 109 1610 2010 2010 900 900 450 450
x ~f' c 0 .57 1.02 15.5 19.3 19.3 7.9 7.8 4.2 4.2 (actual)
d rebar - - -- 19 19 19 - - - --fse (ksi) 170 170 170 154 154 154 140.5 143.1 156.8 156.8
dp !in.) (all)
17.75 17.75 17.75 16. '34 ! 16.94 16.94 14.74 14.78 17.49 17.49
df (in.) 20.25 20.25 20.25 18.57 18.57 18.57 18.4 18.31 18.78 18. 7 ( ension)
d (in.) 20.25 20.25 20.25 18.61 18.61 18.61 16.2 16.2 16.2 16.2
z (in.) 19.94 19.94 19.94 17.58 17.58 17.58 14.74 14.74 16. 76 16.76
Cracking 25.9 22.9 25.7 32.9 32.9 35.9 - - - --(K)
Ultiute 35.4 34.4 36.7 97.9 106.9 104.9 64.2 66.2 42 49.8 (K)
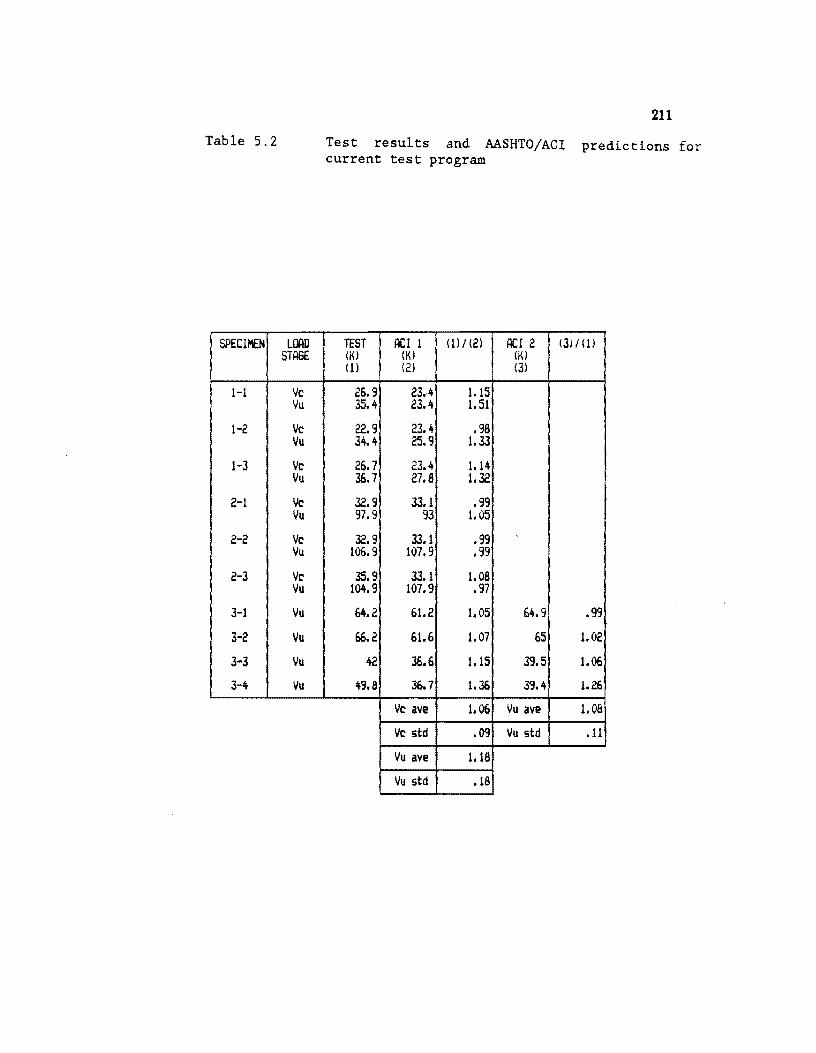
Table 5.2
SPECIMEN LOAD STAGE
1-1 Ve Vu
1-2 Ve Vu
1-3 Ve Vu
2-1 Vc Vu
2-2 Ve Vu
2-3 Ve Vu
3-1 Vu
3-2 Vu
3-3 Vu
3-0\ lIu
211
Test results and AASHTO/ACI predictions for current test program
TEST ocr 1 (1)/(2) ReI 2 (3) 1 (1) (Kl (K) (K) (1) (2) (3)
26.9 23.4 1.15 35.4 23.4 1. 51
22.9 23.4 .98 34.4 25.9 1.33
26.7 23.4 1.14 36. 7 27.8 1.32
32.9 33.1 .99 97.9 93 1.05
32.9 33.1 .99 106.9 107.9 .99
35.9 33.1 1.08 104.9 107.9 .97
64.2 61.2 1.05 64.9 .99
66.2 61.6 1.07 65 1.02
42 36.6 1.15 39.S 1.06
4'3.8 .36.7 1 • .36 39.4 1.Z6
Ve ave 1.06 Vu ave 1.08
lie std .09 Vu std .11
Vu ave 1.18
Vu std .18
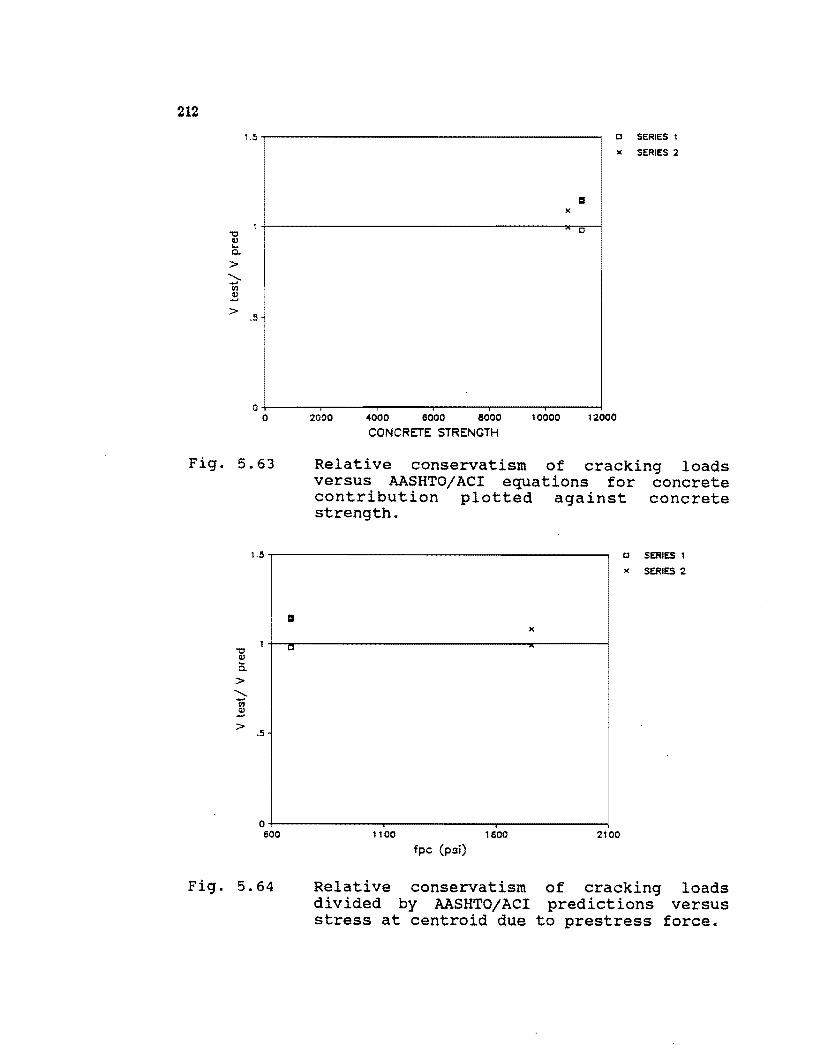
212
1.5.,..--------------------...., o SERIES 1
)( SERIES 2
)(
> .5
o~---~----~----~---~----~----~ o 2000 4000 8000 8000 10000 12000
CONCRETE STRENGTH
Fig. 5.63 Relative conservatism of cracking loads versus AASHTO/ACI equations for concrete contribution plotted against concrete strength.
"C e c. > ........... -In
2 >
1.5.,..--------------------------....,
iii )(
.5
O+------~~-------~------------~ 600 1100 1800 2100
fpc (psi)
o SERIES 1
x SERIES 2
Fig. 5.64 Relative conservatism of cracking loads divided by AASHTO/ACI predictions versus stress at centroid due to prestress force.
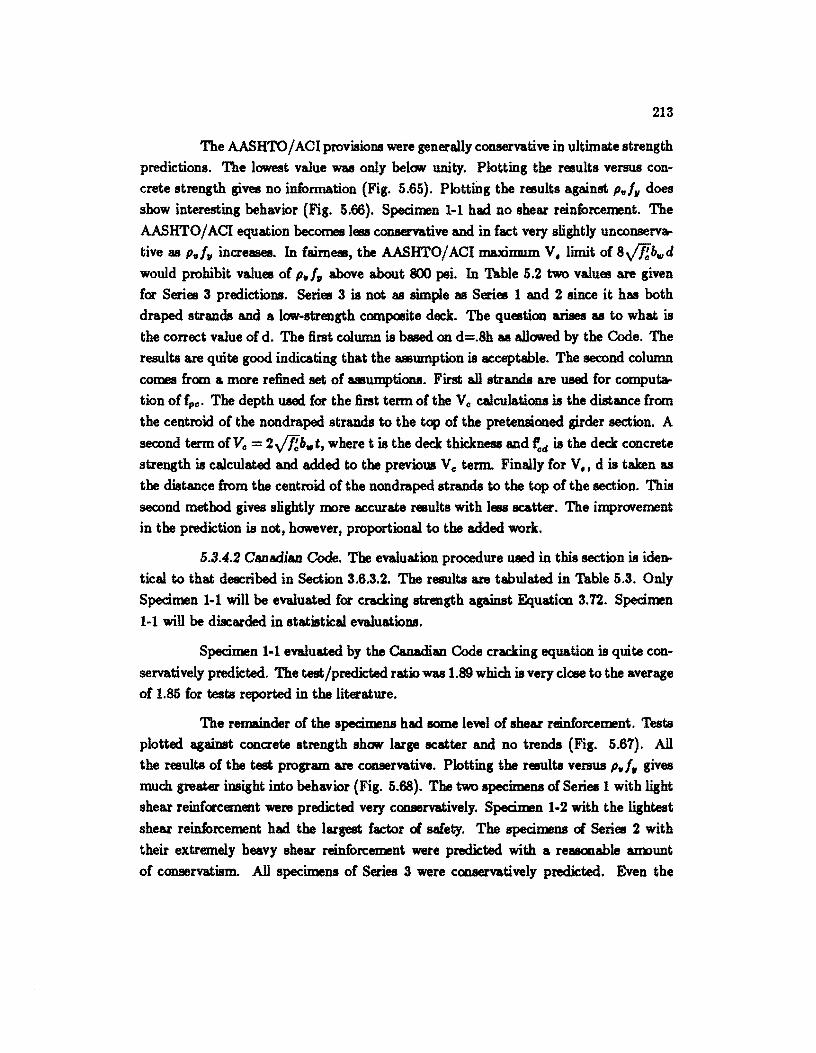
213
The AASHTO / ACI provisions were generally conservative in ultimate strength
predictions. The lowest value was only below unity. Plotting the results versus con
crete strength gives no infonnation (Fig. 5.65). Plottmg the results against '''/11 does show interesting behavior (Fig. 5.66). Specimen 1-1 had no shear reinforcement. The
AASHTO / ACI equation becomes less conservative and in fact very slightly unconserva.
tive as '''/11 increases. In faimeal, the AASFffO/ACI maximum. V, limit of 8JlIbtIJd would prohibit values of '''/11 above about 800 psi. In Table 5.2 two values are given for Series 3 predictions. Series 3 is not as simple as Series 1 and 2 since it has both
draped strands and a low-strength compadte deck. The question arises as to what is
the correct value of d. The first column is based. on d=.8h as allowed by the Code. The
results are quite good indicating that the assumption is acceptable. The second column
comes from a more refined set of assumptions. First all strands are uaed. for computa.
tion of fpc. The depth uaed. for the first tenn of the Ve calculations is the distance from
the centroid of the nondraped strands to the top of the pretensioned girder section. A
second term ofVc = 2 JlIb.t, where t is the deck thickness and ~4 is the deck concrete
strength is calculated and added to the previous V c term. Finally for V" d is taken as
the distance from the centroid of the nondraped strands to the top of the section. This
second method gives slightly more accurate results with less scatter. The improvement
in the prediction is not, however, proportional to the added work.
5.3.4.2 Canadian Code. The evaluation procedure used in this section is iden
tical to that described in Section 3.6.3.2. The results are tabulated in Table 5.3. Only
Specimen 1-1 will be evaluated for cracking strength against Equatioo 3.72. Specimen
1-1 will be discarded in statistical evaluations.
Specimen 1-1 evaluated by the Canadian Code cracking equation is quite con
servatively predicted. The test/predicted ratio was 1.89 which is very close to the average
of 1.85 for tests reported in the literature.
The remainder of the specimens had lOme level of shear reinforcement. Tests
plotted against concrete strength show large scatter and no trends (Fig. 5.67). All
the results of the test program are conservative. Plotting the results versus ,,,/,, gives
much greater insight into behavior (Fig. 5.68). The two specimens of Series 1 with light
shear reinforcement were predicted very conservatively. Specimen 1-2 with the lightest
shear reinforcement had the largest factor ci safety. The specimens ci Series 2 with
their extremely heavy shear reinforcement were predicted with a reasonable a.J:munt
of conservatism. All specimens of Series 3 were conservatively predicted. Even the
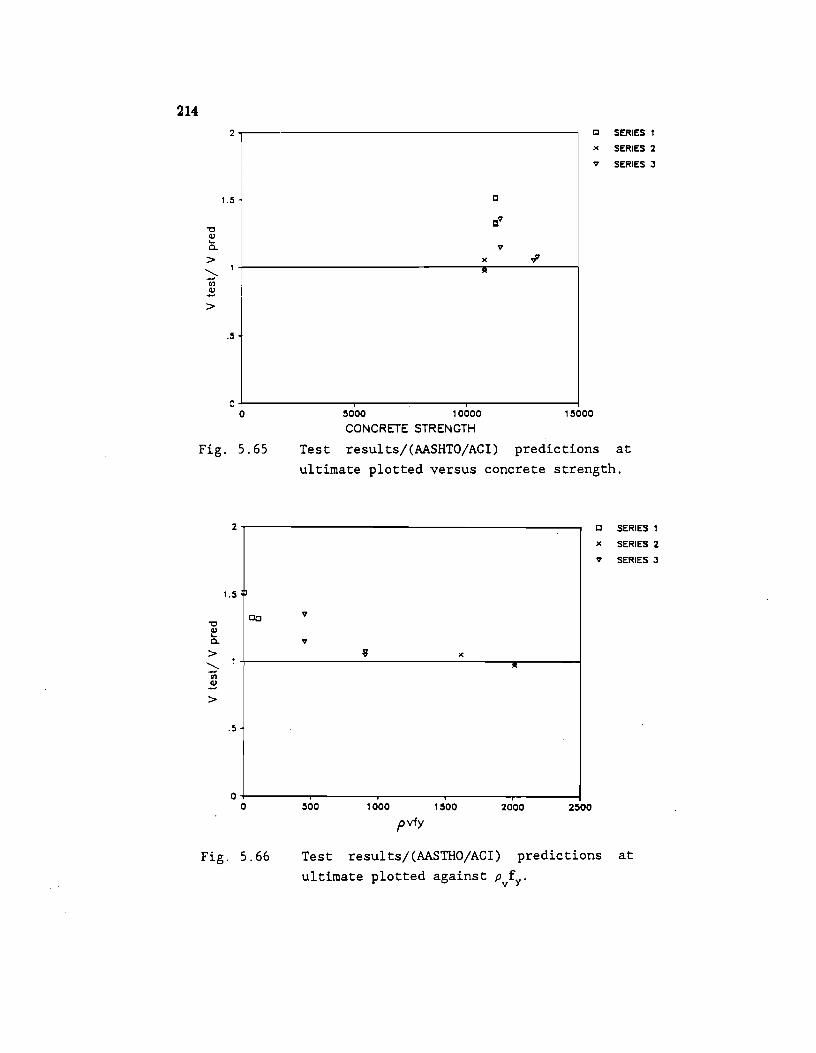
214
2i C SERIES 1
)C SERIES 2
I
v SERIES J
I [] 1.5
r:.V "0
<IJ .... Q. V
> )C oF ~
!II
rJl
1: >
.5
O+--------------r------------~~----------~ a
Fig. 5.65
2
1.5
"0 Co
<IJ ... Q.
> ~
rJl
1: >
.5
5000 10000 15000
CONCRETE STRENGTH
Test results/(AASHTO/ACI) predictions at ultimate plotted versus concrete strength.
C SERIES I
>< SERIES 2
v SERIES J
v
V
)C
"
O+--------r--------r-------~------~------~ a
Fig. 5.66
500 1000 1500 2000 2500
pvfy
Test results/(AASTHO/ACI) predictions at
ultimate plotted against Pvfy'
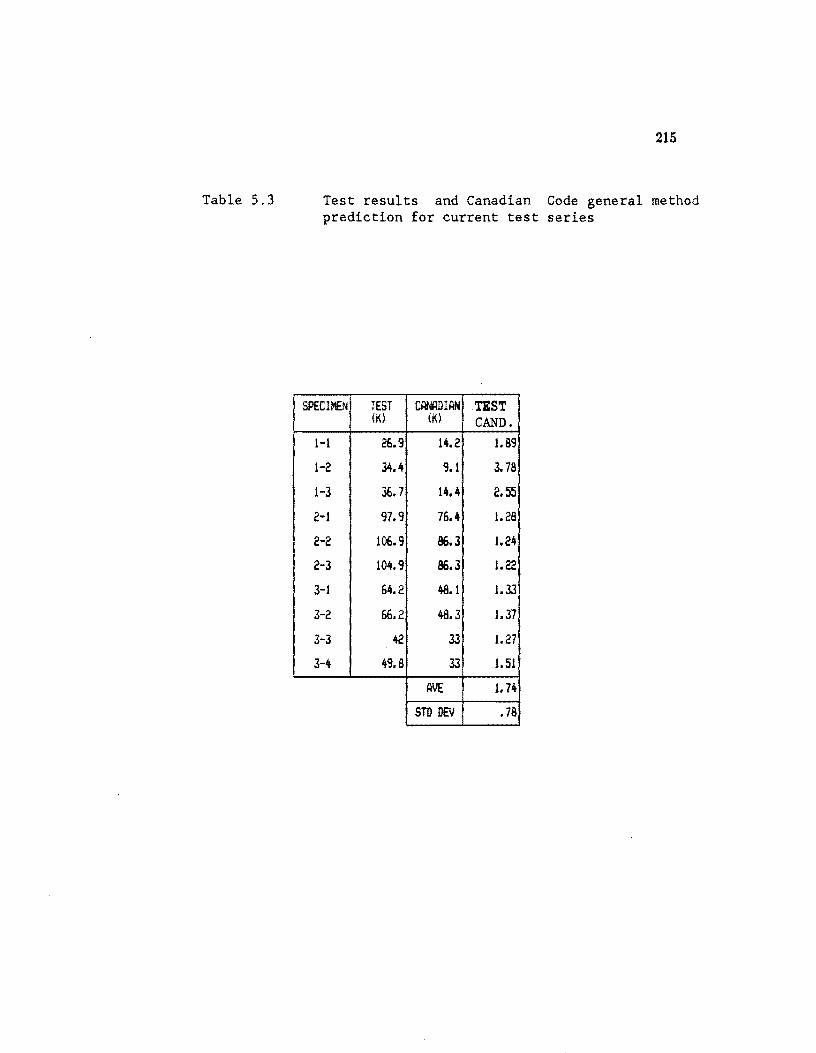
Table 5.3
215
Test results and Canadian Code general method prediction for current test series
SPECIMEN TEST CANADIAN . TEST (Kl (Kl CAND.
1-1 26.9 14.2 1.89
1-2 .14.4 9.1 3. 78
1-3 36.7 14.4 2.55
2-1 97.9 76.4 1.2B
2-2 106.9 86.3 1.24
2-3 104.9 86.3 1.22
3-1 64.2 48.1 1.33
3-2 66.2 48.3 1.37
3-3 42 33 1.27
3-4 49.8 33 1.51
AVE 1.74
STD DEY .78
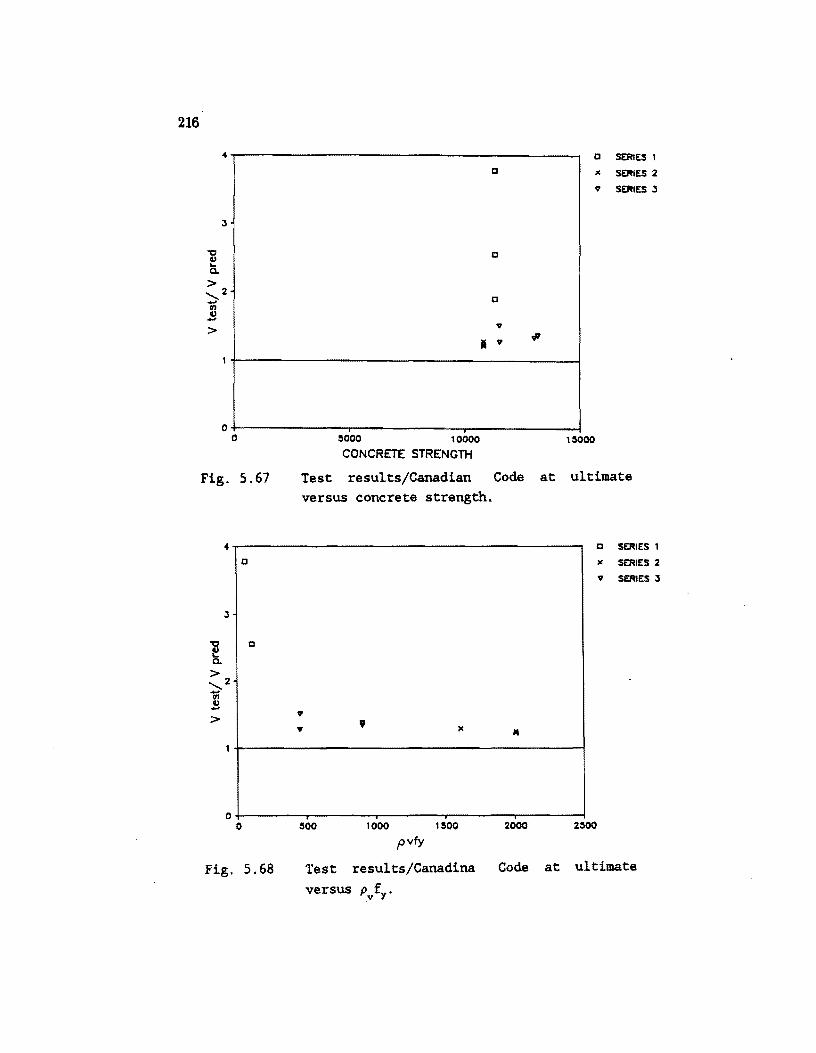
216
4 a SERIES 1
c x SERIES 2
<go SERIES :3
:3
-c a Q) ... a. > ,2 a -III ~ > V
Ii <go .p
o+------------,------------~----------~ o
Fig. 5.67
4
a
:3
-c a Q) ... a. > ,2 -III Q) ->
0 0
Fig. 5.68
~ooo 10000
CONCRETE STRENGTH
Test results/Canadian versus concrete strength.
v v
,
:500 1000 1~00
pvfy
Test results/Canadina
versus Pvfy'
1~000
Code at ultimate
a SERIES 1
x SERIES 2
v SERIES :3
2000 2:500
Code at ultimate
217
specimens which had shear- anchorage failures were acceptable. Specimen 3-4 with its
web crushing was the mcst conservative of this series. The data shows the same trend
for increasing Pv/Jl as noted for tests reported in the literature. The predictions show
compara.ble conservatism between groups as well. The theory that the high conservatism
for specimens with low shear is due to improper accounting of a concrete contribution
seems to have even more support. More importantly, the method is conservative for
values of shear reinforcement far in excess of reinforcement values that will be allowed
in actual practice.
5.3.4.4 TrlUB model. The procedures used to evaluate the specimens with the
Ramirez truss model are the same as described in Section 3.6.4.3. Table 5.4 contains
the cracking loads and the maximum concrete contribution allowed. This comparison is
merely a check to see that the limit placed on V c is conservative. The limit is conservative
in all cases and very much so for Series 2. Figure 5.69 shows the results versus concrete
strength. Figure 5.70 shows the results against fpt:. This figure indicates that the method
does not properly account for the effect of prestress. Conservatism increases rapidly as
fpc increases.
The main analysis with the truss model is for the ultimate capacity of girders
with stirrups. Table 5.5 contains the results for be&IIII with stirrups. All of the predicted
~alues are conservative. The test/predicted values plotted against concrete strength
give little information (Fig. 5.71). Plotting the results versus Pv/Jl indicates some very
interesting behavior (Fig. 5.72). Specimens with light shear reinforcement were quite
conservative although not to the extent noted in the literature. Specimens 3-3 and 3-4
with moderate shear reinforcement were conservative but much less so than the Series
1 be&IIII. All the other specimens became more conservative as Pv/Jl increased. When
computing capacities the reason for this quickly becomes apparent. For girders with heavy shear reinforcement the Ramirez truss model limit on the stress in the compression
diagonals places constraints on Q. The higher Pv/, is, the higher Q must be to keep fd below 30v'l!. Table 5.5 indicates that something is clearly wrong. Specimen 2-1 with
p"l, = 1610 psi has a computed capacity of 54.8 kips while Specimens 2-2 and 2-3
with Pv I, = 2010 psi have a computed capacity of 52.5 kips. Given two otherwise
identical beams it is unreasonable to expect less capacity out of the one with more shear
reinforcement. At the very least the be&IIII should give the same capacity. Again the
arbitrary 30....(lf, limit on the compressive strut stress imposes a severe limit.
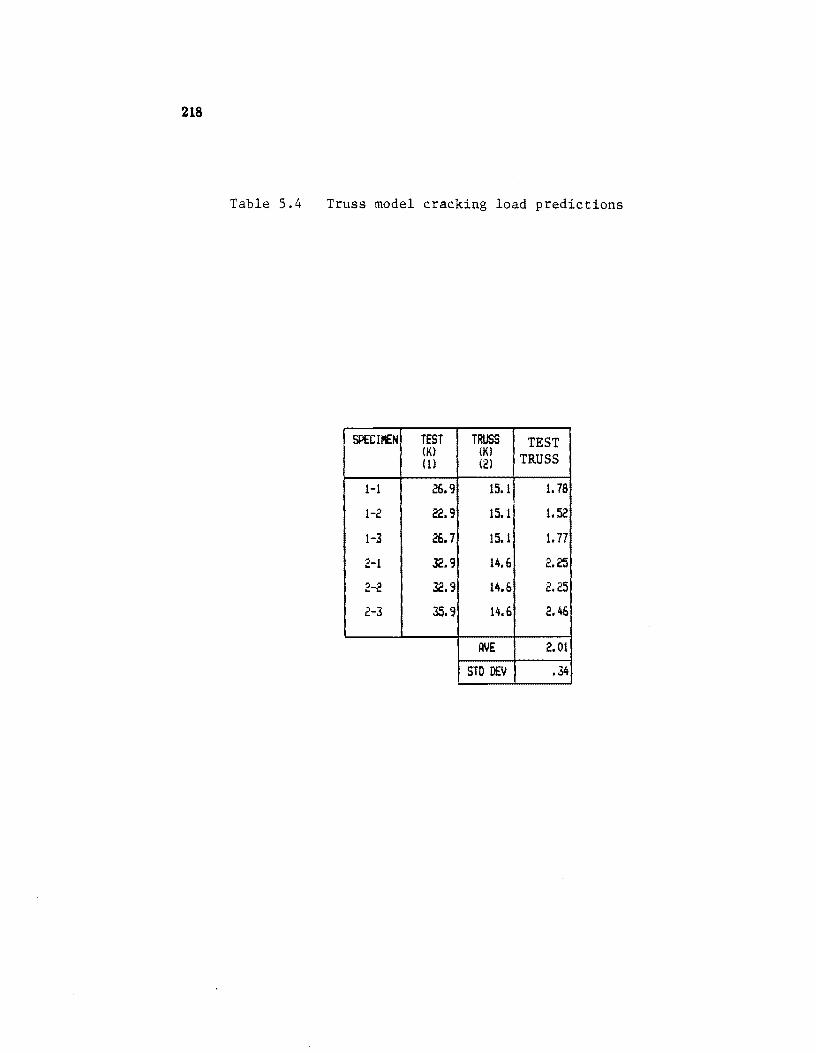
218
Table 5.4 Truss model cracking load predictions
SPECIMEN TEST TRUSS TEST (K) (Kl TRUSS (1) (2)
1-1 26.9 15.1 1.78
1-2 22.9 15.1 1.52
1-3 26.7 15.1 1.77
2-1 32.9 14.6 2.25
2-2 32.9 14.& 2.25
2-3 35.9 14.6 2.4&
AVE 2.01
STD DEV .34
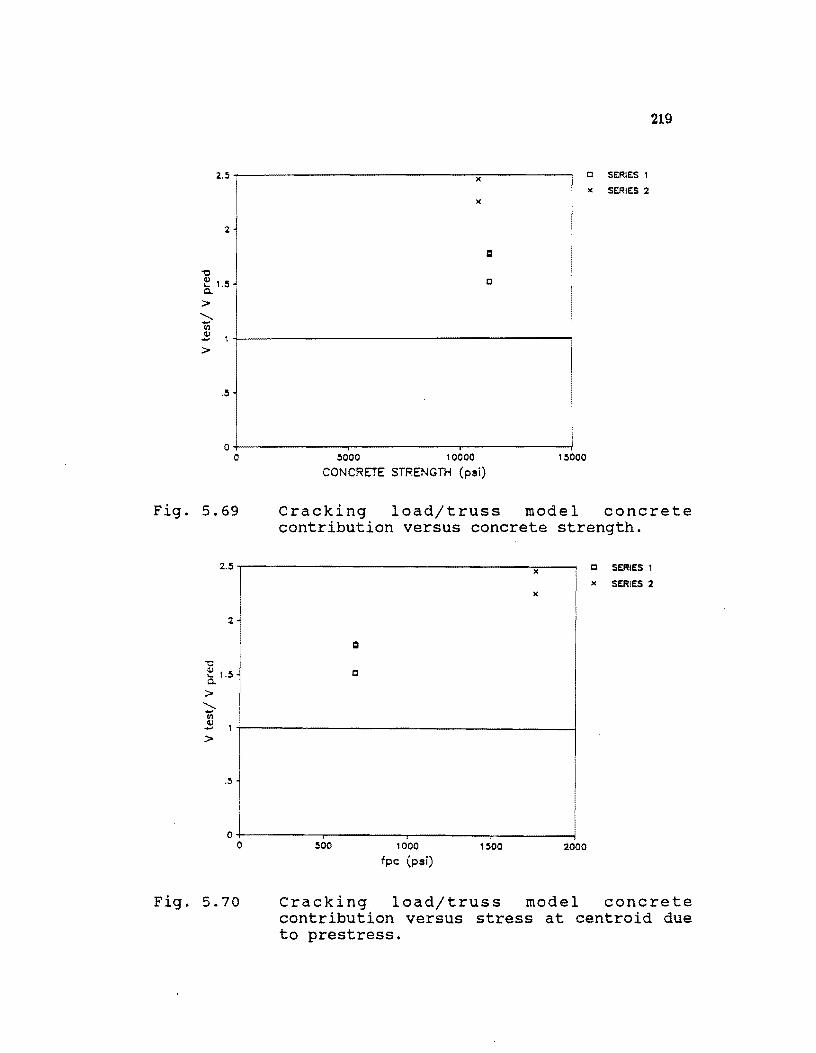
2.5..,..---------------""'x-------.
2
"0 ~ 1.5 c..
;::.
':::> (/l
x
c
~ t+--------------------~ ;::.
.5
O+-------~-------r_------~ o 5000 10000 15000
CONCRETE STRENGTH (psi)
219
C SERIES 1
)( SERIES 2
Fig. 5.69 Cracking load/truss model concrete contribution versus concrete strength.
2.5 -r-----------------------,x;;----, C SERIES 1
"0 V ls.. 1.5
;::.
.......... -(/l
)( SERIES 2 )(
c
~ lr-----------------------~ ;::.
.5 i I o+-----.--------.-----~----~ o
Fig. 5.70
500 1000
fpc (psi) 1500 2000
Cracking load/truss model concrete contribution versus stress at centroid due to prestress.
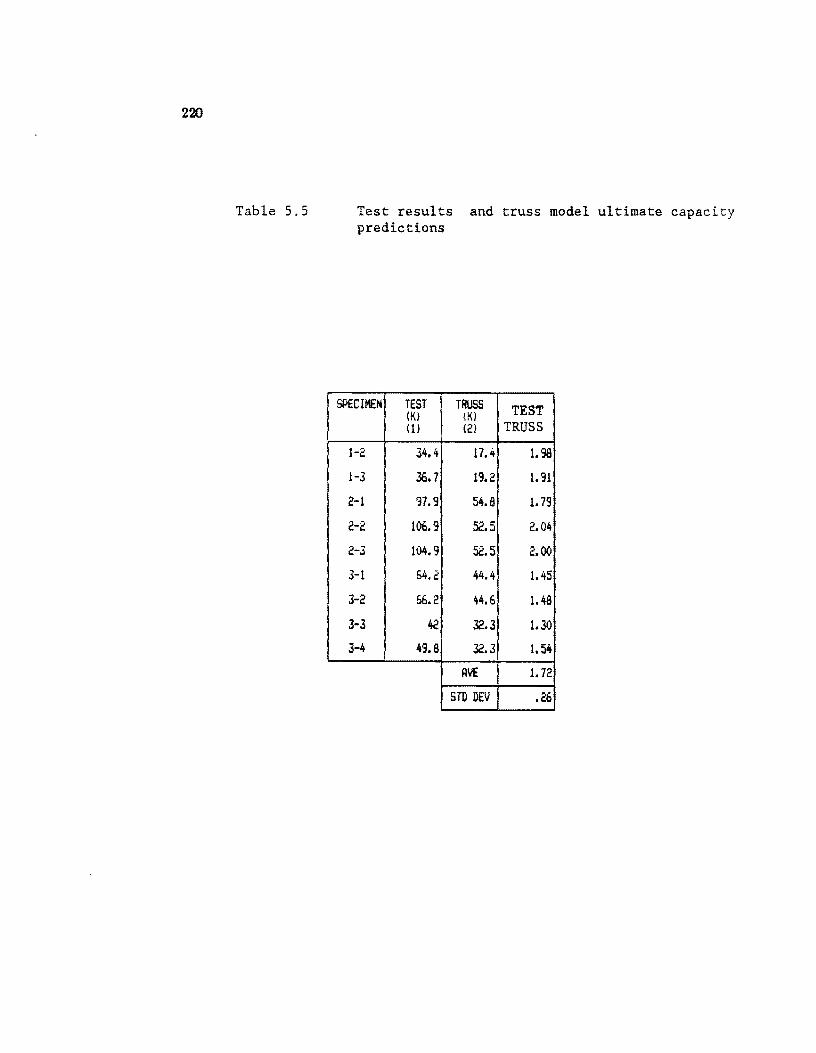
220
Table 5.5 Test results and truss model ultimate capacity predictions
SPECIMEN TEST TRUSS TEST (K) (K) (1) (2) TRUSS
1-2 34.4 17.4 1.98
1-3 36.7 1'3.2 1. '31
2-1 '37.'3 S4.S 1.7'3
2-2 106.'3 52.5 2.04
2-3 104.9 52.5 2.00
3-1 1;4.2 44.4 1.45
3-2 bb.2 44.6 1.4S
3-3 42 32.3 1.30
3-4 49.8 32.3 1.54
AVE 1.72
STD DEV .26
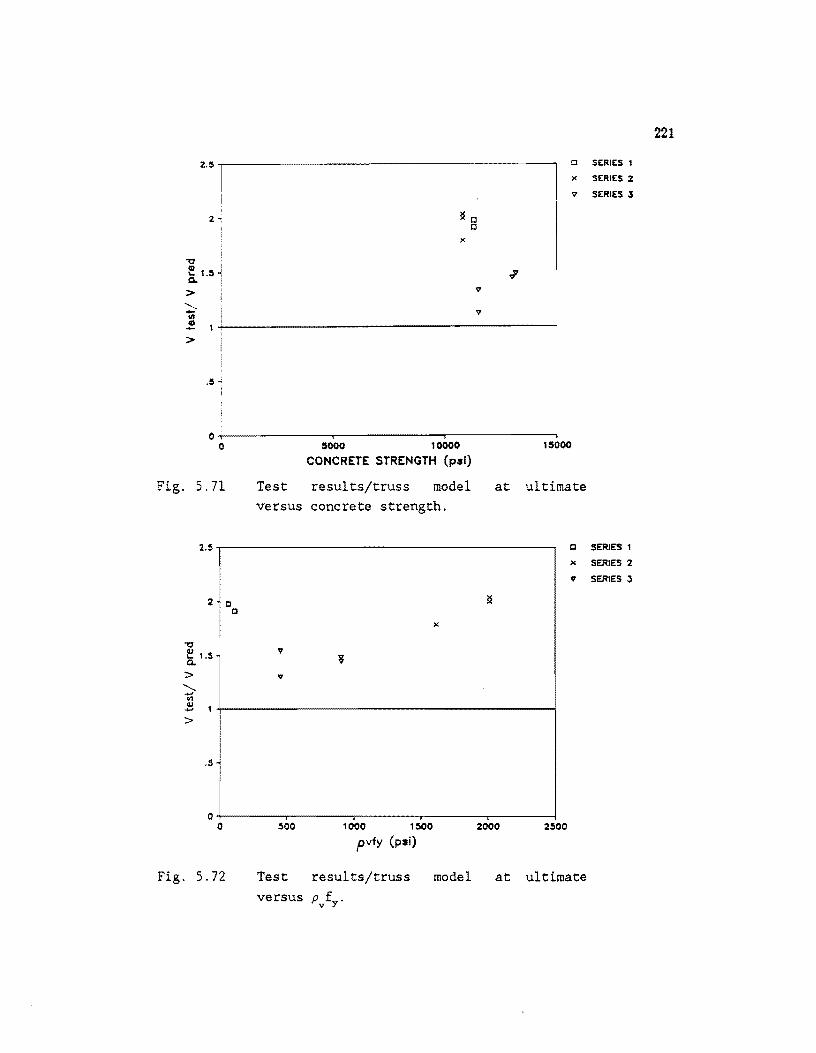
>
2 . .5 ,..-----------------------------,
2
x
v
.5
O+-------~I---------~Ir_-------~.
c SERIES 1
x SERIES 2
v SERIES.'5
5000 10000 15000
CONCRETE STRENGTH (psi)
Fig. S. 71 Test results/truss model at ultimate
>
Fig.
versus concrete strength.
2.,s .,----------------------------r o SERIES 1
x SERIES 2
v SERIES J
2 c o
.S
0 0
S.72
v
,s00
Test versus
x
1000 1500 2000 2500
pvfy (psi)
results/truss model at ultimate
Pvfy'
221
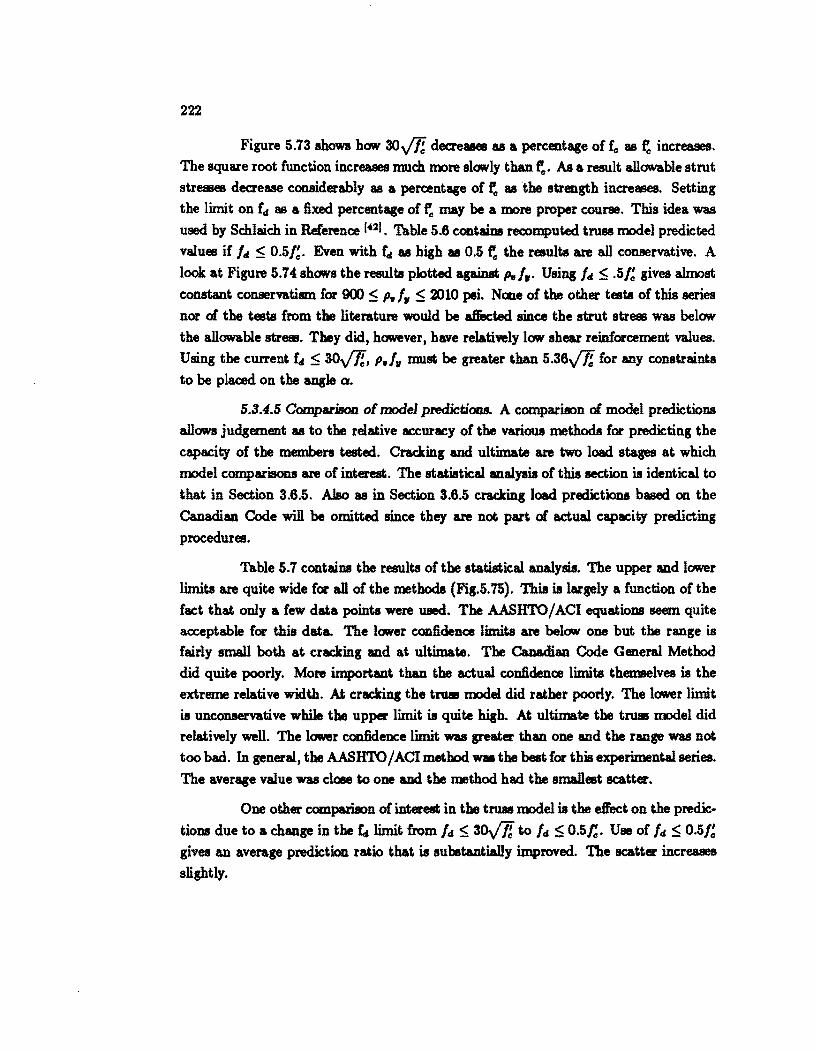
222
Figure 5.73 shows hOW' 3O../lI deaeases as a percentage of t as t:: increases.
The square root function increases IlDlch more slowly than t::. As a result allowable strut
strelJ3es deaease considerably as a percentage of t:: as the strength increases. Setting
the limit on fd as a fixed percentage of t:: may be a more proper course. This idea was used by Schlaich in Reference 1·::11. Table 5.6 containa recomputed truss model predicted
values if Id ~ 0.5/!. Even with td as high as 0.5 t:: the results are all col18ervative. A
look at Figure 5.7-4 shows the results plotted againat po, I,. Using Id ~ .5/! gives almost constant COl18ervatism for 900 ~ p.l, ~ 2010 pei. None of the other tests of this series
nor of the tests from the literature would be afl'ec:ted since the strut stre1J3 was belOW'
the allowable strelJ3. They did, however, have relatively lOW' shear reinforcement values.
Using the current fd ~ 30Vl!, p.l, must be greater than 5.36Vl! for any constraints
to be placed on the angle Q.
5.3.4.5 Comparison of model predictiOllB. A comparison of model predictions
allOW'S judgement as to the relative accuracy of the various methods for predicting the
capacity of the members tested. Cracking and ultimate are two load stages at which
model comparisons are of interest. The statistical analysis of this section is identical to
that in Section 3.6.5. Also as in Section 3.6.5 cracking load predictions based on the
Canadian Code will be omitted since they are not part of actual capacity predicting
procedures.
Table 5.7 containa the results of the statistical analysis. The upper and lower
limits are quite wide for all of the methods (Fig.5.75). This is largely a function of the
fact that only a few data points were used. The AASHTO / ACI equations seem quite
acceptable for this data. The lower confidence limits are below one but the range is
fairly small both at cracking and at ultimate. The Canadian Code General Method
did quite poorly. More important than the actual confidence limits themselves is the
extreme relative width. At cracking the tl'U8ll model did rather poorly. The lower limit
is unconservative while the upper limit is quite high. At ultimate the tl'U8ll model did
relatively well. The lower confidence limit was greater than one and the range was not
too bad.. In general, the AASHTO / ACI method was the best for this experimental series.
The average value was dOle to one and the method had. the smallest scatter.
One other comparison of interest in the tlUll model is the effect on the predic
tions due to a change in the td limit from Id ~ 30Vl! to Id ~ 0.5f::. Use of Id ~ 0.5/~ gives an average prediction ratio that is substantially improved. The scatter increases
slightly.

.71--------;---------~
.6
o .... ........... . 5 ,.-.. o -....-f-
0::: o ~.4 o r")
.J
.2+1-------------.--------------.-------------.-------------~ o
Fig. 5.73
5000 1 0000 15000
CONCRETE STRENGTH (psi)
Allowable diagonal compression strut stress as a percentage of
~ versus f~.
20000
~ CAlI
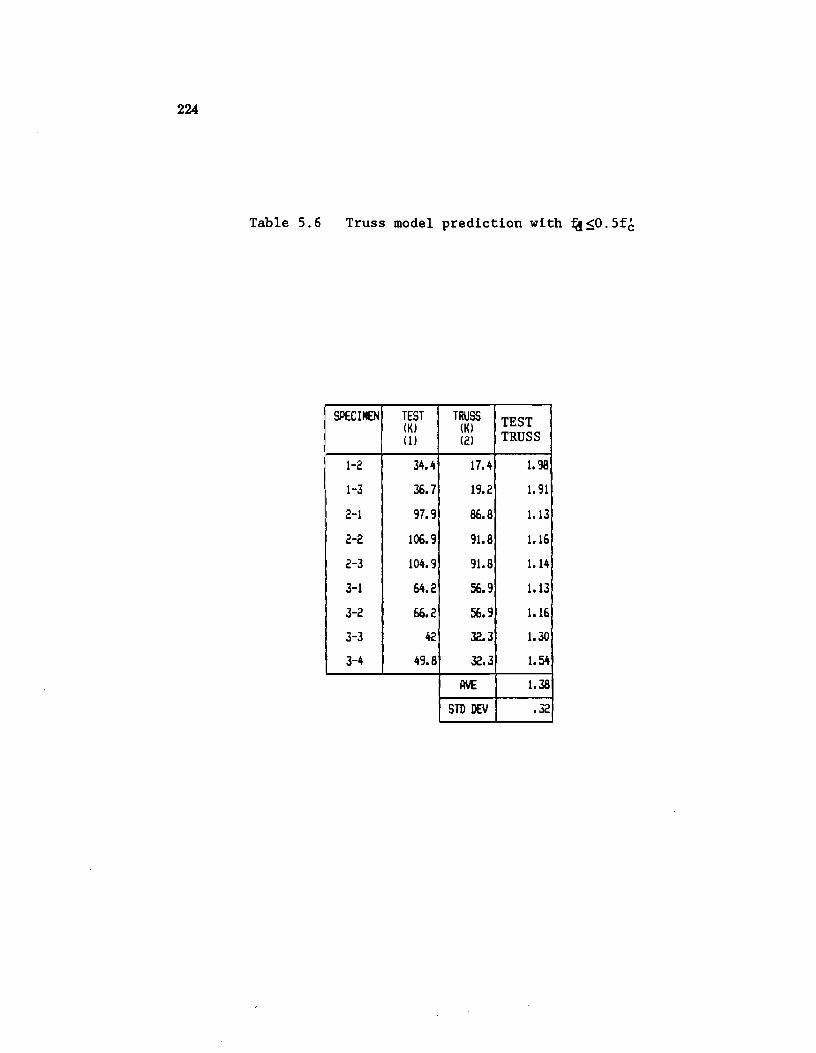
224
Table S. 6 Truss model prediction with i(f ~O. Sfc
II SPECIMEN TEST TRUSS TEST (KJ (KJ (1) (21 TRUSS
I' II 1-2 34.4 17.4 1.98 I
1-3 36. 7 19.2 1.91
II 2-1 97.9 86.8 1.13
2-2 106.9 91.8 1.16
2-3 104.9 91.8 1.14
3-1 64.2 56.9 1.13
3-2 66.2 56.9 1.16
3-3 42 32.3 1.30
3-4 49.8 32.3 1.54
AVE 1.38
STD DEV .32
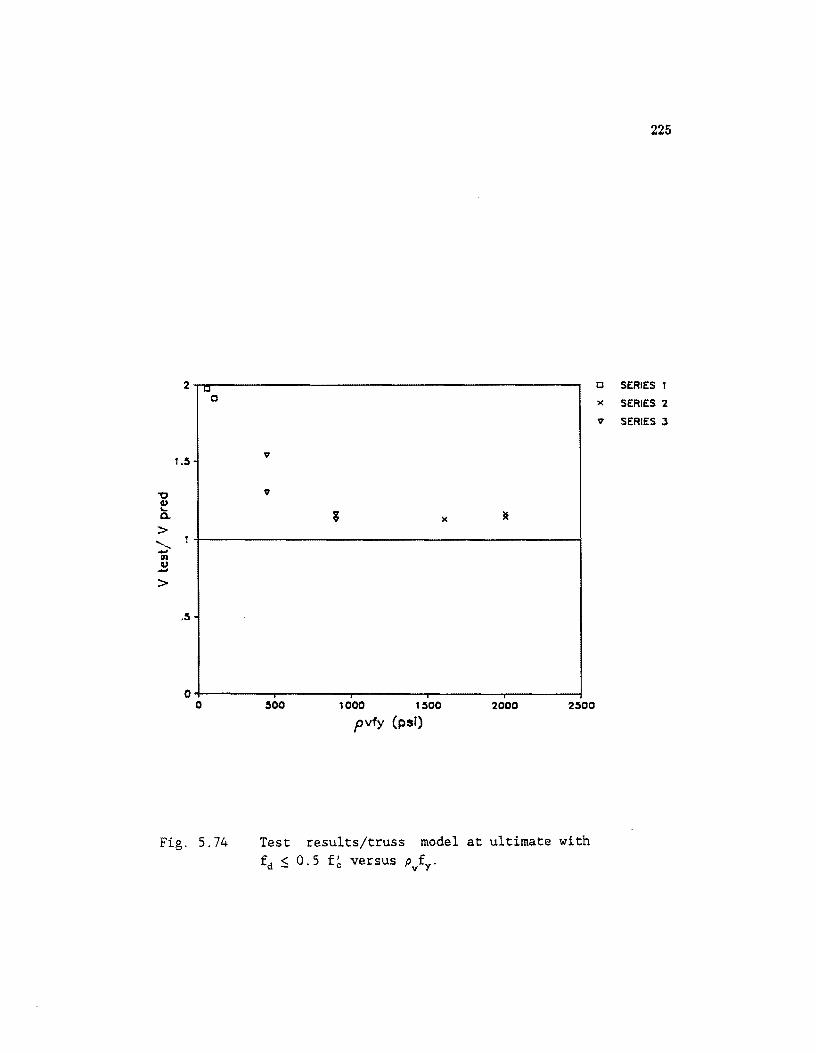
2 I;;J
0
1.S V
'1:1 V CI,) .... a. x > """-....
en CI,) .... >
.S
O+-------~--------r_------~------~~------~ o
Fig. 5.74
SOO 1000 1S00 2000 2S00
pvfy (psi)
Test results/truss model at ultimate with fd ~ O. 5 f~ versus p/y.
225
0 SERIES 1
x SERIES 2
V SERIES J
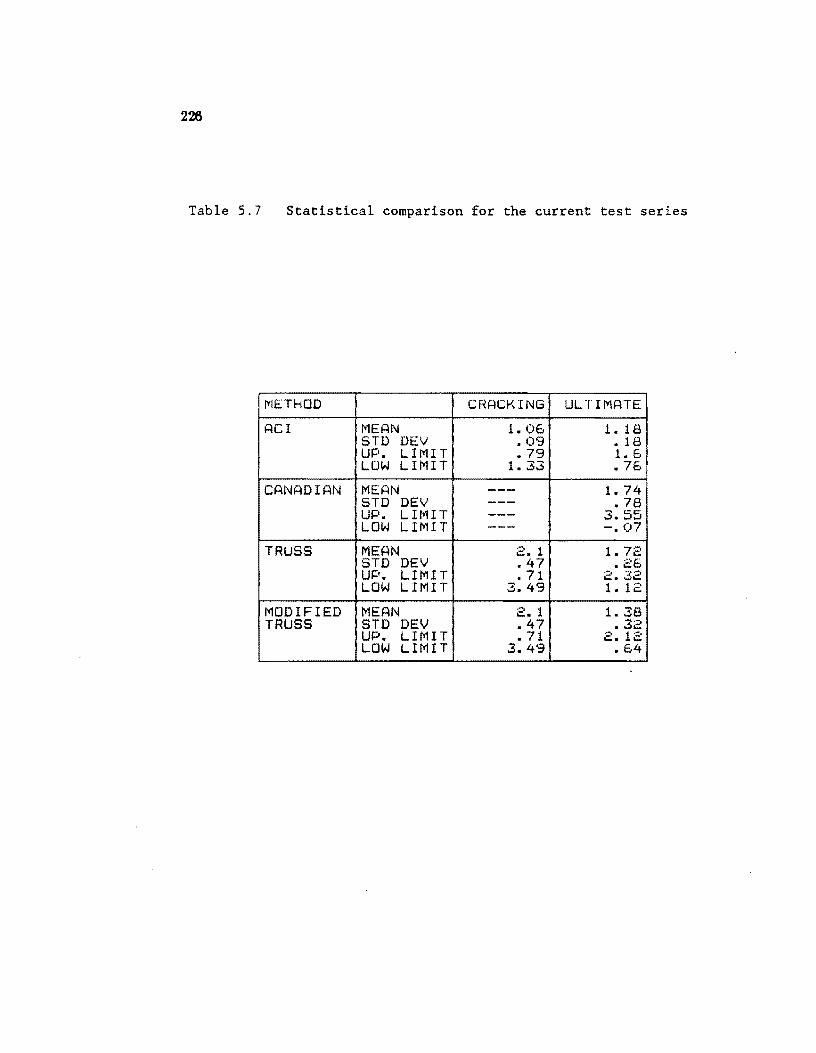
226
Table 5.7 Statistical comparison for the current test series
I"IETHOD CRACKING ULTIMATE
ACI MEAN 1. 06 1. 18 STD DEV .09 • 18 UP. LIMIT .79 1.6 LOW LIMIT 1. 33 • 76
CANADIAN MEAN --- 1.74 STD DEV --- .78 UP. LHrlIT --- 3.55 LOW LIMIT --- -.07
TRUSS MEAN 2. 1 1. 72 STD DEV .47 .26 UP. LIMIT • 71 2.32 LOW LIMIT 3.49 1. 12
MODIFIED MEAN 2. 1 1. 38 TRUSS STD DEV .47 .32
UP. LIMIT • 71 2.12 LOW LIMIT 3.49 .64
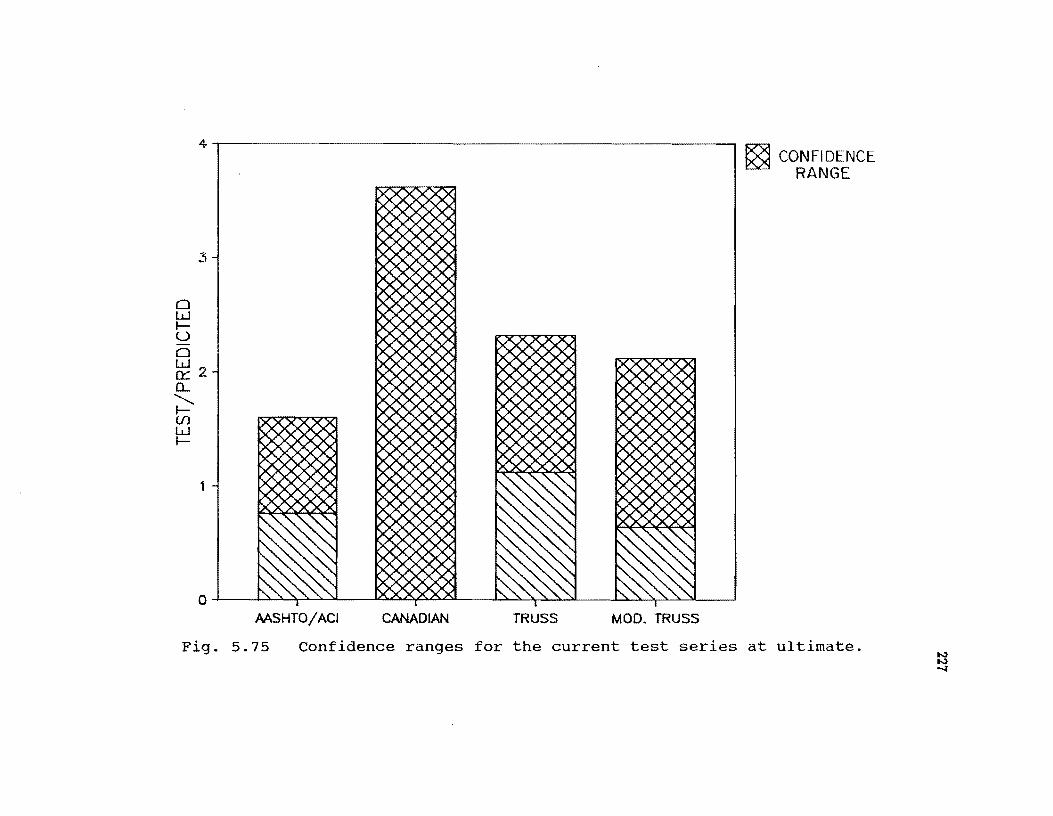
4 I I ~ CONFI DENCE RANGE
o W IU
3
o w 0::: 2 (L
;:: Ul W I-
1
o J , ') " '\" '\ " 10, '" 0.0. 0. AI I " '" "" " "),1 I ;:,. ,. >," '- '"
AASHTO/ACI CANADIAN TRUSS MOD. TRUSS
Fig. 5.75 Confidence ranges for the current test series at ultimate. ."" ."" -:r
228
The question arises over hOW' a set of empirical equations can give more accu
rate results than supposedly rational and physically based models. The AASHTO/ ACI equations were originally derived and calibrated to existing test data. Given a reason
ably complete set of primary variables iocluding Coocrete strength, longitudinal rein
forcement, shear reinforcement, prestre811 force, and shear span- to-depth ratio, fairly
accurate results could be expected. In high strength concrete, concrete strength is the
only variable which has changed. More importantly the relationship between compres
sive strength and tensile strength stays about the same for high strength concrete. Given
this it is not extraordinary that the current AASHTO / ACI equations give good results.
The question then is why do the Canadian Code General Method and truss
model do poorly? For this discussion 111 ~ 0.5f! will be used. Figures 3.38, 3.43, 3.46,
5.66, 5.68, and 5.72 show an interesting trend. There is extreme conservatism for low
p"I'1I decreasing to near unity for higher p.I'1I' If Specimens 1-2 and 1-3 from the current test series are omitted, the average test/predicted ratio for the Canadian model would
be 1.32 with a standard deviation of 0.10. If the same were done with the truss model,
the average would be 1.22 with a standard deviation of 0.15. Improvements in average
performance would be noted in tests reported in the literature as well if tests with very
low p" I'll were excluded. As a practical matter, however, most beams are at the lOW' end
of the p"I'1I scale. This me8D8 that both the Canadian Code and the truss model have a serious practical weakness. They do not properly aocouot for concrete's contribution to
shear capacity for lOW' values of p.I.,. At higher values of P. I., the variable angle truss
models can give an accurate prediction of shear capacity. Very interestingly, concrete
strength is not the principal variable as witoeased by the lack of trends evident when strength rat ice were plotted versus concrete strength.
The Canadian Code General Method does not currently have any avenue
through which to improve its perfa:mance at lOW' values of p.I". This is a very se
rious practical weakoesa to the whole method. The truss model on the other hand has the framework in place to handle this difficulty. Increasing the allOW'able Veto more
realistic values and possibly extending the transition zone would allOW' this model to
give very good results. From Tables 3.9 and 3.10 it can be Been that the current maxi
mum contribution allowed by the truSB model gave average values of 1.67 and 2.38 for
reinforced and prestressed beams respectively. Improving these predictions would likely
improve predictions at law p.l" enough to make the tnlSl model a viable, practical
model.
CHAPTER 8 SUM:M'ARY AND CONCLUSIONS
6.1 Summary of Results
6.1.1 Exper1meutal program. The experimental portion of this project
consisted. or ten pretensioned high strength concrete girders. The girders were built with
widely varying levels of shear reinforcement. This allowed behavioral observations to
be made on members with very low, medium, and very high shear reinforcement levels.
By varying shear reinforcement and support locations three separate failure modes were
observed.
A number of observations and measurements were made during testing. De
termination of the cracking load was of particular importance since current American
practice 88Bumes this is the concrete's contribution to shear capacity. Load-deftection
behavior for the beams was observed as well. A number of internal strain measurements
were taken. The strain readings gave an indication of internal behavior and thereby were
of use comparing shear model 88Bumptions and actual behavior. Additionally, observa
tions were made on crack angles and crack widths. This gave information on how the
concrete was working under load. Comparing various tests indicated behavioral changes
that occurred as the shear reinforcement and support locations changed.
8.1.2 Model camparlsQlUl.. A number of shear capacity models were eval
uated. The evaluations consisted of a description of underlying 88Bumptions and a
comparison of these 88Bumptions to observations made during the experimental portion
of this program. The models evaluated ranged. from highly empirical, such as current
AASHTO/ACI methods, to highly theoretical, like the plasticity models.
A comparison was also made between the model capacity predictions and ac
tual capacity obtained from tests. The shear tests on high strength concrete reported.
in American literature and the results of the current test program were used for this
comparison. Both reinfc:rced and prestressed results were analyzed to determine if ma
jor differences in conservatism of model predictions were occurring for high strength
concrete. The last step was to compare the relative accuracy of the various models.
6.2 Concluslons
Evaluation or the experimental portion of this program gives rise to the fol
lowing conclusions:
229
230
1. Stirrups generally reach yield even when the beam has shear reinforcement
values on the order of 19.3V7t.
2. Stirrups see very small strains until after shear cracking.
3. Crack widths are highly dependent upon the quantity of shear reinforcement.
4. Number and extent of cracks are dependent upon level of shear reinforcement.
S. Bottom rows of strands shaw little or no slip until shortly before shear
anchorage failures. Middle rows of strands show slow gradual slip throughout
loading.
6. Two types of crushing failures can occur. They are crushing of individual struts
for moderate levels of shear reinforcement or a compression field crushing for
very heavy shear reinforcement.
7. Shear-anchorage failures were the primary mode of failure of prestressed beams
without support overhangs. This was accentuated. by poor modelling of strand
development but needs to be carefully checked. in prototype applications.
8. Prestressing strands did not reach yield within the shear span for any of the
tests.
From model comparisons the following additional conclusions can be drawn:
1. AASHTO / ACI, the 1984 Canadian Code General Method, and the truss model
all give generally conservative predictions of high strength concrete's shear
capacity. This includes high strength concrete tests reported in the literature
and those conducted by this project. This indicates that the methods are
acceptable for concrete strengths to at least 12000 psi.
2. AASHTO/ACI gives the most accurate results with the least scatter of the
three methods.
3. AASHTO/ACI becomes slightly unconservative in the range of V, = 19.3V7t.
4. There are no strong trends apparent in the conservatism of the three methods
related to increases in concrete strength.
S. Both the 1984 Canadian Code General Method and the truss model show
decreasing conservatism as PV/1I increases.
231
6. The Canadian Code General Method is very conservative at law p" I'll values.
For reinforced beamB this is p"I'II :5 100 psi and for prestressed beams p"I'II :5 350 psi.
7. The truss model is very conservative for prestressed beamB with p" 111 less than
350 psi.
8. The Canadian Code General Method and the truss model are conservative for
tests with high p" I II values.
9. The truss model, with the current limit on fd , is unable to properly predict
capacities for high strength concrete beams with very heavy shear reinforce
ment.
10. Based on this study the truss model allowable stress in the compression diag
onals could conservatively be raised to 0.5 fe.

!!!!!!!!!!!!!!!!!!!"#$%!&'()!*)&+',)%!'-!$-.)-.$/-'++0!1+'-2!&'()!$-!.#)!/*$($-'+3!
44!5"6!7$1*'*0!8$($.$9'.$/-!")':!
APPENDIX A
This Appendix contains information about the high strength concrete used
throughout this project. Table A.I gives material properties for the various concrete
constituents. Table A.2 contains the batch weights and some physical properties for the
concrete. It should be noted that the quantities of water reducing and retarding agents
and high range water reducers used were dependent upon the temperature on the day of cast.
233
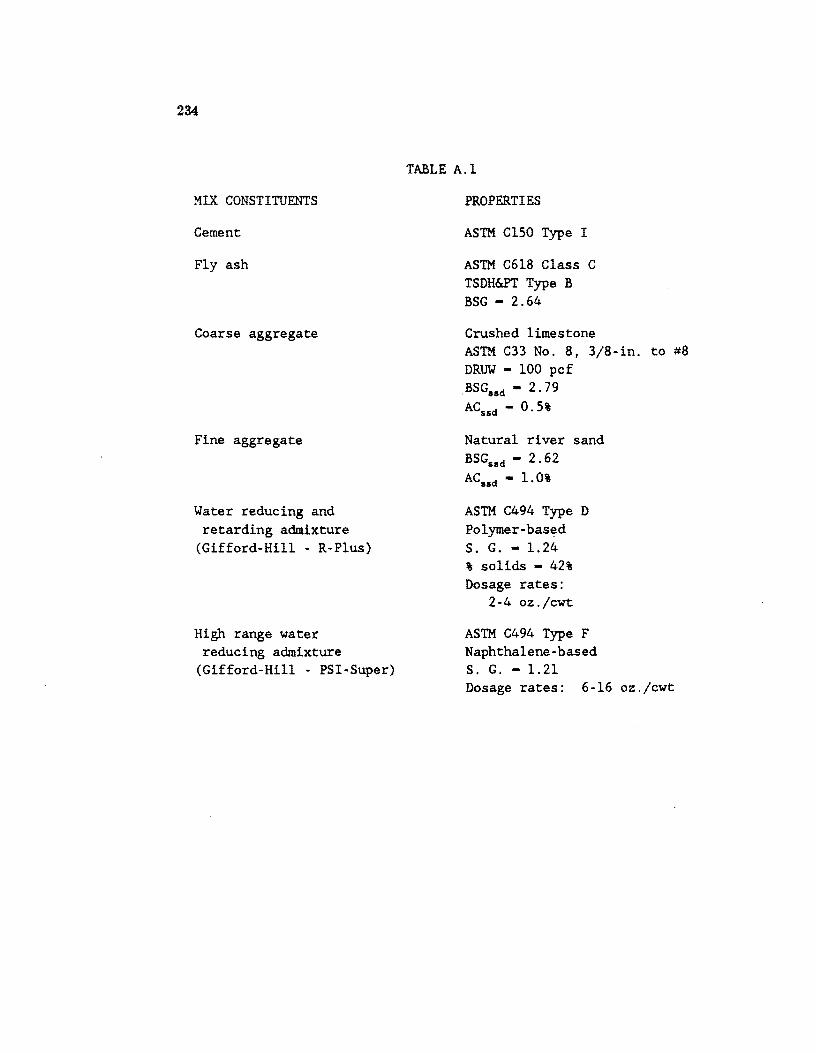
234
MIX CONSTITUENTS
Cement
Fly ash
Coarse aggregate
Fine aggregate
Water reducing and retarding admixture
(Gifford-Hill - R-Plus)
High range water reducing admixture
(Gifford-Hill - PSI-Super)
TABLE A.l
PROPERTIES
ASTM CISO Type I
ASTM C6l8 Class C TSDH&PT Type B BSG - 2.64
Crushed limestone ASTM C33 No.8, 3/8-in. to #8 DRUW - 100 pcf BSGSSci - 2.79 ACssci - 0.5%
Natural river sand BSGSSci - 2.62 ACssci - 1.0%
ASTM C494 Type D Polymer-based S. G. - 1.24 % solids - 42% Dosage rates:
2-4 oz./cwt
ASTM C494 Type F Naphthalene-based S. G. - 1.21 Dosage rates: 6-16 oz./cwt
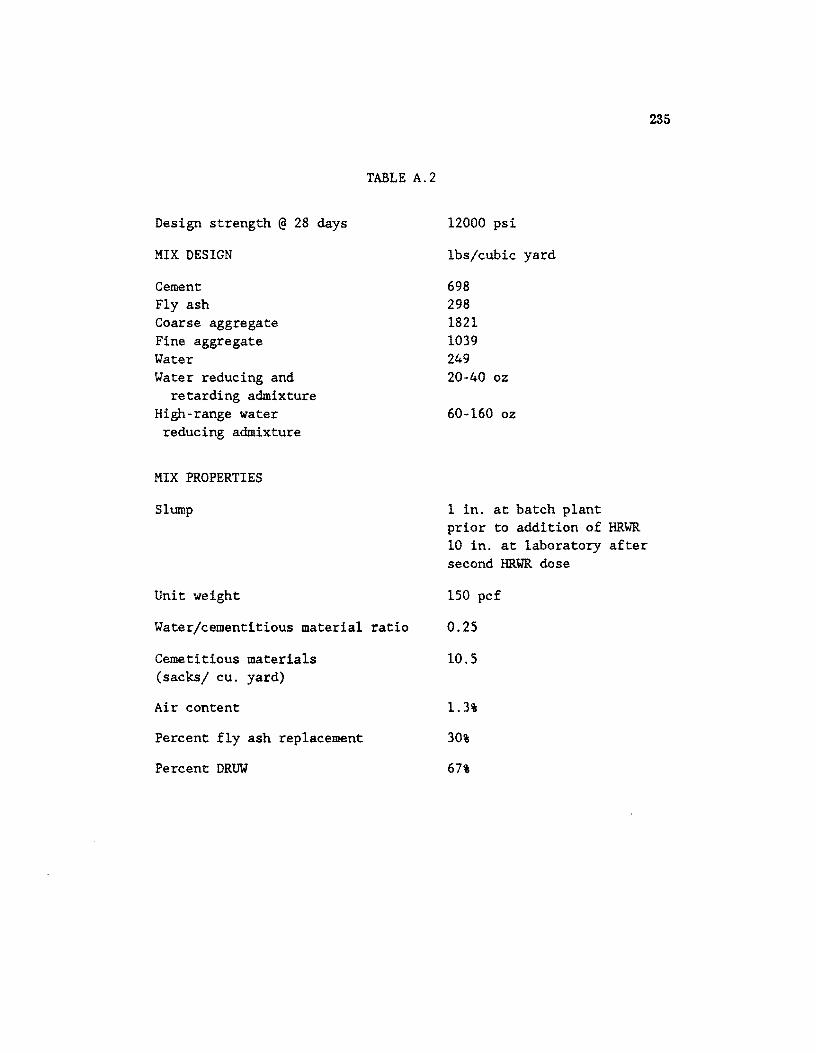
Design strength @ 28 days
MIX DESIGN
Cement Fly ash Coarse aggregate Fine aggregate Water Water reducing and
retarding admixture High-range water
reducing admixture
MIX PROPERTIES
Slump
Unit weight
TABLE A.2
Water/cementitious material ratio
Cemetitious materials (sacks/ cu. yard)
Air content
Percent fly ash replacement
Percent DRUW
12000 psi
1bs/cubic yard
698 298 1821 1039 249 20-40 oz
60-160 oz
1 in. at batch plant prior to addition of HRWR 10 in. at laboratory after second HRWR dose
150 pcf
0.25
10.5
1.3%
30%
67%
235

!!!!!!!!!!!!!!!!!!!"#$%!&'()!*)&+',)%!'-!$-.)-.$/-'++0!1+'-2!&'()!$-!.#)!/*$($-'+3!
44!5"6!7$1*'*0!8$($.$9'.$/-!")':!
APPENDIXB
Development refers to the general topic of the transfer of force between the
steel and the concrete in reinforced and prestretBe<i concrete. The tenn development
length refers to the distance required for the force transfer. KnO'Nledge of the develop
ment characteristics of the reinforcement used is important since it indicates the location
that the full capacity of the reinforcement can be counted on. H the full capacity is not
available, knowledge of the percentage that can be obtained is important. The devel
opment length of prestressing strands is the area of current interest. Only pretensioned
members will be discus.sed herein. The development of prestressing strands consists of
two distinct mechanisms. The first is termed transfer and the second is flexural bond.
The discussion will begin with a coverage of the two development mechanisms
followed by factors that affect them. The current equations for development will be
covered. Then a comparison of model and prototype development lengths will be made.
The first development phase is transfer. 'Iransfer occurs when the prestress
ing strands are released from the supports which held them during casting. Since the
prestressing strands are tensioned they try to contract to their original length. The
concrete resists this contraction and forces are transferred between the strands and the
$:oncrete until equilibrium is achieved. The equilibrium condition in the strand is one
of zero stress at the exterior of the concrete increasing to the effective prestress force
at the end of the transfer length. Friction between the concrete and the steel is generally attributed the greatest importance in transfer [B3,Ba,BG,Bt:iI]. When a prestressing
strand is originally tensioned the crosa-sectional area decreases slightly. Upon release
the strand tries to shorten. As it does so, the diameter of the strand increases. This
is called the Hoyer effect. IB 131. The increase in crcu-section causes a radial pressure
to develop against the hardened concrete. A high friction force is present as the strand
tries to move into the concrete due to this radial pressure. This friction is enough to
prevent further slip of the strand into the concrete and thereby provide transfer.
The second development phase is flexural bond. Flexural bond mechanisms are activated alter cracking when steel stresses in excess of the effective prestress stress
are required for equilibrium. This added stress must be transferred to the concrete. The
mechanisms of flexural bond must be different than those of transfer since the strand constricts as it elongates [Ba,BGI. Two mechanisms are thought to be at work in flexural
bond. The first is adhesion between the concrete and the steel. This comes from concrete
237
238
filling the irregularities in the steel surface. This is generally felt to be of fairly minor
importance. The second mechanism of flexural bond is mechanical resistance. The helical shape provides a nonuniform croea- section that allows for mechanical resistance.
This mechanical resistance is, however, fairly low ainc~ the strand is able to twist in the
groove formed by the strand in the concrete. The mechanisma of flexural bond are not nearly as effective as those of transfer.
A number of factors have been found to affect the mechaniama described above
and thereby the development length. The most important parameter is the force to be
transferred. The larger the force in the strand, the larger the force to be transferred. The
size of the strand also effects the development length. The larger the strand, the greater
surface area there is for transfer. The surface condition of the strand can have an effect
on development. Research has shown behavior goes from good to bad for rusted, clear, and oiled strands. (B1,BI,BO). The literature has attributed only a small influence to
concrete strength. However, recent tests by Castrodale seem to contradict this IB 8,B 10) •
The method of release whether sudden or gradual can have a influence on transfer length.
The sudden release such as by flame cutting can considerably increase development length. (B 6,B 10,B 111. Proper consolidation has been found to be an important practical
method of obtaining good development characteristics IB 4o,B 61. Finally the amount of
cover has been found to effect perfonnance.
The ACI Code has several prO'lisioos dealing with the development length of
prestrealing strands. It calls for a development length of: 14. = (II" - (2/3) /"J}4 beyond the critical section where fp, and f,. are in kips per square inch and 1<J and db are inches. The added provision is given that if strands are debonded and there is tension in the concrete the length computed needs to be doubled. In the section on shear ACI calls
for a development length of 50 d". For computations of the concrete's contribution to shear, the prestreal can be .. umed to vary linearly from zero at the end of the member
to full prestreal at the end of the tr8ll8fer length.
The equation given for development length is a condensed form of the following:
This shows mere clearly the two phases of development discussed previously
(Fig. B-1). The firai term repraents the transfer length. The second represents the
length required for flexural bond. Each phase of development is shown to be a function
239
of a change in strefll times the strand diameter. These factors indicate the force to
be transferred and the surface area over which this transfer takes place are the most
important factors. It can be seen that transfer is three times as effective as flexural
bond. In this form it is also possible to see the origin of 50 diameters as used in the
shear provisions. When the original tests were conducted 25().ksi strands were conumn
as oppoeed to the current use of 27()"ksi strands. In both cases, given an initial prestrefll of.7 fpu and 20% losaes, transfer becomes 47 and 51 strand diameters respectively [Alll.
One major question is how 3/8" diameter strands in a 1/3 scale model test compare to 1/2" diameter strands in a prototype specimen. Table 8-1 shows a com
parison. It can be seen that the development of 1/2" strand in a prototype is poorly
modelled by the use of 3/8" strands in these 1/3 scale models. If the actual development
requirement of 3/8" strands is multiplied by the scale factor of 3, very long development lengths are required when compared to the development of 1/2" strand in a prototype.
In retrospect, these model girders were poorly scaled for strand anchorage. It can be
easily computed that the 3/8" strands would give a prototype development length 2.25 tirnes as long as the 1/2" strands.
While development in the prototype can be seen to be comparatively better
the possible failure mechanisms remain the same. Thus there still is a possibility that
debonding of strand might occur in the prototype as well as the model. This should
always be checked.
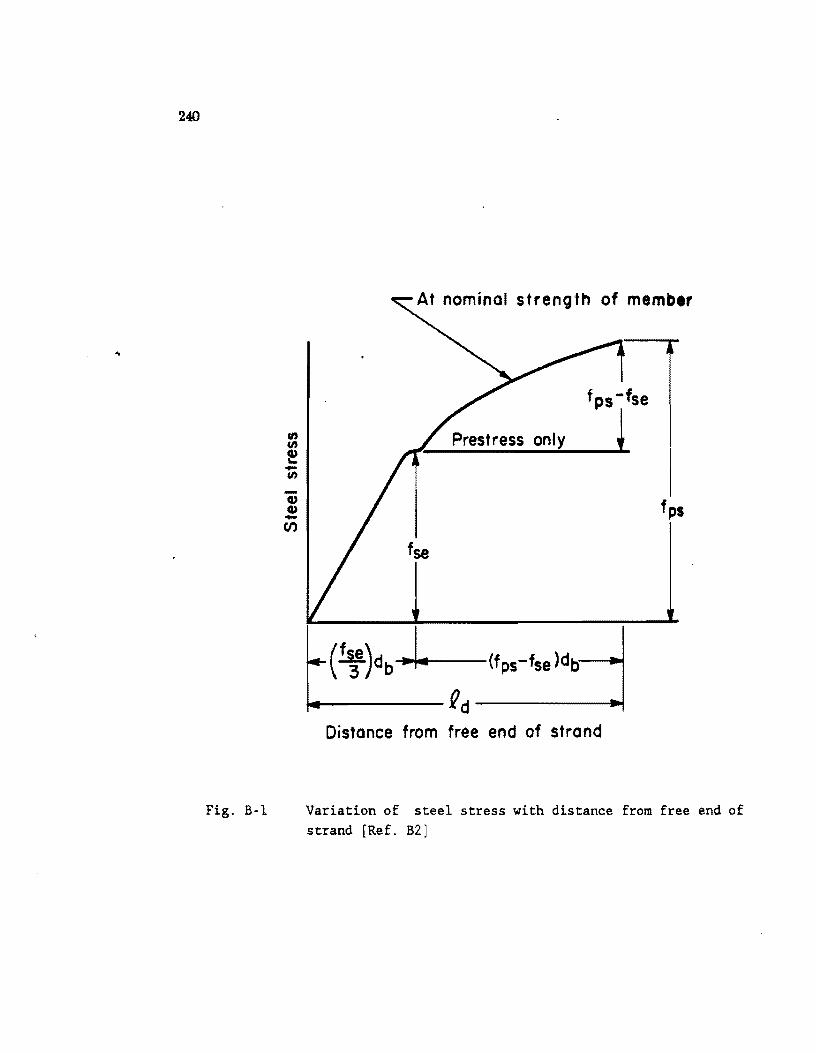
240
Fig. B-1
rn en ! -rn
CD CD -Cf)
At nominal streng'th of member
Prestress only
fse
~---------Rd------------~ Distance from free end of strand
fps
Variation of steel stress with distance from free end of strand [Ref. B2]
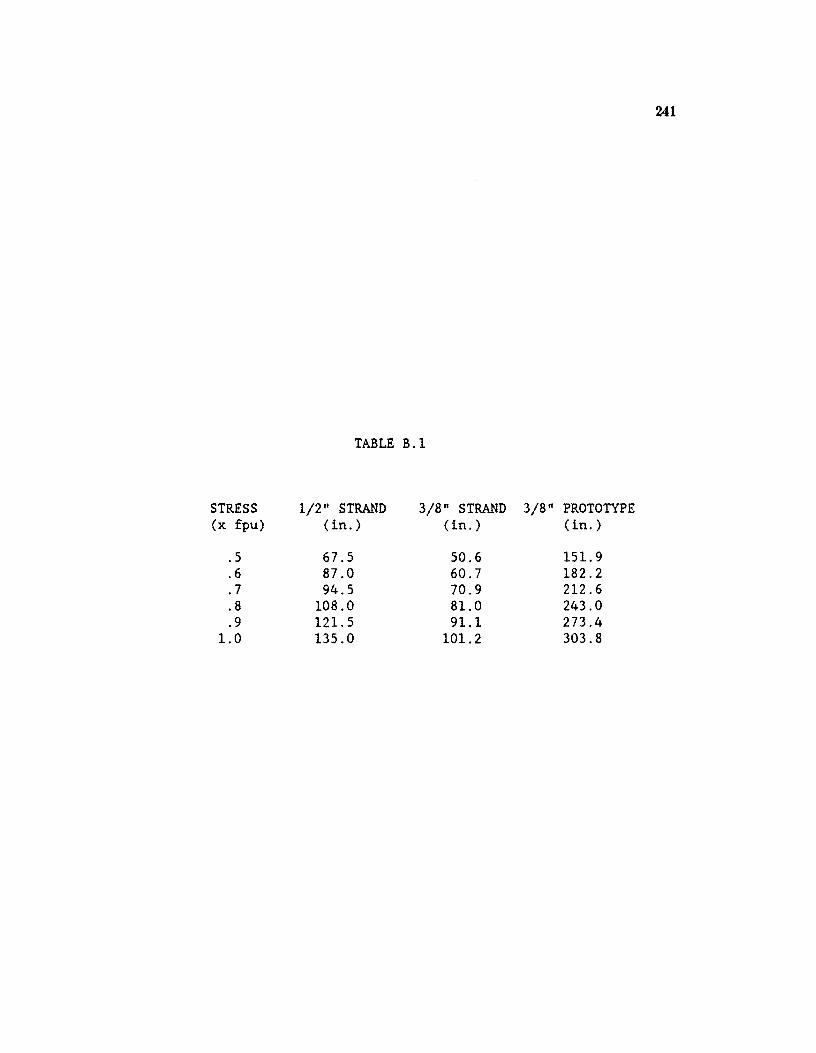
241
TABLE B.1
STRESS 1/2" STRAND 3/8" STRAND 3/8" PROTOTYPE (x fpu) (in. ) (in. ) (in. )
.5 67.5 50.6 151. 9
.6 87.0 60.7 182.2
.7 94.5 70.9 212.6
.8 108.0 81.0 243.0
.9 121. 5 91.1 273.4 1.0 135.0 101.2 303.8
242
REFERENCES
Bl. Amlrican Concrete Institute, Building Code Requirements for Reinforced Con
crete (ACI318-83), Detroit, 1983, ll1pp.
B2. Amlrican Concrete Institute, Commentary on Building Code Requirements for Reinforced Concrete (ACI 318-83), Detroit,.
B3. Badaliance, R. and Van Horn, D.A., "Ultimate Flexural Bond inBeams Pre
tensioned withHigh Strength Strands," Fritz Engineering Laboratory Report
No. 309.3, Lehigh University, Jan., 1967.
B4. Base, G.D., " An Investigation of the Use of Strand in Pretensioned Concrete,"
Research Report No. 11, Cement and Concrete Association, London, 1963.
B5. Base, G.D., "An Investigation of TtansmilBicm Length in Pretensioned Con
crete," Research Report No. 5, Cement and Concrete AIBociation, London,
August, 1958.
B6. Cutrodale, R.W., " " , unpublished Ph.D. d..iMertation, The University of Texas at Austin, ,.
B7. Hanson, N.W., "Influence of Surface RoughneuofPrestreuing Strand in Bond
Perfonnance," Journal, Preetresaed Concrete Institute, V.14, No.1, Jan.-Feb.
1969, pp. 32-45.
B8. Hanson, N.W. and Kaar, P.H., "Flexural Bcmdot' Pretensioned Prestressed Beams," ACI Journal, Proceedings, V. 55, No.7, January, 1959, pp. 78~803.
B9. Janney, J.R., "Nature of Bond in Pretensioned Prestressed Concrete," ACI
Journal, Proceedings, V. 50, No.9, May, 1954, pp. 717-736.
B10. Kaar,P.H., Lafraugh, R.W., and MaIIiI, M.A., "Influence of Concrete Strength on Stranad Ttamier Length," PCI Journal, V. 8, No.5, October, 1963, pp.
47-67.
BU. Swamy, R.N. and Anand, K.L., "TtansmilBicm Length and Prestreu Loesed in High Strength Concrete," Paper prtllented at the Seventh International
Congre811 olthe Federation Internationale de la Precontrainte, New York, N.Y.,
May-June, 1974.
243
B12. 'Thlin, L.G. and Al-Chalabi,M.M., "Bond Strength &8 a Function of Strand
Tension and Cement Paste Content for Lightweight Aggregate Concrete," ACI Journal, Proceedings, V. 66, No. 10, October, 1969, pp. 840-846.
B13. Zia, P. and M08tafa, T.,"Development Length of Prestressing Strands," PC!
Journal, V. 22, No.5, September-October 1977, pp. 54-65.

!!!!!!!!!!!!!!!!!!!"#$%!&'()!*)&+',)%!'-!$-.)-.$/-'++0!1+'-2!&'()!$-!.#)!/*$($-'+3!
44!5"6!7$1*'*0!8$($.$9'.$/-!")':!
REFERENCES
1. Ahmad, S.H., Khaloo, A.R., and Poveda, A., "Shear Capacity of Reinforced
High.Strength Concrete Beams," ACI Journal, Proceedings Vol. 83, No.2,
Mar .• Apr. 1986, pp.297·305.
2. American AaJociation of State Highway and Transportation Officials, Stan
dard Specification for Higbway Bridges, Thirteenth Edition, Washington, D.C.,
1983.
3. American Concrete Institute, Building Code Requirements for Reinforced Concrete (ACI318-63), Detroit, 1963, 144 pp.
4. American Concrete Institute, Building Code Requirements for Reinforced Concrete (ACI318-83), Detroit, 1983, 111 pp.
5. American Concrete Institute, Building Code Requirements for Reinforced Concrete (ACI318-11), Detroit, 1971, 78 pp.
6. American Concrete Institute, Commentary on Building Code Requirements
for Reinforced Concrete (ACI318-63), SP10 Detroit, 1965, 91 pp.
7. American Concrete Institute-American Society of Civil Engineers Committee
326, "Shear and Diagonal Tension," Proceedings, American Concrete Institute,
V.59, Jan., Feb., and Mar., 1962, pp. 1-30,277-334, and 353-396.
8. American Concrete Institute-American Society of Civil Engineers Committee
426, "The Shear Strength of Reinforced Concrete Members," Journal of the
Structural Division, Proceedings, ASCE, V.99, No. ST6, June 1973, pp. 1091-
1187.
9. American Concrete Institute Committee 211.D, "Guide for Selecting Propor
tions for High Strength Concrete," Committee propcsal, July 1986.
10. American Concrete Institute Committee 363, "State-of-the-Art Report on
High-Strength Concrete: ACI Joumal, Proceedings, Vol. 81, No.4, July
Aug. 1984, pp. 363-411.
11. Carrasquillo, P.M. and Carrasquillo, R.L., "Guidelines for Use of High Strength
Concrete in 'Thxaa Highways," ResearcIJ Report 361-1F, Center for Transporta.
tion Research, The University of'Thxas at Austin, Aug. 1986, 227 pp.
245
246
12. Carrasquillo, R.L., Nilson, A.H., and Slate, F.O., "Properties of High Strength
Concrete Subject to Short-'lenn Loads," AOI Journal, Proceedings Vol. 18,
No.3, May.June 1981, pp. 111-118.
13. Castrodale, R. W., "A Study of Pretensioned High Strength Concrete Girders
in Composite Highway Bridges" unpublished Ph.D. dissertation, The Univer
sity or'lexu at Austin, 1988, pp. 662.
14. Colaco J.P., "15-Story 'lexas Commerce Plaza, Houston - The Use of High
Strength Concrete," High Strength Concrete, SP-81, American Concrete Institute, Detroit, 1985, pp. 1-8.
15. Collins, M.P. and Mitchell D., "A Rational Approach to Shear Design - The
1984 Canadian Code Provisioos," ACI Journal, Proceedings, V. 83, No.6,
Nov.-Dec. 1986, pp. 925-933.
16. Collins, M.P. and Mitchell D., "Shear and 1bnion Design of Prestressed and
Non-Prestressed Concrete Beams," POI Joumal, Vol. 25, No.5, Sept.-Oct.
1980, pp. 32-100.
11. Collins, M.P., "Towarda a Rational Theory for RC Members in Shear," Journal
of the Structural Division, Proceedings, ASCE, V. 104, No. ST4, April 1918,
pp. 649-666.
18. Comite Euro-International du Beton, CEB-FIP Model Code for COOCl'ete
Structures, CEB-FIP Intemational Reconmendation, Third Edition, Paris,
April 1918, 348 pp.
19. Danie1sen, S.W., ·Optimizing Aggregate Properties for High Strength Con
crete," Utiliation of High Strength Concrete, Proceedings Symposium in
Stauanger, Norway, June 15-18,1981, No. 1.6, pp 13-84.
20. de Larrad, F., Acker, P., Maller Y., ·Very High-Strength Coocrete: From the
Laboratory to the Construction Site," UiilUaiiorJ of Higb Strength Coocrete,
Proceeding Symposium in Stauanger, Norway, June 15-18, 1981, No. 4.12, pp.
5()9.516.
21. Design of Concrete Structures for Buildings (CAN3-A23.S- M84), Canadian
Standards Association, Rexdale, 1984, 281 pp.
22. Drake, K.D., ·High-Strength Concrete in Seattle," High Strength Coocrete,
SP-81, American Concrete Institute, Detroit, 1985, pp. 21-34.
247
23. Elzanaty, A.H., Nilson, A.H., and Slate, F.O., "Sheal'- Critical High Strength
Concrete Bea.m!I," Resewcb Repori No. 85- 1, Depatment of Structural Engi
neering, Cornell University, Feb. 1985, 216 pp.
24. Fergestad, S., Jordet, E.A., Nielsen, K.H., and Walstad, T., "An Evaluation
of the Economical and Technical Potential of High Strength Concrete in Long
Span Concrete Bridge Construction," UtiliAtion of Higb Strengtb Concrete,
Proceeding Symposium in Stauanger, Norway, June 15-18, 1987, No. 5.4, pp.
597-607.
25. Glaever, N.A., Hoysaeter, E., and Odervd H.T., "High Strength Concrete
Applications in Bridge Construction," UtilUatioll of Higb Stre1Jgtb Concrete,
Proceedings Symposium in Stauanger, Norway, June 15-18,1987, No. 5.2, pp.
573-584.
26. Grob, F. and Thurlimann, B., "Ultimate Strength and Design of Reinforced
Concrete Beams Under Bending and Shear," Publications, No. 36-II, IABSE,
Zurich, 1976, pp. 105-133.
27. MacGregor, J.G. and Hanson, J.M., "Proposed Changes in Shear Provisions
for Reinforced and Prestressed Concrete Bea.m!I," Proceedings, American Con
crete Institute, V. 66, No.4, April 1969, pp. 276-288.
28. Martin, J .B., Plasticity: Fundamen.tals a.od Gelleral Results, The MIT Press,
Cambridge, Mass., 1975,931 pp.
29. Martinez, S., Nilson, A.H., Slate, F .0., "Short-term Mechanical Properties of
High-Strength Light-Weight Concrete," Resewcb Repori No. 82-9 Vol. 81,
No.5, Sept.-Oct. 1984, pp. 431-442.
30. Mphonde, A.G., and Frantz, G.C., "Shear Strength of High Strength Rein
forced Concrete Bea.nB", Research Report C#84-157, Deparlment of Civil
Engineering, University of Connecticut, June 1984, 260 pp.
31. Natrella, M.G., Experimental StatistiaJ, National Bureau of Standal'ds, HI66
32. Nielsen, M.P., Braestrup, M.W., Jensen, B.C., and Bach, F., "Concrete Plas
ticity: Beam Shev-Shear in Joints-Punching Shear," Danish Society for
Structural Science and Engineering, Structural Research Laboratory, Tech
nical University of Denmark, Lyngby, Special Publication, Oct. 1978, pp.
1-89.
248
33. Nielsen, M.P., Limit Analysis and Concrete Plasticity, Prentice-Hall Inc. 1984,
420 pp.
34. Nielsen, M.P., and Braestrup, N. W., "Plastic-Shear Strength of Reinforced
Concrete Beams," Bygningsstatislte Meddeleser, V. 46, No.3, 1975, pp. 61-
99.
35. Nilson, A.H., "High Strength Concrete - An Overview of Cornell Research," Utilisation of Higb Strengtb Concrete, Proceedinp Symposium in Stauanger,
Norway, June 15-18, 1987, No. 1.2, pp. 27-38.
36. Peterman, M.B., and Carrasquillo, R.L., -Production of High Strength Con
crete," Rese8l'm Report 315-1F, Center for 'liansportatioo Research, The Uni
versity ofThxas at Austin, Oct. 1983, 286 pp.
37. Radjy, F.F., Bogen, T., Sellevoid, EJ., and Loeland., K.E., "A Review of
Experiencee with Coodensed Silica-Fume Coocretes and Products," Fly Asll, Silica Fume, Slag, and Natural PODOD in Concrete, SP-91, Proceedings
Second International Cooference, Madrid, Spain, Vol. II, American Coocrete
Institute, Detroit, 1986, pp. 1135-1152.
38. Ramirez, J.A and Breen, J.E., -Experimental Verification of Design Proce
dures for Shear and Torsion in Reinforced and Prestressed Concrete," Resea:rcb Report 248-3, Center for 'li8ll8portation Research, The University of Texas of
Austin, NOV'. 1983, 300 pp.
39. Ramirez, J.A and Breen, J.E., "Propoaed Design Proceduree for Shear and
Torsion in Reinforced and Prestrellled Concrete," Researc:D Report 248-4F, Center for 1iansportation Research, The University of Texas a.t Austin, Nov.
1983, 254 pp.
40. Ramirez, J.A. and Breen, J .E. -Review of Design Proceduree for Shear and Torsion in Reinforced and Prestressed Coocrete," .Researc:D Report 248-2, Cen
ter for 'liansportation Research, The University of Texas at Austin, Nov. 1983,
186 pp.
41. Russel, H.G., "High-Strength Concrete in North America," Utilisation o(Higb St.rengtb Concrete, Proceedings SymposiuminStauanger, Norway, June 15-18,
1987, No. 5.1, pp. 561-572.
249
42. Schlaich, J., Schafer, K., and Jennewein, M., "Towards a Consistent Design
of Structural Concrete," PCI Journal, Vol. 32, No.3, May-June 1987, pp.
74-150.
43. Shah, S.P. and Ahmad, S.R, "Structural Properties of High Strength Concrete
and Its Implications for Precast Prestreaaed Concrete," PCI Journal, Vol. 30,
No.6, Nov.-Dec. 1985, pp. 91- 117.
44. Smadi, M.M., Slate, F.O., and N'Uson, A.H., "Hi&b-, Medium-, and Low
Strength Concretes Subject to Sustained Overloada-Strains, Strengths, and
Failure Mechanisms," ACI Journal, ProceeclilJp, V. 82, No.5, Sept.-Oct.
1985, pp. 657-664.
45. Sozen, M.A. and Hawkins, N M., Discussion of "Shear and. Diagonal Tension,"
by ACI-ASCE Committe 326, ACI Journal, ProceeclilJp, V. 59, Sept. 1962,
pp. 1341-1347.
46. Thurlimann, B., "Plastic Analysis of Reinforced. Cmcrete Beams," Berich 86,
Institut fur Bauatatik und Kmstruktim ETH, November, 1978, Zurich 20 pp.
47. Thurlimann, B., "Shear Strength of Reinforced and PrestzelBed Cmcrete
Beams - CEB Approach," SP-59, American Concrete Institute, Detroit, 1979,
pp. 93-115.
48. Thurlimann, B., unpublished. cl811 notes for "CE397: Strength of Reinforced. and Concrete and Prestreased. Calcrete Beams under Shear, Torsim, and Com
bined Actions," The University of Tex .. at Austin, Oct. 1978.
49. Vecchio, F.J. and. Cdllns, M.P., "The Modified Compression- Field. Theory for
Reinforced. Concrete Elements Subjected to Shear,· ACI Journal, Proceedings, V. 83, No.2, March-April, 1986, pp. 21g..231.