Shear bands in soft clays: strain-softening behavior in...
16
83 Rakenteiden Mekaniikka (Journal of Structural Mechanics) Vol. 48, No 1, 2015, pp. 83-98 www.rmseura.tkk.fi/rmlehti/ ©Authors 2015. Open access under CC BY-SA 4.0 license. Shear bands in soft clays: strain-softening behavior in finite element method Marco D’Ignazio 1 and Tim Länsivaara Summary. Strain-softening behavior of soft sensitive clays is very often neglected in geotechnical design. During undrained loading, such materials show a dramatic loss of strength after the peak stress, until residual strength is reached at large strain. As a consequence, local failure occurs and plastic strains localize in a shear band. Shear band modeling in Finite Element Method requires a regularization technique to overcome mesh dependency. NGI- ADPSoft2 model is able to simulate the post-peak softening behavior of sensitive clays. In this study, the influence of strain softening on the stability of sensitive clay slopes is studied using the NGI-ADPSoft2 model. The analyses are conducted using the finite element software PLAXIS 2D AE. The advantages of using a strain-softening soil model are discussed. Key words: strain-softening, shear band, FEM, sensitive clays, PLAXIS Received 3 March 2015. Accepted 22 May 2015. Published online 3 June 2015 Introduction Soft sensitive clays are quite spread in Scandinavia and in some areas of Canada. Especially in coastal areas, older railway embankments are generally built on soft subsoil, characterized by very low undrained shear strength. As a consequence, safety and stability become key issues when constructing on such materials. One major aspect, which is hardly ever considered in design, is the post-peak stress- strain behavior of soft clays, known as strain-softening behavior. Such materials, when subjected to undrained loading, show strength reduction after reaching the peak shear strength, decreasing until the residual strength is reached at large strains. At failure, the material response is contractant and shear-induced excess pore pressure will develop, due to low permeability. After reaching the peak strength, local failure occurs and shear strains will localize in a shear band. A shear band is as a zone where, after the onset of strain localization, further plastic deformation will accumulate ([20]). In slopes, such behavior may trigger a failure type which will progressively propagate after some local failure takes place in the shear zone ([1], [4], [5], [6], [8]). 1 Corresponding author. [email protected]
Transcript of Shear bands in soft clays: strain-softening behavior in...
83
Rakenteiden Mekaniikka (Journal of Structural Mechanics) Vol. 48, No 1, 2015, pp. 83-98 www.rmseura.tkk.fi/rmlehti/ ©Authors 2015. Open access under CC BY-SA 4.0 license.
Shear bands in soft clays: strain-softening behavior in finite element method
Marco D’Ignazio1 and Tim Länsivaara
Summary. Strain-softening behavior of soft sensitive clays is very often neglected in geotechnical design. During undrained loading, such materials show a dramatic loss of strength after the peak stress, until residual strength is reached at large strain. As a consequence, local failure occurs and plastic strains localize in a shear band. Shear band modeling in Finite Element Method requires a regularization technique to overcome mesh dependency. NGI-ADPSoft2 model is able to simulate the post-peak softening behavior of sensitive clays. In this study, the influence of strain softening on the stability of sensitive clay slopes is studied using the NGI-ADPSoft2 model. The analyses are conducted using the finite element software PLAXIS 2D AE. The advantages of using a strain-softening soil model are discussed.
Key words: strain-softening, shear band, FEM, sensitive clays, PLAXIS Received 3 March 2015. Accepted 22 May 2015. Published online 3 June 2015
Introduction
Soft sensitive clays are quite spread in Scandinavia and in some areas of Canada. Especially in coastal areas, older railway embankments are generally built on soft subsoil, characterized by very low undrained shear strength. As a consequence, safety and stability become key issues when constructing on such materials.
One major aspect, which is hardly ever considered in design, is the post-peak stress-strain behavior of soft clays, known as strain-softening behavior. Such materials, when subjected to undrained loading, show strength reduction after reaching the peak shear strength, decreasing until the residual strength is reached at large strains. At failure, the material response is contractant and shear-induced excess pore pressure will develop, due to low permeability. After reaching the peak strength, local failure occurs and shear strains will localize in a shear band. A shear band is as a zone where, after the onset of strain localization, further plastic deformation will accumulate ([20]). In slopes, such behavior may trigger a failure type which will progressively propagate after some local failure takes place in the shear zone ([1], [4], [5], [6], [8]).
1 Corresponding author. [email protected]
84
In Finite Element Method, when using a strain softening based model, the global soil behavior is affected by the development of strains in the shear zone depending on the shear band thickness. However, thickness and orientation of the shear band are strongly mesh-dependent, since the mesh acts as an internal length parameter. Therefore, a regularization technique is needed to overcome the element-size dependency. One way to introduce an internal length scale and overcome mesh dependency is to use a non-local strain approach ([9]), where an integrated average strain within a specified zone around the point is used to describe the developing plastic strain in the stress points. As a consequence, mesh dependency is overcome for both plastic strains and the resulting strength reduction during softening. Physically, the internal length scale sets the influence area of the weighting function adopted for calculating the non-local strain. However, there are discussions on what is the weighting function to use [25].
In order to model the strain-softening behavior of clays in Finite Element Method, NGI ([26]) and Jostad and Grimstad ([25]) proposed the NGI-ADPSoft2 model. The NGI-ADPSoft2 model is a total stress soil model based on an anisotropic Tresca yield criterion, able to simulate the post-peak softening behavior of clays. The anisotropic peak and residual undrained shear strengths, together with peak and residual shear strains, are given as input parameters. NGI-ADPSoft2 model is a user-defined model implemented in the FE software PLAXIS. The model uses an over non-local strain approach ([15]) to overcome the problem of mesh dependency in the softening regime. The internal length is given as input parameter and the thickness of the shear band is calculated accordingly.
In this study, the NGI-ADPSoft2 model is adopted to simulate stress-strain curves from CU Triaxial tests on Scandinavian soft clays. The effects of both mesh element size and shear band thickness are analyzed and discussed. A stability calculation example of a natural clay slope is shown and the effect of strain-softening examined. Finally, the benefits of using an advanced strain-softening-based model in practice are discussed.
Background
Strain-softening and strain localization
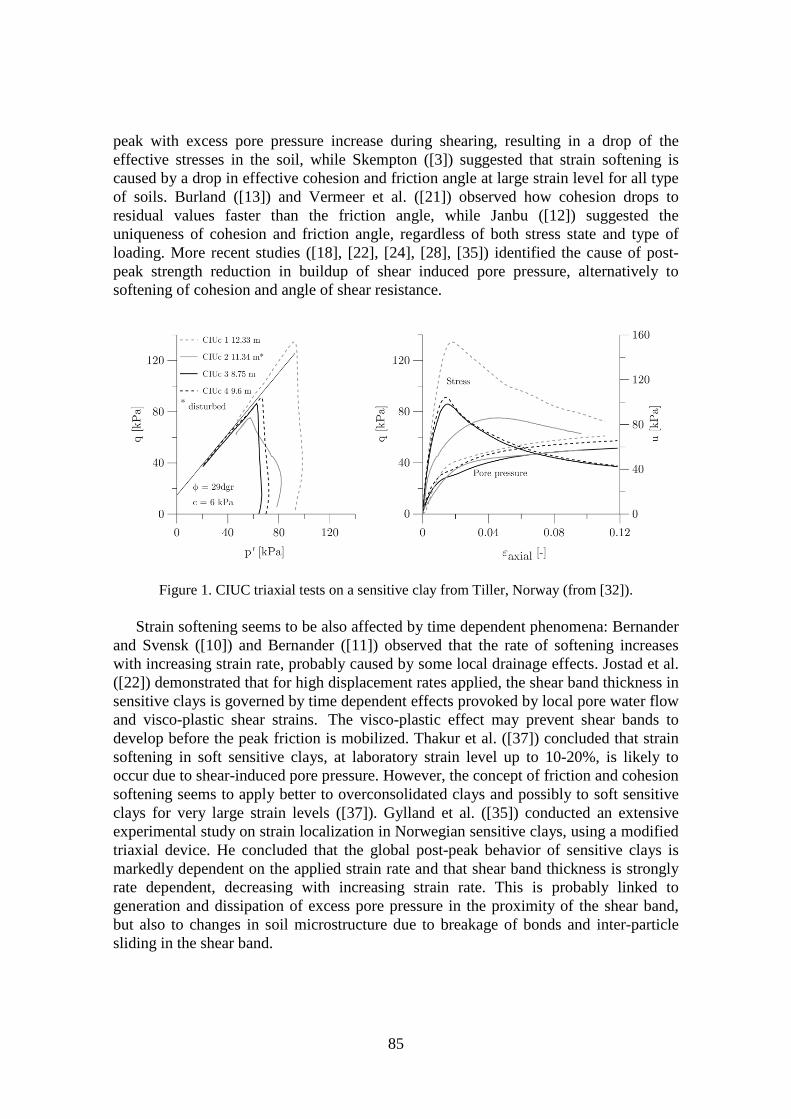
Strain softening behavior of soft sensitive clays can be clearly observed in Fig. 1 ([35]). Undrained triaxial compression tests on specimens of quick clay from Tiller, Norway, taken at different depths, show how the post-peak response is governed by a loss of shear strength and consequent excess pore pressure increase. In the q-p’ space, where q = σ1 – σ3 and p’ =1/3(σ’1+2σ’3), the stress path bends over after reaching the maximum deviator stress, plunging downwards with a gradient induced by the friction angle at critical state.
Softening clays can be classified as instable materials. After peak strength is reached, local failure and strain localization will occur, resulting in a development of a shear band in the initially homogeneous soil.
Strain-softening of soft clays and strain localization have been thoroughly studied by several authors over the last decades. Bjerrum ([2]) linked the strength decrease after
85
peak with excess pore pressure increase during shearing, resulting in a drop of the effective stresses in the soil, while Skempton ([3]) suggested that strain softening is caused by a drop in effective cohesion and friction angle at large strain level for all type of soils. Burland ([13]) and Vermeer et al. ([21]) observed how cohesion drops to residual values faster than the friction angle, while Janbu ([12]) suggested the uniqueness of cohesion and friction angle, regardless of both stress state and type of loading. More recent studies ([18], [22], [24], [28], [35]) identified the cause of post-peak strength reduction in buildup of shear induced pore pressure, alternatively to softening of cohesion and angle of shear resistance.
Figure 1. CIUC triaxial tests on a sensitive clay from Tiller, Norway (from [32]).
Strain softening seems to be also affected by time dependent phenomena: Bernander and Svensk ([10]) and Bernander ([11]) observed that the rate of softening increases with increasing strain rate, probably caused by some local drainage effects. Jostad et al. ([22]) demonstrated that for high displacement rates applied, the shear band thickness in sensitive clays is governed by time dependent effects provoked by local pore water flow and visco-plastic shear strains. The visco-plastic effect may prevent shear bands to develop before the peak friction is mobilized. Thakur et al. ([37]) concluded that strain softening in soft sensitive clays, at laboratory strain level up to 10-20%, is likely to occur due to shear-induced pore pressure. However, the concept of friction and cohesion softening seems to apply better to overconsolidated clays and possibly to soft sensitive clays for very large strain levels ([37]). Gylland et al. ([35]) conducted an extensive experimental study on strain localization in Norwegian sensitive clays, using a modified triaxial device. He concluded that the global post-peak behavior of sensitive clays is markedly dependent on the applied strain rate and that shear band thickness is strongly rate dependent, decreasing with increasing strain rate. This is probably linked to generation and dissipation of excess pore pressure in the proximity of the shear band, but also to changes in soil microstructure due to breakage of bonds and inter-particle sliding in the shear band.
86
As earlier mentioned (see Introduction section), sensitive clay slopes may be subjected to progressive type of failure caused by the strain-softening material behavior. Jostad et al. ([36]) studied the impact of strain softening in geotechnical design of fills on gently inclined slopes on soft sensitive clays through finite element analyses. The main conclusion was that the peak undrained shear strength can be reduced by a scaling factor (Fsoft) and therefore used for limit equilibrium analysis with the hypothesis of perfect plasticity. An average value of Fsoft = 1.09 was calculated, meaning that by reducing the peak strength of about 9%, the same capacity can be achieved without taking softening into account in the calculation.
Shear bands in Finite Element Method
Modelling strain softening and strain localization in Finite Element has always been a challenging issue. From the mechanical point of view, strain softening results in development of plastic strains for a decreasing yield stress or a contracting yield surface. According to Nordal ([31]) the hardening rule may be defined using a consistency condition as follows:
where dσ represents the stress increment vector, {∂F/∂σ}T the yield surface gradient, λ the plastic multiplier and A the plastic resistance number.
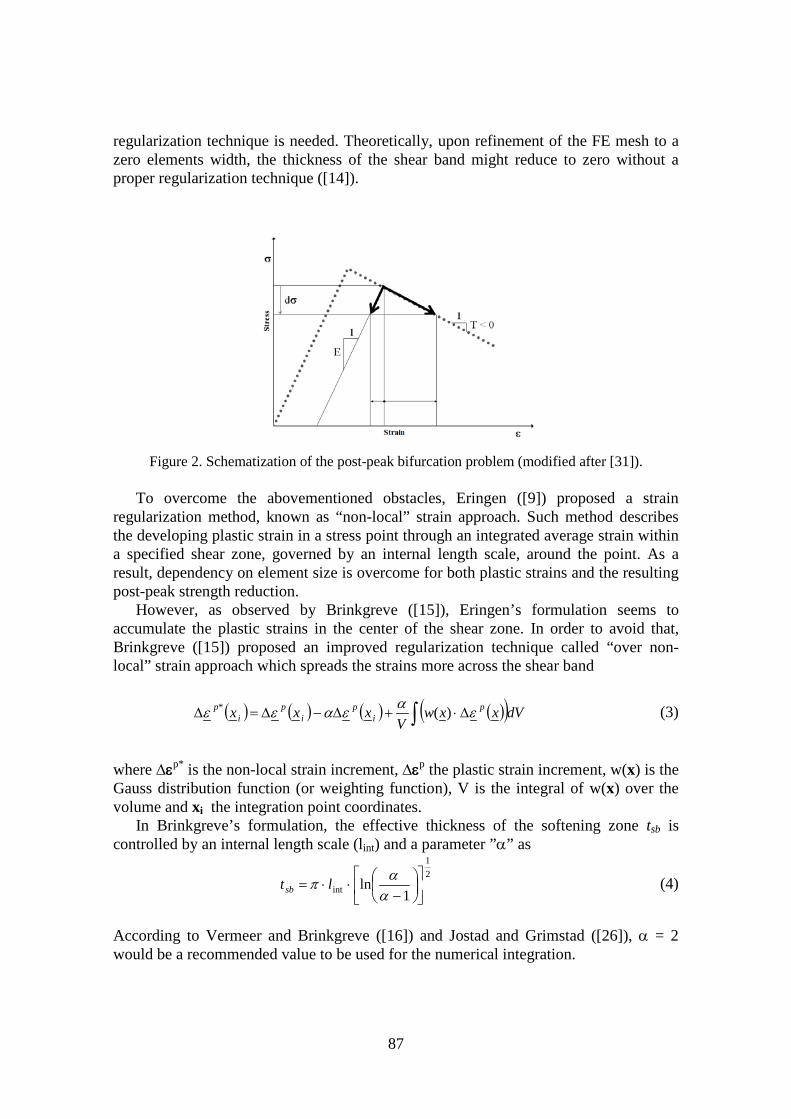
The softening curve has a negative tangent elasto-plastic modulus T (Fig. 2). T is defined as in Eq. 2:
where E is the elastic loading/unloading stiffness.
In the softening regime, both first and second term in Eq. (1) are negative. This implies dλ being positive since A is also negative (from Eq. (2)). From a physical point of view, dλ > 0 implies growing plastic strain during softening.
A consequence of strain softening behavior is that while for a given increment of strain the continuing stress-strain curve at peak stress is unique, for a given stress increment the response is not unique, since, due to reduced shear stress, both plastic softening and elastic unloading are possible (Fig. 2). Such a bifurcation problem needs to be solved by numerical methods e.g. Finite Element Method, in order to guarantee equilibrium of stresses, material behaviour and compatibility of strains during a loading phase ([22]).
Difficulties arise when strain localization is modelled in Finite Element, since the development of plastic strains is directly linked to the thickness of the shear band. More precisely, the FE discretisation would operate as an internal length parameter, thus affecting both thickness and orientation of the shear band. This would indicate that a
0=−
∂∂ λσσ
AddFT
(1)
AET111
+= (2)
87
regularization technique is needed. Theoretically, upon refinement of the FE mesh to a zero elements width, the thickness of the shear band might reduce to zero without a proper regularization technique ([14]).
Figure 2. Schematization of the post-peak bifurcation problem (modified after [31]).
To overcome the abovementioned obstacles, Eringen ([9]) proposed a strain regularization method, known as “non-local” strain approach. Such method describes the developing plastic strain in a stress point through an integrated average strain within a specified shear zone, governed by an internal length scale, around the point. As a result, dependency on element size is overcome for both plastic strains and the resulting post-peak strength reduction.
However, as observed by Brinkgreve ([15]), Eringen’s formulation seems to accumulate the plastic strains in the center of the shear zone. In order to avoid that, Brinkgreve ([15]) proposed an improved regularization technique called “over non-local” strain approach which spreads the strains more across the shear band
where ∆εp* is the non-local strain increment, ∆εp the plastic strain increment, w(x) is the Gauss distribution function (or weighting function), V is the integral of w(x) over the volume and xi the integration point coordinates.
In Brinkgreve’s formulation, the effective thickness of the softening zone tsb is controlled by an internal length scale (lint) and a parameter ”α” as
21
int 1ln
−⋅⋅=
ααπ lt sb (4)
According to Vermeer and Brinkgreve ([16]) and Jostad and Grimstad ([26]), α = 2 would be a recommended value to be used for the numerical integration.
( ) ( ) ( ) ( )( )∫ ∆⋅+∆−∆=∆ dVxxwV
xxx pi
pi
pi
p εαεαεε )(* (3)
88
Constitutive models
NGI-ADPSoft2 model
The NGI-ADPSoft2 soil model ([25], [26]) is an elasto-plastic model based on the undrained shear strength concept and it describes the anisotropic strain-softening behavior of clays during undrained shearing.
The anisotropy in undrained shear strength is based on the ADP framework proposed by Bjerrum ([7]). As input parameters, the undrained shear strength profiles for active (A), direct simple shear (D) and passive (P) loading are given. The direct input of failure strains in the three directions of shearing represented by triaxial compression, DSS and triaxial extension, defines the non-linear anisotropic hardening relationship included in the NGI-ADPSoft2 model.
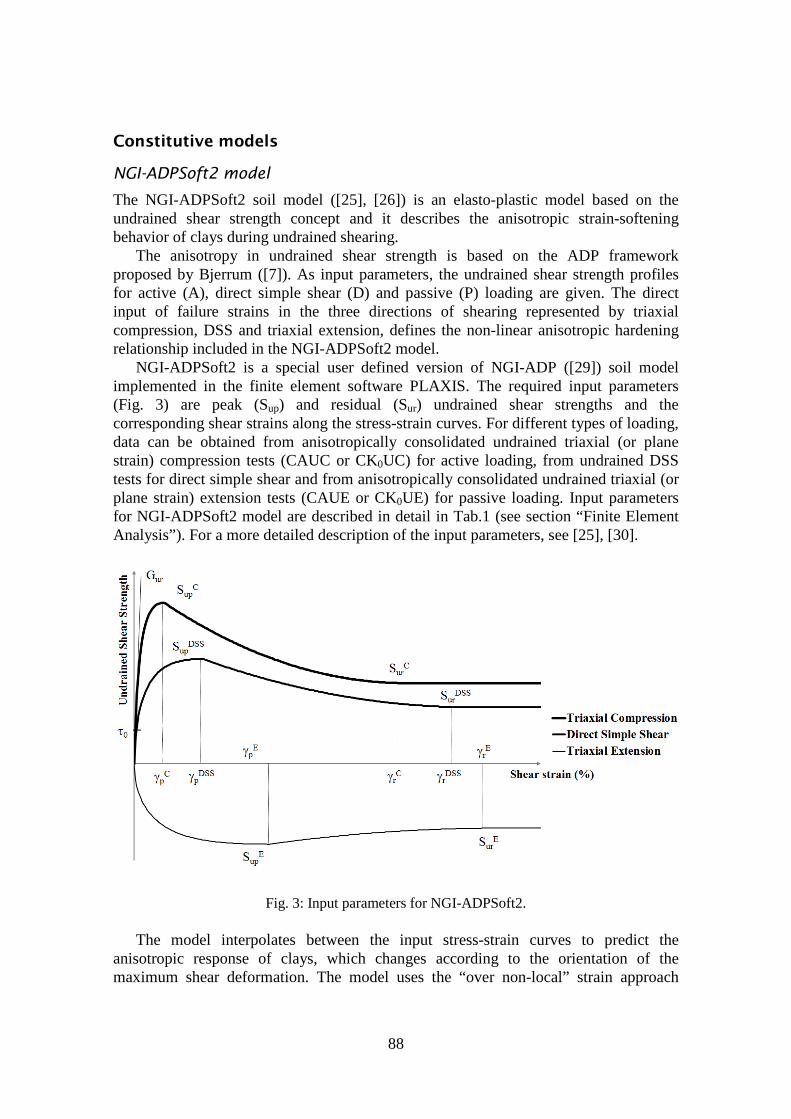
NGI-ADPSoft2 is a special user defined version of NGI-ADP ([29]) soil model implemented in the finite element software PLAXIS. The required input parameters (Fig. 3) are peak (Sup) and residual (Sur) undrained shear strengths and the corresponding shear strains along the stress-strain curves. For different types of loading, data can be obtained from anisotropically consolidated undrained triaxial (or plane strain) compression tests (CAUC or CK0UC) for active loading, from undrained DSS tests for direct simple shear and from anisotropically consolidated undrained triaxial (or plane strain) extension tests (CAUE or CK0UE) for passive loading. Input parameters for NGI-ADPSoft2 model are described in detail in Tab.1 (see section “Finite Element Analysis”). For a more detailed description of the input parameters, see [25], [30].
Fig. 3: Input parameters for NGI-ADPSoft2.
The model interpolates between the input stress-strain curves to predict the anisotropic response of clays, which changes according to the orientation of the maximum shear deformation. The model uses the “over non-local” strain approach
89
([15]), presented in the previous section, to overcome the problem of mesh dependency in the softening regime. The internal length is given as input parameter and the thickness of the shear band is calculated according to Eq. (4).
The formulation of NGI-ADPSoft2 soil model is based on an approximated anisotropic Tresca yield criterion. The formulation of the model for three-dimensional conditions is defined in Eq. (5).
where Ĵ2 is the modified second deviatoric invariant and H(ω) approximates the Tresca criterion ([24]). Two hardening parameters κ1 and κ2 are defined as follows:
γp, γp
p and γrp are the plastic shear strain, plastic “peak” shear strain and plastic
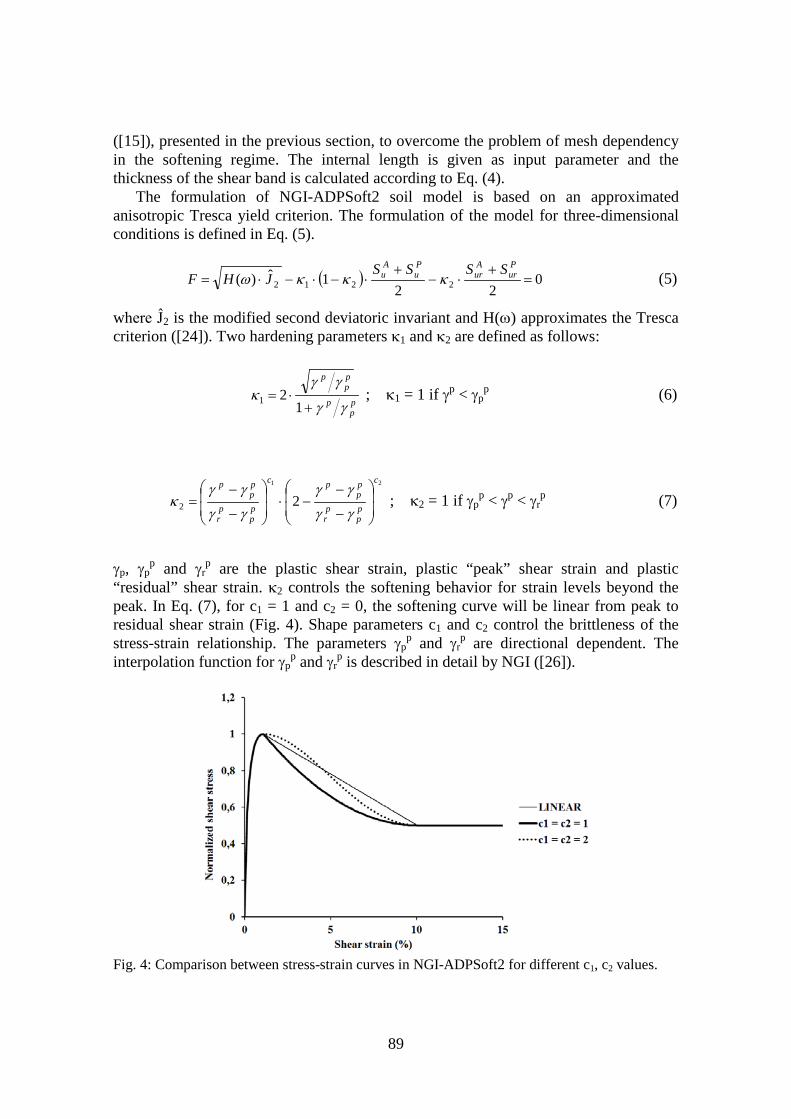
“residual” shear strain. κ2 controls the softening behavior for strain levels beyond the peak. In Eq. (7), for c1 = 1 and c2 = 0, the softening curve will be linear from peak to residual shear strain (Fig. 4). Shape parameters c1 and c2 control the brittleness of the stress-strain relationship. The parameters γp
p and γrp are directional dependent. The
interpolation function for γpp and γr
p is described in detail by NGI ([26]).
Fig. 4: Comparison between stress-strain curves in NGI-ADPSoft2 for different c1, c2 values.
( ) 022
1ˆ)( 2212 =+
⋅−+
⋅−⋅−⋅=Pur
Aur
Pu
Au SSSS
JHF κκκω (5)
pp
p
pp
p
γγ
γγκ
+⋅=1
21 ; κ1 = 1 if γp < γpp (6)
21
22
c
pp
pr
pp
pc
pp
pr
pp
p
−
−−⋅
−
−=
γγ
γγ
γγ
γγκ ; κ2 = 1 if γp
p < γp < γrp (7)
90
Finite element analysis
Model calibration
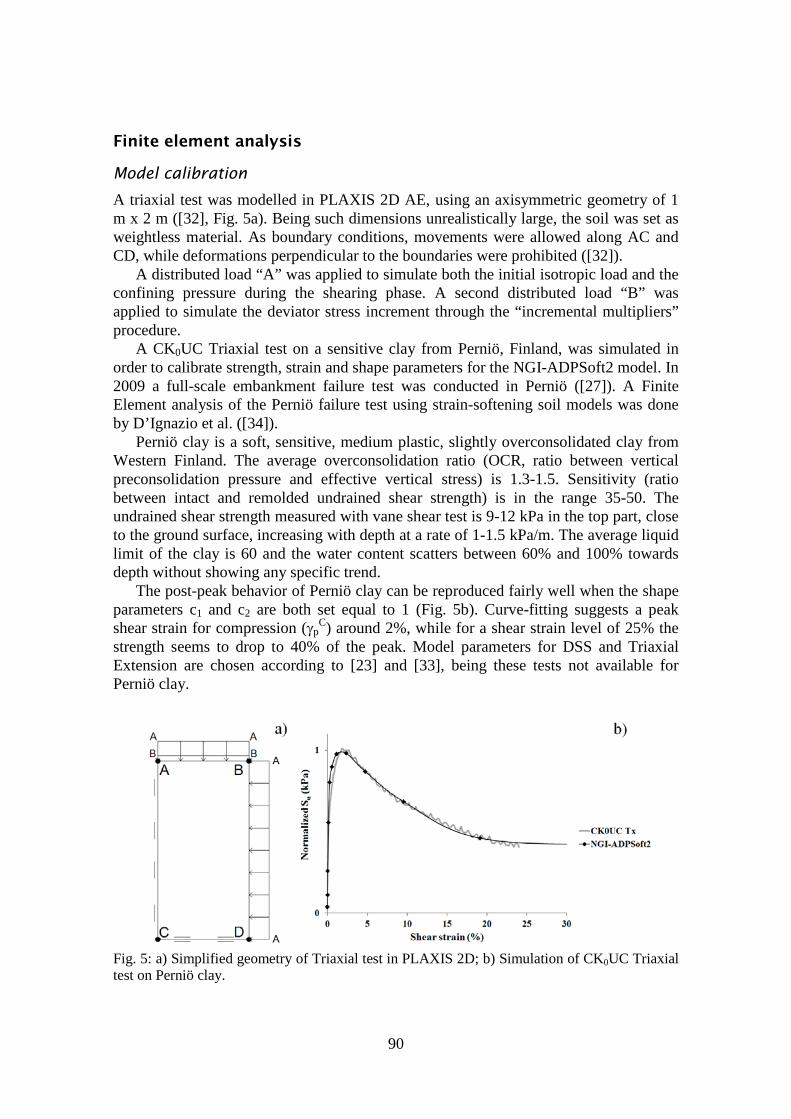
A triaxial test was modelled in PLAXIS 2D AE, using an axisymmetric geometry of 1 m x 2 m ([32], Fig. 5a). Being such dimensions unrealistically large, the soil was set as weightless material. As boundary conditions, movements were allowed along AC and CD, while deformations perpendicular to the boundaries were prohibited ([32]).
A distributed load “A” was applied to simulate both the initial isotropic load and the confining pressure during the shearing phase. A second distributed load “B” was applied to simulate the deviator stress increment through the “incremental multipliers” procedure.
A CK0UC Triaxial test on a sensitive clay from Perniö, Finland, was simulated in order to calibrate strength, strain and shape parameters for the NGI-ADPSoft2 model. In 2009 a full-scale embankment failure test was conducted in Perniö ([27]). A Finite Element analysis of the Perniö failure test using strain-softening soil models was done by D’Ignazio et al. ([34]).
Perniö clay is a soft, sensitive, medium plastic, slightly overconsolidated clay from Western Finland. The average overconsolidation ratio (OCR, ratio between vertical preconsolidation pressure and effective vertical stress) is 1.3-1.5. Sensitivity (ratio between intact and remolded undrained shear strength) is in the range 35-50. The undrained shear strength measured with vane shear test is 9-12 kPa in the top part, close to the ground surface, increasing with depth at a rate of 1-1.5 kPa/m. The average liquid limit of the clay is 60 and the water content scatters between 60% and 100% towards depth without showing any specific trend.
The post-peak behavior of Perniö clay can be reproduced fairly well when the shape parameters c1 and c2 are both set equal to 1 (Fig. 5b). Curve-fitting suggests a peak shear strain for compression (γp
C) around 2%, while for a shear strain level of 25% the strength seems to drop to 40% of the peak. Model parameters for DSS and Triaxial Extension are chosen according to [23] and [33], being these tests not available for Perniö clay.
Fig. 5: a) Simplified geometry of Triaxial test in PLAXIS 2D; b) Simulation of CK0UC Triaxial test on Perniö clay.
91
FE Modeling of a sensitive clay slope
In the previous section, the stress-strain behavior of Perniö clay was presented and model parameters for the NGI-ADPSoft2 model were calibrated. In this section, A FE calculation example using PLAXIS 2D (v.2012 AE) is provided, in order to study the stability of a clay slope using the NGI-ADPSoft2 model. The strain-softening behaviour of Perniö clay is assumed.
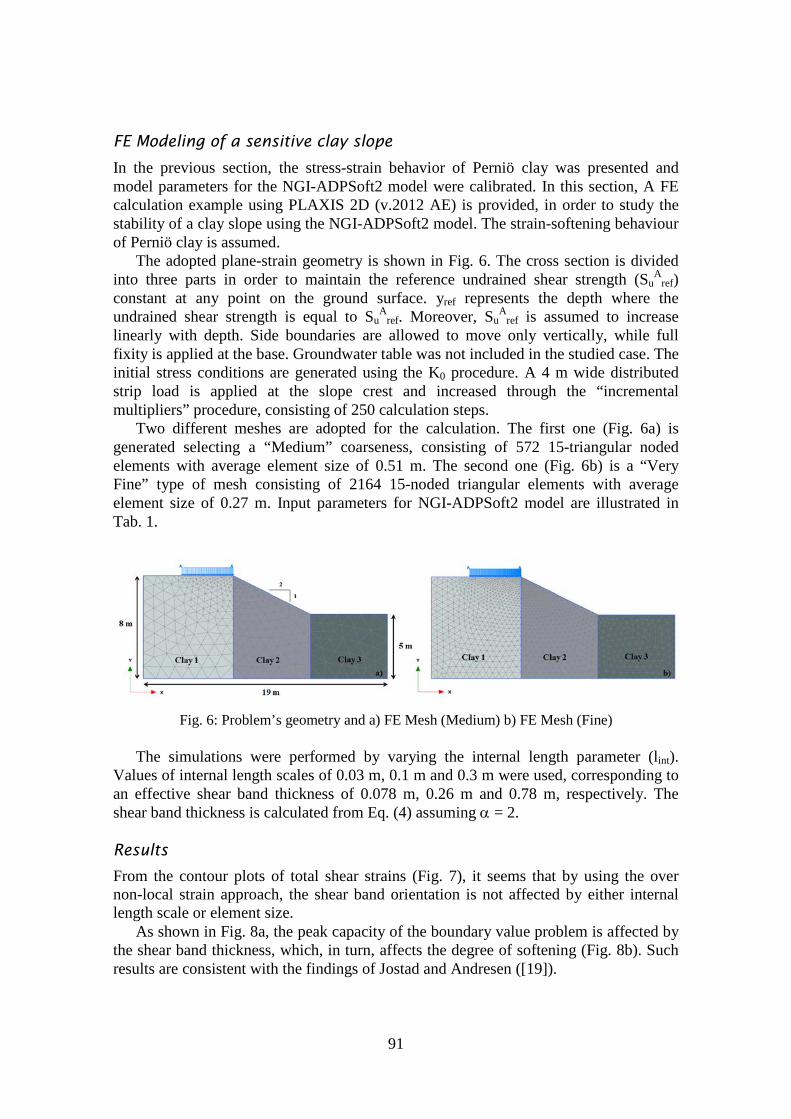
The adopted plane-strain geometry is shown in Fig. 6. The cross section is divided into three parts in order to maintain the reference undrained shear strength (Su
Aref)
constant at any point on the ground surface. yref represents the depth where the undrained shear strength is equal to Su
Aref. Moreover, Su
Aref is assumed to increase
linearly with depth. Side boundaries are allowed to move only vertically, while full fixity is applied at the base. Groundwater table was not included in the studied case. The initial stress conditions are generated using the K0 procedure. A 4 m wide distributed strip load is applied at the slope crest and increased through the “incremental multipliers” procedure, consisting of 250 calculation steps.
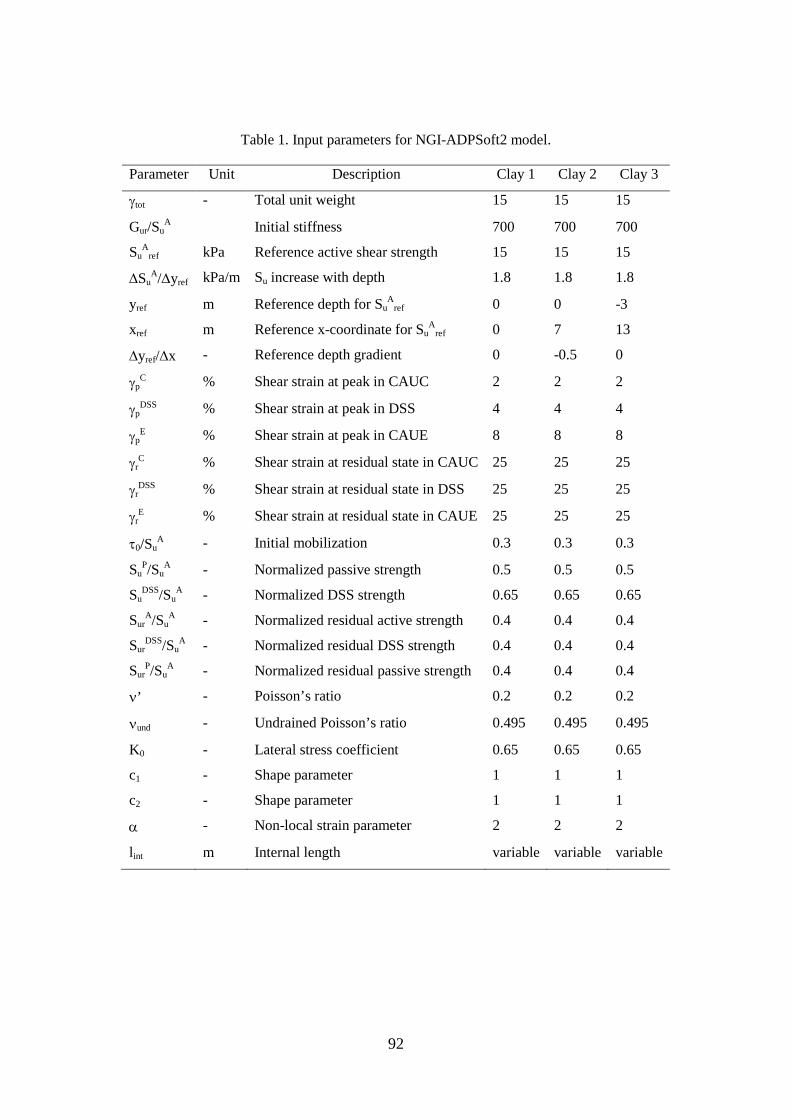
Two different meshes are adopted for the calculation. The first one (Fig. 6a) is generated selecting a “Medium” coarseness, consisting of 572 15-triangular noded elements with average element size of 0.51 m. The second one (Fig. 6b) is a “Very Fine” type of mesh consisting of 2164 15-noded triangular elements with average element size of 0.27 m. Input parameters for NGI-ADPSoft2 model are illustrated in Tab. 1.
Fig. 6: Problem’s geometry and a) FE Mesh (Medium) b) FE Mesh (Fine)
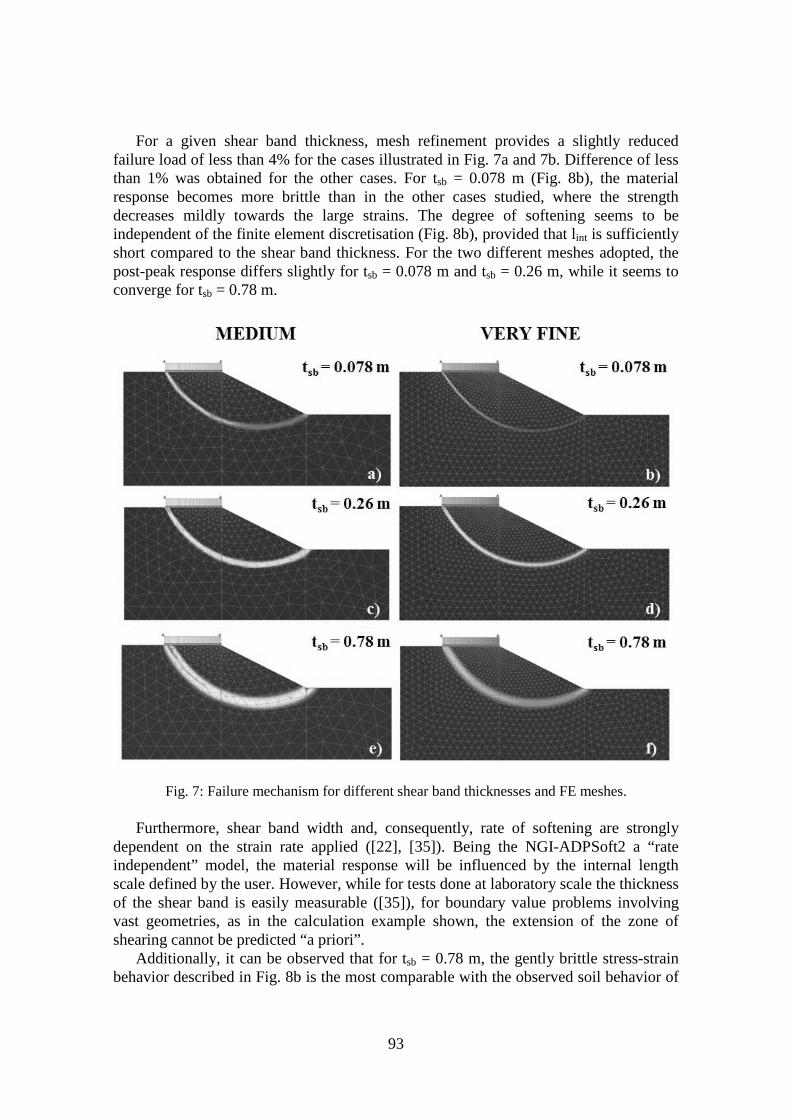
The simulations were performed by varying the internal length parameter (lint). Values of internal length scales of 0.03 m, 0.1 m and 0.3 m were used, corresponding to an effective shear band thickness of 0.078 m, 0.26 m and 0.78 m, respectively. The shear band thickness is calculated from Eq. (4) assuming α = 2.
Results
From the contour plots of total shear strains (Fig. 7), it seems that by using the over non-local strain approach, the shear band orientation is not affected by either internal length scale or element size.
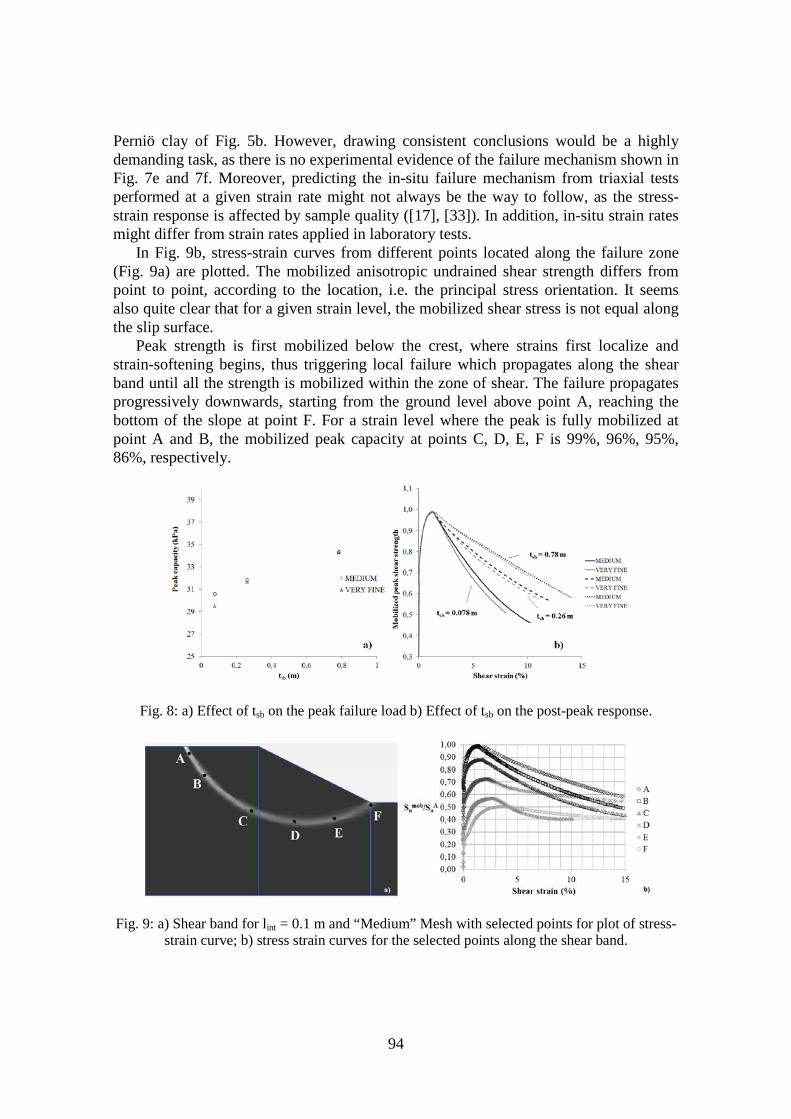
As shown in Fig. 8a, the peak capacity of the boundary value problem is affected by the shear band thickness, which, in turn, affects the degree of softening (Fig. 8b). Such results are consistent with the findings of Jostad and Andresen ([19]).
92
Table 1. Input parameters for NGI-ADPSoft2 model.
Parameter Unit Description Clay 1 Clay 2 Clay 3
γtot - Total unit weight 15 15 15
Gur/SuA Initial stiffness 700 700 700
SuA
ref kPa Reference active shear strength 15 15 15
∆SuA/∆yref kPa/m Su increase with depth 1.8 1.8 1.8
yref m Reference depth for SuA
ref 0 0 -3
xref m Reference x-coordinate for SuA
ref 0 7 13
∆yref/∆x - Reference depth gradient 0 -0.5 0
γpC % Shear strain at peak in CAUC 2 2 2
γpDSS % Shear strain at peak in DSS 4 4 4
γpE % Shear strain at peak in CAUE 8 8 8
γrC % Shear strain at residual state in CAUC 25 25 25
γrDSS % Shear strain at residual state in DSS 25 25 25
γrE % Shear strain at residual state in CAUE 25 25 25
τ0/SuA - Initial mobilization 0.3 0.3 0.3
SuP/Su
A - Normalized passive strength 0.5 0.5 0.5
SuDSS/Su
A - Normalized DSS strength 0.65 0.65 0.65
SurA/Su
A - Normalized residual active strength 0.4 0.4 0.4
SurDSS/Su
A - Normalized residual DSS strength 0.4 0.4 0.4
SurP/Su
A - Normalized residual passive strength 0.4 0.4 0.4
ν’ - Poisson’s ratio 0.2 0.2 0.2
νund - Undrained Poisson’s ratio 0.495 0.495 0.495
K0 - Lateral stress coefficient 0.65 0.65 0.65
c1 - Shape parameter 1 1 1
c2 - Shape parameter 1 1 1
α - Non-local strain parameter 2 2 2
lint m Internal length variable variable variable
93
For a given shear band thickness, mesh refinement provides a slightly reduced failure load of less than 4% for the cases illustrated in Fig. 7a and 7b. Difference of less than 1% was obtained for the other cases. For tsb = 0.078 m (Fig. 8b), the material response becomes more brittle than in the other cases studied, where the strength decreases mildly towards the large strains. The degree of softening seems to be independent of the finite element discretisation (Fig. 8b), provided that lint is sufficiently short compared to the shear band thickness. For the two different meshes adopted, the post-peak response differs slightly for tsb = 0.078 m and tsb = 0.26 m, while it seems to converge for tsb = 0.78 m.
Fig. 7: Failure mechanism for different shear band thicknesses and FE meshes.
Furthermore, shear band width and, consequently, rate of softening are strongly dependent on the strain rate applied ([22], [35]). Being the NGI-ADPSoft2 a “rate independent” model, the material response will be influenced by the internal length scale defined by the user. However, while for tests done at laboratory scale the thickness of the shear band is easily measurable ([35]), for boundary value problems involving vast geometries, as in the calculation example shown, the extension of the zone of shearing cannot be predicted “a priori”.
Additionally, it can be observed that for tsb = 0.78 m, the gently brittle stress-strain behavior described in Fig. 8b is the most comparable with the observed soil behavior of
94
Perniö clay of Fig. 5b. However, drawing consistent conclusions would be a highly demanding task, as there is no experimental evidence of the failure mechanism shown in Fig. 7e and 7f. Moreover, predicting the in-situ failure mechanism from triaxial tests performed at a given strain rate might not always be the way to follow, as the stress-strain response is affected by sample quality ([17], [33]). In addition, in-situ strain rates might differ from strain rates applied in laboratory tests.
In Fig. 9b, stress-strain curves from different points located along the failure zone (Fig. 9a) are plotted. The mobilized anisotropic undrained shear strength differs from point to point, according to the location, i.e. the principal stress orientation. It seems also quite clear that for a given strain level, the mobilized shear stress is not equal along the slip surface.
Peak strength is first mobilized below the crest, where strains first localize and strain-softening begins, thus triggering local failure which propagates along the shear band until all the strength is mobilized within the zone of shear. The failure propagates progressively downwards, starting from the ground level above point A, reaching the bottom of the slope at point F. For a strain level where the peak is fully mobilized at point A and B, the mobilized peak capacity at points C, D, E, F is 99%, 96%, 95%, 86%, respectively.
Fig. 8: a) Effect of tsb on the peak failure load b) Effect of tsb on the post-peak response.
Fig. 9: a) Shear band for lint = 0.1 m and “Medium” Mesh with selected points for plot of stress-strain curve; b) stress strain curves for the selected points along the shear band.
95
Discussion
The shear band thickness acts as key factor when modelling slope stability and progressive failure in FEM, since it affects both rate of softening and peak capacity. Moreover, being the extent of the shear zone defined by the displacement rate applied, it turns a rather difficult parameter to evaluate at design stage.
NGI-ADPSoft2 model, through the shape parameters c1 and c2, can predict remarkably well the strain-softening behavior of sensitive clays, as they can be adjusted according to the laboratory test results. However, NGI-ADPSoft2 model is rate independent; hence the shear band thickness is given as an input parameter, through the internal length scale (lint). In addition, for a given input undrained shear strength the assumption of a too high internal length scale may result in over prediction of safety (Fig. 8a). Hopefully, an updated version of the model subject at hand, including dependency on strain rates will be developed.
From a purely engineering standpoint of view, the philosophy behind the NGI-ADPSoft2 model would represent a straightforward approach to fairly complex aspects such as anisotropy and softening behavior of sensitive clays. Even though the number of input parameters is relatively high, the way of determining them can be rather easy when good soil investigation is available. On the other hand, when there is lack of information on soil parameters, existing correlations based on laboratory tests on high quality samples are available for Norwegian clays ([33]). An extensive database for soil parameters selection is however missing for Finnish and/or Swedish clays.
The advantage of using NGI-ADPSoft2 model is that the actual undrained stress-strain behavior can be modeled without the simplifications required by standard soil models (e.g. Mohr-Coulomb). For instance, when simple elasto-plastic models are used, peak strengths cannot be given as input parameters for softening materials, as the safety level or the bearing capacity would result over predicted. Moreover, by simplifying soil behavior, deformations cannot be predicted correctly.
Another noteworthy aspect to be discussed is the sample quality. The global performance of advanced FE soil models is affected by how well the stress-strain behavior of the soil can be reproduced. Therefore, when tests results from disturbed samples are used for curve-fitting, prediction of both strains and failure load will likely be unsuccessful. According to Lunne et al. ([17]), for soft low plastic Norwegian clays, sample disturbance provokes a reduction in the peak strength, an increase in the shear strain at failure and a higher shear stress at large strain. It was also observed by Berre ([38]) how strains during a laboratory test are negatively affected by the storage time of samples.
Conclusions
The NGI-ADPSoft2 model ([25], [26]) represents a suitable and straightforward soil model able to predict the anisotropic softening behavior of soft sensitive clays and hence capable to describe the progressive failure mechanism in such materials. Peak and residual undrained shear strengths and shear strains are given as input parameters. In this way, peak capacity and deformation behavior can be predicted more accurately than with simpler soil models.
96
NGI-ADPSoft2 model is implemented in PLAXIS as user-defined. The over non local strain approach ([15]) included in the model formulation ensures the uniqueness of post-peak response, notwithstanding of the mesh size, provided that the internal length scale is chosen appropriately.
Being the shear band thickness a rate dependent parameter, the internal length scale (lint) must be selected carefully, in order not to overestimate the peak capacity of a given boundary value problem.
From the calculation example illustrated in this paper, the progressive failure mechanism of a sensitive clay slope subjected to an external load can be observed. The mobilized peak strength differs at any point along the shear band for a given strain level. Furthermore, for a shear band thickness of 0.78 m, the rate of softening is consistent with the observed behavior of Perniö clay during Triaxial compression.
For future research, it would be of interest 1) to have an updated version of the NGI-ADPSoft2 model including rate effect; 2) to observe and estimate the shear band thickness from real cases e.g. full-scale experiments or monitored slopes for a better understanding of the phenomena.
Acknowledgements
The Authors would like to acknowledge M.Sc. Juho Mansikkamäki and M.Sc. Ville Lehtonen from Tampere University of Technology, for the constructive discussions concerning the topic surveyed in the present article.
References
[1] K. Terzaghi, Stability of slopes of natural clay. In Proceedings of the 1st International Conference of Soil Mechanics and Foundations, 161-165, 1936.
[2] L. Bjerrum, The effective shear strength parameters of sensitive clays, Proc. 5th Int. Conf. Soil Mech, Vol. 1, 1961.
[3] A. W. Skempton, Long-term stability of clay slopes. Géotechnique, (14):77-102, 1964.
[4] A. W. Bishop, Progressive failure with special reference to the mechanism causing it. In Proc. Geotech. Conf., Oslo (2):142-150. 1967
[5] L. Bjerrum, The third Terzaghi lectures, Progressive failure in slopes of overconsolidated plastic clay and clay shales, Journal of the Soil Mechanics and Foundations Division, 93(5):1-49, 1967.
[6] J.T. Christian, R. V. Whitman, A one-dimensional model for progressive failure, Proc. 7th Int. Conf. Soil Mech. Found. Engng, Mexico City, Vol. 2. 1969.
[7] L. Bjerrum, Problems of soil mechanics and construction on soft clays, Proceedings of the 8th International Conference on Soil Mechanics and Foundation Engineering, (3):111-159, Moscow, 1973.
[8] S. Bernander, Brittle Failures in Normally Consolidated Soils. Väg-& Vattenbyggaren, (8-9):49-52, 1978.
[9] A. C. Eringen, On nonlocal plasticity, International Journal of Engineering Science, 19(12):1461-1474. 1981.
97
[10] S. Bernander, I. Svensk, On the brittleness of soft clays and its effect on slope stability, Väg-och Vattenbyggaren, 7(9):3-7, 1982.
[11] S. Bernander, I. Svensk, G. Holmberg, J. Bernander, K. Isacsson, Shear strength deformation properties of clays in direct shear tests at high strain rates, In Proceedings of 11th international conference on soil mechanics and foundation engineering, San Fransisco, 987-990, 1985.
[12] N. Janbu, Soil models in offshore engineering, Géotechnique, 35(3):241-281, 1985.
[13] J. B. Burland, On the compressibility and shear strength of natural clays, Geotechnique, 40(3):329-378, 1990.
[14] R. De Borst, Fundamental issues in finite element analyses of localization of deformation, Engineering computations 10(2): 99-121. 1993.
[15] R. B. J. Brinkgreve, Geomaterial models and numerical analysis of softening, TU Delft, Delft University of Technology, 1994.
[16] P. A. Vermeer, R. B. J. Brinkgreve, A new effective non-local strain measure for softening plasticity, Localisation and Bifurcation Theory for Soils and Rocks, 89-100. 1994.
[17] T. Lunne, T. Berre, S. Strandvik, Sample disturbance effects in soft low plastic Norwegian clay, Symposium on Recent Developments in Soil and Pavement Mechanics, 1997.
[18] S. Bernander, Progressive landslides in long natural slopes, Formation, potential extension and configuration of finished slides in strain-softening soils, Licentiate thesis, Lulea University of Technology, 2000
[19] L. Andresen, Jostad H.P, A constitutive model for anisotropic and strain-softening clay. Proceedings of the 8th International Symposium on Numerical Models in Geomechanics, NUMOG VIII, Rome, Italy. 2002.
[20] J. Desrues, G. Viggiani, Strain localization in sand: an overview of the experimental results obtained in Grenoble using stereophotogrammetry. International Journal for Numerical and Analytical Methods in Geomechanics, 28(4): 279-321, 2004
[21] P. A. Vermeer, U. Vogler, E. G. Septanika, O. Stelzer, Modelling strong discontinuities in geotechnical problems, In Proceedings of the 2nd international symposium on continuous and discontinuous modelling of Cohesive Frictional Materials CDM,pp. 381-394, 2004.
[22] H.P. Jostad, L. Andresen, V. Thakur, Calculation of shear band thickness in sensitive clays, Proceedings of the sixth European conference on numerical methods in geotechnical engineering, Graz, 2006.
[23] R. Larsson,. Skjuvhällfasthet –utvärdering I kohesionsjord (2nd ed.), Linköping: Swedish Geotechnical Institute, 2007.
[24] V. Thakur, Strain localization in sensitive soft clays, NTNU, Trondheim, 2007. [25] H.P. Jostad, G. Grimstad, "Comparison of distribution functions for the nonlocal
strain approach." Proceedings, 2nd International Symposium on Computational Geomechanics, Cavtat-Dubrovnik, Croatia, 2011.
[26] NGI, Effekt av progressiv bruddutvikling for utbygging i områder med kvikkleire, Teknisk Notat, Document n. 20092128-00-10-TN, 2011.
98
[27] V. Lehtonen, Instrumentation and analysis of a railway embankment failure experiment, Research reports of the Finnish Transport agency 29/2011, Helsinki, Finnish Transport Agency, 2011.
[28] V. Thakur, Numerically observed shear bands in soft sensitive clays, Geomechanics and Geoengineering: An International Journal, 6(2):131-146, 2011.
[29] G. Grimstad, L. Andresen, H. P. Jostad, NGI‐ADP: Anisotropic shear strength model for clay. International Journal for Numerical and Analytical Methods in Geomechanics, 36(4):483-497, 2012.
[30] NGI, Effekt av progressiv bruddutvikling for utbygging i områder med kvikkleire, A2 Tilbakeregning av skred, NGI report 20092128-00-5-R, 2012.
[31] S. Nordal. Lecture Notes of PhD course BA8304 “Soil modeling”, NTNU, Trondheim, Norway, 2012.
[32] C. Surarak, S. Likitlersuang, D. Wanatowski, A. Balasubramaniam, E. Oh, H. Guan, Stiffness and strength parameters for hardening soil model of soft and stiff Bangkok clays. Soils and Foundations, 52(4), 682-697, 2012.
[33] K. Karlsrud, F.G. Hernandez-Martinez, Strength and deformation properties of Norwegian clays from laboratory tests on high-quality block samples 1. Canadian Geotechnical Journal, 50(12):1273-1293. 2013.
[34] D’Ignazio M., Mansikkamäki J., Länsivaara T. (2014). Anisotropic total and effective stress stability analysis of the Perniö failure test. Numerical Methods in Geotechnical Engineering (NUMGE), Conference Proceedings, CRC Press, 609-614, 2014.
[35] A.S. Gylland, H.P. Jostad, S. Nordal, Experimental study of strain localization in sensitive clays. Acta Geotechnica, 9(2):227-240, 2014.
[36] H.P. Jostad, P. Fornes, V. Thakur, Effect of Strain-Softening in Design of Fills on Gently Inclined Areas with Soft Sensitive Clays. Landslides in Sensitive Clays, 305-316, Springer, Netherlands, 2014.
[37] V. Thakur, H.P. Jostad, H.A. Kornbrekke, S.A. Degago, How well do we understand the undrained strain softening response in soft sensitive clays? Landslides in Sensitive Clays, 291-303, Springer, Netherlands, 2014.
[38] T. Berre, Presentation material: Creep Seminar, NGI, Oslo, Norway, 2015.
Marco D’Ignazio, Tim Länsivaara Tampere University of Technology, Tampere, Finland P.O. Box 600, FI-33101, Tampere, Finland [email protected]; [email protected]