Shayne Heffernan on the Spanish Banks Stress Tests
19
ANEXO Name of the Entity: Banco de Valencia mill. € % RWA Profit generation capacity (1) 111 0,7% Risk Weighted Assets (RWA) 16.322 100,0% Common Equity Tier (CET) 1 (2) 1.291 7,9% mill. € % Assets mill. € % Assets 3.306 18,2% 4.926 27,1% Non-Financial Firms Real Estate Developers 1.848 36,9% 2.589 51,7% Corporate (3) 1.014 13,8% 1.548 21,0% Retail Secured retail (4) 362 7,0% 652 12,5% Non secured retail 83 13,4% 137 22,1% 633 60,5% 737 70,4% Land 417 73,4% 482 84,8% Building in progress 7 58,8% 8 71,5% Finished property 209 44,8% 247 52,8% A3. Total losses current book (A1 +A2) 3.940 20,5% 5.662 29,4% A4. New Credit Book (5) 90 90 A5. Total Losses (A3+A4) 4.029 5.752 B1. Existing provisions (6) B2. Asset protection schemes B3. Profit generation capacity 2012-14 (1,8) B4. Tax impact B5. Capital buffer (7) mill. € % RWA 2014 mill. € % RWA 2014 C1. Common Equity Tier (CET) 1 2014 -809 -7,0% -2.845 -27,7% -1.846 -16,0% -3.462 -33,7% (1) Includes pre-provisioning profit of the Spanish business, and attributed post-provisioning and post-tax profit of international businesses (2) Includes CET 1 capital as of December 2011 plus realised capital actions before 31 August 2012 (3) Includes Public Works, Large Corporates, SMEs & Self-Employed (4) Includes first mortgage collateral and other secured retail (5) New credit origination backloaded towards the end of the period; hence percentage of cumulative losses not comparable with that of the back book (6) Existing provisions as of December 2011 and registered provisions from 1H12 in business combinations (7) Excess available capital above 9% CET1 base scenario / 6% CET1 adverse scenario, using estimated RWA level in each scenario A2. Foreclosed assets Base Scenario Adverse Scenario Results of the bottom up Stress Test Exercise December 2011 figures Base Scenario Adverse Scenario A1.Spanish Current Credit Book A) Estimated losses in each scenario 217 -107 2.184 1.820 674 2.290 C) Estimated capital excess / shortfall in each scenario C2. Capital excess/shortfall in relation to CET1 standards (B6-A5) (8) Includes losses from the sale of part of the equity stakes mill. € mill. € 0 -98 -107 254 B) Estimated loss absorption capacity in each scenario B6. Total loss absorption capacity (B1+B2+B3+B4+B5) Base Scenario Adverse Scenario 1.820 0
-
Upload
shayne-heffernan -
Category
Documents
-
view
239 -
download
1
description
Shayne Heffernan on the Spanish Banks Stress Tests
Transcript of Shayne Heffernan on the Spanish Banks Stress Tests
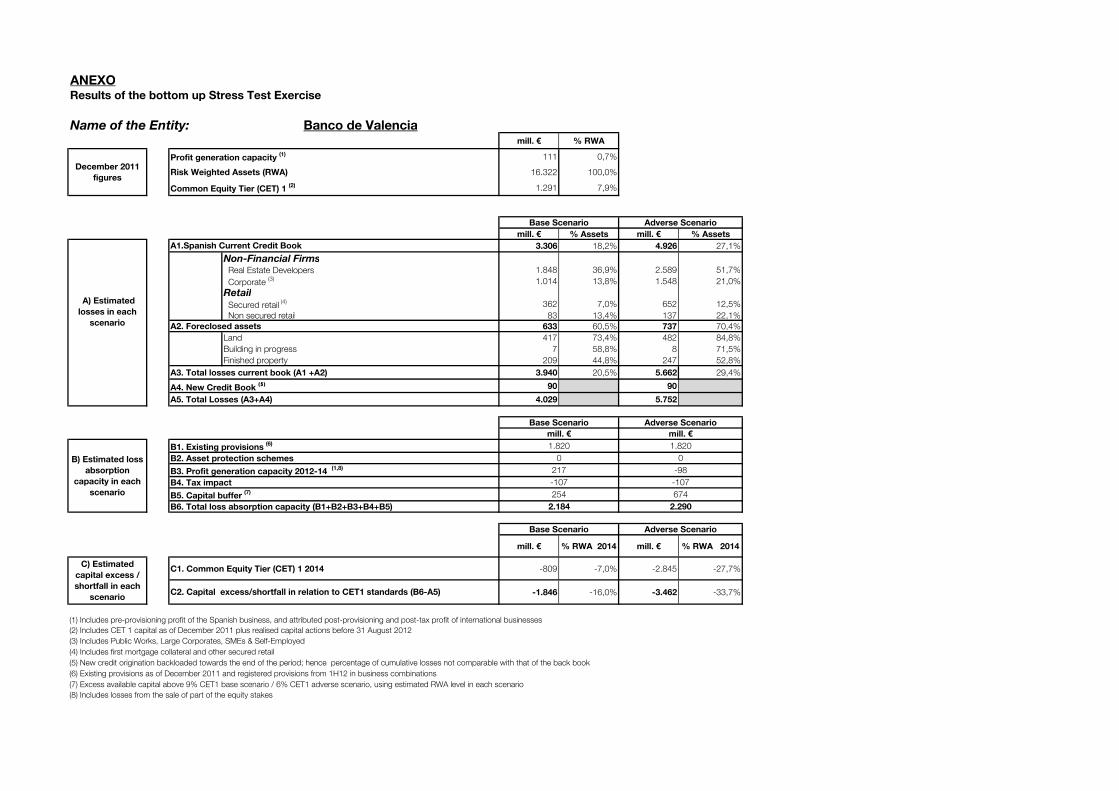
ANEXO
Name of the Entity: Banco de Valenciamill. € % RWA
Profit generation capacity (1) 111 0,7%
Risk Weighted Assets (RWA) 16.322 100,0%
Common Equity Tier (CET) 1 (2) 1.291 7,9%
mill. € % Assets mill. € % Assets
3.306 18,2% 4.926 27,1%
Non-Financial Firms Real Estate Developers 1.848 36,9% 2.589 51,7%
Corporate (3) 1.014 13,8% 1.548 21,0%
Retail
Secured retail (4) 362 7,0% 652 12,5%
Non secured retail 83 13,4% 137 22,1%
633 60,5% 737 70,4%
Land 417 73,4% 482 84,8%
Building in progress 7 58,8% 8 71,5%
Finished property 209 44,8% 247 52,8%
A3. Total losses current book (A1 +A2) 3.940 20,5% 5.662 29,4%
A4. New Credit Book (5) 90 90
A5. Total Losses (A3+A4) 4.029 5.752
B1. Existing provisions (6)
B2. Asset protection schemes
B3. Profit generation capacity 2012-14 (1,8)
B4. Tax impact
B5. Capital buffer (7)
mill. € % RWA 2014 mill. € % RWA 2014
C1. Common Equity Tier (CET) 1 2014 -809 -7,0% -2.845 -27,7%
-1.846 -16,0% -3.462 -33,7%
(1) Includes pre-provisioning profit of the Spanish business, and attributed post-provisioning and post-tax profit of international businesses
(2) Includes CET 1 capital as of December 2011 plus realised capital actions before 31 August 2012
(3) Includes Public Works, Large Corporates, SMEs & Self-Employed
(4) Includes first mortgage collateral and other secured retail
(5) New credit origination backloaded towards the end of the period; hence percentage of cumulative losses not comparable with that of the back book
(6) Existing provisions as of December 2011 and registered provisions from 1H12 in business combinations
(7) Excess available capital above 9% CET1 base scenario / 6% CET1 adverse scenario, using estimated RWA level in each scenario
A2. Foreclosed assets
Base Scenario Adverse Scenario
Results of the bottom up Stress Test Exercise
December 2011
figures
Base Scenario Adverse Scenario
A1.Spanish Current Credit Book
A) Estimated
losses in each
scenario
217
-107
2.184
1.820
674
2.290
C) Estimated
capital excess /
shortfall in each
scenarioC2. Capital excess/shortfall in relation to CET1 standards (B6-A5)
(8) Includes losses from the sale of part of the equity stakes
mill. € mill. €
0
-98
-107
254
B) Estimated loss
absorption
capacity in each
scenario
B6. Total loss absorption capacity (B1+B2+B3+B4+B5)
Base Scenario Adverse Scenario
1.820
0
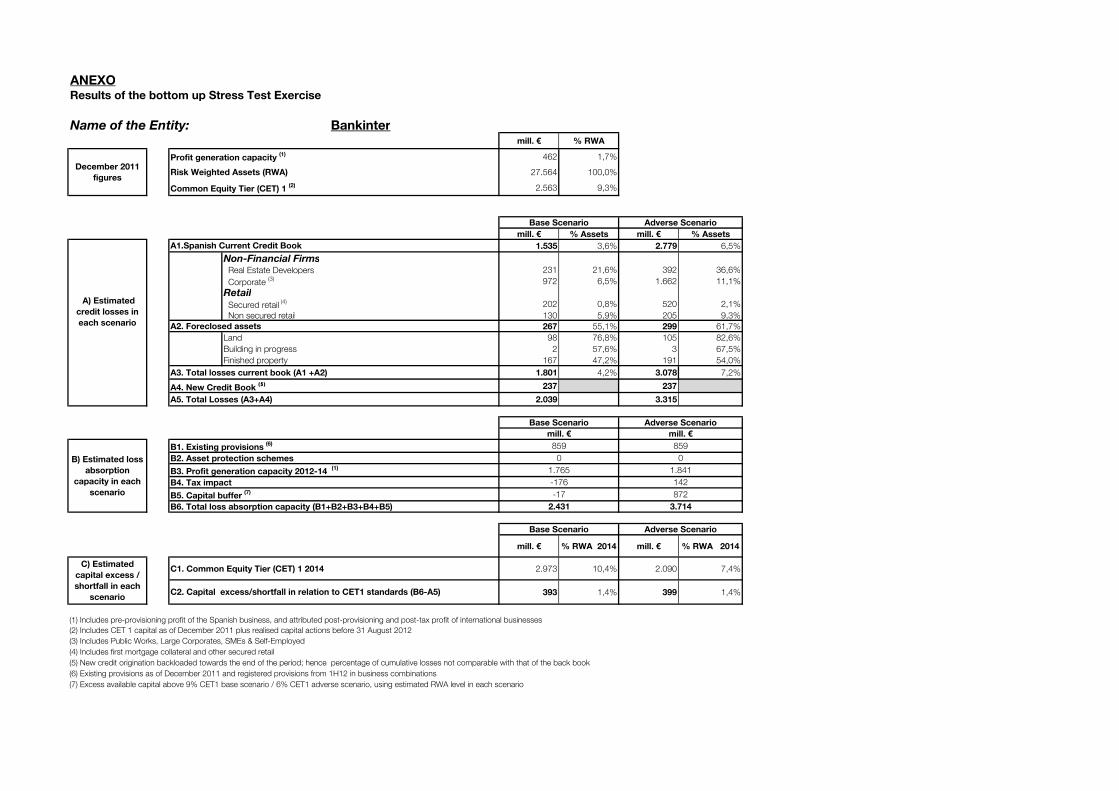
ANEXO
Name of the Entity: Bankintermill. € % RWA
Profit generation capacity (1) 462 1,7%
Risk Weighted Assets (RWA) 27.564 100,0%
Common Equity Tier (CET) 1 (2) 2.563 9,3%
mill. € % Assets mill. € % Assets
1.535 3,6% 2.779 6,5%
Non-Financial Firms Real Estate Developers 231 21,6% 392 36,6%
Corporate (3) 972 6,5% 1.662 11,1%
Retail
Secured retail (4) 202 0,8% 520 2,1%
Non secured retail 130 5,9% 205 9,3%
267 55,1% 299 61,7%
Land 98 76,8% 105 82,6%
Building in progress 2 57,6% 3 67,5%
Finished property 167 47,2% 191 54,0%
A3. Total losses current book (A1 +A2) 1.801 4,2% 3.078 7,2%
A4. New Credit Book (5) 237 237
A5. Total Losses (A3+A4) 2.039 3.315
B1. Existing provisions (6)
B2. Asset protection schemes
B3. Profit generation capacity 2012-14 (1)
B4. Tax impact
B5. Capital buffer (7)
mill. € % RWA 2014 mill. € % RWA 2014
C1. Common Equity Tier (CET) 1 2014 2.973 10,4% 2.090 7,4%
393 1,4% 399 1,4%
(1) Includes pre-provisioning profit of the Spanish business, and attributed post-provisioning and post-tax profit of international businesses
(2) Includes CET 1 capital as of December 2011 plus realised capital actions before 31 August 2012
(3) Includes Public Works, Large Corporates, SMEs & Self-Employed
(4) Includes first mortgage collateral and other secured retail
(5) New credit origination backloaded towards the end of the period; hence percentage of cumulative losses not comparable with that of the back book
(6) Existing provisions as of December 2011 and registered provisions from 1H12 in business combinations
(7) Excess available capital above 9% CET1 base scenario / 6% CET1 adverse scenario, using estimated RWA level in each scenario
Results of the bottom up Stress Test Exercise
December 2011
figures
Base Scenario Adverse Scenario
A) Estimated
credit losses in
each scenario
A1.Spanish Current Credit Book
A2. Foreclosed assets
B) Estimated loss
absorption
capacity in each
scenario
859 859
0 0
1.765
B6. Total loss absorption capacity (B1+B2+B3+B4+B5) 2.431 3.714
Base Scenario Adverse Scenario
mill. € mill. €
1.841
-176 142
-17 872
Base Scenario Adverse Scenario
C) Estimated
capital excess /
shortfall in each
scenarioC2. Capital excess/shortfall in relation to CET1 standards (B6-A5)
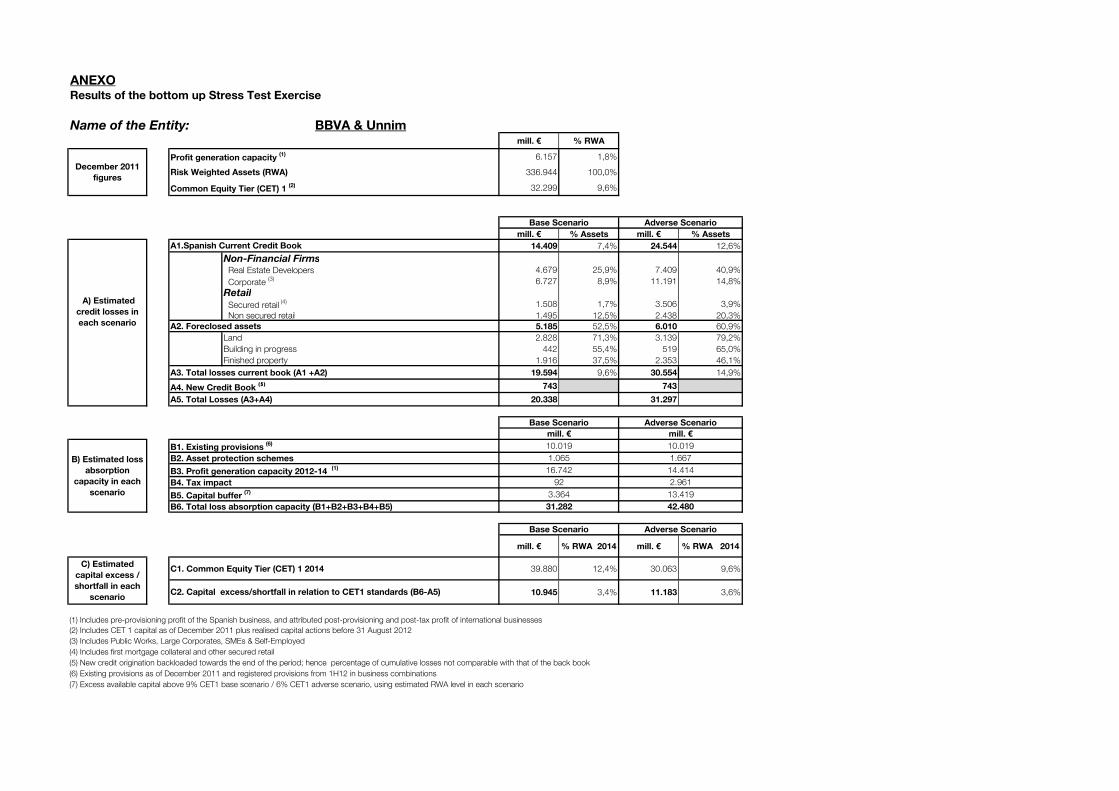
ANEXO
Name of the Entity: BBVA & Unnimmill. € % RWA
Profit generation capacity (1) 6.157 1,8%
Risk Weighted Assets (RWA) 336.944 100,0%
Common Equity Tier (CET) 1 (2) 32.299 9,6%
mill. € % Assets mill. € % Assets
14.409 7,4% 24.544 12,6%
Non-Financial Firms Real Estate Developers 4.679 25,9% 7.409 40,9%
Corporate (3) 6.727 8,9% 11.191 14,8%
Retail
Secured retail (4) 1.508 1,7% 3.506 3,9%
Non secured retail 1.495 12,5% 2.438 20,3%
5.185 52,5% 6.010 60,9%
Land 2.828 71,3% 3.139 79,2%
Building in progress 442 55,4% 519 65,0%
Finished property 1.916 37,5% 2.353 46,1%
A3. Total losses current book (A1 +A2) 19.594 9,6% 30.554 14,9%
A4. New Credit Book (5) 743 743
A5. Total Losses (A3+A4) 20.338 31.297
B1. Existing provisions (6)
B2. Asset protection schemes
B3. Profit generation capacity 2012-14 (1)
B4. Tax impact
B5. Capital buffer (7)
mill. € % RWA 2014 mill. € % RWA 2014
C1. Common Equity Tier (CET) 1 2014 39.880 12,4% 30.063 9,6%
10.945 3,4% 11.183 3,6%
(1) Includes pre-provisioning profit of the Spanish business, and attributed post-provisioning and post-tax profit of international businesses
(2) Includes CET 1 capital as of December 2011 plus realised capital actions before 31 August 2012
(3) Includes Public Works, Large Corporates, SMEs & Self-Employed
(4) Includes first mortgage collateral and other secured retail
(5) New credit origination backloaded towards the end of the period; hence percentage of cumulative losses not comparable with that of the back book
(6) Existing provisions as of December 2011 and registered provisions from 1H12 in business combinations
(7) Excess available capital above 9% CET1 base scenario / 6% CET1 adverse scenario, using estimated RWA level in each scenario
Base Scenario Adverse Scenario
C) Estimated
capital excess /
shortfall in each
scenarioC2. Capital excess/shortfall in relation to CET1 standards (B6-A5)
Base Scenario Adverse Scenario
mill. € mill. €
14.414
B) Estimated loss
absorption
capacity in each
scenario
10.019 10.019
1.065 1.667
16.742
B6. Total loss absorption capacity (B1+B2+B3+B4+B5) 31.282 42.480
92 2.961
3.364 13.419
Results of the bottom up Stress Test Exercise
December 2011
figures
Base Scenario Adverse Scenario
A) Estimated
credit losses in
each scenario
A1.Spanish Current Credit Book
A2. Foreclosed assets

ANEXO
Name of the Entity: BFA - Bankiamill. € % RWA
Profit generation capacity (1) 1.755 1,1%
Risk Weighted Assets (RWA) 164.613 100,0%
Common Equity Tier (CET) 1 (2) 8.006 4,9%
mill. € % Assets mill. € % Assets
21.352 11,3% 33.394 17,6%
Non-Financial Firms Real Estate Developers 12.636 32,5% 17.650 45,4%
Corporate (3) 6.318 11,1% 10.586 18,6%
Retail
Secured retail (4) 1.553 1,8% 3.697 4,3%
Non secured retail 845 11,0% 1.461 19,0%
8.006 55,0% 9.127 62,7%
Land 4.875 74,3% 5.307 80,9%
Building in progress 193 60,2% 221 69,3%
Finished property 2.939 38,3% 3.598 46,9%
A3. Total losses current book (A1 +A2) 29.358 14,4% 42.520 20,9%
A4. New Credit Book (5) 235 235
A5. Total Losses (A3+A4) 29.593 42.756
B1. Existing provisions (6)
B2. Asset protection schemes
B3. Profit generation capacity 2012-14 (1,8)
B4. Tax impact
B5. Capital buffer (7)
mill. € % RWA 2014 mill. € % RWA 2014
C1. Common Equity Tier (CET) 1 2014 -2.735 -2,3% -18.296 -17,0%
-13.230 -11,3% -24.743 -23,0%
(1) Includes pre-provisioning profit of the Spanish business, and attributed post-provisioning and post-tax profit of international businesses
(2) Includes CET 1 capital as of December 2011 plus realised capital actions before 31 August 2012
(3) Includes Public Works, Large Corporates, SMEs & Self-Employed
(4) Includes first mortgage collateral and other secured retail
(5) New credit origination backloaded towards the end of the period; hence percentage of cumulative losses not comparable with that of the back book
(6) Existing provisions as of December 2011 and registered provisions from 1H12 in business combinations
(7) Excess available capital above 9% CET1 base scenario / 6% CET1 adverse scenario, using estimated RWA level in each scenario
Results of the bottom up Stress Test Exercise
December 2011
figures
Base Scenario Adverse Scenario
A) Estimated
credit losses in
each scenario
A1.Spanish Current Credit Book
A2. Foreclosed assets
Base Scenario Adverse Scenario
mill. € mill. €
B) Estimated loss
absorption
capacity in each
scenario
19.750 19.750
0 0
163 -2.236
-1.060 -1.060
-2.490 1.558
B6. Total loss absorption capacity (B1+B2+B3+B4+B5) 16.363 18.012
Base Scenario Adverse Scenario
C) Estimated
capital excess /
shortfall in each
scenarioC2. Capital excess/shortfall in relation to CET1 standards (B6-A5)
(8) Includes losses from the sale of part of the equity stakes

ANEXO
Name of the Entity: BMNmill. € % RWA
Profit generation capacity (1) 303 0,8%
Risk Weighted Assets (RWA) 37.847 100,0%
Common Equity Tier (CET) 1 (2) 3.525 9,3%
mill. € % Assets mill. € % Assets
3.950 8,2% 6.900 14,3%
Non-Financial Firms Real Estate Developers 2.047 22,8% 3.551 39,5%
Corporate (3) 1.301 10,1% 2.034 15,8%
Retail
Secured retail (4) 440 1,8% 1.028 4,3%
Non secured retail 162 7,7% 287 13,6%
2.047 55,8% 2.349 64,0%
Land 1.080 73,6% 1.193 81,2%
Building in progress 132 56,2% 156 66,1%
Finished property 835 42,5% 1.001 51,0%
A3. Total losses current book (A1 +A2) 5.997 11,6% 9.249 17,9%
A4. New Credit Book (5) 199 199
A5. Total Losses (A3+A4) 6.197 9.448
B1. Existing provisions (6)
B2. Asset protection schemes
B3. Profit generation capacity 2012-14 (1)
B4. Tax impact
B5. Capital buffer (7)
mill. € % RWA 2014 mill. € % RWA 2014
C1. Common Equity Tier (CET) 1 2014 2.701 7,9% -332 -1,1%
-368 -1,1% -2.208 -7,1%
(1) Includes pre-provisioning profit of the Spanish business, and attributed post-provisioning and post-tax profit of international businesses
(2) Includes CET 1 capital as of December 2011 plus realised capital actions before 31 August 2012
(3) Includes Public Works, Large Corporates, SMEs & Self-Employed
(4) Includes first mortgage collateral and other secured retail
(5) New credit origination backloaded towards the end of the period; hence percentage of cumulative losses not comparable with that of the back book
(6) Existing provisions as of December 2011 and registered provisions from 1H12 in business combinations
(7) Excess available capital above 9% CET1 base scenario / 6% CET1 adverse scenario, using estimated RWA level in each scenario
Results of the bottom up Stress Test Exercise
December 2011
figures
Base Scenario Adverse Scenario
A) Estimated
credit losses in
each scenario
A1.Spanish Current Credit Book
A2. Foreclosed assets
B) Estimated loss
absorption
capacity in each
scenario
3.852 3.852
0 0
1.531
B6. Total loss absorption capacity (B1+B2+B3+B4+B5) 5.829 7.240
Base Scenario Adverse Scenario
mill. € mill. €
870
-10 870
456 1.649
Base Scenario Adverse Scenario
C) Estimated
capital excess /
shortfall in each
scenarioC2. Capital excess/shortfall in relation to CET1 standards (B6-A5)
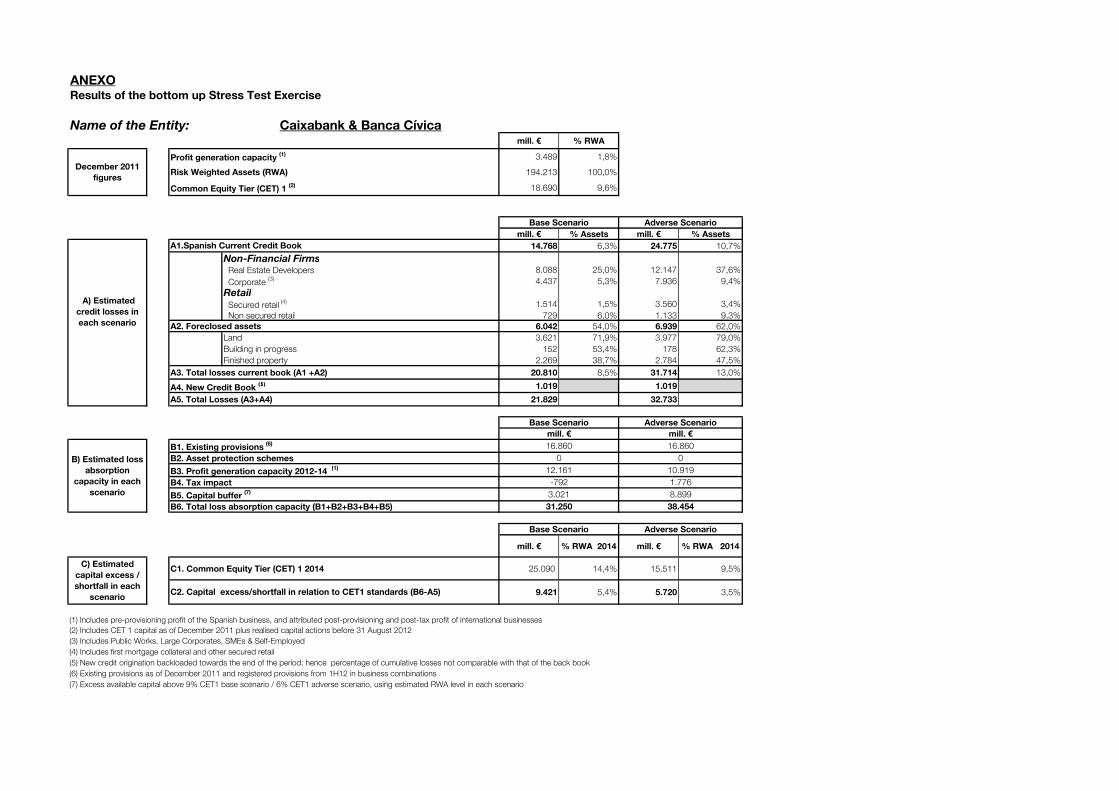
ANEXO
Name of the Entity: Caixabank & Banca Cívicamill. € % RWA
Profit generation capacity (1) 3.489 1,8%
Risk Weighted Assets (RWA) 194.213 100,0%
Common Equity Tier (CET) 1 (2) 18.690 9,6%
mill. € % Assets mill. € % Assets
14.768 6,3% 24.775 10,7%
Non-Financial Firms Real Estate Developers 8.088 25,0% 12.147 37,6%
Corporate (3) 4.437 5,3% 7.936 9,4%
Retail
Secured retail (4) 1.514 1,5% 3.560 3,4%
Non secured retail 729 6,0% 1.133 9,3%
6.042 54,0% 6.939 62,0%
Land 3.621 71,9% 3.977 79,0%
Building in progress 152 53,4% 178 62,3%
Finished property 2.269 38,7% 2.784 47,5%
A3. Total losses current book (A1 +A2) 20.810 8,5% 31.714 13,0%
A4. New Credit Book (5) 1.019 1.019
A5. Total Losses (A3+A4) 21.829 32.733
B1. Existing provisions (6)
B2. Asset protection schemes
B3. Profit generation capacity 2012-14 (1)
B4. Tax impact
B5. Capital buffer (7)
mill. € % RWA 2014 mill. € % RWA 2014
C1. Common Equity Tier (CET) 1 2014 25.090 14,4% 15.511 9,5%
9.421 5,4% 5.720 3,5%
(1) Includes pre-provisioning profit of the Spanish business, and attributed post-provisioning and post-tax profit of international businesses
(2) Includes CET 1 capital as of December 2011 plus realised capital actions before 31 August 2012
(3) Includes Public Works, Large Corporates, SMEs & Self-Employed
(4) Includes first mortgage collateral and other secured retail
(5) New credit origination backloaded towards the end of the period; hence percentage of cumulative losses not comparable with that of the back book
(6) Existing provisions as of December 2011 and registered provisions from 1H12 in business combinations
(7) Excess available capital above 9% CET1 base scenario / 6% CET1 adverse scenario, using estimated RWA level in each scenario
16.860
8.899
38.454
A2. Foreclosed assets
A) Estimated
credit losses in
each scenario
Base Scenario Adverse Scenario
B) Estimated loss
absorption
capacity in each
scenario
B6. Total loss absorption capacity (B1+B2+B3+B4+B5)
Results of the bottom up Stress Test Exercise
December 2011
figures
Base Scenario Adverse Scenario
A1.Spanish Current Credit Book
C) Estimated
capital excess /
shortfall in each
scenarioC2. Capital excess/shortfall in relation to CET1 standards (B6-A5)
mill. € mill. €
0
10.919
1.776
3.021
31.250
Base Scenario Adverse Scenario
16.860
0
12.161
-792

ANEXO
Name of the Entity: Caja 3mill. € % RWA
Profit generation capacity (1) 150 1,2%
Risk Weighted Assets (RWA) 12.743 100,0%
Common Equity Tier (CET) 1 (2) 1.146 9,0%
mill. € % Assets mill. € % Assets
1.496 11,0% 2.441 18,0%
Non-Financial Firms Real Estate Developers 1.137 28,8% 1.809 45,9%
Corporate (3) 223 6,3% 367 10,4%
Retail
Secured retail (4) 80 1,5% 180 3,4%
Non secured retail 55 6,6% 85 10,2%
423 56,0% 476 63,1%
Land 279 68,2% 308 75,3%
Building in progress 12 52,7% 14 61,4%
Finished property 132 40,9% 153 47,6%
A3. Total losses current book (A1 +A2) 1.919 13,4% 2.917 20,3%
A4. New Credit Book (5) 54 54
A5. Total Losses (A3+A4) 1.973 2.972
B1. Existing provisions (6)
B2. Asset protection schemes
B3. Profit generation capacity 2012-14 (1)
B4. Tax impact
B5. Capital buffer (7)
mill. € % RWA 2014 mill. € % RWA 2014
C1. Common Equity Tier (CET) 1 2014 812 7,3% -153 -1,5%
-188 -1,7% -779 -7,5%
(1) Includes pre-provisioning profit of the Spanish business, and attributed post-provisioning and post-tax profit of international businesses
(2) Includes CET 1 capital as of December 2011 plus realised capital actions before 31 August 2012
(3) Includes Public Works, Large Corporates, SMEs & Self-Employed
(4) Includes first mortgage collateral and other secured retail
(5) New credit origination backloaded towards the end of the period; hence percentage of cumulative losses not comparable with that of the back book
(6) Existing provisions as of December 2011 and registered provisions from 1H12 in business combinations
(7) Excess available capital above 9% CET1 base scenario / 6% CET1 adverse scenario, using estimated RWA level in each scenario
Results of the bottom up Stress Test Exercise
December 2011
figures
Base Scenario Adverse Scenario
A) Estimated
credit losses in
each scenario
A1.Spanish Current Credit Book
A2. Foreclosed assets
B) Estimated loss
absorption
capacity in each
scenario
1.149 1.149
0 0
430
B6. Total loss absorption capacity (B1+B2+B3+B4+B5) 1.785 2.192
Base Scenario Adverse Scenario
mill. € mill. €
184
59 339
146 520
Base Scenario Adverse Scenario
C) Estimated
capital excess /
shortfall in each
scenarioC2. Capital excess/shortfall in relation to CET1 standards (B6-A5)
ANEXO
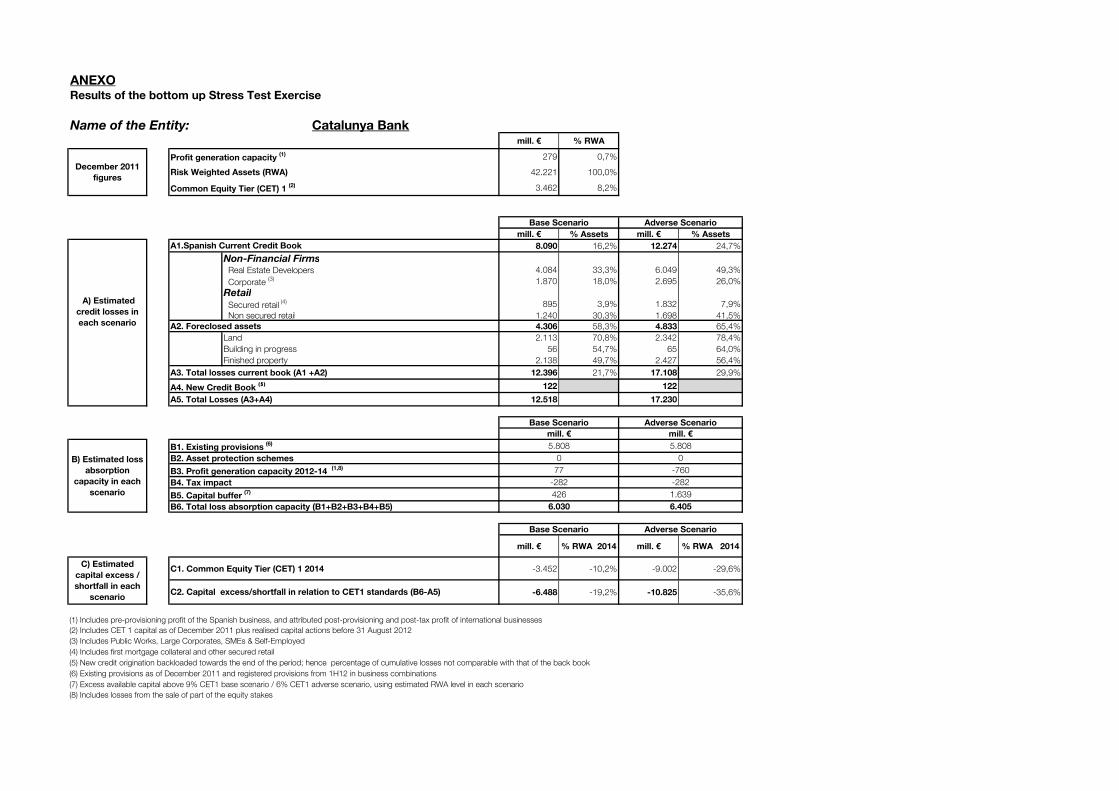
Name of the Entity: Catalunya Bankmill. € % RWA
Profit generation capacity (1) 279 0,7%
Risk Weighted Assets (RWA) 42.221 100,0%
Common Equity Tier (CET) 1 (2) 3.462 8,2%
mill. € % Assets mill. € % Assets
8.090 16,2% 12.274 24,7%
Non-Financial Firms Real Estate Developers 4.084 33,3% 6.049 49,3%
Corporate (3) 1.870 18,0% 2.695 26,0%
Retail
Secured retail (4) 895 3,9% 1.832 7,9%
Non secured retail 1.240 30,3% 1.698 41,5%
4.306 58,3% 4.833 65,4%
Land 2.113 70,8% 2.342 78,4%
Building in progress 56 54,7% 65 64,0%
Finished property 2.138 49,7% 2.427 56,4%
A3. Total losses current book (A1 +A2) 12.396 21,7% 17.108 29,9%
A4. New Credit Book (5) 122 122
A5. Total Losses (A3+A4) 12.518 17.230
B1. Existing provisions (6)
B2. Asset protection schemes
B3. Profit generation capacity 2012-14 (1,8)
B4. Tax impact
B5. Capital buffer (7)
mill. € % RWA 2014 mill. € % RWA 2014
C1. Common Equity Tier (CET) 1 2014 -3.452 -10,2% -9.002 -29,6%
-6.488 -19,2% -10.825 -35,6%
(1) Includes pre-provisioning profit of the Spanish business, and attributed post-provisioning and post-tax profit of international businesses
(2) Includes CET 1 capital as of December 2011 plus realised capital actions before 31 August 2012
(3) Includes Public Works, Large Corporates, SMEs & Self-Employed
(4) Includes first mortgage collateral and other secured retail
(5) New credit origination backloaded towards the end of the period; hence percentage of cumulative losses not comparable with that of the back book
(6) Existing provisions as of December 2011 and registered provisions from 1H12 in business combinations
(7) Excess available capital above 9% CET1 base scenario / 6% CET1 adverse scenario, using estimated RWA level in each scenario
Results of the bottom up Stress Test Exercise
December 2011
figures
Base Scenario Adverse Scenario
A) Estimated
credit losses in
each scenario
A1.Spanish Current Credit Book
A2. Foreclosed assets
Base Scenario Adverse Scenario
mill. € mill. €
B) Estimated loss
absorption
capacity in each
scenario
5.808 5.808
0 0
77 -760
-282 -282
426 1.639
B6. Total loss absorption capacity (B1+B2+B3+B4+B5) 6.030 6.405
Base Scenario Adverse Scenario
C) Estimated
capital excess /
shortfall in each
scenarioC2. Capital excess/shortfall in relation to CET1 standards (B6-A5)
(8) Includes losses from the sale of part of the equity stakes

ANEXO
Name of the Entity: CEISSmill. € % RWA
Profit generation capacity (1) 196 0,8%
Risk Weighted Assets (RWA) 23.719 100,0%
Common Equity Tier (CET) 1 (2) 1.902 8,0%
mill. € % Assets mill. € % Assets
2.929 11,3% 4.464 17,3%
Non-Financial Firms Real Estate Developers 2.076 32,9% 3.071 48,7%
Corporate (3) 598 10,1% 886 15,0%
Retail
Secured retail (4) 105 0,9% 265 2,2%
Non secured retail 151 10,4% 242 16,7%
1.101 50,8% 1.289 59,5%
Land 560 70,4% 639 80,3%
Building in progress 95 54,9% 114 65,8%
Finished property 446 37,2% 536 44,7%
A3. Total losses current book (A1 +A2) 4.030 14,4% 5.753 20,5%
A4. New Credit Book (5) 113 113
A5. Total Losses (A3+A4) 4.143 5.866
B1. Existing provisions (6)
B2. Asset protection schemes
B3. Profit generation capacity 2012-14 (1)
B4. Tax impact
B5. Capital buffer (7)
mill. € % RWA 2014 mill. € % RWA 2014
C1. Common Equity Tier (CET) 1 2014 507 2,6% -960 -5,2%
-1.269 -6,4% -2.063 -11,2%
(1) Includes pre-provisioning profit of the Spanish business, and attributed post-provisioning and post-tax profit of international businesses
(2) Includes CET 1 capital as of December 2011 plus realised capital actions before 31 August 2012
(3) Includes Public Works, Large Corporates, SMEs & Self-Employed
(4) Includes first mortgage collateral and other secured retail
(5) New credit origination backloaded towards the end of the period; hence percentage of cumulative losses not comparable with that of the back book
(6) Existing provisions as of December 2011 and registered provisions from 1H12 in business combinations
(7) Excess available capital above 9% CET1 base scenario / 6% CET1 adverse scenario, using estimated RWA level in each scenario
Results of the bottom up Stress Test Exercise
December 2011
figures
Base Scenario Adverse Scenario
A) Estimated
credit losses in
each scenario
A1.Spanish Current Credit Book
A2. Foreclosed assets
B) Estimated loss
absorption
capacity in each
scenario
2.123 2.123
0 0
297
B6. Total loss absorption capacity (B1+B2+B3+B4+B5) 2.874 3.803
Base Scenario Adverse Scenario
mill. € mill. €
175
328 706
126 799
Base Scenario Adverse Scenario
C) Estimated
capital excess /
shortfall in each
scenarioC2. Capital excess/shortfall in relation to CET1 standards (B6-A5)

ANEXO
Name of the Entity: Ibercajamill. € % RWA
Profit generation capacity (1) 269 1,2%
Risk Weighted Assets (RWA) 22.295 100,0%
Common Equity Tier (CET) 1 (2) 2.292 10,3%
mill. € % Assets mill. € % Assets
1.706 5,3% 3.101 9,7%
Non-Financial Firms Real Estate Developers 933 22,7% 1.658 40,4%
Corporate (3) 447 8,4% 727 13,7%
Retail
Secured retail (4) 179 0,8% 503 2,4%
Non secured retail 146 10,3% 213 15,0%
735 58,2% 829 65,6%
Land 489 70,8% 535 77,4%
Building in progress 2 56,7% 2 66,3%
Finished property 244 43,0% 292 51,3%
A3. Total losses current book (A1 +A2) 2.441 7,3% 3.930 11,8%
A4. New Credit Book (5) 123 123
A5. Total Losses (A3+A4) 2.564 4.053
B1. Existing provisions (6)
B2. Asset protection schemes
B3. Profit generation capacity 2012-14 (1)
B4. Tax impact
B5. Capital buffer (7)
mill. € % RWA 2014 mill. € % RWA 2014
C1. Common Equity Tier (CET) 1 2014 2.259 10,9% 944 4,8%
389 1,9% -226 -1,2%
(1) Includes pre-provisioning profit of the Spanish business, and attributed post-provisioning and post-tax profit of international businesses
(2) Includes CET 1 capital as of December 2011 plus realised capital actions before 31 August 2012
(3) Includes Public Works, Large Corporates, SMEs & Self-Employed
(4) Includes first mortgage collateral and other secured retail
(5) New credit origination backloaded towards the end of the period; hence percentage of cumulative losses not comparable with that of the back book
(6) Existing provisions as of December 2011 and registered provisions from 1H12 in business combinations
(7) Excess available capital above 9% CET1 base scenario / 6% CET1 adverse scenario, using estimated RWA level in each scenario
Results of the bottom up Stress Test Exercise
December 2011
figures
Base Scenario Adverse Scenario
A) Estimated
credit losses in
each scenario
A1.Spanish Current Credit Book
A2. Foreclosed assets
B) Estimated loss
absorption
capacity in each
scenario
1.193 1.193
0 0
1.333
B6. Total loss absorption capacity (B1+B2+B3+B4+B5) 2.953 3.827
Base Scenario Adverse Scenario
mill. € mill. €
1.112
6 399
421 1.123
Base Scenario Adverse Scenario
C) Estimated
capital excess /
shortfall in each
scenarioC2. Capital excess/shortfall in relation to CET1 standards (B6-A5)

ANEXO
Name of the Entity: Kutxabankmill. € % RWA
Profit generation capacity (1) 592 1,3%
Risk Weighted Assets (RWA) 47.334 100,0%
Common Equity Tier (CET) 1 (2) 5.770 12,2%
mill. € % Assets mill. € % Assets
3.695 6,6% 5.863 10,5%
Non-Financial Firms Real Estate Developers 2.037 31,0% 2.924 44,5%
Corporate (3) 1.127 9,3% 1.813 15,0%
Retail
Secured retail (4) 309 0,9% 751 2,2%
Non secured retail 222 7,3% 375 12,3%
1.233 54,4% 1.399 61,7%
Land 760 70,9% 829 77,3%
Building in progress 86 54,9% 100 63,6%
Finished property 387 37,2% 470 45,2%
A3. Total losses current book (A1 +A2) 4.929 8,5% 7.261 12,5%
A4. New Credit Book (5) 128 128
A5. Total Losses (A3+A4) 5.057 7.389
B1. Existing provisions (6)
B2. Asset protection schemes
B3. Profit generation capacity 2012-14 (1)
B4. Tax impact
B5. Capital buffer (7)
mill. € % RWA 2014 mill. € % RWA 2014
C1. Common Equity Tier (CET) 1 2014 6.874 16,5% 4.549 11,6%
3.132 7,5% 2.188 5,6%
(1) Includes pre-provisioning profit of the Spanish business, and attributed post-provisioning and post-tax profit of international businesses
(2) Includes CET 1 capital as of December 2011 plus realised capital actions before 31 August 2012
(3) Includes Public Works, Large Corporates, SMEs & Self-Employed
(4) Includes first mortgage collateral and other secured retail
(5) New credit origination backloaded towards the end of the period; hence percentage of cumulative losses not comparable with that of the back book
(6) Existing provisions as of December 2011 and registered provisions from 1H12 in business combinations
(7) Excess available capital above 9% CET1 base scenario / 6% CET1 adverse scenario, using estimated RWA level in each scenario
Results of the bottom up Stress Test Exercise
December 2011
figures
Base Scenario Adverse Scenario
A) Estimated
credit losses in
each scenario
A1.Spanish Current Credit Book
A2. Foreclosed assets
B) Estimated loss
absorption
capacity in each
scenario
4.043 4.043
0 0
2.412
B6. Total loss absorption capacity (B1+B2+B3+B4+B5) 8.188 9.577
Base Scenario Adverse Scenario
mill. € mill. €
1.745
-294 381
2.028 3.409
Base Scenario Adverse Scenario
C) Estimated
capital excess /
shortfall in each
scenarioC2. Capital excess/shortfall in relation to CET1 standards (B6-A5)

ANEXO
Name of the Entity: Liberbankmill. € % RWA
Profit generation capacity (1) 464 1,7%
Risk Weighted Assets (RWA) 27.703 100,0%
Common Equity Tier (CET) 1 (2) 2.707 9,8%
mill. € % Assets mill. € % Assets
5.249 13,8% 7.406 19,5%
Non-Financial Firms Real Estate Developers 2.907 33,2% 3.941 45,0%
Corporate (3) 1.941 17,4% 2.636 23,7%
Retail
Secured retail (4) 195 1,2% 495 3,0%
Non secured retail 206 11,7% 334 18,9%
1.238 53,9% 1.391 60,6%
Land 703 69,1% 768 75,5%
Building in progress 69 53,3% 81 62,5%
Finished property 466 40,6% 542 47,2%
A3. Total losses current book (A1 +A2) 6.487 16,1% 8.797 21,8%
A4. New Credit Book (5) 97 97
A5. Total Losses (A3+A4) 6.584 8.894
B1. Existing provisions (6)
B2. Asset protection schemes
B3. Profit generation capacity 2012-14 (1)
B4. Tax impact
B5. Capital buffer (7)
mill. € % RWA 2014 mill. € % RWA 2014
C1. Common Equity Tier (CET) 1 2014 2.240 9,4% 140 0,6%
103 0,4% -1.198 -5,4%
(1) Includes pre-provisioning profit of the Spanish business, and attributed post-provisioning and post-tax profit of international businesses
(2) Includes CET 1 capital as of December 2011 plus realised capital actions before 31 August 2012
(3) Includes Public Works, Large Corporates, SMEs & Self-Employed
(4) Includes first mortgage collateral and other secured retail
(5) New credit origination backloaded towards the end of the period; hence percentage of cumulative losses not comparable with that of the back book
(6) Existing provisions as of December 2011 and registered provisions from 1H12 in business combinations
(7) Excess available capital above 9% CET1 base scenario / 6% CET1 adverse scenario, using estimated RWA level in each scenario
C) Estimated
capital excess /
shortfall in each
scenarioC2. Capital excess/shortfall in relation to CET1 standards (B6-A5)
mill. € mill. €
1.027
851
668
569
6.687
Base Scenario Adverse Scenario
3.781
1.027
1.233
77
Results of the bottom up Stress Test Exercise
December 2011
figures
Base Scenario Adverse Scenario
A1.Spanish Current Credit Book
3.781
1.369
7.696
A2. Foreclosed assets
A) Estimated
credit losses in
each scenario
Base Scenario Adverse Scenario
B) Estimated loss
absorption
capacity in each
scenario
B6. Total loss absorption capacity (B1+B2+B3+B4+B5)

ANEXO
Name of the Entity: Ibercaja & Caja3 & Liberbankmill. € % RWA
Profit generation capacity (1) 883 1,4%
Risk Weighted Assets (RWA) 62.679 100,0%
Common Equity Tier (CET) 1 (2) 6.367 10,2%
mill. € % Assets mill. € % Assets
8.451 10,1% 12.948 15,5%
Non-Financial Firms Real Estate Developers 4.978 29,6% 7.409 44,1%
Corporate (3) 2.611 13,1% 3.729 18,6%
Retail
Secured retail (4) 454 1,1% 1.178 2,7%
Non secured retail 408 10,2% 632 15,7%
2.397 55,6% 2.696 62,5%
Land 1.472 69,5% 1.612 76,1%
Building in progress 83 53,3% 97 62,4%
Finished property 842 41,3% 987 48,4%
A3. Total losses current book (A1 +A2) 10.847 12,3% 15.645 17,8%
A4. New Credit Book (5) 249 249
A5. Total Losses (A3+A4) 11.096 15.893
B1. Existing provisions (6)
B2. Asset protection schemes
B3. Profit generation capacity 2012-14 (1)
B4. Tax impact
B5. Capital buffer (7)
mill. € % RWA 2014 mill. € % RWA 2014
C1. Common Equity Tier (CET) 1 2014 5.676 9,9% 1.115 2,1%
492 0,9% -2.108 -3,9%
(1) Includes pre-provisioning profit of the Spanish business, and attributed post-provisioning and post-tax profit of international businesses
(2) Includes CET 1 capital as of December 2011 plus realised capital actions before 31 August 2012
(3) Includes Public Works, Large Corporates, SMEs & Self-Employed
(4) Includes first mortgage collateral and other secured retail
(5) New credit origination backloaded towards the end of the period; hence percentage of cumulative losses not comparable with that of the back book
(6) Existing provisions as of December 2011 and registered provisions from 1H12 in business combinations
(7) Excess available capital above 9% CET1 base scenario / 6% CET1 adverse scenario, using estimated RWA level in each scenario
6.103
3.144
13.785
A2. Foreclosed assets
A) Estimated
credit losses in
each scenario
Base Scenario Adverse Scenario
B) Estimated loss
absorption
capacity in each
scenario
B6. Total loss absorption capacity (B1+B2+B3+B4+B5)
Results of the bottom up Stress Test Exercise
December 2011
figures
Base Scenario Adverse Scenario
A1.Spanish Current Credit Book
C) Estimated
capital excess /
shortfall in each
scenarioC2. Capital excess/shortfall in relation to CET1 standards (B6-A5)
mill. € mill. €
1.027
2.171
1.340
1.183
11.588
Base Scenario Adverse Scenario
6.103
1.027
3.148
126
ANEXO
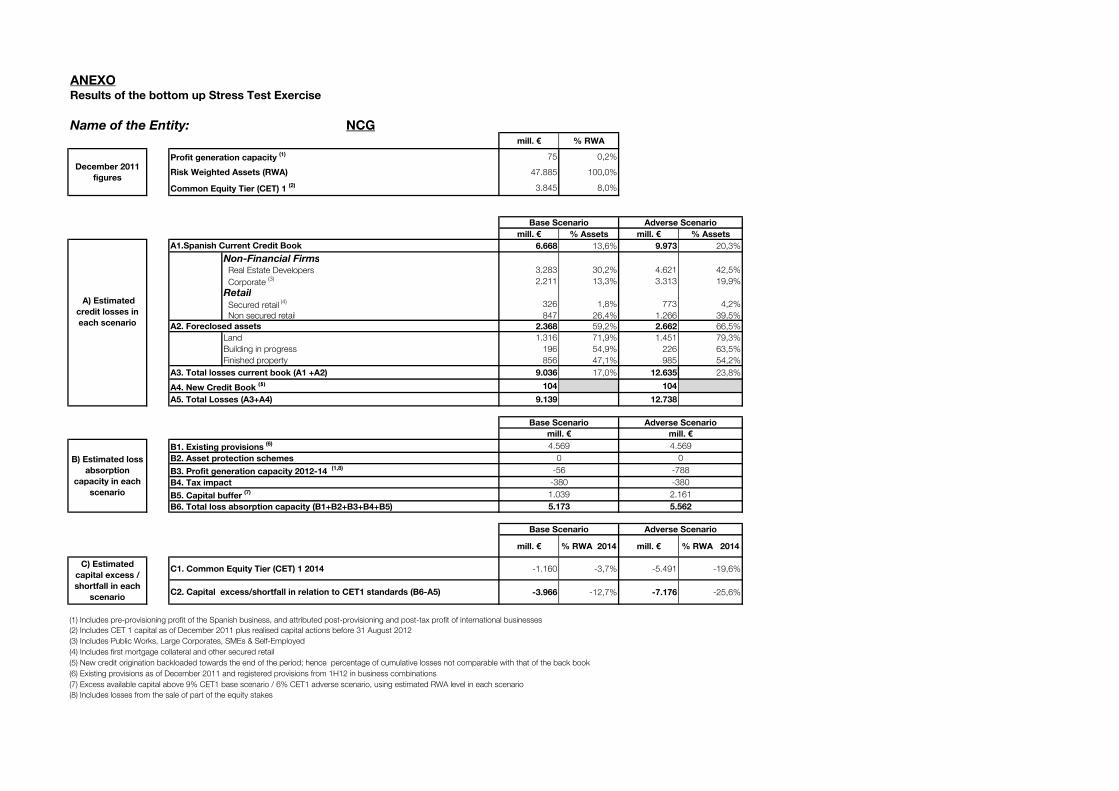
Name of the Entity: NCGmill. € % RWA
Profit generation capacity (1) 75 0,2%
Risk Weighted Assets (RWA) 47.885 100,0%
Common Equity Tier (CET) 1 (2) 3.845 8,0%
mill. € % Assets mill. € % Assets
6.668 13,6% 9.973 20,3%
Non-Financial Firms Real Estate Developers 3.283 30,2% 4.621 42,5%
Corporate (3) 2.211 13,3% 3.313 19,9%
Retail
Secured retail (4) 326 1,8% 773 4,2%
Non secured retail 847 26,4% 1.266 39,5%
2.368 59,2% 2.662 66,5%
Land 1.316 71,9% 1.451 79,3%
Building in progress 196 54,9% 226 63,5%
Finished property 856 47,1% 985 54,2%
A3. Total losses current book (A1 +A2) 9.036 17,0% 12.635 23,8%
A4. New Credit Book (5) 104 104
A5. Total Losses (A3+A4) 9.139 12.738
B1. Existing provisions (6)
B2. Asset protection schemes
B3. Profit generation capacity 2012-14 (1,8)
B4. Tax impact
B5. Capital buffer (7)
mill. € % RWA 2014 mill. € % RWA 2014
C1. Common Equity Tier (CET) 1 2014 -1.160 -3,7% -5.491 -19,6%
-3.966 -12,7% -7.176 -25,6%
(1) Includes pre-provisioning profit of the Spanish business, and attributed post-provisioning and post-tax profit of international businesses
(2) Includes CET 1 capital as of December 2011 plus realised capital actions before 31 August 2012
(3) Includes Public Works, Large Corporates, SMEs & Self-Employed
(4) Includes first mortgage collateral and other secured retail
(5) New credit origination backloaded towards the end of the period; hence percentage of cumulative losses not comparable with that of the back book
(6) Existing provisions as of December 2011 and registered provisions from 1H12 in business combinations
(7) Excess available capital above 9% CET1 base scenario / 6% CET1 adverse scenario, using estimated RWA level in each scenario
Results of the bottom up Stress Test Exercise
December 2011
figures
Base Scenario Adverse Scenario
A) Estimated
credit losses in
each scenario
A1.Spanish Current Credit Book
A2. Foreclosed assets
Base Scenario Adverse Scenario
mill. € mill. €
B) Estimated loss
absorption
capacity in each
scenario
4.569 4.569
0 0
-56 -788
-380 -380
1.039 2.161
B6. Total loss absorption capacity (B1+B2+B3+B4+B5) 5.173 5.562
Base Scenario Adverse Scenario
C) Estimated
capital excess /
shortfall in each
scenarioC2. Capital excess/shortfall in relation to CET1 standards (B6-A5)
(8) Includes losses from the sale of part of the equity stakes

ANEXO
Name of the Entity: Popular & Pastormill. € % RWA
Profit generation capacity (1) 1.802 1,8%
Risk Weighted Assets (RWA) 97.678 100,0%
Common Equity Tier (CET) 1 (2) 9.936 10,2%
mill. € % Assets mill. € % Assets
9.520 9,2% 16.197 15,7%
Non-Financial Firms Real Estate Developers 4.580 21,0% 7.593 34,8%
Corporate (3) 3.830 8,0% 6.351 13,3%
Retail
Secured retail (4) 715 2,5% 1.571 5,4%
Non secured retail 393 8,5% 682 14,7%
4.892 56,4% 5.511 63,5%
Land 2.458 75,2% 2.667 81,6%
Building in progress 158 58,3% 181 67,0%
Finished property 2.277 44,3% 2.662 51,8%
A3. Total losses current book (A1 +A2) 14.412 12,9% 21.708 19,4%
A4. New Credit Book (5) 666 666
A5. Total Losses (A3+A4) 15.078 22.374
B1. Existing provisions (6)
B2. Asset protection schemes
B3. Profit generation capacity 2012-14 (1)
B4. Tax impact
B5. Capital buffer (7)
mill. € % RWA 2014 mill. € % RWA 2014
C1. Common Equity Tier (CET) 1 2014 8.669 9,8% 1.721 2,1%
677 0,8% -3.223 -3,9%
(1) Includes pre-provisioning profit of the Spanish business, and attributed post-provisioning and post-tax profit of international businesses
(2) Includes CET 1 capital as of December 2011 plus realised capital actions before 31 August 2012
(3) Includes Public Works, Large Corporates, SMEs & Self-Employed
(4) Includes first mortgage collateral and other secured retail
(5) New credit origination backloaded towards the end of the period; hence percentage of cumulative losses not comparable with that of the back book
(6) Existing provisions as of December 2011 and registered provisions from 1H12 in business combinations
(7) Excess available capital above 9% CET1 base scenario / 6% CET1 adverse scenario, using estimated RWA level in each scenario
Base Scenario Adverse Scenario
C) Estimated
capital excess /
shortfall in each
scenarioC2. Capital excess/shortfall in relation to CET1 standards (B6-A5)
Base Scenario Adverse Scenario
mill. € mill. €
4.153
B) Estimated loss
absorption
capacity in each
scenario
7.767 7.767
0 0
5.834
B6. Total loss absorption capacity (B1+B2+B3+B4+B5) 15.755 19.151
210 2.239
1.944 4.992
Results of the bottom up Stress Test Exercise
December 2011
figures
Base Scenario Adverse Scenario
A) Estimated
credit losses in
each scenario
A1.Spanish Current Credit Book
A2. Foreclosed assets
ANEXO
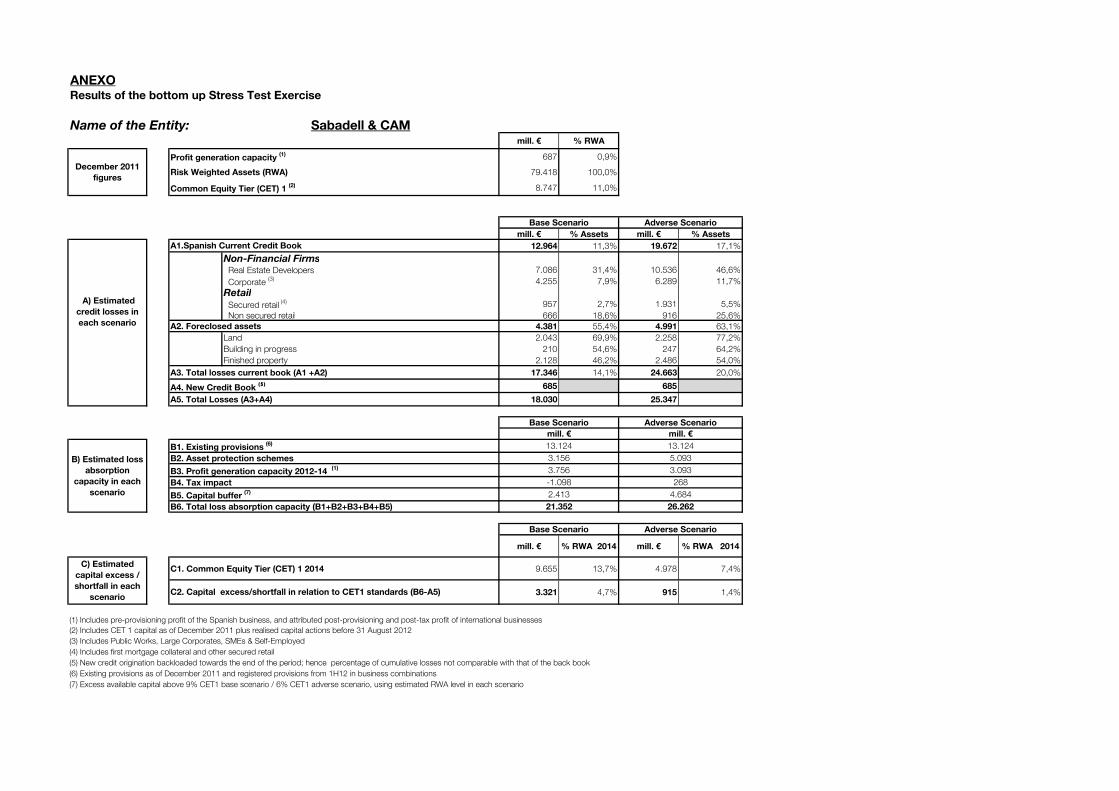
Name of the Entity: Sabadell & CAMmill. € % RWA
Profit generation capacity (1) 687 0,9%
Risk Weighted Assets (RWA) 79.418 100,0%
Common Equity Tier (CET) 1 (2) 8.747 11,0%
mill. € % Assets mill. € % Assets
12.964 11,3% 19.672 17,1%
Non-Financial Firms Real Estate Developers 7.086 31,4% 10.536 46,6%
Corporate (3) 4.255 7,9% 6.289 11,7%
Retail
Secured retail (4) 957 2,7% 1.931 5,5%
Non secured retail 666 18,6% 916 25,6%
4.381 55,4% 4.991 63,1%
Land 2.043 69,9% 2.258 77,2%
Building in progress 210 54,6% 247 64,2%
Finished property 2.128 46,2% 2.486 54,0%
A3. Total losses current book (A1 +A2) 17.346 14,1% 24.663 20,0%
A4. New Credit Book (5) 685 685
A5. Total Losses (A3+A4) 18.030 25.347
B1. Existing provisions (6)
B2. Asset protection schemes
B3. Profit generation capacity 2012-14 (1)
B4. Tax impact
B5. Capital buffer (7)
mill. € % RWA 2014 mill. € % RWA 2014
C1. Common Equity Tier (CET) 1 2014 9.655 13,7% 4.978 7,4%
3.321 4,7% 915 1,4%
(1) Includes pre-provisioning profit of the Spanish business, and attributed post-provisioning and post-tax profit of international businesses
(2) Includes CET 1 capital as of December 2011 plus realised capital actions before 31 August 2012
(3) Includes Public Works, Large Corporates, SMEs & Self-Employed
(4) Includes first mortgage collateral and other secured retail
(5) New credit origination backloaded towards the end of the period; hence percentage of cumulative losses not comparable with that of the back book
(6) Existing provisions as of December 2011 and registered provisions from 1H12 in business combinations
(7) Excess available capital above 9% CET1 base scenario / 6% CET1 adverse scenario, using estimated RWA level in each scenario
Base Scenario Adverse Scenario
C) Estimated
capital excess /
shortfall in each
scenarioC2. Capital excess/shortfall in relation to CET1 standards (B6-A5)
Base Scenario Adverse Scenario
mill. € mill. €
3.093
B) Estimated loss
absorption
capacity in each
scenario
13.124 13.124
3.156 5.093
3.756
B6. Total loss absorption capacity (B1+B2+B3+B4+B5) 21.352 26.262
-1.098 268
2.413 4.684
Results of the bottom up Stress Test Exercise
December 2011
figures
Base Scenario Adverse Scenario
A) Estimated
credit losses in
each scenario
A1.Spanish Current Credit Book
A2. Foreclosed assets

ANEXO
Name of the Entity: Santandermill. € % RWA
Profit generation capacity (1) 10.159 1,8%
Risk Weighted Assets (RWA) 560.031 100,0%
Common Equity Tier (CET) 1 (2) 54.517 9,7%
mill. € % Assets mill. € % Assets
16.144 7,9% 27.674 13,5%
Non-Financial Firms Real Estate Developers 6.488 29,3% 9.805 44,2%
Corporate (3) 6.990 6,5% 12.652 11,7%
Retail
Secured retail (4) 1.381 2,2% 3.047 4,8%
Non secured retail 1.284 11,0% 2.171 18,7%
4.865 56,9% 5.644 66,0%
Land 2.917 71,1% 3.318 80,9%
Building in progress 549 56,9% 652 67,6%
Finished property 1.399 40,1% 1.673 48,0%
A3. Total losses current book (A1 +A2) 21.008 9,8% 33.318 15,6%
A4. New Credit Book (5) 751 751
A5. Total Losses (A3+A4) 21.759 34.069
B1. Existing provisions (6)
B2. Asset protection schemes
B3. Profit generation capacity 2012-14 (1)
B4. Tax impact
B5. Capital buffer (7)
mill. € % RWA 2014 mill. € % RWA 2014
C1. Common Equity Tier (CET) 1 2014 67.714 12,6% 57.147 10,8%
19.181 3,6% 25.297 4,8%
(1) Includes pre-provisioning profit of the Spanish business, and attributed post-provisioning and post-tax profit of international businesses
(2) Includes CET 1 capital as of December 2011 plus realised capital actions before 31 August 2012
(3) Includes Public Works, Large Corporates, SMEs & Self-Employed
(4) Includes first mortgage collateral and other secured retail
(5) New credit origination backloaded towards the end of the period; hence percentage of cumulative losses not comparable with that of the back book
(6) Existing provisions as of December 2011 and registered provisions from 1H12 in business combinations
(7) Excess available capital above 9% CET1 base scenario / 6% CET1 adverse scenario, using estimated RWA level in each scenario
C) Estimated
capital excess /
shortfall in each
scenarioC2. Capital excess/shortfall in relation to CET1 standards (B6-A5)
mill. € mill. €
0
23.806
864
5.984
40.941
Base Scenario Adverse Scenario
12.030
0
25.063
-2.136
Results of the bottom up Stress Test Exercise
December 2011
figures
Base Scenario Adverse Scenario
A1.Spanish Current Credit Book
12.030
22.667
59.366
A2. Foreclosed assets
A) Estimated
credit losses in
each scenario
Base Scenario Adverse Scenario
B) Estimated loss
absorption
capacity in each
scenario
B6. Total loss absorption capacity (B1+B2+B3+B4+B5)
ANEXO
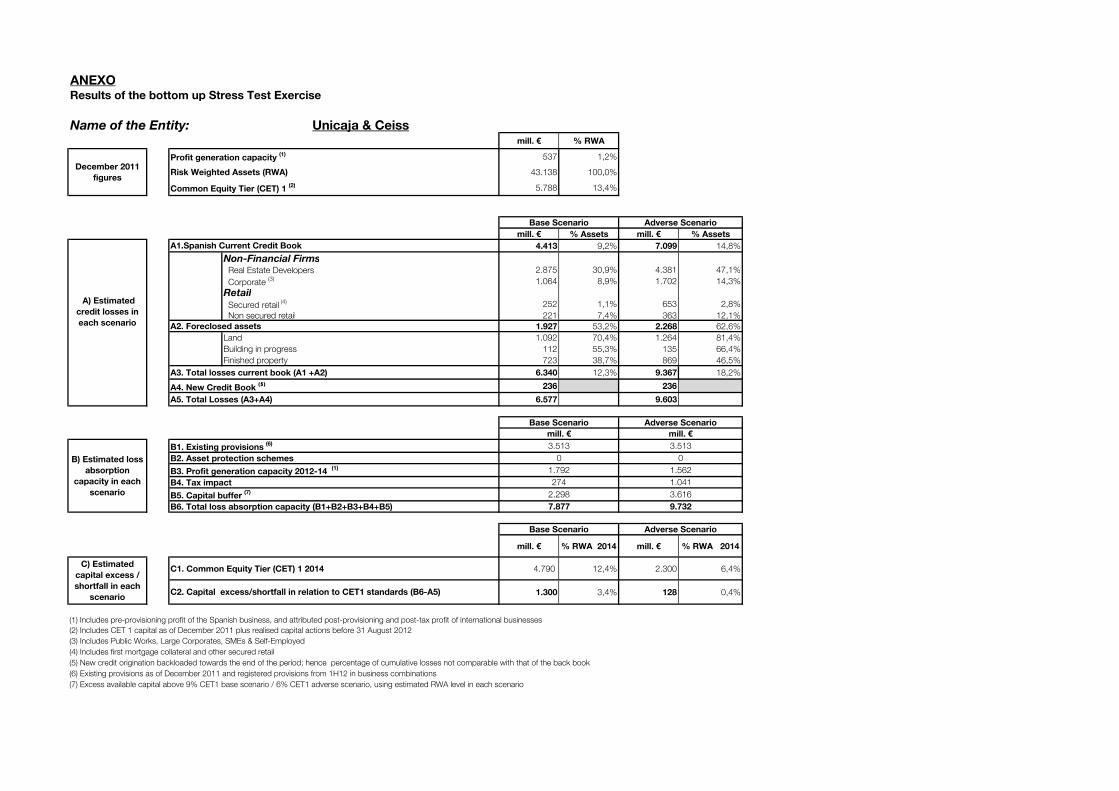
Name of the Entity: Unicaja & Ceissmill. € % RWA
Profit generation capacity (1) 537 1,2%
Risk Weighted Assets (RWA) 43.138 100,0%
Common Equity Tier (CET) 1 (2) 5.788 13,4%
mill. € % Assets mill. € % Assets
4.413 9,2% 7.099 14,8%
Non-Financial Firms Real Estate Developers 2.875 30,9% 4.381 47,1%
Corporate (3) 1.064 8,9% 1.702 14,3%
Retail
Secured retail (4) 252 1,1% 653 2,8%
Non secured retail 221 7,4% 363 12,1%
1.927 53,2% 2.268 62,6%
Land 1.092 70,4% 1.264 81,4%
Building in progress 112 55,3% 135 66,4%
Finished property 723 38,7% 869 46,5%
A3. Total losses current book (A1 +A2) 6.340 12,3% 9.367 18,2%
A4. New Credit Book (5) 236 236
A5. Total Losses (A3+A4) 6.577 9.603
B1. Existing provisions (6)
B2. Asset protection schemes
B3. Profit generation capacity 2012-14 (1)
B4. Tax impact
B5. Capital buffer (7)
mill. € % RWA 2014 mill. € % RWA 2014
C1. Common Equity Tier (CET) 1 2014 4.790 12,4% 2.300 6,4%
1.300 3,4% 128 0,4%
(1) Includes pre-provisioning profit of the Spanish business, and attributed post-provisioning and post-tax profit of international businesses
(2) Includes CET 1 capital as of December 2011 plus realised capital actions before 31 August 2012
(3) Includes Public Works, Large Corporates, SMEs & Self-Employed
(4) Includes first mortgage collateral and other secured retail
(5) New credit origination backloaded towards the end of the period; hence percentage of cumulative losses not comparable with that of the back book
(6) Existing provisions as of December 2011 and registered provisions from 1H12 in business combinations
(7) Excess available capital above 9% CET1 base scenario / 6% CET1 adverse scenario, using estimated RWA level in each scenario
Base Scenario Adverse Scenario
C) Estimated
capital excess /
shortfall in each
scenarioC2. Capital excess/shortfall in relation to CET1 standards (B6-A5)
Base Scenario Adverse Scenario
mill. € mill. €
1.562
B) Estimated loss
absorption
capacity in each
scenario
3.513 3.513
0 0
1.792
B6. Total loss absorption capacity (B1+B2+B3+B4+B5) 7.877 9.732
274 1.041
2.298 3.616
Results of the bottom up Stress Test Exercise
December 2011
figures
Base Scenario Adverse Scenario
A) Estimated
credit losses in
each scenario
A1.Spanish Current Credit Book
A2. Foreclosed assets
ANEXO
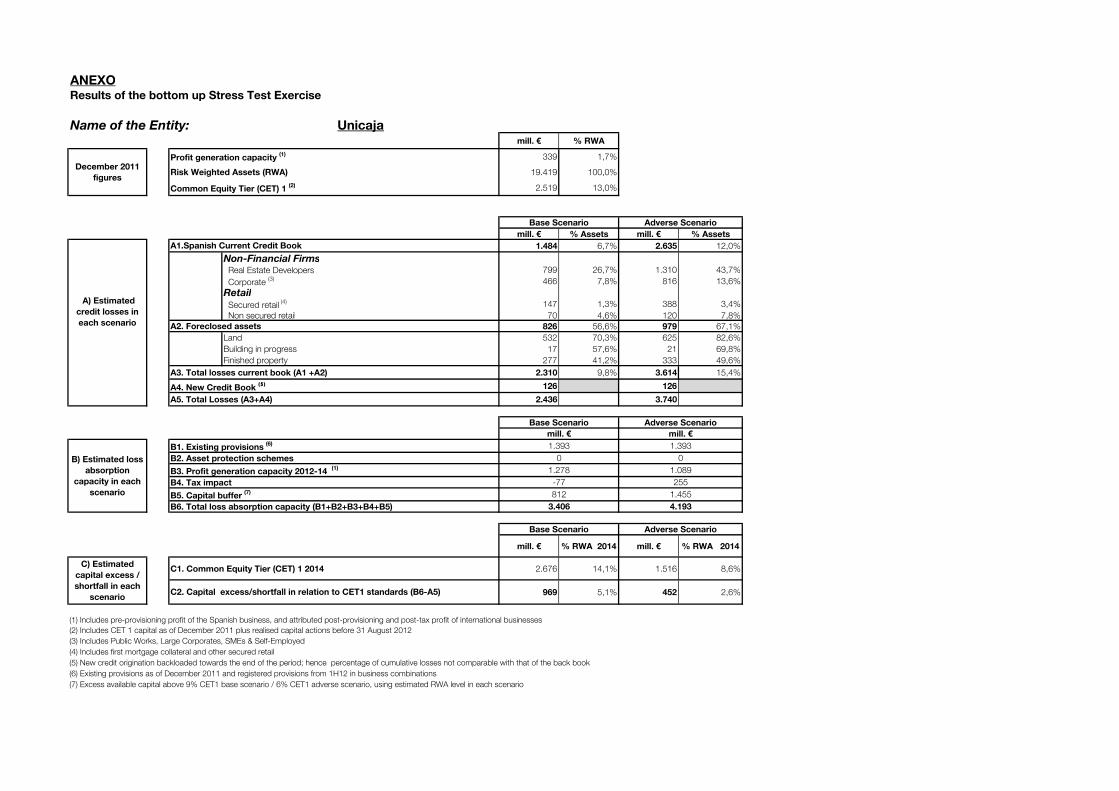
Name of the Entity: Unicajamill. € % RWA
Profit generation capacity (1) 339 1,7%
Risk Weighted Assets (RWA) 19.419 100,0%
Common Equity Tier (CET) 1 (2) 2.519 13,0%
mill. € % Assets mill. € % Assets
1.484 6,7% 2.635 12,0%
Non-Financial Firms Real Estate Developers 799 26,7% 1.310 43,7%
Corporate (3) 466 7,8% 816 13,6%
Retail
Secured retail (4) 147 1,3% 388 3,4%
Non secured retail 70 4,6% 120 7,8%
826 56,6% 979 67,1%
Land 532 70,3% 625 82,6%
Building in progress 17 57,6% 21 69,8%
Finished property 277 41,2% 333 49,6%
A3. Total losses current book (A1 +A2) 2.310 9,8% 3.614 15,4%
A4. New Credit Book (5) 126 126
A5. Total Losses (A3+A4) 2.436 3.740
B1. Existing provisions (6)
B2. Asset protection schemes
B3. Profit generation capacity 2012-14 (1)
B4. Tax impact
B5. Capital buffer (7)
mill. € % RWA 2014 mill. € % RWA 2014
C1. Common Equity Tier (CET) 1 2014 2.676 14,1% 1.516 8,6%
969 5,1% 452 2,6%
(1) Includes pre-provisioning profit of the Spanish business, and attributed post-provisioning and post-tax profit of international businesses
(2) Includes CET 1 capital as of December 2011 plus realised capital actions before 31 August 2012
(3) Includes Public Works, Large Corporates, SMEs & Self-Employed
(4) Includes first mortgage collateral and other secured retail
(5) New credit origination backloaded towards the end of the period; hence percentage of cumulative losses not comparable with that of the back book
(6) Existing provisions as of December 2011 and registered provisions from 1H12 in business combinations
(7) Excess available capital above 9% CET1 base scenario / 6% CET1 adverse scenario, using estimated RWA level in each scenario
Results of the bottom up Stress Test Exercise
December 2011
figures
Base Scenario Adverse Scenario
A) Estimated
credit losses in
each scenario
A1.Spanish Current Credit Book
A2. Foreclosed assets
B) Estimated loss
absorption
capacity in each
scenario
1.393 1.393
0 0
1.278
B6. Total loss absorption capacity (B1+B2+B3+B4+B5) 3.406 4.193
Base Scenario Adverse Scenario
mill. € mill. €
1.089
-77 255
812 1.455
Base Scenario Adverse Scenario
C) Estimated
capital excess /
shortfall in each
scenarioC2. Capital excess/shortfall in relation to CET1 standards (B6-A5)