SHARP AND HOWELLS
18
Australasian Corrosion Consultants Pty Ltd 65 Corowa Crescent Greensborough ACN 098 847 388 Victoria 3088 Australia Tel +61 3 9432 5166 Fax +61 3 9432 5177 [email protected] SHARP AND HOWELLS CONCRETE INVESTIGATION – XYPEX PANEL INVESTIGATION REPORT FEBRUARY 2014
Transcript of SHARP AND HOWELLS

Australasian Corrosion Consultants Pty Ltd 65 Corowa Crescent Greensborough ACN 098 847 388 Victoria 3088 Australia Tel +61 3 9432 5166 Fax +61 3 9432 5177 [email protected]
SHARP AND HOWELLS
CONCRETE INVESTIGATION – XYPEX PANEL
INVESTIGATION REPORT
FEBRUARY 2014

Investigation Report for Sharp and Howells Xypex Panel
Report No. 20140121-MaR-Rev4
Prepared by Jack McLean
For Client: Sharp and Howells
Reviewed by Bill Gerritsen
Approved for issue:
On behalf of
Australasian Corrosion Consultants Pty Ltd 65 Corowa Crescent Greensborough ACN 098 847 388 Victoria 3088 Australia Tel +61 3 9432 5166 Fax +61 3 9432 5177 [email protected]
© This report is copyright. Australasian Corrosion Consultants Pty Ltd claims copyright ownership of all information contained in this report unless
negated by signed contract with the entity defined as “Client” above. Apart from any use permitted under the Copyright Act 1968 (Cth), all other
rights are reserved. No part of this work may be reproduced by any process without expressed authorization of Australasian Corrosion Consultants
Pty Ltd or the “Client”. You have no other rights (expressed or implied) in relation to the contents of this report or parts thereof.
To the extent permitted by law, Australasian Corrosion Consultants Pty Ltd disclaims all liability for any loss, damage, expense and costs (including but
not limited to legal costs incurred by any person that accesses, uses or relies on the information or recommendations contained in this report.
AustralasianCorrosionConsultants
2 of 820140121-MaR-Rev4.pdf

Investigation Report for Sharp and Howells Xypex Panel
1. INTRODUCTION
Australasian Corrosion Consultants were commissioned by Sharp and Howells to perform a survey on a
concrete slab at Lascelles Wharf - Geelong Ports, Victoria. The wharf was constructed in 1995 and has given
19 years of service as a bulk chemical and grain dock. The diagnostic tests were completed with the intention
of analysing a slab that has been treated with a Xypex Admix – C Series. The following report details the
results and findings of this survey as performed on the 16/01/2014.
2. SCOPE OF INVESTIGATION WORKS
3.1 VISUAL CONDITION ASSESSMENT
This survey is carried out to ascertain the type and extent of visible defects to the concrete slab. A defects
log is compiled. Photographic evidence can be used to confirm visual delamination data collected. From this
information, areas are selected for detailed diagnostic testing. For the Lascelles Wharf investigation, a visual
condition assessment will be performed before any other works are performed.
3.2 REINFORCING CONTINUITY TESTING
The electrical continuity of the slabs’ embedded reinforcement is important for Electro-potential testing. The
continuity is checked by measuring the resistance between reinforcing bars using a DC resistance meter in
one direction and then reversing the test leads and repeating the measurement. For the case of the Xypex
treated panel at Lascelles Wharf, an electrical resistance equal to or less than one ohm is considered
acceptable.
3.3 CONCRETE COVER SURVEY
A concrete cover survey is performed via a cover meter to determine the thickness of the concrete overlying
the reinforcement. The cover over reinforcement plays an important role in the corrosion stages, in
particular the time to de-passivate the steel due to chloride ingress is a function of the cover. ACC has been
requested by Sharp and Howells to provide a chloride assessment of the Xypex panel and therefore a
concrete cover survey is required to achieve this.
3.4 EQUIPOTENTIAL MAPPING
Equipotential (or half-cell) mapping is a quick and reliable method of determining corrosion activity of
reinforcing steel in atmospheric concrete, irrespective of the cause of the corrosion. Simply put, as
reinforcing steel corrodes the potential (voltage) of the corroding areas is more negative, often to around -
500mV (-0.5 V) The system works by measuring the voltage at the surface of the concrete, which
approximates the voltage of the reinforcement at various points, allowing the potential gradients to be
mapped.
For the purpose of this project Australasian Corrosion Consultants performed Equipotential Mapping on a 3 x
1 m section of the Xypex panel.
3.5 CHLORIDE CONTENT ASSESSMENT
Measurement of chloride levels is performed by laboratory testing. The critical level of chloride required to
initiate corrosion is related to the hydroxide ion concentration in the concrete pore water. The chloride level
likely to cause corrosion can only be estimated approximately and will vary according to environmental
conditions, cement type and concrete cover.
In analysing the chloride levels, the following criteria as given in HB 84-2006 is applied:
AustralasianCorrosionConsultants
3 of 820140121-MaR-Rev4.pdf

Investigation Report for Sharp and Howells Xypex Panel
Table 1 Chloride Criteria
Chloride W/W Cement Corrosion Probability
<0.4% Low
0.4% to 1.0% Medium
>1.0% High
ACC have been requested by Sharp and Howells to perform a chloride assessment on the Xypex panel in
relation to its chloride ingress and effects on corrosion.
3. RESULTS OF TESTING
Detailed results of the testing that occurred on 16/01/2014 can be seen in appendix A attached.
4.1 VISUAL INSPECTION
Visual inspection of the Xypex slab indicated that there was very little delamination and surface damage. The
concrete surface showed minor wear on the edges of the panel as well as small amounts of general wear.
There were no visible cracks, spalling or other damage to the panel. Pictures from the Visual Inspection can
be found in appendix B attached.
Visual inspection of the reinforcing steel showed a black colouration on the surface of the rebar. This can be
seen in the figure 2 below. .The cause or nature of the discolouration was not investigated during this
survey.
Figure 2 – Xypex Rebar
4.2 REINFORCEMENT CONTINUITY
Reinforcement continuity was tested for the slab. The results of this testing indicate that all reinforcing is
electrically continuous. Results show that the resistance between the reinforcing on the Xypex slabs is less
than 0.3 ohms. This indicates that equipotential testing can occur by making a connection to the reinforcing
at any point and taking a potential reading to a reference electrode.
4.3 CONCRETE COVER SURVEY
The results of the covermeter survey can be used as a reference for assessment of the significance of the
depth of penetration of chloride ions in the Xypex panel. The survey also provides a general indication of the
distribution of reinforcing steel within the cover concrete. The following analysis indicates the typical
reinforcing cover.
Xypex Re-bar (Black
Colouration
AustralasianCorrosionConsultants
4 of 820140121-MaR-Rev4.pdf

Investigation Report for Sharp and Howells Xypex Panel
Table 2 - Concrete Cover Survey Results
Number of readings Minimum Depth
(mm)
Maximum Depth
(mm)
Average Depth (mm) Distribution (mm)
19 76 51 62 150 C-C
4.4 EQUIPOTENTIAL TESTING
Potential Mapping was undertaken on the Xypex slab. The criteria that is typically employed when
performing a concrete potential mapping survey is the ASTM-C876-91 Standard. The ASTM-C876-91
Standard provides a very general guide for classification of half-cell potential values based upon probability
for corrosion. This guideline is presented in table 1 below.
Table 3 – ASTM-C876-91 Standard Half-Cell potential value classification
Potential (ref CuCuSo4) Probability of Corrosion
More positive than –200 mV <5%
-200 to –350 mV About 50%
More negative than –350 mV >95%
The equipotential results for the slab as set out in Appendix A has been analysed and is shown in figures 3-4
below. The colour codes selected in the plots are set to the ASTM classifications contained in Table 1, above.
The interpretation of these ranges (in millivolts (mV)) is described below.
The results of the equipotential mapping of the two slabs can be seen below.
Figure 1 Xypex Panel
-50 to 100 Likely not corroding
-200 to -50 Possible chance of corrosion
-350 to -200 Likely corroding
AustralasianCorrosionConsultants
5 of 820140121-MaR-Rev4.pdf

Investigation Report for Sharp and Howells Xypex Panel
Calculated Mean of the measured values: -51.6mV
Range of measure values: -243mV to 52.9mV
Calculated Standard Deviation of the measured values: 62.2
This analysis indicates that there are some sections of reinforcing that have a greater than 95% probability of
corrosion (as identified by the blue areas (-200 to -350 mV)). These areas are at the location where the steel
was exposed for the test connection. The wet nature of the exposed steel at these locations can distort the
results, requiring careful interpretation.
For the purpose of this report ACC has removed the data surrounding the location of the exposed steel. After
this is completed the plot is more homogenous, as can be seen below.
Figure 2 - Xypex Panel - Amended Values
Calculated Mean of the amended values: -31.5mV
Range of amended values: -105mV to 52.9mV
Calculated Standard Deviation of the amended values:37.8
The amended plot indicates that the majority of the reinforcing in the Xypex panel has less than 5%
probability of corrosion. There are however some sections that fall within a 50% probability of corrosion (-
200 to -50 mV). After amending this data set, the calculated mean value can be seen to be more positive and
there is a smaller standard deviation value than the measured values. This indicates that the amended
sampling has a more evenly distributed potential range.
4.5 CHLORIDE CONTENT ASSESSMENT
ACC were provided with the percentage chloride content, weight/weight of concrete, of three different
Xypex treated core samples by Sharp and Howells Laboratory. These results were given at three increment
depths; 0-20mm, 20-40mm and 40-60mm. As chlorides are analysed to the requirements of HB 84-2006,
ACC were required to determine the chloride content Weight/Weight of cement. For the purpose of this
project a 15% cement content was assumed.
AustralasianCorrosionConsultants
6 of 820140121-MaR-Rev4.pdf

Investigation Report for Sharp and Howells Xypex Panel
Using the chloride level provided for the 3 locations and at the 3 depths, ACC performed a chloride analysis
using Fick’s Second Law which predicts how diffusion causes the concentration to change with time.
A re-iterative plotting method is used to obtain a “best fit” curve, thus determining diffusion co-efficient (Dc)
and chloride supply concentration (Co). These values are used to plot a graph showing penetration rate of
the critical chloride level. Depth of reinforcement cover at the core location is plotted on the same graph.
The below graphs give an indication of the estimated future rate of penetration of the critical 0.4% w/w
chloride concentration towards and beyond the level of the existing reinforcement thus permitting an
assessment of present and future conditions.
SAMPLE 1
The graph below gives an indication of the 0.4% w/w cement chloride level at concrete depth for the 1st
location. The time required for the chloride levels to obtain the theoretical level of 0.4% w/w cement at
reinforcement depth (51mm) as calculated by Fick’s 2nd Law of diffusion, is 160 years for this location. As is
shown in the graph, corrosive levels of chlorides will not be at rebar level for well over 100 years of service.
SAMPLE 3
The graph below gives an indication of the 0.4% w/w cement chloride level at concrete depth for the 3rd
location. The time required for the chloride levels to obtain the theoretical level of 0.4% w/w cement at
reinforcement depth (51mm) as calculated by Fick’s 2nd Law of diffusion, is 156 years for this location. As is
shown in the graph, corrosive levels of chlorides will not be at rebar level for well over 100 years of service.
AustralasianCorrosionConsultants
7 of 820140121-MaR-Rev4.pdf

Investigation Report for Sharp and Howells Xypex Panel
SAMPLE 4
For the 4th location results are quite similar to location 1 and 3. The time required for the chloride levels to
obtain the theoretical level of 0.4% w/w cement at reinforcement depth (51mm) as calculated by Fick’s 2nd
Law of diffusion, is 175 years for this location Corrosive levels of chlorides will not be at rebar depth for over
100 years.
4. CONCLUSIONS
Based on the results of the potential mapping and Chloride analysis, it is possible to conclude that the slabs
appear to not be currently susceptible to corrosion. The results of the chloride analysis indicate that
corrosion will not occur before well over 100 years.
AustralasianCorrosionConsultants
8 of 820140121-MaR-Rev4.pdf

Investigation Report for Sharp and Howells Xypex Panel
APPENDIX A
SURVEY RESULTS
AustralasianCorrosion
Consultants
9 of 1820140121-MaR-Rev3.pdf
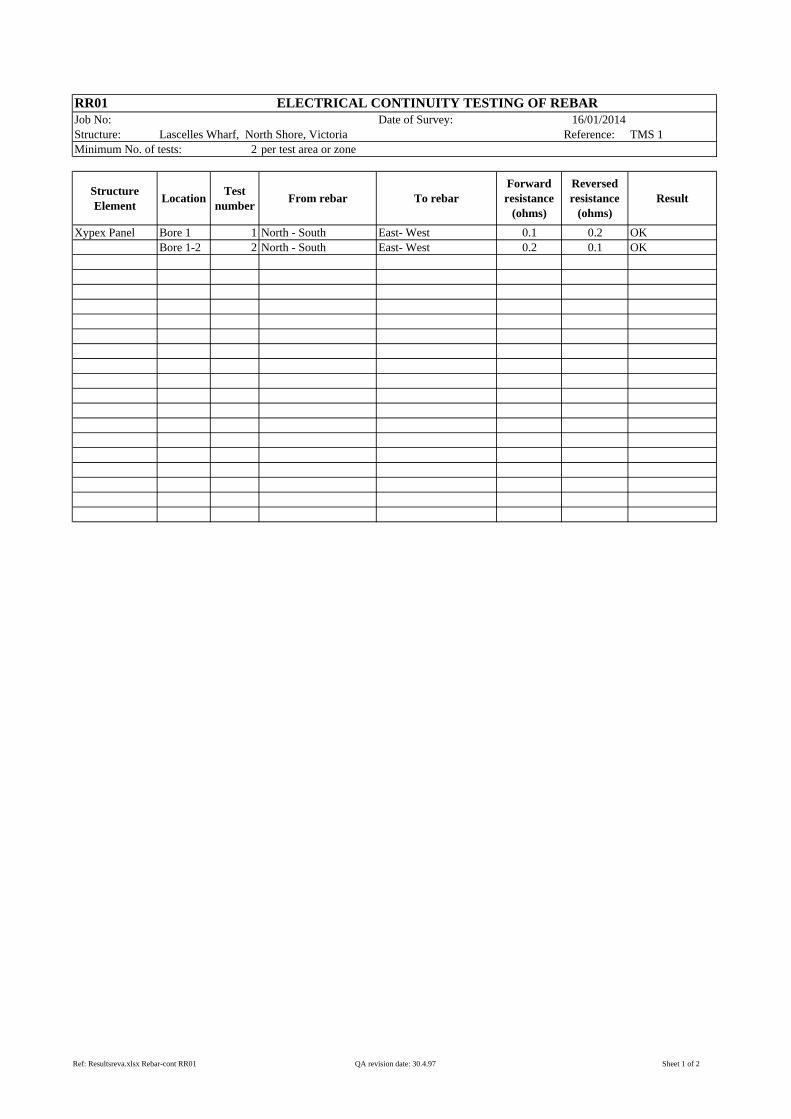
RR01Job No: Date of Survey: 16/01/2014Structure: Lascelles Wharf, North Shore, Victoria Reference: TMS 1Minimum No. of tests: 2 per test area or zone
StructureElement
LocationTest
numberFrom rebar To rebar
Forwardresistance
(ohms)
Reversedresistance
(ohms)Result
Xypex Panel Bore 1 1 North - South East- West 0.1 0.2 OKBore 1-2 2 North - South East- West 0.2 0.1 OK
ELECTRICAL CONTINUITY TESTING OF REBAR
Ref: Resultsreva.xlsx Rebar-cont RR01 QA revision date: 30.4.97 Sheet 1 of 2

Potential Mapping ResultsXypex Facing West
Grid (cm) 0 20 40 60 80 100 120 140 160 180 200 220 240 260 280 3000 -0.58 -40 -60 -38.3 -34 -51.5 -33 -49.6 -67.9 -33.6 -76.2 52.9 -13 39.5 13.8 30.1
20 23 1.2 -28 -43 -22 -60 4.4 0.07 -27.7 -77.1 -80.3 -91.3 -34.7 -186 2.8 39.640 -7.8 -44 -72 -75 -54 -28 -34 -64 -78 -105 -153 -142 -140 -77 -24 -2360 -30 -85 -138 -240 -220 -160 -64 -4 -34 -58 -87 -196 -243 -115 -54 -780 -29 -92 -155 -178 -109 -20 -4 -7 -10 -47 -86 -118 -82 12 7 16
100 -16 -49 -75 -75 -23 4 29 1 22 3 -47 -32 -28 1 10 19
Measurement to Ag/AgCl (mV)
Calibrated to CuCuSo4 (mV)
AustralasianCorrosion
Consultants
11 of 1820140121-MaR-Rev3.pdf

RR05Job No: 0 Date of Survey: 15/01/14Structure: 0 Reference: TMS 5
StructureElement
LocationTest
numberSpecified Cover (mm)
Xypex Slab Lascelles Wharf 1 NA 70 72 70 68 64Xypex Slab Lascelles Wharf 2 NA 68 64 73 76Xypex Slab Lascelles Wharf 3 NA 53 62 66 53 53 53Xypex Slab Lascelles Wharf 4 NA 55 54Xypex Slab Lascelles Wharf 5 NA 51 53
Measurement (mm)
CONCRETE COVER METER SURVEY
Ref: Chlorides Analysis2.xls Rebar-cover RR05 QA revision date: 30.4.97 Sheet 1 of 1
AustralasianCorrosion
Consultants
12 of 1820140121-MaR-Rev3.pdf

CONCRETE CHLORIDE TESTING RESULTS309 Date of Survey: 15/01/2014
0 Reference: TMS 9
LocationTest
numberType ofsample
Depth, (mm) Chloride, as Cl- %w/w of cement
AverageDepth
Years
Lascelles Wharf 1 0 0-20 0.540 10 19Lascelles Wharf 20-40 0.130 30 19Lascelles Wharf 40-60 0.050 50 19
191919
Lascelles Wharf 3 0 0-20 0.480 10 19Lascelles Wharf 20-40 0.120 30 19Lascelles Wharf 40-60 0.060 50 19
191919
Lascelles Wharf 4 0 0-20 0.470 10 19Lascelles Wharf 20-40 0.180 30 19Lascelles Wharf 40-60 0.060 50 19
Ref: Chlorides Analysis2.xls Chlorides Lab results QA revision date: 30.4.97 Sheet 1 of 1
AustralasianCorrosion
Consultants
13 of 1820140121-MaR-Rev3.pdf

Investigation Report for Sharp and Howells Xypex Panel
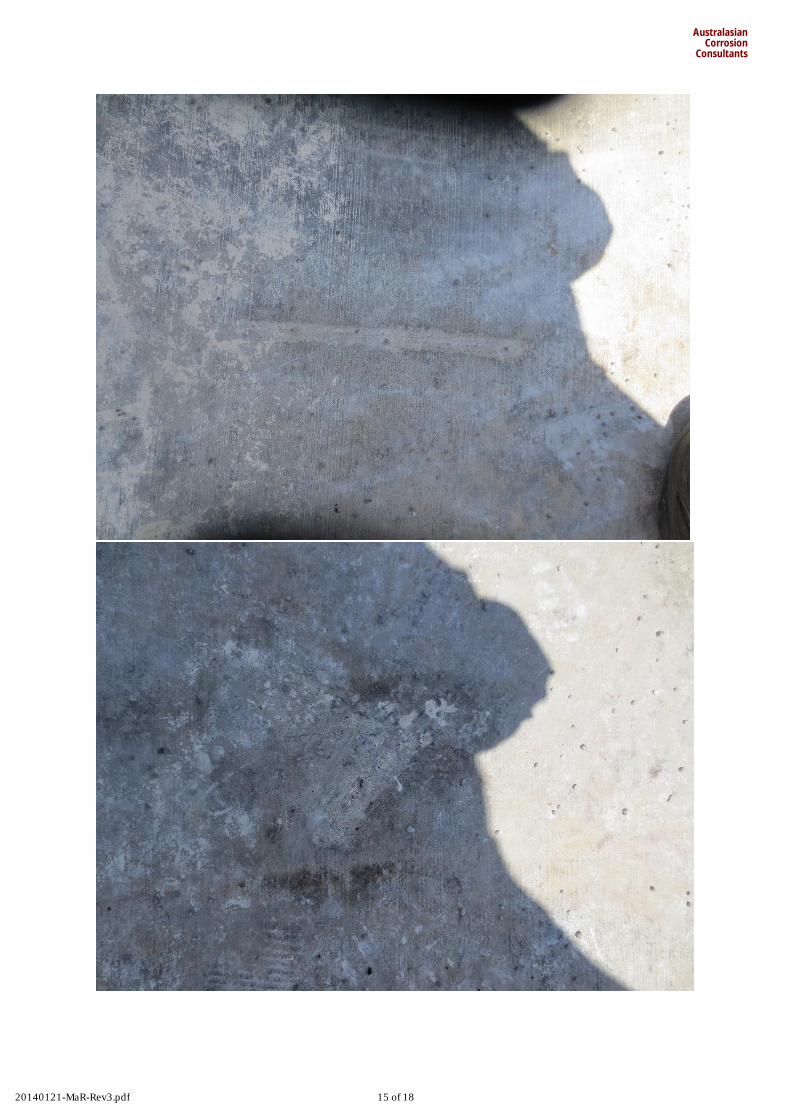
APPENDIX B PHOTOS OF SURVEY
AustralasianCorrosion
Consultants
14 of 1820140121-MaR-Rev3.pdf
AustralasianCorrosion
Consultants
15 of 1820140121-MaR-Rev3.pdf

AustralasianCorrosion
Consultants
16 of 1820140121-MaR-Rev3.pdf

AustralasianCorrosion
Consultants
17 of 1820140121-MaR-Rev3.pdf

AustralasianCorrosion
Consultants
18 of 1820140121-MaR-Rev3.pdf