SHAREHOLDER CONCENTRATION AND EARNINGS
150
Transcript of SHAREHOLDER CONCENTRATION AND EARNINGS


SHAREHOLDER CONCENTRATION AND EARNINGS MANAGEMENT IN LISTED CORPORATIONS IN AN
EMERGING MARKET
By
Dharmendra Naidu
A thesis submitted in fulfillment of the requirements for a degree of Master of Commerce
Copyright © 2012 by Dharmendra Naidu
School of Accounting and Finance
Faculty of Business and Economics
The University of the South Pacific
August, 2012

DECLARATION OF ORIGINALITY
Statement by Author
I, Dharmendra Naidu, declare that this thesis is solely my own work and it is
compiled based on a research. Information has been gathered from other sources
which are referenced and from individuals who are duly acknowledged.
Signature ………………………………….. Date ………………………
Name ……………………………………………………………………………..
Student ID No. …………………………………………………………………..
Statement by Supervisor
This thesis, as per my knowledge, is solely the work of Mr. Dharmendra Naidu who
performed the research under my supervision
Signature ………………………………….. Date ………………………
Name ……………………………………………………………………………..
Designation …..…………………………………………………………………..

iii
DEDICATION
To my parents (Maya Wati and Ram Krishna) for their upbringing, support
throughout my education and their prayers and to my grandfather (George Smith)
who motivated and directed my childhood towards high level of education and for
his support through my education.

iv
ACKNOWLEDGEDMENT
I would like to thank Professor Arvind Patel for his supervision, assistance and
guidance throughout the duration of this research. Special thanks for the many hours
of professional advice, words of encouragement throughout the period of research
and writing of this thesis.
My heartiest gratitude is also for the presenters at our School seminars. With many
others, special thanks to Professor Chris Patel, Dr. Parmod Chand, and Dr. Umesh
Sharma. Your words of advice during your presentations have been fruitful and
useful during this research. I would also like to extend my appreciation to all my
colleagues at the School of Accounting and Finance and the Faculty for your words
of encouragement and support.
Special thanks to the executives of companies that filled and returned the
questionnaires and also to the executives of companies for providing their annual
reports. I would like to express my sincere gratitude to following personnel from
various organizations for their time and valuable comments.
Deepak Rathod – Fiji Sugar Corporation Ltd
Deepak Rathod – R B Patel Ltd
Kenneth Brown – Fosters Group Pacific Ltd
Ateca – Communications Fiji Limited
Jasmeen Khan – FijiCare Insurance Ltd
Tevita Gonelevu – Fijian Holdings Ltd
Sachindra Singh – VB Holdings Ltd
Tanya – Fiji Television Ltd
Alumita – Fiji Television Ltd

v
Pretesh – South Pacific Stock Exchange
vi
ABSTRACT
The ownership structure of the companies in emerging stock markets is concentrated.
The high level of shareholder concentration for the South Pacific Stock Exchange
(SPSE) companies is unique. The alignment and entrenchment effects guide the
relationship between shareholder concentration and earnings management. This
thesis investigates the strength of shareholder concentration in constraining earnings
management using archival data of the SPSE listed companies for the period 1986 to
2010.
The results suggest that high level of shareholder concentration is associated with
high level of earnings management for companies listed on the SPSE. This result
implies that although the concentrated shareholders of the SPSE companies are able
to minimize owner – manager agency problem due to the alignment effect, they
create a majority – minority shareholder agency problem due to entrenchment effect.
Additional results indicate that large boards are effective in mitigating the effects of
shareholder concentration on earnings management. In shareholder concentrated
firms, where owner – manager agency problem is minimal, the large independent
boards are able to minimize the majority – minority shareholder agency problem.
Unlike firms with dispersed ownership, shareholder concentrated firms face a
different form of agency problem indicating different influences on its corporate
governance structure. As such, this study contributes to the extant literature on
corporate governance and suggests new avenues for future research on corporate
governance to protect the interests of the minority shareholders in shareholder
concentrated firms.
This research offers insights to policy makers interested in enhancing corporate
governance for firms with high levels of shareholder concentration, an important

vii
variable that is very prevalent in developing countries with emerging stock markets.
The descriptive results of this thesis indicate that the internal and external corporate
governance structures of the SPSE companies are weak. However, there is scope to
strengthen the internal governance structures to protect the interests of the minority
shareholders. Thus, policy makers should strengthen the corporate governance code
and the financial regulations for companies with high level of shareholder
concentration by ensuring large boards with majority independent directors.

viii
ABBREVIATIONS
AC Audit Committee
ADB Asian Development Bank
AF Audit Fee
APP Atlantic & Pacific Packaging Company Limited
ASX Australian Securities Exchange
ATH Amalgamated Telecommunication Holdings Limited
BOD Board of Directors
BS Board Size
BSP Bank of the South Pacific
CEO Chief Executive Officer
CFL Communications Fiji Limited
CG Corporate Governance
CMDA Capital Markets Development Authority
DAC Discretionary Accruals
EM Earnings Management
ER Executive Remuneration
FF Free Float
FGP Foster's Group Pacific Limited
FHL Fijian Holdings Limited
FIA Fiji Institute of Accountants
FIL FijiCare Insurance Limited
FMF Flour Mills of Fiji Limited
FNPF Fiji National Provident Fund
FSC Fiji Sugar Corporation Limited
FTV Fiji Television Limited
GAAP Generally Accepted Accounting Practices
GMM Generalized Method of Moment
ID Percentage of Independent Directors
IPO Initial Public Offers
IV Instrumental Variable
IFAC International Federation of Accountants
IFRS International Financial Reporting Standards

ix
KGF Kontiki Growth Fund Limited
LEV Leverage
LnADAC Natural Logarithm of the Absolute Value of Discretionary
Accruals
LnAF Natural logarithm of Audit Fee
LnBS Natural logarithm of Board Size
LnTA Natural logarithm of Total Assets
MJM Modified Jones Model
NAS Non-audit services
NASRATIO Non-audit service fee ratio
NBF National Bank of Fiji
NDAC Non-Discretionary Accruals
OECD Organization for Economic Co-operation and Development
PBP Pleass Beverage & Packaging Limited
PGI Pacific Green Industries (Fiji) Limited
PMDA Performance-Matched Discretionary Accruals
RBF Reserve Bank of Fiji
RBG R B Patel Group Limited
RCF The Rice Company of Fiji Limited
ROA Return on Assets
SC Shareholder Concentration
SC*LnBS Interaction of Shareholder Concentration and natural logarithm of
Board Size
SEC Securities and Exchange Commission
SOX Sarbanes – Oxley Act
SOE State Owned Enterprises
SPSE South Pacific Stock Exchange
TA Total Accruals
TTS Toyota Tsusho (South Seas) Limited
UK United Kingdom
US United States
UTF Unit Trust of Fiji
VBL VB Holdings Limited

x
σ Standard deviation of Cash Flow from Operations
xi
TABLE OF CONTENTS CHAPTER 1 OVERVIEW OF THE RESEARCH ............................................................... 1
1.1 Introduction ...............................................................................................................1
1.2 Earnings Management Practices ...............................................................................2
1.3 Shareholder concentration in Emerging Economies .................................................3
1.4 Research Issue and Motivation .................................................................................4
1.5 Aim ...........................................................................................................................7
1.6 Objectives .................................................................................................................7
1.7 Justification and Contribution of the Study ..............................................................8
1.8 Summary and Organization of the Thesis .............................................................. 10
CHAPTER 2 LITERATURE REVIEW .............................................................................. 12
2.1 Introduction ............................................................................................................ 12
2.2 Earnings Management ........................................................................................... 12
2.2.1 Incentives for Earnings Management ............................................................ 14
2.2.2 Drivers of Earnings Management .................................................................. 19
2.3 Recent Focus on Earnings Management Research ................................................ 21
2.4 Corporate Governance ........................................................................................... 22
2.5 Corporate Governance Mechanisms and Earnings Management .......................... 24
2.5.1 External Corporate Governance Structures.................................................... 25
2.5.2 Internal Corporate Governance Structures ..................................................... 29
2.5.2.1 Shareholder Concentration ............................................................................ 38
2.5.2.2 Shareholder Concentration and Board Size ................................................... 40
2.6 Conclusion .............................................................................................................. 42
CHAPTER 3 RESEARCH DESIGN ................................................................................... 43
3.1 Introduction ............................................................................................................ 43
3.2 Research Methods .................................................................................................. 43
3.3 Sample Description ................................................................................................ 44
3.4 Measuring Earnings Management ......................................................................... 46
3.4.1 Earnings Management – Empirical Models ................................................... 46
3.5 Independent Variable ............................................................................................. 55
3.5.1 Measure of Shareholder Concentration.......................................................... 55
3.5.2 Measure of Board Size ................................................................................... 55
3.6 Control Variables ................................................................................................... 55
xii
3.7 Data Analysis ......................................................................................................... 58
3.8 Regression model ................................................................................................... 58
3.9 Conclusion ............................................................................................................. 59
CHAPTER 4 SHAREHOLDER CONCENTRATION AND EARNINGS
MANAGEMENT RESULTS ................................................................................................ 60
4.1 Introduction ............................................................................................................ 60
4.2 Descriptive Analysis .............................................................................................. 60
4.3 Correlation Analysis .............................................................................................. 65
4.4 Regression Results ................................................................................................. 67
4.5 Sensitivity Analysis ............................................................................................... 69
4.6 Robustness Test Results ......................................................................................... 70
4.7 Conclusion ............................................................................................................. 72
CHAPTER 5 CORPORATE GOVERNANCE PRACTICES IN THE SPSE LISTED
COMPANIES 73
5.1 Introduction ............................................................................................................ 73
5.2 Rules and Regulations governing the SPSE companies ........................................ 75
5.3 Internal Corporate Governance practices ............................................................... 78
5.3.1 Ownership Structure ...................................................................................... 78
5.3.2 Board of Directors.......................................................................................... 81
5.3.3 Audit Committees .......................................................................................... 83
5.3.4 Board Committees ......................................................................................... 86
5.3.5 Executive remunerations ................................................................................ 87
5.3.6 Internal Audit ................................................................................................. 89
5.3.7 External Audit ................................................................................................ 90
5.4 External Corporate Governance practices ............................................................. 93
5.4.1 Institutional Ownership .................................................................................. 93
5.4.2 Market Control and Competition ................................................................... 95
5.4.3 Creditor Monitoring and Protection ............................................................... 98
5.4.4 Securities Market Regulations ..................................................................... 100
5.5 Conclusion ........................................................................................................... 103
CHAPTER 6 CONCLUSION: Implications and Future Research .................................... 105
6.1 Introduction .......................................................................................................... 105

xiii
6.2 Shareholder Concentration and Earnings Management in SPSE listed companies 106
6.3 Corporate Governance in the SPSE listed corporations ....................................... 108
6.4 Implications ......................................................................................................... 111
6.5 Limitations ........................................................................................................... 114
6.6 Conclusion ........................................................................................................... 115
REFERENCE 117
APPENDIX 1 126
xiv
LIST OF TABLES Table 1.1 Shareholder concentration in companies listed on the SPSE as at 31
December 2010 ............................................................................................................ 4
Table 1.2 The correspondence of objectives to hypotheses....................................... 8
Table 3.1 Description of the SPSE companies based on shareholder concentration
and ownership in 2010 ............................................................................................... 45
Table 3.2 Predicted signs for each variable in the multi variant regression model . 58
Table 4.1 Descriptive statistics of the dependent and independent variables .......... 64
Table 4.2 Correlation analysis of all the variables used in the regression model .... 66
Table 4.3 Regression analysis of the interaction effect of shareholder concentration
and board size on earnings management including controls...................................... 68
Table 4.4 Sensitivity results of the interaction effect of shareholder concentration
and board size on earnings management.................................................................... 70
Table 4.5 Robustness results of the interaction effect of shareholder concentration
and board size on earnings management.................................................................... 71
Table 4.6 Summary of the results of the test variables used in the multi variant
model 72
Table 5.1 Ownership type of the largest shareholder of the SPSE companies ........ 80
Table 5.2 Characteristics of Board of Directors based on 2010 data ...................... 81
Table 5.3 Characteristics of Audit Committee based on 2010 data......................... 84
Table 5.4 Statistics on Board Committees based on 2010 data ............................... 87
Table 5.5 Descriptive statistics on Directors fees of SPSE companies for 2008 to
2010 89
Table 5.6 Audit tenure and non–audit service fee statistics for SPSE listed
companies 91
Table 5.7 Shareholder composition of the SPSE companies based on Free Float .. 94
Table 5.8 Statistics on Leverage based on past decade data .................................... 99
xv
LIST OF FIGURES
Figure 5.1 Shareholder Concentration representing the aggregate shareholdings of
the largest five shareholders ................................................................. 78
Figure 5.2 The proportion of independent Chairperson in the SPSE companies in
2010 ...................................................................................................... 82
Figure 5.3 Trading Statistics over 12 months ........................................................ 96
Figure 5.4 Trading Statistics over last 5 years ....................................................... 96
1
CHAPTER 1 OVERVIEW OF THE RESEARCH
1.1 Introduction Extensive research has been conducted with the issues surrounding earnings
management (EM) in developed countries, while limited research exists in India and
China. One important area of focus in EM studies has been corporate governance
(CG), given that strong CG constrains EM. This research concentrates on EM and
CG in developing countries. Several researches indicate that the CG format and
structure are country, region and economic specific 1 . The financial regulatory
environment within developed and developing countries impacts on the CG structure
and format. This study investigates the impact of CG on EM in a developing country
with an emerging capital market. Data from 16 listed companies of the South Pacific
Stock Exchange (SPSE) in Fiji is analyzed to investigate the impact of CG on EM.
The ownership structure of the SPSE listed companies is largely considered as highly
concentrated shareholding. Shareholder concentration (SC) which is also common in
emerging economies such as China and India, dictates the governance structure of
these companies. SC serves as a vital CG variable and has not been thoroughly
explored as a constraint on EM. SC occurs when few large shareholders hold
majority of the shares of the company. Due to greater control, the concentrated
shareholders could extract resources from the minority shareholder. Since majority-
minority shareholder conflict is dominant in a highly shareholder concentrated firm,
it is vital to investigate whether SC leads to EM.
1 Dignam and Galanis (2004) explain that the system of CG is regularly described by the ‘insider’ (dispersed shareholding) or ‘outsider’ (concentrated shareholding) system of ownership and control. Moreover, the system of ownership and control is related to the state of development of the economy. Also, the regulatory regimes which differ between countries have an impact on the CG practices (Broshko and Li 2006).
2
1.2 Earnings Management Practices Numerous researches have been constructed on the issue of EM. This has been as a
result of the concerns raised by stakeholders of many organizations in an effort to
improve the quality of financial reporting. Corporate collapses such as Enron, Qwest,
Xerox, WorldCom and HIH Insurance have raised an alarm which led many to
question the integrity of conventional accounting and auditing practices. These
collapses also raised a concern about financial reporting, auditing, corporate
regulations and the accounting profession as a whole. In response, the international
accounting profession contributed efforts to improve the strength and independence
of audit committee (AC) along with auditor independence (Behn et al. 2002).
The corporate collapses and some prior research have indicated greater instance of
EM in organizations. This led to the suggestion that EM literature requires additional
evidence on the factors that would limit EM (Healy and Wahlen 1999). Thus, the
focus of EM research shifted towards exploring CG mechanisms and its ability to
constrain EM. Research in this area has explored various CG attributes including
institutional investors (Cheng and Reitenga 2009), board of directors (BOD), AC,
internal audit function and the choice of external auditor (Davidson et al. 2005), role
of outside directors and AC (Peasnell et al. 2005), and managerial ownership
(Teshima and Shuto 2005).
This stream of research is still developing and various factors need to be explored as
a constraint on EM. One of the many important CG mechanisms is SC (Zhuang et al.
2000 (hereinafter Asian Development Bank (ADB) 2000 Report)). This is because
shareholders have major stake in the organization. They are the owners and
therefore, they have the incentive to uphold the company in its continuous life. They
also have incentives to support the managers’ accounting choices if it benefits them.
More importantly, the ADB (2000) Report indicates that SC is a major CG problem
in emerging economies. Therefore, a relevant question is whether the concentrated
shareholders would constrain EM or support managers’ accounting choices.
3
1.3 Shareholder concentration in Emerging Economies Unlike developed economies, emerging economies have lower Gross National
Income per capita with huge growth potential (BusinessDictionary 2011). Research
on emerging economies such as India and China has identified that corporations have
high SC. Ding et al. (2007) using data from Chinese listed companies found that on
average 42% of shares are held by the top shareholder of state owned enterprises
(SOE) and 32% of shares are held by the top shareholder of private companies.
Fiji is also classified as an emerging economy. Table 1.1 presents the level of SC in
companies listed on the SPSE. The SPSE, formerly known as Suva Stock Exchange
was established in 1979 and operated as a ‘trading post’. The establishment of
Capital Market Development Authority (CMDA) in January 1998 added vigor to the
development of the equity market. Hence, Suva Stock Exchange changed its name to
SPSE with the vision “to be an internationally recognized securities exchange for the
Pacific” (SPSE 2012). Currently the SPSE provides a bond market which is highly
inactive and an equity market with 16 listed companies.
Most of the listed companies on SPSE originated from Fiji. These companies were
either SOE or family controlled private company. The company’s vision of
expansion and raising more capital encouraged them to be listed as public
companies. This enables the firms’ shareholding to get diverse as more and more
investors invest in the company. Despite shares being traded on the stock exchange,
most of the listed corporations’ shareholding has not diluted. The major shareholders
of these corporations, either the state or an institution or an individual or a family, are
hesitant in losing control of the organization. The stock market growth has been slow
with less listings and low liquidity (Mala and White 2006). It is therefore expected
that high levels of SC will exist for some time in most of the listed corporation on the
SPSE. Given the high level of SC, the shareholder structure of these companies
differs from companies in developed economies where shareholding is diverse (for
example, the United States (US)).
4
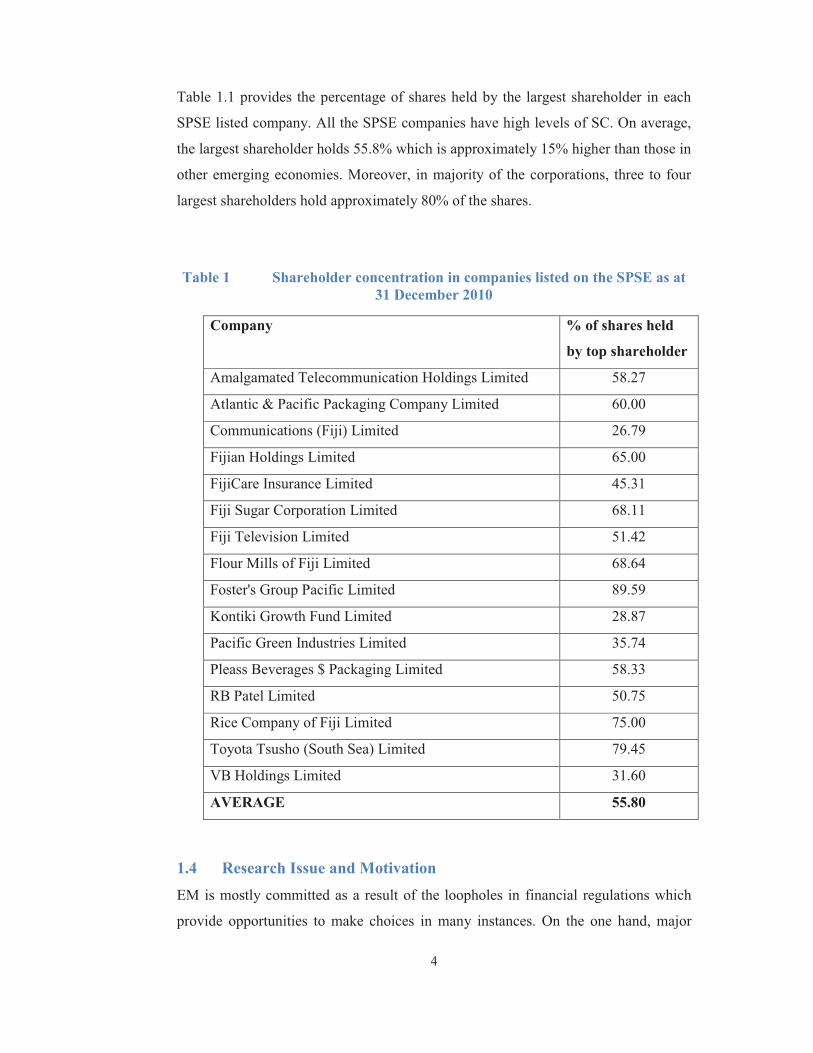
Table 1.1 provides the percentage of shares held by the largest shareholder in each
SPSE listed company. All the SPSE companies have high levels of SC. On average,
the largest shareholder holds 55.8% which is approximately 15% higher than those in
other emerging economies. Moreover, in majority of the corporations, three to four
largest shareholders hold approximately 80% of the shares.
Table 1 Shareholder concentration in companies listed on the SPSE as at 31 December 2010
Company % of shares held
by top shareholder
Amalgamated Telecommunication Holdings Limited 58.27
Atlantic & Pacific Packaging Company Limited 60.00
Communications (Fiji) Limited 26.79
Fijian Holdings Limited 65.00
FijiCare Insurance Limited 45.31
Fiji Sugar Corporation Limited 68.11
Fiji Television Limited 51.42
Flour Mills of Fiji Limited 68.64
Foster's Group Pacific Limited 89.59
Kontiki Growth Fund Limited 28.87
Pacific Green Industries Limited 35.74
Pleass Beverages $ Packaging Limited 58.33
RB Patel Limited 50.75
Rice Company of Fiji Limited 75.00
Toyota Tsusho (South Sea) Limited 79.45
VB Holdings Limited 31.60
AVERAGE 55.80
1.4 Research Issue and Motivation EM is mostly committed as a result of the loopholes in financial regulations which
provide opportunities to make choices in many instances. On the one hand, major
5
accounting bodies like International Accounting Standards Board (IASB) and
Financial Accounting Standards Board (FASB) are working to strengthen the
accounting standards to minimize opportunistic choice of accounting. On the other
hand, recent research is focusing on the factors to constrain EM where emphasis is
on CG mechanisms as the major constraint. Most of these researches have been
conducted in the United Kingdom (UK) and US and a body of research is growing in
China.
It is established in prior research that EM is excessive in most corporations and
organizations are strengthening their CG to constrain EM (Yu 2006; Liu and Lu
2007). This is also prevalent in the SPICs, for instance in Fiji, recent financial scams
such as the agricultural scam and the collapse of the National Bank of Fiji (NBF)
portrays weaker CG and greater EM. Moreover, Singh (2007) stated the same for two
SOEs in Fiji. This indicates that competing incentives for EM exist for these listed
corporations. EM in these corporations is motivated by regulatory pressure from
SPSE, meeting benchmarks, contractual obligations, and managerial compensation.
The recent corporate collapses and incentives for EM not only motivate the need to
identify the extent of EM in corporations in Fiji but also the need to identify factors
that would constrain EM.
EM mostly occurs due to agency problems. All public listed companies have some
extent of agency problems due to separation of ownership and control. Additionally,
the nature of agency problem in a corporation is determined by the firm’s corporate
ownership structure (ADB 2000). SPSE companies have concentrated share
ownership. Therefore, the two forms of agency problem, owner – manager and
majority – minority shareholder agency problem, are common in SPSE companies.
Due to high level of SC, the SPSE companies have less owner–manager agency
problem and more majority – minority shareholder agency problem. The high level
of SC is able to minimize owner – manager agency problem because the
6
concentrated majority shareholders, who are mostly part of the board and the
management, provide extensive monitoring over the management team. As a result
the management would refrain from opportunistic behavior. On the other hand,
majority – minority shareholder agency problem is extensive in shareholder
concentrated firms because the concentrated majority shareholders are able to extract
private benefits of control from the minority shareholders. The dispersed minority
shareholders do not monitor the majority shareholders due to asymmetric
information and large costs of monitoring. Also, the board would refrain from
monitoring the concentrated majority shareholders if it is dominated by them.
On the one hand, the alignment theory (alignment of owner – manager interests)
suggests that high levels of SC would lead to less EM. On the other hand, the
entrenchment theory suggests that high levels of SC would lead to more EM due to
the tunneling behavior of the majority shareholders. Prior literature employs the
alignment and entrenchment theories to explain the effect of managerial ownership
on EM (Teshima and Shuto 2005). Ding et al. (2007) has also used these theories to
explain the effect of the largest shareholder on EM.
More importantly, the ADB (2000) Report highlights that “a fundamental problem in
corporate governance under concentrated ownership is how to protect minority
shareholders from the expropriation by controlling shareholders”. Patel (2002)
presents a similar view in relation to the SPSE companies that “controlling
shareholders may act in their own interests at the expense of minority shareholders
and other investors” (ADB 2000). Moreover, Patel (2002) explains that the
concentrated shareholders resort to EM to extract private benefits of control.
The fundamental problem of resource expropriation and the presence of the
competing agency theories due to the high level of SC provide a unique opportunity
and motivation to investigate the impact of SC on EM in the SPSE companies.
7
1.5 Aim The aim of this study is to investigate the impact of SC on EM in the SPSE
companies.
1.6 Objectives The objectives of this thesis are:
1. To identify the extent of EM in corporations listed on the SPSE.
2. To perform empirical tests in order to investigate the impact of SC on EM in
the SPSE companies.
3. To provide a qualitative analysis on the strength of CG mechanism and SC in
the SPSE companies.
4. To provide suggestions for improvement in the corporate ownership structure
of the SPSE and other similar corporations.
5. To provide suggestions for improvements and betterment of CG in
corporations listed on the SPSE and other similar corporations.
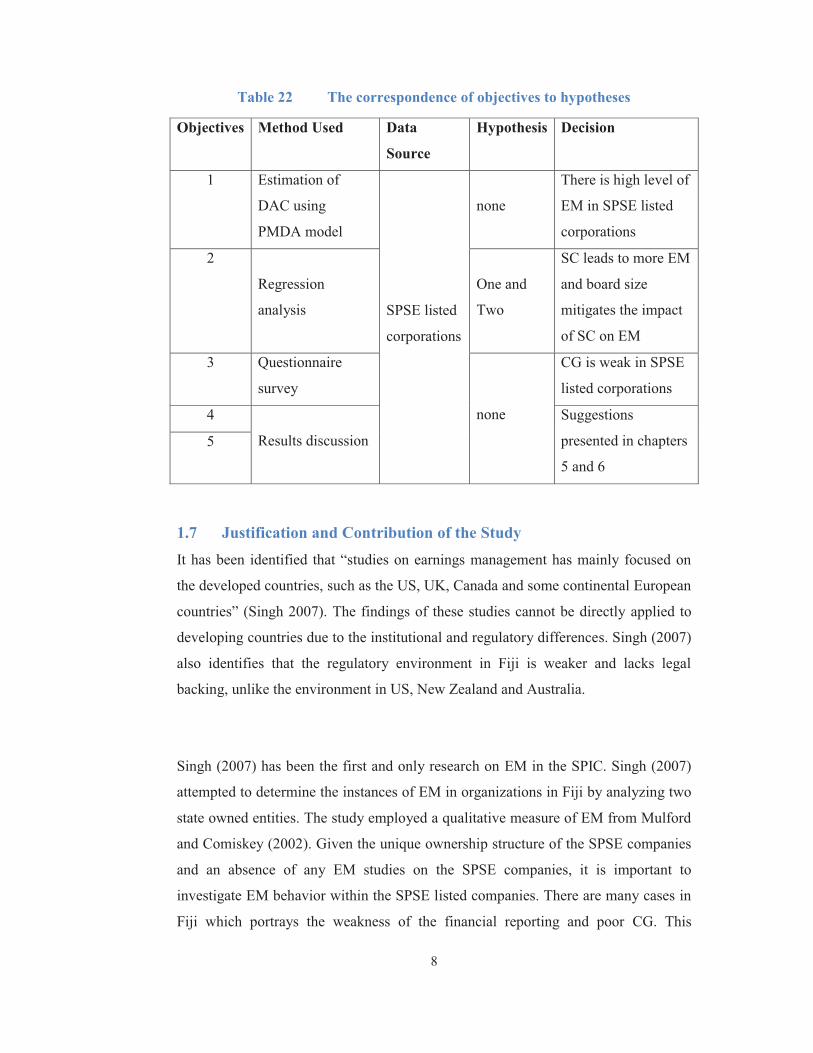
Table 1.2 presents the correspondence of the five objectives to the two hypotheses
developed for this research. The methods, data source and decisions are also
presented to highlight the link from the objectives to the decision attained upon the
completion of this research.
8
Table 22 The correspondence of objectives to hypotheses
Objectives Method Used Data
Source
Hypothesis Decision
1 Estimation of
DAC using
PMDA model
SPSE listed
corporations
none
There is high level of
EM in SPSE listed
corporations
2
Regression
analysis
One and
Two
SC leads to more EM
and board size
mitigates the impact
of SC on EM
3 Questionnaire
survey
none
CG is weak in SPSE
listed corporations
4
Results discussion
Suggestions
presented in chapters
5 and 6
5
1.7 Justification and Contribution of the Study It has been identified that “studies on earnings management has mainly focused on
the developed countries, such as the US, UK, Canada and some continental European
countries” (Singh 2007). The findings of these studies cannot be directly applied to
developing countries due to the institutional and regulatory differences. Singh (2007)
also identifies that the regulatory environment in Fiji is weaker and lacks legal
backing, unlike the environment in US, New Zealand and Australia.
Singh (2007) has been the first and only research on EM in the SPIC. Singh (2007)
attempted to determine the instances of EM in organizations in Fiji by analyzing two
state owned entities. The study employed a qualitative measure of EM from Mulford
and Comiskey (2002). Given the unique ownership structure of the SPSE companies
and an absence of any EM studies on the SPSE companies, it is important to
investigate EM behavior within the SPSE listed companies. There are many cases in
Fiji which portrays the weakness of the financial reporting and poor CG. This
9
includes the collapse of the NBF and the agricultural scam. Moreover, recently the
media has highlighted on numerous occasions that corruption and lack of good
governance is escalating in Fiji. In a recent Fiji Institute of Accountants (FIA)
Congress, the Prime Minister of Fiji stated that the “FNPF board and management
continued to misrepresent its books to the people” (Baselala 2010) in the wake of
$340 million write down of FNPF assets. Hence, it is vital to investigate the
instances of EM in companies listed on the SPSE and it is also vital to identify and
explain ways to constrain them.
First, it is important to determine the ways to measure EM. EM literature has
identified the qualitative measure which is employed in Singh (2007) and the
quantitative measure, which is widely used but has never been employed on the
SPSE organizations. The major reason for not using the Jones model as explained in
Singh (2007) is the lack of data availability. This study now has the benefit of six
more years of data compared to Singh (2007) study and therefore it is possible to
apply the accruals model to companies listed on the SPSE. All the 16 SPSE listed
companies form the sample of this study. An unbalanced panel is formed with no
companies having less than seven consecutive years of data. Hence, it is possible to
use the accruals model to estimate EM. Thus, the quantitative measure of EM is
employed in this study. The application of the quantitative measure allows further
exploration of the variable. This enables the use of other variables to run a regression
as done in many other researches in developed nations to determine the constraints
on EM (Liu and Lu 2007; Ding et al. 2007).
Additionally, a questionnaire analysis is conducted to provide evidence on the CG
practices in the SPSE listed companies. The CG practices in the SPSE companies are
discussed in terms of internal and external governance structures. The CG practices
of the SPSE companies provide further evidence on the inability of SC in
constraining EM.
10
The extant literature has identified CG mechanisms as a major constraint on EM. The
SPSE companies provide a unique opportunity to investigate the impact of SC on
EM. The ownership structure of the SPSE companies is characterized by high levels
of SC. Due to SC, the competitive nature of the alignment and entrenchment theories
makes it imperative to explore the strength of SC in constraining EM. This study
contributes to the extant literature by providing evidence on the dominant theory
operating in high shareholder concentrated firms. Also, it provides empirical and
qualitative evidence on the ability of SC in constraining EM.
1.8 Summary and Organization of the Thesis This thesis is divided into six chapters. The current chapter is an introduction which
is followed by the literature review. Literature review discusses prior EM research
highlighting incentives for EM and drivers for EM. It elaborates on CG as a major
constraint on EM and CG mechanisms are discussed including internal and external
CG structures. This is followed by two hypotheses.
Chapter 3 discusses the research design. This chapter discusses the research methods
and describes the sample used in this study. A detailed discussion is provided on the
measurement of EM and numerous EM models are discussed. Also, independent and
control variables are highlighted. This is followed by a discussion on the data
analysis and the regression model for the analysis.
Chapter 4 presents the empirical analysis to test the two hypotheses. A regression
model is used to analyze the data.
Chapter 5 presents additional findings conducted through a questionnaire survey on
the CG practices in the SPSE companies.

11
The final chapter presents the conclusion. It summarizes the findings of this research
and highlights the implications and avenues for future research. This study
encountered some limitations which are presented in chapter 6.
Next, chapter 2 discusses literature review.

12
CHAPTER 2 LITERATURE REVIEW
2.1 Introduction This chapter provides a thorough review of the EM literature and elaborates on CG
mechanisms (specifically SC and board size) which constrain EM. First, a review of
the incentives for and the drivers of EM are provided. Given the incentives and
opportunities for EM, it has been a concern for more than a decade. Hence, recent
literature on this phenomenon highlights the importance of CG in constraining EM.
Thus, external and internal CG mechanisms are also discussed in this chapter.
ADB (2000) Report suggests that high level of SC is a CG issue for companies in
emerging economies. Moreover, the extant literature on board size emphasizes on the
ability of larger boards in providing effective monitoring over the management of
dispersed owned firms. Based on SC and board size theories, two hypotheses are
developed in this chapter. First hypothesis establishes a relationship between SC and
EM. The second proposition is on the ability of large boards in mitigating the effect
of highly concentrated shareholders on EM.
2.2 Earnings Management EM being a concern to many corporate organizations is a broadly and well known
phrase to accounting academics and practitioners. Healy and Wahlen (1999) explain
that “earnings management occurs when managers use judgment in financial
reporting and in structuring transactions to alter financial reports to either mislead
some stakeholders about the underlying economic performance of the company or to
influence contractual outcomes that depend on reported outcomes”. Judgments can
be exercised in many ways and for various objectives. If it is to mislead some class
of stakeholders then it is called EM (Healy and Wahlen 1999). Schipper (1989) has a
similar view on EM. Schipper (1989) states that EM is the “purposeful intervention
in the external financial reporting process, with the intent of obtaining some private
gain”.
13
Dechow et al. (1996) explain that EM is restricted to accounting choices made within
Generally Accepted Accounting Practices (GAAP). However, the flexibility
provided by accounting standards and the purpose of accrual accounting is to provide
better information about the business performance. Moreover, if the choices are
made to obscure true economic performance, then it is EM (Dechow and Skinner
2000). Dechow and Skinner (2000) added that the choices made to manage earnings
will have similar consequences as financial fraud2. EM is not an illegal activity;
however, it has been a concern for decades. Since EM is committed within the
standards and other regulations given choices in some standards, it is of much
interest to major stakeholders. This is also due to EM being an immoral and unethical
activity where resource allocation is affected.
Fama (1980) explains the theory of a corporate organization where there is a
separation of security ownership and control. The organizations operate based on
principal – agent relationship. EM behavior is explained by the agency theory and is
mostly due to differing interests of the principal and the agent. There are two forms
of agency problems. First, owner – manager agency problem is common in dispersed
owned firms. Second, majority – minority shareholder agency problem is common is
shareholder concentrated firms. Emerging economies experience high levels of SC3
resulting in reduced agency problem between the shareholder and the manager.
However, there is an agency problem between the majority and the minority
shareholders. One such an agency problem is referred to as “tunneling”. Tunneling
refers to the “transfer of resources away from firms for the benefits of their
controlling shareholders” (Liu and Lu 2007). Tunneling is serious in emerging
economies where CG is weak (Liu and Lu 2007).
2 Financial fraud is when accounting choices explicitly violates GAAP. (Dechow and Skinner 2000) 3 SC occurs when one or few largest shareholder hold majority of the shares of the company (Ding et al. 2007 and Liu and Lu 2007).

14
2.2.1 Incentives for Earnings Management
Dechow and Skinner (2000) identifies two major incentives for EM. First, in their
view, Practitioners and Regulators mostly are more concerned about capital market
incentives for EM. Capital markets provide incentives for EM, as it provides a
market for trading shares. The share price changes in response to information release
by organizations. Shareholders and potential investors react to new information
disclosed and therefore causing changes in demand and supply of the corporations’
shares. Thus, there is an impact on the share price. Managers or majority
shareholders, if interested in share price, could manage earnings to eventuate
temporary changes in prices. However, in a strong efficient form capital market, as
true information is available, the prices will adjust to its true value. In an inefficient
form market, which commonly exist in developing economies and emerging markets,
the incentive to engage in EM is more profound because the majority shareholders
have insider information which they would release when it is appropriate for them.
Second, contractual arrangement also provides incentives for EM. For instance,
bonus plans and debt covenants. There is incentive for EM when these contracts are
based on accounting numbers such as profits. Therefore, agents would manipulate
accounting numbers so that they are able to get the most benefits from the contracts,
such as a good bonus or further loans. Furthermore, Healy and Wahlen (1999) have
also discussed regulatory incentives. These incentives along with other related
incentives are further discussed.
Meeting Simple Benchmarks
According to Degeorge et al. (1999), most managers find that it is vital to avoid
losses. Profits sound good for a business and also for managements’ performance.
Once managers achieve profitability, they find that it is important to maintain
increases in profits each period. Moreover, once string of earnings increases is
produced, it becomes vital to meet analysts’ forecasts. Several researches have
provided evidence on this phenomenon (Burgstahler and Dichev 1997; Burgstahler
1997; Degeorge et al. 1999). The studies explain that small reported losses are
15
unusually rare than small reported profits and small increases in reported earnings
are unusually common than small declines in those earnings (Burgstahler and Dichev
1997; Burgstahler 1997; Degeorge et al. 1999). It is well known that reporting
earnings in this manner usually signals positive information about the firm in the
capital markets and thus market participants are expected to positively react. This
would increase the shareholder wealth. Healy and Wahlen (1999) explain that
earnings are manipulated as an attempt to influence short-term stock price
performance. However, it is expected that businesses will not always have increases
in earnings. In order to avoid any negative signal to the capital markets, managers’
would engage in EM.
Meeting Analysts’ Forecasts
Financial analysts usually make periodic financial forecasts. The forecast depends on
the current business situation and future prospects. Management takes the
responsibility of meeting or beating the forecast. It is perceived that if the forecast is
not met then the managers have failed in their part and have not performed
efficiently and effectively. Hence, the managers are inclined to engage in EM to
ensure that they meet or beat the analysts’ forecasts. Several studies (Brown 1998;
Burgstahler and Eames 1998; Degeorge et al. 1999; Richardson et al. 1999) which
have provided evidence that EM is motivated by analysts’ forecasts, document that
firms normally meet or beat earnings forecasts by small numbers. There is unusually
small number of cases where forecast is not met. Additionally, Burgstahler and
Eames (1998) provide evidence that managers have engaged in income increasing
EM to avoid reporting earnings below the analysts’ forecast. Furthermore, Kasznik
(1999) provides evidence that earnings are managed upwards using unexpected
accruals when there is danger of firms not meeting management forecasts.
Equity Offering
Since a firm’s share price is related to the firm’s earnings, managers are expected to
engage in EM prior to equity offers such as Initial Public Offers (IPO) or Seasoned
16
Equity Offers. Hence, higher earnings and increases in earnings would signal
positive information which would lead to overvaluation of initial offer price. Healy
and Wahlen (1999) explain that some managers using income increasing accruals
“inflate reported earnings in an attempt to increase investor’s expectations of future
performance and increase the offer price”. Singh (2007) presents a similar view and
states that due to information asymmetry between investors and IPO issuers, the IPO
process is susceptible to EM. Earlier studies have provided some evidence on this
incentive. Teoh et al. (1998b) provide evidence on the relationship between EM and
underperformance of IPOs in the subsequent periods. Issuers with unusually high
accruals prior to IPO year experience decline in stock prices in subsequent years
reflecting true financial performance and allowing capital market to adjust the share
price. Teoh et al. (1998a) and Rangan (1998) provide similar evidence around
seasoned equity offering.
Management Buyouts
When managers of a firm are considering purchase of the firm, it is expected that
they would want its share price to decrease. As explained earlier, since share price
reflects on the information generated from firm’s earnings, managers have an
incentive to manage earnings that would result in a decline in the share price. This
will make management buyout cheaper. DeAngelo (1988) provides some evidence
from examination of changes in accruals that managers of buyout firms understate
earnings prior to management buyouts. Moreover, Perry and Williams (1994)
provide more evidence from an examination of discretionary accruals (DAC) using a
larger sample that managers of buyout firms engage in negative or income –
decreasing accruals prior to buyout.
Management Compensation contracts
Similar to the capital market incentives, contract arrangement also induces EM. This
is mostly when certain outcome in the contract is depended on accounting numbers.
A management compensation contract is a good example where bonus plans depend
17
on earnings or share price increments. In a normal business scenario, managers are
entitled for bonuses upon achieving certain level of earnings. Even if the
compensation is in terms of share options, it is related to share prices which could be
temporary manipulated. A few studies have examined actual management
compensation contracts to provide evidence on this issue. Healy (1985) and
Holthausen et al. (1995) explain that managers engage in income increasing EM to
improve reported earnings when actual earnings do not qualify for bonuses.
Additionally, managers would defer accruals to future periods when reported
earnings have reached the upper bound of the executive bonus package. Gaver et al.
(1995) presents a similar work, however, supports income smoothing hypothesis.
Moreover, Guidry et al. (1999) supports Healy’s bonus hypothesis and the study
shows that managers manipulate accruals to maximize short – term bonuses.
Research has also examined incentives for EM when top managers’ job security is
threatened or their expected tenure with the firm is short. DeAngelo (1988) explains
that incumbent managers exercise accounting discretion to improve reported earnings
during a proxy contest. Dechow and Sloan (1991) present similar evidence relating to
Chief Executive Officer (CEO) who reduce research and development spending in
their final year in office, probably to increase reported earnings.
Lending Contracts
Lenders in their lending contracts with firms usually have debt covenant to restrict
the firm to maintain certain accounting ratios or impose limits to investing and
financing activities. Violation of this covenant could lead to some serious
consequence for the firm. This includes increase in interest rates, requiring additional
security for the loan, or in extreme cases immediate payment of the loan. In order to
avoid such consequences, managers could be motivated to manage earnings (Beneish
2001). Prior research has found some evidence of EM motivated by lending
contracts. DeFond and Jiambalvo (1994) and Sweeney (1994) who examined a
sample of firms that actually violated the debt covenant, found mixed results. The
earlier paper states that firms engage in EM a year prior to covenant violation.
18
However, the later study finds that firms engage in income increasing EM after
covenant violation. Healy and Wahlen (1999) provide an alternative explanation that
the sample firms in Sweeney (1994) could have restructured their operations in
response to their financial difficulties. Moreover, Dichev and Skinner (2002) using a
sample of US firms having private lending agreements provide evidence that firms
take actions to be on the safe side. They find an unusually small number of loans
with financial measures just below covenant thresholds and an unusually large
number of loans with financial ratios at or just above covenant thresholds.
Industry regulations
Almost all industries are regulated to some degree and some face monitoring that is
explicitly tied to accounting numbers. This includes the Banking industry where
certain capital adequacy requirements are written in terms of accounting numbers
and insurance regulations having conditions for minimum financial health (Healy
and Wahlen 1999). It is asserted that these regulations being tied to accounting data
create incentives for EM. This could be either income increasing or income
decreasing EM. Moyer (1990), Scholes et al. (1990), Beatty et al. (1995) and Collins
et al. (1995) provide evidence that firms overstate loan loss provisions, understate
loan write-offs and recognize abnormal realized gains on securities portfolios when
they are close to capital adequacy requirements. Similarly, insurance companies that
risk regulatory attention understate claim loss reserves (Petroni 1992) and engage in
reinsurance transactions (Adiel 1996).
Anti – trust regulations
Similarly, firms’ vulnerable to anti – trust investigations or adverse political
consequences and firms seeking government subsidy or protection have incentives to
manage earnings. The following studies have examined a sample of firms having
such incentives. Jones (1991) examines 23 firms and states that firms seeking import
relief such as tariff increases and quota reductions tend to defer income in the year of
application. Cahan (1992) examines a sample of 48 firms for monopoly related
19
violations. The study states that these firms reported income decreasing DAC in
investigation years. Similarly, Key (1997) reports evidence of firms in the cable
television industry engaging in EM during the period of Congressional scrutiny.
Even though there are numerous incentives for EM, EM is not possible without
availability of opportunities to perpetrators. The opportunities are available due to
the flexibility in financial reporting, imperfect auditing and poor governance
structures in organizations. The following sub section postulates discussion on the
opportunities giving rise to ways in which managers engage in EM.
2.2.2 Drivers of Earnings Management
There are three major ways in which managers could manage earnings. These are (1)
the use of accruals, (2) changes in accounting methods and (3) changes in capital
structure (debt defeasance and debt – equity swaps) (Jones 1991). Research in the
past has mostly concentrated on the use of accruals for EM. Therefore, numerous
authors have modeled this to compute DAC which is now used as a common proxy
for EM (Healy 1985; DeAngelo 1986; Jones 1991; Dechow et al. 1995; Kothari et al.
2005).
Within accruals, there are several accruals which are managed to temporarily
increase or decrease income. Some research has focused on the use of specific
accruals. Nelson et al. (2003) identified several accounting areas such as revenue
recognition, fixed assets, intangibles, investments, business combinations, leases and
reserves being the most frequent area where EM is prevalent. Marquardt and
Weidman (2004) examine the use of specific accruals for managing earnings. They
state that the use of specific accruals depends on the associated costs and benefits
which depends on the motivation for EM. McNichols and Wilson (1988) found firms
managing earnings with bad debt provisions. Nevertheless, in practice, many
accruals are simultaneously being used for EM. Since, in many cases it is unclear
which specific accruals are managed, there are many works which concentrates on
20
aggregate accruals (Balsam et al. 2003; Davidson et al. 2005; Krishnan 2003; Liu
and Lu 2007).
Accruals are easily and commonly used for EM due to the available flexibility within
accounting standards. The flexibility is vital so that the management can convey
information to the stakeholders about the entity’s performance (Healy and Wahlen
1999). Due to the imperfect nature of auditing, this flexibility is abused to hide the
true performance (Singh 2007). Based on prior studies; Amat and Gowthorpe (2004),
Brewer et al. (2002), Healy and Wahlen (1999) and Blake et al. (1998); Singh (2007)
outlines five potential categorical areas for EM resulting from the accounting
standards. The following paragraphs in turn discuss these categories.
First, the current accounting process requires estimates of several future economic
events. Managers are given the space to exercise judgments to derive these estimates.
Estimates are required for events such as the expected lives and salvage values of
noncurrent assets, deferred taxes, obligations for pension benefits and other post-
employment benefits and losses from bad debts and asset impairments.
Second, accounting standards allow choices in the use of accounting methods for
specific accounting purposes. For instance, inventories can be valued using First In
First Out, Last In First Out or Weighted Average methods. Similarly, depreciation
for long term assets could be calculated using straight line, unit of use, or
diminishing value methods. Also, there is a dual treatment for borrowing cost
depending on its nature. Therefore, justification could be used to treat it as an asset or
an expense. The effect of changes in accounting methods can be easily identified in
the year of change. However, it is less readily discernible thereafter.
Next, judgments are exercised in evaluating transactions if they meet certain criteria
for a particular accounting treatment. For instance, previously, classification of
21
events into extraordinary items required explanation that is both unusual and
infrequent. Likewise, recently for other comprehensive income, judgments are
necessary for classifications.
Fourth, the timing of transactions also has an impact on the financial performance.
Transactions could be either accelerated or deferred to ensure earnings figure is
within the range desired by managers. Mostly, timing for expenditures such as
advertisements, maintenance and research and development is adjusted to attain
desired earnings.
Last, corporate transactions are also structured with the view to either report more or
less earnings in the current period. Singh (2007) provides the following two
examples. First, the sale proceeds of the asset could be artificially adjusted (increased
or decreased) with an equivalent adjustment to related rental payments in a sale and
leaseback arrangement. Second, equity investments can be structured to either avoid
or require consolidation.
Accordingly, due to the incentives and opportunities for EM, EM has been high in
corporations for decades. Even though EM is committed within the regulations, it has
been a concern for practitioners and researchers. In response, academic research has
shifted its focus to identify possible ways of constraining EM to ensure future
viability of the corporation.
2.3 Recent Focus on Earnings Management Research Since late 1990s, EM researchers have prioritized investigation on EM constraints
(Becker et al. 1998; DeFond and Subramanyam 1998). By that time, prior research
had established that EM is common in most corporations (McNichols and Wilson
1988; Jones 1991; Dechow et al. 1995; Healy 1985). Earlier research identified
various accrual models, some using single accruals (McNichols and Wilson 1988)
22
and others using total accruals (TA) (Jones 1991; Dechow et al. 1995; Healy 1985).
Jones (1991) and its modified model (Dechow et al. 1995) have been widely used in
literature. This is discussed in the EM measurement section in the next chapter
(section 3.4).
Recent extant literature discusses several CG mechanisms that constrain EM. First,
audit mechanism includes attributes such as audit quality (Becker et al. 1998;
Krishnan 2003), auditor independence measured using audit fee (AF) (Frankel et al.
2002), and non–audit service (NAS) fee (Ferguson et al. 2004), audit effort
(Caramanis and Lennox 2008), auditor industry specialization (Balsam et al. 2003)
and external auditor changes (DeFond and Subramanyam 1998). Second, board
mechanism consists of attributes such as board committees (Wild 1996; Chtourou et
al. 2001), board and AC expertise and meeting frequency (Xie et al. 2003; Dhaliwal
et al. 2006), board independence (Davidson et al. 2005; Peasnell et al. 2005; Klein
2002; Bar-Yosef and Prencipe 2009), board quality (Sarkar et al. 2008). Third,
ownership mechanism includes attributes such as managerial ownership (Teshima
and Shuto 2005; Gabrielsen et al. 2002), institutional blockholders (Cheng and
Reitenga 2009), investor protection (Leuz et al. 2003) and ownership concentration
(Ding et al. 2007; Liu and Lu 2007).
Since the recent literature on EM has identified CG mechanisms as a major
constraint on EM, it is vital at this point to understand CG and its mechanisms. The
following two sections elaborate on CG and discuss CG mechanisms as external and
internal CG structures respectively.
2.4 Corporate Governance The Advisory Board Minutes of National Association of Corporate Directors
Meeting explains that “Corporate Governance ensures that long-term strategic
objectives and plans are established and that the proper management structure
(organization, systems and people) is in place to achieve those objectives, while at
23
the same time making sure that the structure functions to maintain the corporation’s
integrity, reputation and responsibility to its various constituencies” (Vance 1983).
Shleifer and Vishny (1997) state that “corporate governance deals with the ways in
which suppliers of finance to corporations assure themselves of getting a return on
their investment”. Broshko and Li (2006) explain that CG is about investor
protection. This is vital in today’s modern public companies where there are agency
problems due to the separation of management and finance or separation of
ownership and control. Corporations are financed by numerous individuals and/or
institutions that have the ownership interest. Despite being the owners they are
unable to get involved in the management of the business and hence the control is in
the hands of the agents (managers or controlling shareholders). Since the agents have
control over the assets and activities of the corporation, they can expropriate the
firm’s resources and extract private benefits. Shleifer and Vishny (1997) explain that
agency problem results from contractual relationships where management gets
discretion. The paper further explains that incentive contracts can align the interests
of agents and principals. However, it leads to agency costs. Therefore, the
shareholder wealth maximization goal, which is strenuous, can only be accomplished
if agents are restricted from expropriating resources. Such restrictions could be
through extensive monitoring and protecting investors. This is mostly accomplished
with strong CG. Thus, CG is vital.
The importance of CG has been greatly acknowledged in the US upon the collapse of
public companies such as Enron, Tyco International and WorldCom. The Sarbanes –
Oxley Act (SOX) which was enacted in July 2002 “was designed to facilitate the
tightening of accounting standards and enhance external auditor independence from
management” (Robins 2006). The SOX consists of 11 titles which describes specific
requirements for financial reporting. The 11 titles are (1) Public Company
Accounting Oversight Board, (2) Auditor Independence, (3) Corporate
Responsibility, (4) Enhanced Financial Disclosures, (5) Analyst Conflict of Interest,
(6) Commission Resources and Authority, (7) Studies and Reports, (8) Corporate and
Criminal Fraud Accountability, (9) White Collar Crime Penalty Enhancement, (10)
Corporate Tax Returns, and (11) Corporate Fraud Accountability (SOX 2002).
24
The SOX provides several guidelines on various CG issues within the 11 titles.
Specific CG mandates relate to the duties of the Board, member appointment,
composition and independence, powers and rules of the board and also audit quality
and auditor independence. Sections 201 to 209 outline various rules on maintaining
auditor independence. The importance of an AC is discussed in section 204 which
states that the auditor reports to the AC (SOX 2002). Likewise, other titles in the
SOX provide numerous rules to ensure strong CG practices within corporations listed
and operating in the US.
Australia also experienced a spate of dramatic corporate collapses which includes
One.Tel, Harris Scarfe and HIH before the collapses in the US. Australia responded
to this with legislative changes following the SOX. The Australian responses include
a Corporate Law Economic Reform Programme (CLERP 9) which “amends the
Corporations Act” effective from 1st July 2004 and the “establishment of a Corporate
Governance Council by the Australian Stock Exchange” (Robins 2006). The CLERP
9 primarily strengthened the “financial disclosure and the independence and integrity
of audit (Robins 2006). Additionally, CLERP 9 includes “more detailed regulation of
audit practices” and provides “greater protection to whistleblowers” (Robins 2006).
Moreover, the Australian Securities Exchange (ASX) Corporate Governance Council
publishes and provides CG Principles and Recommendations as guidelines for
companies listed on the ASX and generally for companies operating in Australia
(ASX Corporate Governance Council 2003). These principles and guidelines have
been recently revised and its second edition is published (ASX Corporate
Governance Council 2007).
2.5 Corporate Governance Mechanisms and Earnings Management CG literature identifies several mechanisms (audit, board and ownership) which are
useful for investor protection. Most of these mechanisms focus on monitoring the

25
management or establishing policies to ensure that they are aware of the
consequences of misappropriation of firm’s resources. Yu (2006) while discussing
the relationship of CG and EM classifies CG as external and internal governance
structures. The discussion of CG mechanisms that follows is similarly
compartmentalized.
2.5.1 External Corporate Governance Structures
Institutional ownership
Within a capital market, few firms are actively involved in investment in stocks of
other public corporations. These institutions normally hold significant proportion of
the shares of the invested company and thus actively monitor the firms in their
investment portfolio. Hence, if these institutional shareholders are active then they
would lessen agency problem (Solomon and Solomon 2004). There has been an
increase in institutional shareholder activism in the UK and it is having a positive
effect on CG and corporate value as well (Solomon and Solomon 2004). Clay (2000)
and Hartzell and Starks (2003) state that institutional investors influence executive
compensation. Wu (2004) added that they also influence board structures. Similarly,
Fleming (2003) explains that “the most likely outcome of the change in the type of
owner and ownership concentration is in the review and monitoring of the board and
management by shareholders that could incur the transaction costs of information
collection and regular briefings and meetings”. Moreover, Yu (2006) finds that
“higher institutional holdings are associated with less earnings management”.
However, ownership endogeneity is a potential problem since institutional investors
may have a preference to invest in firms with less EM which could be due to good
internal governance (Yu 2006). Bushee (1998) and Yu (2006) further state that long-
term institutional ownership significantly constrains EM while the effect of short-
term holdings is positive and insignificant.
26
Securities Market Regulation
ADB (2000) Report provides the CG insight of stock market regulations. The basic
objective of the regulation is to ensure better CG and corporate performance and
maximization of shareholders’ wealth. This could be achieved if the regulation is
able to protect investors’ interests, maintain order in the market and promote market
efficiency. There are usually numerous requirements of the securities market. Such
requirements include; registration requirement, timely disclosure requirement, and
restriction on share trading by certain groups and restrictions on the levels of
shareholding by financial institutions (ADB 2000). These regulations could be
effective for strong CG. Nevertheless, implementation mechanisms vary and there
could be great costs of enforcing compliance. Emerging stock exchanges do have a
number of regulations, however, implementation and enforcement is an issue in
developing and emerging economies.
Market Control and Competition
Corporate control is normally gained by corporations during mergers and takeovers.
The market of corporate control is not common since information asymmetry may
render the takeover mechanism ineffective. Even though the hostile company
succeeds in the hostile takeover, it is usually at a very high price because the
managements and the concentrated shareholders have inside information. Yu (2006)
states that “hostile takeovers are a powerful form of governance to discipline
managers”. They can remove incumbent managers by gaining control of voting
rights. When there is a threat of losing control, management is more vigilant and
would probably work harder. However, anti-takeover legislation increases the
difficulty and reduces the power of outsiders on current management. Using
differences-in-differences methodology, Yu (2006) tests the effect of legislation
changes on EM and finds that “once takeover pressure is reduced, managers are more
likely to take ‘big baths’”.

27
Similarly a competitive market pressures management to be efficient otherwise they
would be forced out of business. Shleifer and Vishny (1997) and ADB (2000) Report
state that a perfectly competitive market could be sufficient to ensure managers act in
investors’ interests. However, a perfectly competitive market is uncommon.
Creditor Monitoring and Protection
Creditors, similar to owners are a major stakeholder of a corporation. Unlike owners
who are insiders, they are referred to as outsiders. Creditors provide short term loans
and companies come back to them at regular intervals for more transactions. Hence,
as stated in ADB (2000) Report, creditors have some control rights in the companies
they finance, thus they are an important player in CG. They can “discipline
companies that default on debt payments or violate debt covenant” (ADB 2000).
Creditors can also influence decision making of solvent corporations by imposing
restriction on the overall level of borrowing of the company. If borrowers violate any
covenant or default in payments, lenders can repossess firm’s assets (collateral) or
liquidate the firm. Although these threats may ensure managers invest in good
projects, there are costs involved. For instance, due to restrictions, companies may be
prevented from undertaking better yielding projects.
The quality of creditor monitoring depends on a number of factors. This includes the
difficulty in renegotiating in default states, whether creditors’ rights are enforceable
in courts, creditors’ own CG structures and regulations (ADB 2000). Most
corporations usually borrow from commercial banks. Hence, banks have stronger
incentive to monitor corporate activities. However, market debt providers could more
effectively monitor since renegotiating with these dispersed debt providers may be
difficult than banks who hold bilateral relationships. ADB (2000) Report states that
“the interlocking ownership relationship between creditors and borrowers could
compromise the role of creditors as external agents in monitoring and disciplining
borrowers, especially when bank and financial regulations and supervisions are
weak”.
28
Legal Protection
Shleifer and Vishny (1997) identified that “much of the differences in corporate
governance systems around the world stems from the differences in the nature of
legal obligations that managers have to the financiers, as well as in the differences in
how courts interpret and enforce these obligations”. Shareholder voting right is an
essential characteristic but it is expensive for small investors. In developed nations,
voting violations are tried in courts. This is not a common practice in weaker legal
systems, especially in developing nations. Strong legal protection is vital to attract
potential investors. This includes “legal restrictions on managerial self-dealing, such
as outright theft from the firm, excessive compensation, or issues of additional
securities (such as equity) to the management and its relatives” (Shleifer and Vishny
1997). The duty of loyalty doctrine is strong in US and Canada but outside the
Organization for Economic Co-operation and Development (OECD), it is a weaker
concept (OECD 2004). Shleifer and Vishny (1997) explain that this is due to the
courts’ incapability and lack of desire to interfere in business.
Similarly, effective creditor monitoring would be possible if creditors are legally
protected. Shleifer and Vishny (1997) identify some of the ways creditors are
protected across countries. These include the right to repossess collateral assets,
liquidate company when it defaults payments, vote to reorganize the company, and
remove incumbent managers. Even though creditor legal protection is often more
effective, diverse creditors with conflicting interest makes the legal proceeding
difficult, costly and lingering. Despite the difficulties, creditor legal rights are
enforced. Leuz et al. (2003) and Yu (2006) provide evidence that stronger legal
protection for outsider is negatively associated with the instances of EM. However,
Shleifer and Vishny (1997) state that the situation is worse in developing economies
due to incomplete bankruptcy laws and unreliable courts.
29
2.5.2 Internal Corporate Governance Structures
Internal CG stems from the shareholders (owners) to the employees. It includes the
structures in place within the organization to ensure its efficient operations. The
attributes include audit functions, executive remunerations, BOD’s characteristics
and committees and ownership structure which are discussed in this section
respectively.
Audit functions
Effective audit consists of both internal and external audit. Internal audit function
provides an assurance and consulting service to improve the effectiveness of risk
management, control and governance processes (Institute of Internal Auditors 1999).
It also facilitates the effective operation and functioning of the AC (Scarbrough et al.
1998; Goodwin and Yeo 2001; Goodwin 2003). Clikeman (2003) emphasizes that
internal audit should take a proactive approach in educating managers and directors
on the dangers of EM practice. Hence, Davidson et al. (2005) explores the
effectiveness of internal audit function in curbing EM and reports an insignificant
negative relationship.
Past literature suggests that large audit firms (Big 4) are more effective in monitoring
the financial reporting processes and performs higher quality external audits than the
smaller firms (DeAngelo 1981; Francis et al. 1999; Francis and Krishnan 1999; Kim
et al. 2003). Larger audit firms have more resources, expertise and greater incentive
to protect their reputation (Krishnan 2003). Accordingly, Becker et al. (1998) and
Francis et al. (1999) find that clients of larger auditors (Big 5) report lower levels of
EM. Similarly, auditor industry specialization also contributes to audit quality and
hence is positively associated to earnings quality (Balsam et al. 2003). In the
contrary, Davidson et al. (2005) using Australian firms, reports an insignificant
negative relationship between audit quality and earnings quality.
30
Auditor independence is also vital in constraining EM. Frankel et al. (2002) and
Ferguson et al. (2004) provide evidence that auditor independence measured using
the proportion of NAS fee constrains EM. When an audit firm provides excessive
NAS to a client, its independence appears to be impaired. Caramanis and Lennox
(2008) provide evidence that the level of audit effort is negatively associated with
EM.
Executive remunerations
Solomon and Solomon (2004) explain that it is vital to set the executive pay at
appropriate levels. Jensen (1993) identified that the importance of establishing ERs is
to incentivize management to pursue with shareholders’ interests. In the UK, the
Cadbury and Greenbury Reports led to the creation of remuneration committee
(discussed later in this chapter) to determine pay packages of executives. Core et al.
(1999) using US data presented significant statistical evidence on the association
between excessive ER and poor corporate performance. Moreover, Cheffins (2003)
identified that executives in the US were receiving larger pay packages than any
other countries considered in the study. The paper highlighted on the importance of
disclosure of ERs and argued that a significant relationship between remuneration
and performance would reduce shareholder monitoring costs.
Board of Directors
The many shareholders of public companies cannot individually oversee the business
operations. Thus, the shareholders appoint BOD who monitors the activities of the
management. ADB (2000) Report identifies some fiduciary responsibilities of BOD.
These are to “formulate corporate policy, approve strategic plans, authorize major
transactions, declare dividends, and authorize the sale of additional securities”. Their
responsibilities also involve hiring, advising, compensating management and
nominating new board members and to determine board size.

31
A board is composed of members with differing characteristics. In shareholder
concentrated firms, the majority shareholders normally form part of the BOD. The
board also consists of some executive and non-executive (independent) directors
(Fleming 2003). Board independence is paramount to ensure effective monitoring
over the management. Having greater proportion of non-executive directors on the
board ensures that the CEO or other senior management is not able to influence the
Board’s decision. Similar view is presented by Davidson et al. (2005), Chtourou et
al. (2001) and Xie et al. (2003) who test the effectiveness of the board in constraining
EM. Chtourou et al. (2001) provide insignificant results. Xie et al. (2003) and
Davidson et al. (2005) provide results that a board with majority of non-executive
directors is significantly negatively associated with EM. However, Brickley and
James (1987), Weisbach (1988), Byrd and Hickman (1992) and Lee et al. (1992)
states that independent directors are effective in specific agency problem instances.
Moreover, it is highly recommended that the responsibilities of the CEO and the
chairperson shall be carried by two different individuals. The non-duality of CEO
and board chairperson also ensures board independence. However, Davidson et al.
(2005) present an insignificant positive relationship between CEO non-duality and
EM, and Bar-Yosef and Prencipe (2009) find that the proportion of independent
directors and CEO non-duality are weaker in constraining EM for family-controlled
businesses.
The board independence is also affected if the CEO sits on any of the committee
formed by the board, for instance, the nominating committee and executive
compensation committee (Klein 1998, 2002; Shivdasani and Yermack 1999). Klein
(2002) provides evidence that “earnings management is positively related to whether
the CEO sits on the board’s compensation committee. Peasnell et al. (1998, 2005)
highlight that “the likelihood of managers making income-increasing abnormal
accruals to avoid reporting losses and earnings reductions is negatively related to the
proportion of outsiders on the board”. The result is insignificant for income-
decreasing EM. Likewise Sarkar et al. (2008) explain that diligent boards are
associated with lower levels of EM, but promoters’ influence on the board and busy

32
independent directors exhibit higher EM. Sarkar et al. (2008) conclude that board
quality is more important than board independence in curbing EM.
Alternatively, board composition relates to the proportion of shareholding director
and non-investor director. This alternative definition of board composition
determines how well the board’s interest is aligned with those of the shareholders or
with the majority shareholders. Hence, Mace (1986) and Patton and Baker (1987)
state that it is more likely that directors with sizeable ownership would question and
challenge management’s proposals because it would impact on their wealth (Minow
and Bingham 1995). Since the board-owners interest will be aligned, they will be
more effective in monitoring the management. Literature provides a positive
association between stock ownership by outside directors and effective monitoring
(see Gerety and Lehn 1997; Beasley 1996; Shivdasani 1993).
Moreover, board member competence is also vital in effective board monitoring
(Beasley 1996; and Gerety and Lehn 1997). It is not only vital for the non-executive
board members to have knowledge of the company’s affairs and the governance
process (Chtourou et al. 2001) but also to have experience on the company’s board
(Kosnik 1987). Chtourou et al. (2001) provide evidence that non-executive directors’
competence, measured as number of directorships held and years served, constrain
EM.
Board Committees
The many responsibilities of the board are divided and board committees are formed
to engage in each specific task. For instance, an AC is formed for the purpose of
monitoring the financial reporting process (Laux and Laux 2007). The board
committees are discussed in the following paragraphs.
33
Executive Committee
Vance (1983) identifies that executive committees mostly have inside directors as
members and outlines some salient features of this committee. The features include:
it’s constant presence and acts for the board in the interim between board meetings; it
assists the CEO and also checks on him/her; members are mostly officer-directors,
experienced, competent and dedicated to the company.
Nomination Committee
Vance (1983) states that the nomination committee is responsible for locating
competent and available candidate for the board. Mallin (2010) adds that the
“nomination committee should evaluate the existing balance of skills, knowledge,
and experience on the board, and utilize this when preparing a candidate profile for
new appointments”. Moreover, the nomination committee is “frequently asked to
review the board’s total composition, structure and membership”. That is, this
committee selects and/or evaluates the members of each board committees, inside
and outside directors, top executives, candidates for vacancies and incumbent
directors (Vance 1983). Chtourou et al. (2001) explain that it is vital for firms to have
independent nomination committee “for board effectiveness and monitoring ability
because it takes away the CEO’s power in nominating new members to the board”.
Chtourou et al. (2001) find insignificant results on the association between
nomination committee and EM.
Compensation Committee
The compensation committee is responsible for setting the higher managements’
remuneration, especially for the CEO and executive directors. The executive pay
includes base salary, bonuses and performance based shares. Other benefits such as
housing, travelling, and medical allowances are also provided. The compensation
committee also oversees the company’s compensation practices and approves its
compensation programs and plans. Vance (1983) adds that the compensation
committee administers the stock option plans for some companies as well. The
34
committee, if dominated by inside directors, is excessively generous in setting their
own executive pay (Vance 1983). Sykes (2002) states that although majority or entire
members of the remuneration committee may be non-executive directors, they might
be part of management in another company. Hence, non-executive directors could
also be generous in setting the executive pay.
Laux and Laux (2007) explain that since the board members are distributed into
board committees, the committee members would concentrate on committee specific
goals. The committee specific goals may not individually positively contribute to the
overall Boards aim. For instance, the purpose of performance sensitive pay is to
motivate managers to work harder and also to align the long-term interests of the
management to those of the shareholders. The compensation committee will be
willing to boost performance sensitive pay to reward employees. This could
consequently result in EM if management desires higher pay but actual performance
is not on par. However, the subsequent monitoring will be borne by the AC.
Audit Committee
The purpose of AC formation is to oversee the financial reporting and auditing
process of a firm. Vance (1983) identifies the following seven general functions of
an AC.
1. “Be responsible for the nomination and appointment, subject to
stockholder approval, of independent accountants and auditors.
2. Select the outside auditors and set the range of audit and non-audit fees.
3. Approve each professional service provided by the outside auditors before
such services are performed and monitor the independent auditing.
4. Review management responses to important internal control
recommendations by both independent accountants and internal auditors.
5. Review the annual financial statements and, when feasible, other financial
reports before issuance.

35
6. Assist the full board in better comprehension of the company’s
accounting policies, internal controls, financial reporting practices, and
business ethics policies.
7. Maintain clear and comprehensive lines of communication between the
directors and the independent accountants, internal auditors, and financial
managements”.
Wild (1996) explains that AC formation enhances earnings quality. Additionally,
Chtourou et al. (2001) explain that independence is an essential quality for AC
effectiveness. It is preferred that the AC is entirely composed of non-executive
directors (McMullen and Raghunandan 1996). Klein (2002) presents a non-linear
negative relationship between AC independence and earnings manipulation.
However, Chtourou et al. (2001) explain that non-executive members do not imply
AC independence. Some non-executive members may be affiliated with client firms
and some may be managers4 in another firm. As a result, independence of the AC
would be impaired and they would be less likely to be effective monitors. Klein
(2002) provides evidence that at least one large (holding at least 5% shares) outside
director on the AC contributes to curb EM. Furthermore, Dhaliwal et al. (2006) uses
AC size and meetings as two other vital variables which contributes to its
effectiveness. More members on an AC imply more resources (Anderson et al. 2004)
and quality discussions (DeZoort and Salterio 2001). Menon and Williams (1994)
state that greater AC meetings imply that greater effort was exerted to monitor the
management. Chtourou et al. (2001) add that AC effectiveness is dependent on
committee activity which is measured as the number of meetings held in a year and
the presence of a formal mandate establishing the committee’s responsibilities. The
presence of at least one financially expert member, a formal mandate and only
independent members who meet more than twice in a year, are negatively associated
with EM (Chtourou et al. 2001). Dhaliwal et al. (2006) decompose AC into members
having accounting, finance and supervisory expertise and suggest that accounting
expertise is vital for effective ACs. Peasnell et al. (2005) and Davidson et al. (2005)
find no evidence to support that the presence of AC directly affects earnings
4 Mace (1986), Lorsch and Maclver (1989) and Westphal and Zajac (1997) state that directors who are managers in another firm are less likely to criticize the firm’s management.
36
manipulation. However, Davidson et al. (2005) provides results that AC
independence constrain EM.
Chtourou et al. (2001) explain that it is vital for AC members to be financially
literate to be competent in overseeing the internal control and financial reporting
process. The Blue Ribbon Committee (1999, 25) Report provides a similar
recommendation. McMullen and Raghunandan (1996) explain that firms subject to
securities exchange commission’s (SEC) enforcement actions are less likely to have
CPAs on their AC. Likewise, DeZoort and Salterio (2001) find that AC is likely to
support the auditor in auditor-corporate management dispute if its members have
accounting experience and auditing knowledge. Similarly, Chtourou et al. (2001)
find that AC with at least a member having financial expertise is negatively
associated with EM. Moreover, Dhaliwal et al. (2006) decompose AC financial
expertise into accounting, finance and supervisory expertise and provide evidence
that indicates a significant positive relation between accounting expertise in ACs and
accruals quality.
Risk Management Committee
Risk is part of business and directors need to realize and take responsibility of the
company’s internal control system to ensure that it is operating efficiently.
Companies are exposed to interest rate, currency, business and other risks as well.
Therefore, Mallin (2010) states that a risk management committee should
comprehend the risks involved. The committee should possess high level of financial
expertise to manage risks. Yatim (2009) explains the importance of risk management
committee and provides evidence that its establishment is related to good CG. The
paper demonstrates that the establishment of a risk management committee is
associated with strong board structures. Other good CG attributes also leads to the
establishment of risk management committee to minimize financial, operational and
reputational risks. Companies not having a risk management committee usually
incorporate this responsibility as part of the AC responsibility (Mallin 2010).
37
The recent global financial crisis of 2008-2009 highlighted weak risk management as
a determinant of the crisis. Kirkpatrick (2009) explains this in relation to CG failures
and weaknesses. The paper “concludes that the financial crisis can be an important
extent attributed to failures and weaknesses in corporate governance arrangements
which did not serve their purpose to safeguard against excessive risk taking in a
number of financial services companies”.
Public Policy Committee
Public Policy Committee provides guidance to management on major public issues
and policies and simultaneously monitors the corporation’s responsibility on these
issues. It also reviews and recommends on “trends in the political and social
environment, as they may affect the operations of the corporation” (Vance 1983).
Moreover, Vance (1983) states that it considers general policies regarding
educational and charitable organizations.
Ownership Structure
The ownership structure (dispersed versus concentrated) of a firm determines the
level of alignment of shareholders’ and managers’ interests. Accordingly, the
ownership structure determines the nature of agency problems that exist in a firm
(ADB 2000). When the ownership structure is dispersed, there is an agency problem
between the incumbent shareholders and the managers. On the other hand, in
ownership concentrated firms, the agency problem is between the majority and the
minority shareholder groups.
In order to minimize shareholder – manager agency problem, shareholders need to
monitor the management. In the US and the UK where ownership is dispersed, the
inadequacy of shareholder monitoring is due to the free rider problem (ADB 2000).
The BOD plays a vital role of monitoring in firms having dispersed ownership.
38
Conversely, SC is common in Continental Europe and East Asian countries. In
shareholder concentrated firms, the majority shareholders play more active role in
monitoring and disciplining managers (Clay 2000; Yu 2006). Thus, high level of SC
minimizes shareholder – manager agency problems. However, minority
shareholders’ investments are at risk as controlling shareholders would extract
private benefits of control (ADB 2000).
The nature of agency problem changes due to changes in ownership structure.
Fleming (2003) provides evidence that the ownership by households/persons has
decreased from 75.6% to 22.8% and the ownership by financial institutions has
increased from 8.9% to 34.8% from 1952 to 1995 in Australia. The analysis portrays
that the change in the nature of ownership structure is growing in line with
corporations financing needs and as a result changes in corporate governance policies
are necessary.
2.5.2.1 Shareholder Concentration
The distribution of powers between managers and shareholders depends on the
degree of ownership concentration. Institutions holding large amount of stock are
interested in long term performance of the business and they act as good monitors
(Bushee 1998). Institutional blockholders are institutions holding a large amount of
stock (Cheng and Reitenga 2009). Cheng and Reitenga (2009) explain the
characteristics of institutional shareholders as institutional non-blockholders and
institutional blockholders, who can be either active or passive. Active blockholders
are good monitors over management and hence they constrain earnings management
(Cheng and Reitenga 2009).
Even though the controlling power held by the concentrated shareholders is useful
for monitoring the management, it could be misused to expropriate resources from
minority shareholders. The majority-minority shareholder agency problem is
expected because the controlling owners will not be disciplined by either the
39
management or the minority shareholders. It is important to investigate whether the
monitoring role or tunneling is more prevalent for concentrated shareholders of listed
companies in emerging economies. Liu and Lu (2007) explain that most management
actions are performed specifically for the benefit of the largest shareholders.
Therefore, management is anticipated to serve the best interests of the concentrated
shareholders - either to achieve long term performance and growth or to maximize
current returns.
From financial management perspective, individuals would mostly prefer current
income as opposed to future income due to the following reasons. First, future
income is never certain and is dependent on many unforeseen circumstances. Second,
receipts of earlier funds could be invested to increase its value. Third, the purchasing
power of money will decline in the future so it is more beneficial to utilize it in
current consumption than future consumption. Thus, like any individual, the largest
shareholder is expected to be more interested in current returns.
Moreover, managers have incentives to meet targets and therefore they use DAC to
smoothen the gap between pre–managed earnings and targeted earnings (DeFond and
Park 1997; Gaver et al. 1995; Subramanyam 1996). Incentives motivate
management’s choice of accounting. Shareholders can opt to support the
management for income-increasing earnings management if it would benefit them.
On the other hand, in order to reduce political costs, shareholders can opt to support
management for income-decreasing earnings management.
We expect shareholders to have incentives at all times, either to support income
increasing or income decreasing earnings management. Highly concentrated
shareholders have controlling power, therefore, influencing decision outcomes
pertaining to either income increasing or decreasing earnings management. This
discussion leads to the hypothesis (stated in the alternative form):
40
Hypothesis 1. There is a positive relationship between shareholder concentration and
earnings management5.
2.5.2.2 Shareholder Concentration and Board Size
High levels of SC as discussed earlier leads to more earnings management. The
majority shareholders alone would not be able to constrain the instances of earnings
management as they could also be self-interested and expropriate resources if private
gains exceed costs. Even though SC provides more monitoring over the management,
large abnormal accruals exist due to majority-minority shareholder agency problem.
This is due to the entrenchment effect6 discussed in Ding et al. (2007) and Fan and
Wong (2002). Moreover, Wang (2004) states that majority-minority shareholder
agency problem is severe when external governance mechanisms are weak. Thus, in
such business environments, maximizing the benefits of internal corporate
governance mechanisms would be more beneficial.
The BOD has various responsibilities and serves as an internal corporate governance
mechanism to oversee the management and ensure maximum shareholder wealth.
The number of directors on the board and board independence are important board
characteristics which ensure efficient and effective board deliberations and
monitoring. Literature documents mixed evidence on the association between board
size and effective monitoring. On one hand, few studies argue that small boards are
more effective monitors (Goodstein et al. 1994; Jensen 1993; Rahman and Ali 2006;
Yermack 1996) since they are more focused in solving any issues that arise. On the
other hand, Zahra and Pearce (1989) find larger boards as better monitors since they
have better environmental links and more expertise (Dalton et al. 1999). In support,
Chtourou et al. (2001), Cornett et al. (2008), Peasnell et al. (2005) and Xie et al.
(2003) provide evidence that board size is negatively associated with the levels of
earnings management.
5 The natural logarithm of the absolute value of discretionary accruals computed using the PMDA model is used to measure earnings management in this study. 6 The entrenched majority shareholders are able to pursue their self-interest at the expense of the minority shareholders.

41
When SC is high, the board is dominated by the majority shareholders and therefore
the majority shareholders are able to influence the board decisions. This is highly
likely in smaller boards than in larger boards. When board size is large, wider
representation of directors is possible, hence constraining the influence on board
decisions of majority shareholders.
Wider representation of directors implies greater board independence. Prior research
provides evidence on the relationship between independent boards and earnings
management (Davidson et al. 2005; Klein 2002; Bar-Yosef and Prencipe 2009;
Randøy and Jenssen 2004). In high shareholder concentrated firms, the board would
be considered independent if majority of the directors are non-investor directors.
Section 6.36 of the SPSE Listing Rule states that “at least one third of the directors
must be independent” (SPSE 2010). Company specific rules provide guidance on the
board composition of the company. For instance, Amalgamated Telecommunication
Holdings Limited (ATH) has provisions for board composition of four strategic
investor directors, seven non-executive directors and three Fiji directors (ATH 2010).
A pre-analysis of board independence for the SPSE listed companies in 2010
indicates that, on average, 46 percent of the board members are non-investor
directors. In 2010, 50 percent of the SPSE companies had less than 50 percent of
majority shareholder representatives on the board. Hence, the non-investor directors
being majority on the board could possibly collaborate to ensure that the investor
directors are not pressing for self-interest decisions. Due to data unavailability for
other years, the proportion of non-investor directors on the board is not used in this
study. Instead, the board size is used as a proxy with the assumption of wide board
representatives.
To the extent that large boards show mixed results as effective monitors, large boards
in a highly concentrated firm are more likely to have proportionate representation by
the executive and non-executive directors to investor directors (the majority
shareholders). The non-investor directors would be able to ensure that the board
42
decisions are not disadvantage to any shareholder group. The highly concentrated
shareholders (investor directors) would be able to ensure that shareholder-manager
agency problem is minimal as they would be able to monitor the management.
Hence, large boards would mitigate the influence of highly concentrated shareholders
on earnings management. This discussion leads to the hypothesis (stated in the
alternative form):
Hypothesis 2. The degree of interaction between the level of shareholder
concentration and board size has a negative relationship with the instances of
earnings management.
2.6 Conclusion This chapter has discussed the extant literature on EM and CG. CG is a major
constraint on EM. Relating the theories to emerging economies, this chapter in the
earlier section presents two hypotheses which are tested in this thesis. Chapter Three
which is on research design discusses techniques of data collection and analysis to
test the hypotheses.
43
CHAPTER 3 RESEARCH DESIGN
3.1 Introduction Research hypotheses have been developed in chapter two. This chapter discusses the
research design which is used to conduct this study. First, it elaborates on the
research methods used for data collection and analysis. Second, a sample description
used in this study is provided. Third, Section 3.4.1 provides a discussion on the
accruals models used in prior literature. This is followed by a discussion on the
measurement of each variable used in the regression model developed to test the
hypotheses for this study.
3.2 Research Methods Theories and hypotheses developed need to be tested with data to validate the
research. Also, research is useful when it produces knowledge. This is mostly
impossible without a research method. Research method includes techniques for
collecting, analyzing and interpreting data. All research heavily relies on the methods
which are used to test hypotheses or answer research questions. Research methods
based on the theoretical underpinning provide a link between the research objectives
and research findings. This is vital as it contributes to the validity of the research.
This research thesis employs two major research methods. First, a quantitative
analysis of financial data is conducted. The natural logarithm of the absolute value of
discretionary accrual (LnADAC) is regressed on SC and an interaction of SC with
board size including some control variables. DAC is computed using the
Performance – Matched Discretionary Accruals (PMDA) model and it is transformed
to LnADAC by, first, computing its absolute value since the focus of this study is not
on directional EM (see Becker et al. 1998; Klein 2002) and, second, transforming
using natural logarithm. The absolute value of DAC is transformed to LnADAC due
to the expected abnormal distribution of its data series caused by computing the
absolute value. LnADAC which is a proxy for EM is computed separately for each

44
company using time series data of the company. Second, a qualitative analysis is
performed using a questionnaire survey to complement the quantitative results.
Descriptive statistics of most qualitative data collected is computed for the discussion
of the results. Next, the sample used in this thesis is described.
3.3 Sample Description Our preliminary sample comprised of all the 16 SPSE listed companies. These
companies mostly operate in the following industries – telecommunication,
investment, manufacturing, retailing and service. All these companies are
characterized as highly shareholder concentrated where, on average, the largest
shareholder held 52 percent of the shares in 2010. Table 3.1 provides a brief
description on the percent of shares held by the largest shareholder of each SPSE
listed company.
Financial information and information pertaining to BOD were obtained from
disclosures made in annual reports. Annual reports from 1986 to 2010 were gathered
forming an unbalanced panel due to missing reports of few firms. This resulted in an
initial sample of 186 data points. Using the 186 data years, we first compute DAC
and remove a number of outliers, resulting in the final sample of 151 panel data.
Even though the final sample of 151 panel data from 16 SPSE companies is a small
sample, it is not too small when compared to the Jones (1991) study which used 23
firms panel to investigate EM during import relief investigations.
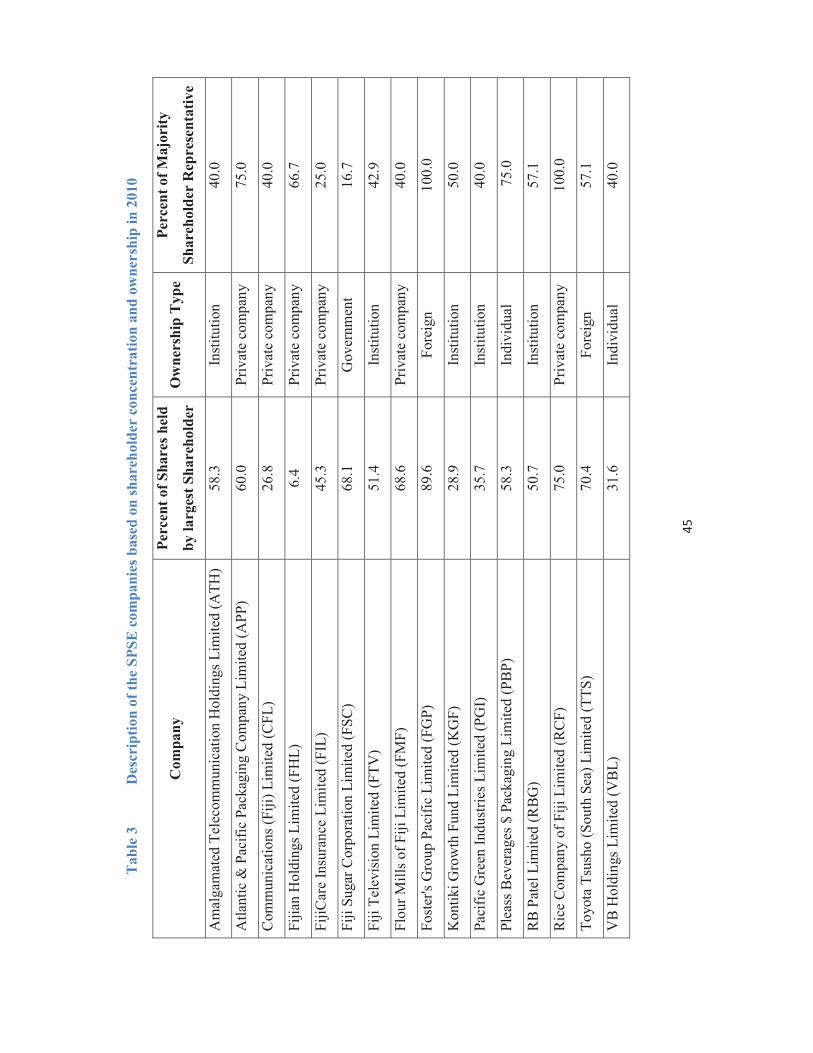
45
Tab
le 3
D
escr
iptio
n of
the
SPSE
com
pani
es b
ased
on
shar
ehol
der
conc
entr
atio
n an
d ow
ners
hip
in 2
010
Com
pany
Pe
rcen
t of S
hare
s hel
d
by la
rges
t Sha
reho
lder
O
wne
rshi
p T
ype
Perc
ent o
f Maj
ority
Shar
ehol
der
Rep
rese
ntat
ive
Am
alga
mat
ed T
elec
omm
unic
atio
n H
oldi
ngs L
imite
d (A
TH)
58.3
In
stitu
tion
40.0
Atla
ntic
& P
acifi
c Pa
ckag
ing
Com
pany
Lim
ited
(APP
) 60
.0
Priv
ate
com
pany
75
.0
Com
mun
icat
ions
(Fiji
) Lim
ited
(CFL
) 26
.8
Priv
ate
com
pany
40
.0
Fijia
n H
oldi
ngs L
imite
d (F
HL)
6.
4 Pr
ivat
e co
mpa
ny
66.7
FijiC
are
Insu
ranc
e Li
mite
d (F
IL)
45.3
Pr
ivat
e co
mpa
ny
25.0
Fiji
Suga
r Cor
pora
tion
Lim
ited
(FSC
) 68
.1
Gov
ernm
ent
16.7
Fiji
Tele
visi
on L
imite
d (F
TV)
51.4
In
stitu
tion
42.9
Flou
r Mill
s of F
iji L
imite
d (F
MF)
68
.6
Priv
ate
com
pany
40
.0
Fost
er's
Gro
up P
acifi
c Li
mite
d (F
GP)
89
.6
Fore
ign
100.
0
Kon
tiki G
row
th F
und
Lim
ited
(KG
F)
28.9
In
stitu
tion
50.0
Paci
fic G
reen
Indu
strie
s Lim
ited
(PG
I)
35.7
In
stitu
tion
40.0
Plea
ss B
ever
ages
$ P
acka
ging
Lim
ited
(PB
P)
58.3
In
divi
dual
7
5.0
RB
Pat
el L
imite
d (R
BG
) 50
.7
Inst
itutio
n 57
.1
Ric
e C
ompa
ny o
f Fiji
Lim
ited
(RC
F)
75.0
Pr
ivat
e co
mpa
ny
100.
0
Toyo
ta T
sush
o (S
outh
Sea
) Lim
ited
(TTS
) 70
.4
Fore
ign
57.1
VB
Hol
ding
s Lim
ited
(VB
L)
31.6
In
divi
dual
40
.0
46
3.4 Measuring Earnings Management EM cannot be directly observed in an organization, hence it requires proxy
measurement. Empirical models and a qualitative approach have been used to
measure EM in prior research (Singh 2007). Mulford and Comiskey (2004) explain
the qualitative approach which is used in Singh (2007) thesis to measure EM in two
SOEs in Fiji. Singh (2007) justifies the choice of the qualitative approach based on
its applicability to Fiji’s environment and not the merits and de-merits. Singh (2007)
explains that “the lack of quality and consistent data for Fiji does not permit a
reliable statistically based study” in Fiji. Singh (2007) further states that the use of
the cross-sectional models is difficult due to unavailability of similar entities to form
groups, such as entities in the same industry.
However, recent developments in statistical software and sampling techniques make
it possible to do empirical analysis using panel data. Panel data is a matrix form data
where cross-sections and time-series data are integrated. The panel can be formed
from either a balanced sample where each cross-section has the same number of data
years or an unbalanced sample where the number of data years would differ for each
cross-section.
This study investigates the research phenomena using the SPSE companies. Most
listings on the SPSE have been recent but some entities have been listed for at least a
decade. Hence, the data gathered for these corporations form an unbalanced panel.
This study uses EVIEWS to statistically measure EM proxy using an empirical
model.
3.4.1 Earnings Management – Empirical Models
EM is measured using either a “portfolio approach” or a “representative approach”
(McNichols and Wilson 1988). According to the portfolio approach, researchers
examine “a proxy for the sum of all accruals’ discretionary components” (McNichols
and Wilson 1988). However, following the representative approach, one would
47
examine “a proxy for a single accrual’s discretionary component” (McNichols and
Wilson 1988).
McNichols and Wilson (1988) use the provision for bad debts to provide evidence of
EM for income smoothing and/or bonus maximizing purposes. The discretionary
component of the provision for bad debts is used as the proxy for EM and is
measured as “the difference between the reported provision and the measurement
specified by GAAP”. Other specific accruals include deferred tax flows, increase in
inventories, increase in receivables, unexpected earnings and a variant of TA
(McNichols and Wilson 1988).
Marquardt and Wiedman (2004) also examine specific accruals in three EM contexts,
equity offering, management buyouts and avoiding earnings decreases. The paper
argues that the costs of EM vary depending on the specific accrual used and the
benefits depend on the EM context. Hence, it makes “differential predictions
regarding which specific accrual will be used to manage earnings in each of the three
contexts” (Marquardt and Wiedman 2004). The paper highlights that accounts
receivable is the preferred accrual for firms issuing equity and also in management
buyout context where unexpected accounts receivable is negative. However, firms
avoiding earnings decreases is more likely to use more transitory and less costly
approach, such as the use of special items (non-recurring income statement items)
(Marquardt and Wiedman 2004).
Even though the focus on specific accruals permits more precise modeling, large
portion of managed accruals are not captured in the model (Kang and
Sivaramakrishnan 1995). This problem is minimized by using TA instead of specific
accruals. Several studies have modeled TA.

48
Healy (1985) uses mean TA to measure EM for bonus maximizing hypothesis. The
paper presents three cases with different EM predictions. The partitioning variable is
used to divide the sample into three groups. EM is investigated through a pair-wise
comparison of mean TA across the EM partitioning variable. The mean TA is
computed as TA scaled by lagged total assets divided by the number of estimation
years. Healy (1985) estimates TA as “the difference between reported accounting
earnings and cash flows from operations”. Kaplan (1985) criticizes Healy’s
definition of DAC which is the changes in working capital plus depreciation. Kaplan
(1985) argues that there are examples of DAC, for instance “accelerating or delaying
the delivery of inventory at the end of the fiscal year”, that may not affect earnings
but cash flows. Moreover, Healy (1985) assumes expected TA to be zero. However,
Kaplan (1985) and Dechow et al. (1995) state that the changes to working capital
depends on the economic circumstances of the firm. Thus, expected accruals need to
be measured using expected levels for current year rather than actual values of prior
year. Similarly, Kaplan (1985) identifies that the total depreciation is not
discretionary. A great proportion of depreciation which arises from fixed assets
acquired in prior years is predictable.
Furthermore, DeAngelo (1986) explains that TA is a poor proxy if non-discretionary
accruals (NDAC) are relatively large. Mostly NDAC is relatively large and
negative7. Hence TA is expected to be negative even in the absence of EM. The use
of TA in such cases would wrongly imply income-decreasing EM (DeAngelo 1986).
Despite recognizing TA as a poor proxy, DeAngelo (1986) uses lagged TA as a
proxy for NDAC8. Dechow et al. (1995) argue that the Healy and DeAngelo models
will measure DAC with error if NDAC change from period to period.
Dechow and Sloan (1991) relax the above stated assumption (that NDAC is constant
over time) and introduce an accruals model9 which “assumes that variation in the
7 This is due to large depreciation charge and a significant portion is part of NDAC (DeAngelo 1986). 8 NDACt = TAt-1 (Dechow et al. 1995). 9 NDACt = λ1 + λ2median1(TAt) where median1(TAt) is “the median value of TA scaled by lagged assets for all non-sample firms” (Dechow et al. 1995).

49
determinants of nondiscretionary accruals are common across firms in the same
industry” (Dechow et al. 1995). Although this model removes the variation in NDAC
which are common across the firms in the same industry, it does not eliminate the
effect of other changes in economic circumstances. This issue is addressed in Jones
(1991). Another limitation of the Industry model is that it removes changes in DAC
that is “correlated across firms in the same industry” (Dechow et al. 1995).
Jones (1991) presents another model which also relaxes the assumption that NDAC
is constant over time. Since the economic circumstances of a firm changes, NDAC is
also expected to change over time. Thus it is vital to control for the changes in the
economic circumstances, which Jones (1991) does by including “gross property,
plant and equipment and change in revenues” in the accruals model. The Jones
model is presented below:
where,
TAit = total accruals for firm i in year t,
Ait-1 = net total assets for firm i in year t-1,
ΔREVit = change in revenue for firm i from year t-1 to year t,
PPEit = gross property plant and equipment for firm i in year t,
εit = error term for firm i in year t.
Dechow et al. (1995) identify an implicit assumption in the Jones model that
revenues are non-discretionary. Revenue includes credit sales where managers could
exercise their discretions. In order to minimize the estimate of EM biasness, Dechow
et al. (1995) adjust the change in revenue for change in receivables. The modified
Jones model (MJM) is presented below:
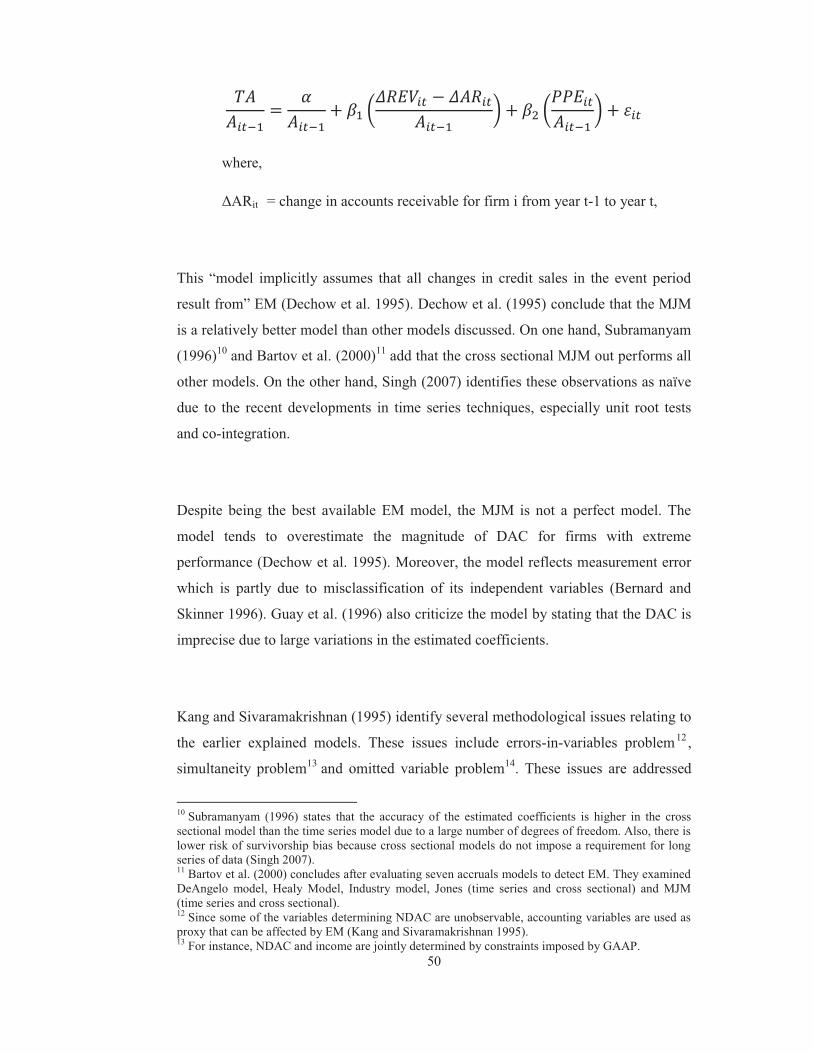
50
where,
ΔARit = change in accounts receivable for firm i from year t-1 to year t,
This “model implicitly assumes that all changes in credit sales in the event period
result from” EM (Dechow et al. 1995). Dechow et al. (1995) conclude that the MJM
is a relatively better model than other models discussed. On one hand, Subramanyam
(1996)10 and Bartov et al. (2000)11 add that the cross sectional MJM out performs all
other models. On the other hand, Singh (2007) identifies these observations as naïve
due to the recent developments in time series techniques, especially unit root tests
and co-integration.
Despite being the best available EM model, the MJM is not a perfect model. The
model tends to overestimate the magnitude of DAC for firms with extreme
performance (Dechow et al. 1995). Moreover, the model reflects measurement error
which is partly due to misclassification of its independent variables (Bernard and
Skinner 1996). Guay et al. (1996) also criticize the model by stating that the DAC is
imprecise due to large variations in the estimated coefficients.
Kang and Sivaramakrishnan (1995) identify several methodological issues relating to
the earlier explained models. These issues include errors-in-variables problem12,
simultaneity problem13 and omitted variable problem14. These issues are addressed
10 Subramanyam (1996) states that the accuracy of the estimated coefficients is higher in the cross sectional model than the time series model due to a large number of degrees of freedom. Also, there is lower risk of survivorship bias because cross sectional models do not impose a requirement for long series of data (Singh 2007). 11 Bartov et al. (2000) concludes after evaluating seven accruals models to detect EM. They examined DeAngelo model, Healy Model, Industry model, Jones (time series and cross sectional) and MJM (time series and cross sectional). 12 Since some of the variables determining NDAC are unobservable, accounting variables are used as proxy that can be affected by EM (Kang and Sivaramakrishnan 1995). 13 For instance, NDAC and income are jointly determined by constraints imposed by GAAP.
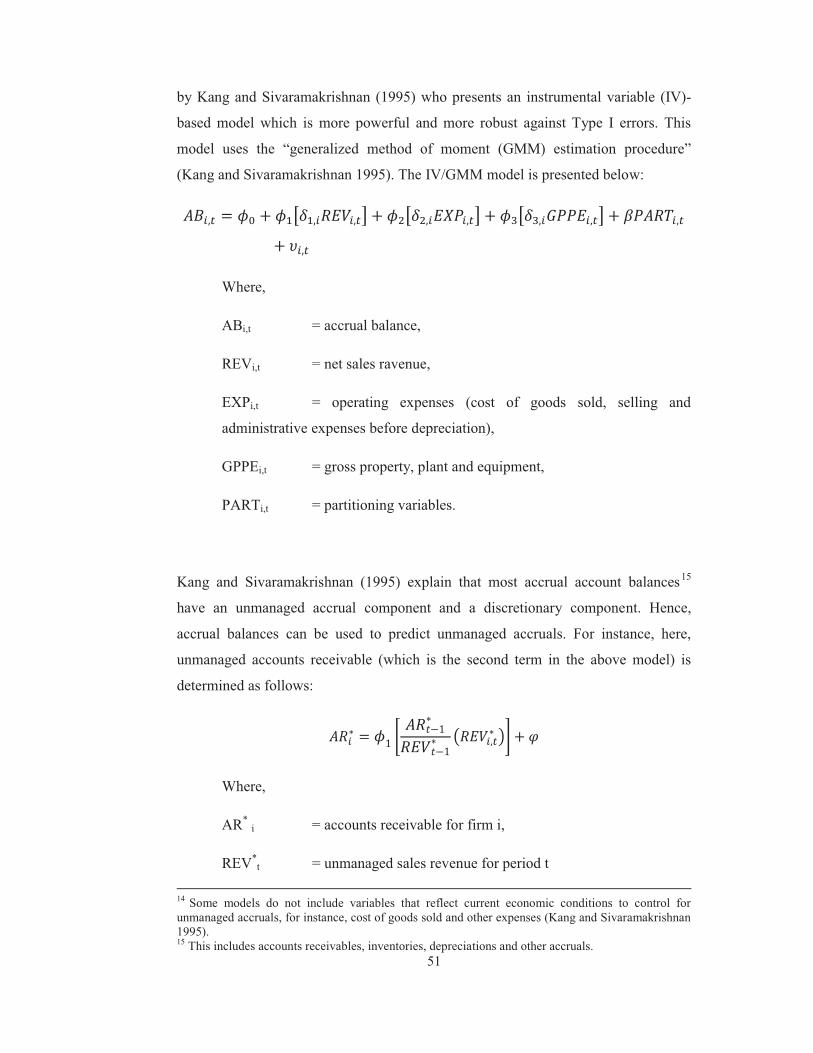
51
by Kang and Sivaramakrishnan (1995) who presents an instrumental variable (IV)-
based model which is more powerful and more robust against Type I errors. This
model uses the “generalized method of moment (GMM) estimation procedure”
(Kang and Sivaramakrishnan 1995). The IV/GMM model is presented below:
Where,
ABi,t = accrual balance,
REVi,t = net sales ravenue,
EXPi,t = operating expenses (cost of goods sold, selling and
administrative expenses before depreciation),
GPPEi,t = gross property, plant and equipment,
PARTi,t = partitioning variables.
Kang and Sivaramakrishnan (1995) explain that most accrual account balances15
have an unmanaged accrual component and a discretionary component. Hence,
accrual balances can be used to predict unmanaged accruals. For instance, here,
unmanaged accounts receivable (which is the second term in the above model) is
determined as follows:
Where,
AR* i = accounts receivable for firm i,
REV*t = unmanaged sales revenue for period t
14 Some models do not include variables that reflect current economic conditions to control for unmanaged accruals, for instance, cost of goods sold and other expenses (Kang and Sivaramakrishnan 1995). 15 This includes accounts receivables, inventories, depreciations and other accruals.
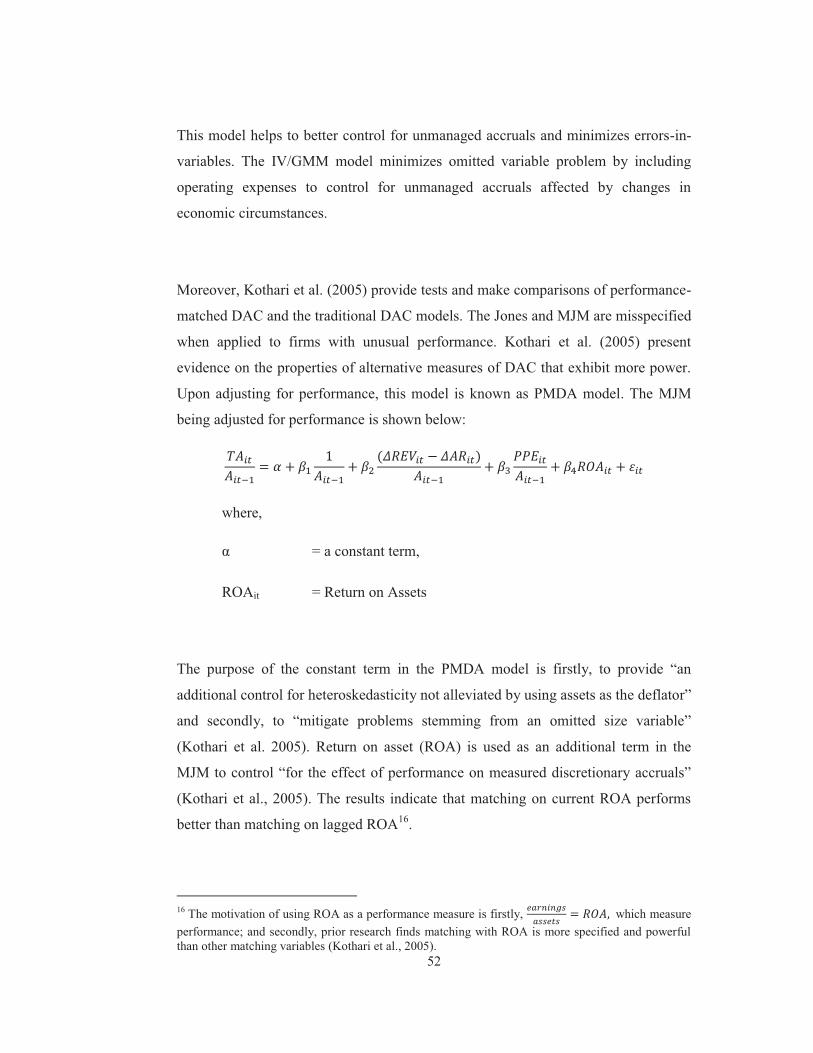
52
This model helps to better control for unmanaged accruals and minimizes errors-in-
variables. The IV/GMM model minimizes omitted variable problem by including
operating expenses to control for unmanaged accruals affected by changes in
economic circumstances.
Moreover, Kothari et al. (2005) provide tests and make comparisons of performance-
matched DAC and the traditional DAC models. The Jones and MJM are misspecified
when applied to firms with unusual performance. Kothari et al. (2005) present
evidence on the properties of alternative measures of DAC that exhibit more power.
Upon adjusting for performance, this model is known as PMDA model. The MJM
being adjusted for performance is shown below:
where,
α = a constant term,
ROAit = Return on Assets
The purpose of the constant term in the PMDA model is firstly, to provide “an
additional control for heteroskedasticity not alleviated by using assets as the deflator”
and secondly, to “mitigate problems stemming from an omitted size variable”
(Kothari et al. 2005). Return on asset (ROA) is used as an additional term in the
MJM to control “for the effect of performance on measured discretionary accruals”
(Kothari et al., 2005). The results indicate that matching on current ROA performs
better than matching on lagged ROA16.
16 The motivation of using ROA as a performance measure is firstly, which measure performance; and secondly, prior research finds matching with ROA is more specified and powerful than other matching variables (Kothari et al., 2005).

53
This research thesis uses PMDA model as stated above for the analysis and
computation of DAC. The choice of the PMDA model is based on its merits and de-
merits of the traditional EM models. Kothari et al. (2005) concludes that the PMDA
model provides a more powerful test for EM. Kothari et al. (2005) indicate that the
Jones and MJM are “the most popular choices for estimating discretionary accruals
even though previous research shows that (they) are severely misspecified when
applied to stratified-random samples of firms”. Kothari et al. (2005) present the
limitations inherent in the two popular models and provide evidence that the
“performance-matched discretionary accrual model is useful in mitigating type I
errors”.
The focus when detecting EM is on the residual representing DAC which is used by
the management to cook the books. The other components are equally important as
they are used to determine the magnitude and directions of DAC, or EM. DAC is the
error term in the PMDA model and is calculated as follows:
Where,
TA* = predicted Total Accruals
There are two approaches to observe TA. One is known as the Income Statement
approach while the other is the Balance Sheet Approach. The calculation for the two
approaches is as shown below:
Income Statement approach;
TA = Net Income before extra-ordinary items – cash flows from operations,
Balance Sheet approach;
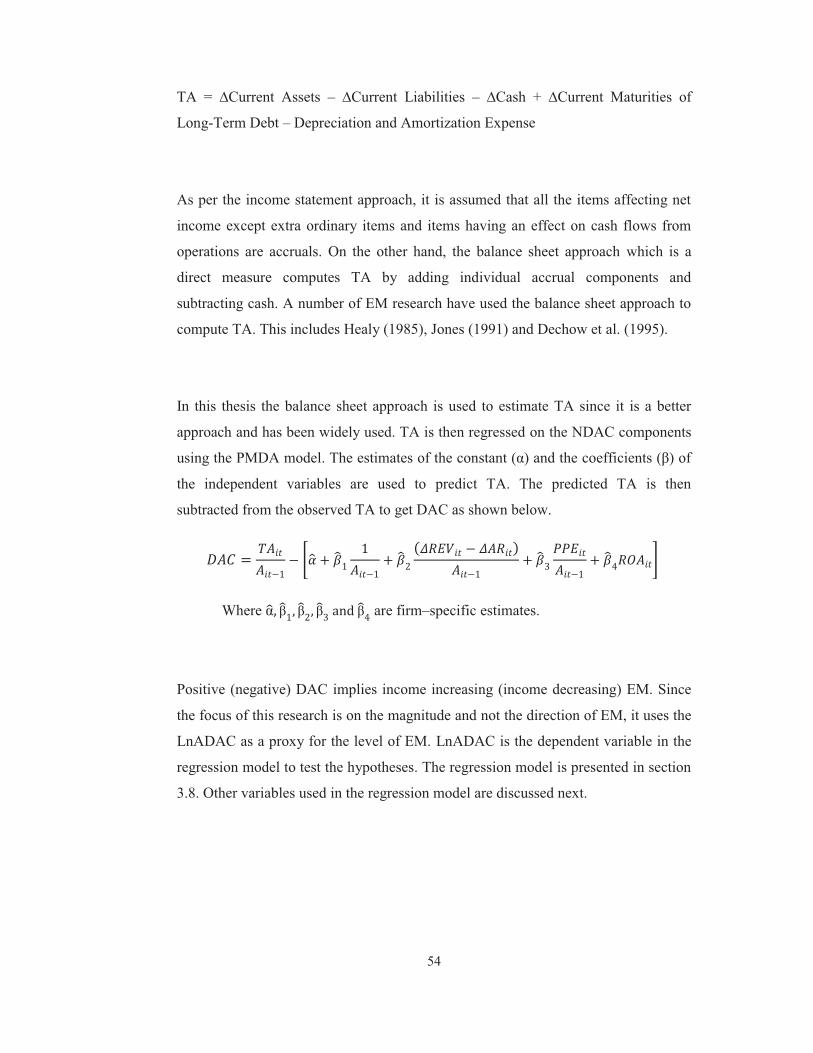
54
TA = ∆Current Assets – ∆Current Liabilities – ∆Cash + ∆Current Maturities of
Long-Term Debt – Depreciation and Amortization Expense
As per the income statement approach, it is assumed that all the items affecting net
income except extra ordinary items and items having an effect on cash flows from
operations are accruals. On the other hand, the balance sheet approach which is a
direct measure computes TA by adding individual accrual components and
subtracting cash. A number of EM research have used the balance sheet approach to
compute TA. This includes Healy (1985), Jones (1991) and Dechow et al. (1995).
In this thesis the balance sheet approach is used to estimate TA since it is a better
approach and has been widely used. TA is then regressed on the NDAC components
using the PMDA model. The estimates of the constant (α) and the coefficients (β) of
the independent variables are used to predict TA. The predicted TA is then
subtracted from the observed TA to get DAC as shown below.
Where α β β β β are firm–specific estimates.
Positive (negative) DAC implies income increasing (income decreasing) EM. Since
the focus of this research is on the magnitude and not the direction of EM, it uses the
LnADAC as a proxy for the level of EM. LnADAC is the dependent variable in the
regression model to test the hypotheses. The regression model is presented in section
3.8. Other variables used in the regression model are discussed next.
55
3.5 Independent Variable
3.5.1 Measure of Shareholder Concentration
There are several ways to measure SC. Cheng and Reitenga (2009) have used
blockholders who hold more than 5% of the shares in the company. Lehmann and
Weigand (2000), and Firth et al. (2002), use herfindahl type index that measures SC
as the sum of the squared individual percentage stakes in the company. Yu (2006)
has used a discrete measure by including the presence of a large shareholder. Similar
to Ding et al. (2007), Liu and Lu (2007) and Marra et al. (2011), we measure SC as
the percentage of shares held by the largest shareholder due to two reasons. First, in
most cases the largest shareholder holds a significant proportion of the shares of the
sample companies (see table 3.1). Second, the largest shareholder of most sample
companies has motivations for tunneling as they have significant stakes in other
related companies.
3.5.2 Measure of Board Size
This study uses the natural logarithm of the number of directors on the board as the
measure of board size following Cornett et al. (2008). The number of directors is
transformed using natural logarithm in this study due to (1) the small sample size,
and (2) to improve the interpretability. Data transformation also generates the new
data series which has a more normal distribution.
3.6 Control Variables Prior CG and EM studies have provided evidence on various constraints and
determinants of EM. These have been discussed in Chapter 2. In order to have a
powerful analysis of the test variable, it is vital to control for all other variables
which have an impact on the dependent variable. However, due to various limitations
such as small sample size and data unavailability, it is not possible to control for all
the variables that have an impact on the dependent variable. Therefore, leverage,
audit quality, firm size and operating volatility are used as controls variables in this
study.
56
Leverage
The impact of leverage on earnings management is analyzed in prior studies which
document mixed results. Balsam et al. (2003), Becker et al. (1998), Cheng and
Reitenga (2009) and Frankel et al. (2002) find a negative association while Davidson
et al. (2005) and Ferguson et al. (2004) find a positive association between leverage
and earnings management.
Audit Fees
Frankel et al. (2002) provide evidence that AF has an inverse relationship with
earnings management. AF is a proxy for the extent of audit work. Better audit would
mean high fees and low earnings management. The natural logarithm of the total
audit fees (LnAF) paid to the auditor for external audit services is used as a control
variable in this study.
Firm Size
Firm size is a vital variable used in most accounting research. Prior studies have
found mixed results (Balsam et al. 2003; Becker et al. 1998; Davidson et al. 2005;
Klein 2002) on the relationship between earnings management and total assets. In
this research, the natural logarithm of total assets (LnTA) is used to control for the
firm size.
Standard Deviation of Cash Flows from Operations
Since this study uses LnADAC as the dependent variable, firm size may not be a
sufficient control. This is because the measurement error inherent in DAC influences
the absolute value of DAC that could lead to biased inferences. Hribar and Nichols
(2007) explore the properties of DAC and absolute value of DAC and examine the
implications of using the absolute value of DAC when testing for EM. The mean for
57
the absolute value of DAC is always positive which implies that EM will always
exist; however, this may not be true. Also, the mean of the absolute value of DAC is
a function of the standard deviation of DAC. These distributional properties
increases “the risk of incorrectly rejecting the null hypothesis” (Hribar and Nichols
2007). Moreover, the measurement error in signed DAC increases the absolute value
of DAC on average. As indicated earlier, the variance in DAC determines the
absolute value of DAC. “A significant determinant of DAC variance is the firm’s
underlying operating volatility” (Hribar and Nichols 2007). Thus, operating volatility
is taken into consideration to mitigate this problem.
There are two ways to minimize the biasness in test using unsigned measures. They
are named as the control approach and the transformation approach. Hribar and
Nichols (2007) use standard deviation of cash flows from operations ( CFO) and
standard deviation of revenue to control for operating volatility. This approach is
more practical. Initially, it is vital to test the correlation between partitioning
variables and operating volatility measure and firm size. If there is a correlation
between the partitioning variables and operating volatility measure then the test
should incorporate controls for operating volatility. Otherwise, severe biasness would
result that would affect inferences (Hribar and Nichols 2007).
For the purpose of this study, we computed the correlation17 between CFO, firm
size and the partitioning variables. Since there is a significant correlation between the
variables, we have used CFO to control for operating volatility in our regression
model.
The following table provides a summary of the variables used in the regression
models and their respective predicted signs in the regression.
17 The correlation results are discussed in chapter 4 when we discuss the results of this research.
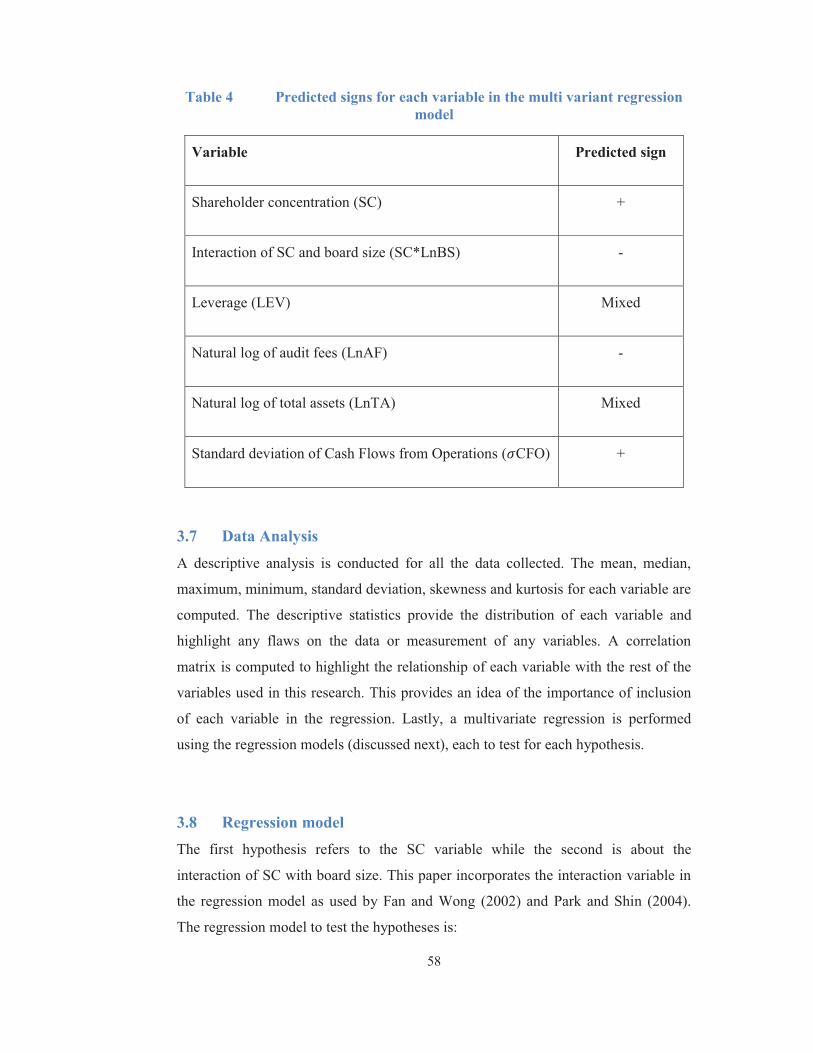
58
Table 4 Predicted signs for each variable in the multi variant regression model
Variable Predicted sign
Shareholder concentration (SC) +
Interaction of SC and board size (SC*LnBS) -
Leverage (LEV) Mixed
Natural log of audit fees (LnAF) -
Natural log of total assets (LnTA) Mixed
Standard deviation of Cash Flows from Operations ( CFO) +
3.7 Data Analysis A descriptive analysis is conducted for all the data collected. The mean, median,
maximum, minimum, standard deviation, skewness and kurtosis for each variable are
computed. The descriptive statistics provide the distribution of each variable and
highlight any flaws on the data or measurement of any variables. A correlation
matrix is computed to highlight the relationship of each variable with the rest of the
variables used in this research. This provides an idea of the importance of inclusion
of each variable in the regression. Lastly, a multivariate regression is performed
using the regression models (discussed next), each to test for each hypothesis.
3.8 Regression model The first hypothesis refers to the SC variable while the second is about the
interaction of SC with board size. This paper incorporates the interaction variable in
the regression model as used by Fan and Wong (2002) and Park and Shin (2004).
The regression model to test the hypotheses is:
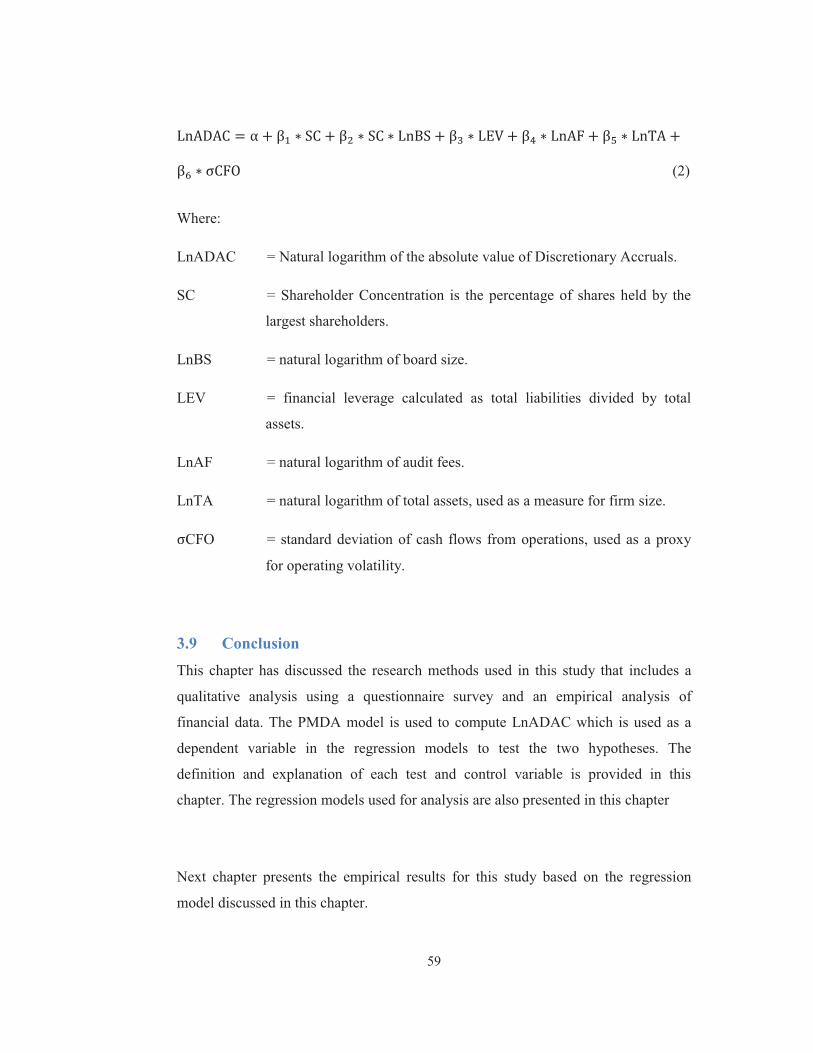
59
(2)
Where:
LnADAC = Natural logarithm of the absolute value of Discretionary Accruals.
SC = Shareholder Concentration is the percentage of shares held by the
largest shareholders.
LnBS = natural logarithm of board size.
LEV = financial leverage calculated as total liabilities divided by total
assets.
LnAF = natural logarithm of audit fees.
LnTA = natural logarithm of total assets, used as a measure for firm size.
CFO = standard deviation of cash flows from operations, used as a proxy
for operating volatility.
3.9 Conclusion This chapter has discussed the research methods used in this study that includes a
qualitative analysis using a questionnaire survey and an empirical analysis of
financial data. The PMDA model is used to compute LnADAC which is used as a
dependent variable in the regression models to test the two hypotheses. The
definition and explanation of each test and control variable is provided in this
chapter. The regression models used for analysis are also presented in this chapter
Next chapter presents the empirical results for this study based on the regression
model discussed in this chapter.
60
CHAPTER 4 SHAREHOLDER CONCENTRATION AND
EARNINGS MANAGEMENT RESULTS
4.1 Introduction The current age and business professionals in this era place more emphasis on CG.
The long term business success is highly depended on its governance. It, as
highlighted in the literature, has strong capabilities to constrain EM in any business
environment. The ability of CG to constrain EM depends on the corporate structure
and governance policies and implementations. The corporate structure and its
policies vary between countries due to numerous factors18 such as the state of the
nation.
The corporate structure of companies listed on the SPSE vastly differs from those
listed on developed stock exchanges. This is due to the high level of SC of
companies listed on the SPSE. This chapter provides the descriptive statistics,
correlation statistics of each variable used in this study and regression results based
on the regression model developed in chapter three. The descriptive statistics
highlight that shareholdings are highly concentrated in SPSE companies. Also, the
regression results indicate that there is a significant relationship between SC and EM.
Next, descriptive statistic is discussed for all the variables used in this research.
4.2 Descriptive Analysis An analysis of each variable highlights some interesting characteristics about the
variable. The descriptive analysis enables the researcher to better understand the
characteristics and behavior of each variable, including the dependent, test and
control variables. It also highlights if any variable needs to be omitted in further
analysis.
18 Identifying these factors are not part of this research.
61
Table 4.1 provides descriptive statistics for EM, SC, the interaction of SC and BS,
LEV, LnAF, CFO and LnTA of the sample companies. The LnADAC which is
computed using the PMDA model is used as a proxy for EM in the SPSE companies.
The descriptive statistics indicate that EM is common in all SPSE companies. The
mean and median LnADAC is -2.7261 and -2.7449 respectively. For further
understanding, the mean of DAC and absolute value of DAC which are computed,
are 0.0007 and 0.1351 respectively. The mean of DAC which is not equal to zero,
implies that EM is common in the sample companies. The minimum LnADAC is -
6.2102 and the maximum is -0.1535. The standard deviation is 1.3111. The
descriptive statistics indicate that EM is a concern for all companies listed on the
SPSE.
Moreover, the skewness, kurtosis and probability provide statistic about the
normality of the distribution. The skewness of -0.2892 means that the LnADAC data
series has a small left tail. Kurtosis which measures the peakedness or flatness of the
series is 2.7178. This means that the LnADAC distribution is not leptokurtic
(peaked) relative to the normal distribution. The probability of greater than 0.05
implies that LnADAC is normally distributed.
The descriptive statistic of SC indicates that on average 41 percent of the shares of
the SPSE companies are held by the largest shareholder with the median being 39
percent. The shareholding of the largest shareholder of the sample companies range
from 10 percent (the minimum) to 82 percent (the maximum). This implies that the
level of SC is very high in SPSE companies. The standard deviation of 0.2183
implies that the level of SC is within 22 percent of the mean value of SC for most
corporations (approximately 67 percent). SC is common in other developing and
emerging economies (Ding et al. 2007; Fan and Wong 2002; Wang 2004).
Further statistics indicate that the SC data is not skewed as the skewness (0.1836) is
close to zero. The SC data is flat compared to the standard normal distribution
62
because the kurtosis is 1.6938. Since the skewness is close to zero, kurtosis is close
to three and Jarque-Bera statistic is not large, it could be concluded that the SC data
series is close to a standard normal distribution.
The interaction variable (SC*LnBS) has a mean (median) of 0.7101 (0.6671) and the
standard deviation is 0.3870. The minimum is 0.1543 and the maximum is 1.6972.
The mean of the interaction variable implies that with the average level of SC, the
BS is approximately 5.65. The BS of the SPSE companies ranges from 3 to 14
directors. The average BS is 5.78. Despite the high level of SC in the sample
companies, the BS is quite low. This could be a contributor to the high level of EM
in SPSE companies. Similar to SC, the statistics of the interaction variable indicate
that it is close to standard normal distribution. The skewness is 0.6843 indicating a
small right tail and the kurtosis of 2.7452 is good since it is close to three.
LEV has a mean (median) of 0.4400 (0.4532) and a standard deviation of 0.1628.
The descriptive statistic implies that approximately 44 percent of the company’s
assets are owned by outsiders leaving a larger proportion to equity holders. The
minimum is 0.0356 and the maximum is 0.9747. This implies that for some sample
companies, equity holders have significant control in terms of shares and finance as
well. SPSE companies also portray characteristics of significant outsider control in
terms of finance. The skewness and kurtosis of 0.1553 and 3.2129 respectively
implies that the distribution is normal.
The LnAF is used as a proxy for audit quality. The mean (median) LnAF is 10.3860
(10.7058) with a maximum of 12.4723 and a minimum of 7.8240. The standard
deviation of LnAF is 1.1931. The LnAF is close to normally distributed because its
skewness and kurtosis are -0.6252 and 2.3843 respectively. The skewness and
kurtosis of LnAF are close to the standard of zero and three respectively.
63
The σ , which is used as a proxy for operating volatility has a mean (median) of
0.1377 (0.0871) and a standard deviation of 0.1211. The minimum and maximum of
the σ are 0.0286 and 0.5933 respectively. The descriptive statistics imply that the
cash flows from operations are volatile. Due to the operating volatility, some
variations in the AbsDAC are as a result of normal business operations. This is
primarily due to the large number of credit transactions. Furthermore, the σ is
not normally distributed at 1% significance level and the distribution is more peaked
given a kurtosis of 6.2621 and has a right tail (skewness is 1.9308) compared to
standard normal distribution.
The firm size is used as a control variable in most EM research. In this thesis LnTA
is used as a proxy for the firm size. The mean (median) is 17.3295 (17.2587) with the
maximum of 20.0463 and the minimum of 14.7436 and a standard deviation of
1.5476. The skewness of LnTA is 0.1613 and the kurtosis is 1.5970, both implying
that it is close to standard normal distribution.
The descriptive characteristics of the variables used in this study indicate several
aspects about the companies listed on the SPSE. In summary, most firms engage in
EM, have high level of SC, a board of approximately 6 directors, and more equity
than liability. The descriptive statistics does not provide conclusive evidence on the
hypotheses developed. However, it only provides statistics that highlights the
characteristics of each variable.

64
Tab
le 5
D
escr
iptiv
e st
atis
tics o
f the
dep
ende
nt a
nd in
depe
nden
t var
iabl
es
L
nAD
AC
SC
L
nBS
SC*L
nBS
LE
V
LnA
F C
FO
LN
TA
Mea
n -2
.726
1 0.
4148
1.
7548
0.
7101
0.
4400
10
.386
0 0.
1377
17
.329
5
Med
ian
-2.7
449
0.39
24
1.79
18
0.66
71
0.45
32
10.7
058
0.08
71
17.2
587
Max
imum
-0
.153
5 0.
8162
2.
6391
1.
6972
0.
9747
12
.472
3 0.
5933
20
.046
3
Min
imum
-6
.210
2 0.
0959
1.
0986
0.
1543
0.
0356
7.
8240
0.
0286
14
.743
6
Std.
Dev
. 1
.311
1 0.
2183
0.
3127
0.
3870
0.
1628
1.
1931
0.
1211
1.
5476
Skew
ness
-0
.289
2 0.
1836
-0
.328
1 0.
6843
0.
1553
-0
.625
2 1.
9308
0.
1613
Kur
tosi
s 2
.717
7 1.
6938
2.
6819
2.
7452
3.
2129
2.
3843
6.
2621
1.
5970
Jarq
ue-B
era
2.6
057
11.5
836
3.34
58
12.1
939
0.89
23
12.2
211
160.
7738
13
.039
8
Prob
abili
ty
0.2
717
0.00
31
0.18
77
0.00
23
0.64
01
0.00
22
0.00
00
0.00
15
Sum
-4
11.6
368
62.6
349
264.
9765
10
7.22
89
66.4
355
1568
.279
0 20
.799
0 26
16.7
460
Sum
Sq.
Dev
. 2
57.8
376
7.14
78
14.6
635
22.4
596
3.97
35
213.
5348
2.
2004
35
9.27
98
Not
es:
This
tab
le r
epor
ts t
he d
escr
iptiv
e st
atis
tics
of e
arni
ngs
man
agem
ent
mea
sure
(Ln
AD
AC
), th
e sh
areh
olde
r co
ncen
tratio
n m
easu
re (
SC),
the
natu
ral l
ogar
ithm
of b
oard
siz
e (L
nBS)
, the
inte
ract
ion
of s
hare
hold
er c
once
ntra
tion
and
boar
d si
ze (S
C*L
nBS)
, lev
erag
e (L
EV),
audi
t qua
lity
mea
sure
(L
nAF)
, ope
ratin
g vo
latil
ity m
easu
re (
CFO
) and
firm
siz
e (L
nTA
) of t
he s
ampl
e co
mpa
nies
. LnA
DA
C is
the
natu
ral l
ogar
ithm
of t
he a
bsol
ute
valu
e of
dis
cret
iona
ry a
ccru
als.
SC is
the
shar
ehol
ding
per
cent
age
of th
e la
rges
t sha
reho
lder
s. SC
*LnB
S is
the
inte
ract
ion
of s
hare
hold
er c
once
ntra
tion
and
boar
d si
ze. L
EV is
tota
l lia
bilit
ies
over
tota
l ass
ets.
LnA
F is
the
natu
ral l
ogar
ithm
of
audi
t fee
s. C
FO is
the
stan
dard
dev
iatio
n of
cas
h flo
ws
from
op
erat
ions
. LnT
A is
the
natu
ral l
ogar
ithm
of t
otal
ass
ets.
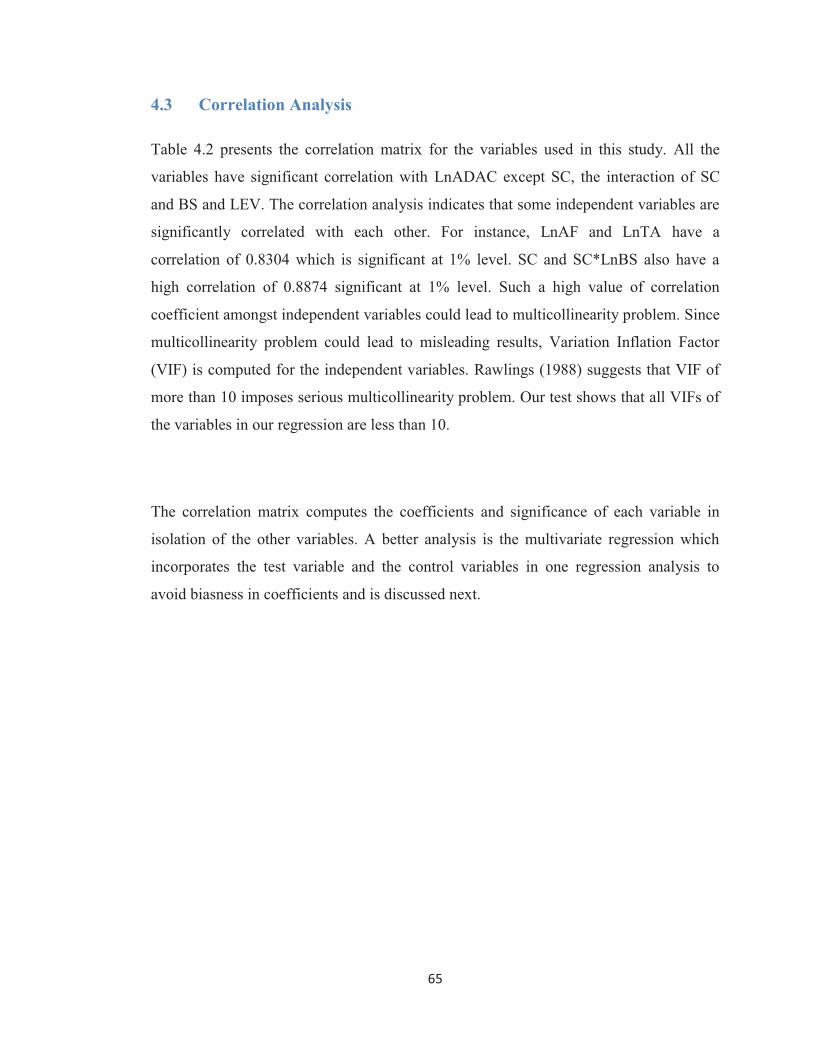
65
4.3 Correlation Analysis
Table 4.2 presents the correlation matrix for the variables used in this study. All the
variables have significant correlation with LnADAC except SC, the interaction of SC
and BS and LEV. The correlation analysis indicates that some independent variables are
significantly correlated with each other. For instance, LnAF and LnTA have a
correlation of 0.8304 which is significant at 1% level. SC and SC*LnBS also have a
high correlation of 0.8874 significant at 1% level. Such a high value of correlation
coefficient amongst independent variables could lead to multicollinearity problem. Since
multicollinearity problem could lead to misleading results, Variation Inflation Factor
(VIF) is computed for the independent variables. Rawlings (1988) suggests that VIF of
more than 10 imposes serious multicollinearity problem. Our test shows that all VIFs of
the variables in our regression are less than 10.
The correlation matrix computes the coefficients and significance of each variable in
isolation of the other variables. A better analysis is the multivariate regression which
incorporates the test variable and the control variables in one regression analysis to
avoid biasness in coefficients and is discussed next.

66
Tab
le 6
C
orre
latio
n an
alys
is o
f all
the
vari
able
s use
d in
the
regr
essi
on m
odel
Cor
rela
tion
Prob
abili
ty
LnA
DA
C
SC
LnB
S SC
*LnB
S L
EV
L
nAF
CFO
L
nTA
L
nAD
AC
1.
0000
SC
0.
1069
1.
0000
LnB
S
-0.3
200*
**
-0.2
621*
**
1.00
00
SC*L
nBS
-0
.054
8 0.
8874
***
0.18
03**
1.
0000
LE
V
-0.0
091
-0.0
408
0.11
34
0.07
60
1.00
00
LnA
F
-0.1
839*
* 0.
0382
0.
4647
***
0.26
78**
* 0.
3121
***
1.00
00
C
FO
0.26
50**
* 0.
2448
***
-0.3
892*
**
0.02
79
-0.2
839*
**
-0.4
287*
**
1.00
00
LnT
A
-0.1
517*
0.
0556
0.
6461
***
0.35
21**
* 0.
2802
***
0.83
04**
* -0
.376
5***
1.
0000
Not
es: T
his
tabl
e re
ports
the
corr
elat
ion
mat
rix f
or th
e va
riabl
es u
sed
in th
e re
gres
sion
. Ln
AD
AC
is t
he n
atur
al lo
garit
hm o
f th
e ab
solu
te v
alue
of
disc
retio
nary
acc
rual
s. SC
is t
he s
hare
hold
ing
perc
enta
ge o
f th
e la
rges
t sha
reho
lder
s. Ln
BS
is th
e na
tura
l log
arith
m o
f bo
ard
size
. SC
*LnB
S is
the
inte
ract
ion
of s
hare
hold
er c
once
ntra
tion
and
boar
d si
ze. L
EV is
tota
l lia
bilit
ies
over
tota
l ass
ets.
LnA
F is
the
natu
ral l
ogar
ithm
of a
udit
fees
. C
FO is
th
e st
anda
rd d
evia
tion
of c
ash
flow
s fr
om o
pera
tions
. LnT
A is
the
natu
ral l
ogar
ithm
of t
otal
ass
ets.
***
= si
gnifi
cant
at 1
%, *
* =
sign
ifica
nt a
t 5%
, * =
si
gnifi
cant
at 1
0%.

67
4.4 Regression Results Table 4.3 reports the estimated coefficients, t-statistics, probabilities and adjusted R2
from an Ordinary Least Square (OLS) regression of LnADAC on SC, the interaction of
SC and BS, and the control variables. The model is significant with F-statistic of 4.60 (p
< 0.01) and its adjusted R2 is 0.13 which is a good explanatory power. The adjusted R2
in this study is comparable to those in similar studies (see Ferguson et al. 2004;
Davidson et al. 2005; Ding et al. 2007; Liu and Lu 2007; Sarkar et al. 2008).
Consistent with Yu (2006), the coefficient of SC19 is positive and significant (β = 4.74, p
< 0.01). This supports the first hypothesis. The result suggests that high levels of SC
lead to higher levels of EM. This could be due to either ineffective monitoring over the
management of the SPSE companies or the largest shareholder has incentives to support
the management for EM. Even though the positive coefficient is as predicted, the large
coefficient is captivating as it implies that SC itself is unable to constrain EM.
Conversely, SC contributes to more EM.
The coefficient of the interaction variable, SC*LnBS, is negative and significant (β = -
2.75, p < 0.01). This supports the second hypothesis20. The result implies that the larger
the interaction between SC and BS, the lesser will be EM. In other words, large BS is
able to constrain the effect of SC on EM. This is because, in larger boards, a wider
representation of board members is expected and the investor directors would not be
able to influence the board decisions. On the one hand, the concentrated shareholders
would monitor the management and minimize owner-manager agency problem and on
the other independent board members would monitor the concentrated shareholders and
19 Following Ding et al. (2007) and Liu and Lu (2007), a separate regression analysis was conducted which incorporated squared shareholder concentration variable (SC2) assuming a non-linear relationship with earnings management. The result for SC2 was insignificant (β = -0.06 and P = 0.85) and the coefficient and significance of the variables presented in table 4.3 were insignificantly different. 20 A separate regression analysis was conducted that incorporated LnBS in the regression model. The result for LnBS was insignificant (β = 0.07 and P = 0.56) and the coefficient and significance of the variables presented in table 4.3 were insignificantly different.
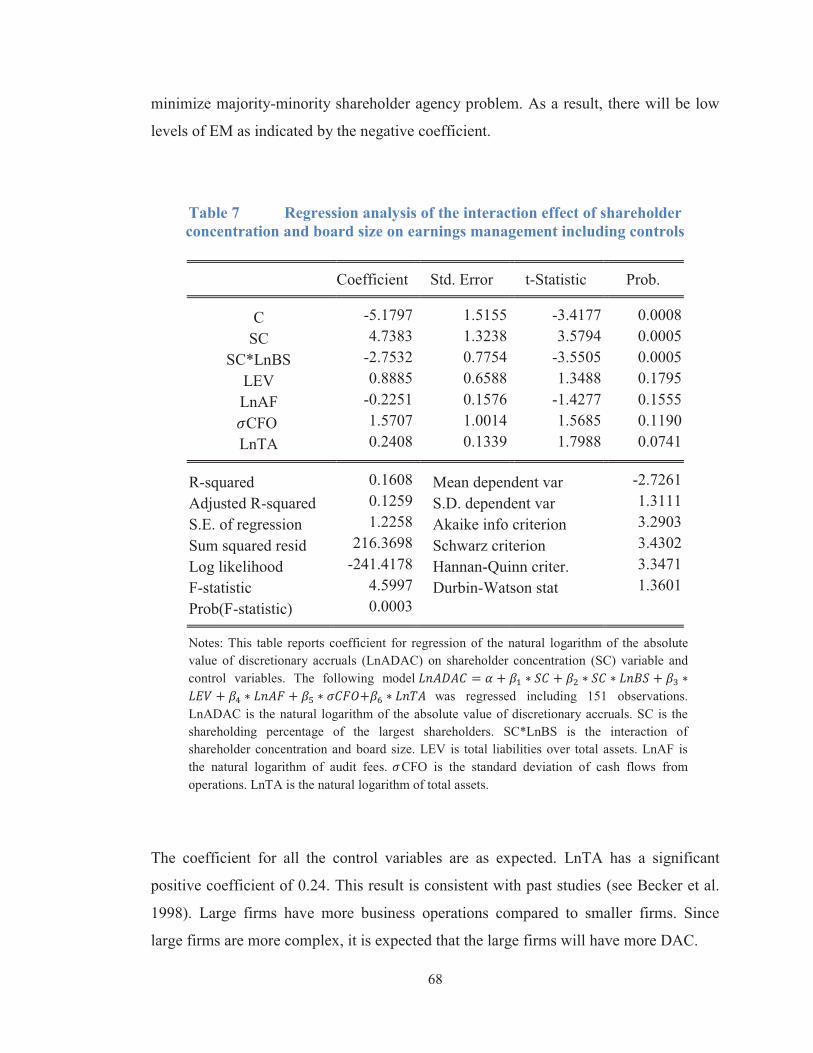
68
minimize majority-minority shareholder agency problem. As a result, there will be low
levels of EM as indicated by the negative coefficient.
Table 7 Regression analysis of the interaction effect of shareholder concentration and board size on earnings management including controls
Coefficient Std. Error t-Statistic Prob.
C -5.1797 1.5155 -3.4177 0.0008 SC 4.7383 1.3238 3.5794 0.0005
SC*LnBS -2.7532 0.7754 -3.5505 0.0005 LEV 0.8885 0.6588 1.3488 0.1795 LnAF -0.2251 0.1576 -1.4277 0.1555 CFO 1.5707 1.0014 1.5685 0.1190
LnTA 0.2408 0.1339 1.7988 0.0741
R-squared 0.1608 Mean dependent var -2.7261 Adjusted R-squared 0.1259 S.D. dependent var 1.3111 S.E. of regression 1.2258 Akaike info criterion 3.2903 Sum squared resid 216.3698 Schwarz criterion 3.4302 Log likelihood -241.4178 Hannan-Quinn criter. 3.3471 F-statistic 4.5997 Durbin-Watson stat 1.3601 Prob(F-statistic) 0.0003
Notes: This table reports coefficient for regression of the natural logarithm of the absolute value of discretionary accruals (LnADAC) on shareholder concentration (SC) variable and control variables. The following model
was regressed including 151 observations. LnADAC is the natural logarithm of the absolute value of discretionary accruals. SC is the shareholding percentage of the largest shareholders. SC*LnBS is the interaction of shareholder concentration and board size. LEV is total liabilities over total assets. LnAF is the natural logarithm of audit fees. CFO is the standard deviation of cash flows from operations. LnTA is the natural logarithm of total assets.
The coefficient for all the control variables are as expected. LnTA has a significant
positive coefficient of 0.24. This result is consistent with past studies (see Becker et al.
1998). Large firms have more business operations compared to smaller firms. Since
large firms are more complex, it is expected that the large firms will have more DAC.

69
The coefficient of LEV, LnAF and is 0.89, -0.23 and 1.57 respectively. However,
these results are insignificant. The positive coefficient of LEV could be as a result of
EM pressures to meet debt covenants. The major lenders for the sample companies are
banks. Since there are only a few listed companies, the banking sector would prefer not
to lose a client by engaging in extensive monitoring. This would result in loss of income
for the lender given few opportunities in a small developing market.
Audit quality is unable to significantly constrain EM because the auditors of all the
SPSE companies are one of the Big Four audit firms. There is probably insignificant
difference in the quality of audit service provided by these firms due to similar expertise.
The insignificant association of operating volatility with LnADAC could be due to the
lack of influence of the business operations on accruals.
4.5 Sensitivity Analysis Table 4.4 provides the results of the sensitivity analysis used in this study. The
sensitivity analysis uses Herfindahl index (H index) as the measure of SC. H index is
used in previous studies that investigate the consequences of concentrated ownership
structures (Demsetz and Lehn 1985; Hartzell and Starks 2003; Makhija and Patton
2004). The H index is computed as the sum of the squares of the percentages of shares
held by the 5 largest shareholders. Ding et al. (2004) also uses the shareholding of the 5
largest shareholders to measure SC. The results of the sensitivity analysis are generally
consistent with the main regression results reported in Table 4.3. Both, SC and it’s
interaction with BS, are significant at 1 percent and LnTA is significant at 10 percent.
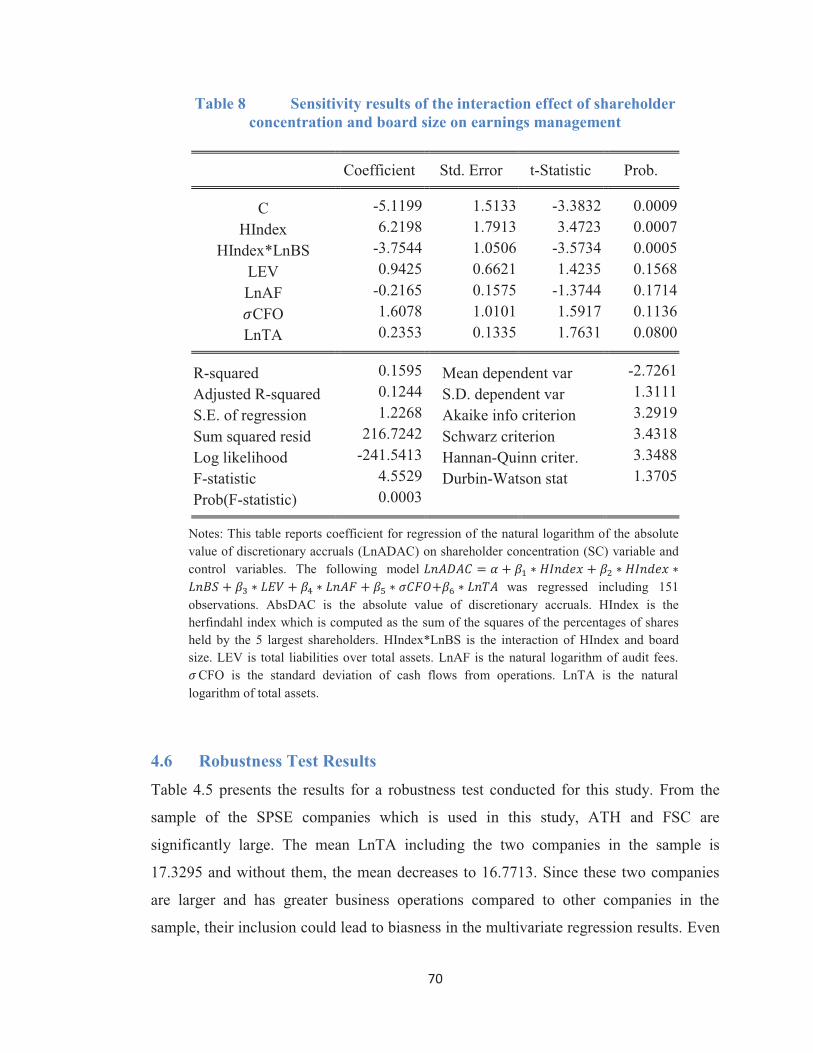
70
Table 8 Sensitivity results of the interaction effect of shareholder concentration and board size on earnings management
Coefficient Std. Error t-Statistic Prob.
C -5.1199 1.5133 -3.3832 0.0009 HIndex 6.2198 1.7913 3.4723 0.0007
HIndex*LnBS -3.7544 1.0506 -3.5734 0.0005 LEV 0.9425 0.6621 1.4235 0.1568 LnAF -0.2165 0.1575 -1.3744 0.1714
CFO 1.6078 1.0101 1.5917 0.1136 LnTA 0.2353 0.1335 1.7631 0.0800
R-squared 0.1595 Mean dependent var -2.7261 Adjusted R-squared 0.1244 S.D. dependent var 1.3111 S.E. of regression 1.2268 Akaike info criterion 3.2919 Sum squared resid 216.7242 Schwarz criterion 3.4318 Log likelihood -241.5413 Hannan-Quinn criter. 3.3488 F-statistic 4.5529 Durbin-Watson stat 1.3705 Prob(F-statistic) 0.0003
Notes: This table reports coefficient for regression of the natural logarithm of the absolute value of discretionary accruals (LnADAC) on shareholder concentration (SC) variable and control variables. The following model
was regressed including 151 observations. AbsDAC is the absolute value of discretionary accruals. HIndex is the herfindahl index which is computed as the sum of the squares of the percentages of shares held by the 5 largest shareholders. HIndex*LnBS is the interaction of HIndex and board size. LEV is total liabilities over total assets. LnAF is the natural logarithm of audit fees.
CFO is the standard deviation of cash flows from operations. LnTA is the natural logarithm of total assets.
4.6 Robustness Test Results Table 4.5 presents the results for a robustness test conducted for this study. From the
sample of the SPSE companies which is used in this study, ATH and FSC are
significantly large. The mean LnTA including the two companies in the sample is
17.3295 and without them, the mean decreases to 16.7713. Since these two companies
are larger and has greater business operations compared to other companies in the
sample, their inclusion could lead to biasness in the multivariate regression results. Even

71
though LnTA (firm size) is used as a control variable in the main regression analysis, a
further robustness test21 is conducted to ensure that the results are not biased due to the
inclusion of ATH and FSC in the sample.
The empirical results for the robustness check are largely consistent with the main
regression results. The relationship of SC, the interaction of SC with BS and LnTA are
as predicted and presented above. SC and the interaction between SC and BS are
significant at 1% level and 5% level respectively while LnTA is significant at 10%.
Table 9 Robustness results of the interaction effect of shareholder concentration and board size on earnings management
Coefficient Std. Error t-Statistic Prob.
C -6.5705 2.2192 -2.9607 0.0037 SC 4.5394 1.5242 2.9783 0.0036
SC*LnBS -2.1635 1.0121 -2.1377 0.0347 LEV 0.9857 0.7668 1.2856 0.2013 LnAF -0.3444 0.1879 -1.8332 0.0694
CFO 1.3009 1.0572 1.2305 0.2211 LnTA 0.3820 0.2061 1.8535 0.0664
R-squared 0.1675 Mean dependent var -2.6247 Adjusted R-squared 0.1229 S.D. dependent var 1.3535 S.E. of regression 1.2676 Akaike info criterion 3.3692 Sum squared resid 179.9690 Schwarz criterion 3.5327 Log likelihood -193.4665 Hannan-Quinn criter. 3.4356 F-statistic 3.7547 Durbin-Watson stat 1.4817 Prob(F-statistic) 0.0019
Notes: This table reports coefficient for regression of the natural logarithm of the absolute value of discretionary accruals (LnADAC) on shareholder concentration (SC) variable and control variables. The following model
was regressed including 151 observations. LnADAC is the natural logarithm of the absolute value of discretionary accruals. SC is the
21 The sample size of the robustness test is 119 firm years.
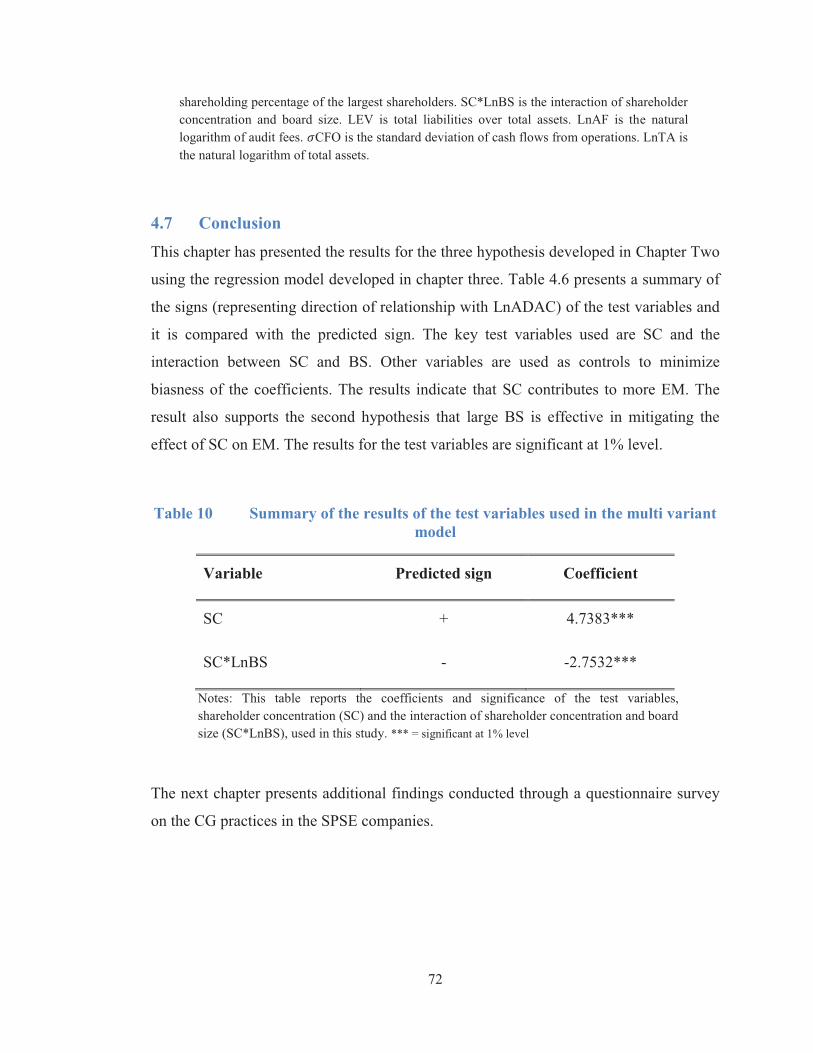
72
shareholding percentage of the largest shareholders. SC*LnBS is the interaction of shareholder concentration and board size. LEV is total liabilities over total assets. LnAF is the natural logarithm of audit fees. CFO is the standard deviation of cash flows from operations. LnTA is the natural logarithm of total assets.
4.7 Conclusion This chapter has presented the results for the three hypothesis developed in Chapter Two
using the regression model developed in chapter three. Table 4.6 presents a summary of
the signs (representing direction of relationship with LnADAC) of the test variables and
it is compared with the predicted sign. The key test variables used are SC and the
interaction between SC and BS. Other variables are used as controls to minimize
biasness of the coefficients. The results indicate that SC contributes to more EM. The
result also supports the second hypothesis that large BS is effective in mitigating the
effect of SC on EM. The results for the test variables are significant at 1% level.
Table 10 Summary of the results of the test variables used in the multi variant model
Variable Predicted sign Coefficient
SC + 4.7383***
SC*LnBS - -2.7532***
Notes: This table reports the coefficients and significance of the test variables, shareholder concentration (SC) and the interaction of shareholder concentration and board size (SC*LnBS), used in this study. *** = significant at 1% level
The next chapter presents additional findings conducted through a questionnaire survey
on the CG practices in the SPSE companies.
73
CHAPTER 5 CORPORATE GOVERNANCE PRACTICES IN
THE SPSE LISTED COMPANIES
5.1 Introduction The empirical results in the earlier chapter provide evidence that high level of SC is a
CG issue in an emerging stock market such as the SPSE. The results indicate that the
high levels of SC contribute to more EM. The ADB (2000) Report indicates that this
issue is severe when the internal and external CG mechanisms are weak. This chapter
provides evidence on the CG practices in the SPSE listed companies using a
questionnaire22 survey and annual report analysis.
The CG practices of the SPSE companies are expected to be different from those of
corporations listed on the stock exchanges in developed nations due to two major
reasons. First, the place (country) of origin of a company dictates its rules, policies,
regulations, culture and law on the company like the place of birth of an individual
explains his/her language, culture, values and personalities. There are various
differences between countries, within countries between states, within states between
towns and cities which contribute to the differences between companies. These
differences explain the strength of the external CG structures available to support
business growth and development.
For instance, a company incorporated in the US and Australia is expected to have strong
external CG practices. In the US, the SOX provides several guidelines on CG issues.
These include rules on the establishment and registration of the Board. Specific rules
such as the duties of the Board, member appointment, composition and independence,
powers and rules of the board and also audit quality and independence are outlined
within Title I of SOX. The SOX has its second Title (II) on Auditor Independence where 22 The questionnaire is provided in Appendix 1.

74
sections 201 to 209 outline various rules on maintaining auditor independence. The
importance of an AC is discussed in section 204 which states that the auditor reports to
the AC (SOX 2002). Likewise, other titles in the SOX provide numerous rules to ensure
strong CG practices within corporations listed and operating in the US.
Similarly, the ASX Corporate Governance Council in Australia publishes and provides
CG Principles and Recommendations as guidelines for companies listed on the ASX and
generally for companies operating in Australia (ASX Corporate Governance Council
2003). The CG Principles and Recommendations outline eight principles which are each
of equal importance. The principles are: (1) Lay solid foundations for management and
oversight, (2) Structure the board to add value, (3) Promote ethical and responsible
decision-making, (4) Safeguard integrity in financial reporting, (5) Make timely and
balanced disclosure, (6) Respect the right of shareholders, (7) Recognize and manage
risk, and (8) Remunerate fairly and responsibly (ASX Corporate Governance Council
2007). These guidelines have been very useful in improving the CG practices in most
corporations in Australia.
However, there are very limited guidelines and recommendations on CG for the SPSE
companies. This chapter highlights on the external policies and practices governing
corporations listed on the SPSE.
Second, the strength of the CG practices in a company is determined by the available
internal governance structures in the company. The shareholders (with power), BOD and
the management of a company determine the internal CG practices of the company. The
external business environment also influences the internal CG practices of an
organization.
75
A major factor that contributes to the differences between corporations is their
governance mechanisms and administration. CG mostly differ between corporations due
to various reasons including the laws of the nation, the strength of the stock exchanges,
the strength of the accounting body, the competitiveness of the corporate market and the
status of the economy. These factors have an impact on the CG practices within the
corporations.
5.2 Rules and Regulations governing the SPSE companies The Government of Fiji (hereinafter Companies Act (1985)), SPSE (2010) Listing
Rules, CMDA (2008) CG code for the capital markets (which is also known as the
Reserve Bank of Fiji (RBF) CG principles and reporting guidelines) and the FIA provide
rules and regulations that govern the operations of the SPSE publicly traded companies.
The Companies Act provides legislations on the incorporation of companies and
generally on the administration and management of the companies. The SPSE listed
companies are required to follow the International Financial Reporting Standards (IFRS)
since 2007 following a decision of the FIA to adopt the IFRS. The FIA also provides the
code of ethics for accountants based on the International Federation of Accountants
(IFAC) code of ethics.
The CG principles and regulations for the SPSE companies are provided by the SPSE
(2010) Listing Rules and CMDA (2008) CG code. The SPSE requires all listed
companies “to comply with corporate governance code as stipulated under the RBF
corporate governance principles and reporting guidelines” (SPSE 2010) which was
previously known as CMDA (2008) CG code for the capital markets.
The SPSE (2010) requires a minimum of three directors on the board. On the other hand,
the CMDA (2008) CG code takes a flexible approach by stating that “the board should
be structured in a way, in terms of its composition, size and commitment that it
76
effectively carries out its responsibilities”. The CMDA (2008) CG code recommends the
establishment of a nomination committee for the selection and appointment of directors.
Additionally, the regulations require the board to be independent. The SPSE (2010)
Listing Rules state that “at least one third of the directors must be independent”. There is
some inconsistency as the CMDA (2008) CG code recommends that at least thirty
percent of the board to be independent. The CG code defines an independent director as
“a non-executive director who is not a member of management and who is free of any
business or other relationship that could materially interfere with-or could reasonably be
perceived to materially interfere with-the independent exercise of their judgment”
(CMDA 2008). Moreover, it is recommended that “the board should ensure that all
conflicts of interest are disclosed” (CMDA 2008).
The CG code states that the appointment of directors should be based on consideration
of factors such as “skills, knowledge, expertise and experience; professionalism; and
integrity” (CMDA 2008). Also, the appointment should be for a fixed period for each
director. Reappointment of directors should not be automatic but directors may be
subject to re-election (CMDA 2008).
Moreover, the CG code recommends that the board, at a minimum, should have the
following three sub-committees. (1) AC, (2) Risk management committee and (3)
Recruitment committee (CMDA 2008). Each committee is recommended to have a
formal charter and sufficient meeting to ensure that the board is informed about
“relevant issues pertaining to the company’s operations” (CMDA 2008). Furthermore,
recommendation 9.2 states that the AC should have at least three members and majority
of the members should be independent (CMDA 2008). It is also recommended that the
chairperson of the AC should not be the chairperson of the board (CMDA 2008).
Recommendation 10.1 indicates that although a separate risk management committee

77
may be established, the ultimate responsibility for risk oversight and management rests
with the full board (CMDA 2008).
Recommendation 9.1 of the CG code relates to internal audit function and external audit.
It is recommended that a company should have an internal audit function or an
alternative mechanism to achieve the same objective (CMDA 2008). The SPSE requires
public corporations to present annual audited financial statements no later than three
months after the end of the financial period (SPSE 2010). The company appoints an
independent “external auditor who reports directly to the Board Audit Committee”
(CMDA 2008). Also, “companies must ensure that the extent of non-audit given to the
external auditor does not cause any compromise of the independence of auditors”
(CMDA 2008).
Principle 5 of the CG code highlights on “timely and full disclosure of all material
matters concerning the company” (CMDA 2008). Beyond annual report disclosures, the
CG code recommends at least disclosures of governance structures and policies, and
company’s compliance to the CG code (CMDA 2008).
Similar to the motivation of this study, recommendation 8.1 of the CG code states that
“the board must ensure that the interests of the minority shareholders are protected”
(CMDA 2008). This is only possible if the internal and external CG mechanisms are
optimally structured and enforced. Hence, this study also investigates the practice CG
practices in the SPSE companies.

78
5.3 Internal Corporate Governance practices
5.3.1 Ownership Structure
Ownership Concentration
Unlike the US and the UK, the ownership of all listed corporations on the SPSE is
highly concentrated. Figure 5.1 provides the aggregate proportion of shares held by the
largest five (5) shareholders of each SPSE listed company for the last five years based
on the annual report analyses of the companies. The bar graph shows that all the SPSE
listed companies have very high levels of SC and it is also consistent over time. The
latter does not imply lack of stock trading. The large controlling shareholders do not
mostly engage in trading and prefer to maintain control over the business. This is visible
in Figure 5.1. The five largest shareholders hold a minimum of approximately 50 percent
of the shares. For some companies this is above 80 percent. The shares held by the five
largest shareholders do not decrease vastly in most cases.
Figure 5.1 Shareholder Concentration representing the aggregate shareholdings of the largest five shareholders
Within the SPSE corporations, monitoring over the management is not an issue as the
large concentrated shareholders have the control. Hence, the shareholder – manager
agency problem is minimized in these companies. However, in these companies, there is
-
20
40
60
80
100
120
ATH APP CFL FSC FTV FHL FIL FMF FGP KGF PGI RBG RCF TTS VBL PBP
perc
enta
ge o
f ow
ners
hip
Companies listed on SPSE
2006
2007
2008
2009
2010

79
an agency problem between the large concentrated shareholders and the dispersed small
investors. Since the majority shareholders could extract resources for private benefits,
protection of the minority shareholders is a concern. A different set of CG policies is
necessary in this business scenario because the policies in the developed nations where
shareholding is dispersed may not be fully applicable.
EM is a tool which is most likely to be used by the accountants and/or managements to
produce results favoring the majority concentrated shareholders. The consistency in
shareholding by the large shareholders implies long term interest in the firm and that
they are going to work to uphold the firm. In spite of having a long term interest in the
firm, the large controlling shareholders’ choice of accounting could be detrimental to the
minority shareholders. For instance, income increasing EM could be used to increase the
value of the shares (firm value) which could then be sold by the large shareholders to
realize some gain. Also, EM could be used by the controlling shareholders to hide any
tunneling activities.
Thus, the high levels of SC contribute to strong CG by minimizing owner-manager
agency problems. However, it creates another form of agency problem – majority-
minority shareholder agency problem.
Shareholder Composition
The shares of a firm can be owned by various groups such as family, government,
financial institutions and individuals. The ownership type of the controlling shareholders
would determine their long term interest. For instance, family groups would be
interested in more income, government may be interested in better service while
financial institutions would want business growth. Hence, the shareholder composition
of the large shareholders of each company would determine their long term interest. This
would then determine the strength of SC as a strong CG attribute.
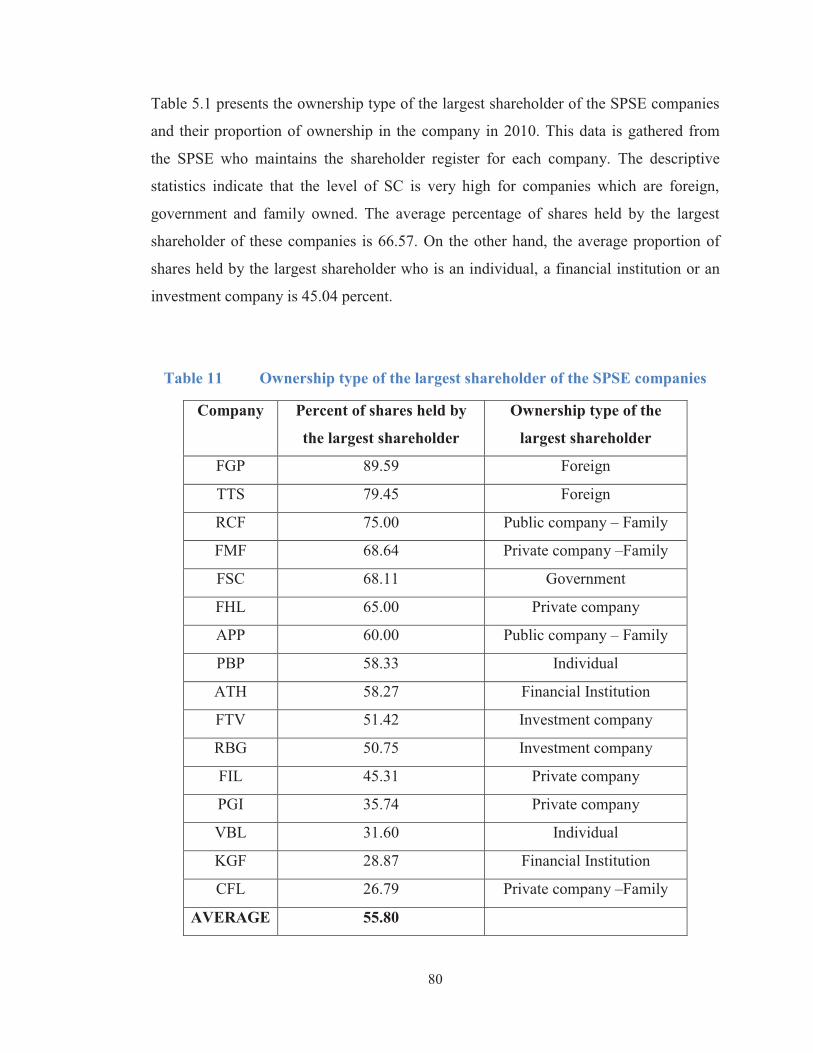
80
Table 5.1 presents the ownership type of the largest shareholder of the SPSE companies
and their proportion of ownership in the company in 2010. This data is gathered from
the SPSE who maintains the shareholder register for each company. The descriptive
statistics indicate that the level of SC is very high for companies which are foreign,
government and family owned. The average percentage of shares held by the largest
shareholder of these companies is 66.57. On the other hand, the average proportion of
shares held by the largest shareholder who is an individual, a financial institution or an
investment company is 45.04 percent.
Table 11 Ownership type of the largest shareholder of the SPSE companies
Company Percent of shares held by
the largest shareholder
Ownership type of the
largest shareholder
FGP 89.59 Foreign
TTS 79.45 Foreign
RCF 75.00 Public company – Family
FMF 68.64 Private company –Family
FSC 68.11 Government
FHL 65.00 Private company
APP 60.00 Public company – Family
PBP 58.33 Individual
ATH 58.27 Financial Institution
FTV 51.42 Investment company
RBG 50.75 Investment company
FIL 45.31 Private company
PGI 35.74 Private company
VBL 31.60 Individual
KGF 28.87 Financial Institution
CFL 26.79 Private company –Family
AVERAGE 55.80
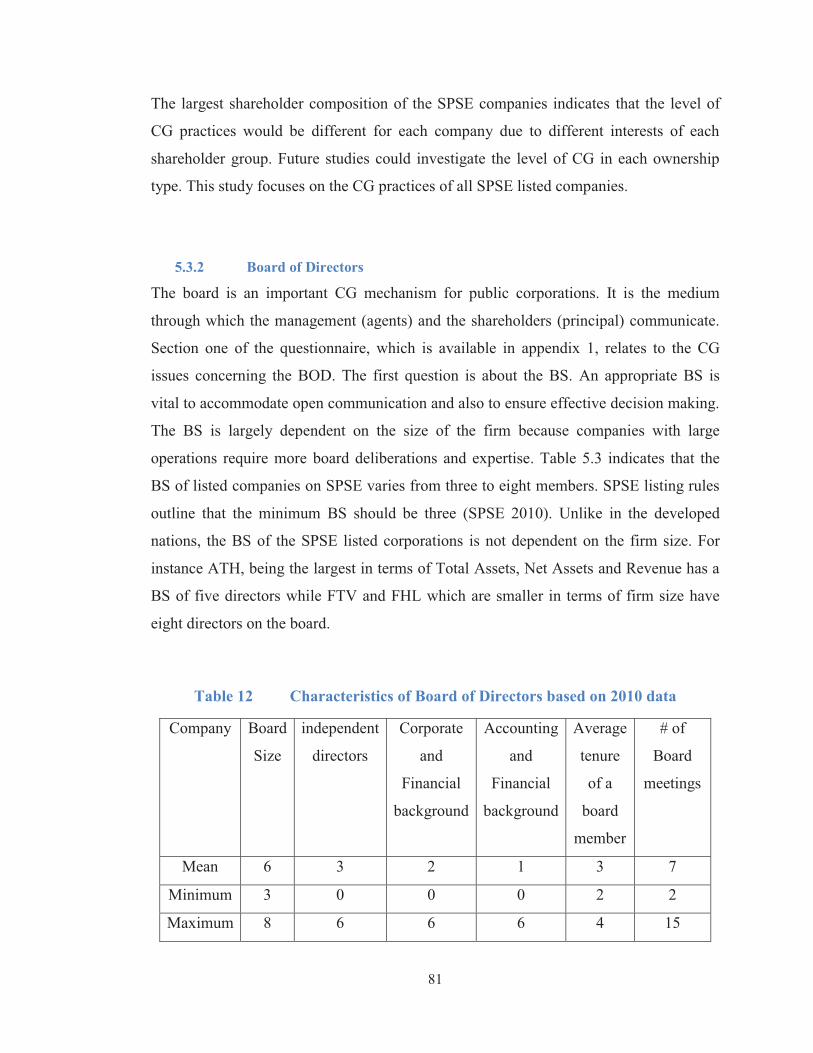
81
The largest shareholder composition of the SPSE companies indicates that the level of
CG practices would be different for each company due to different interests of each
shareholder group. Future studies could investigate the level of CG in each ownership
type. This study focuses on the CG practices of all SPSE listed companies.
5.3.2 Board of Directors
The board is an important CG mechanism for public corporations. It is the medium
through which the management (agents) and the shareholders (principal) communicate.
Section one of the questionnaire, which is available in appendix 1, relates to the CG
issues concerning the BOD. The first question is about the BS. An appropriate BS is
vital to accommodate open communication and also to ensure effective decision making.
The BS is largely dependent on the size of the firm because companies with large
operations require more board deliberations and expertise. Table 5.3 indicates that the
BS of listed companies on SPSE varies from three to eight members. SPSE listing rules
outline that the minimum BS should be three (SPSE 2010). Unlike in the developed
nations, the BS of the SPSE listed corporations is not dependent on the firm size. For
instance ATH, being the largest in terms of Total Assets, Net Assets and Revenue has a
BS of five directors while FTV and FHL which are smaller in terms of firm size have
eight directors on the board.
Table 12 Characteristics of Board of Directors based on 2010 data
Company Board
Size
independent
directors
Corporate
and
Financial
background
Accounting
and
Financial
background
Average
tenure
of a
board
member
# of
Board
meetings
Mean 6 3 2 1 3 7
Minimum 3 0 0 0 2 2
Maximum 8 6 6 6 4 15

82
Question number three to six of the questionnaire relate to board independence. Prior
research has identified the importance of board independence (Davidson et al. 2005;
Chtourou et al. 2001; Xie et al. 2003). The board chairperson is seen as independent if
he/she is not the company CEO (Davidson et al. 2005; Bar-Yosef and Prencipe 2009).
Accordingly, most of the SPSE companies have an independent chairperson (see figure
5.2). Furthermore, the SPSE requires each listed companies to have at least one third
independent directors (SPSE 2010). Only a few of the SPSE companies maintain the
minimum board independence. These companies are mostly family owned. On the other
hand, institution and government owned companies have majority of independent
directors on the board. Thus, for all the SPSE companies, the average board
independence is 47 percent (see table 3.1).
Figure 5.2 The proportion of independent Chairperson in the SPSE companies in 2010
Question two of the questionnaire is about the number of meetings held by the board.
The number of board meetings has been used as a proxy for board effectiveness in the
literature (Dhaliwal et al. 2006). Table 5.3 provides descriptive statistics on board
meeting of the SPSE companies. On average, seven board meetings were held in 2010
for the SPSE listed companies. The minimum number of board meetings held was two
BODs with independentcharirperson
BODs withoutindependent charirperson

83
and the maximum was 15. The greater number of board meetings gives an indication on
the number of executive decisions engaged by the board. For instance, the board of FHL
had 15 meetings in 2010 and the year was very fruitful for the company as it expanded
and engaged in large investments as well.
The first question of section one of the questionnaire also required information on the
directors’ characteristics such as the directors’ qualification and experience. The
corporate, accounting and financial background and the experience of each board
member contribute to the effectiveness of board decisions. Table 5.3 provides statistics
on board members’ corporate, accounting and financial background and tenure. On
average, a board member remains in a company for three consecutive years which is
ample to fully understand the company and contribute towards its growth. Moreover,
some board members have corporate background as they have worked and served as
directors of other companies. However, the average number of directors that have
accounting and financial background was only one for the SPSE companies in 2010.
Lack of directors with accounting and financial background could undermine the success
of some decisions taken by the board. It could also undermine effective governance of
the company.
In summary, the small BS, lack of board independence and lack of directors with
accounting and financial background contribute to the weak CG in the SPSE companies.
5.3.3 Audit Committees
The literature identifies a number of board committees which performs various specific
board functions. These board committees include AC, executive committee, nomination
committee, risk management committee, compensation committee, disciplinary
committee, public policy committee and CG committee. These committees with other
responsibilities also monitor the management and ensure that the management makes
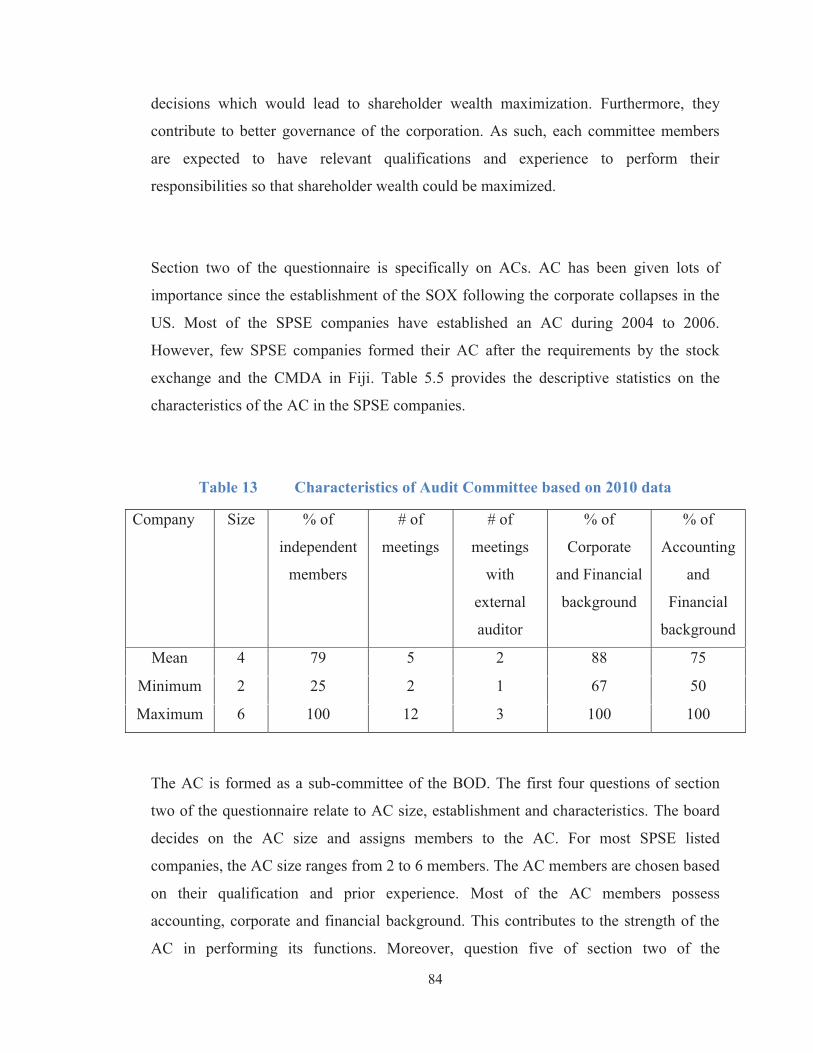
84
decisions which would lead to shareholder wealth maximization. Furthermore, they
contribute to better governance of the corporation. As such, each committee members
are expected to have relevant qualifications and experience to perform their
responsibilities so that shareholder wealth could be maximized.
Section two of the questionnaire is specifically on ACs. AC has been given lots of
importance since the establishment of the SOX following the corporate collapses in the
US. Most of the SPSE companies have established an AC during 2004 to 2006.
However, few SPSE companies formed their AC after the requirements by the stock
exchange and the CMDA in Fiji. Table 5.5 provides the descriptive statistics on the
characteristics of the AC in the SPSE companies.
Table 13 Characteristics of Audit Committee based on 2010 data
Company Size % of
independent
members
# of
meetings
# of
meetings
with
external
auditor
% of
Corporate
and Financial
background
% of
Accounting
and
Financial
background
Mean 4 79 5 2 88 75
Minimum 2 25 2 1 67 50
Maximum 6 100 12 3 100 100
The AC is formed as a sub-committee of the BOD. The first four questions of section
two of the questionnaire relate to AC size, establishment and characteristics. The board
decides on the AC size and assigns members to the AC. For most SPSE listed
companies, the AC size ranges from 2 to 6 members. The AC members are chosen based
on their qualification and prior experience. Most of the AC members possess
accounting, corporate and financial background. This contributes to the strength of the
AC in performing its functions. Moreover, question five of section two of the
85
questionnaire relates to AC independence. Almost all AC members are independent non-
executive directors. This is vital to ensure the independence of the committee as it liaises
with the management and the auditors.
Furthermore, question seven and eight of section two of the questionnaire is about AC
meetings. The AC members meet, on average, every quarterly and some of these
meetings are with the external auditor. On average, from five AC meetings, two
meetings are held with the external auditor. Few SPSE companies have as many as 12
AC meetings which depend on the seriousness of the issues and its urgency.
Literature identifies various functions of an AC. In order to answer question ten of
section two of the questionnaire; participants from the companies listed on the SPSE
have listed the following functions of an AC.
� To oversee the financial reporting process;
� To oversee the balance, transparency and integrity of published financial
information;
� Ensure timely and balanced disclosure;
� Promote ethical and responsible decision making;
� Maintain a register of interests;
� Respect the rights of shareholders;
� Promote accountability and audit;
� Recognize and manage risk;
� To challenge and review all internal processes;
� To carry out audit of internal control;
� Assess whether the Company's external reporting is legally compliant, consistent
with Committee members information and knowledge, and suitable for
shareholder need;
� Assess the management processes and internal control systems supporting
external reporting;
86
� Liaise with the external auditors and ensure that the annual statutory audit and
half year review are conducted in an effective manner;
� Make recommendation for the appointment or removal of the external and the
internal auditors;
� On an annual basis, assess the performance and independence of the external and
internal auditors;
� monitor the coordination of the internal and external audits;
� to look at transparency and verification of internal controls and procedures;
� To provide recommendations, advice and information concerning its accounting
and reporting responsibilities under Companies Act 1983 and related legislation,
and evaluating risk management practices.
The above comprehensive list indicates that the AC has numerous responsibilities. If
most of the SPSE corporations have other board committees then most of these functions
could be distributed to other committees. The numerous functions of the AC pose
questions on the effectiveness of the committee in conducting its core responsibility.
This indicates that although most SPSE companies have an AC, it is not structured in the
best manner to promote strong CG.
5.3.4 Board Committees
Section three of the questionnaire relate to board committees and internal audit. The
earlier is discussed first and the latter is discussed in the next section, 5.3.6. Table 5.4
summarizes the number of SPSE companies that have established a number of board
committees. Most companies listed on the SPSE have ACs. Question eight to 14 of
section three of the questionnaire relates to other board committees. Other common
board committees in the SPSE companies are executive committee, risk management
committee and disciplinary committee. A company also has a compensation committee
and a CG committee. Two SPSE listed companies do not have any board committees.
Hence, the BOD of these companies performs all the board functions. For some SPSE
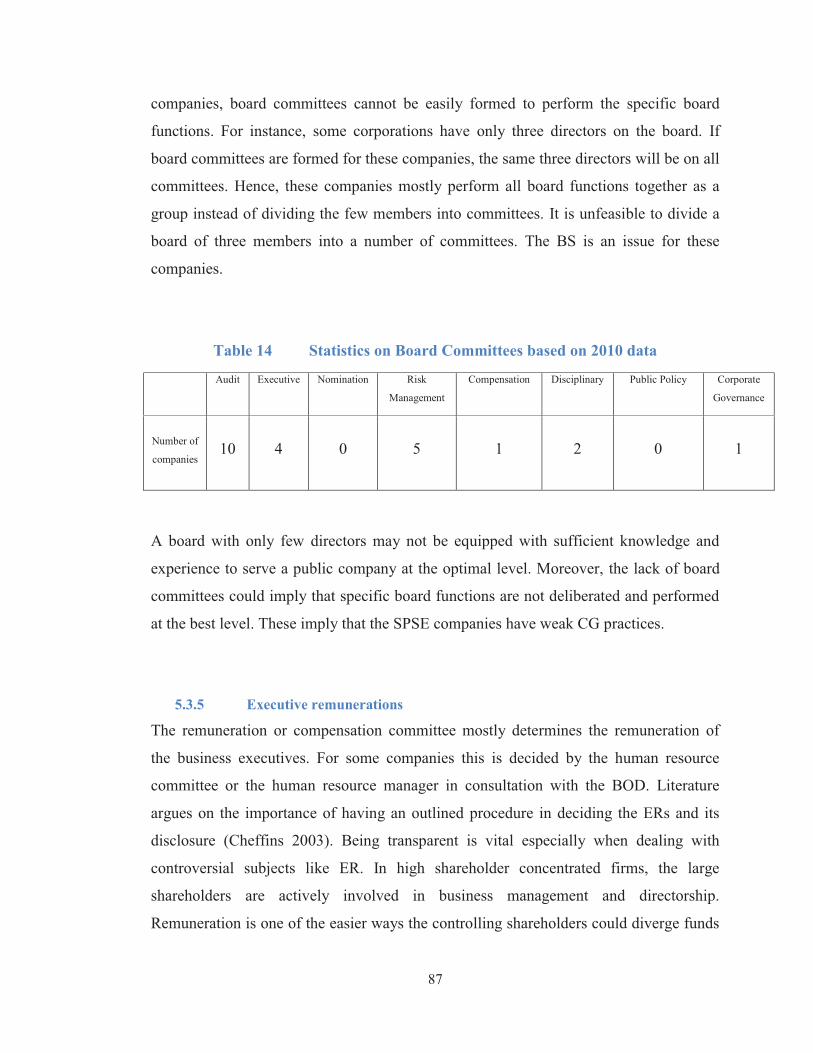
87
companies, board committees cannot be easily formed to perform the specific board
functions. For instance, some corporations have only three directors on the board. If
board committees are formed for these companies, the same three directors will be on all
committees. Hence, these companies mostly perform all board functions together as a
group instead of dividing the few members into committees. It is unfeasible to divide a
board of three members into a number of committees. The BS is an issue for these
companies.
Table 14 Statistics on Board Committees based on 2010 data
Audit Executive Nomination Risk
Management
Compensation Disciplinary Public Policy Corporate
Governance
Number of
companies 10 4 0 5 1 2 0 1
A board with only few directors may not be equipped with sufficient knowledge and
experience to serve a public company at the optimal level. Moreover, the lack of board
committees could imply that specific board functions are not deliberated and performed
at the best level. These imply that the SPSE companies have weak CG practices.
5.3.5 Executive remunerations
The remuneration or compensation committee mostly determines the remuneration of
the business executives. For some companies this is decided by the human resource
committee or the human resource manager in consultation with the BOD. Literature
argues on the importance of having an outlined procedure in deciding the ERs and its
disclosure (Cheffins 2003). Being transparent is vital especially when dealing with
controversial subjects like ER. In high shareholder concentrated firms, the large
shareholders are actively involved in business management and directorship.
Remuneration is one of the easier ways the controlling shareholders could diverge funds
88
away from the firm into their own pockets. Hence, an outlined procedure to determine
ER and the disclosure of ER are vital for strong CG levels.
Question twelve of section three of the questionnaire relates to the compensation or
remuneration committee and the annual report of some SPSE companies provides
information on executive remunerations. One of the SPSE companies has a
compensation committee which makes decisions on executive remuneration of the
company. In another company, a human resource committee is “responsible for advising
the Board on human resources issues including the remuneration and conditions of
employments of the CEO, and senior management and succession planning” (ATH
2010). Moreover, the “remuneration of directors is based on fees of directors approved
by the shareholders. In addition, the Company provides travel, medical and professional
indemnity insurance for the directors. The Board sets remuneration and scope of
technical and professional services required by directors in addition to their services as
directors.” (FSC 2010).
Most of the SPSE companies do not disclose their procedures for setting ER. However,
many SPSE companies publish the ER in their annual reports. Companies divide the
remunerations paid to directors into directors’ fees, directors’ fees for other services and
also directors’ emoluments – staff costs. Table 5.2 provides the descriptive statistics of
the directors’ fees for directorial and non-directorial services for the SPSE companies
for years 2008 to 2010. The average directors’ fee for other services is greater than the
average directors’ fee for directorial services during the years 2009 and 2010. The SPSE
companies have a fixed fee payable to directors for participating on the Board and
committee meetings and providing other directorial services.
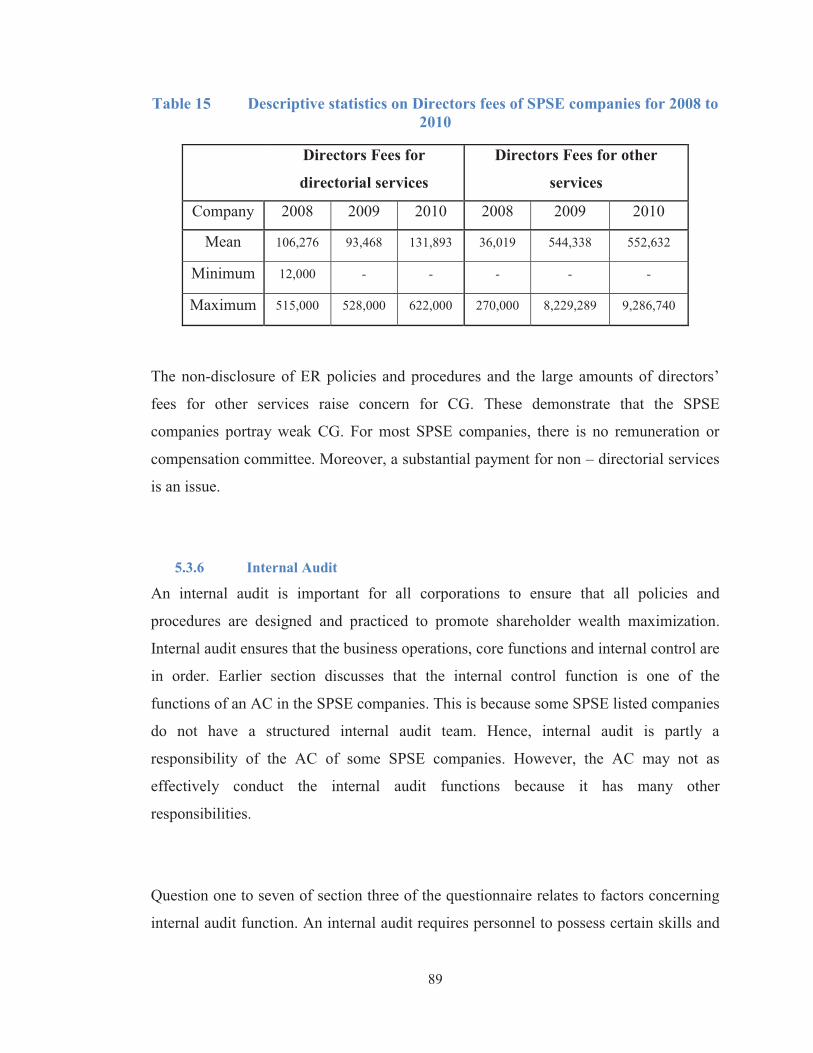
89
Table 15 Descriptive statistics on Directors fees of SPSE companies for 2008 to 2010
Directors Fees for
directorial services
Directors Fees for other
services
Company 2008 2009 2010 2008 2009 2010
Mean 106,276 93,468 131,893 36,019 544,338 552,632
Minimum 12,000 - - - - -
Maximum 515,000 528,000 622,000 270,000 8,229,289 9,286,740
The non-disclosure of ER policies and procedures and the large amounts of directors’
fees for other services raise concern for CG. These demonstrate that the SPSE
companies portray weak CG. For most SPSE companies, there is no remuneration or
compensation committee. Moreover, a substantial payment for non – directorial services
is an issue.
5.3.6 Internal Audit
An internal audit is important for all corporations to ensure that all policies and
procedures are designed and practiced to promote shareholder wealth maximization.
Internal audit ensures that the business operations, core functions and internal control are
in order. Earlier section discusses that the internal control function is one of the
functions of an AC in the SPSE companies. This is because some SPSE listed companies
do not have a structured internal audit team. Hence, internal audit is partly a
responsibility of the AC of some SPSE companies. However, the AC may not as
effectively conduct the internal audit functions because it has many other
responsibilities.
Question one to seven of section three of the questionnaire relates to factors concerning
internal audit function. An internal audit requires personnel to possess certain skills and
90
knowledge to be effective in performing their function. Like the AC of a SPSE
company, the internal audit functions are not defined optimally as well. A few
companies do not have a proper internal audit function. For most of the SPSE listed
companies, the internal audit function has been established within the last 5 years. This,
similar to an AC, has been as a result of past corporate collapses.
The internal audit members of the SPSE companies are either appointed by the
management or the BOD with an exception of one company where the AC appoints the
internal audit team members. Mostly, the team comprises of members who are
employees of the company. It is rare in Fiji but two companies outsource this function.
One outsources the internal audit function to its external auditor while the other to
another audit firm which is not its external auditor. On average, the internal audit team is
made up of 5 members. These members have tenure of approximately 3 to 4 years. The
internal audit team in most cases reports to its appointer.
The lack of internal audit function in some SPSE companies and the weak practices of
the internal audit team, such as reporting to the appointer and not the board or the AC,
contribute to weak CG practices in the corporation. AC participation would have been
useful in improving the internal control weakness. There are some improvements in the
recent years as more companies now have an AC due to the CG requirements of the
SPSE through capital market unit of the Reserve Bank of Fiji (RBF).
5.3.7 External Audit
Within an agency relationship, due to price protection agents ultimately bear monitoring
costs associated with contracts. Hence, the agents establish mechanisms to guarantee
that they will behave in the principal’s interests. External audit is one of the many
bonding mechanisms employed by managements. Even though it adds creditability to

91
the reports produced by the managements, there are issues regarding external audit that
emasculate CG.
The CG, EM and audit literature have highlighted various concerns relating to external
audit practices (Frankel et al. 2002; Ferguson et al. 2004). This includes and mostly
revolves around factors that contribute to lack of auditor independence. Auditor
independence is also a major concern for the SPSE listed companies. Table 5.6 presents
the descriptive statistics on audit tenure and non-audit service fee ratio (NASRATIO).
The average audit tenure for the SPSE listed companies is eight years and the maximum
is 21 years. The audit tenure is large enough for the management to establish a good
relationship with the external auditor. This could lead to biasness in the audit report
which is relied upon by the stakeholders to make decisions. Although an audit firm
spends 21 consecutive years with a company, it is possible that they are ensuring
independence through rotation of the individual auditors conducting the audit. However,
this does not confiscate the issue that the independence of the auditor is likely to be
impaired. The audit reports are signed by the audit firm as a whole and not individual
partner or auditor.
Table 16 Audit tenure and non–audit service fee statistics for SPSE listed companies
Audit tenure Non audit fees as a
proportion of total
fees
Mean 8 33%
Minimum 1 2%
Maximum 21 97%
On the other hand, the minimum of one year with a company also raises questions. It is
important to understand why the auditor left the company in a year. There could be
92
various reasons such as a disagreement on the accounting treatment of some
transactions, a disagreement on the classification of certain accounts and a disagreement
on the methods for calculations (for example, depreciation method).
Prior literature documents that the ratio of NAS fee paid to the audit firm is a proxy for
auditor independence (Frankel et al. 2002; Ferguson et al. 2004). A large proportion of
NAS to total audit fee implies that the auditor is getting a good income from the
company. In such cases the audit firm would do their best not to lose the client. If they
do, it would mean a big loss of income for the firm. Table 5.6 provides the descriptive
statistics on the proportion of NAS to total fees. On average, a listed company pays 33
percent for NAS (of the total fees paid) to the audit firm. The proportion of NAS fee
usually varies from period to period and between companies. The minimum is as low as
two percent but the maximum is as high as 97 percent. For most SPSE companies, the
proportion of NAS to total audit fee is quite large. Similar to the audit tenure issue, this
indicates that there is a strong relationship between the audit firm and the management
of the company. Like audit tenure issue, the high proportion of NAS may not necessarily
imply impairment of auditor independence. However, the two issues do raise questions
on the audit quality.
Moreover, the annual report analyses also indicate that all the audit reports of the SPSE
companies have been unqualified. There is one exception. A company has been having a
disclaimer on its going concern which is dependent on the government’s support for the
company (FSC 2010). The unqualified report of all the SPSE listed companies raises
concerns for the quality of the audit. The financial and annual reports of these companies
are either of very high quality or there are issues regarding the audit quality.
93
The long audit tenure and the high ratio of NAS to total audit fee are clear indication of
the weak CG practices in the SPSE companies. With respect to the external audit,
auditor independence is a major concern for the SPSE listed companies.
5.4 External Corporate Governance practices
5.4.1 Institutional Ownership
Financial institutions are a major contributor to the function and development of the
capital markets. Some financial institutions actively participate in investments which is
their business. In Fiji, the few major players are the Fiji National Provident Fund
(FNPF), the Bank of the South Pacific (BSP), Unit Trust of Fiji (UTF), Kontiki Growth
Fund (KGF) and FHL. These corporations, some are listed, invests in other listed
corporations and also hold shares of unlisted companies. Hence, they have their
representatives on the Board of the invested company and have some say over the
operations of the company. This may have a positive contribution on the CG practices of
the SPSE companies. However, the shares mostly held by the institutional investors and
foundation members (mostly the concentrated controlling shareholders) of the company
are classified as non-free float shares in the share registry of the SPSE.
Table 5.7 provides information on the composition of shares into FF and non-free float
share of the SPSE listed companies. On average, 77 percent of the shares are non-free
float shares. This means that, on average, only 23 percent of the shares of the SPSE
companies are available in the market for trading purposes. Majority of the shares are
either held by the foundation shareholders or the institutional investors. These
shareholders prefer to maintain control over the corporation. This could be a good CG
attribute as these investors would provide better monitoring over the management.
However, the major agency problem in this nature of ownership structure (SC) is the
majority – minority shareholder agency problem.
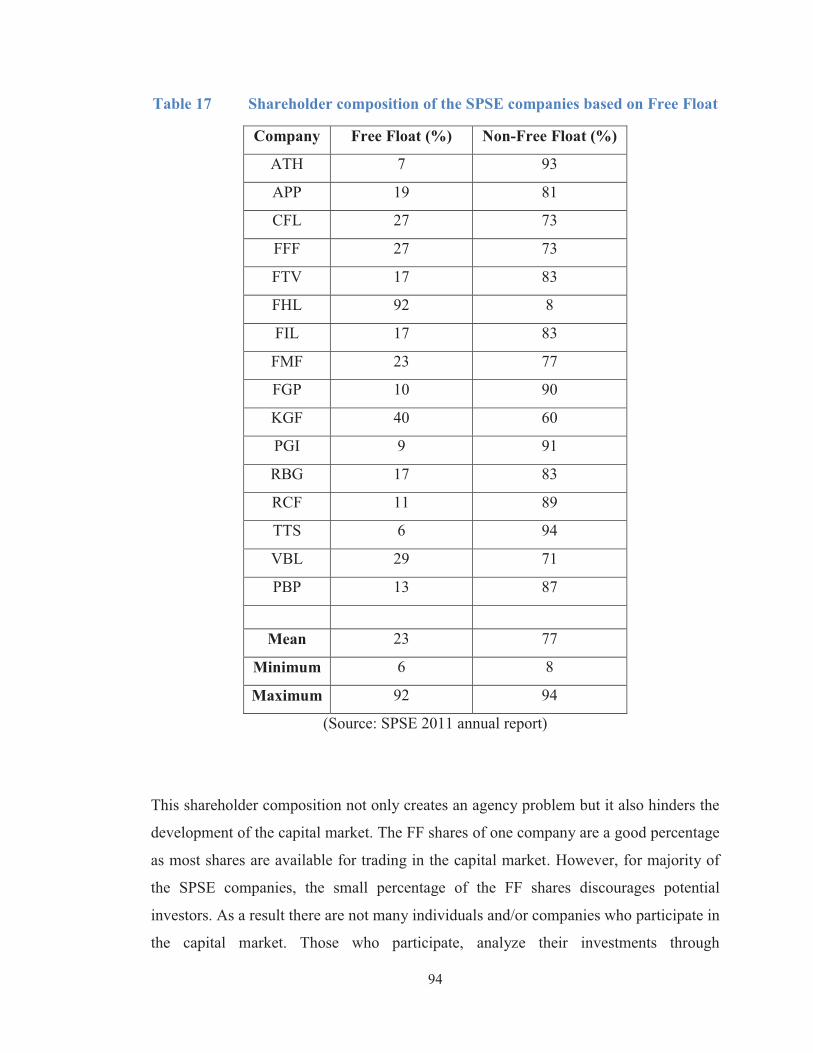
94
Table 17 Shareholder composition of the SPSE companies based on Free Float
Company Free Float (%) Non-Free Float (%)
ATH 7 93
APP 19 81
CFL 27 73
FFF 27 73
FTV 17 83
FHL 92 8
FIL 17 83
FMF 23 77
FGP 10 90
KGF 40 60
PGI 9 91
RBG 17 83
RCF 11 89
TTS 6 94
VBL 29 71
PBP 13 87
Mean 23 77
Minimum 6 8
Maximum 92 94
(Source: SPSE 2011 annual report)
This shareholder composition not only creates an agency problem but it also hinders the
development of the capital market. The FF shares of one company are a good percentage
as most shares are available for trading in the capital market. However, for majority of
the SPSE companies, the small percentage of the FF shares discourages potential
investors. As a result there are not many individuals and/or companies who participate in
the capital market. Those who participate, analyze their investments through
95
brokers/analyst. The high percent of non – free float shareholding indicates a possibility
of expropriation by the larger shareholders. Thus, institutional investors are useful in
minimizing one agency problem but it creates another. The non-free float shares held by
these investors would increase their confidence. Being the big sharks in the market and
given the weak capital market regulations, they could easily accomplish their self
motives. Also, these non-free float shares discourage competition in the market. The
control is in the hand of the founders and the institutional investors instead of the
market.
5.4.2 Market Control and Competition
The SPSE, formerly known as Suva Stock Exchange was established in 1979 and
operated as a ‘trading post’. The establishment of the CMDA in January 1998 added
vigor to the development of the equity market. Hence, Suva Stock Exchange changed its
name to SPSE with the vision “to be an internationally recognized securities exchange
for the pacific” (SPSE 2012).
SPSE fulfills two major functions as a capital market. First, it acts as a primary market
and allows means of equity finance for companies by initially listing on the stock
exchange and engaging in IPO. Second, the more vital role is that it provides a
secondary market where initially offered shares could be further traded. Not only it
provides a market for trading shares of listed companies but also a market for trading
government bonds, statutory authority bonds, government treasury bills, statutory
authority promissory notes, RBF notes, and tradable term deposits. However, it does not
provide a market for derivatives and futures.
Today, there are 16 companies listed on the stock exchange. Many of these companies
have been added in the last decade. Although the market is developing and inactive,
trading has been taking place in the past years as shown on figure 5.3 and 5.4. In spite of

96
the trading activities, many companies are not encouraged to list on the stock exchange.
There are a number of large companies operating privately and not willing to list with
the fear of lost control. The incumbent shareholders want control over their company.
Figure 5.3 Trading Statistics over 12 months
Figure 5.4 Trading Statistics over last 5 years
(Source: SPSE 2011 Annual Report)

97
Due to the less developed secondary market, Fiji’s financial market is shallow.
Institutional investors have the largest share in most of the investments including
government bonds and bills. FNPF holds 72 percent of government bonds. “Since it is
the main purchaser for government bonds, it influences to a greater extent the current
market interest rates within the economy” (Fiji Peoples Charter website 2011). Likewise,
for equity, the founders and institutional investors hold non-free float shares as discussed
in section 5.3.1. Hence the control is mostly in the hands of the founders and the
institutional investors. Market has a minimal say in this regard as it is highly inactive.
Active markets provide market competition between corporations and other listings.
Competition brings efficiency in the activities conducted. The domination by the
founders and institutional investors imply monopoly position. Also, the small number of
listings contributes to the lack of competition in the market. This does not encourage
strong CG within corporations. The companies and its managements do not have any
major threat of existence and continuation as they are dominating in their sector. Thus
the external governance mechanism from the market is very weak.
However, managements of weak performing business are always under spotlight. There
have been mergers and/or takeovers which has been a concern for incumbent manager of
weak performing companies. Decades ago the NBF was taken over by the Colonial
Group which was recently in December 2009 bought by the BSP. In 2005, Carlton
Brewery took over South Pacific Distilleries and later renamed itself to FGP which is
now listed. A more recent case is where FHL Retailing limited partially took over RBG.
This takeover was facilitated through special crossing transaction. The first batch of
takeover happened on 14th April 2008 and the quantity that got transferred was
15,060,000 at a price of $1.40. This equates to $21,084,000. The second batch of
takeover happened on 20th March 2009 and the quantity that got transferred was
163,796 at a price of $1.40. This equates to $229,314.40. As a result, FHL Retailing

98
Limited owns 15,223,796 shares of RBG. This is 50.75 percent of the total issued shares
of RBG.
.
The takeover and/or merger may result in restructure of the company whose shares are
sold. The buying company may bring in their administration and their senior personnel
so that in their opinion the business would perform better. This imposes threats to the
incumbent managers. For poor performing companies, the senior managers would do
their best to ensure their performances improve. This may also lead to EM. However, the
threat could also be a form of external governance whereby the management ensures
smooth operation of the business to avoid any takeover.
5.4.3 Creditor Monitoring and Protection
Creditors who are basically outsiders make lots of contribution to business success. They
provide finance and in some statement of financial position, their contribution outweighs
equity. LEV is the ratio of total liability over total assets. Table 5.8 provides the
descriptive statistics on LEV for the SPSE listed corporations. On average, 38 percent of
the Assets of the listed companies are financed by the outsiders. The minimum is zero
which means that all the assets are financed by the equity holders for at least a SPSE
company. The maximum LEV is 146 percent implying that the equity is in negative, that
is, the value of the assets is less than the liabilities. This is a concern for the business.
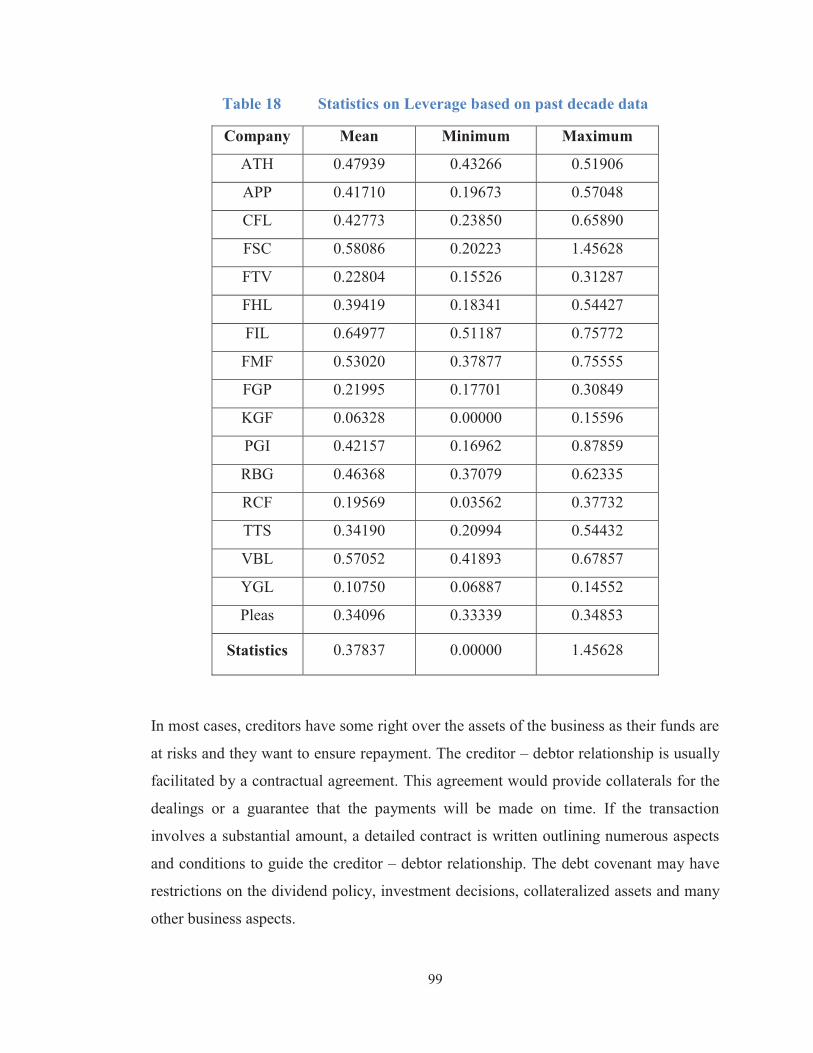
99
Table 18 Statistics on Leverage based on past decade data
Company Mean Minimum Maximum
ATH 0.47939 0.43266 0.51906
APP 0.41710 0.19673 0.57048
CFL 0.42773 0.23850 0.65890
FSC 0.58086 0.20223 1.45628
FTV 0.22804 0.15526 0.31287
FHL 0.39419 0.18341 0.54427
FIL 0.64977 0.51187 0.75772
FMF 0.53020 0.37877 0.75555
FGP 0.21995 0.17701 0.30849
KGF 0.06328 0.00000 0.15596
PGI 0.42157 0.16962 0.87859
RBG 0.46368 0.37079 0.62335
RCF 0.19569 0.03562 0.37732
TTS 0.34190 0.20994 0.54432
VBL 0.57052 0.41893 0.67857
YGL 0.10750 0.06887 0.14552
Pleas 0.34096 0.33339 0.34853
Statistics 0.37837 0.00000 1.45628
In most cases, creditors have some right over the assets of the business as their funds are
at risks and they want to ensure repayment. The creditor – debtor relationship is usually
facilitated by a contractual agreement. This agreement would provide collaterals for the
dealings or a guarantee that the payments will be made on time. If the transaction
involves a substantial amount, a detailed contract is written outlining numerous aspects
and conditions to guide the creditor – debtor relationship. The debt covenant may have
restrictions on the dividend policy, investment decisions, collateralized assets and many
other business aspects.
100
For companies listed on the SPSE, given that the creditors have a large share in
financing the business assets, creditors could also be monitoring the management to
ensure timely service of their loan. The creditors may not provide monitoring over all
the companies at all times but they are expected to rigorously monitor the
underperforming companies. The debt covenants could always give a number of rights
to the creditors or lenders by having clauses on the following issues:
� Annulment or suspension of credit
� Suspension of disbursement
� Use of loans and other funds
� Deadline for completion of project for which the loan is undertaken
� Insurance over all properties forming part of the project that is related to the loan
� Maintenance of all properties forming part of the project
� Audit of accounts
� Disclosure of all information relating to the project for which funds are borrowed
� Right to demand prepayments
This is a stronger form of external governance. However, this is effective when poor
performing firms are discovered in a timely manner. Otherwise, the underperformance
would lead to loss to both, the equity and debt financiers’ investments. On the other
hand, debt covenants also motivate management to engage in EM so that the real
performance is hidden.
5.4.4 Securities Market Regulations
The capital market unit within the RBF sets rules for companies listed on the SPSE. The
SPSE also have listing rules for listed companies and for those companies interested in
listing. The SPSE listing rules were recently updated in July 2010 and now it has more
101
strong requirements. The SPSE listing rules have 7 sections. The following paragraphs
outline the rules in four major categories.
The first part of the listing rule is about Listing Requirements. This section outlines a
number of requirements for a company to be listed. Some rules are on the capital
requirements (total market capitalization must be at least $1 million), public
shareholding, operating history, working capital, memorandum and article of association
and dual or secondary listing. Companies must satisfy the requirements in this section
(section 3 of the SPSE listing rules) to be qualified for the SPSE listing.
The second major category outlines rules on application for listing. Section 4 elaborates
on public offering and compliance listing. This section outlines the documents required
for listing and the process involved in public offering. Section 5 is about additional
issues where requirements on shareholder approval, SPSE approval, dividend plan,
options, allotment and issue of certificates are outlined.
Continuing listing requirements, section 6 of the listing rule is comprehensive. It
includes requirements on disclosure of material information, response to rumors and
unusual trading activity, public shareholding and working capital, transfer of securities,
shareholder meetings, takeovers, half yearly financial statements, annual audited
financial statement, annual report, change of balance date, statutory and shareholder
disclosure, board composition, director fees, transactions with related parties, CG,
insider dealing and capital structure. This section highlights on a number of CG aspects.
It requires the boards of the SPSE listed companies to have a minimum of three directors
and at least one third of the directors must be independent. Directors’ fees cannot be
increased without shareholders’ approval. “All listed companies are required to comply
with the corporate governance code as stipulated under the RBF corporate governance
principles and reporting guidelines” which are discussed later in this section.
102
The last category on compliance and enforcement is discussed in section 7. This section
highlights the consequences to a company if found not complying with the SPSE listing
requirements. The SPSE has the powers of inspection of any books, records or accounts
of the entity. The non-compliance of the listing requirements could result in trading
halts, suspensions and delisting.
The Capital market unit of the RBF provides “reporting guidelines for listed companies
and licensed intermediaries” and the “corporate governance code for capital markets”.
The code highlights on ten CG principles and provides recommendations on best
practices. The reporting guideline elaborates on the approach to be adapted to report
under the CG principles. CG code and the reporting guidelines together are very similar
to ASX Corporate Governance Council’s “Principles of Good Corporate Governance
and Best Practice Recommendations”. Paragraph 6.42 of SPSE listing rule requires all
listed companies to comply with the CG Code. The regulations together have
strengthened the CG reporting by all the SPSE listed companies. However, brief
information is provided in the annual reports. Detailed information would have been
useful to give an indication on the level of improvements.
The recent development in the CG policies has resulted in an improvement in the
disclosure on CG by the SPSE companies. These disclosures are very brief and it does
not imply that the CG practices have actually improved in these companies. In most
cases, it is identified that the SPSE companies only maintain the minimum mandatory
requirements. Most of these companies do not see the CG recommendations as a good
practice but an additional obligation and documentation.

103
5.5 Conclusion This chapter discussed the CG practices of the SPSE listed companies based on a
questionnaire survey. The CG practices are discussed as internal and external
governance structures.
The internal CG structures of most SPSE companies are generally weak due to many
reasons. First, the high level of SC creates an agency problem between the majority and
minority shareholder groups. Second, the large amount of payments for non-directorial
services and lack of disclosure on ER for some SPSE companies raise concerns because
it is the easiest medium to divert funds from the company and expropriate from the
minority shareholders. Third, the directors do not possess adequate qualities to be
efficient and effective with their responsibilities. The board lacks independence and
directors with accounting and financial background. Fourth, most boards of the SPSE
companies do not have the necessary board committees to effectively distribute the
board’s responsibilities. Fifth, the AC has lots of responsibilities that may hinder its
performance. Sixth, the internal audit function is not clearly defined in most SPSE
corporations. Last, the external audit quality is an issue given the high level of
NASRATIO, audit tenure and many unqualified reports.
Moreover, the external CG practices are mostly weak due to the following reasons. First,
the low percentage of shares available for FF indicates that the minority shareholders’
interests may not be protected as most controls are with the concentrated large
shareholders including the institutional investors. Second, although mergers/takeovers
have been practiced earlier, the business market and environment does not provide much
scope for competition. Lack of competition indicates weak external governance. Third,
the securities market regulations have been weak in the past. Despite the recent
developments on the CG code, it is unclear as to whether CG practices have actually
improved in the SPSE companies. Furthermore, there is more scope for development in
104
the policies for CG. For instance, the minimum level of BS and board independence
should be increased.
On the other hand, creditor monitoring is a more effective governance structure in the
SPSE companies. Large LEV indicates that the outsiders also have some control over
the firm and could possibly oppose the concentrated shareholders.
Therefore, the CG practices are weak in the SPSE companies. This implies that there is
lack of protection for the minority shareholders. This supports the results presented in
chapter four that the high level of SC leads to more EM due to the majority-minority
shareholder agency problems. Despite the impractical minimum requirements on BS and
board independence, some SPSE companies practice good governance by having large
independent boards. As a result, those companies experience low levels of EM. The
large independent boards are effective in mitigating the effect of SC and constrain EM.
105
CHAPTER 6 CONCLUSION: Implications and Future Research
6.1 Introduction This chapter summarizes the research findings of this study and discusses the
implications of the research. It also presents the scope for future research and discloses
the limitations encountered in conducting this research.
This study provides evidence on the instances of EM and the CG practices of the SPSE
listed companies. The results indicate that the high level of SC creates an agency
problem between the majority and the minority shareholder groups. Hence, there is more
EM in highly shareholder concentrated firms. Furthermore, large BS is effective in
mitigating the effect of SC on EM. The questionnaire survey supports the empirical
findings that SC leads to more EM due to weak CG practices in the SPSE companies.
The results indicate that there is lack of protection for the minority shareholders of the
SPSE companies.
The findings of this research have implications on the CG practices and policies for the
SPSE companies. The major implication of this study is on the improvements of the
level of the CG policies and practices in companies listed on the SPSE. Due to the high
level of SC, the rights and interests of the minority shareholders are at risk. This study
suggests some possible ways of improving CG policies for the protection of the minority
shareholders and the company as well.
The limitations and scope for future research is also presented in this chapter. Next, a
summary of this research is provided.
106
6.2 Shareholder Concentration and Earnings Management in SPSE listed
companies Chapter Four provides the empirical evidence on the effect of SC on EM based on a
multi-variant regression model. The analysis is based on 151 data years of 16 SPSE
companies.
The descriptive statistics indicate that there is a high level of SC in all SPSE listed
corporations. The largest shareholder of the SPSE companies hold, on average, 55.80
percent of the shares of the company. Additionally, the five largest shareholders hold
approximately 81.57 percent of the shares of the company. The qualitative analysis
identifies that approximately only 23 percent of the shares of the SPSE listed companies
are on FF. This indicates that the concentrated controlling shareholders do not want to
lose control. The high level of SC creates an agency problem between the majority and
the minority shareholders. This is a major concern for all the SPSE listed companies
because the large concentrated shareholders would not facilitate the dilution of their
shares and thus the market cannot protect the minority shareholders. Due to the high
level of SC, the minority shareholders’ investments are at risk because the controlling
shareholders could expropriate resources from the company.
EM is a tool which could be used by the concentrated shareholders to divert recourses or
to hide their tunneling behavior. The descriptive statistics suggest that there is high level
of EM in the SPSE companies. The academic literature indicates that weak CG leads to
EM. Despite the ability of the high level of SC to minimize owner-manager agency
problem through monitoring, there is an agency problem between the majority and
minority shareholders that could motivate EM. The correlation statistics support this
proposition.
107
The multi variant regression results provide evidence that there is a significant positive
relationship between SC and EM. This result indicates that the high level of SC is unable
to constrain the instances of EM in the SPSE companies. Although EM is not always
bad for a company, it can also be advantageous to some shareholders. Since shareholders
can also benefit from EM in a company, they support the managers’ choices of
accounting discretion. Only the large concentrated controlling shareholders would
benefit from EM. Hence, it is a major concern for all the SPSE companies and the
protection of minority shareholders is paramount in emerging stock markets.
The empirical results also support the second hypothesis that the interaction between SC
and BS is negatively associated with the level of EM. This implies that large BS
mitigates the adverse effect of SC on EM. In high shareholder concentrated firms, it is
highly likely that the concentrated controlling shareholders would not be able to
influence the board decisions if the BS is large. When BS is large, wider representation
of directors is possible, hence constraining the influence on board decisions of majority
shareholders.
The SPSE listing rule requires a minimum of three directors on the board and one third
of the directors should be independent. Despite the impractical minimum requirement,
some SPSE companies maintain better CG in terms of BS and independence. The
average BS is approximately 6 directors and average board independence based on 2010
data is 47 percent. Even though, on average, majority of the directors are not
independent, the 2010 data shows that almost 50 percent of the SPSE companies have
majority independent directors. Thus, using BS as a proxy for board independence due
to unavailability of board independence data for prior years, this study provides evidence
that large boards are effective in mitigating the adverse effect of SC on EM. The results
are robust based on an alternative measure of SC and upon the removal of dominant
firms from the sample. ATH and FSC were eliminated from the sample for the later
robustness test.

108
Other variables are used as controls in the multi variant regression model. The
coefficients of all the control variables are as predicted. However, only the coefficient of
LEV is significant while other control variables are insignificant.
Prior research has explained that blockholders constrain EM and that SC has a non-
linear relationship with EM. This study adds to the CG and EM literature by providing
empirical evidence that the majority-minority shareholder agency problem leads to more
EM in very high shareholder concentrated firms such as the SPSE companies. This study
also contributes to the extant literature that large boards are effective in minimizing the
majority-minority shareholder problem through extensive monitoring in very high
shareholder concentrated firms.
6.3 Corporate Governance in the SPSE listed corporations Literature has discussed various important CG policies which are good for companies
for strong CG. Most of these policies are implemented and practiced in the developed
stock exchanges such as the ASX. However, the CG practices in developing economies
with emerging stock exchanges have been a concern. The weak CG practices in
companies are a major factor that hinders the capital market development. Hence, the
SPSE with the CMDA in Fiji has developed a CG guideline. Prior to the requirement by
the SPSE, CG had been very poor in the listed companies. There have been some
improvements recently; however, it is not sufficient to minimize agency problems and
promote capital markets development.
CG is divided into internal and external governance structures and accordingly discussed
in Chapter Five. Internal CG attributes include ownership structure, ER, BOD
characteristics, board committees, AC, internal audit and external audit. Like other
emerging stock markets, the shareholding structure of the SPSE companies is highly

109
concentrated. Most concentrated large shareholders are founders of the company. Even
though these concentrated shareholders have futuristic view and minimizes owner-
manager agency problems, they could dominate the other small investors. Thus, there is
a majority-minority shareholder agency problem which motivates EM in the SPSE
companies. This is severe when CG practices are weak.
The non-disclosure of ER policies and procedures and the large amounts of directors’
fees for other services raise concern for CG. For most SPSE companies, there is no
remuneration or compensation committee. Moreover, a substantial payment for non –
directorial services is an issue.
Board has a major role in the administration of a company. Companies with high level
of SC need to have a board which is able to maintain balance and also have a futuristic
perspective. Information on BS, independent directors, corporate, accounting and
financial background, director’s tenure, and board meetings are presented in chapter
five. Board committees are also formed to perform specific board functions. Audit, risk
management and executive committees are more common in the SPSE companies from
a list of eight committees identified in the literature.
Since AC is common in almost all the SPSE companies, further analysis was conducted
to gather more information. AC in most SPSE companies is made up of four directors,
most of which are non-executive independent directors. On average, from five meetings,
two are held with external auditor and most members have corporate, accounting and
financial background. These all are good indicators of CG. However, the survey
indicates that the AC in the SPSE companies has many responsibilities which could
make its functioning inefficient.

110
In most corporations, the internal audit function was established recently, approximately
five years ago. The internal audit team is either appointed by the board or the AC and
they mostly report to their appointer. A number of SPSE corporations do not have a
defined internal audit function. All companies listed on the SPSE are audited by an
external auditor. The audit tenure and NASRATIO is large and this raises issues of
auditor independence and audit quality.
This research indicates that the external CG structures are even weaker. External CG
structures include institutional ownership, market control and competition, creditor
monitoring and protection, and securities market regulations. The founders of companies
and institutional investors hold majority of the shares of the company. The issue is that
most of these shares are unavailable for trading in the stock market despite the company
being listed. Furthermore, the SPSE is not very active and the market does not provide
much competition and it is inefficient. Lack of competition implies no threat of
existence and continuation for the SPSE listed companies and the concentrated
controlling shareholders are able to dominate. This is a weak CG attribute.
Moreover, creditor monitoring and protection is vital as well. Creditor monitoring is a
strong CG mechanism for the SPSE companies. Since the creditors finance, on average,
38 percent of the assets of the SPSE companies, they provide monitoring over the
companies. The securities market also screens the listing process. The listing rules
outline rules on listing requirements, application for listing, and compliance and
enforcement. Recently, the CG code was developed. This is a positive factor; however,
there are rooms for further development and success would depend on the
implementation and practice of the guidelines in the Code.
Upon a thorough analysis of the internal and external CG structures of the companies
listed on SPSE, it is clear that the CG practice is weak in most SPSE companies. The

111
practices of the SPSE companies indicate weak governance structures. This includes
shareholder composition, board committees, internal audit, and external audit, lack of
market competition, compliance and enforcement of SPSE rules. Since CG practices are
poor, the SPSE companies have a high level of EM.
6.4 Implications The results of this research highlights that the majority – minority shareholder agency
problem is a concern for companies with very high levels of SC such as the SPSE
companies. Moreover, a further analysis indicates that large boards are effective in
minimizing the majority – minority shareholder agency problem and hence mitigating
EM. Thus, this study has implications for regulators who are concerned about
strengthening the CG policies to protect the interests of the minority shareholders,
minimizing opportunities for EM and improving the quality of financial reports.
The board mechanisms are considered as the basic and the most important internal CG
mechanism. The board mechanisms relate to board size, board independence, board
expertise, board tenure and board meeting frequencies. It is important for companies to
decide on an appropriate board size as it would determine the strength of other board
mechanisms. The SPSE companies currently have an average board size of six directors
despite the minimum requirement of three directors. Ning et al. (2010) suggest that the
“target number of directors on the board for average US publicly-traded corporations is
between eight and eleven directors”. Moreover, the results of this study suggest that
large boards constrain EM. Therefore, the SPSE needs to reconsider its requirement on
board size for the publicly traded companies.
Furthermore, board independence is also vital to ensure effective CG. The SPSE
requires publicly traded corporations to have a minimum of one third proportion of
independent directors on the board. However, SOX requires majority independent
112
directors on the board (SOX 2002). Similarly, this study suggests that a wider
representation of directors is important for the protection of the minority shareholders in
a very high shareholder concentrated firm. Additionally, majority independent directors
would monitor the controlling concentrated shareholders. Therefore, it is important for
the SPSE to reconsider its requirement on board independence for the publicly traded
companies.
Adequate board size and board independence are the primary aspect of the board
mechanisms. Upon strengthening the rules on these primary board mechanisms, the
SPSE, FIA and the Capital Market Unit at RBF need to update the specific guidelines on
board expertise and board tenure. The current guidelines are broad as indicated in
section 5.2 of Chapter Five. The SOX in its first Title, section 101, paragraph (e) clearly
outlines the requirement on board composition for US publicly traded companies. The
findings of this study suggest that it is vital to appoint directors with expertise such as
accounting and financial. Also, it is important to have guidelines on board tenure to
ensure effective and efficient board deliberations.
Despite the minimum recommendation of the CMDA (2008) CG code, all SPSE
companies did not have an AC, risk management committee, recruitment committee and
nomination committee in 2010. The results of this study indicate that there is a need for
enforcement of the CG guidelines to ensure that the SPSE companies practice strong
governance. The revised CG code follows the “if not, why not’ approach” where the
companies are required to explain if they do not follow any principles of the code
(CMDA 2008). However, this approach does not seem to be fruitful for strong
governance practices in the SPSE companies due to a different business culture in this
business environment. The SPSE needs to incorporate rules on the establishment and the
operations of board sub committees to ensure effective and efficient governance in
publicly traded companies.

113
Moreover, it is recommended that there should be a requirement that all companies have
a compensation committee to determine the appropriate salary packages of the
executives. A defined procedure for determining ER is vital. Future research (probably
case studies) could be conducted to have an in – depth understanding of current
procedures on ERs. ER needs to be clearly disclosed in the annual reports.
The weak levels of CG in the SPSE companies are mostly due to the lack of an internal
audit function. The SPSE should require all listed companies to have an internal audit
function and the responsibilities of the internal audit should be clearly outlined.
Even though all SPSE companies have the Big 4 firms as their external auditor, external
audit quality is still an issue due to the large NASRATIO and audit tenure. The SPSE
needs to incorporate rules on auditor independence to ensure effective governance. Title
II of the SOX could be followed to develop the rules on auditor independence.
It is now timely that an independent council or institution is established to oversee and
discipline professionals engaging in immoral and unlawful business activities. The
Prime Minister of Fiji in 2010 FIA Congress “questioned the efficiency of auditors in
the country’s two biggest financial debacles that cost $699million” (Baselala 2010).
Furthermore, the Prime Minister of Fiji in 2011 FIA Congress states that the Cabinet has
approved “the creation of a legal framework to establish an independent body to set
standards for the accounting profession; to monitor, hear complaints and institute
disciplinary proceedings” (Bainimarama 2011). The Prime Minister indicated that an
Independent Financial and Auditing Services Commission (IFASC) will be established
under the framework.
114
External CG structures also require major improvements. Further research could
consider the reasons for having low proportion of FF shares offered by the SPSE
companies. Research also needs to identify ways to have most shares on FF and limit
restriction on trade. This will enhance market competition and more open economy will
promote growth of competitive firms. Financial market research should consider
avenues to increase listing in the near future. Stock market regulations have been
recently updated. However, more research is required to ensure more relevant and
reasonable rules and regulations considering the business environment. Outright
adoption of developed markets guidelines on CG may not be very fruitful. This could be
one reason for the lack of compliance. Also, there is a need for more compliance and
strict implementation of the current CG code.
Literature clearly indicates that strong CG minimizes EM. This research highlights that
EM is common in the selected companies mostly due to poor governance which is
possibly a result of the high levels of SC. Strengthening CG mechanisms will be fruitful
for the development of the capital market and the economy as well.
6.5 Limitations Even though this research has highlighted various issues on CG and EM in the SPSE
companies, the study encountered a number of limitations. The limitations are discussed
in the following paragraphs.
Only companies listed on the SPSE have been selected for this study. Other private or
SOEs were not selected due to the difficulty in gathering ample financial data to
compute AbsDAC. Most private companies are hesitant in providing annual reports. It is
important for the nation that financial data is compiled for companies and is available
for research. The results would differ for different set of companies if their shareholders’
115
are not as highly concentrated. Future research needs to consider companies in different
jurisdictions.
Moreover, due to the small number of firms (only 16), the firms were not distributed into
their respective industries to conduct the empirical analysis. Separate analysis for each
industry could produce interesting results as firms in each industry experience different
level of pressures and competition and motivations for EM. This could be further
investigated in future research if there is sufficient data.
The main sample includes firms with different shareholding structure such as majority
state owned and majority family owned. The sample was not disaggregated into different
shareholding structure due to the small number of firms in the main sample. Future
research could investigate this further given ample data availability.
DAC can be income increasing or income decreasing. Some shareholders would support
income increasing while others would support income decreasing EM due to differing
incentives. A better analysis would have been to segregate the data into income
increasing and income decreasing DAC and test for SC separately for each component.
The study was unable to do this due to a small sample. Such analysis will produce better
results given a larger sample.
6.6 Conclusion
Despite the limitations, this study presents results which are vital to better understand
the nature of the SPSE companies. The results are useful to have a better understanding
of the lack of growth of the capital market. CG has always been an important factor to
ensure the growth of corporations and minimize issues which limits development. EM
may be good in some instances. However, mostly managers engage in EM due to agency

116
problems and self – interest attitudes. Current income (of self – interested parties) is
prioritized at the expense of the business survival. This problem is common and it leads
to further severe problems such as business fraud and the extreme is business collapse.
These need to be minimized. Hence it is vital to strengthen the CG policies and practice
of all SPSE companies and other organizations.
117
REFERENCE Adiel, R. 1996. Reinsurance and the management of regulatory ratios and taxes in the
property--casualty insurance industry. Journal of Accounting and Economics 22 (1-3):207-240.
Amat, O., and C. Gowthorpe. 2004. Creative accounting: nature, incidence and ethical issues. UPF Working Paper No. 749.
Anderson, R. C., S. A. Mansi, and D. M. Reeb. 2004. Board characteristics, accounting report integrity, and the cost of debt* 1. Journal of Accounting and Economics 37 (3):315-342.
ASX Corporate Governance Council. 2003. Principles of Good Corporate Governance and Best Recommendations: Australian Stock Exchange.
ASX Corporate Governance Council. 2007. Principles of Good Corporate Governance and Best Recommendations 2nd Edition: Australian Stock Exchange.
ATH. 2010. Annual Report: Amalgamated Telecom Holdings Limited. Bainimarama, C. J. V. 2011. PM Bainimaram - Address to Fiji Institute of Accounts 39th
Annual Congress. [cited 23/7/12 2012]. Available from www.fiji.gov.fj. Balsam, S., J. Krishnan, and J. Yang. 2003. Auditor industry specialization and earnings
quality. Auditing: A Journal of Practice & Theory 22 (2):71-97. Bar-Yosef, S., and A. Prencipe. 2009. Corporate Governance and Earnings Management
in Family-Controlled Companies: Universita Bocconi, Milan. Bartov, E., F. A. Gul, and J. S. L. Tsui. 2000. Discretionary-Accruals Models and Audit
Qualifications. Paper read at Nineth Annual Conference on Financial Economics and Accounting at Penn State, the University of Rchester.
Baselala, E. 2010. Ethics of Auditors. The Fiji Times, 12 June. Beasley, M. S. 1996. An Empirical Analysis of the Relation between the Board of
Director Composition and Financial Statement Fraud. The Accounting Review 71 (4):443-465.
Beatty, A., S. Chamberlain, and J. Magliolo. 1995. Managing financial reports of commercial banks: The influence of taxes, regulatory capital and earnings. Journal of Accounting Research 33 (2):231-261.
Becker, C. L., M. L. DeFond, J. Jiambalvo, and K. R. Subramanyam. 1998. The Effect of Audit Quality on Earnings Management*. Contemporary Accounting Research 15 (1):1-24.
Behn, B., A. L. Nagy, and R. Riley. 2002. The association between stock/compensation mix and earnings usefulness: University of Tennessee.
Beneish, M. D. 2001. Earnings management: A perspective. Managerial Finance 27 (12):3-17.
Bernard, V., and D. Skinner. 1996. What motivates managers' choice of discretionary accruals? Journal of Accounting and Economics 22:313-325.
Blake, J., J. Clarke, and C. Gowthorpe. 1998. The ethics of accounting regulation. Ethical issues in accounting: 6.
Blue Ribbon Committee. 1999. Report and Recommendations of the Blue Ribbon Committee on improving the effectiveness of corporate audit committees. New York Stock Exchange and the National Association of Securities Dealers.

118
Brewer, B. L., R. J. Angell, and R. D. Mautz Jr. 2002. The Proliferation of “Special” Accounting Items: A Threat to Corporate Credibility. Southern Business Review 28 (1):1-10.
Brickley, J. A., and C. M. James. 1987. The takeover market, corporate board composition, and ownership structure: The case of banking. Journal of Law and Economics 30 (1):161-180.
Broshko, E. B., and K. Li. 2006. Corporate Governance Requirements in Canada and the United States: A Legal and Empirical Comparison of the Principles-based and Rules-based Approaches. Canadian Investment Review forthcoming.
Brown, L. D. 1998. Managerial behavior and the bias in analysts' earnings forecasts.: Georgia State University.
Burgstahler, D. 1997. Incentives to manage earnings to avoid earnings decreases and losses: evidence from quarterly earnings.: University of Washington.
Burgstahler, D., and I. Dichev. 1997. Earnings Management to avoid earnings decreases and losses. Journal of Accounting and Economics 24:99 - 126.
Burgstahler, D., and M. Eames. 1998. Management of earnings and analyst forecasts: University of Washington.
Bushee, B. J. 1998. The Influence of Institutional Investors on Myopic R&D Investment Behavior. The Accounting Review 73 (3):305-333.
BusinessDictionary. 2011. emerging economies [cited 28/8/11 2011]. Available from http://www.businessdictionary.com/definition/emerging-economies.html.
Byrd Kent, A., and W. John. 1992. Do outside directors monitor managers?* 1:: Evidence from tender offer bids. Journal of Financial Economics 32 (2):195-221.
Cahan, S. 1992. The effect of antitrust investigations on discretionary accruals: A refined test of political cost hypothesis. The Accounting Review 67:77-95.
Caramanis, C., and C. Lennox. 2008. Audit effort and earnings management. Journal of Accounting and Economics 45 (1):116-138.
Cheffins, B. R. 2003. Will executive pay globalise along American lines? Corporate governance: an international review 11 (1):8-24.
Cheng, C. S. A., and A. Reitenga. 2009. Characteristics of Institutional Investors and Discretionary Accruals. International Journal of Accounting and Information Management 17 (1):5-26.
Chtourou, S. M., J. Bedard, and L. Courteau. 2001. Corporate Governance and Earnings Management: Universite Laval, Canada.
Clay, D. 2000. The effects of institutional investment on CEO compensation. In University of Southern California working paper.
Clikeman, P. M. 2003. Where auditors fear to tread. Internal Auditor 60 (4):75-79. CMDA. 2008. Corporate Governance Code for the Capital Markets. Capital Markets
Development Authority. Collins, J., D. Shackelford, and J. Wahlen. 1995. Bank differences in the coordination of
regulatory capital, earnings and taxes. Journal of Accounting Research 33 (2):263-291.
Core, J. E., R. W. Holthausen, and D. F. Larcker. 1999. Corporate governance, chief executive officer compensation, and firm performance. Journal of Financial Economics 51 (3):371-406.
119
Cornett, M. M., A. J. Marcus, and H. Tehranian. 2008. Corporate governance and pay-for-performance: The impact of earnings management. Journal of Financial Economics. 87: 357-373.
Dalton, D. R., C. M. Daily, J. L. Johnson, and A. E. Ellstrand. 1999. Number of directors and financial performance: A meta-analysis. Academy of Management journal. 42 (6): 674-686.
Davidson, R., J. Goodwin-Stewart, and P Kent. 2005. Internal Governance Structures and Earnings Management. Accounting and Finance 45 (July):241-267.
DeAngelo, L. E. 1981. Auditor size and auditor quality. Journal of Accounting and Economics 3:183-199.
———. 1986. Accounting Numbers as Market Valuation Substitutes: A Study of Management Buyouts of Public Stockholders. The Accounting Review LXI (3):400-420.
———. 1988. Managerial competition, information costs, and corporate governance: The use of accounting performance measures in proxy contests. Journal of Accounting and Economics 10 (3-36).
Dechow, P. M., and D. J. Skinner. 2000. Earnings Management: Reconciling the Views of Accounting Academics, Practitioners, and Regulators. Accounting Horizons 14 (2):235-250.
Dechow, P. M., R. G. Sloan, A. P. Sweeney. 1995. Detecting Earnings Management. The Accounting Review 70 (2):193-225.
———. 1996. Causes and Consequences of Earnings Manipulation: An Analysis of Firm Subjects to Enforcement Actions by the SEC. Contemporary Accounting Research 13 (1):1-36.
Dechow, P. M., and R. G. Sloan. 1991. Executive incentives and the horizon problem:: An empirical investigation. Journal of Accounting and Economics 14 (1):51-89.
DeFond, M. L., and J. Jiambalvo. 1994. Debt covenant effects and the manipulation of accruals. Journal of Accounting and Economics 17 (January ):145-176.
DeFond, M. L., and C. W. Park. 1997. Smoothing income in anticipation of future earnings. Journal of Accounting and Economics 23 (2):115-139.
DeFond, M. L., and K. R. Subramanyam. 1998. Auditor changes and discretionary accruals. Journal of Accounting and Economics 25 (1):35-67.
Degeorge, F., J. Patel, and R. Zeckhauser. 1999. Earnings Management to Exceed Thresholds. Journal of Business 72 (1):1-33.
Demsetz, H., and K. Lehn. 1985. The Structure of Corporate Ownership: Causes and Consequences. Journal of Political Economy 93 (6): 1155-1177.
DeZoort, F. T., and S. Salterio. 2001. The effect of corporate governance experience and financial reporting and audit knowledge on audit committe members' judgments. Auditing: A Journal of Practice & Theory 21 (fall).
Dhaliwal, D., V. Naiker, and F. Navissi. 2006. Audit Committee Financial Expertise, Corporate Governance and Accruals Quality: An Empirical Analysis: University of Arizona.
Dichev, I., D., Skinner. 2002. Large-sample evidence on the debt covenant hypothesis. Journal of Accounting Research 40:1091-1123.
Dignam, A., and M. Galanis. 2004. Australia Inside-Out: The Corporate Governance System of Australian Listed Market. Melbourne University Law Review 28 (3): 623-653.
120
Ding, Y., H. Zhang, and J. Zhang. 2007. Private vs State Ownership and Earnings Management: evidence from Chinese listed companies. Corporate Governance 15 (2):223-238.
Fama, E. F. 1980. Agency Problems and the Theory of the Firm. Journal of Political Economy 88 (2):288-307.
Fan, J. P. H., and T. J. Wong. 2002. Corporate ownership structure and the informativeness of accounting earnings in East Asia. Journal of Accounting and Economics. 33: 401-425.
Ferguson, M. J., G. S. Seow, and D. Young. 2004. Nonaudit Services and Earnings Management: UK Evidence*. Contemporary Accounting Research 21 (4):813-841.
Fiji People's Charter. 2011. Development of the Financial Services Sector People's Charter For Change, Peace & Progress [cited 28/08/11 2011]. Available from http://www.fijipeoplescharter.com.fj/wg5tor.htm.
Firth, M., P. M. Y. Fung, and O. M. Rui. 2002. Simultaneous Relationships among Ownership, Corporate Governance, and Financial Performance. Kowloon: The Hong Kong Polytechnic University.
Fleming, G. 2003. Corporate Governance in Australia. Agenda 10 (3):195-212. Francis, J. R., E. L. Maydew, and C. H. Sparks 1999. The role of Big 6 auditors in the
credible reporting of accruals. Auditing: A Journal of Practice and Theory 18:17-34.
Francis, J. R., and J. Krishnan. 1999. Accounting Accruals and Auditor Reporting Conservatism*. Contemporary Accounting Research 16 (1):135-165.
Frankel, R. M., M. F. Johnson, and K. K. Nelson. 2002. The relation between auditors' fees for nonaudit services and earnings management. Accounting Review:71-105.
FSC. 2010. Annual Report. Fiji Sugar Corporation. Gabrielsen, G., J. D. Gramlich, and T. Plenborg. 2002. Managerial Ownership,
Information Content of Earnings, and Discretionary Accruals in a Non-US Setting. Journal of Business Finance & Accounting 29 (7 & 8):967-988.
Gaver, J. J., K. M. Gaver, and J. R. Austin. 1995. Additional evidence on bonus plans and income management* 1. Journal of Accounting and Economics 19 (1):3-28.
Gerety, M., and K. Lehn. 1997. The Causes and Consequences of Accounting Fraud. Managerial and Decision Economics 18 (7/8):587-599.
Goodwin, J. 2003. The Relationship Between the Audit Committee and the Internal Audit Function: Evidence from Australia and New Zealand. International Journal of Auditing 7 (3):263-278.
Goodwin, J., and T. Y. Yeo. 2001. Two Factors Affecting Internal Audit Independence and Objectivity: Evidence from Singapore. International Journal of Auditing 5 (2):107-125.
Goodstein, J., K. Gautam, and W. Boeker. 1994. The effects of board size and diversity on strategic change. Strategic Management Journal. 15: 241-250.
Government of Fiji. 1985. Rev. Ed. Companies Act Chapter 247, Laws of Fiji. Republic of Fiji Islands.
Guay, W. R., S. P. Kothari, and R. L Watts. 1996. A Market Based Evaluation of Discretionary Accrual Models. Journal of Accounting Research 34 (Supplement):83-105.
121
Guidry, F., A. J. Leone, and S. Rock. 1999. Earnings-based bonus plans and earnings management by business-unit managers1. Journal of Accounting and Economics 26 (1-3):113-142.
Hartzell, J. C., and L. T. Starks. 2003. Institutional investors and executive compensation. The Journal of Finance 58 (6):2351-2374.
Healy, P. M. 1985. The Effect of Bonus Schemes on Accounting Decisions. Journal of Accounting and Economics 7:85-107.
Healy, P. M., and J. M. Wahlen. 1999. A Review of the Earnings Management Literature and its Implications for Standard Setting. Accounting Horizons 13 (4):365-383.
Holthausen, R., D. Larcker, and R. Sloan. 1995. Annual bonus schemes and the manipulation of earnings. Journal of Accounting and Economics 19:29-74.
Hribar, P., and C. Nichols. 2007. The use of unsigned earnings quality measures in tests of earnings management. Journal of Accounting Research 45 (5):1017-1053.
Institute of Internal Auditor. 1999. Definition of International Auditing: The Institute of Internal Auditors. Altamonte Springs. Florida.
Jensen, M. 1993. Modern industrial revolution, exit, and the failure of internal control systems. Journal of Finance 48:831-880.
Jones, J. J. 1991. Earnings Management During Import Relief Investigations. Journal of Accounting Research 29 (2):193-227.
Kang, S., and K. Sivaramakrishnan. 1995. Issues in Testing Earnings Management and an Instrumental Variable Approach. Journal of Accounting Research 33 (2):353-367.
Kaplan, R. S. 1985. COMMENTS ON PAUL HEALY Evidence on the Effect of Bonus Schemes on Accounting Procedure and Accrual Decisions. Journal of Accounting and Economics 7:109-113.
Kasznik, R. 1999. On the association between voluntary disclosure and earnings management. Journal of Accounting Research 37:57-81.
Key, K. G. 1997. Political cost incentives for Earnings Management in the cable television industry. Journal of Accounting and Economics 23 (3):309-337.
Kim, J., C. Liu, and S. G. Rhee. 2003. The Effect of Firm Size on Earnings Managemet: University of Hawai'i.
Kirkpatrick, G. 2009. The Corporate Governance Lessons from Financial Crisis. Financial Market Trends 2009/1.
Klein, A. 1998. Firm performance and board committee structure. Journal of Law & Economics 41:275-303.
———. 2002. Audit committee, board of director characteristics, and earnings management* 1. Journal of Accounting and Economics 33 (3):375-400.
Kosnik, R. D. 1987. Greenmail: A study of board performance in corporate governance. Administrative Science Quarterly:163-185.
Kothari, S. P., A. J. Leone, and C. E. Wasley. 2005. Performance matched discretionary accrual measures. Journal of Accounting and Economics 39:163-197.
Krishnan, G. V. 2003. Audit Quality and the Pricing of Discretionary Accruals. Auditing: A Journal of Practice & Theory 22 (March):109-126.
Laux, C., and V. Laux. 2007. Board Committees, CEO Compensation and Earnings Management.

122
Lee, C. I., S. Rosenstein, N. Rangan, and W. N. Davidson Iii. 1992. Board composition and shareholder wealth: The case of management buyouts. Financial Management:58-72.
Lehmann, E., and J. Weigand. 2000. Does the governed corporation perform better? Governance structures and corporate performance in Germany. European Finance Review. 4(2): 157-195.
Leuz, C., D. Nandab, and P. D. Wysockic. 2003. Earnings management and investor protection: an international comparison. Journal of Financial Economics 69 (3):505-527.
Liu, Q., and Z Lu. 2007. Corporate governance and earnings management in the Chinese listed companies: A tunneling perspective. Journal of Corporate Finance 13:881-906.
Lorsch, J. W., and E. MacIver. 1989. Pawns or potentates: The reality of America's corporate boards: Harvard Business Press.
Mace, M. L., ed. 1986. Directors: Myth and Reality Boston, MA: Harvard Business School Press.
Makhija, A. K. and J. M. Patton. 2004. The Impact of Firm Ownership Structure on Voluntary Disclosure: Empirical Evidence from Czech Annual Reports. Journal of Business 77 (3): 457- 491.
Mala, R., and M. White. 2006. Assessment of an Emerging Stock Market: The Case for Fiji's Stock Market. International Research Journal of Finance and Economics (6).
Mallin, C. A. 2010. Corporate Governance. 3 ed. New York: Oxford University Press. Marquardt, C. A., and C. I. Wiedman. 2004. How Are Earnings Managed? An
Examination of Specific Accruals. Contemporary Accounting Research 21 (2):461-491.
Marra, A., P. Mazzola, and A. Prencipe. 2011. Board Monitoring and Earnings Management Pre- and Post-IFRS. The International Journal of Accounting. 46: 205-230.
McMullen, D. A., and K. Raghunandan. 1996. Enhancing audit committee effectiveness. Journal of Accountancy 182:79-81.
McNichols, M., and G. P. Wilson. 1988. Evidence of Earnings Management from the Provision for Bad Debts. Journal of Accounting Research.
Menon, K., and J. Deahl Williams. 1994. The use of audit committees for monitoring. Journal of Accounting and Public Policy 13 (2):121-139.
Minow, N., and K. Bingham, eds. 1995. The Ideal Board. Moyer, S. 1990. Capital adequacy ratio regulations and accounting choices in
commercial banks. Journal of Accounting and Economics 12:123-154. Mulford, C., and E. Comiskey, ed. 2002. The financial numbers game: detecting
creative accounting practices: John Wiley & Sons Inc. Nelson, M. W., J. A. Elliott, and R. L. Tarpley. 2003. How are earnings managed?
Examples from auditors. Accounting Horizons 17:17-36. Ning, Y, W. N. Davidson III, and J. Wang. 2010. Does Optimal Corporate Board Size
Exist? An Empirical Analysis. Journal of Applied Finance 20 (2): 57-69. OECD. 2004. OECD Principles of Corporate Governance: Organisation for Economic
Co-operation and Development.
123
Park, Y. W., and H. H. Shin. 2004. Board composition and earnings management in Canada. Journal of Corporate Finance. 10: 431-457.
Patel, A. 2002. Corporate Governance in Private Sector: Ownership structure and the role of auditors. The Fiji Accountant (December):41-44.
Patton, A., and J. Baker. 1987. Why do not directors rock the boat. Harvard Business Review 65 (6):10-12.
Peasnell, K. V., P. F. Pope, and S. Young. 1998. Outside Directors, Board Effectiveness, and Earnings Management: Lancaster University.
———. 2005. Board Monitoring and Earnings Management: Do Outside Directors Influence Abnormal Accruals? Journal of Business Finance & Accounting 32 (7 & 8):1311-1346.
Perry, S., and T. Williams. 1994. Earnings management preceeding management buyout offers. Journal of Accounting and Economics 18:157-179.
Petroni, K. R. 1992. Optimistic reporting in the property-casualty insurance industry* 1. Journal of Accounting and Economics 15 (4):485-508.
Rahman, R. A., and F. H. M. Ali. 2006. Board, audit committee, culture and earnings management: Malaysian evidence. Managerial Auditing Journal. 21: 783-804.
Randøy, T., and J. I. Jenssen. 2004. Board independence and product market competition in Swedish firms. Corporate governance: an international review 12 (3):281-289.
Rangan, S. 1998. Earnings management and the performance of seasoned equity offerings1. Journal of Financial Economics 50 (1):101-122.
Rawlings, J. O. 1988. Applied Regression Analysis: A Research Tool. Belmont, CA: Wadsworth and Brooks.
Richardson, S. A., S. H. Teoh, and P. D. Wysocki. 1999. Tracking analysts' forecasts over the annual earnings horizon: Are analysts' forecasts optimistic or pessimistic?: University of Michigan.
Robins, F. 2006. Corporate Governance after Sarbanes - Oxley: an Australian Perspective. Corporate Governance. 6 (1): 34-48.
Sarbanes Oxley Act. 2002. One Hundred Seventh Congress of the United States of America An Act. Vice President of the United States and President of the Senate.
Sarkar, J., S. Sarkar, and K. Sen. 2008. Board of Directors and Opportunistic Earnings Management: Evidence from India. Journal of Accounting, Auditing and Finance:517-551.
Scarbrough, D. P., D. V. Rama, and K. Raghunandan. 1998. Audit committee composition and interaction with internal auditing: Canadian evidence. Accounting Horizons 12:51-62.
Schipper, K. 1989. COMMENTARY on Earnings Management. Accounting Horizons 3 (December):91-102.
Scholes, M., G. P. Wilson, and M. Wolfson. 1990. Tax planning, regulatory capital planning, and financial reporting strategy for commercial banks. Review of Financial Studies 3:625-650.
Shivdasani, A. 1993. Board composition, ownership structure, and hostile takeovers. Journal of Accounting and Economics 16 (1-3):167-198.
Shivdasani, A., and D. Yermack. 1999. CEO involvement in the selection of new board members: An empirical analysis. Journal of Finance:1829-1853.

124
Shleifer, A., and R. W. Vishny. 1997. A Survey of Corporate Governance. Journal of Finance 52 (2):737-783.
Singh, A. 2007. Analyses of Earnings Management Practices in SOEs, School of Accounting and Finance, University of the South Pacific, Suva.
Solomon, J., and A. Solomon, ed. 2004. Corporate Governance and Accountability: John Wiley & Sons Ltd.
SPSE. 2010. South Pacific Stock Exchange Listing Rules. South Pacific Stock Exchange. Suva. Fiji Islands.
SPSE. 2011. Annual Report. South Pacific Stock Exchange. SPSE. 2012. Mission/ Vision/ Values. South Pacific Stock Exchange 2012 [cited
06/06/2012]. Available from http://www.spse.com.fj/About-SPSE/Mission-Vison-Values.aspx.
Subramanyam, K. R. 1996. The pricing of discretionary accruals. Journal of Accounting and Economics 22:249-281.
Sweeney, A. P. 1994. Debt-covenant violations and managers' accounting responses. Journal of Accounting and Economics May:281-308.
Sykes, A. 2002. Overcoming Poor Value Executive Remuneration: resolving the manifest conflicts of interest. Corporate governance: an international review 10 (4):256-260.
Teoh, S. H., I. Welch, and T. J. Wong. 1998a. Earnings Management and the long-term market performance of intial public offerings. Journal of Finance 53 (December):1935-1974.
———. 1998b. Earnings Management and the underperformance of seasoned equity offerings. Journal of Financial Economics 50 (October):63-99.
Teshima, N., and A. Shuto. 2005. Managerial Ownership and Earnings Management: Theory and Evidence: Senshu University.
Vance, S. C., ed. 1983. Corporate Leadership Boards, Directors and Strategy. Edited by K. Davis, and F. Luthans: McGraw-Hill.
Wang, C. 2004. Ownership and operating performance of Chinese IPOs. Journal of Banking & Finance. 29: 1835-1856.
Weisbach, M. S. 1988. Outside directors and CEO turnover. Journal of Financial Economics 20:431-460.
Westphal, J. D., and E. J. Zajac. 1997. Defections from the inner circle: Social exchange, reciprocity, and the diffusion of board independence in US corporations. Administrative Science Quarterly:161-183.
Wild, J. J. 1996. The Audit Committee and Earnings Quality. Journal of Accounting, Auditing and Finance 11 (Spring):247-276.
Wu, Y. L. 2004. The impact of public opinion on board structure changes, director career progression, and CEO turnover: Evidence from CalPERS'corporate governance program. Journal of Corporate Finance 10 (1):199-227.
Xie, H. B., W. N. Davidson III, and P. J. DaDalt. 2003. Earnings Management and Corporate Governance: The Roles of the Board and the Audit Committee. Journal of Corporate Finance 9: 295-316.
Yatim, P. 2009. Board structures and the establishment of a risk management committee by Malaysian listed firms. Journal of Management & Governance 14 (1):17-36.
Yermack, D. 1996. Higher market valuation of companies with a small board of directors. Journal of Financial Economics 40 (2):185-211.

125
Yu, F. 2006. Corporate Governance and Earnings Management: University of Minnesota.
Zahra, S. A., and J. A. Pearce. 1989. Boards of directors and corporate financial performance: A review and integrative model. Journal of Management. 15(2): 291-334.
Zhuang, J., D. Edwards, D. Webb, and M. V. Capulong. 2000. CORPORATE GOVERNANCE AND FINANCE IN EAST ASIA A Study of Indonesia, Republic of Korea, Malaysia, Philippines, and Thailand. Vol. One: Asian Development Bank.
126
APPENDIX 1
My name is Dharmendra Naidu and I am an assistant lecturer in the School of
Accounting and Finance at USP. You are invited to participate in this survey, which is
part of my research study. The Purpose of this questionnaire is to collect information on
various aspects of corporate governance in an organization.
The questionnaire is organized in three parts. Part one collects information
regarding the Board of directors of the company. Part two comprises of a survey to
collect information on various aspects of an audit committee. Part three collects
information in regards to the various other aspects of corporate governance for example,
corporate governance committee and internal auditing.
Any information provided will be treated with strict confidence. Data will be
analyzed in aggregate form, held solely by the researcher and will not be used for any
other purpose.
It would be greatly appreciated if you could please fill the attached questionnaire.
Your time and cooperation in this study will be greatly appreciated.
Dharmendra Naidu [[email protected], Ph: 3232774]
Corporate Governance
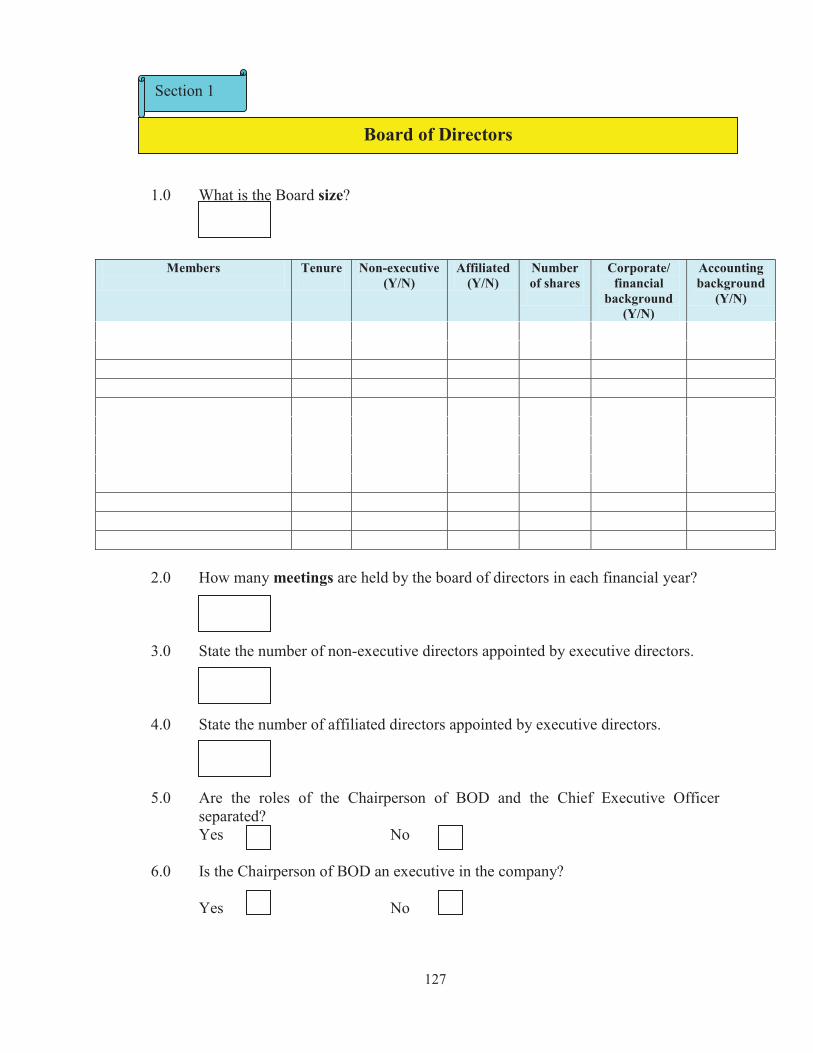
127
1. 1.0 What is the Board size?
Members
Tenure
Non-executive (Y/N)
Affiliated (Y/N)
Number of shares
Corporate/ financial
background (Y/N)
Accounting background
(Y/N)
2.0 How many meetings are held by the board of directors in each financial year? 3.0 State the number of non-executive directors appointed by executive directors. 4.0 State the number of affiliated directors appointed by executive directors. 5.0 Are the roles of the Chairperson of BOD and the Chief Executive Officer
separated? Yes No
6.0 Is the Chairperson of BOD an executive in the company?
Yes No
Section 1
Board of Directors
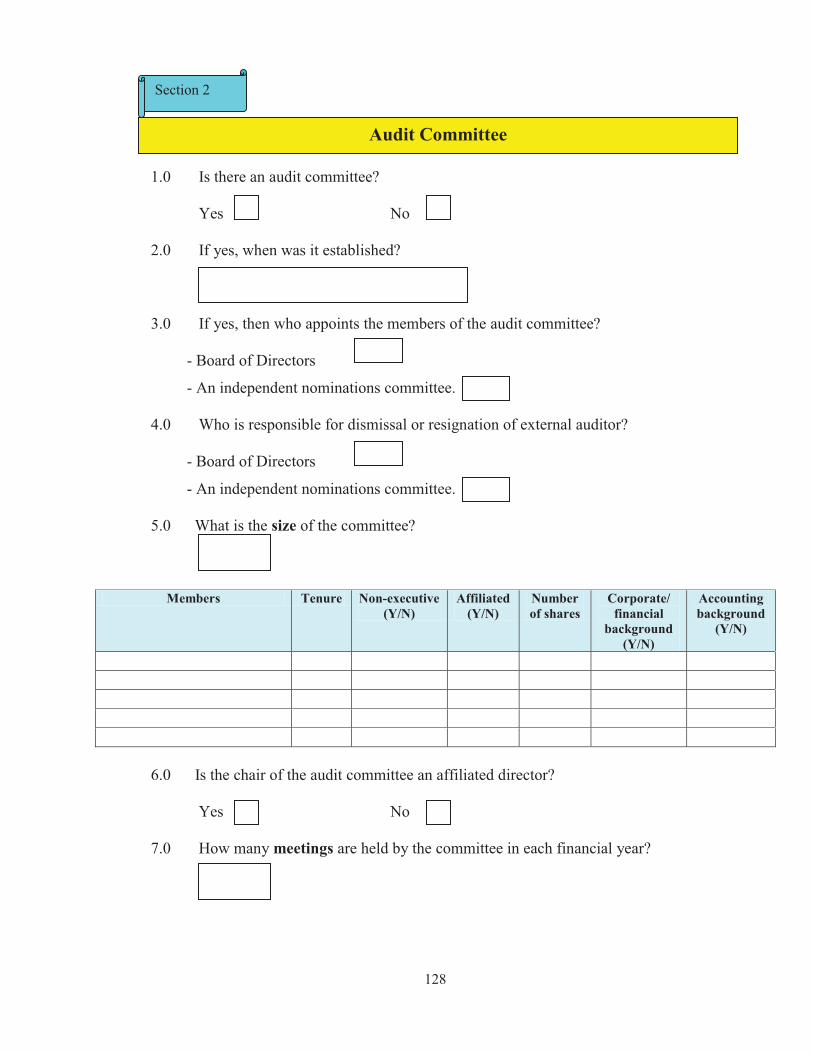
128
1.0 Is there an audit committee?
Yes No
2.0 If yes, when was it established? 3.0 If yes, then who appoints the members of the audit committee?
- Board of Directors
- An independent nominations committee. 4.0 Who is responsible for dismissal or resignation of external auditor?
- Board of Directors
- An independent nominations committee. 5.0 What is the size of the committee?
Members Tenure Non-executive (Y/N)
Affiliated (Y/N)
Number of shares
Corporate/ financial
background (Y/N)
Accounting background
(Y/N)
6.0 Is the chair of the audit committee an affiliated director?
Yes No 7.0 How many meetings are held by the committee in each financial year?
Section 2
Audit Committee

129
8.0 How many meetings does the audit committee have with the external auditor of the company in one financial year?
9.0 Does the audit committee have either joint or sole authorization to dismiss the
chief internal auditor?
Yes No
10.0 What are some of the major responsibilities of the Audit Committee in your company? ____________________________________________________________________________________________________________________________________________________________________________________________________________________________________________________________________

130
1.0 Does the company perform internal audits?
Yes No 2.0 If yes, in which year did internal auditing commence? 3.0 Who appoints the internal auditors? 4.0 Who are the internal auditors?
An internal audit team employed by the organization
Out-sourced from the external auditor
Out-sourced from other audit firms.
5.0 How many members are in the internal audit section? 6.0 For how many years does each member remain in the team (tenure)? 7.0 Whom does the internal auditor report to? 8.0 Does the company have any executive committee?
Yes No
8.1 Which year was this committee established?
8.2 What is the size of the committee?
Internal Audit and Corporate Governance Committee
Section 3

131
8.3 For how many years does each member remain in the committee (tenure)?
8.4 How many meetings are held by the committee in each financial year?
9.0 Does the company have any nomination committee?
Yes No
9.1 Which year was this committee established?
9.2 What is the size of the committee?
9.3 For how many years does each member remain in the committee (tenure)?
9.4 How many meetings are held by the committee in each financial year?
10.0 Does your Company have a risk management Committee?
Yes No
10.1 Which year was this committee established?
10.2 What is the size of the committee?
10.3 For how many years does each member remain in the committee
(tenure)?
10.4 How many meetings are held by the committee in each financial year?

132
11.0 Does the company have a Corporate Governance Committee? Yes No
11.1 Which year was this committee established?
11.2 What is the size of the committee?
11.3 For how many years does each member remain in the committee (tenure)?
11.4 How many meetings are held by the committee in each financial year?
12.0 Does the company have any compensation committee?
Yes No
12.1 Which year was this committee established?
12.2 What is the size of the committee?
12.3 For how many years does each member remain in the committee (tenure)?
12.4 How many meetings are held by the committee in each financial year?
12.5 Is the chair of the compensation committee an affiliated director? Yes No

133
13.0 Does the company have any disciplinary committee?
Yes No
13.1 Which year was this committee established?
13.2 What is the size of the committee?
13.3 For how many years does each member remain in the committee (tenure)?
13.4 How many meetings are held by the committee in each financial year?
14.0 Does the company have any public policy committee?
Yes No
14.1 Which year was this committee established?
14.2 What is the size of the committee?
14.3 For how many years does each member remain in the committee (tenure)?
14.4 How many meetings are held by the committee in each financial year?
15.0 Did the Board form any other sub-committee?
Yes No

134
16.0 Does the Chief Executive Officer own any shares in the Company?
Yes No
16.1 If yes, from which financial year the management started to own shares?
16.2 In total, how many shares are owned by the management?
17.0 Does any other employee own any shares in the company?
Yes No
17.1 If yes, from which financial year the employee started to own shares?
17.2 In total, how many shares are owned by the employee?
Thank You