Shared Spectrum Throughput for Secondary Users
24
Pratik Gandhi, Kavitha Chandra & Charles Thompson International Journal of Computer Networks (IJCN), Volume (6) : Issue (2) : 2014 26 Shared Spectrum Throughput for Secondary Users Pratik Gandhi [email protected] PhD student/ECE University of Massachusetts Lowell Lowell MA, 01854, USA Kavitha Chandra [email protected] Faculty/ ECE University of Massachusetts Lowell Lowell MA, 01854, USA Charles Thompson [email protected] Faculty/ ECE University of Massachusetts Lowell Lowell MA, 01854, USA Abstract The throughput performance of secondary users sharing radio spectrum with a licensed primary user is analyzed in this work. An asynchronous transmission, sensing and backoff protocol is proposed for the secondary user and modeled as a six state Markov process. The model parameters are derived as a function of the duty cycle and average duration that the channel is unoccupied by the primary user. The secondary user parameters include its continuous transmission duration or packet size and its backoff window size. The model results show that the probabilities of the secondary user being in the transmit state are relatively invariant to the duty cycle compared to the probability of being in the backoff state, particularly at low to moderate secondary packet sizes. The secondary user throughput is expressed as a function of the aforementioned parameters and shown to change significantly with duty cycle and secondary packet sizes. It is found that at very low duty cycles, the throughput variation is insensitive to backoff duration being random or fixed. The proposed transmission and sensing method is also shown to outperform a periodic sensing protocol. The regions of the parameter space wherein the backoff and retransmit probabilities of the secondary user are bounded by specified performance metrics are derived. The sensitivity of the throughput in the presence of a cooperative and non- cooperative secondary user is also investigated. Keywords: Spectrum Sharing, Cognitive Radio, Throughput, Licensed Users, Secondary Users. 1. INTRODUCTION Radio spectrum sharing between the licensed primary users (PU) also referred as incumbents and opportunistic secondary users (SU) has been examined from various performance, regulation and policy perspectives. Currently, the executive office of the President’s spectrum management team, the Federal Communication Commission (FCC) and the National Telecommunications and Information Administration are evaluating the feasibility of releasing spectrum in the 1695-1710, 1755-1850, 5350-5470 and 5850-5925 MHz bands for secondary usage [1]. The 2012 report [2] to the President from his council of advisors on science and technology recommended identification of 1000 MHz of Federal spectrum for sharing as well as a policy change from auctioning to sharing underutilized spectrum to the maximum extent consistent with the Federal mission. The report makes a strong case for migrating from an exclusive spectrum rights to a shared resource policy, one where novel approaches to spectrum management can lead to a more uniform utilization of the radio spectrum. To evaluate the effectiveness and potential advantage of spectrum sharing, the tradeoff between tolerable interference to PUs and capacity
-
Upload
cscjournals -
Category
Education
-
view
193 -
download
0
Transcript of Shared Spectrum Throughput for Secondary Users

Pratik Gandhi, Kavitha Chandra & Charles Thompson
International Journal of Computer Networks (IJCN), Volume (6) : Issue (2) : 2014 26
Shared Spectrum Throughput for Secondary Users
Pratik Gandhi [email protected] PhD student/ECE University of Massachusetts Lowell Lowell MA, 01854, USA
Kavitha Chandra [email protected] Faculty/ ECE University of Massachusetts Lowell Lowell MA, 01854, USA Charles Thompson [email protected] Faculty/ ECE University of Massachusetts Lowell Lowell MA, 01854, USA
Abstract The throughput performance of secondary users sharing radio spectrum with a licensed primary user is analyzed in this work. An asynchronous transmission, sensing and backoff protocol is proposed for the secondary user and modeled as a six state Markov process. The model parameters are derived as a function of the duty cycle and average duration that the channel is unoccupied by the primary user. The secondary user parameters include its continuous transmission duration or packet size and its backoff window size. The model results show that the probabilities of the secondary user being in the transmit state are relatively invariant to the duty cycle compared to the probability of being in the backoff state, particularly at low to moderate secondary packet sizes. The secondary user throughput is expressed as a function of the aforementioned parameters and shown to change significantly with duty cycle and secondary packet sizes. It is found that at very low duty cycles, the throughput variation is insensitive to backoff duration being random or fixed. The proposed transmission and sensing method is also shown to outperform a periodic sensing protocol. The regions of the parameter space wherein the backoff and retransmit probabilities of the secondary user are bounded by specified performance metrics are derived. The sensitivity of the throughput in the presence of a cooperative and non-cooperative secondary user is also investigated. Keywords: Spectrum Sharing, Cognitive Radio, Throughput, Licensed Users, Secondary Users.
1. INTRODUCTION
Radio spectrum sharing between the licensed primary users (PU) also referred as incumbents and opportunistic secondary users (SU) has been examined from various performance, regulation and policy perspectives. Currently, the executive office of the President’s spectrum management team, the Federal Communication Commission (FCC) and the National Telecommunications and Information Administration are evaluating the feasibility of releasing spectrum in the 1695-1710, 1755-1850, 5350-5470 and 5850-5925 MHz bands for secondary usage [1]. The 2012 report [2] to the President from his council of advisors on science and technology recommended identification of 1000 MHz of Federal spectrum for sharing as well as a policy change from auctioning to sharing underutilized spectrum to the maximum extent consistent with the Federal mission. The report makes a strong case for migrating from an exclusive spectrum rights to a shared resource policy, one where novel approaches to spectrum management can lead to a more uniform utilization of the radio spectrum. To evaluate the effectiveness and potential advantage of spectrum sharing, the tradeoff between tolerable interference to PUs and capacity

Pratik Gandhi, Kavitha Chandra & Charles Thompson
International Journal of Computer Networks (IJCN), Volume (6) : Issue (2) : 2014 27
available for SUs should be understood, taking into consideration the diverse parameters governing frequency bands, transmission and receiver characteristics. Dynamic spectrum allocation (DSA) has been investigated in the context of spectrum sensing with cognitive radios [3][4][5] and through the use of geolocation databases to detect primary users [6][7][8]. The IEEE 802.22 [9] standard designed for sharing the whitespace generated by transition to digital TV recommends that SUs determine channel availability by querying a database that records the activity of the licensed users at required space and time instants. The decision to use a database driven approach was the result of concerns by the FCC on the harmful interference that could result from the uncertainty of sensing based decisions. The standard however includes allowance for a quiet period during which the SU suspends operation and the physical layer performs channel sensing. Spectrum sensing and database query to identify the presence of the primary user can be construed as two extreme approaches, the former operating with minimal knowledge about the PU and the latter assuming complete knowledge. To enable a more elastic spectrum utilization model, one that accommodates primary users that may operate on a random access basis, it is important to identify those access parameters that have the most impact on the spectrum sharing paradigm. These parameters may be drawn from across the layers of the primary user communications stack and applied to better understand how knowledge of the primary user behavior by cognitive radios can help optimize the coexistence of secondary users and primary transmissions. In [10], a channel sensing scheme based on primary users channel access pattern was found to result in lower ideal channel search delay and higher performance compared to the random channel sensing scheme. Wang et al. [11] show the importance of observing PU’s on-off behavior to make a prediction about channel availability to achieve higher secondary throughput. Analysis of protocol and parameter compatibility between primary and secondary users can lead regulators to make well-informed decisions on which the under-utilized licensed applications and bands may be suitable for spectrum sharing. The duty cycle that characterizes the channel usage of a primary user is recognized as an important parameter that governs the viability of a particular licensed band for spectrum sharing. Chang et al. [12] show that even with a duty cycle as high as fifty percent, the spectrum sensing performance using energy, waveform and cyclostationary detection degrades significantly. However, primary users with low duty cycles are expected to be good candidates for sharing spectrum and therefore efficient methods to identify and utilize the durations when PUs are not occupying the channel are quite important. Gabran et al. [13] presented methods for the joint estimation of the primary user traffic parameters, including the average duty cycle and quantified the estimation error and its impact on spectrum sensing performance. Kim and Shin [14] investigated sensing at the medium access control (MAC) layer and showed that the sensing duration could be optimized to maximally identify available spectrum considering the probability distributions of the on-off alternating renewal processes that characterized the PU activity. The application of a cross-layer approach, beginning with joint MAC and physical layer functions has the potential to afford significant spectrum sharing gains. Zheng et al. [15] compare the throughput performance of SU’s for both the layered and cross-layered approaches and show that the SU throughput is nearly doubled when spectrum sensing at the physical layer is integrated with the medium access protocol at the higher layer. A survey of medium access protocols for cognitive radios (CR) is given in [16], where random access, time slotted and hybrid MAC protocols are classified for cognitive radio infrastructure-based and ad hoc networks. The optimization of spectrum sensing and transmission duration so as to maximize the SU throughput while minimizing interference to the PU is the key objective of CR-MAC protocols. Previous work in this area has considered finding the optimal operating region for transmission and sensing times as a function of the probability of PU being on or off [17], optimizing transmission duration while keeping the sensing period fixed [18] or finding the optimum sensing period given a fixed transmission duration [19]. The work presented here demonstrates operating regions considering both PU and SU access parameters. In particular, it determines how small the PU duty cycle has to be to obtain a useful

Pratik Gandhi, Kavitha Chandra & Charles Thompson
International Journal of Computer Networks (IJCN), Volume (6) : Issue (2) : 2014 28
SU throughput and how the transmission window size of the SU affects the system performance. The channel sharing is analyzed assuming complete knowledge of the PU access patterns, which is assumed to be an on-off Markov chain. The SU access pattern with the knowledge of PU parameters is represented by a six state Markov chain and includes the functions of spectrum sensing, transmission and backoff when the channel is occupied. This approach is shown to provide the optimal SU transmission frame sizes, corresponding throughput and operating regions based on performance specifications that bounding the probabilities of SU occupying backoff, transmit and retransmit states. Section 2 presents a MAC layer model for the secondary users considering a fixed backoff window and derives the SU state probabilities for a range of PU duty cycles. The SU throughput is derived in Section 3. Section 4 compares the model with results from simulation. The effect of randomly distributed backoff windows on the SU throughput is presented in Section 5. The performance with two secondary users is analyzed in Sections 6 and 7 assuming the case of a cooperative and a non-cooperative user respectively. Section 8 concludes the paper.
2. TIME-SLOTTED MAC LAYER MODEL FOR THROUGHPUT OF
SECONDARY USERS
The PU channel usage is described using a two state discrete time Markov chain , n=1, 2… where n is the slotted time index. The two states referred as on and off states represent respectively, the times when the PU is utilizing the spectrum or when the channel is available for sharing. The average durations of the on and off periods are represented by and
respectively. The PU changes from the on to off state with probability β and from the off to on state with probability α. Assuming that the on and off durations are represented as geometrically distributed random variables, the average on and off periods are related to the transition probabilities as and . Of interest are the average duty cycle of the PU
and the sensitivity of the SU throughput performance to this
parameter. The SU model presented here extends the authors’ previous work [20] on modeling sensing and transmission probabilities to include a theoretical analysis of the SU throughput performance, randomly distributed backoff window sizes and the performance impact of non-cooperative secondary users. The model that approximates a MAC layer function includes transmission, backoff and channel sensing states. The sensing state incorporates information communicated from the PHY layer on channel availability at the requested time-slot. The objective is to determine an optimal operating space delineated by the PU parameters, , the backoff
window bwin, the SU transmission duration or packet size and the throughput . A
continuous stream of SU transmission frames is assumed to be queued and available, thus operating in what is referred as a saturation mode. It is also assumed that no packets are dropped and as many retransmissions necessary for an error-free transmission are carried out, thus providing an upper bound to the delay experienced by an opportunistic SU.
Pratik Gandhi, Kavitha Chandra & Charles Thompson
International Journal of Computer Networks (IJCN), Volume (6) : Issue (2) : 2014 29
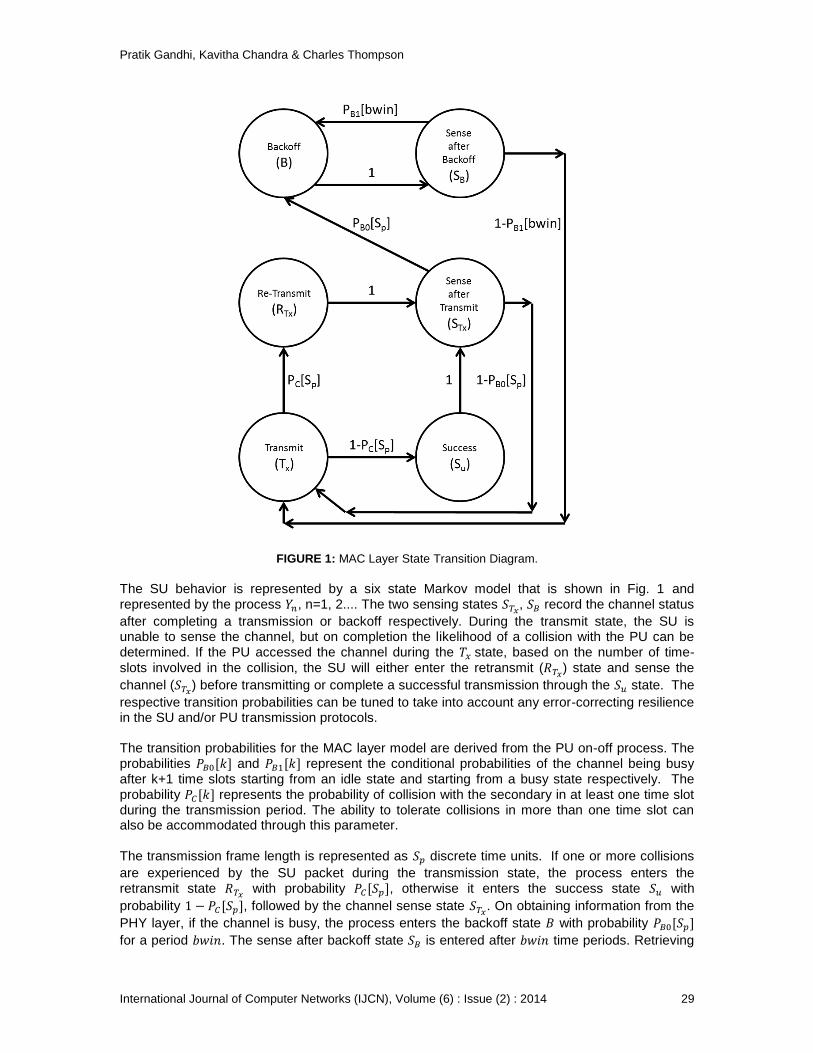
FIGURE 1: MAC Layer State Transition Diagram.
The SU behavior is represented by a six state Markov model that is shown in Fig. 1 and represented by the process , n=1, 2.... The two sensing states
, record the channel status
after completing a transmission or backoff respectively. During the transmit state, the SU is unable to sense the channel, but on completion the likelihood of a collision with the PU can be determined. If the PU accessed the channel during the state, based on the number of time-
slots involved in the collision, the SU will either enter the retransmit ( ) state and sense the
channel ( ) before transmitting or complete a successful transmission through the state. The
respective transition probabilities can be tuned to take into account any error-correcting resilience in the SU and/or PU transmission protocols. The transition probabilities for the MAC layer model are derived from the PU on-off process. The probabilities and represent the conditional probabilities of the channel being busy after k+1 time slots starting from an idle state and starting from a busy state respectively. The probability represents the probability of collision with the secondary in at least one time slot during the transmission period. The ability to tolerate collisions in more than one time slot can also be accommodated through this parameter. The transmission frame length is represented as discrete time units. If one or more collisions
are experienced by the SU packet during the transmission state, the process enters the retransmit state
with probability , otherwise it enters the success state with
probability , followed by the channel sense state . On obtaining information from the
PHY layer, if the channel is busy, the process enters the backoff state with probability
for a period . The sense after backoff state is entered after time periods. Retrieving

Pratik Gandhi, Kavitha Chandra & Charles Thompson
International Journal of Computer Networks (IJCN), Volume (6) : Issue (2) : 2014 30
channel information from the PHY layer, if the channel is busy, the system backs off with probability . If the channel is free the packet transmit state is initiated with probability
. The state transition matrix , representing the SU dynamics is given as,
(1) The state representing successful packet transmission is introduced here to distinguish entry
into the sense after transmit ( ) state after a successful packet transmission or through
retransmit ( ) state after a collision with the primary. The two sensing states, allow the
evaluation of suitable ( ) parameters for a particular PU duty cycle.
The transition probabilities, , , are derived from the two state Markov chain
descriptor of the primary channel [21]. The n-step transition probability matrix for the PU with elements
representing the probability of transition from state to state in n steps is as
follows:
(2)
With respect to , the transition probabilities and are given as,
(3)
(4) The collision probability defined as the probability of collision in at least one out of a total of
time slots is given as,
(5)
where represents the probability of the PU being in the on-state for contiguous time
steps. It is seen that the collision probability depends only on , and hence on the average
off duration of the primary user. A symbolic representation of the steady state probability vector
as obtained from given in Eqn. 1 leads to the following
probabilities,
(6)
(7)

Pratik Gandhi, Kavitha Chandra & Charles Thompson
International Journal of Computer Networks (IJCN), Volume (6) : Issue (2) : 2014 31
(8)
(9)
with and
.
Examining the steady state probabilities, it is seen that the dependence on arises from the
terms and . From Eqns. 6-8, one can obtain the system parameters that
satisfy specified performance constraints. For example, if the ratio of retransmission to transmission rate
is to be bounded by
, the relation between and can be
derived from 7 and 8 as,
(10) If the ratio
of the transmit and backoff state probabilities is to be constrained, the
backoff window size that can achieve this can be obtained as a function of the duty cycle and the packet size parameters as,
(11)
3. THROUGHPUT ANALYSIS FOR SECONDARY USERS
An important performance parameter is the throughput of the secondary user and the variability of this metric with parameters and for a specified . Given the secondary user dynamics
through , the mean time taken to transmit a secondary user packet successfully is derived. The number of visits to the backoff and transmit states before exiting through the success state determines the time spent in successful transmission of a SU packet. To enable this computation,
the state is taken to be an absorbing state in a modified Markov chain . The corresponding
transition probability matrix is,
(12)
In this representation, the five states
are the transient states and is the
absorbing state. The matrix can be represented in terms of the matrix of transient states and vector with elements that are one-step probabilities of reaching the absorbing state from each of the transient states.
(13) where

Pratik Gandhi, Kavitha Chandra & Charles Thompson
International Journal of Computer Networks (IJCN), Volume (6) : Issue (2) : 2014 32
with and containing zero and unit element values respectively. The n-step transition probabilities of are,
(14)
In the limit as , and .
The elements of matrix have particular significance for computing the average time before
absorption starting from a particular transient state. The element of , represents the
expected number of visits to state , starting from state prior to absorption. Consider . The element of given by
represents the probability of transitioning to
state at the transition starting from an initial state . Let be a positive valued random
variable that represents the number of visits to state from state . The occupancy of state can
take place at the transition. The random variable takes a value of one if
the process transitions to state from state at the transition and zero otherwise. The probability that
is . The expected number of transitions to state from state can
be represented as
(15) Note that represents the element of matrix . Therefore, the sum of the elements in
each row of , provides the expected time before absorption starting from state . A symbolic calculation of leads to the following expressions for each row, where the subscript signifies the starting state.
Pratik Gandhi, Kavitha Chandra & Charles Thompson
International Journal of Computer Networks (IJCN), Volume (6) : Issue (2) : 2014 33
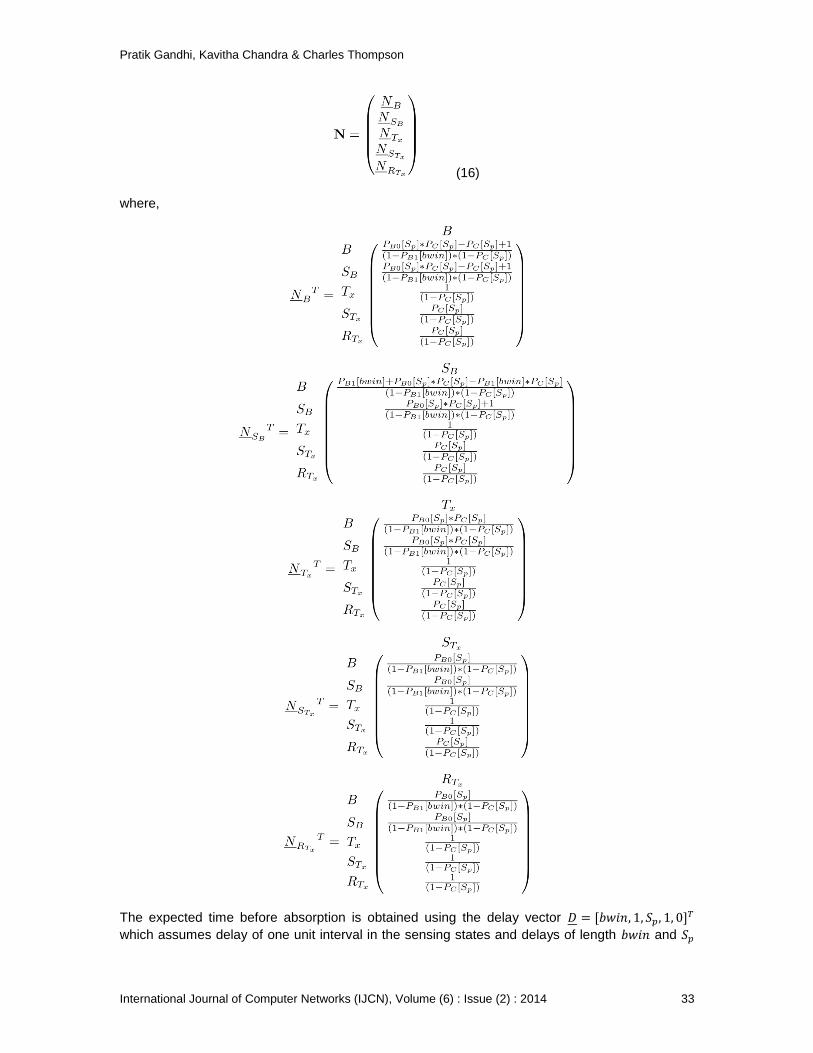
(16)
where,
The expected time before absorption is obtained using the delay vector
which assumes delay of one unit interval in the sensing states and delays of length and

Pratik Gandhi, Kavitha Chandra & Charles Thompson
International Journal of Computer Networks (IJCN), Volume (6) : Issue (2) : 2014 34
each time the process enters the backoff and transmit states respectively. After successful transmission, the process always starts from the
state. Therefore the expected time to reach
the success state, denoted as can be calculated as follows:
(17)
The throughput, for the secondary packet transmission with packet size is therefore,
(18)
The next section discusses the results and compares the theoretical model derived in this section with a simulation study.
4. THROUGHPUT ANALYSIS FOR SECONDARY USERS
In this section, the performance of sensing and transmission is analyzed for three duty cycles of the primary user: . The average off duration is fixed at and is
determined using . The secondary packet size is nondimensionalized as
and varied such that
. The nondimensionalized backoff window size is
. A simulation of the protocol is carried out to verify the theoretically derived
steady state probabilities given in Eqns. (6-9). A discrete time simulation evolves the primary user in time n=1,2,... as a Markov process , with indicating channel free and occupied
states. The SU is represented by the random process which is evolved in time using state dependent decisions based on the channel state and packet error conditions. The simulation is run for 10
5 successful packet transmissions. The model generated results are shown in solid lines
and the simulation results are shown by symbols. The variation of the transition probability given in Eqn. 4 as a function of and
is shown as a contour plot in Fig. 2. It can be seen that for low duty cycle, approaches
a constant equal to as the backoff window size is increased. To utilize this invariant feature, a backoff window size of will be used, allowing one to approximate for
the range of considered. Figs. [3-6] show the variation of the SU steady-state probabilities of being in the backoff, transmit, retransmit and success states respectively as a function of
with . The results are
shown for and . The model and simulation results show a good agreement for
all cases. The backoff probability increases with increase in duty cycle and becomes invariant for large values of
. As increases, approaches and tends to unity from Eqn.
3 and 5 respectively. In this regime, . At 20% duty
cycle the SU has 7% probability of being in the backoff state as approaches one and thus
equal to the average off duration of the PU, whereas this probability remains at 0.5% for across the range of
considered.

Pratik Gandhi, Kavitha Chandra & Charles Thompson
International Journal of Computer Networks (IJCN), Volume (6) : Issue (2) : 2014 35
FIGURE 2: Contour plots of .
FIGURE 3: Analytical and simulation results for with fixed .
0.1
0.1 0.1 0.10.2
0.2 0.2 0.2
0.3
0.3 0.3 0.3
0.4
0.4
0.40.4 0.4
0.5
0.5
0.5
0.6
0.6
0.6
0.7
0.7
0.7
0.8
0.8
0.8
0.9
0.9
bwin*
Duty
cycle
0.5 1 1.5 2 2.5 3 3.5 4 4.5 5
0.05
0.1
0.15
0.2
0.25
0.3
0.35
0.4
0.45
0 0.1 0.2 0.3 0.4 0.5 0.6 0.7 0.8 0.9 10
0.01
0.02
0.03
0.04
0.05
0.06
0.07
0.08
Sp
*
B
Dc: 0.10
Dc: 0.20
Dc: 0.01

Pratik Gandhi, Kavitha Chandra & Charles Thompson
International Journal of Computer Networks (IJCN), Volume (6) : Issue (2) : 2014 36
In Fig. 4 the probability of being in the transmit state is depicted for the three values of duty
cycle and as a function . This represents also the probability of being in the sense-after-
transmit state . The level decrease in these probabilities as the duty cycle is increased results
from the denominator term in Eqn. 8 which is a function of that increases with , and
is constant due to fixed . As the duty cycle increases, the secondary users will tend to enter the backoff state more often than the transmit state and hence the observed decrease in the transmission state probabilities. But it is important to note that because the probabilities of being in the backoff state are nearly an order of magnitude smaller than that of being in the transmit state, the dynamic range of the transmit probabilities as the duty cycle decreases from 0.2 to 0.01 is also quite small. For the parametric range considered, the SU operates around a thirty percent probability in the transmission state, and an equal probability of being in the sense after transmit state.
FIGURE 4: Analytical and simulation results for
with fixed .
In Fig. 5, the probability of being in the retransmit state is depicted with change in the duty cycle. These probabilities decrease with an increase in the duty cycle for a fixed
, similar to the results
for the transmission probability in Fig. 4. However, the retransmit probability for a fixed duty cycle increases with
due to increased number of packet errors from collision with the primary users,
as the SU packet size increases. For small values, the retransmit probability exhibits
minimal sensitivity to the duty cycle.
0 0.1 0.2 0.3 0.4 0.5 0.6 0.7 0.8 0.9 1
0.29
0.295
0.3
0.305
0.31
0.315
0.32
0.325
0.33
0.335
Sp
*
T
x
Dc: 0.20
Dc: 0.10
Dc: 0.01

Pratik Gandhi, Kavitha Chandra & Charles Thompson
International Journal of Computer Networks (IJCN), Volume (6) : Issue (2) : 2014 37
FIGURE 5: Analytical and simulation results for
with fixed .
FIGURE 6: Analytical and simulation results for
with fixed .
In Fig. 6, the probability of entering the success state decreases with an increase in the duty cycle and with increase in
and exhibits the most dynamic range among the state probabilities
of the SU dynamics.
0 0.1 0.2 0.3 0.4 0.5 0.6 0.7 0.8 0.9 10
0.05
0.1
0.15
0.2
0.25
Sp
*
R
Tx
Dc: 0.01
Dc: 0.20
Dc: 0.10
0 0.1 0.2 0.3 0.4 0.5 0.6 0.7 0.8 0.9 10.1
0.15
0.2
0.25
0.3
0.35
Sp
*
S
u
Dc: 0.01
Dc: 0.10
Dc: 0.20

Pratik Gandhi, Kavitha Chandra & Charles Thompson
International Journal of Computer Networks (IJCN), Volume (6) : Issue (2) : 2014 38
FIGURE 7: Analytical and simulation results for the secondary throughput with fixed .
The throughput calculated from simulation by estimating the average time taken for a successful packet transmission denoted as is
(19)
This is compared in Fig. 7 with the theoretical result shown in Eqn. 18 for the range of duty cycles considered. A maximum throughput of 70% is observed at the lowest of 0.01, the peak
value occurring at a transmit frame size 0.2. With increase in , the peak throughput
decreases to 40% and 30% for =0.1 and 0.2 respectively, while allowing the SU to operate at
higher values of .
5. THROUGHPUT ESTIMATION FOR RANDOM BACKOFF WINDOWS
In this section, the backoff window is taken to be a random variable drawn from uniform and exponential probability distributions with expected values equal to . For the case of uniformly
distributed window sizes, ranges from 0 to 4* and in the case of an exponential
distribution ranges from to . When the SU enters the backoff state ( ), it randomly selects a waiting period drawn from the prescribed distribution. The other parameters such as
and are varied in the same way as for the fixed backoff case. The probability of collision with
the primary transmission during the secondary transmit state ( ) and the probability of the
channel being busy after transitions starting from an idle state ( ) remain the same
as in the case of the fixed backoff window. However, the probability of the channel being busy after transitions starting from a busy state ( ) now becomes a function of the
random variable .
The expected value of , denoted as is applied in the transition probability calculation for the secondary user Markov chain, where,
0 0.1 0.2 0.3 0.4 0.5 0.6 0.7 0.8 0.9 10.1
0.2
0.3
0.4
0.5
0.6
0.7
0.8
Sp
*
Thro
ughput
Dc: 0.01
Dc: 0.10
Dc: 0.20
Pratik Gandhi, Kavitha Chandra & Charles Thompson
International Journal of Computer Networks (IJCN), Volume (6) : Issue (2) : 2014 39
(20)
(21) The six-state model, the one-step transition probability matrix ( ) and the steady state
probability vector,
, remain the same as the fixed backoff window
case except, for being replaced by .
Theoretically, the throughput is calculated by replacing with in the
fundamental matrix given in Eqn. 16, and using the expected value in the delay
vector such that .
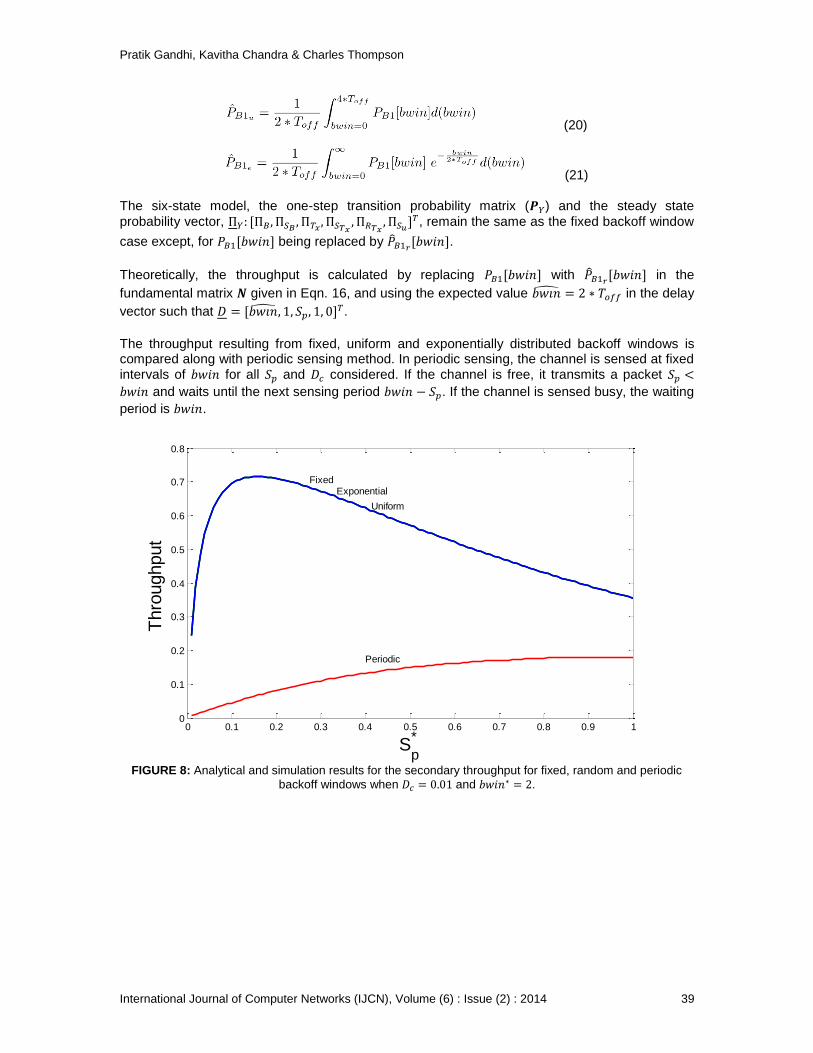
The throughput resulting from fixed, uniform and exponentially distributed backoff windows is compared along with periodic sensing method. In periodic sensing, the channel is sensed at fixed intervals of for all and considered. If the channel is free, it transmits a packet
and waits until the next sensing period . If the channel is sensed busy, the waiting
period is .
FIGURE 8: Analytical and simulation results for the secondary throughput for fixed, random and periodic
backoff windows when and .
0 0.1 0.2 0.3 0.4 0.5 0.6 0.7 0.8 0.9 10
0.1
0.2
0.3
0.4
0.5
0.6
0.7
0.8
Thro
ughput
Sp
*
Periodic
FixedExponential
Uniform

Pratik Gandhi, Kavitha Chandra & Charles Thompson
International Journal of Computer Networks (IJCN), Volume (6) : Issue (2) : 2014 40
FIGURE 9: Analytical and simulation results for the secondary throughput for fixed, random and periodic
backoff windows when and .
Figs. 8 and 9 depict the SU throughput for the fixed, random and periodic backoff or sensing cases for and respectively. At the low PU duty cycle, random backoff
windows have negligible effect on the throughput compared to a fixed . As the duty cycle
increases, for . The throughput due to random backoff windows decreases from the fixed backoff window model by about 5%. The asynchronous sensing generated by the proposed model is found to perform significantly better than the periodic sensing at , for which the peak throughput is reduced to less than twenty percent. The combined effect of SU and PU parameters on the SU throughput can be visualized through contour plots of as a function of
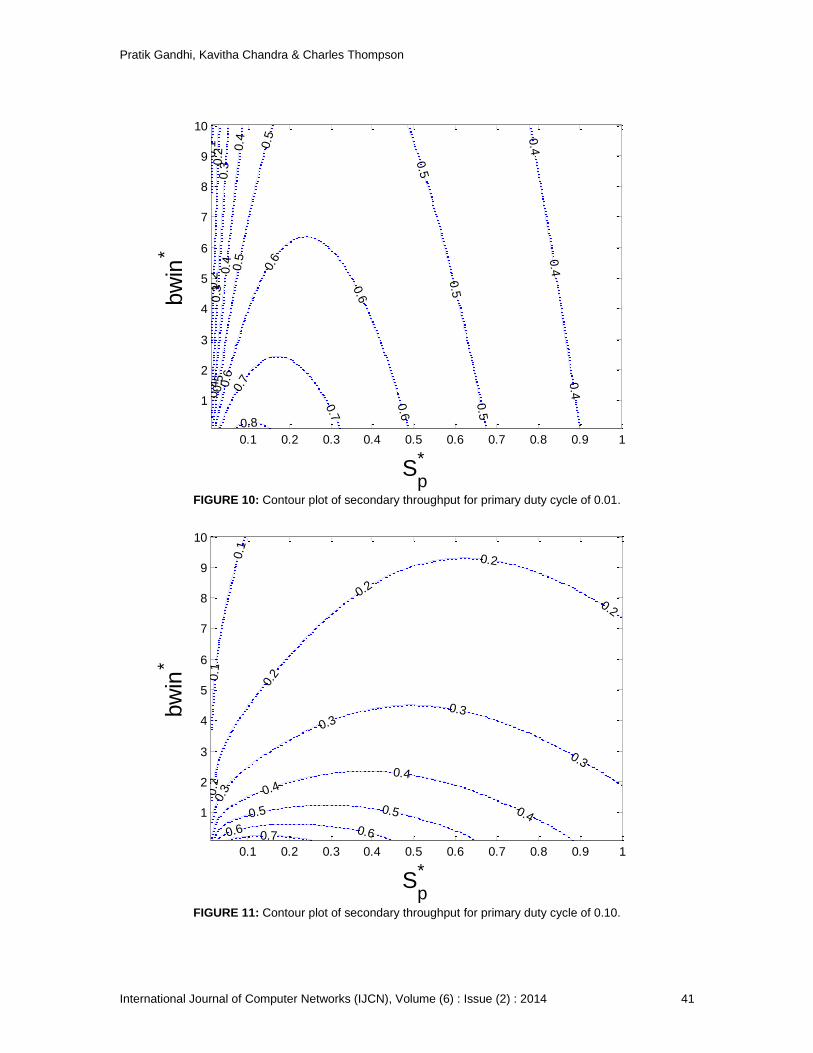
and . Figs. 10, 11 and 12 depict the performance for
duty cycles of 0.01, 0.10 and 0.20 respectively considering uniformly distributed backoff windows. These results show that SU throughput in the range of 70-80% can be achieved with
and for . For the operating region is reduced to
and to for . Since and are normalized with PU's
, increase in reduces and which results in higher SU's throughput verified using
contour plots.
0 0.1 0.2 0.3 0.4 0.5 0.6 0.7 0.8 0.9 10
0.05
0.1
0.15
0.2
0.25
0.3
0.35
Sp
*
Thro
ughput
Fixed
Exponential
Uniform
Periodic
Pratik Gandhi, Kavitha Chandra & Charles Thompson
International Journal of Computer Networks (IJCN), Volume (6) : Issue (2) : 2014 41
FIGURE 10: Contour plot of secondary throughput for primary duty cycle of 0.01.
FIGURE 11: Contour plot of secondary throughput for primary duty cycle of 0.10.
0.1
0.2
0.2
0.3
0.3
0.4
0.4
0.4
0.4
0.4
0.40
.5
0.5
0.5
0.5
0.5
0.5
0.6
0.6
0.6
0.6
0.7
0.7
0.8
Sp
*
bw
in*
0.1 0.2 0.3 0.4 0.5 0.6 0.7 0.8 0.9 1
1
2
3
4
5
6
7
8
9
10
0.1
0.1
0.2
0.2
0.2
0.2
0.2
0.3
0.30.3
0.3
0.4
0.4
0.4
0.5 0.5
0.6 0.60.7
Sp
*
bw
in*
0.1 0.2 0.3 0.4 0.5 0.6 0.7 0.8 0.9 1
1
2
3
4
5
6
7
8
9
10

Pratik Gandhi, Kavitha Chandra & Charles Thompson
International Journal of Computer Networks (IJCN), Volume (6) : Issue (2) : 2014 42
FIGURE 12: Contour plot of secondary throughput for primary duty cycle of 0.20.
Feasible operating regions in the space of
are identified so as to satisfy performance
requirements such as:
and
. This ensures that collision with the
primary is reduced, while ensuring that the quality of service to the secondary is maintained through the transmission probability. This performance is analyzed in the limit of large backoff window size , which results in from Eqn. 4. This limit yields the following expressions for the backoff, transmission, retransmission and success probabilities,
(22)
(23)
(24)
(25) In Figs. 13-15 a contour plot of
is shown as a decreasing solid (red) line starting from
the top left corner and is shown as an increasing solid (black) line starting from the
bottom left corner with increasing . These boundaries are derived from Eqns. 26 and 27
respectively. Eqn. 26 is from Eqns. 22 and 23, and Eqns. 22 and 24 yields Eqn. 27. The
boundary delineates the constraint in the region above the red line and
in the
region below the red line. The black line also divides the space of
into regions
0.1
0.1
0.2
0.20.2
0.2
0.3
0.3 0.3
0.30.4
0.4
0.40.5 0.50.6
Sp
*
bw
in*
0.1 0.2 0.3 0.4 0.5 0.6 0.7 0.8 0.9 1
1
2
3
4
5
6
7
8
9
10

Pratik Gandhi, Kavitha Chandra & Charles Thompson
International Journal of Computer Networks (IJCN), Volume (6) : Issue (2) : 2014 43
where below the line and
above the line. The vertical green line, which is
independent of as per Eqn. 28 represents the case where
derived from Eqns. 24
and 25 which yield Eqn. 28. On the left side of this line,
, and on the right side
. Thus the feasible operating region as per the performance constraints is in the region
bounded by three contours and the vertical axis.
(26)
(27)
(28)
FIGURE 13: Contours of and
and operating regions bounded by and
with
.
0 0.1 0.2 0.3 0.4 0.5 0.6 0.7 0.8 0.9 10
0.1
0.2
0.3
0.4
0.5
0.6
0.7
0.8
0.9
1
0.0
4
0.0
4
0.04
0.0
8
0.0
8
0.1
2
0.12
0.160.1
0.1
0.10.1
0.2
0.2
0.2
0.2
0.3
0.3
0.3
0.40.4
0.4
0.5 0.5 0.5
Sp
*
Duty
cycle
R
Tx
S
u
= R
Tx
B =
RTx
B =
Tx
B

Pratik Gandhi, Kavitha Chandra & Charles Thompson
International Journal of Computer Networks (IJCN), Volume (6) : Issue (2) : 2014 44
FIGURE 14: Contour of and
and operating regions bounded by and
with .
FIGURE 15: Contour of and
and operating regions bounded by and
with .
From the results shown in Fig. 13, 14 and 15, one can determine the operating regions of and
that will satisfy the given performance metrics.
0 0.1 0.2 0.3 0.4 0.5 0.6 0.7 0.8 0.9 10
0.1
0.2
0.3
0.4
0.5
0.6
0.7
0.8
0.9
1 0.050.1
0.1
0.15
0.15
0.2
0.2
0.2
5
0.25
0.3
0.3
0.3
Sp
*
Duty
cycle
S
u
= R
Tx
B =
RTx
B =
Tx
T
x
0 0.1 0.2 0.3 0.4 0.5 0.6 0.7 0.8 0.9 10
0.1
0.2
0.3
0.4
0.5
0.6
0.7
0.8
0.9
10.05
0.05
0.1
0.1
0.1
5
0.1
5
0.15
0.2
0.2
0.2
0.2
5
0.2
5
0.2
50.3
0.3
Sp
*
Duty
Cycle
S
u
S
u
= R
Tx
B =
RTx
B =
Tx

Pratik Gandhi, Kavitha Chandra & Charles Thompson
International Journal of Computer Networks (IJCN), Volume (6) : Issue (2) : 2014 45
6. PERFORMANCE FOR TWO COOPERATIVE SECONDARY USERS
This section examines the throughput when two secondary users are in contention for the PU channel. A uniformly distributed backoff window is considered to demonstrate the effect. The analysis is carried out by simulation. The two SU's operate according to the aforementioned six state Markov model. If a channel is occupied either by the PU or another SU, the SU attempting to transmit enters the backoff state. On detection of collision after the transmit state, the SU will transition to the retransmit and the sense states. The simulation tracks the successful transmission of 10
5 packets by each of the secondary users. Fig. 16 compares the simulated
throughput as a function of for one and two SUs for and . The peak SU
throughput drops from 75% to about 20%. This study has assumed that the SU's generate a continuous stream of packets for transmission. Therefore the results shown correspond to the worst case scenario where no statistical multiplexing takes place during the channel access phase of the SU's.
FIGURE 16: Throughput simulation for two cooperative secondary users for .
7. PERFORMANCE WITH A NON-COOPERATIVE SECONDARY USER
The effect on a SU's throughput is also analyzed for the case where a non-cooperative user (MU) attempts to access and block the channel for the SU while avoiding interference to a primary user. Both SU and MU actions are represented using the six state Markov model. In this case, the SU backs off when the channel is occupied either by the PU or MU. However, the MU avoids interference by the PU by sensing its presence and backing off, but ignores transmissions of the SU. The transmission frame size and backoff window size of the MU are varied to examine the impact on the SU throughput. Fig. 17 compares the SU throughput with and without the presence
of the MU. The simulation results shown are for a PU duty cycle with SU and
. The packet size of the MU does not affect the SU throughput performance if
its backoff window is high enough so that it operates in the saturation regime shown in Fig. 2 where is invariant with . This feature is seen in Fig. 17 where the SU throughput is
obtained for MU time units. The decrease in SU throughput is shown as the MU
backoff window size is varied as . These results indicate that a non-
cooperative user can operate covertly with small packet sizes, avoid detection from the primary
0 0.1 0.2 0.3 0.4 0.5 0.6 0.7 0.8 0.9 10
0.1
0.2
0.3
0.4
0.5
0.6
0.7
0.8
Sp*
Thro
ughput
One SU
Two SUs
Pratik Gandhi, Kavitha Chandra & Charles Thompson
International Journal of Computer Networks (IJCN), Volume (6) : Issue (2) : 2014 46
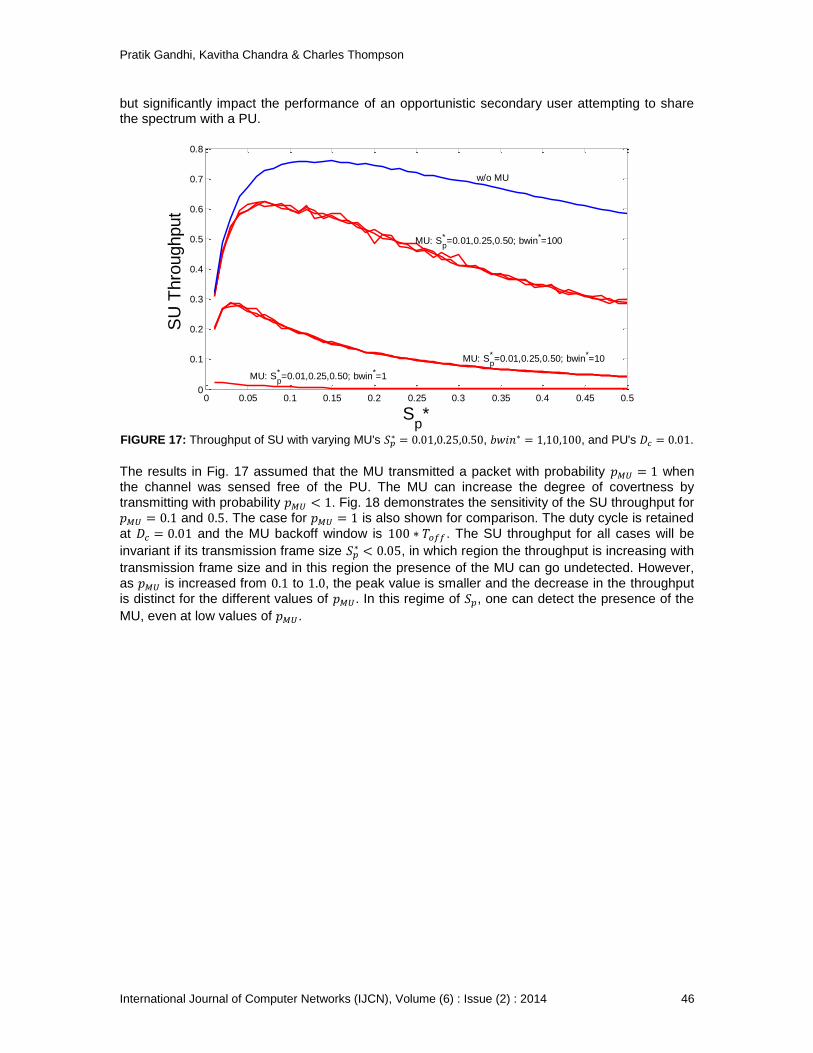
but significantly impact the performance of an opportunistic secondary user attempting to share the spectrum with a PU.
FIGURE 17: Throughput of SU with varying MU's
, , and PU's .
The results in Fig. 17 assumed that the MU transmitted a packet with probability when the channel was sensed free of the PU. The MU can increase the degree of covertness by transmitting with probability . Fig. 18 demonstrates the sensitivity of the SU throughput for and . The case for is also shown for comparison. The duty cycle is retained
at and the MU backoff window is . The SU throughput for all cases will be
invariant if its transmission frame size , in which region the throughput is increasing with
transmission frame size and in this region the presence of the MU can go undetected. However, as is increased from to , the peak value is smaller and the decrease in the throughput is distinct for the different values of . In this regime of , one can detect the presence of the
MU, even at low values of .
0 0.05 0.1 0.15 0.2 0.25 0.3 0.35 0.4 0.45 0.50
0.1
0.2
0.3
0.4
0.5
0.6
0.7
0.8
Sp*
SU
Thro
ughput
w/o MU
MU: Sp* =0.01,0.25,0.50; bwin*=10
MU: Sp* =0.01,0.25,0.50; bwin*=100
MU: Sp* =0.01,0.25,0.50; bwin*=1

Pratik Gandhi, Kavitha Chandra & Charles Thompson
International Journal of Computer Networks (IJCN), Volume (6) : Issue (2) : 2014 47
FIGURE 17: Simulated Throughput of SU with with , .
8. CONCLUSIONS
A joint sensing and transmission model is investigated for secondary users sharing spectrum with a primary user. The sensitivity of the SU probabilities of being in a transmit, retransmit or backoff states has been analyzed with respect to the PU duty cycle and average duration that the PU does not occupy the channel. A theoretical model for the SU throughput identifies the feasible operating region with respect to the SU packet length and backoff window size that leads to the peak throughput model for a specified PU duty cycle. The model is also shown to identify the range of PU duty cycles and SU transmission durations that maintain specified bounds on the probabilities of the SU being in the backoff and retransmit states. The model can be extended to multiple secondary users, with examples given here for the case of two cooperative and non-cooperative channel access.
9. ACKNOWLEDGEMENTS
Pratik Gandhi acknowledges support from the GK-12 Vibes and Waves in Action Fellowship through NSF grant #0841392.
10. REFERENCES [1] President Obama, “Presidential Memorandum-Expanding America’s Leadership in Wireless
Innovation.” Internet: http://www.whitehouse.gov/the-press-office/2013/06/14/, June 14 2013 [Nov. 20, 2013].
[2] President’s Council of Advisors on Science and Technology, “Report to the President-Realizing the Full Potential of Government-held Spectrum to Spur Economic Growth,” July 2012.
[3] E. Axell, G. Leus, E.G. Larsson, and H.V. Poor, “Spectrum Sensing for Cognitive Radio,” IEEE Signal Processing Magazine, vol. 29, pp.1315–1329, 2012.
[4] Y.-E. Lin, K.-H. Liu, and H.-Y. Hsieh, “On using interference-aware spectrum sensing for dynamic spectrum access in cognitive radio networks,” IEEE Transactions on Mobile Computing, vol. 12, pp. 461–474, March 2013.
0 0.05 0.1 0.15 0.2 0.25 0.3 0.35 0.4 0.45 0.50.2
0.3
0.4
0.5
0.6
0.7
0.8
0.9
1
Sp*
SU
Thro
ughput
w/o MU
pMU
= 0.1
pMU
= 0.5
pMU
= 1.0

Pratik Gandhi, Kavitha Chandra & Charles Thompson
International Journal of Computer Networks (IJCN), Volume (6) : Issue (2) : 2014 48
[5] D. Treeumnuk and D. Popescu, “Adaptive Sensing for Increased Spectrum Utilization in Dynamic Cognitive Radio Systems,” in IEEE Radio and Wireless Symposium (RWS), 2012, pp. 319–322.
[6] J. Deaton, C. Wernz, and L. DaSilva, “Decision analysis of dynamic spectrum access rules,” in IEEE Global Telecommunications Conference (GLOBECOM), 2011, pp. 1–6.
[7] L. Shi, K. W. Sung, and J. Zander, “Secondary spectrum access in tv-bands with combined co-channel and adjacent channel interference constraints,” in IEEE International Symposium on Dynamic Spectrum Access Networks (DYSPAN), 2012, pp. 452–460.
[8] M. Barrie, S. Delaere, G. Sukareviciene, J. Gesquiere, and I. Moerman, “Geolocation database beyond tv white spaces? matching applications with database requirements,” in IEEE International Symposium on Dynamic Spectrum Access Networks (DYSPAN), 2012, pp. 467–478.
[9] IEEE Std 802.22, “IEEE Standard for Information Technology–Telecommunications and information exchange between systems Wireless Regional Area Networks (WRAN)–Specific requirements Part 22: Cognitive Wireless RAN Medium Access Control (MAC) and Physical Layer (PHY) Specifications: Policies and Procedures for Operation in the TV Bands.” IEEE Std 802.22-2011, 2011.
[10] M. Hamid, A. Mohammed, and Z. Yang, “On Spectrum Sharing and Dynamic Spectrum Allocation: MAC Layer Spectrum Sensing in Cognitive Radio Networks,” International Conference on Communications and Mobile Computing (CMC), pp. 183-187, 2010.
[11] X. Wang, W.Chen, and Z. Cao, “Partially observable Markov decision process-based MAC-layer sensing optimization for cognitive radios exploiting rateless-coded spectrum aggregation,” Communications, IET, vol. 6, pp. 828-835, 2012.
[12] K. Chang, Y. C. Huang, and B. Senadji, “Analysis of primary user duty cycle impact on spectrum sensing performance,” in International Symposium on Information Theory and its Applications (ISITA), pp. 940–945, 2010.
[13] W. Gabran, C.-H. Liu, P. Pawelczak, and D. Cabric, “Primary user traffic estimation for dynamic spectrum access,” IEEE Journal on Selected Areas in Communications, vol. 31, pp. 544–558, 2013.
[14] H. Kim and K. Shin, “Efficient discovery of spectrum opportunities with mac layer sensing in cognitive radio networks,” IEEE Transactions on Mobile Computing, vol. 7, pp. 533–545, 2008.
[15] S. Zheng, Y.-C. Liang, P.-Y. Kam, and A.T. Hoang, “Cross-Layered Design of Spectrum Sensing and MAC for Opportunistic Spectrum Access," IEEE Conference on Wireless Communications and Networking (WCNC), pp. 1-6, 2009.
[16] C. Cormio and K. R. Chowdhury, “A Survey on MAC Protocols for Cognitive Radio Networks,” ELSEVIER Ad Hoc Networks, vol. 7, pp. 1315–1329, 2009.
[17] W.-Y. Lee and I. Akyildiz, “Optimal spectrum sensing framework for cognitive radio networks,” IEEE Transactions on Wireless Communications, vol. 7, pp. 3845–3857, 2008.
[18] Y. Pei, A.T. Hoang, and Y.-C. Liang, “Sensing-throughput tradeoff in cognitive radio networks: How frequently should spectrum sensing be carried out?,” IEEE 18th International Symposium on Personal, Indoor and Mobile Radio Communications (PIMRC), pp. 1–5, 2007.

Pratik Gandhi, Kavitha Chandra & Charles Thompson
International Journal of Computer Networks (IJCN), Volume (6) : Issue (2) : 2014 49
[19] P. Wang, L. Xiao, S. Zhou, and J. Wang, “Optimization of detection time for channel efficiency in cognitive radio systems,” in IEEE Wireless Communications and Networking Conference (WCNC), pp. 111–115, 2007.
[20] P. Gandhi, I. Alshawabkeh, K. Chandra, and C. Thompson, “A spectrum sensing and transmission model for secondary users in cognitive radios,” 20th International Conference on Software, Telecommunications and Computer Networks (SoftCOM), p.1-5, 2012.
[21] D. Cox and H. Miller, The Theory of Stochastic Processes, Methuen & Co Ltd., London, 1965.