SHARE15277 Monitoring IMS Performance v4€¦ · QPOOL – IMS uses QPOOL to hold both input and...
62
Session # 15277 Monitoring IMS Performance for Faster Problem Solving Lih M. Wang [email protected] IBM Corporation March 13, 2014 9:30 a.m. – 10:30 a.m. Orange County Salon 1
Transcript of SHARE15277 Monitoring IMS Performance v4€¦ · QPOOL – IMS uses QPOOL to hold both input and...

Session # 15277
Monitoring IMS Performance for Faster Problem Solving
Lih M. Wang
IBM Corporation
March 13, 2014
9:30 a.m. – 10:30 a.m.
Orange County Salon 1
2
Agenda
• Introduction
• IMS Overview
• Performance Basics
• IMS Transaction Flow
• Key Performance Indicators
• Case Study
• Summary
3
Introduction

4
User
DB
MSG
QueueWADSOLDS
D
L
I
S
A
S
D
B
R
C
MP
MP
BMP
BMP
I
R
L
M
C
O
N
T
R
O
L
RDS RECON
ACBLIB
MFS
PGMLIB
IMS TM and DB Overview
KPI: CPU, Memory, I/O, Network, Locking
5
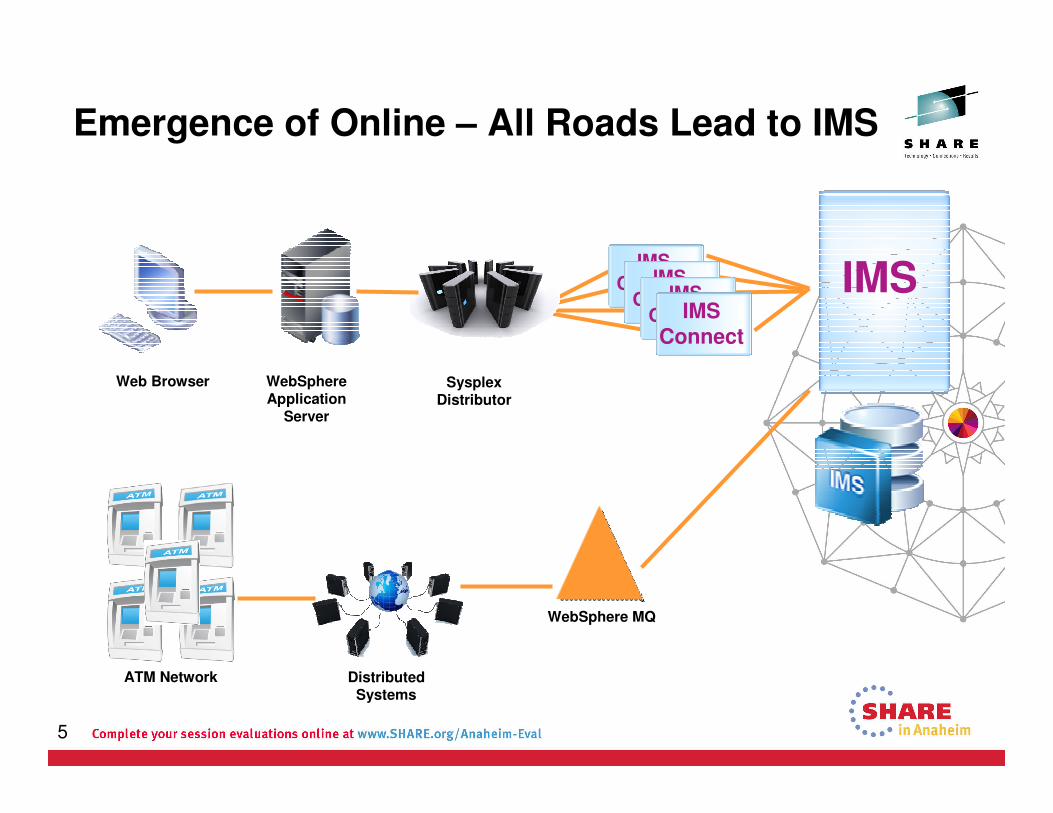
Emergence of Online – All Roads Lead to IMS
IMS
Web Browser WebSphere Application
Server
Distributed Systems
ATM Network
WebSphere MQ
Sysplex Distributor
IMS ConnectIMS
ConnectIMS ConnectIMS Connect
6
What to Monitor?

7
Performance Basics
• CPU
• Memory
• I/O
• Network
• Locking
• Storage
• Applications
8
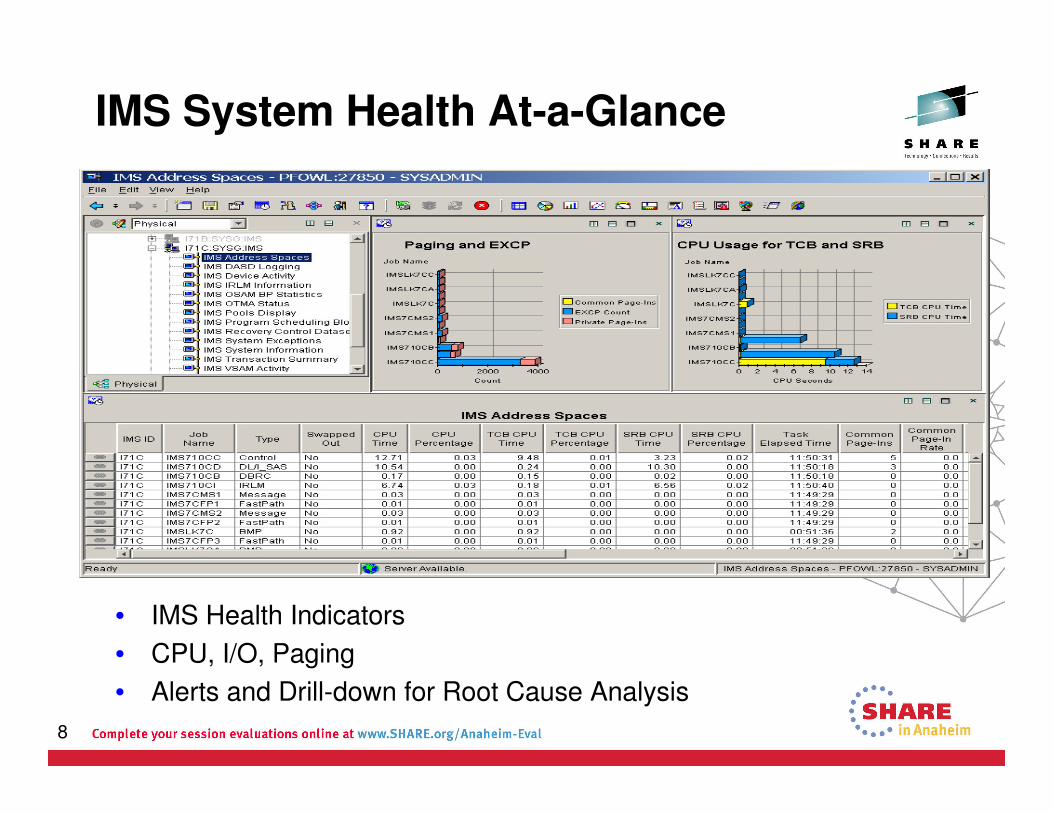
IMS System Health At-a-Glance
• IMS Health Indicators
• CPU, I/O, Paging
• Alerts and Drill-down for Root Cause Analysis
9
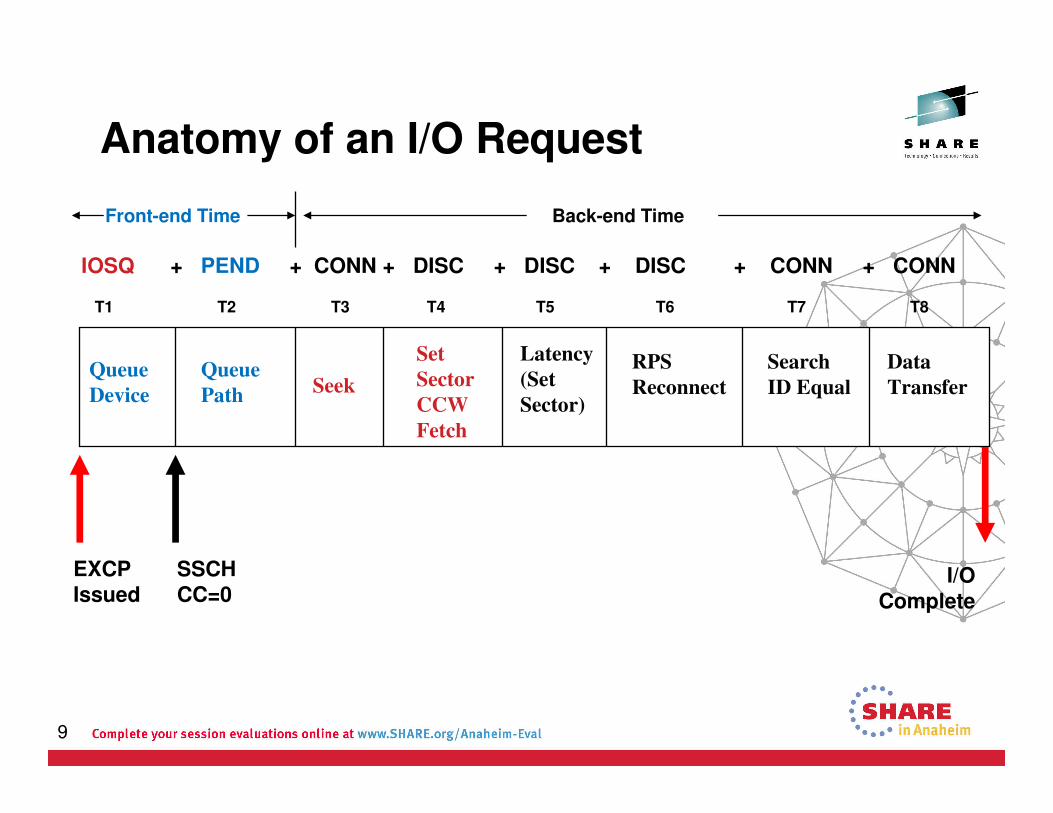
Anatomy of an I/O Request
Queue
Device
Queue
Path
Latency
(Set
Sector)
RPS
Reconnect
EXCPIssued
SSCHCC=0
Front-end Time Back-end Time
IOSQ + PEND + CONN + DISC + DISC + DISC + CONN + CONN
T1 T2 T3 T4 T5 T6 T7 T8
Seek
Set
Sector
CCW
Fetch
Search
ID Equal
Data
Transfer
I/O
Complete

10
Monitoring I/O Response Time
I/O Response Time = IOSQ + PEND + CONN + DISCONNECT

11
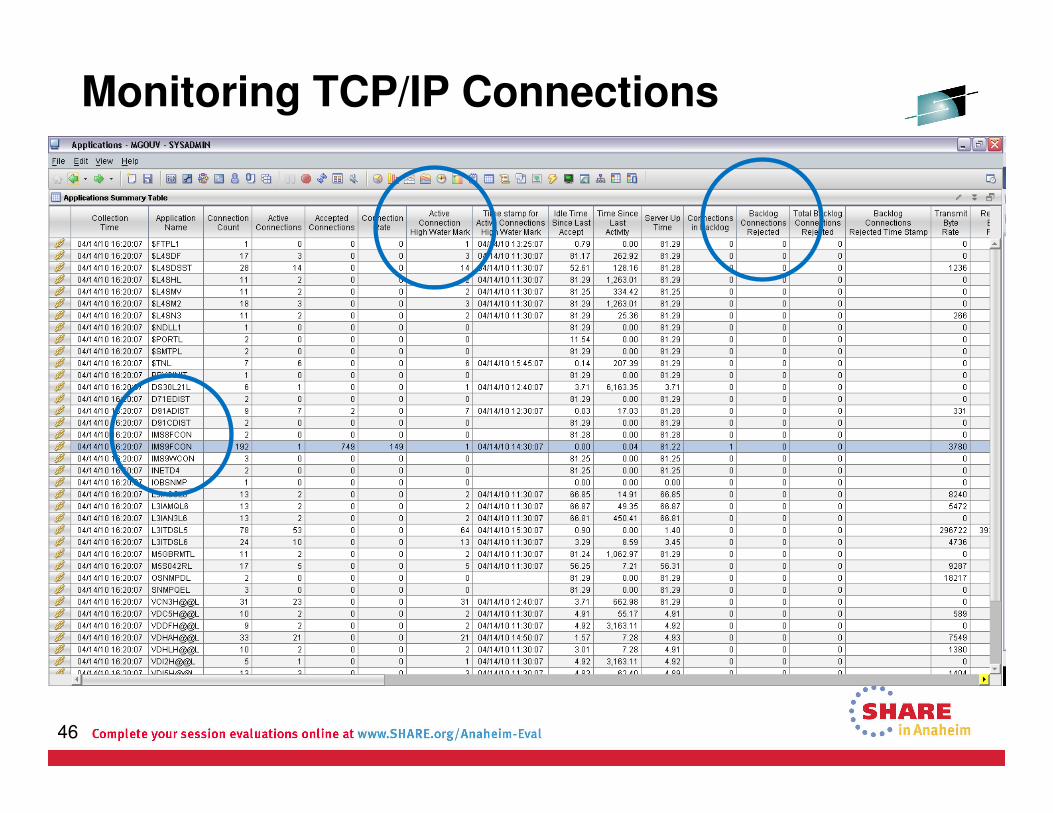
Monitoring TCP/IP Connections
12
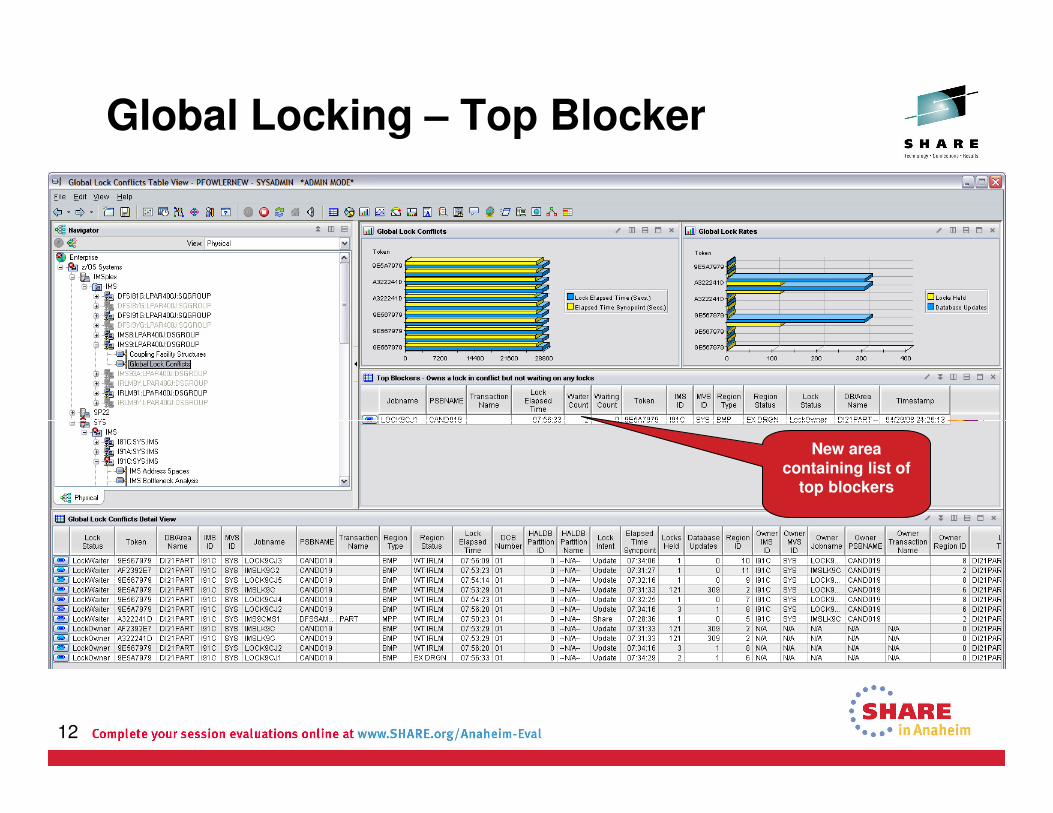
Global Locking – Top Blocker
New area containing list of
top blockers

13
IMS Transaction Flow andKey Performance Indicators
14
Log
MessageQueue
DataBases
Transaction
Communications Control
Scheduler
CommonServices
DL/I
Checkpoint/Restart
MP
Appl.Pgm.
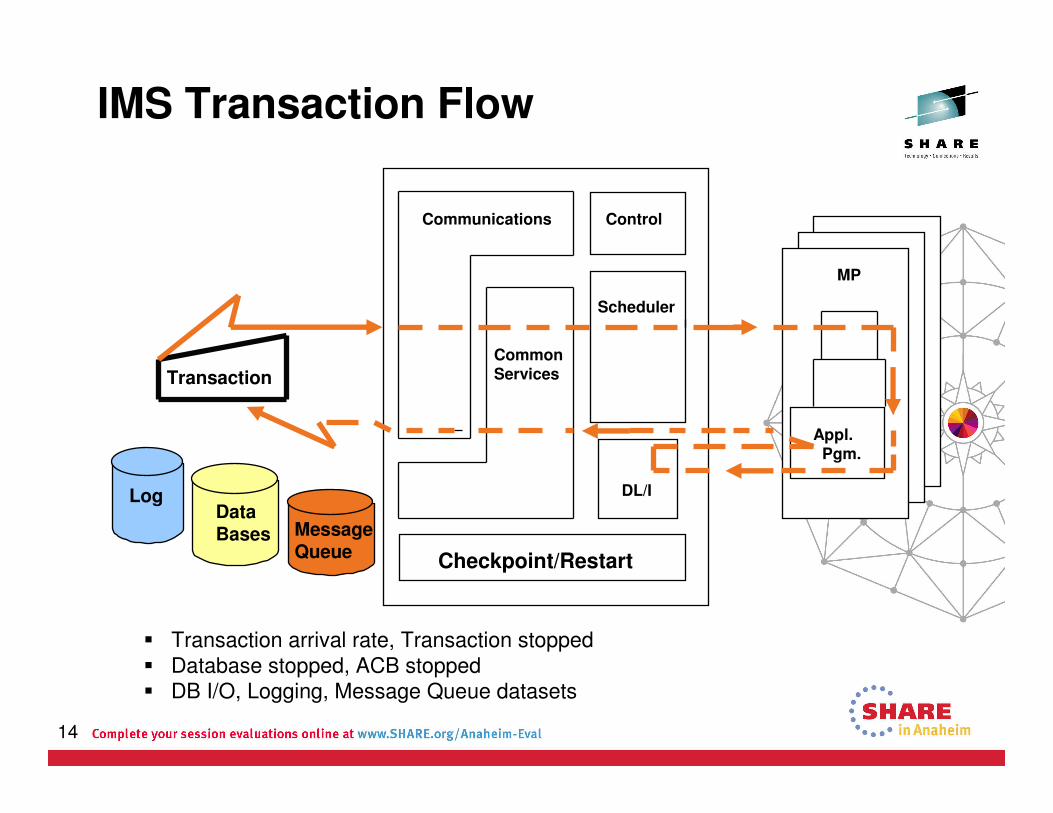
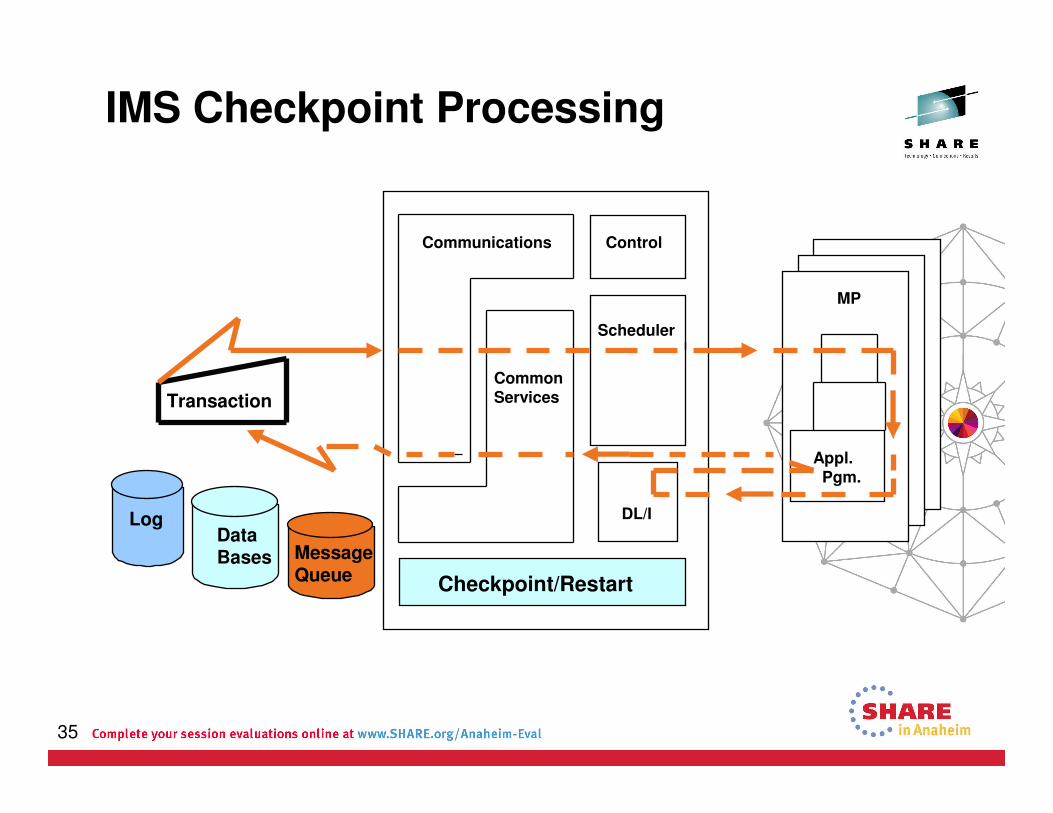
IMS Transaction Flow
� Transaction arrival rate, Transaction stopped
� Database stopped, ACB stopped
� DB I/O, Logging, Message Queue datasets
15
IMS Communication Overview
Log
MessageQueue
DataBases
Transaction
Control
Scheduler
CommonServices
DL/I
Checkpoint/Restart
MP
Appl.Pgm.
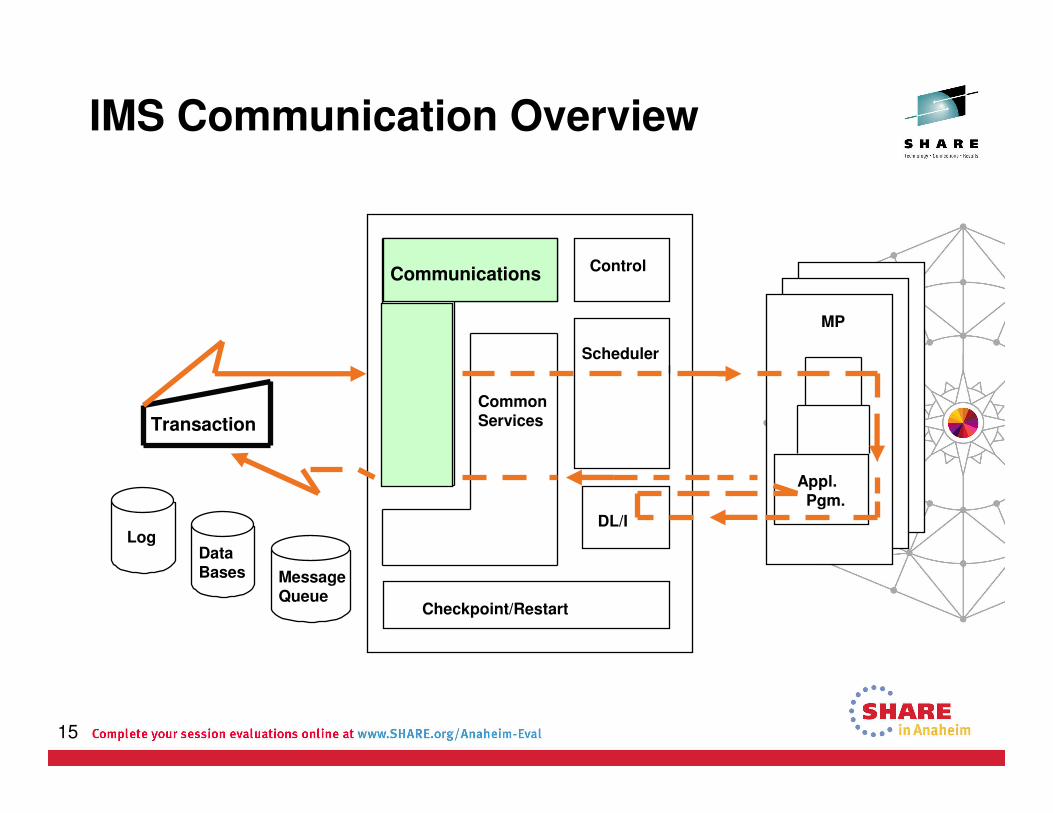
Communications

16
Communication Pools
IOBUFs SAPs IMS CONTROL REGION
ECSA
VTAMNODE
RECANY
MSG QUEUE POOL
SPAP
SMBsSMBs
ShortMSG Q
LongMSG Q
OUTBUFHIOP
Format
CIOP
MFS/FRE
VTAM
SAP – Save Area Prefix, FRE – Fetch Request Element,
CIOP – Communication I/O Pool, HIOP – High I/O Pool (outbound messages),
SPAP – Scratch Pad Area Pool (for conversational messages)

17
Selective Dispatching------------------------------------------------------------ 10/27/12 9:09:45
IMS Status I11A
+-----------------------------------------------------------------------------+
¦ ¦
¦ IMS restart date . : 05.297 IMS restart time . . . .: 08:48:11 ¦
¦ ¦
¦ Checkpoints taken . : 3 Current checkpoint id . : 05297/143735 ¦
¦ ¦
¦ MPPs active . . . . : 1 BMPs active . . . . . . : 0 ¦
¦ ¦
¦ Msg enqueue rate . : .00/sec Msg dequeue rate . . . .: .00/sec ¦
¦ ¦
¦ Transactions queued : 778 Selective dispatch . . .: Inactive ¦
¦ ¦
¦ VTAM authorize Path : Active VTAM ACB . . . . . . . .: Open ¦
¦ ¦
¦ START DC . . . . . .: Performed Logtape write-ahead . . : Active ¦
¦ ¦
+-----------------------------------------------------------------------------+
SAP CIOP MFS/FRE MSG Queue SPAP
***** ITASK must wait
when the resource shortage is detected

18
Storage Pool Information
19
Log
MessageQueue
DataBases
Transaction
Communications Control
Scheduler
CommonServices
DL/I
Checkpoint/Restart
MP
Appl.Pgm.
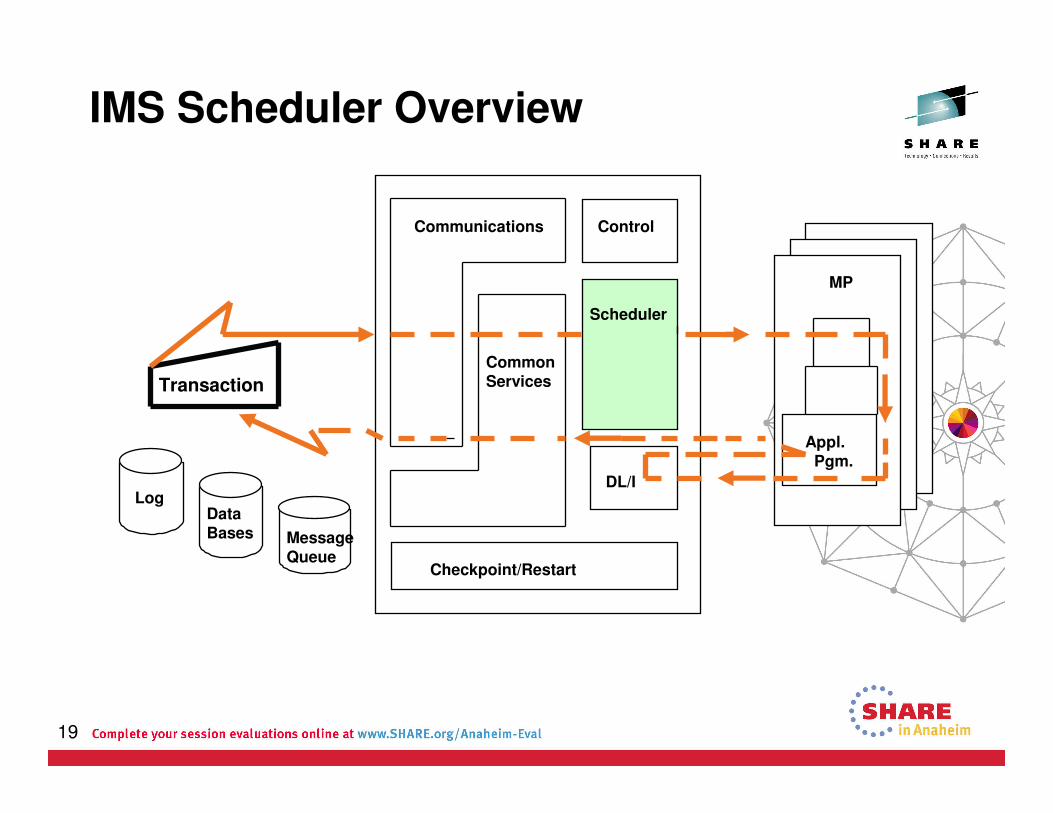
IMS Scheduler Overview

20
Scheduling Facility
SCHEDULER
Class Priority
Load
BalancingProcessing
Limit Count
Wait for
Input
Message
Queue
Pool
Scheduler
Related Pools
Scheduler
Related
Control Blocks

21
Scheduling Waits
PSBA
PSBB
PSBC
DMBX
DMBY
PSB POOL
DMB POOL
PSB WORKAREA POOL
RESIDENTPSB’s
INTENTLISTS
RESIDENTDMB’s
ACBLIB
BLDLLIST
***** If DMB space is unavailable, the least recently referenced DMB in the pool is flushed, all of its data
sets have to be CLOSED -� OPEN / CLOSE overhead, performance degradation.
***** If PSB pool space is unavailable, the least recently referenced PSB is removed, next time that PSB must be reloaded from ACBLIB when requested.
CONTROL REGION

22
PSB Status - Clean Up The Unusable

23
Schedule End to First DL/I Call
• Time before the first DL/I call to retrieve a message
• Loading the application program
• Initializing the program
• Opening any non-DL/I files
• Issuing any database calls

24
Monitor Non-DL/I Wait
PDEX ------SHORT TERM %---- ------LONG TERM %-----
+ (ELAPSED TIME= 1:41 MN) % 0_______ 50_______100 % 0_______ 50_______100
+ USING CPU: 21.0|--->. . . .| 20.5|--->. . . .
+ USING CPU IN APPL (11.2)|--> . . . .| (11.0)|->- . . . .
+ USING CPU IN IMS (9.8)|--> . . . .| (9.5)|-> . . . .
+ SCHEDULING WAITS: 2.8|> . . . .| 2.0|> . . . .
+ WAIT FOR MPP (0.2)|> . . . .| (0)|> . . . .
+ WAIT FOR GU (2.6)|> . . . .| (2.0)|> . . . .
+ IMS ACTIVITY: 16.5|--> . . . .| 15.5|--> . . . .
+ SPA I/O (1.2)|> . . . .| (1.2)|> . . . .
+ SYNC POINT WAIT (5.6)|> . . . .| (5.6)|> . . . .
+ ISWITCHED TO CTL (9.7)|-> . . . .| (8.7)|-> . . . .
+ DATABASE I/O WAITS 26.7|-----> . . .| 21.7|----> . . .
+ ADA221 (15.4)|--> . . . .| (11.4)|--> . . . .
+ ADA021S (11.3)|-> . . . .| (10.3)|-> . . . .
+ MVS WAITS: 35.8|-------> . . .| 30.8|------> . . .
+ CPU WAIT (MPP/BMP) (13.7)|--> . . . .| (10.7)|--> . . . .
+ PROGRAM FETCH I/O (22.1)|---> . . .| (20.1)|---> . . .
+ - - - - - - - - - - - - - - - - - - - - - - - - - - - - - - - - - - - - - - -
+ Avg. Trans Executing: 5.3 4.0

25
Log
MessageQueue
DataBases
Transaction
Communications Control
Scheduler
DL/I
Checkpoint/Restart
MP
Appl.Pgm.
CommonServices
IMS Message Queuing

26
Input/Output Messages
SMB
CNT
MESSAGE
MESSAGE
MESSAGE
MESSAGE
MESSAGE
MESSAGE
QUEUEBLOCK
SHORTMESSAGE LONG
MESSAGE
QPOOLCONTROL REGION
SMB – Scheduler Message Block built at IMS SYSGEN, a list of all valid transaction codes – TRANSACT Macro
CNT – Communication Name Table, built at IMS SYSGEN, a list of all valid logical terminal names – NAME macro
QPOOL – IMS uses QPOOL to hold both input and output messages in-core.

27
Message Queue Considerations
• Allocate sufficient QBUFs
• MSGQUEUE macro defines #QPOOL bufs, blksz
• IMS control region JCL parm QBUF=
• Optimize LRECL sizes to make efficient use of pool space
and balance I/O activity between the SHMSG and LGMSG
datasets
• If large SPAs are defined, allocate the size of the LGMSG
LRECL to include the size of the SPA plus the length of the input message
• Use fixed length SPAs

28
Monitor Message Queue I/O
------------------------------------------------------------ 08/28/12 14:39:10
Message Queue Buffers and Datasets I91A
+-----------------------------------------------------------------------------+
¦ Message Queue ¦ Total ¦ Short ¦ Long ¦ QBLKS ¦ Free ¦
¦---------------------+----------+----------+----------+----------+-----------¦
¦ No. of Buffers ¦ 5 ¦ 2 ¦ 2 ¦ 1 ¦ 0 ¦
¦ Percentage ¦ ¦ 40.0% ¦ 40.0% ¦ 20.0% ¦ .0 ¦
+-----------------------------------------------------------------------------+
+-----------------------------------------------------------------------------+
¦ Dataset ¦ % Used ¦ Shutdown ¦ I/O Rate ¦
¦------------+---------------------------+-------------+----------------------¦
¦ Short ¦ 14.36%, 968 of 6740 ¦ 98.53% ¦ .00 per second ¦
¦ Long ¦ .96%, 6 of 620 ¦ 86.11% ¦ .00 per second ¦
¦ QBLKS ¦ .24%, 32 of 13100 ¦ 99.24% ¦ .00 per second ¦
+-----------------------------------------------------------------------------+

29
What If MSG-Q BUF# Became Low...
• Enough active MP regions?
• Scheduling Delayed because of short on PSB, PSBW, or EPCB
pools?
• Remote printers are active?
• Increase QBUF= in control region JCL
• If region is stopped but messages are still coming, stop
transactions. Otherwise the % utilization of short message dataset will increase.
• If the % used of long message dataset increases, an
application may be looping while inserting output messages, stop the region (especially if it’s BMP).
30
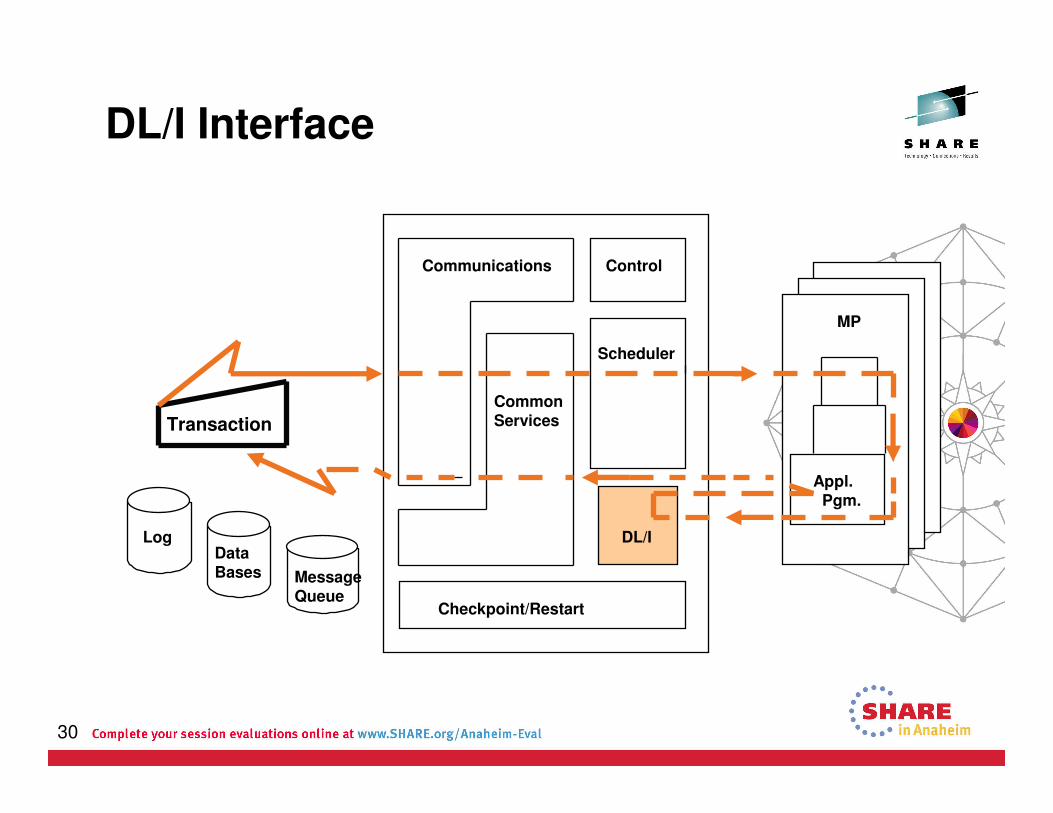
DL/I Interface
Log
MessageQueue
DataBases
Transaction
Communications Control
Scheduler
CommonServices
DL/I
Checkpoint/Restart
MP
Appl.Pgm.

31
Online Database Operations
Interregion
Communication
DL/I Call
Analyzer
DL/I Action
Modules
Program
Isolation
OSAM/VSAM
Buffer Handlers
Database Work
Area Pool
ENQ/DEQ Pool
DL/I Buffer
Handler Pool
OSAM
Buffer Pool
VSAM
Shared
Resource Pool
WADS
Data
Bases

32
VSAM Hiperspace
Buffers
Buffers
Buffers
Hiperspace
Buffers
DLISAS
16 MEG
VSAM HiperspaceBUFFER
PREFIXES
Hiperspace
Buffers

33
VSAM Buffer Pool
------------------------------------------------------------ 08/28/12 14:48:08
VSAM Buffer Pools Status I11A
Lines 1 to 11 of 11
+-----------------------------------------------------------------------------+
¦ Subpool ¦ Number of ¦ Size of ¦ Hit ¦ Buffers ¦ Blocks ¦
¦ ¦ Buffers ¦ Buffers ¦ Ratio ¦ Page-Fixed? ¦ Page-Fixed? ¦
¦------------+------------+-----------+-----------+-------------+-------------¦
¦ 1 ¦ 5 ¦ 512 ¦ .0% ¦ YES ¦ YES ¦
¦ 2 ¦ 15 ¦ 1024 ¦ 82.0% ¦ YES ¦ YES ¦
¦ 3 ¦ 20 ¦ 2048 ¦ 90.0% ¦ YES ¦ YES ¦
¦ 4 ¦ 5 ¦ 4096 ¦ .0% ¦ YES ¦ YES ¦
¦ 5 ¦ 55 ¦ 4096 ¦ 70.0% ¦ YES ¦ NO ¦
¦ 6 ¦ 5 ¦ 4096 ¦ .0% ¦ YES ¦ NO ¦
¦ 7 ¦ 3 ¦ 32768 ¦ .0% ¦ YES ¦ YES ¦
¦ 8 ¦ 5 ¦ 2048 ¦ .0% ¦ YES ¦ YES ¦
¦ 9 ¦ 5 ¦ 512 ¦ .0% ¦ YES ¦ YES ¦
¦ 10 ¦ 5 ¦ 1024 ¦ .0% ¦ YES ¦ YES ¦
¦ 11 ¦ 5 ¦ 1024 ¦ .0% ¦ YES ¦ YES ¦
+-----------------------------------------------------------------------------+
Optimal Index Hit Ratio > = 90%
Data Hit Ratio > = 80%

34
OSAM Buffer Pool
• 4 Gig limit
• Page fix only the buffer
• Sequential Buffering
• DFSVSMxx member in IMSVS.PROCLIB
IOBF=(length, number, fix1, fix2), for ex.,
• IOBF=(4096,50,N,Y)
• IOBF=(6144,8)Length specifies the length of the buffers in the subpool in bytes, 512-32000.
Fix1 specifies the buffers long-term-page-fixing option
Y – all buffers and buffer prefixes associated with this subpool will be long-
term-page-fixed at initialization of the subpool.
N – no buffer associated with this subpool will be long-term-page-fixed at
initialization of the subpool.
Fix2 specifies the buffer-prefix long-term-page-fixing option.
35
Log
MessageQueue
DataBases
Transaction
Communications Control
Scheduler
CommonServices
DL/I
Checkpoint/Restart
MP
Appl.Pgm.
IMS Checkpoint Processing

36
OLDS5
OLDS4
OLDS3
OLDS2
RECON
3
RECON
2
z/OS
IMS/TM DBRC DLISAS
Control
Region
DB Recovery
Control
DL/I Subordinate
Address Space
SLDS2
SLDS1
RLDS2
RLDS1
SYSTEM
LOG
DATA
SETS
RECOVERY
LOG
DATA
SETS
LOG ARCHIVE UTILITY
WADS
WRITE
AHEAD
DATA
SETS
RECON
1
Buffers Buffers
OLDS1
Common Logging Facility

37
Logging I/O
------------------------------------------------------------ 08/28/12 7:15:47
Logging Buffers and Statistics I11A
+-----------------------------------------------------------------------------+
¦ Size : 22 K Number of Buffers : 25 Number Available : 4 ¦
+-----------------------------------------------------------------------------+
+----------------------------------------------------------+
¦ I/O Type ¦ Rate/sec ¦0..................¦
¦---------------------------+----------+-------------------¦
¦ OLDS writes. . : 225 ¦ .00 ¦ ¦
¦ OLDS reads . . : 0 ¦ .00 ¦ ¦
¦ WADS 2K writes : 1058 ¦ .00 ¦ ¦
¦ WADS EXCPVRS . : 234 ¦ .00 ¦ ¦
+----------------------------------------------------------+
***** If WADS I/O rate is too high, check the dataset and volume
response time, application checkpoint frequency, and re-evaluate
OLDs buffer size.
BMP Abending?

38
Monitor IMS System Datasets

39
Cross Reference – Part 1
Message Input
Scheduling
Schedule End to
First DL/I Call
EVENT ACTIVITY POOLs/LISTs DATASETs
TP
MFS
SPA GET
QUEUING
CIOP
RECANY
MFP
SPAP/CWAP
QBUF
LOG
LINEs
FORMAT
MSGQs
IMSLOG
Scheduling
PSB Load
DMB Load
QBUF
PSBP
DMBP
LOG
MSGQs
ACBLIB
ACBLIB
IMSLOG
Program Load
Initialization
BLDL
VLF/LLA
PRELOAD
STEPLIBs
Reference: IMS Performance Guide Redbook, SG24-4637-00

40
Cross Reference – Part 2
Program Elapsed
DL/I Elapsed
IWAIT Elapsed
Termination
EVENT ACTIVITY POOLs/LISTs DATASETs
DC Calls
DB Calls
SPA Insert
QBUF
OSAM
VSAM
LOG
SPAP/CWAP
LOG
MSGQs
Databases
Databases
IMSLOG
IMSLOG
Dequeuing
MFS
TP
QBUF
MFP
CIOP/HIOP
LOG
MSGQs
FORMAT
LINEs
IMSLOG
Message
Output
Sync Point OSAM
VSAM
QBUF
LOG
Databases
Databases
MSGQs
IMSLOG
41
Monitoring IMS Connect

42
IMS Connect
• IMS Connect is the TCP/IP interface for IMS
• IMS Connect is delivered with IMS
• IMS Connect runs in a separate address space
• IMS Connect is a TCP/IP Server
• IMS Connect is used for:
• Submitting IMS transaction messages over TCP/IP
• Accessing IMS data (IMS Open Database) over TCP/IP
• MSC, ISC over TCP/IP
• Application Remote Messaging

43
Invoke IMS Transactions over TCP/IP
IMSIMS
ConnectTCP/IP Application
OTMAXCF
� IMS Connect and IMS communicate using XCF (cross-system coupling facility)
� i.e IMS Connect and IMS do not have to be on the same LPAR
� IMS Connect and IMS interface thru OTMA (Open Transaction Manager Access)
� IMS Connect provides exit routines for transaction message formatting

44
One IMS Connect to Many IMSs
IMS
IMS
Connect
TCP/IP
Application
OTMA
� IMS Connect can communicate with multiple IMSs
� IMS Connect could do load balancing across the IMSs
� IMS Connect can know the status of the IMSs
� So if an IMS is unavailable, IMS connect could re-direct
the transaction to another IMS
IMS
OTMA IMS
OTMA
XCF

45
IMS Connect with Sysplex Distributor
IMS
Web Browser WebSphere
Application
Server
Sysplex
Distributor
IMS ConnectIMS
ConnectIMS ConnectIMS
Connect
� Can front end IMS connect with Sysplex Distributor (A software function in z/OS
that increases availability through a combination of dynamic VIPA and the
z/OS Workload Manager).
46
Monitoring TCP/IP Connections

47
TCP/IP.PROFILE Definitions
• PORT statement: IMS Connect PORT set to NODELAYACKS
• Allows ACKS to be sent immediately
• Default is to wait for up to 200ms before ACKing each transmission
• SHAREPORT
• Allows IMS Connect PORTS to be shared by multiple IMS Connect instances on the same TCP/IP stack
• TCPCONFIG INTERVAL or KEEPALIVEOPTIONS INTERVAL
• Allows TCP/IP to maintain a connection that can be inactive for long periods of time
• SOMAXCONN
• Specifies the max. connection requests queued for any listening socket. Default is 10.
• Must be defined large enough for maximum concurrent IMS Connect requests

48
Customizing Unix System Services
• SYS1.PARMLIB (BPXPRMxx)
• MAXSOCKETS sets total number of active sockets per stack
• MAXFILEPROC sets total number of file (socket) descriptors for process
• IMS Connect – HWSCFGxx Option
• MAXSOC sets total number of concurrent sessions for this IMS Connect.
• One connection per port is reserved as a listener connection. Default is 50

49
Network Key Indicators to WatchTCP/IP Active Connection Backlog Connection Rejected
FTP long running jobs Packet Retransmission Rate
VTAM Buffer Pools OSA Adapter Performance

50
Case Study: Database I/O Wait

51
Database I/O Wait
PDEX ------SHORT TERM %---- ------LONG TERM %-----
+ (ELAPSED TIME= 1:41 MN) % 0_______ 50_______100 % 0_______ 50_______100
+ USING CPU: 21.0|--->. . . .| 20.5|--->. . . .
+ USING CPU IN APPL (11.2)|--> . . . .| (11.0)|--> . . . .
+ USING CPU IN IMS (9.8)|--> . . . .| (9.5)|--> . . . .
+ SCHEDULING WAITS: 2.8|> . . . .| 2.5|> . . . .
+ WAIT FOR MPP (0)|> . . . .| (0.2)|> . . . .
+ WAIT FOR GU (2.8)|> . . . .| (2.3)|> . . . .
+ IMS ACTIVITY: 16.5|--> . . . .| 12.5|--> . . . .
+ SPA I/O (1.2)|> . . . .| (1.0)|> . . . .
+ SYNC POINT WAIT (5.6)|> . . . .| (5.2)|> . . . .
+ ISWITCHED TO CTL (9.7)|-> . . . .| (6.3)|--->. . . .
+ DATABASE I/O WAITS 35.7|-------> . . .| 26.7|-----> . . .
+ PAY221 (25.4)|-----> . . .| (15.4)|--> . . . .
+ ADA021S (10.3)|-> . . . .| (11.3)|-> . . . .
+ MVS WAITS: 25.8|------> . . .| 22.7|---> . . . .
+ CPU WAIT (MPP/BMP) (13.7)|--> . . . .| (12.6)|--> . . . . .
+ PROGRAM FETCH I/O (12.1)|-> . . . .| (10.1)|-> . . . .
+ ----
+ - - - - - - - - - - - - - - - - - - - - - - - - - - - - - - - - - - - - - - -
+ Avg. Trans Executing: 5.3 3.5
52
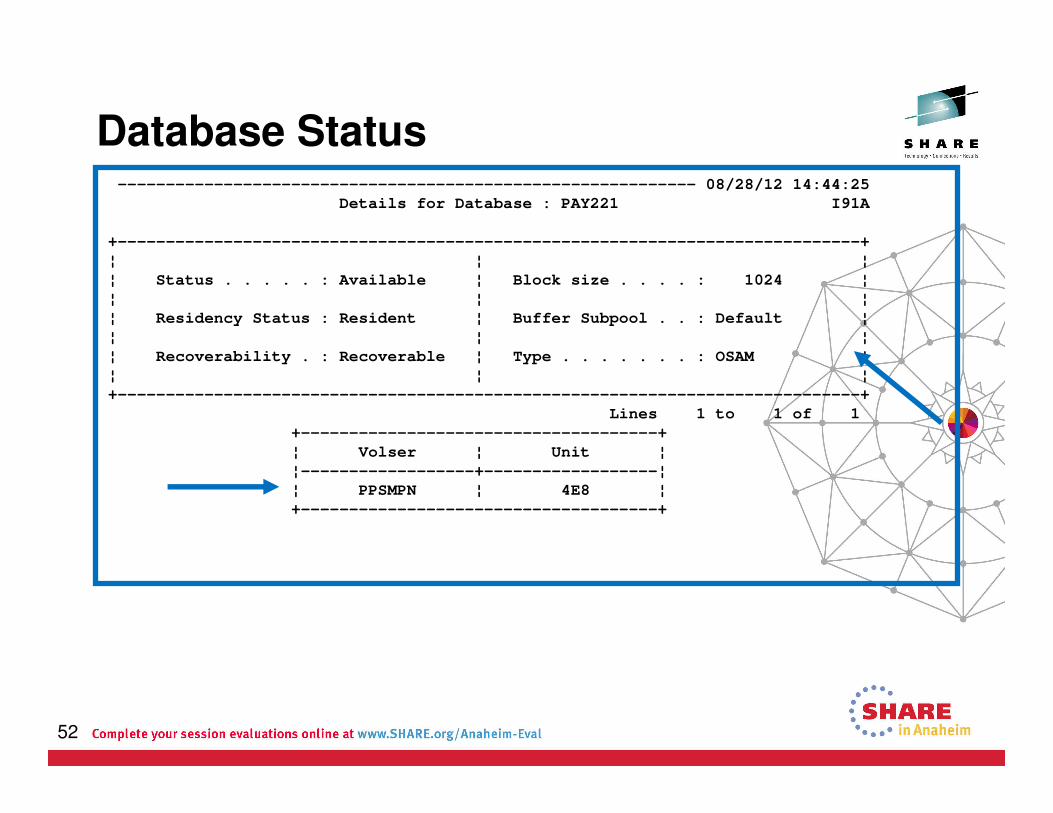
Database Status------------------------------------------------------------ 08/28/12 14:44:25
Details for Database : PAY221 I91A
+-----------------------------------------------------------------------------+
¦ ¦ ¦
¦ Status . . . . . : Available ¦ Block size . . . . : 1024 ¦
¦ ¦ ¦
¦ Residency Status : Resident ¦ Buffer Subpool . . : Default ¦
¦ ¦ ¦
¦ Recoverability . : Recoverable ¦ Type . . . . . . . : OSAM ¦
¦ ¦ ¦
+-----------------------------------------------------------------------------+
Lines 1 to 1 of 1
+-------------------------------------+
¦ Volser ¦ Unit ¦
¦------------------+------------------¦
¦ PPSMPN ¦ 4E8 ¦
+-------------------------------------+

53
Database Buffer Pool Status
------------------------------------------------------------ 08/28/12 14:47:27
OSAM Buffer Pools Status I91A
Lines 1 to 3 of 3
+-----------------------------------------------------------------------------+
¦ Subpool ¦ Subpool ¦ Number of ¦ Hit ¦ Size of ¦ Buffers ¦ Prefix ¦
¦ ¦ Id ¦ Buffers ¦ Ratio ¦ Buffers ¦ Page-Fixed? ¦ Page-Fixed? ¦
¦---------+---------+-----------+-------+---------+-------------+-------------¦
¦ 1 ¦ none ¦ 64 ¦ 62.5%¦ 1024 ¦ NO ¦ NO ¦
¦ 2 ¦ none ¦ 32 ¦ 62.0%¦ 2048 ¦ NO ¦ NO ¦
¦ 3 ¦ none ¦ 16 ¦ 41.3%¦ 4096 ¦ NO ¦ NO ¦
+-----------------------------------------------------------------------------+

54
Volume Response Time
------------------------------------------------------------ 08/28/12 14:47:32
Device Statistics I91A
Lines 1 to 7 of 7
+-----------------------------------------------------------------------------+
¦ ¦ ¦ ¦ ¦ ¦ ¦ ¦I/Os per sec¦ ¦ ¦
¦ Volser¦ Unit ¦Response¦ IOSQ ¦ Pend ¦ Conn ¦ Disc ¦------------+Queue ¦% ¦
¦ ¦ ¦ Time ¦ Time ¦ Time ¦ Time ¦ Time ¦Total¦ IMS ¦Length¦Busy ¦
¦-------+------+--------+------+------+------+------+-----+------+------+-----¦
¦ PPSMPE¦ 14E ¦ 7.5 ¦ .0¦ 3.2 ¦ 2.6¦ 1.6¦ .7¦ .0 ¦ .00 ¦ .7¦
¦ CAN001¦ 2A4 ¦ 7.2 ¦ .0¦ 1.5 ¦ 2.1¦ 3.5¦ .5¦ .0 ¦ .00 ¦ 2.5¦
¦ CAN009¦ 2B9 ¦ 6.8 ¦ .0¦ 1.0 ¦ 2.7¦ 2.9¦ .4¦ .0 ¦ .00 ¦ .4¦
¦ PPSMPF¦ 4E1 ¦ 4.8 ¦ .0¦ 2.6 ¦ 1.5¦ .6¦ 30.9¦ .0 ¦ .00 ¦ 3.4¦
¦ PPSMPH¦ 4E5 ¦ 15.0 ¦ .0¦ 3.5 ¦ 1.1¦ 10.2¦ .0¦ .0 ¦ .00 ¦ .0¦
¦ PPSMPI¦ 4E7 ¦ 7.6 ¦ .0¦ .6 ¦ 3.0¦ 4.0¦ .6¦ .0 ¦ .00 ¦ .2¦
¦ PPSMPN¦ 4E8 ¦ 54.7 ¦ 34.3¦ 1.3 ¦ 14.5¦ 4.6¦ 7.8¦ .0 ¦ .02 ¦ 11.5¦
+-----------------------------------------------------------------------------+
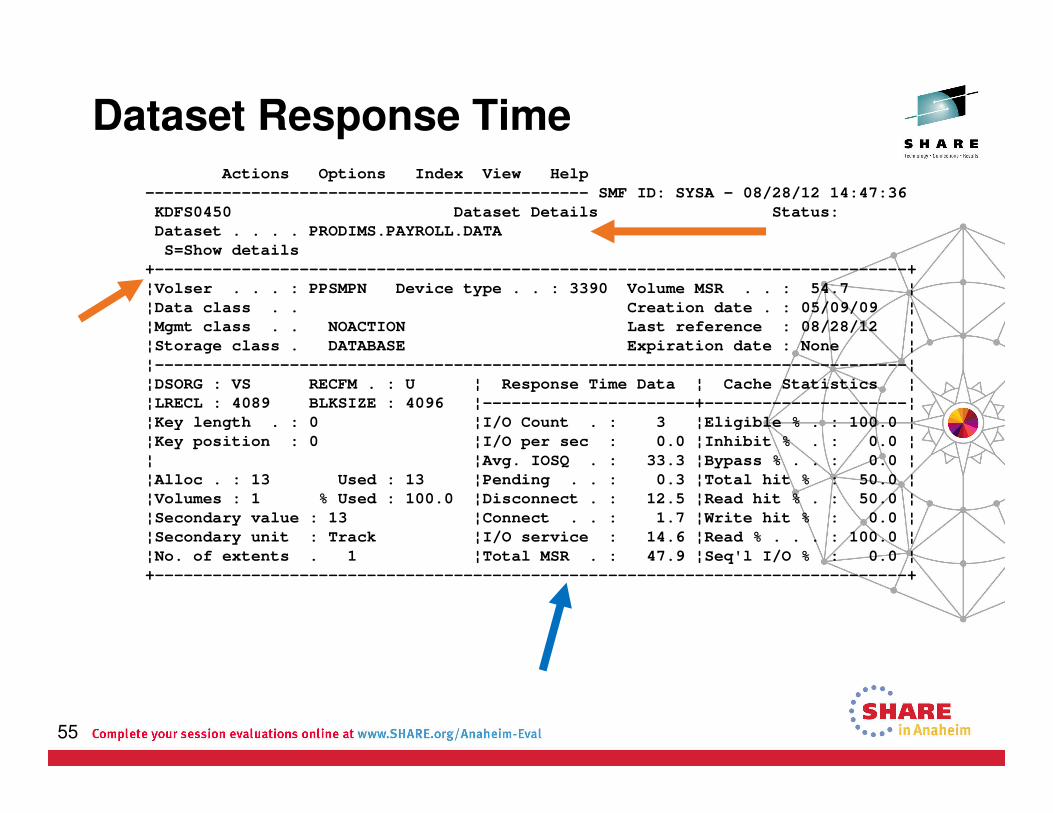
55
Dataset Response TimeActions Options Index View Help
---------------------------------------------- SMF ID: SYSA - 08/28/12 14:47:36
KDFS0450 Dataset Details Status:
Dataset . . . . PRODIMS.PAYROLL.DATA
S=Show details
+------------------------------------------------------------------------------+
¦Volser . . . : PPSMPN Device type . . : 3390 Volume MSR . . : 54.7 ¦
¦Data class . . Creation date . : 05/09/09 ¦
¦Mgmt class . . NOACTION Last reference : 08/28/12 ¦
¦Storage class . DATABASE Expiration date : None ¦
¦------------------------------------------------------------------------------¦
¦DSORG : VS RECFM . : U ¦ Response Time Data ¦ Cache Statistics ¦
¦LRECL : 4089 BLKSIZE : 4096 ¦----------------------+---------------------¦
¦Key length . : 0 ¦I/O Count . : 3 ¦Eligible % . : 100.0 ¦
¦Key position : 0 ¦I/O per sec : 0.0 ¦Inhibit % . : 0.0 ¦
¦ ¦Avg. IOSQ . : 33.3 ¦Bypass % . . : 0.0 ¦
¦Alloc . : 13 Used : 13 ¦Pending . . : 0.3 ¦Total hit % : 50.0 ¦
¦Volumes : 1 % Used : 100.0 ¦Disconnect . : 12.5 ¦Read hit % . : 50.0 ¦
¦Secondary value : 13 ¦Connect . . : 1.7 ¦Write hit % : 0.0 ¦
¦Secondary unit : Track ¦I/O service : 14.6 ¦Read % . . . : 100.0 ¦
¦No. of extents . 1 ¦Total MSR . : 47.9 ¦Seq'l I/O % : 0.0 ¦
+------------------------------------------------------------------------------+
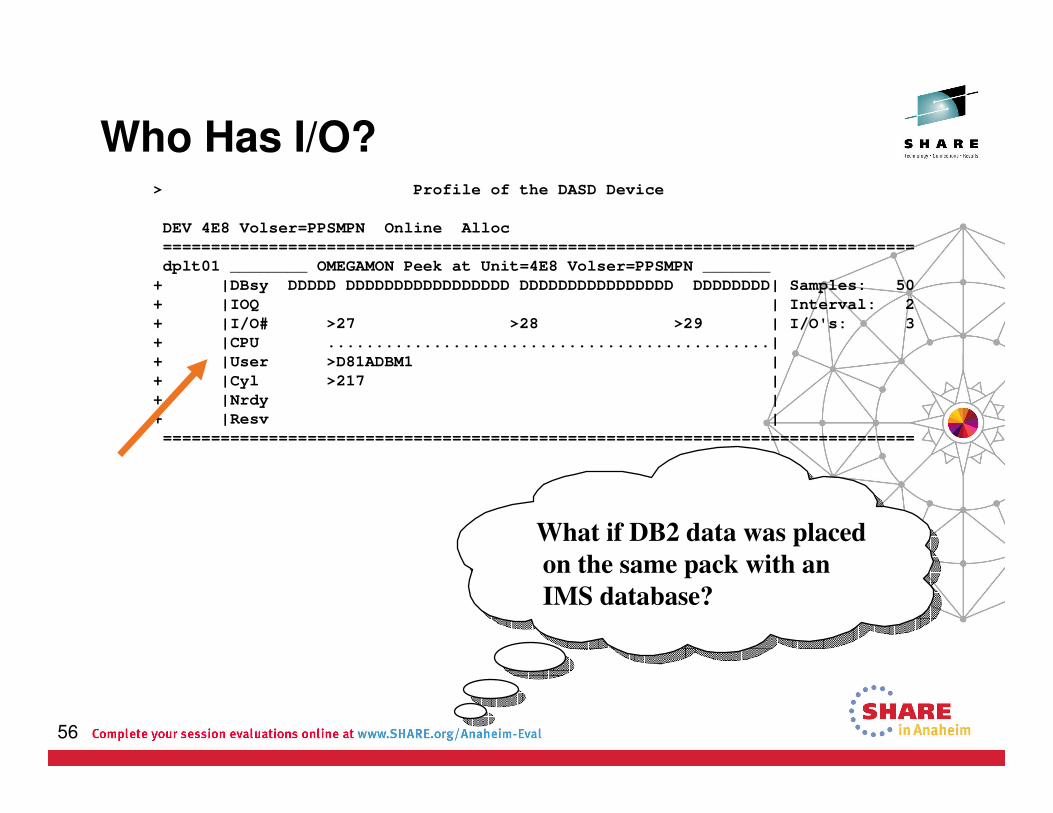
56
Who Has I/O?> Profile of the DASD Device
DEV 4E8 Volser=PPSMPN Online Alloc
==============================================================================
dplt01 ________ OMEGAMON Peek at Unit=4E8 Volser=PPSMPN _______
+ |DBsy DDDDD DDDDDDDDDDDDDDDDD DDDDDDDDDDDDDDDD DDDDDDDD| Samples: 50
+ |IOQ | Interval: 2
+ |I/O# >27 >28 >29 | I/O's: 3
+ |CPU ..............................................|
+ |User >D81ADBM1 |
+ |Cyl >217 |
+ |Nrdy |
+ |Resv |
==============================================================================
What if DB2 data was placed
on the same pack with an
IMS database?

57
Summary

58
Steps to Managing Performance
• Set up objectives
• Monitor transaction response time
• Snap shot and trending
• Pinpoint the bottleneck
• Message flooding
• Locking contention
• Database I/O
• Logging and DBRC
• Network congestion
• Correct the problem

59
Correlate Metrics with z/OS, TCP, DB2, SMS
� CPU – top CPU Consumers, looping Jobs, excessive CPU tasks,
GCP, zIIP
� Memory / Storage – ECSA/CSA storage leaks
� I/O – high volume response time, IOSQ, pending, disconnect,
connect Times
� TCP/IP - timeouts, backlog limit, backlog connections rejected
� WLM - Performance Index >1
� Sysplex - Coupling Facility
� Unix System Services – processes, files I/O, threads connection
pooling for distributed systems
� FTP Jobs – long holding a dataset
� Batch Jobs - delay, long waits, back-out issues
� DB2 – lockouts, timeouts
� …and monitor third party gateway / connectors
60
Summary
• Monitor and measure system routinely
• Understand workloads, priorities, trending
• Obtain a global view of your entire system and application performance health
61
References
• IMS product documentation
• IMS Webcasts by Deepak Kohli
• IMS regions simplified, clarified and demystified: PART 1 & PART 2 (Aug 27 & Oct 15, 2013)
• Replay URL: http://ibm.co/16WNtBE
• IMS Performance Monitoring and Tuning Update Redbook, SG24-6404-00
• IMS Performance Guide Redbook, SG24-4637-00
• IMS Slideshare and SHARE conference presentations
• IBM OMEGAMON XE for IMS User’s Guide
• www.ibm.com/ims

62
Thank You!