SHAPING SUCCESS - s21.q4cdn.coms21.q4cdn.com/969015058/files/doc_financials/VRTV-2014AR.pdf · Net...
104
2014 ANNUAL REPORT SHAPING SUCCESS
Transcript of SHAPING SUCCESS - s21.q4cdn.coms21.q4cdn.com/969015058/files/doc_financials/VRTV-2014AR.pdf · Net...

2014 ANNUAL REPORT
SHAPING SUCCESS
Facebook.com/VeritivCorp
Twitter.com/Veritiv Twitter.com/VeritivIR
LinkedIn.com/company/Veritiv
VER
ITIV C
OR
POR
ATION
| 2014 AN
NU
AL R
EPOR
T
6600 Governors Lake Parkway Norcross, Georgia 30071veritivcorp.com

We leverage our global network of specialized papermakers to deliver the most comprehensive selection of best-in-class commercial, business, and digital paper products in the market.
Veritiv provides paper brokerage and print management services to end users through our two complementary publishing and print management companies, Bulkley Dunton Publishing Group and Graphic Communications.
PUBLISHING & PRINT MANAGEMENT
From concept to design and production to distribution, we have the insights and experience to help customers discover all the ways packaging can generate more efficiencies, more sales, and more profits.
PACKAGING
Our comprehensive selection of facility solutions products, management programs, and advanced analysis tools help customers maintain a clean, healthy environment.
FACILITY SOLUTIONS
TRANSFER AGENT & REGISTRARComputershareP.O. Box 30170College Station, TX 77842
computershare.com/investor866.276.9370
INDEPENDENT REGISTERED PUBLIC ACCOUNTING FIRM FOR 2014Deloitte & Touche LLP Cincinnati, OH
ANNUAL MEETINGThe Veritiv Corporation Annual Meeting will be held on Wednesday, May 20, 2015 in Atlanta, GA.
INVESTOR CONTACTNeil A. Russell Senior Vice President Corporate Affairs
[email protected] 844.845.2136
ANNUAL REPORT & FORM 10-K COPIESCopies of the Annual Report and Form 10-K are available and may be obtained by contacting:
Veritiv Corporationc/o Investor Relations6600 Governors Lake Parkway Norcross, GA 30071
844.845.2136ir.veritivcorp.com
FORWARD-LOOKING STATEMENTSCertain statements contained in this report regarding the Company’s future operating results, performance, business plans, prospects, guidance and any other statements not constituting historical fact are “forward-looking statements” subject to the safe harbor created by the Private Securities Litigation Reform Act of 1995. All forward-looking statements reflect only the Company’s current beliefs and assumptions with respect to future operating results, performance, business plans, prospects, guidance and other matters, and are based on information currently available to the Company. Accordingly, the statements are subject to significant risks, uncertainties and contingencies, which could cause the Company’s actual operating results, performance or business plans or prospects to differ materially from those expressed in, or implied by, these statements.
For a detailed discussion of specific risks and uncertainties that could cause actual results to differ from those contained in the forward-looking statements, see the information under the heading “Risk Factors” in our Annual Report on Form 10-K for the year ended December 31, 2014, which is included in this report, and in other filings we make with the SEC. The Company undertakes no obligation to update or revise the forward-looking statements, whether as a result of new information, future events or otherwise, except as required by law. In addition, historical information should not be considered as an indicator of future performance.
DESIGN: SAVAGE BRANDS, HOUSTON, TEXAS
Shareholder Information

Veritiv Corporation (NYSE: VRTV) is a leading North American business-to-business distributor of print, publishing, packaging, facility, and logistics solutions. Veritiv was established in 2014, following the merger of International Paper Company’s xpedx division and Unisource Worldwide. Veritiv has emerged as a business-to-business distri bution solutions leader in North America. Today, our focus on customers and our commitment to operational excellence allow us to partner with world-class suppliers and deliver solutions to a wide range of customer segments.
01

Financial Highlights
02
In millions, except per share amounts, at December 31 2014 2013
PRO FORMA 1,2:
Net Sales $ 9,314.1 $ 9,741.5
Cost of Products Sold 7,745.9 8,107.2
Net Sales Less Cost of Products Sold 1,568.2 1,634.3
Adjusted EBITDA 153.6 161.3
Adjusted EBITDA as a Percentage of Net Sales 1.6% 1.7%
AS REPORTED:
Net Income (Loss) $ (19.6) $ 0.2
Basic and Diluted Earnings (Loss) Per Share (1.62) 0.02
Weighted – Average Shares Outstanding – basic and diluted 12.08 8.16
1 Amounts calculated on a pro forma basis, which assumes the merger with UWW Holdings, Inc. and the related financing occurred on January 1, 2013, as well as purchase accounting adjustments and adjustments for one-time costs related to the merger.
2 For our Non-GAAP reconciliations see our 2014 Annual Report on Form 10-K, beginning on page 28.
3 The remaining one percent of net sales is contributed by our Corporate and Other category, which includes our logistics solutions business.
2014 NET SALES BY BUSINESS SEGMENT 3
(In millions, at December 31)
PRINT: $3,690
40%
PACKAGING: $2,821
30%
PUBLISHING & PRINT MANAGEMENT: $1,332
14% 15%
FACILITY SOLUTIONS: $1,388
$9.3B1,2
2014 Net Sales
$154M1,2 Adjusted EBITDA

MARY LASCHINGER Chairman and Chief Executive Officer
To Our Shareholders,
Our history goes back more than 150 years, and on July 1, 2014, we created Veritiv Corporation – a strong, financially viable company, strategically focused on what our legacy businesses have done so well – distribution and customer solutions.
Our legacy companies achieved past success by upholding high standards of efficiency, integrity, accountability, and customer focus. We leverage this rich history as one team shaping success through exceptional service, innovative people, and consistent values. Our combined capabilities allow us to design, source, and deliver cus tomer solutions at a level that is unparalleled in the industry. We are proud of our leadership position and proud to be listed on the New York Stock Exchange among hundreds of other notable companies.
Now, our focus is on execution – implementing our plan to integrate the operations of our legacy compa-nies and delivering stated synergies to achieve cost savings, while continuing to support our customers and enhance operational excellence. I am pleased to say that we are off to a great start. Each step in this journey brings new opportunities to shape success for all of our stakeholders, and the Veritiv team is tremendously excited about the future.
2014 FINANCIAL HIGHLIGHTS I am pleased to report that Veritiv’s 2014 financial results were strong. When we formed the Company, we announced a plan to deliver $150 to $255 million in net synergies realization over five years. We are on track for this long-term goal, and we have accelerated net synergies with approximately 10 percent of the total $150 to $225 million achieved by year-end 2014. This accomplishment is a testament to our robust integration plan and execution of that plan by our hardworking, dedicated Veritiv team.
In the full year 2014, Veritiv reported pro forma net sales of $9.3 billion. We exceeded our goal for pro forma adjusted EBIDTA for the year, closing 2014 at $154 million. As a result, we believe we are
well positioned for future growth. We see opportuni-ties for growth in our Packaging and Facility Solutions segments and to maintain market leadership in Print. We continue to build our position in Canada and see growth opportunities in Mexico.
We look forward to driving shareholder value that is among the best in our peer group through continued diligence toward synergies and integration and solidifying our leadership position in each of our business segments.
BRINGING TOGETHER TWO LEADING COMPANIES AND MAINTAINING A CUSTOMER FOCUSWe are building a values-based culture for the Com-pany, which we believe will ultimately drive operational excellence through to the bottom line. Integration was a top priority in 2014, and will continue to be for the coming years. We are integrating our systems and processes, balancing standardization with the agility, innovation, and most importantly, superior customer service, that are expected of an industry leader.
I am pleased to report that we are on track with our integration plan, and we have great momentum propelling us forward through 2015. We reached several important integration milestones in 2014. We worked to align the Veritiv team around our new organizational structure and operating model; addressed overlap customer accounts, aligning Veritiv customers with a single sales professional; imple-mented employee benefit plans consistent with a dis-tribution company; harmonized our financial policies; introduced a new customer relationship management module; and finalized our new incentive plan structure that aligns the goals of the organization with those that drive shareholder value.
03

Our integration plan is critical in driving value creation, and we also recognize that no amount of planning would matter much without continuing to deliver exceptional service to our customers. It took a com-plex and uncommon transaction to bring our legacy companies together to form Veritiv. During this time, our main objective was to stabilize business operations and minimize disruption for our customers, and I’m proud to say that we have done just that. Our leaders, sales force, and customer service professionals have gone above and beyond to support our customers throughout the transition. They have enriched their customer relationships, and as a result, are supporting profitable growth for the Company.
We have made significant progress, but there is still much work to be done. For the coming year, we have set guideposts for the integration that will make it easier to do business with us. For example, we will begin to integrate our information technology plat-forms, identify preferred suppliers, and continue to roll out our branding and marketing efforts. Our integration plan is ambitious, but I am confident that we have the leadership commitment, resources, strat-egies, and people to execute the plan and deliver on our value creation commitments.
LEADING VERITIV INTO THE FUTUREWe operate in some challenging business environ-ments, and with the right teams and strategies in place, we will be able to make Veritiv successful as a whole. The print industry is under pressure. However, we have the opportunity to develop new strategies and cultivate product categories that support higher growth tech-nologies, such as digital and wide format printing. Packaging is an incredibly fragmented, competitive, and growing industry – and we believe that our value-added services in designing and sourcing cus-tomized packaging are what set us apart from the competition. In the facility solutions business, we are one of a few large providers offering quality products from a wide range of industry-leading suppliers, as well as unique services and rich industry expertise to help customers manage costs. Our in-house logistics ser-vices, which includes value-added freight brokerage,
material handling, warehousing, and kitting, has seen tremendous growth over the past year. We expect to continue to invest in and grow this service category as a complementary offering to new and existing customers.
We have a very exciting opportunity in front of us. As we work to take advantage of that opportunity, it is clear that we won’t get anywhere without our employees. Our success to this point is the product of an innovative and hardworking group of individuals at Veritiv, and I am proud to be part of this amazing team. We are also fortunate to have an experienced and knowledgeable Board of Directors backing our team and guiding the direction of the Company. I believe in our employees’ capabilities and the impact they can have on the growth and prosperity of this company.
Our future success also depends on maintaining and nurturing the valuable relationships we have with our customers and our suppliers. These relationships are integral to our business and our potential. We thank our customers and suppliers for their continued trust in Veritiv.
We have accomplished a tremendous amount of work in just the first six months of our existence. There is no doubt that we have a lot of work ahead of us to con-tinue to integrate our company, achieve the synergies we need to operate successfully, and grow our business profitably and sustainably for the future. I am confi-dent that we have the resources and people necessary to get the work done, and I look forward to continuing to shape success for our customers, our suppliers, our employees, and you – our shareholders.
Thank you for your continued support of Veritiv Corporation.
Mary Laschinger Chairman and Chief Executive Officer
04
1 As of December 31, 2014. All data reflects Veritiv operations worldwide with the exception of warehouse locations and square footage, which reflect our North American distribution network only.
~8,900 Employees
VERITIV BY THE NUMBERS1
~$8B Products and Services Sourced
~7,000 Suppliers
>180 Warehouse Locations
~60,000 Customers
~22 Million Square Feet of Warehouse Space
The name Veritiv comes from the roots of three words: verity, meaning truthful and honest, and active and connective. We are true to our word, true to our customers’ needs, and true to our values. We connect to our customers in a real and lasting way, and we collaborate with our customers to find innovative solutions to their most complex problems. But Veritiv is more than a name – it is a promise that we must deliver on each and every day. We have the world-class cus-tomers and suppliers, value-added capabili-ties, and an exceptional team necessary to help us deliver on that promise.Learn more at veritivcorp.com
SHAREHOLDERS LETTER

INTEGRITYWe do the right things, act with honesty and consistency, and truthfully represent our capabilities.
ONE TEAMWe collaborate as one team based on what is best for Veritiv as a whole, and treat each other with mutual respect.
PEOPLE COMMITMENTWe engage our employees in the organization’s success and are committed to performance management and talent development.
CUSTOMER FOCUSWe are committed to understanding our customers’ needs and providing solutions that add value.
OPERATIONAL EXCELLENCEWe consistently execute, measure, and improve the safety, efficiency, and quality of the work we do every single day.
PASSION FOR RESULTSWe are passionate about winning and our desire to meet financial, operational, and people commitments in the right way.
SUPPLIERSWe depend on our expansive network of suppliers to help fulfill our commitments to our customers, and we bring value to our suppliers by providing reach to our world-class customer base.
INVESTORSWe aim to create value for our shareholders by achieving synergies and delivering operational excellence.
EMPLOYEESOur team of experienced and dedicated professionals is our greatest competitive strength, and in return, we offer Veritiv employees a safe and rewarding work environment.
CUSTOMERWe are committed to understanding the needs of our customers and designing, sourcing, and delivering quality solutions that add value.
OUR VISION & VALUES
One team shaping success through exceptional service, innovative people, and consistent values.
SHAPING SUCCESS FOR OUR KEY STAKEHOLDERS
05

06
We leverage our global network of specialized papermakers and printers to deliver the most comprehensive selection of best-in-class commercial, business, and digital paper products in the market, including:• Digital paper and synthetics• Graphics supplies and equipment• Flexography
• Offset printing supplies• Specialty paper• Wide format supplies and equipment
Our Veritiv exclusive brands represent a range of product categories including coated paper, coated board, digital, imaging, and a full array of pressroom supplies. Veritiv also supports three Chain of Custody certi-fications – Forest Stewardship Council® (FSC®), Sustainable Forestry Initiative® (SFI®), and Programme for the Endorsement of Forest Certifi-cation (PEFC).
The print products we sell and distribute are used by commercial printers, in-plant print facilities, data centers, print design agencies, and others to produce a range of communications, including catalogs, brochures, adver-tising supplements, annual reports, business forms, and retail circulars.
Our team of experienced sales professionals understands the wide range of printing products available and can identify tailored solutions that reduce resource spending, assure reliability, and increase supply-chain transparency.
Veritiv provides paper brokerage and print management services to end users, including publishers, catalogers, retailers, printers, and specialty busi-nesses, through our two complementary publishing and print management companies, Bulkley Dunton Publishing Group and Graphic Communications.
Our experienced industry consultants are strategically partnered with leading paper mills to offer a wide range of high-quality coated and uncoated com-mercial printing paper solutions that optimize our customers’ production spend on materials such as books, catalogs, couponing and retail inserts, direct mail, directories, and magazines.
We support customers throughout the printing process, serving as a liaison between paper mills, printers, and key stakeholders, and adding valuable industry insight throughout the process to reduce the complexity and cost of producing printed materials. Our customized solutions give customers the most return on their printed programs, while allowing them to focus on their core strengths to grow their businesses.
“Our scale, logistics capabilities, and experienced sales team differentiate Veritiv from our competitors. We are focused on growing in the space of emerging technologies, such as digital and wide format printing. We believe we are positioned to win in the print space.”Dan Watkoske, Senior Vice President, Print
Market leader in Print in North America.
Percentage of net sales: 40%
“Veritiv’s Publishing and Print Management group aims to create meaningful, long-term solutions and to become the strategic supplier for our customers. Our highly knowledgeable sales and execution teams and continued collaboration with our Print business should position Veritiv for success in the publishing market.” Barry Nelson, Senior Vice President, Publishing and Print Management
Market leader in Publishing and Print Management in North America.
Percentage of net sales: 14%
Veritiv at a Glance
PRINT PUBLISHING & PRINT MANAGEMENT

Veritiv works with customers to help rethink their packaging – what it’s made from, how it’s designed and engineered, and how it gets where it needs to go quickly, safely, and efficiently.
We offer a full-service platform for designing, sourcing, and delivering stan-dard and custom packaging for consumer goods, such as electronics and food products, industrial and manufacturing components, point-of-sale displays, and more. The TUFflex® line of packaging products, offered exclusively by Veritiv, delivers enduring performance, maximum efficiency, and unmatched value; and includes carton sealing tape, specialty tape, machine stretch film, and hand stretch film. We also sell and distribute single function and fully automated packaging equipment, and offer assembly and fulfillment services, such as kitting.
Approximately 50 percent of our packaging business is comprised of custom packaging solutions designed in our network of packaging design centers. Our designers balance performance, creativity, and cost control to bring you the best solutions to engage consumers and drive revenue. Our custom packaging capabilities span from environmentally conscious products to molded fiber solutions and include everything in between. We are material-neutral, which means that we have a range of materials – including fiber, resin, foam, and plastics – at our disposal to develop the right packaging solution for each and every customer.
Veritiv understands that clean, healthy, safe, and well-maintained environ-ments significantly impact performance. Our comprehensive selection of facility solutions products, management programs, and advanced analysis tools help customers achieve their unique business goals while reducing energy, waste, and cost.
Our Facility Solutions customers represent a range of industries and include building service contractors, food service providers, healthcare facilities, higher education institutions, government agencies, manufacturers, property managers, retail outlets, sporting and entertainment facilities, and more. No matter the business, Veritiv has the products and services – from towels and tissues to cleaning chemicals and trash can liners – to improve facilities from the floor up. Our exclusive facility solutions product line, Reliable® Brand, has an integrated product portfolio of cleaning and personal care products with value advantage. We also offer sustainability and Leadership in Energy & Environmental Design (LEED) scoring services, supply chain, and logistics support, and deploy technology tools to make customers’ facility solutions experience smooth and efficient. For example, our workloading software assesses customers’ current processes to identify potential time, labor, and cost-saving opportunities.
Our North American presence is extensive, which means we can offer next day delivery to 95 percent of our customer population. We service our customers in smaller, local markets through FORDIS® and Saalfeld®, our facility solutions redistribution arms.
07
“We believe we have significant growth opportunities in our packaging business, both in the U.S. and internationally. These opportunities, paired with the unique value we provide to our customers, make Veritiv an industry leader in packaging.” Darin Tang, Senior Vice President, Packaging
Market leader in Packaging in North America.
Percentage of net sales: 30%
“Veritiv Facility Solutions has the reach to develop and monetize innovative solutions. Our footprint extends across North America, and includes a diverse customer base and a world-class set of supplier partners.” Joe Myers, Senior Vice President, Facility Solutions, Strategy and Commercial Excellence
Leading provider of Facility Solutions in North America.
Percentage of net sales: 15%
FACILITY SOLUTIONSPACKAGING

Front row from left to right: Thomas S. Lazzaro, Mary A. Laschinger, Joseph B. Myers; Middle row from left to right: Stephen J. Smith, Elizabeth A. Patrick, Neil A. Russell, Daniel J. Watkoske, Bruce Henry; Back row from left to right: Barry R. Nelson, Darin W. Tang, Mark W. Hianik
MARY A. LASCHINGERChairman and Chief Executive Officer
BRUCE HENRYSenior Vice President Integration and Change Management
MARK W. HIANIK Senior Vice President, General Counsel and Corporate Secretary
THOMAS S. LAZZARO Senior Vice President Field Sales and Operations
JOSEPH B. MYERS Senior Vice President Facility Solutions, Strategy and Commercial Excellence
BARRY R. NELSON Senior Vice President Publishing and Print Management
ELIZABETH A. PATRICK Senior Vice President and Chief Human Resources Officer
NEIL A. RUSSELL Senior Vice President Corporate Affairs
STEPHEN J. SMITH Senior Vice President and Chief Financial Officer
DARIN W. TANG Senior Vice President Packaging
DANIEL J. WATKOSKE Senior Vice President Print
08
SENIOR LEADERSHIP TEAM
BOARD OF DIRECTORS
MARY A. LASCHINGERChairman and Chief Executive Officer
WILLIAM E. MITCHELL Presiding Director, Founding Partner of Sequel Capital Management, LLC
SETH A. MEISEL2, 3*
Managing Director of Bain Capital, LLC
DANIEL T. HENRY 1*, 2
Retired Chief Financial Officer and Executive Vice President of American Express Company
CHARLES G. WARD, III1, 3
Partner at Perella Weinberg Partners
ALLAN R. DRAGONE, JR. President and Chief Operating Officer of GCA Services Group, Inc.
MICHAEL P. MULDOWNEY 1, 2
Chief Financial Officer of Gordon Brothers Group
TRACY A. LEINBACH1, 3
Retired Executive Vice President and Chief Financial Officer of Ryder System, Inc.
JOHN J. ZILLMER2*, 3
Retired Executive Chairman of Univar Inc.
Board Committees1 Audit and Finance2 Compensation and
Leadership Development 3 Nominating and
Governance* Denotes Committee Chair
Leadership

24MAR201512530288
UNITED STATESSECURITIES AND EXCHANGE COMMISSION
Washington, D.C. 20549
FORM 10-K� ANNUAL REPORT PURSUANT TO SECTION 13 OR 15(d) OF THE SECURITIES
EXCHANGE ACT OF 1934For the fiscal year ended December 31, 2014
OR
� TRANSITION REPORT PURSUANT TO SECTION 13 OR 15(d) OF THE SECURITIESEXCHANGE ACT OF 1934
For the transition period from to Commission file number 001-36479
VERITIV CORPORATION(Exact name of registrant as specified in its charter)
Delaware 46-3234977(State or other jurisdiction of (I.R.S Employer Identification Number)incorporation or organization)
6600 Governors Lake Parkway 30071Norcross, Georgia (Zip code)
(Address of principal executive offices)
Registrant’s telephone number, including area code: (770) 447-9000
Securities registered pursuant to Section 12(b) of the Act:
Title of each class Name of each exchange on which registered
Common stock, $0.01 par value New York Stock Exchange
Securities registered pursuant to Section 12(g) of the Act: None
Indicate by check mark if the registrant is a well-known seasoned issuer, as defined in Rule 405 of the Securities Act. Yes � No �
Indicate by check mark if the registrant is not required to file reports pursuant to Section 13 or Section 15(d) of the Act. Yes � No �
Indicate by check mark whether the registrant (1) has filed all reports required to be filed by Section 13 or 15(d) of the SecuritiesExchange Act of 1934 during the preceding 12 months (or for such shorter period that the registrant was required to file such reports), and(2) has been subject to such filing requirements for the past 90 days. Yes � No �
Indicate by check mark whether the registrant has submitted electronically and posted on its corporate Web site, if any, every InteractiveData File required to be submitted and posted pursuant to Rule 405 of Regulation S-T (§232.405 of this chapter) during the preceding12 months (or for such shorter period that the registrant was required to submit and post such files). Yes � No �
Indicate by check mark if disclosure of delinquent filers pursuant to Item 405 of Regulation S-K (§229.405 of this chapter) is notcontained herein, and will not be contained, to the best of registrant’s knowledge, in definitive proxy or information statements incorporatedby reference in Part III of this Form 10-K or any amendment to this Form 10-K. �
Indicate by check mark whether the registrant is a large accelerated filer, an accelerated filer, a non-accelerated filer, or a smallerreporting company. See the definitions of ‘‘large accelerated filer’’, ‘‘accelerated filer’’ and ‘‘smaller reporting company’’ in Rule 12b-2 of theExchange Act.
Large accelerated filer � Accelerated filer � Non-accelerated filer � Smaller reporting company �(Do not check if a
smaller reporting company)
Indicate by check mark whether the registrant is a shell company (as defined in Rule 12b-2 of the Act). Yes � No �
As of June 30, 2014, the registrant’s common stock was not publicly traded.
The number of shares outstanding of the registrant’s common stock as of March 16, 2015 was 16,000,000.
DOCUMENTS INCORPORATED BY REFERENCE
Portions of the Company’s Proxy Statement for the 2015 Annual Meeting of Shareholders are incorporated by reference into Part III ofthis Form 10-K.

TABLE OF CONTENTS
Page
EXPLANATORY NOTE . . . . . . . . . . . . . . . . . . . . . . . . . . . . . . . . . . . . . . . . . . . . . . . . . . . . . . . . . . . . . . . . . . 1CAUTIONARY NOTE ON FORWARD-LOOKING STATEMENTS . . . . . . . . . . . . . . . . . . . . . . . . . . . . . . . . . . . 1
Part IItem 1. Business . . . . . . . . . . . . . . . . . . . . . . . . . . . . . . . . . . . . . . . . . . . . . . . . . . . . . . . . . . . . . . . . . . . . 2Item 1A. Risk Factors . . . . . . . . . . . . . . . . . . . . . . . . . . . . . . . . . . . . . . . . . . . . . . . . . . . . . . . . . . . . . . . . . . 9Item 1B. Unresolved Staff Comments . . . . . . . . . . . . . . . . . . . . . . . . . . . . . . . . . . . . . . . . . . . . . . . . . . . . . . 22Item 2. Properties . . . . . . . . . . . . . . . . . . . . . . . . . . . . . . . . . . . . . . . . . . . . . . . . . . . . . . . . . . . . . . . . . . . 22Item 3. Legal Proceedings . . . . . . . . . . . . . . . . . . . . . . . . . . . . . . . . . . . . . . . . . . . . . . . . . . . . . . . . . . . . . 23Item 4. Mine Safety Disclosures . . . . . . . . . . . . . . . . . . . . . . . . . . . . . . . . . . . . . . . . . . . . . . . . . . . . . . . . . 23
Part IIItem 5. Market for Registrant’s Common Equity, Related Stockholder Matters and Issuer Purchases of Equity
Securities . . . . . . . . . . . . . . . . . . . . . . . . . . . . . . . . . . . . . . . . . . . . . . . . . . . . . . . . . . . . . . . . . . 23Item 6. Selected Financial Data . . . . . . . . . . . . . . . . . . . . . . . . . . . . . . . . . . . . . . . . . . . . . . . . . . . . . . . . . 25Item 7. Management’s Discussion and Analysis of Financial Condition and Results of Operations . . . . . . . . . 26Item 7A. Quantitative and Qualitative Disclosures About Market Risk . . . . . . . . . . . . . . . . . . . . . . . . . . . . . . 44Item 8. Financial Statements and Supplementary Data . . . . . . . . . . . . . . . . . . . . . . . . . . . . . . . . . . . . . . . . . 45Item 9. Changes in and Disagreements With Accountants on Accounting and Financial Disclosure . . . . . . . . . 85Item 9A. Controls and Procedures . . . . . . . . . . . . . . . . . . . . . . . . . . . . . . . . . . . . . . . . . . . . . . . . . . . . . . . . . 85Item 9B. Other Information . . . . . . . . . . . . . . . . . . . . . . . . . . . . . . . . . . . . . . . . . . . . . . . . . . . . . . . . . . . . . 85
Part IIIItem 10. Directors, Executive Officers and Corporate Governance . . . . . . . . . . . . . . . . . . . . . . . . . . . . . . . . . 85Item 11. Executive Compensation . . . . . . . . . . . . . . . . . . . . . . . . . . . . . . . . . . . . . . . . . . . . . . . . . . . . . . . . . 86Item 12. Security Ownership of Certain Beneficial Owners and Management and Related Stockholder Matters . 86Item 13. Certain Relationships and Related Transactions, and Director Independence . . . . . . . . . . . . . . . . . . . 86Item 14. Principal Accountant Fees and Services . . . . . . . . . . . . . . . . . . . . . . . . . . . . . . . . . . . . . . . . . . . . . . 86
Part IVItem 15. Exhibits and Financial Statement Schedules . . . . . . . . . . . . . . . . . . . . . . . . . . . . . . . . . . . . . . . . . . . 86
SIGNATURES . . . . . . . . . . . . . . . . . . . . . . . . . . . . . . . . . . . . . . . . . . . . . . . . . . . . . . . . . . . . . . . . . . . . . . . . 87EXHIBIT INDEX . . . . . . . . . . . . . . . . . . . . . . . . . . . . . . . . . . . . . . . . . . . . . . . . . . . . . . . . . . . . . . . . . . . . . 88

EXPLANATORY NOTE
On July 1, 2014, International Paper Company completed the spin-off of its xpedx distribution solutions business (‘‘xpedx’’) tothe International Paper Company shareholders. Immediately following the spin-off, UWW Holdings, Inc., the parent company ofUnisource Worldwide, Inc. (‘‘Unisource’’), was merged with and into xpedx to form a new publicly traded company known as VeritivCorporation (‘‘Veritiv’’).
Because the spin-off and merger transactions were consummated on July 1, 2014:
• The Veritiv Consolidated and Combined Statements of Operations, Statements of Comprehensive Income (Loss), Statementsof Cash Flows and Statements of Shareholders’ Equity and Notes thereto presented in this report for the year endedDecember 31, 2014 include the legacy xpedx business for the full twelve months presented and the legacy Unisource resultsfrom July 1, 2014. The Veritiv Combined Statements of Operations, Statements of Comprehensive Income (Loss), Statementsof Cash Flows and Statements of Shareholders’ Equity and Notes thereto presented in this report for the years endedDecember 31, 2013 and 2012 reflect the results of the legacy xpedx business only.
• The Veritiv Consolidated Balance Sheet and Notes thereto presented in this report as of December 31, 2014 reflect the assets,liabilities and equity of the combined legacy xpedx and Unisource businesses. The Veritiv Combined Balance Sheet and Notesthereto presented in this report as of December 31, 2013 reflect the assets, liabilities and equity of the legacy xpedx businessonly.
Additionally, the financial information presented in Part II, Item 7—Management’s Discussion and Analysis of FinancialCondition and Results of Operations—of this report, and elsewhere, is consistent with the above Consolidated and Combinedfinancial statement presentation.
CAUTIONARY NOTE ON FORWARD-LOOKING STATEMENTS
Certain statements contained in this report regarding the Company’s future operating results, performance, business plans, prospects,guidance and any other statements not constituting historical fact are ‘‘forward-looking statements’’ subject to the safe harbor created by thePrivate Securities Litigation Reform Act of 1995. Where possible, the words ‘‘believe,’’ ‘‘expect,’’ ‘‘anticipate,’’ ‘‘intend,’’ ‘‘should,’’ ‘‘will,’’‘‘would,’’ ‘‘planned,’’ ‘‘estimated,’’ ‘‘potential,’’ ‘‘goal,’’ ‘‘outlook,’’ ‘‘may,’’ ‘‘predicts,’’ ‘‘could,’’ or the negative of such terms, or othercomparable expressions, as they relate to the Company or its management, have been used to identify such forward-looking statements. Allforward-looking statements reflect only the Company’s current beliefs and assumptions with respect to future operating results, performance,business plans, prospects, guidance and other matters, and are based on information currently available to the Company. Accordingly, thestatements are subject to significant risks, uncertainties and contingencies, which could cause the Company’s actual operating results,performance or business plans or prospects to differ materially from those expressed in, or implied by, these statements.
Factors that could cause actual results to differ materially from current expectations include risks and other factors described under‘‘Risk Factors’’ in this report and elsewhere in the Company’s publicly available reports filed with the Securities and Exchange Commission(‘‘SEC’’), which contain a discussion of various factors that may affect the Company’s business or financial results. Such risks and otherfactors, which in some instances are beyond the Company’s control, include: the industry-wide decline in demand for paper and relatedproducts; procurement and other risks in obtaining packaging, paper and facility products from our suppliers for resale to our customers;increased competition from existing and non-traditional sources; loss of significant customers; our ability to collect trade receivables fromcustomers to whom we extend credit; successful integration of the legacy xpedx and Unisource businesses and realization and timing of theexpected synergy and other cost savings from the Merger; fuel cost increases; inclement weather, anti-terrorism measures and otherdisruptions to the transportation network; our ability to generate sufficient cash to service our debt; our ability to comply with the covenantscontained in our debt agreements; our ability to refinance or restructure our debt on reasonable terms and conditions as might be necessaryfrom time to time; our ability to put in place in a timely manner the Sarbanes-Oxley procedures necessary as a public company; increasinginterest rates; foreign currency fluctuations; changes in accounting standards and methodologies; regulatory changes and judicial rulingsimpacting our business; adverse results from litigation, governmental investigations or audits, or tax related proceedings or audits; the effectsof work stoppages, union negotiations and union disputes; our reliance on third-party vendors for various services; and other events ofwhich we are presently unaware or that we currently deem immaterial that may result in unexpected adverse operating results.
1

For a more detailed discussion of these factors, see the information under the heading ‘‘Risk Factors’’ in this report and in other filingswe make with the SEC. Forward-looking statements are made only as of the date hereof, and the Company undertakes no obligation toupdate or revise the forward-looking statements, whether as a result of new information, future events or otherwise, except as required bylaw. In addition, historical information should not be considered as an indicator of future performance.
PART I
ITEM 1. BUSINESS
Our Company
Veritiv Corporation (‘‘Veritiv’’ or the ‘‘Company’’ and sometimes referred to in this Annual Report on Form 10-K as ‘‘we’’,‘‘our’’, ‘‘us’’, or ‘‘ourselves’’) is a leading North American business-to-business distributor of print, publishing, packaging, facility andlogistics solutions. Veritiv was established in 2014, following the merger of International Paper Company’s (‘‘International Paper’’ or‘‘Parent’’) xpedx distribution solutions business and UWW Holdings, Inc. (‘‘UWWH’’), the parent company of Unisource.Independently, the two companies achieved past success by continuously upholding high standards of efficiency and customer focus.Through leveraging this combined history of operational excellence, Veritiv evolved into one team shaping its success throughexceptional service, innovative people and consistent values. Today, Veritiv’s focus on segment-tailored market leadership indistribution and a commitment to operational excellence allows it to partner with world class suppliers, add value through multiplecapabilities and deliver solutions to a wide range of customer segments.
We operate from more than 180 distribution centers primarily throughout the U.S., Canada and Mexico, serving customersacross a broad range of industries. These customers include printers, publishers, commercial printing, data centers, manufacturers,higher education institutions, healthcare facilities, sporting and performance arenas, retail stores, government agencies, propertymanagers and building service contractors.
Veritiv’s business is organized under four reportable segments: Print, Publishing, Packaging and Facility Solutions. The Companyalso has a Corporate & Other category which includes certain assets and costs not primarily attributable to any of the reportablesegments, as well as our Veritiv Logistics Solutions business which provides transportation and warehousing solutions. The followingsummary describes the products and services offered in each of the reportable segments:
• Print—The Print segment sells and distributes commercial printing, writing, copying, digital, wide format and specialty paperproducts, graphics consumables and graphics equipment primarily in the U.S., Canada and Mexico. This segment also includescustomized paper conversion services of commercial printing paper for distribution to document centers and form printers.Our broad geographic platform of operations coupled with the breadth of paper and graphics products, including our exclusiveprivate brand offerings, provides a foundation to service national, regional and local customers across North America.
• Publishing—The Publishing segment sells and distributes coated and uncoated commercial printing papers to publishers,retailers, converters, printers and specialty businesses for use in magazines, catalogs, books, directories, gaming, couponing,retail inserts and direct mail. This segment also provides print management, procurement and supply chain managementsolutions to simplify paper and print procurement processes for its customers.
• Packaging—The Packaging segment provides standard as well as custom and comprehensive packaging solutions for customersbased in North America and in key global markets. The business is strategically focused on higher growth industries includinglight industrial/general manufacturing, food manufacturing, fulfillment and internet retail, as well as niche verticals based ongeographical and functional expertise. Veritiv’s packaging professionals create customer value through supply chain solutions,structural and graphic packaging design and engineering, automation, workflow and equipment services, and contractpackaging, kitting and fulfillment.
• Facility Solutions—The Facility Solutions segment sources and sells cleaning, break-room and other supplies such as towels,tissues, wipers and dispensers, can liners, commercial cleaning chemicals, soaps and sanitizers, sanitary maintenance suppliesand equipment, safety and hazard supplies, and shampoos and amenities primarily in the U.S., Canada and Mexico. Veritiv isa leading distributor in the Facility Solutions segment. We offer a world class network of leading suppliers in all categories,total cost of ownership solutions with re-merchandising, budgeting
2

and compliance, inventory management, consistent multi-local supply solutions, and a sales-force trained to bring leadingvertical expertise to all of the major North American geographies.
The table below summarizes net sales for each of the above segments, as a percentage of consolidated net sales:
Year EndedDecember 31,
2014 2013 2012
Print . . . . . . . . . . . . . . . . . . . . . . . . . . . . . . . . . . . . . . . . . . . . . . . . . . . . . . . . . . . 40% 43% 44%Publishing . . . . . . . . . . . . . . . . . . . . . . . . . . . . . . . . . . . . . . . . . . . . . . . . . . . . . . . 15% 14% 14%Packaging . . . . . . . . . . . . . . . . . . . . . . . . . . . . . . . . . . . . . . . . . . . . . . . . . . . . . . . . 30% 28% 26%Facility Solutions . . . . . . . . . . . . . . . . . . . . . . . . . . . . . . . . . . . . . . . . . . . . . . . . . . . 14% 15% 16%Corporate & Other . . . . . . . . . . . . . . . . . . . . . . . . . . . . . . . . . . . . . . . . . . . . . . . . . 1% —% —%
Total . . . . . . . . . . . . . . . . . . . . . . . . . . . . . . . . . . . . . . . . . . . . . . . . . . . . . . . . . . . 100% 100% 100%
Additional financial information regarding our reportable business segments and certain geographic information is included inItem 7 of this report and in Note 17 of the Notes to Consolidated and Combined Financial Statements in Item 8 of this report.
Our History
On July 1, 2014 (the ‘‘Distribution Date’’), International Paper completed the previously announced spin-off of xpedx to theInternational Paper shareholders (the ‘‘Spin-off’’), forming a new public company called Veritiv. Immediately following the Spin-off,UWWH merged with and into Veritiv (the ‘‘Merger’’). The Spin-off and the Merger are collectively referred to as the ‘‘Transactions’’.
On the Distribution Date, 8,160,000 shares of Veritiv common stock were distributed on a pro rata basis to the InternationalPaper shareholders of record as of the close of business on June 20, 2014. Immediately following the Spin-off, but prior to theMerger, International Paper’s shareholders owned all of the outstanding shares of Veritiv common stock.
Immediately following the Spin-off on the Distribution Date, UWW Holdings, LLC, the sole stockholder of UWWH, (the‘‘UWWH Stockholder’’) which is jointly owned by Bain Capital and Georgia-Pacific, received 7,840,000 shares of Veritiv commonstock for all of the outstanding shares of UWWH common stock that it held on the Distribution Date, in a private placementtransaction.
Immediately following the completion of the Transactions, International Paper shareholders owned approximately 51%, and theUWWH Stockholder owned approximately 49%, of the shares of Veritiv common stock on a fully-diluted basis. Immediatelyfollowing the completion of the Spin-off, International Paper did not own any shares of Veritiv common stock. Veritiv’s commonstock began regular-way trading on the New York Stock Exchange on July 2, 2014 under the ticker symbol VRTV.
International Paper’s distribution business was consolidated into a division operating under the xpedx name in 1998 to serve theU.S. and Mexico markets. International Paper grew its distribution business both organically and through the acquisition of over 30distribution businesses located across the U.S. and Mexico. Unisource was a wholly-owned subsidiary of Alco Standard Corporationuntil its spin-off of Unisource in December 1996 whereby Unisource became a separate public company. Unisource was acquired byGeorgia-Pacific, now owned by Koch Industries, in July 1999. In November 2002, Bain Capital acquired approximately a 60%ownership interest in Unisource, while Georgia-Pacific retained approximately a 40% ownership interest.
Products and Services
Veritiv distributes well-known national and regional branded products as well as products marketed under its own private labelbrands. Products under the Company’s private label brands are manufactured by third-party suppliers in accordance withspecifications established by the Company. Our portfolio of private label products includes:
• Coated and uncoated papers, coated board and cut size under the Endurance, uBrand, nordic+, Econosource, Comet,Starbrite Opaque Ultra, porcelianECO 30 and other brands,
3

• Packaging products under the TUFflex brand, which include stretch film, carton sealing tape and other specialty tapes, and
• Cleaning chemicals, skin care products, sanitary maintenance supplies and a wide range of facility supplies products under theReliable and Spring Grove brands.
For the year ended December 31, 2014, sales of products sold under private label brands accounted for approximately 12% ofconsolidated net sales. On a segment basis, private label sales in the Print, Packaging and Facility Solutions segments accounted forapproximately 21%, 8% and 9%, respectively, of that segment’s total net sales for the year ended December 31, 2014. The Publishingsegment did not have any private label sales.
Customers
We serve customers across a broad range of industries, through a variety of means ranging from multi-year supply agreements totransactional sales. The Company has valuable, multi-year, long-term supply agreements with many of its largest customers that setforth the terms and conditions of sale, including product pricing and warranties. Generally, the Company’s customers are notrequired to purchase any minimum amount of products under these agreements and can place orders on an individual purchaseorder basis. However, the Company enters into negotiated supply agreements with a minority of its customers.
For the year ended December 31, 2014, no single customer accounted for more than 5% of the Company’s consolidated netsales.
Suppliers
We purchase our products from thousands of suppliers, both domestic and international, across different business segments.Although varying by segment, the Company’s suppliers consist generally of large corporations selling brand name and private labelproducts and, to a more limited extent, independent regional and private label suppliers. Suppliers are selected based on customerdemand for the product and a supplier’s total service, cost and product quality offering.
Our sourcing organization supports the purchasing of well-known national and regional brand products as well as productsmarketed under our own private label brands from key national suppliers in the Print, Packaging and Facility Solutions segments.The Publishing segment primarily operates as a direct ship brokerage business aligned with the Company’s core supplier strategy. Inaddition, under the guidance and oversight of the sourcing team, our merchandising personnel located within individual distributioncenters source products not available within our core offering in order to meet specialized customer needs.
The product sourcing program is designed to ensure that the Company is able to offer consistent product selections and marketcompetitive pricing across the enterprise while maintaining the ability to service localized market requirements. Our procurementprogram is also focused on replenishment which includes purchase order placement and managing the total cost of inventory byimproving the number of day’s inventory on hand, negotiating favorable payment terms and maintaining vendor-owned and vendor-managed programs. As one of the largest purchasers of paper, graphics, packaging and facility supplies, we can qualify for volumeallowances with some suppliers and can realize significant economies of scale. We in turn enter into incentive agreements withcertain of our largest customers, which are generally based on sales to these customers.
Competition
The paper, publishing, packaging and facility solutions distribution industry is highly competitive, with numerous regional andlocal competitors, and is a mature industry characterized by slowing growth or, in the case of paper, declining net sales. TheCompany’s principal competitors include national, regional and local distributors, national and regional manufacturers, independentbrokers and both catalog-based and online business-to-business suppliers. Most of these competitors generally offer a wide range ofproducts at prices comparable to those Veritiv offers, though at varying service levels. Additionally, new competition could arise fromnon-traditional sources, group purchasing organizations, e-commerce, discount wholesalers or consolidation among competitors.Veritiv believes it offers the full range of services required to effectively compete, but if new competitive sources appear it may resultin margin erosion or make it more difficult to attract and retain customers.
4

The following summary briefly describes the key competitive landscape for each of Veritiv’s business segments:
• Print—Industry sources estimate that there are hundreds of regional and local companies engaged in the marketing anddistribution of paper and graphics products. While the Company believes there are few national distributors of paper andgraphics products similar to Veritiv, several regional and local distributors have cooperated together to serve customersnationally. The Company’s customers also have the opportunity to purchase products directly from paper and graphicsmanufacturers. In addition, competitors also include regional and local specialty distributors, office supply and big box stores,independent brokers and large commercial printers that broker the sale of paper in connection with the sale of their printingservices.
• Publishing—The publishing market is serviced by printers, paper brokers and distributors. The Company’s customers also havethe opportunity to purchase paper directly from paper manufacturers. The market consists primarily of magazine and bookpublishers, cataloguers, direct mailers and retail customers using catalog, insert and direct mail as a method of advertising.Veritiv’s brokerage companies, Bulkley Dunton and Graphic Communications, act in a consulting capacity in the selection ofproducts as well as providing supply chain services and solutions.
• Packaging—The packaging market is fragmented and consists of competition from national and regional packaging distributors,national and regional manufacturers of packaging materials, independent brokers and both catalog-based and onlinebusiness-to-business suppliers. Veritiv believes there are few national packaging distributors with substrate neutral designcapabilities similar to the Company’s capabilities.
• Facility Solutions—There are few national but numerous regional and local distributors of facility supply solutions. Severalgroups of distributors have created strategic alliances among multiple distributors to provide broader geographic coverage forlarger customers. Other key competitors include the business-to-business divisions of big box stores, purchasing group affiliatesand both catalog-based and online business-to-business suppliers.
We believe that our competitive advantages include over 1,600 sales and marketing professionals and the breadth of ourselection of quality products, including high-quality private brands. The breadth of products distributed and services offered, thediversity of the types of customers served, and our broad geographic footprint in the U.S., Canada and Mexico buffer the impact ofregional economic declines while also providing a network to readily serve national accounts.
Distribution and Logistics
Timely and accurate delivery of a customer’s order, on a consistent basis, are important criteria in a customer’s decision topurchase products and services from Veritiv. Delivery of products is provided through two primary channels, either from theCompany’s warehouses or directly from the manufacturer. Our distribution centers offer a range of delivery options depending onthe customer’s needs and preferences, and the strategic placement of the distribution centers also allows for delivery of special or‘‘rush’’ orders to many customers.
Working Capital
Veritiv’s working capital needs generally reflect the need to carry significant amounts of inventory in our distribution centers tomeet delivery requirements of our customers, as well as significant accounts receivable balances. As is typical in our industry, ourcustomers often do not pay upon receipt, but are offered terms which are heavily dependent on the specific circumstances of thesale.
Employees
As of December 31, 2014, Veritiv had approximately 8,900 employees worldwide, of which approximately 10% were covered bycollective bargaining agreements. Labor contract negotiations are handled on an individual basis by a team of Veritiv HumanResources and Legal personnel. Approximately 40% of the Company’s unionized employees have collective bargaining agreementsthat expire during 2015. We currently expect that we will be able to renegotiate such agreements on satisfactory terms when theyexpire. We consider labor relations to be good.
Government Relations
As a distributor, our transportation operations are subject to the U.S. Department of Transportation Federal Motor CarrierSafety Regulations. We are also subject to federal, state and local regulations regarding licensing and inspection of facilities, includingcompliance with the U.S. Occupational Safety and Health Act. These regulations require us to comply
5

with health and safety standards to protect our employees from accidents and establish communication programs to transmitinformation on the hazards of certain chemicals present in specific products that we distribute.
We are also subject to regulation by numerous U.S., Canadian and Mexican federal, state and local regulatory agencies,including, but not limited to, the U.S. Department of Labor which sets employment practice standards for workers. Although we aresubject to other U.S., Canadian and Mexican federal, state and local provisions relating to the protection of the environment and thedischarge or destruction of materials, these provisions do not materially impact the use or operation of the Company’s facilities.Compliance with these laws has not had, and is not anticipated to have, a material effect on Veritiv’s capital expenditures, earningsor competitive position.
Intellectual Property
We have numerous well-recognized trademarks, represented primarily by our private label brands, in each of our segments. Forthe year ended December 31, 2014, sales of products sold under private label brands accounted for approximately 12% ofconsolidated net sales. Most of our trademark registrations are effective for an initial period of 10 years, and we generally renew ourtrademark registrations before their expiration dates for trademarks that are in use or have reasonable potential for future use.Although our Print, Packaging and Facility Solutions segments rely on a number of trademarks that, in the aggregate, provideimportant protections to the Company, no single trademark is material to any one of these segments.
Veritiv does not have any material patents or licenses. During the last three years, Veritiv has not had any research anddevelopment expenditures.
Seasonality
The Company’s operating results are subject to seasonal influences. Historically, our highest consolidated net sales andconsequently Adjusted EBITDA (as defined in the ‘‘Key Performance Measure’’ section of Item 7 of this report) occur during thethird quarter while our lowest consolidated net sales and consequently Adjusted EBITDA occur during the first quarter. Within thePrint and Publishing segments, seasonality is driven by increased magazine advertising page counts, retail inserts, catalogs and directmail primarily due to back-to-school, political election and holiday-related advertising and promotions in the second half of the year.The Packaging segment net sales tend to increase each quarter throughout the year and net sales for the first quarter are typicallyless than net sales for the fourth quarter of the preceding year. Production schedules for non-durable goods that build up to theholidays and peak in the fourth quarter drive this seasonal net sales pattern. Net sales for the Facility Solutions segment tend to behighest during the second quarter due to increased summer demand in the away-from-home resort, cruise and hospitality marketsand second highest during the third quarter due to back-to-school demand from our customers.
Executive Officers of the Company
The following table sets forth certain information concerning the individuals who serve as executive officers of the Company asof March 1, 2015.
Name Age Position
Mary A. Laschinger . . . . . . . . . . . . . . . . . . . 54 Chairman and Chief Executive OfficerStephen J. Smith . . . . . . . . . . . . . . . . . . . . . 51 Senior Vice President and Chief Financial OfficerCharles B. Henry . . . . . . . . . . . . . . . . . . . . 50 Senior Vice President Integration and Change ManagementMark W. Hianik . . . . . . . . . . . . . . . . . . . . . 54 Senior Vice President, General Counsel and Corporate SecretaryThomas S. Lazzaro . . . . . . . . . . . . . . . . . . . 51 Senior Vice President Field Sales and OperationsJoseph B. Myers . . . . . . . . . . . . . . . . . . . . . 49 Senior Vice President Facility Solutions, Strategy and Commercial ExcellenceBarry R. Nelson . . . . . . . . . . . . . . . . . . . . . 50 Senior Vice President Publishing and Print ManagementElizabeth Patrick . . . . . . . . . . . . . . . . . . . . . 47 Senior Vice President and Chief Human Resources OfficerNeil A. Russell . . . . . . . . . . . . . . . . . . . . . . 43 Senior Vice President Corporate AffairsDarin W. Tang . . . . . . . . . . . . . . . . . . . . . . 49 Senior Vice President PackagingDaniel J. Watkoske . . . . . . . . . . . . . . . . . . . 46 Senior Vice President Print
6

The following descriptions of the business experience of our executive officers include the principal positions held by them sinceMarch 2010.
Mary A. Laschinger has served as Chairman and Chief Executive Officer of the Company since January 2014. Ms. Laschingeralso served as Senior Vice President of International Paper Company, a global packaging and paper manufacturing company, from2007 to July 2014 and as President of its xpedx distribution business from January 2010 to July 2014. Ms. Laschinger previouslyserved as President of International Paper’s Europe, Middle East, Africa and Russia business, Vice President and General Managerof International Paper’s Wood Products and Pulp businesses and in other senior management roles at International Paper in sales,marketing, manufacturing and supply chain. Ms. Laschinger joined International Paper in 1992. Prior to joining International Paper,Ms. Laschinger held various positions in product management and distribution at James River Corporation and Kimberly-ClarkCorporation. Ms. Laschinger has significant knowledge and executive management experience running domestic and internationalmanufacturing and distribution businesses as well as a deep understanding of xpedx and the industry in which it operates.Ms. Laschinger also serves as a director of Kellogg Company.
Stephen J. Smith has served as Senior Vice President and Chief Financial Officer of the Company since March 2014. Previously,Mr. Smith served as Senior Vice President and Chief Financial Officer of American Greetings Corporation, a global greeting cardcompany, from November 2006 to March 2014. Previously, Mr. Smith served as Vice President of Investor Relations and Treasurer ofAmerican Greetings from April 2003 to November 2006. Prior to American Greetings, Mr. Smith served as Vice President andTreasurer of General Cable Corporation, a global wire and cable manufacturer and distributer, and Vice President, Treasurer andAssistant Secretary of Insilco Holding Company, a telecommunications and electrical component products manufacturer. DuringMr. Smith’s tenure as a public company chief financial officer, he helped lead several strategic acquisitions and was responsible forthe design and execution of the capital structure for a management buyout.
Charles B. Henry has served as Senior Vice President Integration and Change Management of the Company since July 2014.Previously, Mr. Henry served as Vice President, Strategy Management and Integration of xpedx from March 2013 to July 2014 andwas a member of the xpedx Senior Lead Team. Prior to that, he served as Director of the xpedx Strategy Management Office fromFebruary 2011 to March 2013. Prior to that, he served as a Director in International Paper’s Supply Chain Project ManagementOffice. Mr. Henry joined International Paper in 1986 and served in a variety of supply chain, sales and general management roleswithin International Paper’s Program Management Office, Printing and Communications Papers business and Global Supply Chainoperations. Mr. Henry has significant strategy and project management experience in the manufacturing and distribution industries.
Mark W. Hianik has served as Senior Vice President, General Counsel and Corporate Secretary of the Company since January2014. Previously, Mr. Hianik served as Senior Vice President, General Counsel and Chief Administrative Officer for Dex OneCorporation, an advertising and marketing services company, from March 2012 to May 2013. Prior to that Mr. Hianik served asSenior Vice President, General Counsel and Corporate Secretary for Dex One (and its predecessor, R.H. Donnelley Corporation)from April 2008 to March 2012. R.H. Donnelley filed for voluntary reorganization under Chapter 11 of the U.S. Bankruptcy Code inMay 2009 emerging with a confirmed plan as Dex One in January 2010 and Dex One filed a pre-packaged bankruptcy petition underChapter 11 in March 2013 to effect a merger consummated in April 2013. Mr. Hianik previously served as Vice President andAssistant General Counsel for Tribune Company, a diversified media company, and as a corporate and securities partner in privatepractice. Mr. Hianik has significant experience as a public company general counsel and leader of corporate administrative functionsas well as significant mergers and acquisitions, securities, corporate finance and corporate governance experience.
Thomas S. Lazzaro has served as Senior Vice President Field Sales and Operations of the Company since July 2014. Previously,Mr. Lazzaro served as Executive Vice President, Supply Chain of xpedx from March 2013 to July 2014 and was a member of thexpedx Senior Lead Team. Mr. Lazzaro joined xpedx in January 2011 as Executive Vice President and Chief Procurement Officer,responsible for all aspects of the purchasing organization. From October 2007 to May 2010, Mr. Lazzaro held several positions withHD Supply, a construction supply company, including President of White Cap Construction Supply and President of Creative TouchInteriors. Previously, Mr. Lazzaro was a senior executive with Home Depot and General Electric. Mr. Lazzaro has significantexperience in general management, supply chain, operations and finance in the manufacturing and distribution industries.
Joseph B. Myers has served as Senior Vice President Facility Solutions, Strategy and Commercial Excellence of the Companysince April 2014. Previously, Mr. Myers served as President of Oldcastle Building Solutions, a unit of Oldcastle
7

Inc., one of the nation’s largest building products companies, from February 2012 to April 2014. From August 2000 to February 2012,Mr. Myers was a Partner at McKinsey & Company, a management consulting firm, where he was a designated expert in sales andmarket growth development and led client engagements across various industries, including distribution, paper, packaging andchemicals. Previously, Mr. Myers held positions in sales, marketing and general management with BP Amoco. Mr. Myers hassignificant experience in senior leadership, general management, consulting, strategy and business transformation positions.
Barry R. Nelson has served as Senior Vice President Publishing and Print Management of the Company since July 2014. Prior tothat, Mr. Nelson served as Group Vice President, Sales-Publishing for xpedx from December 2012 to July 2014. From August 2002 toDecember 2012, Mr. Nelson served as Senior Vice President of Sales and Marketing for NewPage Corporation, a papermanufacturing company. NewPage filed for voluntary reorganization under Chapter 11 of the U.S. Bankruptcy Code in September2011 and emerged with a confirmed plan in December 2012. Previously, Mr. Nelson served as Executive Vice President of Sales,Marketing and Client Delivery at ForestExpress, a technology joint venture of leading forest product companies. Mr. Nelson hassignificant sales and sales leadership experience in the paper manufacturing and distribution industries.
Elizabeth Patrick has served as Senior Vice President and Chief Human Resources Officer of the Company since July 2014.Prior to that, Ms. Patrick served as Vice President, Human Resources of xpedx from March 2013 until July 2014 and was a memberof International Paper Company’s Human Resources & Communications Lead Team and the xpedx Senior Lead Team. Prior to that,she served as Director, Human Resources-Field Operations of xpedx from October 2012 to March 2013. Ms. Patrick served as VicePresident of Human Resources of TE Connectivity, a global electronics manufacturing and distribution company, from April 2008 toOctober 2012. Prior to that, Ms. Patrick served as Vice President Human Resources of Guilford Mills, Inc., an automotive andspecialty markets fabrics manufacturer, and in a variety of roles of increasing responsibility with General Motors Company and GMspin-off, Delphi Corporation, a global automotive parts manufacturer. Ms. Patrick has significant human resources and financemanagement and leadership experience.
Neil A. Russell has served as Senior Vice President Corporate Affairs of the Company since February 2014. Previously,Mr. Russell served as Vice President—Investor Relations of Sysco Corporation, a global business-to-business foodservice distributor,from August 2007 to February 2014. Prior to that, Mr. Russell served as Director of Investor Relations of Delta Air Lines. While atDelta, Mr. Russell also held positions of increasing responsibility including Director of Financial Analysis and worked in the areas ofStrategic Planning and Network Analysis. Mr. Russell has significant experience as an investor relations officer for global publiccompanies, as well as significant financial planning and public relations experience.
Darin W. Tang has served as Senior Vice President Packaging of the Company since July 2014. Prior to that, Mr. Tang served asPresident of the Packaging Solutions Group for Unisource from January 2013 to July 2014. Since joining Unisource in 2004,Mr. Tang has held positions as Area Vice President of Packaging, Senior Vice President of Packaging, Senior Vice President for theEast Region and National Packaging Director and President, Sales of the Industry Business Group. Prior to joining Unisource,Mr. Tang served as Director of Sales with Intertape Polymer Group, Inc., a specialty manufacturer of packaging products andsystems, and in various roles in sales and training with Scott Paper Company/Kimberly-Clark, a manufacturer of personal careproducts to the distribution and retail channels. Mr. Tang has significant sales and sales management experience in the paper andpackaging manufacturing and distribution industries.
Daniel J. Watkoske has served as Senior Vice President Print of the Company since July 2014. Prior to that, Mr. Watkoskeserved as Executive Vice President Sales for xpedx from January 2011 and was a member of the xpedx Senior Lead Team. Prior tothat, Mr. Watkoske served as Group Vice President for the xpedx Metro New York Group from January 2008 to January 2011.Previously, Mr. Watkoske served as Vice President National Accounts for xpedx. Mr. Watkoske joined International Paper in 1989 asa sales trainee for Nationwide Papers, which later became part of xpedx. Mr. Watkoske has significant sales, sales management andoperations experience in the paper and packaging distribution industries.
We have been advised that there are no family relationships among any of our executive officers or directors and that there isno arrangement or understanding between any of our executive officers and any other persons pursuant to which they wereappointed, respectively, as an executive officer.
8

Company Information
Veritiv was incorporated in Delaware on July 10, 2013. Our principal executive offices are currently located at 6600 GovernorsLake Parkway, Norcross, Georgia 30071. In December 2014, we announced our plans to relocate our principal executive offices to400 Northpark Town Center in Atlanta, Georgia.
Our corporate website is http://www.veritivcorp.com. Information contained on our website is not part of this Annual Report onForm 10-K. Through the ‘‘Investors’’ portion of this website, we make available, free of charge, our proxy statements, AnnualReports on Form 10-K, Quarterly Reports on Form 10-Q, Current Reports on Form 8-K and other relevant filings with the SEC andany amendments to those reports as soon as reasonably practicable after such material has been filed with, or furnished to, the SEC.These filings are also accessible on the SEC’s website at http://www.sec.gov.
ITEM 1A. RISK FACTORS
You should carefully consider the following risk factors, together with the other information contained in this report, in evaluating usand an investment in our common stock. The risks described below are the material risks, although not the only risks, relating to us andour common stock. If any of the following risks and uncertainties develop into actual events, these events could have a material adverseeffect on our business, financial condition, results of operations or cash flows.
Risks Relating to Our Business
The industry-wide decline in demand for paper and related products could have a material adverse effect on our financial condition andresults of operations.
Our Print and Publishing businesses rely heavily on the sale of paper and related products. The industry-wide decrease indemand for paper and related products in key markets we serve places continued pressure on our revenues and profit margins andmakes it more difficult to maintain or grow earnings. This trend is expected to continue. The failure to effectively differentiate usfrom our competitors and the failure to grow the Packaging and Facility Solutions businesses in the face of increased use of email,increased and permanent product substitution, including less print advertising, more electronic billing, more e-commerce, fewercatalogs and a reduced volume of mail, could have a material adverse effect on market share, sales and profitability throughincreased expenditures or decreased prices.
Competition in our industry may adversely impact our margins and our ability to retain customers and make it difficult to maintain ourmarket share and profitability.
The business-to-business distribution industry is highly competitive, with numerous regional and local competitors, and is amature industry characterized by slowing revenue growth. Our principal competitors include regional and local distributors in thePrint segment; regional, national and international paper manufacturers and other merchants and brokers in the Publishing segment;national distributors, national and regional manufacturers and independent brokers in the Packaging segment; and national, regionaland local distributors in the Facility Solutions segment. Most of these competitors generally offer a wide range of products at pricescomparable to those we offer. Additionally, new competition could arise from non-traditional sources, group purchasingorganizations, e-commerce, discount wholesalers or consolidation among competitors. New competitive sources may result inincreased focus on pricing and on limiting price increases, or may require increased discounting. Such competition may result inmargin erosion or make it difficult to attract and retain customers.
Increased competition within the industry, reduced demand for paper, increased and permanent product substitution throughless print advertising, more electronic billing, more e-commerce, fewer catalogs, a reduced volume of mail and general economicconditions have served to further increase pressure on the industry’s profit margins, and continued margin pressure within theindustry may have a material adverse impact on our operating results and profitability.
Adverse developments in general business and economic conditions as well as conditions in the global capital and credit markets couldhave a material adverse effect on the demand for our products and our financial condition and results of operations.
The persistently slow rate of increase in gross domestic product (‘‘GDP’’) in recent years has adversely affected our results ofoperations. If GDP continues to indicate a sluggish economy, or if economic growth declines, demand for the products we sell will beadversely affected. In addition, volatility in the capital and credit markets, which impacts interest
9

rates, currency exchange rates and the availability of credit, could have a material adverse effect on the business, financial conditionand results of operations of our company and our customers. We have exposure to counterparties with which we routinely executetransactions. Such counterparties include customers and financial institutions. A bankruptcy or liquidity event by one or more of ourcounterparties could have a material adverse effect on our business, financial condition and results of operations.
In order to compete, we must attract, train and retain highly qualified employees, and the failure to do so could have a material adverseeffect on results of operations.
To successfully compete, we must attract, train and retain a large number of highly qualified employees while controlling relatedlabor costs. Specifically, we must recruit and retain qualified sales professionals. If we were to lose a significant amount of our salesprofessionals, we could lose a material amount of sales, which would have a material adverse effect on our financial condition andresults of operations. Many of our sales professionals are subject to confidentiality and non-competition agreements. If our salesprofessionals were to violate these agreements, we could seek to legally enforce these agreements and may incur substantial costs inconnection with such enforcement. We compete with other businesses for employees and invest significant resources in training andmotivating them. There is no assurance that we will be able to attract or retain highly qualified employees. The inability to retain orhire qualified personnel at economically reasonable compensation levels would restrict our ability to improve our business and resultin lower operating results and profitability.
Our business may be adversely affected by work stoppages, union negotiations and labor disputes.
Approximately 10% of our employees are currently covered by collective bargaining or other similar labor agreements.Historically, the effects of collective bargaining and other similar labor agreements have not been significant. However, if a largernumber of our employees were to unionize, including in the wake of any future legislation or administrative regulation that makes iteasier for employees to unionize, the effect may be negative. Any inability to negotiate acceptable new contracts under thesecollective bargaining arrangements could cause strikes or other work stoppages, and new contracts could result in increased operatingcosts. If any such strikes or other work stoppages occur, or if additional employees become represented by a union, a disruption ofour operations and higher labor costs could result. Labor relations matters affecting our suppliers of products and services could alsoadversely affect our business from time to time.
The loss of any of our significant customers could adversely affect our financial condition.
Our ten largest customers generated approximately 13% of our consolidated net sales for the six months ended December 31,2014, and our largest customer accounted for approximately 2% of our consolidated net sales in that same period. We cannotguarantee that we will maintain or improve our relationships with these customers or that we will continue to supply these customersat historical levels.
Generally, our customers are not contractually required to purchase any minimum amount of products. Should such customerspurchase products sold by us in significantly lower quantities than they have in the past, such decreased purchases could have amaterial adverse effect on our financial condition, operating results and cash flows.
In addition, consolidation among customers could also result in changes to the purchasing habits and volumes among some ofour present customers. The loss of one or more of these significant customers, a significant customer’s decision to purchase ourproducts in substantially lower quantities than they have in the past, or deterioration in the relationship with any of these customerscould adversely affect our financial condition, operating results and cash flows.
Changes in business conditions in our international operations could adversely affect our business and results of operations.
Our operating results and business prospects could be substantially affected by risks related to Canada, Mexico and othernon-U.S. countries where we sell and distribute our products. Some of our operations are in or near locations that have sufferedfrom political, social and economic issues; civil unrest; and a high level of criminal activity. In those locations where we haveemployees or operations, we may incur substantial costs to maintain the safety of our personnel and the security of our operations.Downturns in economic activity, adverse tax consequences or any change in social, political or labor conditions in any of thecountries in which we operate could negatively affect our financial results. In addition, our international operations are subject toregulation under U.S. law and other laws related to operations in foreign jurisdictions. For example, the Foreign Corrupt PracticesAct of 1977 (the ‘‘FCPA’’) prohibits U.S. companies and their representatives
10

from offering, promising, authorizing or making payments to foreign officials for the purpose of obtaining or retaining businessabroad. Failure to comply with domestic or foreign laws could result in various adverse consequences, including the imposition ofcivil or criminal sanctions and the prosecution of executives overseeing our international operations.
We purchase all of the products we sell to our customers from other parties, and conditions beyond our control can interrupt our suppliesand increase our product costs.
As a distributor, we obtain our packaging, paper and facility products from third-party suppliers. Our business and financialresults are dependent on our ability to purchase products from suppliers not controlled by us that we, in turn, sell to our customers.We may not be able to obtain the products we need on open credit, with market or other favorable terms, or at all. During the sixmonths ended December 31, 2014, approximately 40% of our purchases were made from only ten suppliers. A sustained disruptionin our ability to source products from one or more of the largest of these vendors might have a material impact on our ability tofulfill customer orders resulting in lost sales and, in rare cases, damages for late or non-delivery.
For the most part, we do not have a significant number of long-term contracts with our suppliers committing them to provideproducts to us. Although our purchasing volume can provide benefits when dealing with suppliers, suppliers may not provide theproducts and supplies needed in the quantities and at the prices requested. We are also subject to delays caused by interruption inproduction and increases in product costs based on conditions outside of our control. These conditions include raw materialshortages, environmental restrictions on operations, work slowdowns, work interruptions, strikes or other job actions by employees ofsuppliers, product recalls, transportation interruptions, unavailability of fuel or increases in fuel costs, competitive demands andnatural disasters or other catastrophic events. Our inability to obtain adequate supplies of paper, packaging and facility products as aresult of any of the foregoing factors or otherwise could mean that we could not fulfill our obligations to customers, and customersmay turn to other distributors.
In addition, increases in product costs may reduce our margins if we are unable to pass all or a portion of these costs along toour customers, which we have historically had difficulty doing. Any such inability may have a negative impact on our business andour profitability.
Changes in prices for raw materials, including pulp, paper and resin, could negatively impact our results of operations and cash flows.
Changes in prices for raw materials, such as pulp, paper and resin, could significantly impact our results of operations in theprint market. Although we do not produce paper products and are not directly exposed to risk associated with production, declines inpulp and paper prices, driven by falling secular demand, periods of industry overcapacity and overproduction by paper suppliers, mayadversely affect our revenues and net income to the extent such factors produce lower paper prices. Declining pulp and paper pricesgenerally produce lower revenues and profits, even when volume and trading margin percentages remain constant. During periods ofdeclining pulp and paper prices, customers may alter purchasing patterns and defer paper purchases or deplete inventory levels untillong-term price stability occurs. Alternatively, if prices for raw materials rise and we are unable to pass these increases on to ourcustomers, our results of operations and profits may also be negatively impacted.
We may not be able to fully compensate for increases in fuel costs.
Volatile fuel prices have a direct impact on our industry. The cost of fuel affects the price paid by us for products as well as thecosts incurred to deliver products to our customers. Although we have been able to pass along a portion of increased fuel costs toour customers in the past, there is no guarantee that we can continue to do so. We currently pass on some of our fuel costs througha fuel surcharge on orders, but we may experience difficulties in passing all or a portion of these costs along to our customers, whichmay have a negative impact on our business and our profitability.
Inclement weather, anti-terrorism measures and other disruptions to the transportation network could impact our distribution system andoperations.
Our ability to provide efficient distribution of products to our customers is an integral component of our overall businessstrategy. Disruptions at distribution centers or shipping ports or the closure of roads or imposition of other driving bans due tonatural events such as flooding, tornadoes and blizzards may affect our ability to both maintain key products in
11

inventory and deliver products to our customers on a timely basis, which may in turn adversely affect our results of operations.
Furthermore, in the aftermath of terrorist attacks in the United States, federal, state and local authorities have implemented andcontinue to implement various security measures that affect many parts of the transportation network in the U.S. and abroad. Ourcustomers typically need quick delivery and will rely on our on-time delivery capabilities. If security measures disrupt or impede thetiming of our deliveries, we may fail to meet the needs of our customers, or may incur increased expenses to do so. Any of thesedisruptions to our operations may reduce our sales and have an adverse effect on our business, financial condition and results ofoperations.
We are dependent on a variety of IT and telecommunications systems and the Internet, and any failure of these systems could adverselyimpact our business and operating results.
We depend on information technology (‘‘IT’’) and telecommunications systems and the Internet for our operations. Thesesystems support a variety of functions including inventory management, order placement and processing with vendors and fromcustomers, shipping, shipment tracking and billing. We maintain redundant information systems as part of our disaster recoveryprogram and, if necessary, are able to operate in many respects using a paper-based system to help mitigate a complete interruptionin our information processing capabilities. We have also invested in tools and processes to combat security threats. Nonetheless, ourinformation systems remain vulnerable to natural disasters, wide-area telecommunications or power utility outages, terrorist or cyber-attacks and other major disruptions.
Failures or significant downtime of our IT or telecommunications systems for any reason, including as a result of disruptionsfrom integrating the xpedx and Unisource businesses, could prevent us from taking customer orders, printing product pick-lists,shipping products, billing customers and handling call volume. Sales also may be adversely impacted if our reseller and retailcustomers are unable to access pricing and product availability information. We also rely on the Internet, electronic data interchangeand other electronic integrations for a large portion of our orders and information exchanges with our suppliers and customers. TheInternet and individual websites have experienced a number of disruptions and slowdowns, some of which were caused by organizedattacks. In addition, some websites have experienced security breakdowns. If we were to experience a security breakdown, disruptionor breach that compromised sensitive information, it could harm our relationships with our suppliers and customers. Disruption ofour website or the Internet in general could impair our order processing or more generally prevent our suppliers and resellers fromaccessing information. Failures of our systems could also lead to delivery delays and may expose us to litigation and penalties undersome of our contracts. Any significant increase in our IT and telecommunications costs or temporary or permanent loss of our IT ortelecommunications systems, including as a result of disruptions from integrating the xpedx and Unisource businesses, could harmour relationships with our customers and suppliers and result in lost sales, business delays and bad publicity. The occurrence of anyof these events could have a material adverse effect on our business, financial condition and results of operations.
We are subject to cyber-security risks related to breaches of security pertaining to sensitive company, customer, employee and vendorinformation as well as breaches in the technology that manages operations and other business processes.
Our operations rely upon secure IT systems for data capture, processing, storage and reporting. Our IT systems, and those ofour third-party providers, could become subject to cyber-attacks. Network, system, application and data breaches could result inoperational disruptions or information misappropriation including, but not limited to, interruption of systems availability, denial ofaccess to and misuse of applications required by our customers to conduct business with us. Access to internal applications requiredto plan our operations, source materials, ship finished goods and account for orders could be denied or misused. Theft of intellectualproperty or trade secrets, and inappropriate disclosure of confidential information, could stem from such incidents. Any operationaldisruptions or misappropriation of information could harm our relationship with our customers and suppliers, result in lost sales,business delays and negative publicity and could have a material adverse effect on our business, financial condition and results ofoperations.
Costs to comply with environmental, health and safety laws, and to satisfy any liability or obligation imposed under such laws, couldnegatively impact our business, financial condition and results of operations.
Our operations are subject to U.S. and international environmental, health and safety laws, including laws regulating theemission or discharge of materials into the environment, the use, storage, treatment, disposal and management of hazardoussubstances and waste, the investigation and remediation of contamination and the health and safety of our employees and the
12

public. We could incur substantial fines or sanctions, enforcement actions (including orders limiting our operations or requiringcorrective measures), investigation, remediation and closure costs and third-party claims for property damage and personal injury as aresult of violations of, or liabilities or obligations under, environmental, health and safety laws. We could be held liable for the coststo address contamination at any real property we have ever owned, operated or used as a disposal site.
In addition, changes in, or new interpretations of, existing laws, the discovery of previously unknown contamination, or theimposition of other environmental liabilities or obligations in the future, may lead to additional compliance or other costs that couldimpact our business and results of operations. Moreover, as environmental issues, such as climate change, have become moreprevalent, U.S. and foreign governments have responded, and are expected to continue to respond, with increased legislation andregulation, which could negatively impact our business, financial condition and results of operations.
Expenditures related to the cost of compliance with laws, rules and regulations could adversely impact our business and results ofoperations.
Our operations are subject to U.S. and international laws and regulations, including regulations of the U.S. Department ofTransportation Federal Motor Carrier Safety Administration, the import and export of goods, customs regulations, Office of ForeignAsset Control and the FCPA. We could incur substantial fines or sanctions, enforcement actions (including orders limiting ouroperations or requiring corrective measures), and third-party claims for property damage and personal injury as a result of violationsof, or liabilities under, laws, regulations, codes and common law.
Tax assessments and unclaimed property audits by governmental authorities could adversely impact our operating results.
We remit a variety of taxes and fees to various governmental authorities, including federal and state income taxes, excise taxes,property taxes, sales and use taxes, and payroll taxes. The taxes and fees remitted by us are subject to review and audit by theapplicable governmental authorities which could result in liability for additional assessments. In addition, we are subject to unclaimedproperty (escheat) laws which require us to turn over to certain government authorities the property of others held by us that hasbeen unclaimed for a specified period of time. We are subject to audit by individual U.S. states with regard to our escheatmentpractices. The legislation and regulations related to tax and unclaimed property matters tend to be complex and subject to varyinginterpretations by both government authorities and taxpayers. Although management believes that the positions are reasonable,various taxing authorities may challenge certain of the positions we have taken, which may also potentially result in additionalliabilities for taxes, unclaimed property and interest in excess of accrued liabilities. Our positions are reviewed as events occur suchas the availability of new information, the lapsing of applicable statutes of limitations, the conclusion of tax audits, the measurementof additional estimated liability based on current calculations, the identification of new tax contingencies or the rendering of relevantcourt decisions. An unfavorable resolution of assessments by a governmental authority could have a material adverse effect on ourfinancial condition, results of operations and cash flows in future periods.
Our inability to renew existing leases on acceptable terms, negotiate rent decreases or concessions and identify affordable real estate couldadversely affect our operating results.
We may be unable to successfully negotiate or renew existing leases at attractive rents, negotiate rent decreases or concessionsor identify affordable real estate. A key factor in our operating performance is the location and associated real estate costs of ourdistribution centers. In particular, approximately 40 of our lease and sublease agreements expire in June 2018. Our inability tonegotiate or renew these or any other leases on favorable terms, or at all, could have a material adverse effect on our business andresults of operations due to, among other things, any resultant increased lease payments.
Results of legal proceedings could have a material adverse effect on our consolidated financial statements.
We rely on manufacturers and other suppliers to provide us with the products and equipment we sell, distribute and service. Aswe do not have direct control over the quality of the products manufactured or supplied by such third-party suppliers, we areexposed to risks relating to the quality of the products and equipment we sell, distribute and service. It is possible that inventoryfrom a manufacturer or supplier could be sold to our customers and later be alleged to have quality problems or to have causedpersonal injury, subjecting us to potential claims from customers or third parties. Our ability to hold such manufacturer or supplierliable will depend on a variety of factors, including its financial viability. Moreover, as
13

we increase the number of private label products we distribute, our exposure to potential liability for product liability claims mayincrease. Finally, even if we are successful in defending any claim relating to the products or equipment we distribute, claims of thisnature could negatively impact our reputation and customer confidence in our products, equipment and company. We have beensubject to such claims in the past, which have been resolved without material financial impact. We also operate a significant numberof facilities and a large fleet of trucks and other vehicles and therefore face the risk of premises-related liabilities and vehicle-relatedliabilities including traffic accidents.
From time to time, we may also be involved in government inquiries and investigations, as well as class action, employment andother litigation. We cannot predict with certainty the outcomes of these legal proceedings and other contingencies, includingenvironmental remediation and other proceedings commenced by government authorities. The costs and other effects of pendinglitigation against us cannot be determined with certainty. Although we believe that the outcome of any pending or future lawsuits orclaims will not have a material adverse effect on our business or consolidated financial statements, there can be no assurance that theoutcome of any lawsuit or claim will be as expected. The defense of these lawsuits may divert our management’s attention, andsignificant expenses may be incurred in defending these lawsuits. In addition, we may be required to pay damage awards orsettlements, or become subject to injunctions or other equitable remedies, that could have a material adverse effect on our business,financial condition, results of operations and cash flows.
While we currently maintain insurance coverage to address a portion of these types of liabilities, we cannot make assurances thatwe will be able to obtain such insurance on acceptable terms in the future, if at all, or that any such insurance will provide adequatecoverage against potential claims. In addition, we may choose not to seek to obtain such insurance in the future. Moreover,indemnification rights that we have may be insufficient or unavailable to protect us against potential loss exposures.
We may not be able to adequately protect our material intellectual property and other proprietary rights, or to defend successfully againstintellectual property infringement claims by third parties.
Our ability to compete effectively depends in part upon our intellectual property rights, including but not limited to trademarks,copyrights and proprietary technology. The use of contractual provisions, confidentiality procedures and agreements, and trademark,copyright, unfair competition, trade secret and other laws to protect intellectual property rights and proprietary technology may notbe adequate. Litigation may be necessary to enforce our intellectual property rights and protect proprietary technology, or to defendagainst claims by third parties that our conduct or our use of intellectual property infringes upon such third-party’s intellectualproperty rights. Any intellectual property litigation or claims brought against us, whether or not meritorious, could result insubstantial costs and diversion of our resources, and there can be no assurances that favorable final outcomes will be obtained in allcases. The terms of any settlement or judgment may require us to pay substantial amounts to the other party or cease exercising ourrights in such intellectual property, including ceasing the use of certain trademarks used by us to distinguish our services from thoseof others or ceasing the exercise of our rights in copyrightable works. In addition, we may have to seek a license to continuepractices found to be in violation of a third-party’s rights, which may not be available on reasonable terms, or at all. Our business,financial condition or results of operations could be adversely affected as a result.
Our pension and health care costs are subject to numerous factors which could cause these costs to change.
Our pension costs are dependent upon numerous factors resulting from actual plan experience and assumptions of futureexperience, including actuarial assumptions regarding life expectancies. Pension plan assets are primarily made up of equity and fixedincome investments. Fluctuations in actual equity market returns, changes in general interest rates and changes in the number ofretirees may result in increased pension costs in future periods. Significant changes in any of these factors may adversely impact ourcash flows, financial condition and results of operations.
We participate in multi-employer pension plans and multi-employer health and welfare plans, which could create additional obligationsand payment liabilities.
We contribute to multi-employer defined benefit pension as well as multi-employer health and welfare plans under the terms ofcollective bargaining agreements that cover certain unionized employee groups in the United States. The risks of participating inmulti-employer pension plans differ from single employer-sponsored plans and such plans are subject to regulation under the PensionProtection Act (‘‘PPA’’). Multi-employer pension plans are cost-sharing plans subject to collective-bargaining agreements.Contributions to a multi-employer plan by one employer are not specifically earmarked for its employees and may be used to providebenefits to employees of other participating employers. If a participating
14

employer stops contributing to the plan, the unfunded obligations of the plan are borne by the remaining participating employers. Inaddition, if a multi-employer plan is determined to be underfunded based on the criteria established by the PPA, the plan may berequired to implement a financial improvement plan or rehabilitation plan that may require additional contributions or surcharges byparticipating employers.
In addition to the contributions discussed above, we could be obligated to pay additional amounts, known as withdrawal liability,upon decrease or cessation of participation in a multi-employer pension plan. While an employer may obtain an estimate of suchliability, the final calculation of withdrawal liability may not be determined for an extended period. The cash obligation of suchwithdrawal liability is payable over a 20 year period.
Our substantial indebtedness could adversely affect our financial condition and impair our ability to operate our business.
As of December 31, 2014, we had approximately $911.0 million in total indebtedness, reflecting borrowings of $847.8 millionunder the asset-based lending facility (the ‘‘ABL Facility’’), $52.2 million of financing obligations to a related party (exclusive of thenon-monetary portion) and $11.0 million of equipment capital lease obligations. This level of indebtedness could have importantconsequences to our financial condition, operating results and business, including the following:
• limiting our ability to obtain additional debt or equity financing for working capital, capital expenditures, debt servicerequirements, acquisitions and general corporate or other purposes;
• increasing our cost of borrowing;
• requiring that a substantial portion of our cash flows from operations be dedicated to payments on our indebtedness insteadof other purposes, including operations, capital expenditures and future business opportunities;
• making it more difficult for us to make payments on our indebtedness or satisfy other obligations;
• exposing us to risk of increased interest rates because our borrowings under the ABL Facility are at variable rates of interest;
• limiting our ability to make the expenditures necessary to complete the integration of xpedx’s business with Unisource’sbusiness;
• limiting our ability to adjust to changing market conditions and placing us at a competitive disadvantage compared to ourcompetitors that have less debt; and
• increasing our vulnerability to a downturn in general economic conditions or in our business, and making us unable to carryout capital spending that is important to our growth.
Despite our substantial indebtedness, we may still be able to incur substantially more indebtedness in the future. This could furtherexacerbate the risks to our financial condition described above.
We may be able to incur significant additional indebtedness in the future, including secured indebtedness. Although theagreements governing the ABL Facility contain restrictions on the incurrence of additional indebtedness, these restrictions are subjectto a number of qualifications and exceptions, and the additional indebtedness incurred in compliance with these restrictions could besubstantial. If new indebtedness is added to our current indebtedness levels, the related risks we will face could intensify.
The agreements governing our indebtedness contain restrictive covenants, which could restrict our operational flexibility.
The agreements governing the ABL Facility contain restrictions and limitations on our ability to engage in activities that may bein our long-term best interests, including financial and other restrictive covenants that could limit our ability to:
• incur additional indebtedness or guaranties, or issue certain preferred shares;
• pay dividends, redeem stock or make other distributions;
• repurchase, prepay or redeem subordinated indebtedness;
• make investments or acquisitions;
• create liens;
• make negative pledges;
• consolidate or merge with another company;
• sell or otherwise dispose of all or substantially all of our assets;
• enter into certain transactions with affiliates; and
15
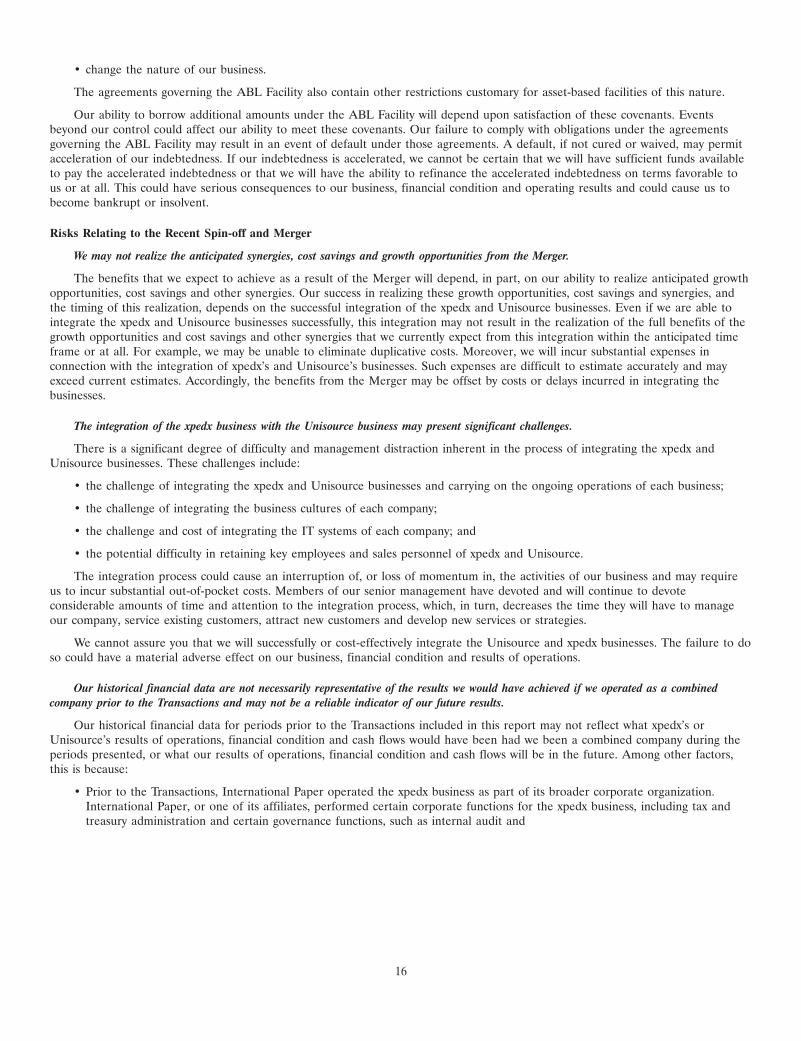
• change the nature of our business.
The agreements governing the ABL Facility also contain other restrictions customary for asset-based facilities of this nature.
Our ability to borrow additional amounts under the ABL Facility will depend upon satisfaction of these covenants. Eventsbeyond our control could affect our ability to meet these covenants. Our failure to comply with obligations under the agreementsgoverning the ABL Facility may result in an event of default under those agreements. A default, if not cured or waived, may permitacceleration of our indebtedness. If our indebtedness is accelerated, we cannot be certain that we will have sufficient funds availableto pay the accelerated indebtedness or that we will have the ability to refinance the accelerated indebtedness on terms favorable tous or at all. This could have serious consequences to our business, financial condition and operating results and could cause us tobecome bankrupt or insolvent.
Risks Relating to the Recent Spin-off and Merger
We may not realize the anticipated synergies, cost savings and growth opportunities from the Merger.
The benefits that we expect to achieve as a result of the Merger will depend, in part, on our ability to realize anticipated growthopportunities, cost savings and other synergies. Our success in realizing these growth opportunities, cost savings and synergies, andthe timing of this realization, depends on the successful integration of the xpedx and Unisource businesses. Even if we are able tointegrate the xpedx and Unisource businesses successfully, this integration may not result in the realization of the full benefits of thegrowth opportunities and cost savings and other synergies that we currently expect from this integration within the anticipated timeframe or at all. For example, we may be unable to eliminate duplicative costs. Moreover, we will incur substantial expenses inconnection with the integration of xpedx’s and Unisource’s businesses. Such expenses are difficult to estimate accurately and mayexceed current estimates. Accordingly, the benefits from the Merger may be offset by costs or delays incurred in integrating thebusinesses.
The integration of the xpedx business with the Unisource business may present significant challenges.
There is a significant degree of difficulty and management distraction inherent in the process of integrating the xpedx andUnisource businesses. These challenges include:
• the challenge of integrating the xpedx and Unisource businesses and carrying on the ongoing operations of each business;
• the challenge of integrating the business cultures of each company;
• the challenge and cost of integrating the IT systems of each company; and
• the potential difficulty in retaining key employees and sales personnel of xpedx and Unisource.
The integration process could cause an interruption of, or loss of momentum in, the activities of our business and may requireus to incur substantial out-of-pocket costs. Members of our senior management have devoted and will continue to devoteconsiderable amounts of time and attention to the integration process, which, in turn, decreases the time they will have to manageour company, service existing customers, attract new customers and develop new services or strategies.
We cannot assure you that we will successfully or cost-effectively integrate the Unisource and xpedx businesses. The failure to doso could have a material adverse effect on our business, financial condition and results of operations.
Our historical financial data are not necessarily representative of the results we would have achieved if we operated as a combinedcompany prior to the Transactions and may not be a reliable indicator of our future results.
Our historical financial data for periods prior to the Transactions included in this report may not reflect what xpedx’s orUnisource’s results of operations, financial condition and cash flows would have been had we been a combined company during theperiods presented, or what our results of operations, financial condition and cash flows will be in the future. Among other factors,this is because:
• Prior to the Transactions, International Paper operated the xpedx business as part of its broader corporate organization.International Paper, or one of its affiliates, performed certain corporate functions for the xpedx business, including tax andtreasury administration and certain governance functions, such as internal audit and
16

external reporting. Our historical financial statements reflect allocations of corporate expenses from International Paper forthese and similar functions and may not reflect the costs that we will incur for similar services in the future.
• The working capital and other capital required for the general corporate purposes of the xpedx business, including acquisitionsand capital expenditures, historically have been satisfied as part of the company-wide cash management practices ofInternational Paper. As a result of the Transactions, we need to generate our own funds to finance working capital or othercash requirements and may need to obtain additional financing from banks, either through public offerings or privateplacements of debt or equity securities or other arrangements.
• Other significant changes may occur in our cost structure, management, financing and business operations as a result ofoperating as a combined company.
We have limited experience complying with the reporting and other requirements of a publicly traded company.
As a result of the Transactions, we became a publicly traded company on July 1, 2014. We have limited experience complyingwith the reporting and other requirements of the Securities Exchange Act of 1934, as amended (the ‘‘Exchange Act’’). The ExchangeAct requires that we file annual, quarterly and current reports with respect to our business and financial condition. We areresponsible for ensuring that all aspects of our business comply with Section 404 of the Sarbanes-Oxley Act of 2002 (the ‘‘SarbanesOxley Act’’). Under the Sarbanes-Oxley Act, we are required to maintain effective disclosure controls and procedures and internalcontrol over financial reporting. In addition, our management is required to assess the effectiveness of our internal control overfinancial reporting and obtain a report by an independent registered public accounting firm addressing such assessments on anannual basis, subject to applicable phase-in periods.
To comply with these requirements, we have incurred significant costs in upgrading our systems, implementing additionalfinancial and management controls, reporting systems and procedures, and hiring additional accounting, audit, tax and legal staff. Wewill also incur additional annual expenses for the purpose of addressing these requirements, and those expenses may be significant.Any failure to achieve and maintain effective internal controls could have a material adverse effect on our business, financialcondition and results of operations.
We have incurred and continue to incur significant costs associated with the Transactions that could affect our period-to-period operatingresults.
We anticipate that we will incur costs associated with the Transactions of approximately $225 million over the five yearsfollowing the Transactions. We are not able to quantify the exact amount of these costs or the period in which they will be incurred.Some of the factors affecting the costs associated with the Transactions include the resources required in integrating the Unisourcebusiness and the xpedx business and the length of time during which transition services are provided to us by International Paper.The amount and timing of these costs could adversely affect our period-to-period operating results, which could result in a reductionin the market price of shares of our common stock. Moreover, delays in completing the integration may reduce or delay thesynergies and other benefits expected from the Transactions and such reduction may be material.
If costs to integrate our IT infrastructure and network systems are more than amounts that have been budgeted, our business, financialcondition and results of operations could be adversely affected.
We currently expect costs associated with achieving anticipated cost savings and other synergies from the Transactions to beapproximately $225.0 million over a five-year period from the Distribution Date, including approximately $55.0 million for capitalexpenditures, primarily consisting of information technology infrastructure, systems integration and planning. The primary areas ofspending will be integrating our financial, operational and human resources systems. We expect that a portion of these expenditureswill be capitalized. Expenditures in excess of the budgeted amounts on integration and other costs could adversely affect ourbusiness, financial condition and results of operations.
If the Spin-off does not qualify as a tax-free spin-off under Section 355 of the Internal Revenue Code (the ‘‘Code’’), including as a resultof subsequent acquisitions of stock of International Paper or our company, then International Paper and/or the International Papershareholders may be required to pay substantial U.S. federal income taxes.
In connection with the Transactions, International Paper received a private letter ruling from the Internal Revenue Service(‘‘IRS’’) to the effect that the Spin-off and certain related transactions will qualify as tax-free to International Paper and theInternational Paper shareholders for U.S. federal income tax purposes. Although a private letter ruling from the IRS
17

generally is binding on the IRS, the IRS ruling does not rule that the Spin-off satisfies every requirement for a tax-free spin-offunder Section 355 of the Code, and we and International Paper relied solely on the opinion of counsel for comfort that suchadditional requirements are satisfied. We also received an opinion of counsel to the effect that the Spin-off will qualify as tax-free toInternational Paper and the International Paper shareholders. This opinion relied on the IRS ruling as to matters covered by the IRSruling.
The IRS ruling and such opinion were based on, among other things, certain representations and assumptions as to factualmatters made by us, International Paper and UWWH, including assumptions concerning Section 355(e) of the Code as discussedbelow. The failure of any factual representation or assumption to be true, correct and complete in all material respects couldadversely affect the validity of the IRS ruling or such opinion. An opinion of counsel represents counsel’s best legal judgment, is notbinding on the IRS or the courts, and the IRS or the courts may not agree with the opinion. In addition, the IRS ruling and suchopinion were based on then current law, and cannot be relied upon if current law changes with retroactive effect.
If the Spin-off does not qualify as a tax-free spin-off under Section 355 of the Code, then the receipt of our common stockwould be taxable to the International Paper shareholders, International Paper might recognize a substantial gain on the Spin-off, andwe may be required to indemnify International Paper for the tax on such gain pursuant to the Tax Matters Agreement we enteredinto with International Paper in connection with the Spin-off.
In addition, the Spin-off will be taxable to International Paper pursuant to Section 355(e) of the Code if there is a 50% or morechange in ownership of either International Paper or our company, directly or indirectly, as part of a plan or series of relatedtransactions that include the Spin-off. Because the International Paper shareholders collectively owned more than 50% of ourcommon stock upon the Merger, the Merger alone will not cause the Spin-off to be taxable to International Paper underSection 355(e) of the Code. However, Section 355(e) of the Code might apply if other acquisitions of stock of International Paperbefore or after the Merger, or of our company after the Merger, are considered to be part of a plan or series of related transactionsthat include the Spin-off. If Section 355(e) of the Code applied, then International Paper might recognize a substantial amount oftaxable gain, and we may be required to indemnify International Paper for the tax on such gain pursuant to the Tax MattersAgreement.
If the Merger does not qualify as a tax-free reorganization under Section 368(a) of the Code, then we may be required to pay substantialU.S. federal income taxes.
In connection with the Transactions, we received an opinion of counsel to the effect that the Merger will qualify as a tax-freereorganization under Section 368(a) of the Code. In addition, International Paper received a private letter ruling from the IRS to theeffect that the Merger will qualify as a tax-free reorganization under Section 368(a) of the Code. Although a private letter rulingfrom the IRS generally is binding on the IRS, the IRS ruling does not rule that the Merger satisfies every requirement for a tax-freereorganization under Section 368(a) of the Code, and we relied on an opinion of counsel for comfort that such additionalrequirements are satisfied.
The IRS ruling and such opinion were based on, among other things, certain representations and assumptions as to factualmatters made by us, International Paper and UWWH. The failure of any factual representation or assumption to be true, correct andcomplete in all material respects could adversely affect the validity of the IRS ruling and such opinion. An opinion of counselrepresents counsel’s best legal judgment, is not binding on the IRS or the courts, and the IRS or the courts may not agree with theopinion. In addition, the IRS ruling and such opinion were based on then current law, and cannot be relied upon if current lawchanges with retroactive effect.
If the Merger does not qualify as a tax-free reorganization under Section 368(a) of the Code, then UWWH would be consideredto have made a taxable sale of its assets to us and we would be required to pay the U.S. federal income tax on the gain, if any,arising from such taxable sale as a result of being the surviving corporation in the Merger.
If the Subsidiary Merger does not qualify as a transfer of property to Unisource under Section 351(a) of the Code, then we may berequired to pay substantial U.S. federal income taxes.
In connection with the Transactions, UWWH received an opinion of counsel to the effect that the merger of xpedx Intermediatewith and into Unisource (the ‘‘Subsidiary Merger’’ and, collectively with the Merger, the ‘‘Mergers’’) will qualify as a transfer ofproperty to Unisource under Section 351(a) of the Code. In addition, International Paper received a private letter ruling from theIRS to the effect that the Subsidiary Merger will qualify as a transfer of property to Unisource under
18

Section 351(a) of the Code. Although a private letter ruling from the IRS generally is binding on the IRS, the IRS ruling does notrule that the Subsidiary Merger satisfies every requirement for a transfer of property to Unisource under Section 351(a) of the Code,and the parties relied solely on the opinion of counsel for comfort that such additional requirements are satisfied.
The IRS ruling and such opinion were based on, among other things, certain representations and assumptions as to factualmatters made by us, International Paper and UWWH. The failure of any factual representation or assumption to be true, correct andcomplete in all material respects could adversely affect the validity of the IRS ruling or such opinion. An opinion of counselrepresents counsel’s best legal judgment, is not binding on the IRS or the courts, and the IRS or the courts may not agree with theopinion. In addition, the IRS ruling and such opinion were based on then current law, and cannot be relied upon if current lawchanges with retroactive effect.
If the Subsidiary Merger does not qualify as a transfer of property to Unisource under Section 351(a) of the Code, then wewould be considered to have made a taxable sale of the assets of xpedx Intermediate to Unisource, and we may either be required topay the U.S. federal income tax on such sale or to indemnify International Paper for the U.S. federal income tax on such salepursuant to the Tax Matters Agreement.
We are generally obligated to pay the UWWH Stockholder an amount equal to 85% of the tax savings arising from pre-Merger netoperating loss (‘‘NOL’’) carryforwards, and our ability to use such NOL carryforwards to offset future taxable income may be subject tolimitations, including as a result of an ownership change for Unisource in connection with the Merger under Section 382 of the Code.
Unisource had, and we acquired, substantial NOLs for U.S. federal, state and Canadian income tax purposes. Pursuant to theTax Receivable Agreement, we are generally obligated to pay the UWWH Stockholder an amount equal to 85% of the U.S. federal,state and Canadian income tax savings, if any, that we actually realize with respect to taxable periods (or portions thereof) beginningafter the date of the Merger as a result of the utilization of Unisource’s net operating losses attributable to taxable periods prior tothe date of the Merger. The utilization of Unisource’s NOLs, tax credits and other tax attributes depends on the timing and amountof taxable income earned by our company in the future and a lack of future taxable income would adversely affect our ability toutilize these tax attributes. Tax attributes are generally subject to expiration at various times in the future to the extent that they havenot previously been applied to offset the taxable income of our company, and there is a risk that our existing NOL carryforwardscould expire unused and be unavailable to offset future income tax liabilities. Moreover, the Merger resulted in an ownership changefor Unisource under Section 382 of the Code, potentially limiting the use of Unisource’s NOLs to offset future taxable income forboth U.S. federal and state income tax purposes. These limitations may affect the timing of when these NOLs may be used which, inturn, may impact the timing and amount of cash taxes payable by our company.
Significant judgment is required in evaluating the need for and magnitude of appropriate valuation allowances against deferredtax assets. The realization of these assets is dependent on generating future taxable income, as well as successful implementation ofvarious tax planning strategies. While we believe that the judgments and estimates with respect to the valuation allowances areappropriate and reasonable under the circumstances, actual results could differ from projected results, which could give rise toadditions to valuation allowances or reductions in valuation allowances. It is possible that such changes could have a material adverseeffect on the amount of income tax expense (benefit) recorded in our consolidated statement of operations.
We are required to abide by potentially significant restrictions that could limit our ability to undertake certain corporate actions (such asthe issuance of common stock or the undertaking of a merger or consolidation) that otherwise could be advantageous.
The Tax Matters Agreement prohibits us from taking actions that could reasonably be expected to cause the Transactions to betaxable. In particular, for two years after the Spin-off we may not:
• cease, or permit certain of our wholly owned subsidiaries to cease, the active conduct of a business that was conductedimmediately prior to the Spin-off or from holding certain assets held at the time of the Spin-off;
• dissolve, liquidate, take any action that is a liquidation for U.S. federal income tax purposes, merge or consolidate with anyother person (other than pursuant to the Mergers), or permit certain of our wholly owned subsidiaries from doing any of theforegoing; or
• approve or allow an extraordinary contribution to us by our shareholders in exchange for stock, redeem or otherwiserepurchase (directly or indirectly) any of our stock, or amend our certificate of incorporation or other organizational
19

documents, or take any other action, if such amendment or other action would affect the relative voting rights of our capitalstock.
Nevertheless, we are permitted to take any of the actions described above if International Paper obtains a supplemental IRSprivate letter ruling (or, in certain circumstances, an opinion of counsel that is reasonably acceptable to International Paper) to theeffect that such action will not affect the tax-free status of the Transactions. Because of these restrictions, for two years after theSpin-off, we may be limited in the amount of capital stock that we can issue to make acquisitions or to raise additional capital.
Risks Relating to Our Common Stock
Our stock price may fluctuate significantly.
The market price of our common stock may fluctuate widely, depending on many factors, some of which may be beyond ourcontrol, including:
• actual or anticipated fluctuations in the operating results of our company due to factors related to our business;
• success or failure of the strategy of our company;
• the quarterly or annual earnings of our company, or those of other companies in our industry;
• continued industry-wide decrease in demand for paper and related products;
• our ability to obtain third-party financing as needed;
• announcements by us or our competitors of significant acquisitions or dispositions;
• the inability to issue equity securities or convertible debt securities during the two year period following the Distribution Datewithout jeopardizing the intended tax consequences of the Transactions;
• restrictions on our ability to pay dividends under our ABL Facility;
• changes in accounting standards, policies, guidance, interpretations or principles;
• the operating and stock price performance of other comparable companies;
• investor perception of our company;
• natural or environmental disasters that investors believe may affect our company;
• overall market fluctuations;
• results from any material litigation or government investigation;
• changes in laws and regulations affecting our company or any of the principal products sold by our company; and
• general economic conditions and other external factors.
Stock markets in general have experienced volatility that has often been unrelated to the operating performance of a particularcompany. These broad market fluctuations could adversely affect the trading price of our common stock.
If securities or industry analysts do not publish research or publish unfavorable research about our company, our stock price andtrading volume could decline.
The trading market for our common stock depends in part on the research and reports that securities or industry analystspublish about us and our business. If the current coverage of our company by securities or industry analysts ceases, the trading pricefor our stock would be negatively impacted. In addition, if one or more of these analysts downgrades our stock or publishesmisleading or unfavorable research about our business, our stock price would likely decline. If one or more of these analysts ceasescoverage of our company or fails to publish reports on us regularly, demand for our stock could decrease, which could cause ourstock price or trading volume to decline.
A few shareholders may exert significant control over the direction of our company. Ownership of our common stock is highlyconcentrated as a result of the Transactions and could prevent shareholders from influencing significant corporate decisions.
As a result of the Transactions, the UWWH Stockholder, controlled by Bain Capital, beneficially owns approximately 49% of theoutstanding shares of our common stock. As a result, the UWWH Stockholder will exercise significant influence over all mattersrequiring shareholder approval for the foreseeable future, including approval of significant corporate transactions, which may reducethe market price of our common stock. The interests of the UWWH Stockholder may conflict with the interests of our othershareholders. Our board of directors has adopted corporate governance guidelines that, among other things, address potentialconflicts between a director’s interests and our interests. In addition, we have adopted
20

a code of business conduct that, among other things, requires our employees to avoid actions or relationships that might conflict orappear to conflict with their job responsibilities or our interests and to disclose their outside activities, financial interests orrelationships that may present a possible conflict of interest or the appearance of a conflict to management or corporate counsel.These corporate governance guidelines and code of business ethics do not, by themselves, prohibit transactions with our principalshareholders.
Under our amended and restated certificate of incorporation, the UWWH Stockholder, Bain Capital Fund VII, L.P. and their respectiveaffiliates and, in some circumstances, any of our directors and officers who is also a director, officer, employee, member or partner of theUWWH Stockholder, Bain Capital Fund VII, L.P. and their respective affiliates, have no obligation to offer us corporate opportunities.
The policies relating to corporate opportunities and transactions with the UWWH Stockholder, Bain Capital Fund VII, L.P. andtheir respective affiliates set forth in our amended and restated certificate of incorporation address potential conflicts of interestbetween us, on the one hand, and the UWWH Stockholder, Bain Capital Fund VII, L.P., their respective affiliates and theirrespective officers and directors who are directors or officers of our company, on the other hand. Although these provisions aredesigned to resolve conflicts between us and the UWWH Stockholder, Bain Capital Fund VII, L.P. and their respective affiliatesfairly, conflicts may not be so resolved.
Anti-takeover provisions in our amended and restated certificate of incorporation and amended and restated by-laws could discourage,delay or prevent a change of control of our company and may affect the trading price of our common stock.
Our amended and restated certificate of incorporation and amended and restated by-laws include a number of provisions thatmay discourage, delay or prevent a change in our management or control over us that shareholders may consider favorable. Forexample, our amended and restated certificate of incorporation and amended and restated by-laws collectively:
• authorize the issuance of ‘‘blank check’’ preferred stock that could be issued by our board of directors to thwart a takeoverattempt;
• limit the ability of shareholders to remove directors;
• provide that vacancies on our board of directors, including vacancies resulting from an enlargement of our board of directors,may be filled only by a majority vote of directors then in office;
• prohibit shareholders from calling special meetings of shareholders unless called by the holders of not less than 20% of ouroutstanding shares of common stock;
• prohibit shareholder action by written consent, unless initiated by the holders of not less than 20% of the outstanding sharesof common stock;
• establish advance notice requirements for nominations of candidates for election as directors or to bring other business beforean annual meeting of our shareholders; and
• require the approval of holders of at least a majority of the outstanding shares of our common stock to amend our amendedand restated by-laws and certain provisions of our amended and restated certificate of incorporation.
These provisions may prevent our shareholders from receiving the benefit from any premium to the market price of ourcommon stock offered by a bidder in a takeover context. Even in the absence of a takeover attempt, the existence of these provisionsmay adversely affect the prevailing market price of our common stock if the provisions are viewed as discouraging takeover attemptsin the future.
Our amended and restated certificate of incorporation and amended and restated by-laws may also make it difficult forshareholders to replace or remove our management. These provisions may facilitate management entrenchment that may delay,deter, render more difficult or prevent a change in our control, which may not be in the best interests of our shareholders.
We do not intend to pay dividends on our common stock and, consequently, your ability to achieve a return on your investment willdepend on appreciation in the price of our common stock.
We do not intend to declare and pay dividends on our common stock for the foreseeable future. We currently intend to investour future earnings, if any, to fund our growth, to develop our business, for working capital needs and for general corporatepurposes. Therefore, the success of an investment in shares of our common stock will depend upon any future
21

appreciation in their value. There is no guarantee that shares of our common stock will appreciate in value or even maintain theircurrent value. In addition, our operations are conducted almost entirely through our subsidiaries. As such, to the extent that wedetermine in the future to pay dividends on our common stock, none of our subsidiaries will be obligated to make funds available tous for the payment of dividends. Further, the agreements governing our ABL Facility can, in certain circumstances, restrict the abilityof our subsidiaries to pay dividends or otherwise transfer assets to us. We are also restricted under the Contribution and DistributionAgreement that we entered into with International Paper in connection with the Spin-off from declaring or paying special dividendsthrough July 1, 2016 (or, in certain circumstances, January 1, 2016). In addition, Delaware law may impose requirements that mayrestrict our ability to pay dividends to holders of our common stock.
A significant percentage of our outstanding common stock is held by a single shareholder, which could impact your liquidity, and futuresales of our common stock by this shareholder may lower our stock price.
As noted above, the UWWH Stockholder, which is jointly owned by Bain Capital and Georgia-Pacific, currently owns 7,840,000shares, or 49%, of our common stock. Continuation of this concentrated ownership could result in a limited amount of shares beingavailable to be traded in the market, resulting in reduced liquidity.
The shares held by the UWWH Stockholder are restricted securities within the meaning of Rule 144 under the Securities Act of1933 (the ‘‘Securities Act’’) and are eligible for resale in the public market without registration subject to volume, manner of sale andholding period limitations under Rule 144 under the Securities Act. Further, pursuant to the Registration Rights Agreement, dated asof July 1, 2014, between the UWWH Stockholder and the Company, all of the shares of our common stock owned by the UWWHStockholder are now eligible to be registered under the Securities Act, subject to certain limitations set forth in the RegistrationRights Agreement, and may be offered and sold to the public now or in the future. If and when some or all of these shares are sold,or if it is perceived that they will be sold, the market price of our common stock could decline.
Our amended and restated certificate of incorporation designates the Court of Chancery of the State of Delaware as the exclusive forumfor certain litigation that may be initiated by our shareholders, which could limit our shareholders’ ability to obtain a favorable judicialforum for disputes with us.
Our amended and restated certificate of incorporation provides that the Court of Chancery of the State of Delaware is the soleand exclusive forum for (i) any derivative action or proceeding brought on our behalf, (ii) any action asserting a claim of breach of afiduciary duty owed to us or our shareholders by any of our directors, officers, employees or agents, (iii) any action asserting a claimagainst us arising under the Delaware General Corporation Law or (iv) any action asserting a claim against us that is governed bythe internal affairs doctrine. The choice of forum provision in our amended and restated certificate of incorporation may limit ourshareholders’ ability to obtain a favorable judicial forum for disputes with us.
ITEM 1B. UNRESOLVED STAFF COMMENTS
Not applicable.
ITEM 2. PROPERTIES
As of December 31, 2014, our corporate office operations were split between our offices in Norcross, Georgia and Loveland,Ohio. In December 2014, we announced our plans to relocate our principal executive offices to 400 Northpark Town Center inAtlanta, Georgia.
As of December 31, 2014, we had a distribution network of more than 180 distribution centers, of which approximately 160 wereleased and 20 were owned. Our leased locations comprise approximately 19.7 million square feet while our owned locations compriseapproximately 2.7 million square feet.
These facilities are strategically located throughout the U.S., Canada and Mexico in order to efficiently serve our customer basein the surrounding areas while also facilitating expedited delivery services for special orders. We continually evaluate location, sizeand attributes to maximize efficiency, deliver top quality customer service and achieve economies of scale.
The Company also leases various office spaces for corporate and sales functions.
22

ITEM 3. LEGAL PROCEEDINGS
From time to time, the Company is involved in various lawsuits, claims, and regulatory and administrative proceedings arisingout of its business relating to general commercial and contractual matters, governmental regulations, intellectual property rights,labor and employment matters, tax and other actions.
Although the ultimate outcome of any legal proceeding or investigation cannot be predicted with certainty, based on presentinformation, including the Company’s assessment of the merits of the particular claim, the Company does not expect that anyasserted or unasserted legal claims or proceedings, individually or in the aggregate, will have a material adverse effect on its cashflow, results of operations or financial condition.
ITEM 4. MINE SAFETY DISCLOSURES
Not applicable.
PART II
ITEM 5. MARKET FOR REGISTRANT’S COMMON EQUITY, RELATED STOCKHOLDER MATTERS AND ISSUERPURCHASES OF EQUITY SECURITIES
Veritiv’s common stock is publicly traded on the New York Stock Exchange (‘‘NYSE’’) under the symbol VRTV. A‘‘when-issued’’ trading market for Veritiv’s common stock began on the NYSE on June 18, 2014, and ‘‘regular-way’’ trading ofVeritiv’s common stock began on July 2, 2014. As of March 16, 2015, there were 7,048 shareholders of record.
The following table sets forth, for the quarterly reporting periods indicated, the high and low market prices per share for theCompany’s common stock, as reported on the NYSE.
2014
3rd Quarter 4th Quarter
High . . . . . . . . . . . . . . . . . . . . . . . . . . . . . . . . . . . . . . . . . . . . . . . . . . . . . . . . . $53.21 $52.23Low . . . . . . . . . . . . . . . . . . . . . . . . . . . . . . . . . . . . . . . . . . . . . . . . . . . . . . . . . $31.94 $40.93
Veritiv does not intend to declare and pay dividends on its common stock for the foreseeable future. The Company currentlyintends to invest its future earnings, if any, to fund its growth, to develop its business, for working capital needs and for generalcorporate purposes. Any payment of dividends will be at the discretion of Veritiv’s board of directors and will depend upon variousfactors then existing, including earnings, financial condition, results of operations, capital requirements, level of indebtedness,contractual restrictions with respect to payment of dividends, restrictions imposed by applicable law, general business conditions andother factors that Veritiv’s board of directors may deem relevant.
Performance Graph
The following graph provides a comparison of the cumulative shareholder return on the Company’s common stock to the returnsof the Russell 2000 Index and the average performance of a group consisting of the Company’s peer companies (the ‘‘Peer Group’’)based on total shareholder return from June 18, 2014 (the first day our common stock began ‘‘when-issued’’ trading on the NYSE)through December 31, 2014. Companies included in the Peer Group are as follows:
23

24MAR201513423418
• Anixter International Inc. • Graphic Packaging Holding Company • Resolute Forest Products Inc.
• Applied Industrial Technologies, Inc. • InnerWorkings Inc. • Rock-Tenn Company
• Arrow Electronics, Inc. • International Paper • ScanSource, Inc.
• Avery Dennison Corporation • Kaman Corporation • Sealed Air Corporation
• Avnet, Inc. • KapStone Paper and Packaging • Sonoco Products Co.Corporation
• Bemis Company, Inc. • MeadWestvaco Corporation • Staples, Inc.
• Brady Corporation • MSC Industrial Direct Co. Inc. • United Stationers Inc.
• Deluxe Corporation • Neenah Paper, Inc. • W.W. Grainger, Inc.
• Domtar Corporation • Office Depot, Inc. • Wausau Paper Corporation
• Ennis Inc. • Packaging Corporation of America • WESCO International Inc.
• Fastenal Company • PH Glatfelter Co.
• Genuine Parts Company • R.R. Donnelley & Sons Company
The graph is not, and is not intended to be, indicative of future performance of our common stock. The graph assumes $100invested on June 18, 2014 in the Company, the Russell 2000 Index and the Peer Group. Total return indices reflect reinvestment ofdividends and are weighted on the basis of market capitalization at the time of each reported data point.
Comparison of 7 Month Cumulative Total ReturnAmong Veritiv Corporation, the Russell 2000 Index and Peer Group
$140
$130
$120
$110
$100
$90
$806/18/2014 6/30/2014 7/31/2014 8/31/2014 9/30/2014 10/31/2014 11/30/2014 12/31/2014
Veritiv Corporation
Russell 2000 Index
Peer Group
24
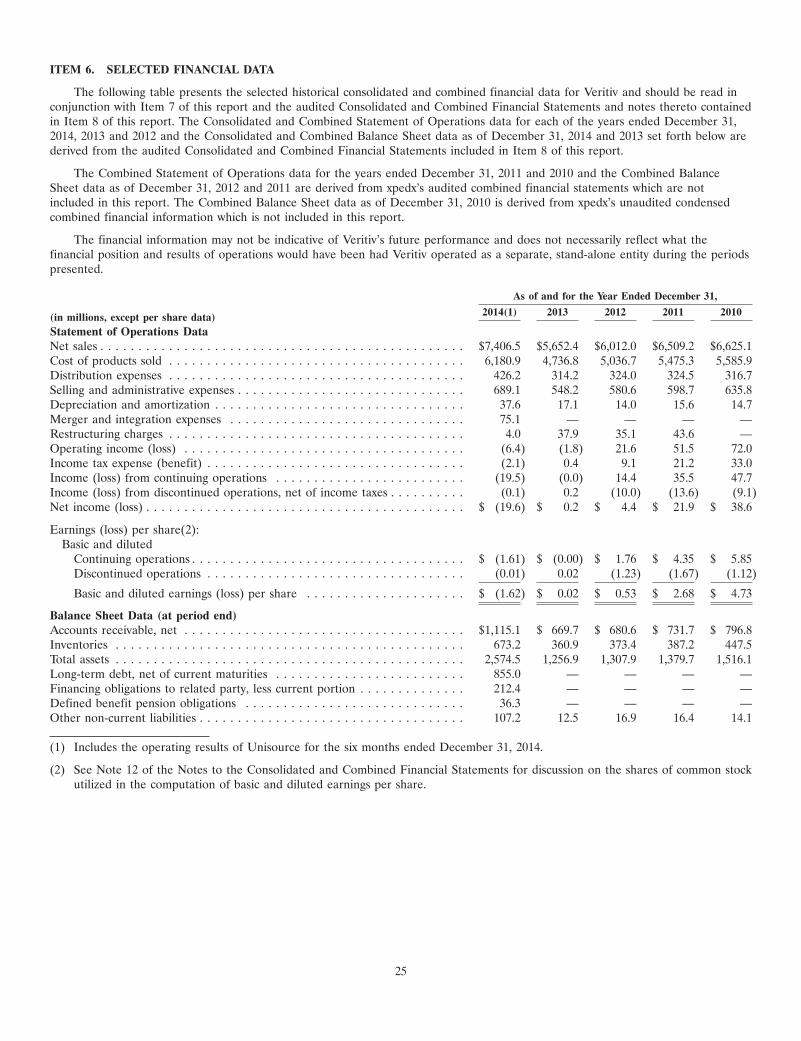
ITEM 6. SELECTED FINANCIAL DATA
The following table presents the selected historical consolidated and combined financial data for Veritiv and should be read inconjunction with Item 7 of this report and the audited Consolidated and Combined Financial Statements and notes thereto containedin Item 8 of this report. The Consolidated and Combined Statement of Operations data for each of the years ended December 31,2014, 2013 and 2012 and the Consolidated and Combined Balance Sheet data as of December 31, 2014 and 2013 set forth below arederived from the audited Consolidated and Combined Financial Statements included in Item 8 of this report.
The Combined Statement of Operations data for the years ended December 31, 2011 and 2010 and the Combined BalanceSheet data as of December 31, 2012 and 2011 are derived from xpedx’s audited combined financial statements which are notincluded in this report. The Combined Balance Sheet data as of December 31, 2010 is derived from xpedx’s unaudited condensedcombined financial information which is not included in this report.
The financial information may not be indicative of Veritiv’s future performance and does not necessarily reflect what thefinancial position and results of operations would have been had Veritiv operated as a separate, stand-alone entity during the periodspresented.
As of and for the Year Ended December 31,
2014(1) 2013 2012 2011 2010(in millions, except per share data)Statement of Operations DataNet sales . . . . . . . . . . . . . . . . . . . . . . . . . . . . . . . . . . . . . . . . . . . . . . . . $7,406.5 $5,652.4 $6,012.0 $6,509.2 $6,625.1Cost of products sold . . . . . . . . . . . . . . . . . . . . . . . . . . . . . . . . . . . . . . . 6,180.9 4,736.8 5,036.7 5,475.3 5,585.9Distribution expenses . . . . . . . . . . . . . . . . . . . . . . . . . . . . . . . . . . . . . . . 426.2 314.2 324.0 324.5 316.7Selling and administrative expenses . . . . . . . . . . . . . . . . . . . . . . . . . . . . . . 689.1 548.2 580.6 598.7 635.8Depreciation and amortization . . . . . . . . . . . . . . . . . . . . . . . . . . . . . . . . . 37.6 17.1 14.0 15.6 14.7Merger and integration expenses . . . . . . . . . . . . . . . . . . . . . . . . . . . . . . . 75.1 — — — —Restructuring charges . . . . . . . . . . . . . . . . . . . . . . . . . . . . . . . . . . . . . . . 4.0 37.9 35.1 43.6 —Operating income (loss) . . . . . . . . . . . . . . . . . . . . . . . . . . . . . . . . . . . . . (6.4) (1.8) 21.6 51.5 72.0Income tax expense (benefit) . . . . . . . . . . . . . . . . . . . . . . . . . . . . . . . . . . (2.1) 0.4 9.1 21.2 33.0Income (loss) from continuing operations . . . . . . . . . . . . . . . . . . . . . . . . . (19.5) (0.0) 14.4 35.5 47.7Income (loss) from discontinued operations, net of income taxes . . . . . . . . . . (0.1) 0.2 (10.0) (13.6) (9.1)Net income (loss) . . . . . . . . . . . . . . . . . . . . . . . . . . . . . . . . . . . . . . . . . . $ (19.6) $ 0.2 $ 4.4 $ 21.9 $ 38.6
Earnings (loss) per share(2):Basic and diluted
Continuing operations . . . . . . . . . . . . . . . . . . . . . . . . . . . . . . . . . . . . $ (1.61) $ (0.00) $ 1.76 $ 4.35 $ 5.85Discontinued operations . . . . . . . . . . . . . . . . . . . . . . . . . . . . . . . . . . (0.01) 0.02 (1.23) (1.67) (1.12)
Basic and diluted earnings (loss) per share . . . . . . . . . . . . . . . . . . . . . $ (1.62) $ 0.02 $ 0.53 $ 2.68 $ 4.73
Balance Sheet Data (at period end)Accounts receivable, net . . . . . . . . . . . . . . . . . . . . . . . . . . . . . . . . . . . . . $1,115.1 $ 669.7 $ 680.6 $ 731.7 $ 796.8Inventories . . . . . . . . . . . . . . . . . . . . . . . . . . . . . . . . . . . . . . . . . . . . . . 673.2 360.9 373.4 387.2 447.5Total assets . . . . . . . . . . . . . . . . . . . . . . . . . . . . . . . . . . . . . . . . . . . . . . 2,574.5 1,256.9 1,307.9 1,379.7 1,516.1Long-term debt, net of current maturities . . . . . . . . . . . . . . . . . . . . . . . . . 855.0 — — — —Financing obligations to related party, less current portion . . . . . . . . . . . . . . 212.4 — — — —Defined benefit pension obligations . . . . . . . . . . . . . . . . . . . . . . . . . . . . . 36.3 — — — —Other non-current liabilities . . . . . . . . . . . . . . . . . . . . . . . . . . . . . . . . . . . 107.2 12.5 16.9 16.4 14.1
(1) Includes the operating results of Unisource for the six months ended December 31, 2014.
(2) See Note 12 of the Notes to the Consolidated and Combined Financial Statements for discussion on the shares of common stockutilized in the computation of basic and diluted earnings per share.
25

ITEM 7. MANAGEMENT’S DISCUSSION AND ANALYSIS OF FINANCIAL CONDITION AND RESULTS OF OPERATIONS
The following discussion of the Company’s results of operations and financial condition should be read in conjunction with theConsolidated and Combined Financial Statements and Notes thereto, included elsewhere in this report. The financial information discussedbelow and included in this report as of December 31, 2013 and for the years ended December 31, 2013 and 2012 may not necessarilyreflect what xpedx’s financial condition, results of operations or cash flows would have been had xpedx been a stand-alone company duringthis period or what xpedx’s financial condition, results of operations and cash flows may be in the future.
References in the Consolidated and Combined Financial Statements to ‘‘International Paper’’ or ‘‘Parent’’ refer to International PaperCompany.
Executive Overview
Business Overview
Veritiv Corporation (‘‘Veritiv’’ or the ‘‘Company’’) is a leading North American business-to-business distributor of print,publishing, packaging, facility and logistics solutions. Established in 2014, following the merger of International Paper’s xpedx division(‘‘xpedx’’) and UWW Holdings, Inc. (‘‘UWWH’’), the Company operates from more than 180 distribution centers primarilythroughout the U.S., Canada and Mexico.
xpedx was a business-to-business distributor of paper, publishing, packaging and facility supplies products in North America thatoperated in the U.S. and Mexico. xpedx distributed products and services to various customer markets, including printers, publishers,data centers, manufacturers, higher education institutions, healthcare facilities, sporting and performance arenas, retail stores,government agencies, property managers and building service contractors.
UWWH, operating through Unisource Worldwide, Inc. and its other consolidated subsidiaries (collectively, ‘‘Unisource’’), was adistributor of printing and business paper, publishing solutions, packaging supplies and equipment, facility supplies and equipmentand logistics services that operated primarily in the U.S. and Canada. Unisource sold its products to a diverse customer base thatincluded the commercial printing, retail, hospitality, healthcare, governmental, distribution and manufacturing sectors.
Veritiv’s business is organized under four reportable segments: Print, Publishing, Packaging and Facility Solutions. During 2014,the Company realigned and expanded its reportable segments to include a new Publishing segment. This realignment followed theCompany’s merger with Unisource in the third quarter of 2014. This new segment structure is consistent with the way the ChiefOperating Decision Maker now makes operating decisions and manages the growth and profitability of the Company’s business. As aresult of the change in segment reporting, all historical financial information has been revised to conform to the new presentation.The following summary describes the products and services offered in each of the segments:
• Print—The Print segment sells and distributes commercial printing, writing, copying, digital, wide format and specialty paperproducts, graphics consumables and graphics equipment primarily in the U.S., Canada and Mexico. This segment also includescustomized paper conversion services of commercial printing paper for distribution to document centers and form printers.Our broad geographic platform of operations coupled with the breadth of paper and graphics products, including our exclusiveprivate brand offerings, provides a foundation to service national, regional and local customers across North America.
• Publishing—The Publishing segment sells and distributes coated and uncoated commercial printing papers to publishers,retailers, converters, printers and specialty businesses for use in magazines, catalogs, books, directories, gaming, couponing,retail inserts and direct mail. This segment also provides print management, procurement and supply chain managementsolutions to simplify paper and print procurement processes for its customers.
• Packaging—The Packaging segment provides standard as well as custom and comprehensive packaging solutions for customersbased in North America and in key global markets. The business is strategically focused on higher growth industries includinglight industrial/general manufacturing, food processing and manufacturing, fulfillment and internet retail, as well as nicheverticals based on geographical and functional expertise. Veritiv’s packaging
26

professionals create customer value through supply chain solutions, structural and graphic packaging design and engineering,automation, workflow and equipment services, contract packaging, and kitting and fulfillment.
• Facility Solutions—The Facility Solutions segment sources and sells cleaning, break-room and other supplies such as towels,tissues, wipers and dispensers, can liners, commercial cleaning chemicals, soaps and sanitizers, sanitary maintenance suppliesand equipment, safety and hazard supplies, and shampoos and amenities primarily in the U.S., Canada and Mexico. Veritiv isa leading distributor in the Facility Solutions segment. We offer a world class network of leading suppliers in all categories;total cost of ownership solutions with re-merchandising, budgeting and compliance, inventory management, and consistentmulti-local supply solutions; and a sales-force trained to bring leading vertical expertise to all of the major North Americangeographies.
The Company also has a Corporate & Other category which includes certain assets and costs not primarily attributable to any ofthe reportable segments, as well as our Veritiv Logistics Solutions business which provides transportation and warehousing solutions.
The Spin-off and Merger
On July 1, 2014 (the ‘‘Distribution Date’’), International Paper completed the previously announced spin-off of xpedx to theInternational Paper shareholders (the ‘‘Spin-off’’), forming a new public company called Veritiv. Immediately following the Spin-off,UWWH merged with and into Veritiv (the ‘‘Merger’’). Prior to the Distribution Date, Veritiv’s financial position, results ofoperations and cash flows consisted of only the xpedx business of International Paper and have been derived from InternationalPaper’s historical accounting records. The financial results of xpedx have been presented on a carve-out basis through theDistribution Date, while the financial results for Veritiv, post Spin-off, are prepared on a stand-alone basis. As such, theConsolidated and Combined Statements of Operations, Consolidated and Combined Statements of Comprehensive Income (Loss)and Consolidated and Combined Statements of Cash Flows for the year ended December 31, 2014 consist of:
• the combined results of operations of xpedx for the six months ended June 30, 2014 on a carve-out basis, and
• the consolidated results of Veritiv on a stand-alone basis for the six months ended December 31, 2014.
The combined financial statements as of December 31, 2013 and for the years ended December 31, 2013 and 2012 consistentirely of the combined results of xpedx on a carve-out basis.
For periods prior to the Spin-off, the combined financial statements include expense allocations for certain functions previouslyprovided by International Paper. See Note 1 of the Notes to the Consolidated and Combined Financial Statements for furtherinformation.
Key Performance Measure
Adjusted EBITDA is the primary financial performance measure Veritiv uses to manage its businesses, to monitor its results ofoperations, to measure its performance against the ABL Facility and to incentivize its management. This common metric is intendedto align shareholders, debt holders and management. Adjusted EBITDA is a non-GAAP financial measure and is not an alternativeto net income, operating income or any other measure prescribed by U.S. generally accepted accounting principles (‘‘GAAP’’).
Veritiv uses Adjusted EBITDA (earnings before interest, income taxes, depreciation and amortization, restructuring charges(income), non-restructuring stock-based compensation expense, LIFO (income) expense, asset impairment charge, non-restructuringseverance charges, gain on sale of joint venture, merger and integration expenses, income (loss) from discontinued operations, net ofincome taxes, fair value adjustments on the contingent liability associated with the Tax Receivable Agreement (‘‘TRA’’) and certainother adjustments) because Veritiv believes investors commonly use Adjusted EBITDA as a key financial metric for valuingcompanies such as Veritiv. In addition, the credit agreement governing the ABL Facility (as defined in the Notes to the Consolidatedand Combined Financial Statements) permits the Company to exclude these and other charges in calculating Consolidated EBITDA,as defined in the ABL Facility.
The table below provides a reconciliation of Veritiv’s net income (loss) determined in accordance with GAAP to AdjustedEBITDA on a pro forma basis for the years ended December 31, 2014 and 2013. The pro forma adjustments take into account theMerger and the related financing as if they occurred on January 1, 2013, as well as purchase accounting adjustments and transactioncosts related to the Merger. The pro forma results do not reflect events that have occurred or may occur after the transactions,including the impact of any synergies expected to result from the Merger. Accordingly, the
27

unaudited pro forma financial information is not necessarily indicative of the results of operations as they would have been had thetransactions been effected on the assumed date, nor is it necessarily an indication of future operating results.
Year Ended December 31, 2014 Year Ended December 31, 2013
Veritiv Pro Veritiv Veritiv Pro VeritivAs Forma Pro As Forma Pro
Reported Adjustments Forma Reported Adjustments Forma(in millions)Net income (loss) . . . . . . . . . . . . . . . . . . . . . . . . . . . . . . $ (19.6) $ 42.3 $ 22.7 $ 0.2 $ 180.9(1) $ 181.1Interest expense, net . . . . . . . . . . . . . . . . . . . . . . . . . . . . 14.0 12.4 26.4 — 25.9 25.9Income tax expense (benefit) . . . . . . . . . . . . . . . . . . . . . . (2.1) 44.3 42.2 0.4 (267.9)(1) (267.5)Depreciation and amortization . . . . . . . . . . . . . . . . . . . . . 37.6 14.7 52.3 17.1 39.1 56.2
EBITDA . . . . . . . . . . . . . . . . . . . . . . . . . . . . . . . . . . . . $ 29.9 $ 113.7 $ 143.6 $ 17.7 $ (22.0) $ (4.3)Restructuring charges (income) . . . . . . . . . . . . . . . . . . . . . 4.0 0.2 4.2 37.9 (3.4) 34.5Non-restructuring stock-based compensation . . . . . . . . . . . . 4.0 0.1 4.1 13.1 0.4 13.5LIFO (income) expense . . . . . . . . . . . . . . . . . . . . . . . . . . 6.3 (2.8) 3.5 3.4 3.3 6.7Asset impairment charge . . . . . . . . . . . . . . . . . . . . . . . . . — 2.8 2.8 — 0.4 0.4Non-restructuring severance charges . . . . . . . . . . . . . . . . . 2.6 0.4 3.0 2.3 0.4 2.7Gain on sale of joint venture . . . . . . . . . . . . . . . . . . . . . . — (6.6) (6.6) — — —Merger and integration expenses . . . . . . . . . . . . . . . . . . . . 75.1 (75.1) — — 103.5 103.5Fair value adjustment on TRA contingent liability . . . . . . . . 1.7 — 1.7 — — —Other . . . . . . . . . . . . . . . . . . . . . . . . . . . . . . . . . . . . . . (1.7) (1.1) (2.8) — 4.5 4.5Loss (income) from discontinued operations, net of income
taxes . . . . . . . . . . . . . . . . . . . . . . . . . . . . . . . . . . . . . 0.1 — 0.1 (0.2) — (0.2)
Adjusted EBITDA . . . . . . . . . . . . . . . . . . . . . . . . . . . . . $ 122.0 $ 31.6 $ 153.6 $ 74.2 $ 87.1 $ 161.3
Net sales . . . . . . . . . . . . . . . . . . . . . . . . . . . . . . . . . . . . $7,406.5 $1,907.6 $9,314.1 $5,652.4 $4,089.1 $9,741.5Adjusted EBITDA / Pro Forma Adjusted EBITDA as a % of
net sales . . . . . . . . . . . . . . . . . . . . . . . . . . . . . . . . . . . 1.6% 1.6% 1.3% 1.7%
(1) Unisource’s historical results for the year ended December 31, 2013 includes the reversal of a $238.7 million valuation allowanceagainst its U.S. federal and a substantial portion of its state net deferred tax assets.
The table below provides a reconciliation of Veritiv’s net income (loss) determined in accordance with GAAP to AdjustedEBITDA for the years ended December 31, 2014, 2013 and 2012.
Year Ended December 31,
2014 2013 2012(in millions)Net income (loss) . . . . . . . . . . . . . . . . . . . . . . . . . . . . . . . . . . . . . . . . . . . . . . . . . . . . . . . . . $ (19.6) $ 0.2 $ 4.4Interest expense, net . . . . . . . . . . . . . . . . . . . . . . . . . . . . . . . . . . . . . . . . . . . . . . . . . . . . . . . 14.0 — —Income tax expense (benefit) . . . . . . . . . . . . . . . . . . . . . . . . . . . . . . . . . . . . . . . . . . . . . . . . . (2.1) 0.4 9.1Depreciation and amortization . . . . . . . . . . . . . . . . . . . . . . . . . . . . . . . . . . . . . . . . . . . . . . . . 37.6 17.1 14.0
EBITDA . . . . . . . . . . . . . . . . . . . . . . . . . . . . . . . . . . . . . . . . . . . . . . . . . . . . . . . . . . . . . . . $ 29.9 $ 17.7 $ 27.5Restructuring charges . . . . . . . . . . . . . . . . . . . . . . . . . . . . . . . . . . . . . . . . . . . . . . . . . . . . . . 4.0 37.9 35.1Non-restructuring stock-based compensation . . . . . . . . . . . . . . . . . . . . . . . . . . . . . . . . . . . . . . . 4.0 13.1 13.1LIFO expense . . . . . . . . . . . . . . . . . . . . . . . . . . . . . . . . . . . . . . . . . . . . . . . . . . . . . . . . . . . 6.3 3.4 1.0Non-restructuring severance charges . . . . . . . . . . . . . . . . . . . . . . . . . . . . . . . . . . . . . . . . . . . . 2.6 2.3 0.6Merger and integration expenses . . . . . . . . . . . . . . . . . . . . . . . . . . . . . . . . . . . . . . . . . . . . . . . 75.1 — —Fair value adjustment on TRA contingent liability . . . . . . . . . . . . . . . . . . . . . . . . . . . . . . . . . . . 1.7 — —Other . . . . . . . . . . . . . . . . . . . . . . . . . . . . . . . . . . . . . . . . . . . . . . . . . . . . . . . . . . . . . . . . . (1.7) — 2.2Loss (income) from discontinued operations, net of income taxes . . . . . . . . . . . . . . . . . . . . . . . . 0.1 (0.2) 10.0
Adjusted EBITDA . . . . . . . . . . . . . . . . . . . . . . . . . . . . . . . . . . . . . . . . . . . . . . . . . . . . . . . . $ 122.0 $ 74.2 $ 89.5
Net sales . . . . . . . . . . . . . . . . . . . . . . . . . . . . . . . . . . . . . . . . . . . . . . . . . . . . . . . . . . . . . . . $7,406.5 $5,652.4 $6,012.0Adjusted EBITDA as a % of net sales . . . . . . . . . . . . . . . . . . . . . . . . . . . . . . . . . . . . . . . . . . . 1.6% 1.3% 1.5%
28

Adjusted EBITDA has limitations as an analytical tool and should not be considered in isolation or as a substitute for analysis ofVeritiv’s results as reported under GAAP. For example, Adjusted EBITDA:
• Does not reflect the Company’s income tax expenses or the cash requirements to pay its taxes; and
• Although depreciation and amortization charges are non-cash charges, it does not reflect that the assets being depreciated andamortized will often have to be replaced in the future, and the foregoing metrics do not reflect any cash requirements for suchreplacements.
Other companies in the industry may calculate Adjusted EBITDA differently than Veritiv does, limiting its usefulness as acomparative measure. Because of these limitations, Adjusted EBITDA should not be considered as a measure of discretionary cashavailable to Veritiv to invest in the growth of its business. Veritiv compensates for these limitations by relying both on the Company’sGAAP results and by using Adjusted EBITDA for supplemental purposes. Additionally, Adjusted EBITDA is not an alternativemeasure of financial performance under GAAP and therefore should be considered in conjunction with net income and otherperformance measures such as operating income or net cash provided by operating activities and not as an alternative to such GAAPmeasures.
Results of Operations, Including Business Segments
The following discussion compares the consolidated and combined operating results of Veritiv for the years ended December 31,2014, 2013 and 2012:
Comparison of the Years Ended December 31, 2014 and December 31, 2013
IncreaseYear Ended December 31, (Decrease)
2014 % 2013 % $ %(in millions)Net sales . . . . . . . . . . . . . . . . . . . . . . . . . . . . . . . . . . . . . . . . . . . . $7,406.5 100.0% $5,652.4 100.0% $1,754.1 31.0%Cost of products sold (exclusive of depreciation and amortization shown
separately below) . . . . . . . . . . . . . . . . . . . . . . . . . . . . . . . . . . . . . 6,180.9 83.5% 4,736.8 83.8% 1,444.1 30.5%Distribution expenses . . . . . . . . . . . . . . . . . . . . . . . . . . . . . . . . . . . 426.2 5.8% 314.2 5.6% 112.0 35.6%Selling and administrative expenses . . . . . . . . . . . . . . . . . . . . . . . . . . 689.1 9.3% 548.2 9.7% 140.9 25.7%Depreciation and amortization . . . . . . . . . . . . . . . . . . . . . . . . . . . . . 37.6 0.5% 17.1 0.3% 20.5 119.9%Merger and integration expenses . . . . . . . . . . . . . . . . . . . . . . . . . . . . 75.1 1.0% — —% 75.1 *Restructuring charges . . . . . . . . . . . . . . . . . . . . . . . . . . . . . . . . . . . 4.0 0.1% 37.9 0.7% (33.9) (89.4)%
Operating income (loss) . . . . . . . . . . . . . . . . . . . . . . . . . . . . . . . . . . (6.4) (0.1)% (1.8) (0.0)% (4.6) *Interest expense, net . . . . . . . . . . . . . . . . . . . . . . . . . . . . . . . . . . . . 14.0 0.2% — —% 14.0 *Other expense (income), net . . . . . . . . . . . . . . . . . . . . . . . . . . . . . . 1.2 0.0% (2.2) (0.0)% 3.4 *
Income (loss) from continuing operations before income taxes . . . . . . . (21.6) (0.3)% 0.4 0.0% (22.0) *Income tax expense (benefit) . . . . . . . . . . . . . . . . . . . . . . . . . . . . . . (2.1) (0.0)% 0.4 0.0% (2.5) *
Income (loss) from continuing operations . . . . . . . . . . . . . . . . . . . . . . (19.5) (0.3)% (0.0) (0.0)% (19.5) *Income (loss) from discontinued operations, net of income taxes . . . . . . (0.1) (0.0)% 0.2 0.0% (0.3) *
Net income (loss) . . . . . . . . . . . . . . . . . . . . . . . . . . . . . . . . . . . . . . $ (19.6) (0.3)% $ 0.2 0.0% (19.8) *
*—not meaningful
Net Sales
Net sales increased due primarily to the net sales contribution of $2,040.5 million, or 36.1%, from the Merger and due to anincrease in legacy xpedx Packaging segment sales which increased 2.9%. These increases were partially offset by an 8.2% decrease innet sales in the legacy xpedx Print, Publishing and Facility Solutions segments. See the ‘‘Segment Results’’ for additional discussion.
Cost of Products Sold
Cost of products sold increased due primarily to incremental costs of $1,677.3 million, or 35.4%, attributable to the Merger. Thisincrease was partially offset by a 4.9% decrease in legacy xpedx cost of products sold. The percentage decrease in cost of
29
products sold were driven by a decline in Facilities Solutions, Print and Publishing cost of products sold. The declines in the threesegments was driven primarily by a decline in sales volume.
Distribution Expenses
Distribution expenses increased due primarily to incremental expenses of $131.4 million, or 41.8%, attributable to the Merger.This increase was partially offset by a 6.2% decrease in legacy xpedx distribution expenses. The decline in legacy xpedx distributionexpenses was driven by (i) an $11.3 million decrease in vehicle operation expenses due primarily to a reduction in third-party freightexpense, (ii) a $4.1 million decrease in wages and benefits driven by a reduction in headcount and (iii) a $3.3 million one-timebenefit related to a change in Veritiv’s vacation policy.
Selling and Administrative Expenses
Selling and administrative expenses increased due primarily to incremental expenses of $191.9 million, or 35.0%, from theMerger. This increase was partially offset by a $51.0 million decrease in legacy xpedx selling and administrative expenses. Thedecrease in legacy xpedx selling and administrative expenses is primarily attributed to: (i) a $29.9 million reduction in allocatedexpenses from International Paper, (ii) a $9.6 million one-time benefit related to the change in the vacation policy previously noted,(iii) a $4.0 million decrease in personnel costs due to a reduction in headcount, (iv) a $4.0 million decrease in sales professionaltraining, (v) a $2.4 million reduction in IT project spending and (vi) a $1.1 million decline in miscellaneous other expenses.
Depreciation and Amortization Expenses
Depreciation and amortization expenses increased due primarily to incremental expenses of $19.0 million, or 111.1%,attributable to the Merger. Legacy xpedx depreciation and amortization expenses increased an additional 8.8% due primarily to anincrease in capital leases for tractor-trailer power units.
Merger and Integration Expenses
Merger and integration expenses incurred during the year included advisory, legal and other professional fees directly associatedwith the Merger; integration-related professional services and project management fees; retention compensation; termination benefits(including change-in-control bonuses); rebranding and other redundant costs to integrate the combined businesses of xpedx andUnisource. See Note 2 of the Notes to Consolidated and Combined Financial Statements for a breakdown of the major componentsof these costs.
Restructuring Charges
For the year ended December 31, 2014, restructuring charges related primarily to Veritiv’s restructuring program of its NorthAmerican operations intended to integrate the legacy xpedx and Unisource operations, generate cost savings and capture synergiesacross the combined company. During the fourth quarter of 2014, the Company initiated the process of consolidating warehouse andcustomer service locations of the legacy organizations as well as realigning its field and sales management function. As a result, theCompany incurred restructuring charges for employee termination benefits and other direct costs. See Note 3 of the Notes to theConsolidated and Combined Financial Statements for additional details. The Company may continue to record restructuring chargesin the future as integration activities progress. Restructuring charges for the year ended December 31, 2013 related to xpedx’smulti-year restructuring plan as further described below.
Interest Expense, Net
Interest expense, net primarily consists of (i) $9.2 million of interest expense on the ABL Facility, (ii) $2.2 million foramortization of deferred financing costs related to the ABL Facility, (iii) $1.1 million attributable to financing obligations to relatedparty and (iv) $1.5 million in miscellaneous other interest expense.
Effective Tax Rate
Veritiv’s effective tax rate was 9.7% and 100.0% for the years ended December 31, 2014 and 2013, respectively. The differencebetween the Company’s effective tax rate for the year ended December 31, 2014 and the U.S. statutory tax rate of 35% is principallyrelated to non-deductible transaction-related costs and other expenses and changes in the valuation allowance. Over time, theCompany estimates its effective tax rate will be approximately 38-40%. However, it may vary significantly due to potential changes inthe amount and mix of pre-tax book income and changes in amounts of non-deductible expenses and other items impacting theeffective tax rate. See Note 7 of the Notes to the Consolidated and Combined Financial Statements for additional details.
30

Comparison of the Years Ended December 31, 2013 and December 31, 2012
IncreaseYear Ended December 31, (Decrease)
2013 % 2012 % $ %(in millions)Net sales . . . . . . . . . . . . . . . . . . . . . . . . . . . . . . . . . . . . . . . . . . . . . $5,652.4 100.0% $6,012.0 100.0% $(359.6) (6.0)%Cost of products sold (exclusive of depreciation and amortization shown
separately below) . . . . . . . . . . . . . . . . . . . . . . . . . . . . . . . . . . . . . 4,736.8 83.8% 5,036.7 83.8% (299.9) (6.0)%Distribution expenses . . . . . . . . . . . . . . . . . . . . . . . . . . . . . . . . . . . . 314.2 5.6% 324.0 5.4% (9.8) (3.0)%Selling and administrative expenses . . . . . . . . . . . . . . . . . . . . . . . . . . . 548.2 9.7% 580.6 9.7% (32.4) (5.6)%Depreciation and amortization . . . . . . . . . . . . . . . . . . . . . . . . . . . . . . 17.1 0.3% 14.0 0.2% 3.1 22.1%Restructuring charges . . . . . . . . . . . . . . . . . . . . . . . . . . . . . . . . . . . . 37.9 0.7% 35.1 0.6% 2.8 8.0%
Operating income (loss) . . . . . . . . . . . . . . . . . . . . . . . . . . . . . . . . . . (1.8) (0.0)% 21.6 0.4% (23.4) *Other income, net . . . . . . . . . . . . . . . . . . . . . . . . . . . . . . . . . . . . . . (2.2) (0.0)% (1.9) (0.0)% (0.3) 15.8%
Income (loss) from continuing operations before income taxes . . . . . . . . 0.4 0.0% 23.5 0.4% (23.1) (98.3)%Income tax (benefit) expense . . . . . . . . . . . . . . . . . . . . . . . . . . . . . . . 0.4 0.0% 9.1 0.2% (8.7) (95.6)%
Income (loss) from continuing operations . . . . . . . . . . . . . . . . . . . . . . (0.0) (0.0)% 14.4 0.2% (14.4) (100.0)%Income (loss) from discontinued operations, net of income taxes . . . . . . . 0.2 0.0% (10.0) (0.2)% 10.2 *
Net income (loss) . . . . . . . . . . . . . . . . . . . . . . . . . . . . . . . . . . . . . . . $ 0.2 0.0% $ 4.4 0.1% (4.2) (95.5)%
*—not meaningful
Net Sales
Net sales decreased due primarily to lower net sales of $251.6 million and $99.6 million in our Print and Facility Solutionssegments, respectively, which are further discussed in the section ‘‘Segment Results’’ below.
Cost of Products Sold
Cost of products sold decreased in line with the net sales decrease.
Distribution Expenses
Distribution expenses decreased due primarily to (i) a $4.0 million decrease in salaries, wages and employee benefits as a resultof a management initiative to restructure the organization to reduce headcount, (ii) a $3.9 million decrease in temporary labor costsattributable to the decline in net sales, (iii) a $1.2 million decrease in freight and fuel costs primarily attributable to the decrease innet sales and (iv) a $0.6 million decrease in repairs and maintenance costs. As a percentage of net sales, distribution expensesincreased due primarily to sales volumes declining more rapidly than costs.
Selling and Administrative Expenses
Selling and administrative expenses decreased due primarily to (i) a $14.7 million decline in incentive compensation, (ii) a$7.4 million decline in commissions associated with the decreased volume, (iii) a $4.3 million decrease in overhead allocations fromInternational Paper, (iv) a $3.1 million decrease in travel and entertainment expenses and (v) a $2.7 million decrease in salaries,wages and benefits as a result of a management initiative to restructure the organization. As a percentage of net sales, selling andadministrative expenses remained consistent for the years ended December 31, 2013 and 2012.
Depreciation and Amortization Expenses
Depreciation and amortization expenses increased due primarily to investment in e-commerce and supply chain managementsystems.
Restructuring Charges
Restructuring charges for the years ended December 31, 2013 and 2012 related to xpedx’s multi-year restructuring plan to(i) optimize the warehouse network, (ii) improve the efficiency of the sales team and (iii) reorganize the procurement function.During 2013 and 2012, six and 118 locations were closed, respectively, related to this plan. As a result of these closures, xpedxincurred restructuring charges for severance and other termination benefits, facility closure costs, gains on sales of fixed assets
31

and other direct costs. See Note 3 of the Notes to the Consolidated and Combined Financial Statements for the breakout of thesecosts and additional details.
Effective Tax Rate
Veritiv’s effective tax rate was 100.0% and 38.7% for the years ended December 31, 2013 and 2012, respectively. The differencebetween the Company’s effective tax rate for the year ended December 31, 2013 and the U.S. statutory tax rate of 35% is principallyrelated to the meals and entertainment disallowance. See Note 7 of the Notes to the Consolidated and Combined FinancialStatements for additional details.
Segment Results
As discussed above, during 2014, the Company realigned and expanded its reportable segments to include a new Publishingsegment. This new segment structure is consistent with the way the Chief Operating Decision Maker (‘‘CODM’’), identified as theChief Executive Officer, manages and evaluates the business. In addition, as a result of the change in how the CODM manages andevaluates the business, certain costs such as executive costs, corporate affairs, finance, human resources, IT and legal that werepreviously allocated to the reportable segments are no longer allocated. The Company’s consolidated financial results now include a‘‘Corporate & Other’’ category which includes certain assets and costs not primarily attributable to any of the reportable segments.Corporate & Other also includes the Veritiv Logistics Solutions business unit which provides transportation and warehousingsolutions. As a result of these changes in segment reporting, all historical financial information has been revised to conform to thenew presentation, with no resulting impact on the consolidated and combined results of operations.
Due to the shared nature of the distribution network, distribution charges are not a direct charge to each segment, but areallocated to each segment based primarily on operational metrics that correlate with changes in volume. Accordingly, distributionexpenses allocated to each segment are highly interdependent on the results of other segments. Lower volume in any segment that isnot offset by a reduction in distribution expenses can result in the other segments absorbing a larger share of distribution expenses.Conversely, higher volume in any segment can result in the other segments absorbing a smaller share of distribution expenses. Theimpact of this at the segment level is that the changes in distribution expense trends may not correspond with volume trends within aparticular segment.
In conjunction with the change in reportable segments, management re-evaluated its use of key performance metrics.Historically, xpedx used operating profit, excluding certain charges, as its measure of operating performance of segment results.Based on the recent evaluation, Veritiv has concluded that Adjusted EBITDA is the primary metric management uses to assessoperating performance. Therefore, the current and prior period segment presentations reflect Adjusted EBITDA as the operatingperformance measure.
The Company believes that the decline in paper and related products is due to the widespread use of electronic media andpermanent product substitution, more e-commerce, less print advertising, fewer catalogs and a reduced volume of direct mail, andother factors. This trend is expected to continue and will place continued pressure on the Company’s revenues and profit marginsand make it more difficult to maintain or grow Adjusted EBITDA within the Print and Publishing segments.
Included in the following table are net sales and Adjusted EBITDA for each of the reportable segments reconciled to thecombined totals:
Facility Corporate &Print Publishing Packaging Solutions Other Total(in millions)
Year Ended December 31, 2014Net sales . . . . . . . . . . . . . . . . . . . . . . . . . . . . . . . . . . . . $2,956.1 $1,075.5 $2,259.4 $1,070.3 $ 45.2 $7,406.5Adjusted EBITDA . . . . . . . . . . . . . . . . . . . . . . . . . . . . . $ 55.4 $ 27.1 $ 157.0 $ 33.6 $(151.1) $ 122.0Adjusted EBITDA as a % of net sales . . . . . . . . . . . . . . . . 1.9% 2.5% 6.9% 3.1% — 1.6%
Year Ended December 31, 2013Net sales . . . . . . . . . . . . . . . . . . . . . . . . . . . . . . . . . . . . $2,399.6 $ 807.9 $1,600.3 $ 844.6 $ — $5,652.4Adjusted EBITDA . . . . . . . . . . . . . . . . . . . . . . . . . . . . . $ 43.9 $ 16.4 $ 117.9 $ 14.4 $(118.4) $ 74.2Adjusted EBITDA as a % of net sales . . . . . . . . . . . . . . . . 1.8% 2.0% 7.4% 1.7% — 1.3%
Year Ended December 31, 2012Net sales . . . . . . . . . . . . . . . . . . . . . . . . . . . . . . . . . . . . $2,651.2 $ 822.7 $1,593.9 $ 944.2 $ — $6,012.0Adjusted EBITDA . . . . . . . . . . . . . . . . . . . . . . . . . . . . . $ 53.0 $ 13.8 $ 123.6 $ 19.2 $(120.1) $ 89.5Adjusted EBITDA as a % of net sales . . . . . . . . . . . . . . . . 2.0% 1.7% 7.8% 2.0% — 1.5%
32

The table below presents selected data with respect to the Print segment:
2014 vs. 2013 2013 vs. 2012Year Ended December 31, Increase Increase
2014 2013 2012 (Decrease) % (Decrease) %(in millions)Net sales . . . . . . . . . . . . . . . . . . . . . . . . . . . . . . . . . . . . . . . . . . $2,956.1 $2,399.6 $2,651.2 23.2% (9.5)%Adjusted EBITDA . . . . . . . . . . . . . . . . . . . . . . . . . . . . . . . . . . . . $ 55.4 $ 43.9 $ 53.0 26.2% (17.2)%Adjusted EBITDA as a % of net sales . . . . . . . . . . . . . . . . . . . . . . 1.9% 1.8% 2.0%
The table below presents the components of the net sales change compared to the prior year:
Increase (Decrease) %
2014 vs. 2013 2013 vs. 2012
Volume . . . . . . . . . . . . . . . . . . . . . . . . . . . . . . . . . . . . . . . . . . . . . . . . . . . . . (7.0)% (9.5)%Price/Mix . . . . . . . . . . . . . . . . . . . . . . . . . . . . . . . . . . . . . . . . . . . . . . . . . . . . (0.4)% —%Merger . . . . . . . . . . . . . . . . . . . . . . . . . . . . . . . . . . . . . . . . . . . . . . . . . . . . . . 30.6% —%
23.2% (9.5)%
Comparison of the Years Ended December 31, 2014 and December 31, 2013
Net sales increased due primarily to the net sales contribution of $733.5 million from the Merger. This increase was partiallyoffset by a 7.4% decrease in the net sales of legacy xpedx operations which was primarily attributable to declining volumes at existingcustomers.
Adjusted EBITDA increased by $9.2 million as a result of the Merger. The legacy xpedx Adjusted EBITDA increased by$2.2 million driven by (i) a $13.5 million decline in distribution expenses due to lower sales volume, (ii) an $8.1 million decline inpersonnel costs driven by a reduction in headcount, (iii) a $6.0 million decrease in sales training programs and project spend, (iv) a$2.7 million decline in commissions and (v) a $1.8 million decline in miscellaneous other expenses. These declines in expenses arepartially offset by (i) a $24.0 million reduction in Adjusted EBITDA driven by a decline in volume and (ii) a $5.9 million decreasedue to changes in pricing and mix.
Comparison of the Years Ended December 31, 2013 and December 31, 2012
Net sales decreased due to lower volumes driven by (i) $70.2 million in customer losses and (ii) a decrease of $29.3 million as aresult of xpedx altering its go-to-market approach for walk-in customers through the closing of certain retail stores. The remainingdecline is due to loss in volumes at existing customers driven by the continued decline in the overall paper market.
The decrease in Adjusted EBITDA was driven primarily by an overall decrease in sales which reduced Adjusted EBITDA by$34.9 million, partially offset by a $25.8 million reduction in expenses. Expenses declined due to (i) a $13.5 million decline in sellingand general administrative expenses, benefits and incentive compensation, (ii) a $9.4 million decline in distribution expenses that wasdriven by declines in sales volume, (iii) a $2.6 million decline in commissions and (iv) a $0.3 million decline in miscellaneous otherexpenses.
Publishing
The table below presents selected data with respect to the Publishing segment:
2014 vs. 2013 2013 vs. 2012Year Ended December 31, Increase Increase2014 2013 2012 (Decrease) % (Decrease) %(in millions)
Net sales . . . . . . . . . . . . . . . . . . . . . . . . . . . . . . . . . . . . . . . . . . . . . $1,075.5 $807.9 $822.7 33.1% (1.8)%Adjusted EBITDA . . . . . . . . . . . . . . . . . . . . . . . . . . . . . . . . . . . . . . $ 27.1 $ 16.4 $ 13.8 65.2% 18.8%Adjusted EBITDA as a % of net sales . . . . . . . . . . . . . . . . . . . . . . . . . 2.5% 2.0% 1.7%
33

The table below presents the components of the net sales change compared to the prior year:
Increase (Decrease) %
2014 vs. 2013 2013 vs. 2012
Volume . . . . . . . . . . . . . . . . . . . . . . . . . . . . . . . . . . . . . . . . . . . . . . . . . . . . . (6.3)% 2.9%Price/Mix . . . . . . . . . . . . . . . . . . . . . . . . . . . . . . . . . . . . . . . . . . . . . . . . . . . . (0.9)% (4.7)%Merger . . . . . . . . . . . . . . . . . . . . . . . . . . . . . . . . . . . . . . . . . . . . . . . . . . . . . . 40.3% —%
33.1% (1.8)%
Comparison of the Years Ended December 31, 2014 and December 31, 2013
Net sales increased due primarily to the net sales contribution of $325.9 million from the Merger. This increase was partiallyoffset by a 7.2% decrease in the net sales of legacy xpedx operations, due primarily to a 6.3% decline in volume driven by (i) the lossof three large customers which comprised 2.8% of the decline in sales and (ii) a continued decrease in volume at existing customersdue to both structural demand decline and market price decreases for the products we sell.
Adjusted EBITDA increased by $10.8 million as a result of the Merger. The change in legacy xpedx Adjusted EBITDA duringthis period was minimal.
Comparison of the Years Ended December 31, 2013 and December 31, 2012
The net sales decrease is in line with a 1.6% print market decline. Volume increased due to increased share with customers inthe book, retail insert and specialty segments. The price/mix decline was driven by deterioration in the coated free sheet and coatedground wood segments.
The increase in Adjusted EBITDA was driven by a $1.7 million decline in incentive compensation and a $1.3 million decline inwages and benefits as a result of a reduction in headcount which was partially offset by a $0.4 million increase in various otherexpenses.
Packaging
The table below presents selected data with respect to the Packaging segment:
2014 vs. 2013 2013 vs. 2012Year Ended December 31, Increase Increase
2014 2013 2012 (Decrease) % (Decrease) %(in millions)Net sales . . . . . . . . . . . . . . . . . . . . . . . . . . . . . . . . . . . . . . . . . . $2,259.4 $1,600.3 $1,593.9 41.2% 0.4%Adjusted EBITDA . . . . . . . . . . . . . . . . . . . . . . . . . . . . . . . . . . . . $ 157.0 $ 117.9 $ 123.6 33.2% (4.6)%Adjusted EBITDA as a % of net sales . . . . . . . . . . . . . . . . . . . . . . 6.9% 7.4% 7.8%
The table below presents the components of the net sales change compared to the prior year:
Increase (Decrease) %
2014 vs. 2013 2013 vs. 2012
Volume . . . . . . . . . . . . . . . . . . . . . . . . . . . . . . . . . . . . . . . . . . . . . . . . . . . . . 4.2% 0.9%Price/Mix . . . . . . . . . . . . . . . . . . . . . . . . . . . . . . . . . . . . . . . . . . . . . . . . . . . . (1.3)% (0.5)%Merger . . . . . . . . . . . . . . . . . . . . . . . . . . . . . . . . . . . . . . . . . . . . . . . . . . . . . . 38.3% —%
41.2% 0.4%
Comparison of the Years Ended December 31, 2014 and December 31, 2013
Net sales increased due primarily to the net sales contribution of $613.1 million from the Merger, along with a 2.9% increase innet sales of the legacy xpedx operations. This increase was due primarily to a 4.2% increase in sales volume driven by higher sales atexisting customers. This was partially offset by a 1.3% unfavorable price mix variance driven primarily by growth in new business atlower margins.
34

Adjusted EBITDA increased by $50.2 million as a result of the Merger. The legacy xpedx Adjusted EBITDA declined by$11.1 million as a result of (i) an $8.7 million increase in distribution expenses driven by an increase in sales volume and (ii) a$2.2 million decrease due primarily to lower pricing, and (iii) a $4.6 million increase in personnel expense. These cost increases wereoffset by a $4.4 million decline in various other expenses.
Comparison of the Years Ended December 31, 2013 and December 31, 2012
The increase in net sales was due primarily to increased sales volume to existing customers.
The decrease in Adjusted EBITDA is due to (i) cost of sales rising faster than net sales which reduced Adjusted EBITDA by$4.7 million and (ii) an increase in distribution expenses of $4.4 million driven by the increase in packaging revenues as well asreductions in revenues in other segments which had the overall effect of increasing this segment’s share of distribution expenses.These negative variances were partially offset by a $3.0 million reduction in commissions and a $0.4 million decline in various otherexpenses.
Facility Solutions
The table below presents selected data with respect to the Facility Solutions segment.
2014 vs. 2013 2013 vs. 2012Year Ended December 31, Increase Increase2014 2013 2012 (Decrease) % (Decrease) %(in millions)
Net sales . . . . . . . . . . . . . . . . . . . . . . . . . . . . . . . . $1,070.3 $844.6 $944.2 26.7% (10.5)%Adjusted EBITDA . . . . . . . . . . . . . . . . . . . . . . . . . . $ 33.6 $ 14.4 $ 19.2 133.3% (25.0)%Adjusted EBITDA as a % of net sales . . . . . . . . . . . . 3.1% 1.7% 2.0%
The table below presents the components of the net sales change compared to the prior year:
Increase (Decrease) %
2014 vs. 2013 2013 vs. 2012
Volume . . . . . . . . . . . . . . . . . . . . . . . . . . . . . . . . . . . . . . . . . . . . . . . . . . . . . (12.7)% (10.6)%Price/Mix . . . . . . . . . . . . . . . . . . . . . . . . . . . . . . . . . . . . . . . . . . . . . . . . . . . . 1.2% 0.1%Merger . . . . . . . . . . . . . . . . . . . . . . . . . . . . . . . . . . . . . . . . . . . . . . . . . . . . . . 38.2% —%
26.7% (10.5)%
Comparison of the Years Ended December 31, 2014 and December 31, 2013
Net sales increased due primarily to the net sales contribution of $322.8 million from the Merger. This increase was offset by an11.5% decline in legacy xpedx net sales. The decline in legacy xpedx sales is primarily driven by customer attrition with fivecustomers comprising 8.4% of the decline.
Adjusted EBITDA increased by $16.1 million as a result of the Merger. The legacy xpedx Adjusted EBITDA increased by$3.1 million driven primarily by (i) a $10.8 million reduction in distribution expenses due to a reduction in sales volume, (ii) a$12.6 million impact from cost of products sold declining faster than net sales and (iii) a $1.4 million decline in selling andadministrative costs primarily due to less sales commissions resulting from the decline in sales. These improvements were partiallyoffset by a $21.7 million reduction in Adjusted EBITDA driven primarily by the decline in net sales volume.
Comparison of the Years Ended December 31, 2013 and December 31, 2012
The decrease in sales volume is due primarily to (i) $31.8 million in customer losses, (ii) management’s decision to reposition itsdistribution network, which reduced net sales by $8.2 million and (iii) volume declines at existing customers.
The decrease in Adjusted EBITDA is due primarily to the decrease in net sales which reduced Adjusted EBITDA by$19.2 million, partially offset by (i) a $6.0 million decline in selling and administrative wages, benefits and incentive compensation,(ii) a $3.1 million decrease in distribution expenses driven by the decline in sales volumes, (iii) a $2.5 million decrease in commissioncosts, (iv) a $1.0 million decrease in travel and entertainment expenses, (v) a $1.0 million decline in bad debt expense and (vi) a$0.8 million decline in various other expenses.
35

Corporate & Other
Comparison of the Years Ended December 31, 2014 and December 31, 2013
Adjusted EBITDA decreased by $50.5 million as a result of the Merger. The legacy xpedx Adjusted EBITDA improved by$17.9 million, driven by a $29.8 million reduction in allocated expenses from International Paper, that was offset by (i) a$10.3 million increase in personnel costs and (ii) a $1.6 million increase in various other expenses.
Comparison of the Years Ended December 31, 2013 and December 31, 2012
Adjusted EBITDA improved from a loss of $120.1 million to a loss of $118.4 million due primarily to a $3.9 million decrease inoverhead allocations from International Paper, partially offset by a $2.2 million increase in IT services.
Liquidity and Capital Resources
The cash requirements of the Company are provided by cash flows from operations and borrowings under the ABL Facility. Thefollowing table sets forth a summary of cash flows:
Year Ended December 31,
2014 2013 2012(in millions)Net cash provided by (used for):
Operating activities . . . . . . . . . . . . . . . . . . . . . . . . . . . . . . . . . . . . . . . . . . . . . . $ 5.0 $ 52.2 $ 56.0Investing activities . . . . . . . . . . . . . . . . . . . . . . . . . . . . . . . . . . . . . . . . . . . . . . . 19.9 13.2 (7.5)Financing activities . . . . . . . . . . . . . . . . . . . . . . . . . . . . . . . . . . . . . . . . . . . . . . . 23.0 (76.6) (46.3)
Operating Activities
2014 Compared with 2013: Net cash provided by operating activities decreased by $47.2 million compared to last year. Cashprovided by operating activities in 2014 was negatively impacted by approximately $58.4 million of cash outflows for merger andintegration expenses.
2013 Compared with 2012: Net cash provided by operating activities decreased by $3.8 million due primarily to $13.2 million oflower income from continuing operations, adjusted to exclude non-cash items and deferred income taxes, partially offset by (i) a$7.6 million increase in cash generated by working capital and (ii) a $1.8 million decrease in cash used by discontinued operations foroperating activities.
Investing Activities
2014 Compared with 2013: Net cash provided by investing activities increased by $6.7 million due primarily to the net cashacquired from the Merger. This increase was partially offset by higher capital expenditures and lower proceeds from sales of assets ascompared to last year.
2013 Compared with 2012: Net cash provided by investing activities increased by $20.7 million due primarily to incrementalproceeds from the sale of certain assets as compared to 2012, along with lower capital expenditures.
Financing Activities
2014 Compared with 2013: Net cash provided by financing activities was $23.0 million compared to net cash used for financingactivities of $76.6 million for the prior year period. The current year activity includes net proceeds from the new ABL Facility, asdescribed below, partially offset by $493.1 million of net cash transfers to Parent and $22.4 million of deferred financing feepayments related to the new ABL Facility.
2013 Compared with 2012: Cash used in financing activities for the years ended December 31, 2013 and 2012 primarilyrepresents transactions between xpedx and International Paper. These transactions were considered to be effectively settled for cashat the time the transaction was recorded. The components of these transactions (or transfers) include (i) cash transfers from xpedx toInternational Paper, (ii) cash transfers from International Paper to fund xpedx’s requirements for working capital and othercommitments and (iii) an allocation of International Paper’s corporate expenses.
36

Funding and Liquidity Strategy
The Spin-off and Merger transactions resulted in a new capital structure and additional sources of liquidity for Veritiv whencompared to the historical capital structures of both xpedx and Unisource. In conjunction with the Spin-off and Merger, and torefinance existing debt of Unisource, Veritiv entered into a commitment with a group of lenders for a $1.4 billion asset-based lendingfacility (the ‘‘ABL Facility’’). The ABL Facility is comprised of U.S. and Canadian sub-facilities of $1,250.0 million and $150.0 million,respectively. The ABL Facility is available to be drawn in U.S. dollars, in the case of the U.S. sub-facilities, and in U.S. dollars orCanadian dollars, in the case of the Canadian sub-facilities, or in other currencies that are mutually agreeable. The Company’saccounts receivable and inventories in the U.S. and Canada are collateral under the ABL Facility.
The ABL Facility will mature and the commitments thereunder will terminate after July 1, 2019, however, it provides for theright of the individual lenders to extend the maturity date of their respective commitments and loans upon the request of Veritiv andwithout the consent of any other lenders. The ABL Facility may be prepaid at Veritiv’s option at any time without premium orpenalty and is subject to mandatory prepayment if the amount outstanding under the ABL Facility exceeds either the aggregatecommitments with respect thereto or the current borrowing base, in an amount equal to such excess.
The ABL Facility has a springing minimum fixed charge coverage ratio of at least 1.00 to 1.00 on a trailing four-quarter basis,which will be tested only when specified availability is less than limits outlined under the ABL Facility. At December 31, 2014, theabove test was not applicable.
Availability under the ABL Facility is determined based upon a monthly borrowing base calculation which includes eligiblecustomer receivables and inventory, less outstanding borrowings, letters of credit and certain designated reserves. As of December 31,2014, the available additional borrowing capacity under the ABL Facility was approximately $392.0 million.
Under the terms of the ABL Facility, interest rates are based upon LIBOR or the prime rate plus a margin rate, or in the caseof Canada, a banker’s acceptance rate or base rate plus a margin rate. At December 31, 2014, the weighted-average borrowinginterest rate was 2.0%.
Veritiv’s ability to fund its capital needs will depend on its ongoing ability to generate cash from operations and borrowingsunder the ABL Facility. If Veritiv’s cash flows from operating activities are lower than expected, the Company will need to borrowunder the ABL Facility and may need to incur additional debt or issue additional equity. Although management believes that thearrangements currently in place will permit Veritiv to finance its operations on acceptable terms and conditions, the Company’saccess to, and the availability of, financing on acceptable terms and conditions in the future will be impacted by many factors,including (i) the liquidity of the overall capital markets and (ii) the current state of the economy.
Veritiv’s management expects that the Company’s primary future cash needs will be for working capital, capital expenditures,contractual commitments and strategic investments. Additionally, management expects that cash provided by operating activities andavailable capacity under the ABL Facility will provide sufficient funds to operate the business and meet other liquidity needs.
The Company currently expects costs associated with achieving anticipated cost savings and other synergies from the Spin-offand Merger to be approximately $225.0 million over a five-year period from the Distribution Date, including approximately$55.0 million for capital expenditures, primarily consisting of information technology infrastructure, systems integration and planning.
Off-Balance Sheet Arrangements
Veritiv does not have any off-balance sheet arrangements as of December 31, 2014, other than the operating lease obligationsaddressed below under Contractual Obligations and the letters of credit under the ABL Facility as discussed above. The Companydoes not have any off-balance sheet arrangements that have or are reasonably likely to have a material current or future effect on itsfinancial condition, revenues or expenses, results of operations, liquidity, capital expenditures or capital resources.
37
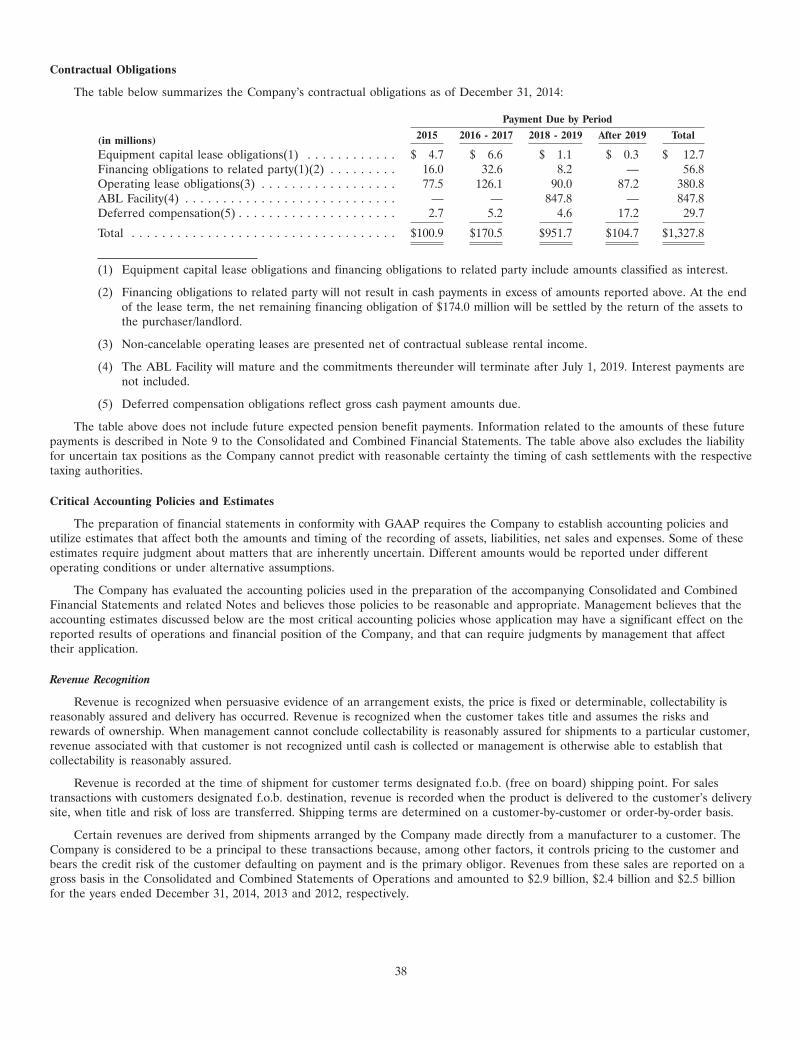
Contractual Obligations
The table below summarizes the Company’s contractual obligations as of December 31, 2014:
Payment Due by Period
2015 2016 - 2017 2018 - 2019 After 2019 Total(in millions)Equipment capital lease obligations(1) . . . . . . . . . . . . $ 4.7 $ 6.6 $ 1.1 $ 0.3 $ 12.7Financing obligations to related party(1)(2) . . . . . . . . . 16.0 32.6 8.2 — 56.8Operating lease obligations(3) . . . . . . . . . . . . . . . . . . 77.5 126.1 90.0 87.2 380.8ABL Facility(4) . . . . . . . . . . . . . . . . . . . . . . . . . . . . — — 847.8 — 847.8Deferred compensation(5) . . . . . . . . . . . . . . . . . . . . . 2.7 5.2 4.6 17.2 29.7
Total . . . . . . . . . . . . . . . . . . . . . . . . . . . . . . . . . . . $100.9 $170.5 $951.7 $104.7 $1,327.8
(1) Equipment capital lease obligations and financing obligations to related party include amounts classified as interest.
(2) Financing obligations to related party will not result in cash payments in excess of amounts reported above. At the endof the lease term, the net remaining financing obligation of $174.0 million will be settled by the return of the assets tothe purchaser/landlord.
(3) Non-cancelable operating leases are presented net of contractual sublease rental income.
(4) The ABL Facility will mature and the commitments thereunder will terminate after July 1, 2019. Interest payments arenot included.
(5) Deferred compensation obligations reflect gross cash payment amounts due.
The table above does not include future expected pension benefit payments. Information related to the amounts of these futurepayments is described in Note 9 to the Consolidated and Combined Financial Statements. The table above also excludes the liabilityfor uncertain tax positions as the Company cannot predict with reasonable certainty the timing of cash settlements with the respectivetaxing authorities.
Critical Accounting Policies and Estimates
The preparation of financial statements in conformity with GAAP requires the Company to establish accounting policies andutilize estimates that affect both the amounts and timing of the recording of assets, liabilities, net sales and expenses. Some of theseestimates require judgment about matters that are inherently uncertain. Different amounts would be reported under differentoperating conditions or under alternative assumptions.
The Company has evaluated the accounting policies used in the preparation of the accompanying Consolidated and CombinedFinancial Statements and related Notes and believes those policies to be reasonable and appropriate. Management believes that theaccounting estimates discussed below are the most critical accounting policies whose application may have a significant effect on thereported results of operations and financial position of the Company, and that can require judgments by management that affecttheir application.
Revenue Recognition
Revenue is recognized when persuasive evidence of an arrangement exists, the price is fixed or determinable, collectability isreasonably assured and delivery has occurred. Revenue is recognized when the customer takes title and assumes the risks andrewards of ownership. When management cannot conclude collectability is reasonably assured for shipments to a particular customer,revenue associated with that customer is not recognized until cash is collected or management is otherwise able to establish thatcollectability is reasonably assured.
Revenue is recorded at the time of shipment for customer terms designated f.o.b. (free on board) shipping point. For salestransactions with customers designated f.o.b. destination, revenue is recorded when the product is delivered to the customer’s deliverysite, when title and risk of loss are transferred. Shipping terms are determined on a customer-by-customer or order-by-order basis.
Certain revenues are derived from shipments arranged by the Company made directly from a manufacturer to a customer. TheCompany is considered to be a principal to these transactions because, among other factors, it controls pricing to the customer andbears the credit risk of the customer defaulting on payment and is the primary obligor. Revenues from these sales are reported on agross basis in the Consolidated and Combined Statements of Operations and amounted to $2.9 billion, $2.4 billion and $2.5 billionfor the years ended December 31, 2014, 2013 and 2012, respectively.
38

Merger and Integration Expenses
The Company’s Consolidated and Combined Statements of Operations includes a line item titled, ‘‘Merger and IntegrationExpenses’’. Merger and Integration Expenses is not a defined term in GAAP, thus management must use judgment in determiningwhether a particular expense should be classified as a merger and integration expense. Management believes its accounting policy formerger and integration expenses is critical because these costs are expected to be significant over the next few years, will generallyinvolve cash expenditures, are not defined in GAAP, are excluded in determining compliance with the Company’s ABL credit facility,and are excluded in determining management compensation.
Under Veritiv’s accounting policy for merger and integration expenses, merger expenses include advisory, legal and otherprofessional fees directly associated with the Merger. Integration expenses include professional services and project management fees,retention compensation, termination benefits (including change-in-control bonuses), rebranding and other redundant costs tointegrate the combined businesses of xpedx and Unisource. See Note 2 of the Notes to Consolidated and Combined FinancialStatements for a breakdown of the major components of these expenses.
Allowance for Doubtful Accounts
The allowance for doubtful accounts reflects the best estimate of losses inherent in the Company’s accounts receivable portfoliodetermined on the basis of historical experience, specific allowances for known troubled accounts and other available evidence. Theallowances contain uncertainties because the calculation requires management to make assumptions and apply judgment regardingthe customer’s credit worthiness. We perform ongoing evaluations of our customers’ financial condition and adjust credit limits basedupon payment history and the customer’s current credit worthiness, as determined by our review of their current financialinformation. We continuously monitor collections from our customers and maintain a provision for estimated credit losses basedupon our customers’ financial condition, our collection experience and any other relevant customer specific information. Ourassessment of this and other information forms the basis of our allowances.
If the financial condition of our customers deteriorates, resulting in an inability to make required payments to us, or if economicconditions deteriorate, additional allowances may be deemed appropriate or required. If the allowance for doubtful accounts changedby 0.1% of gross billed receivables, reflecting either an increase or decrease in expected future write-offs, the impact to consolidatedpre-tax income would have been approximately $1.2 million.
Purchase Incentives and Customer Rebates
Veritiv receives purchase incentives from its suppliers through volume-based and cost-supported arrangements. Volume-basedagreements are based on purchases made from suppliers and may require the attainment of specific thresholds before rebates areearned. Volume-based purchase incentives are typically earned over a monthly, quarterly or annual period, and some agreements maybe retroactive to the first purchase of the period. Under cost-supported arrangements, Veritiv earns purchase incentives fromsuppliers based on achieving certain sales thresholds with specific customers. In these arrangements, suppliers provide rebates toVeritiv to lower the overall cost of the product sold to customers. Cost-supported rebates are typically paid to Veritiv on a weekly ormonthly basis as Veritiv provides documentation to suppliers of sales to specified customers. Other current assets in the Consolidatedand Combined Balance Sheets included $58.1 million and $18.4 million as of December 31, 2014 and 2013, respectively, ofanticipated amounts of volume-based and cost-supported rebates not yet received. Purchase incentives are recorded as a reduction ininventory and recognized in cost of products sold as the product is sold.
Veritiv also enters into volume-based incentive agreements with its customers, which are generally based on customers attainingspecific purchasing levels from Veritiv. Incentive rebates are calculated on a given customer’s purchases relative to a volumethreshold over a monthly, quarterly or annual period. Customer rebates can include all products purchased, or may be limited topurchases of specific products. Veritiv records estimated rebates to customers as a reduction to gross sales as customer revenue isrecognized. Other accrued liabilities in the Consolidated and Combined Balance Sheets included $24.1 million and $12.8 million as ofDecember 31, 2014 and 2013, respectively, of anticipated amounts not yet paid.
Inventories
We record inventory at the lower of LIFO cost or market value. We reduce the value of obsolete and inactive inventory basedon the difference between the LIFO cost of the inventory and the estimated market value using assumptions of future demand andmarket conditions. To estimate the net realizable value, we consider factors such as age of the inventory, the
39

nature of the products, the quantity of items on-hand relative to sales trends, current market prices and trends in pricing, our abilityto use excess supply in another channel, historical write-offs and expected residual values or other recoveries. If actual demand ormarket conditions are less favorable than those projected by management or if the integration of the legacy businesses results in theidentification of additional inventory to be disposed of for less than cost, additional charges may be required.
Impairment or Disposal of Long-Lived Assets and Goodwill
The Company completed the Merger in July 2014. The process of integrating the two companies has begun, but will continue forsome time. The Company used various valuation methodologies to estimate the fair value of assets acquired and liabilities assumed,including using a market participant perspective when applying cost, income and relief from royalty analyses, supplemented withmarket appraisals where appropriate. Pension and other benefits plans were revalued using current estimates of interest and earningsrates, as well as cost trends. Significant judgments and estimates were required in preparing these fair value estimates.
Intangible assets acquired in the Merger are naturally more susceptible to impairment, primarily due to the fact that they arerecorded at fair value based on recent operating plans and macroeconomic conditions present at the time of acquisition.Consequently, if operating results and/or macroeconomic conditions deteriorate shortly after an acquisition, it could result in theimpairment of the acquired assets. A deterioration of macroeconomic conditions may not only negatively impact the estimatedoperating cash flows used in our cash flow models, but may also negatively impact other assumptions used in our analyses, including,but not limited to, the estimated cost of capital and/or discount rates. Additionally, we are required to ensure that assumptions usedto determine fair value in our analyses are consistent with the assumptions a marketplace participant would use. As a result, the costof capital and/or discount rates used in our analyses may increase or decrease based on market conditions and trends, regardless ofwhether our Company’s actual cost of capital has changed. Therefore, if the cost of capital and/or discount rates change, ourCompany may recognize an impairment of an intangible asset in spite of realizing actual cash flows that are approximately equal to,or greater than, our previously forecasted amounts.
An impairment of a long-lived asset exists when the asset’s carrying amount exceeds its expected future undiscounted cash flowsand is recorded at its estimated fair value. Goodwill impairment exists when the carrying amount of goodwill exceeds its fair value.Assessments of possible impairments of long-lived assets and goodwill are made in the fourth quarter, and when events or changes incircumstances indicate that the carrying value of the asset may not be recoverable through future operations. Additionally, testing forpossible impairment of goodwill and indefinite-lived intangible asset balances is required annually. The Company currently does nothave any indefinite-lived intangible assets.
The amount and timing of any impairment charges based on these assessments require the estimation of future cash flows andthe fair market value of the related assets based on management’s best estimates of certain key factors. These key factors includefuture selling prices and volumes, operating, inventory, energy and freight costs and various other projected operating economicfactors. As these key factors change in future periods, the Company will update its impairment analyses to reflect the latest estimatesand projections.
The testing of goodwill for possible impairment is a two-step process. In the first step, the fair value of the reporting unit iscompared with its carrying value, including goodwill. If fair value exceeds the carrying value, goodwill is not considered to beimpaired. If the fair value of a reporting unit is below the carrying value, then step two is performed to measure the amount of thegoodwill impairment loss for the reporting unit. This analysis requires the determination of the fair value of all of the individualassets and liabilities of the reporting unit, including any currently unrecognized intangible assets, as if the reporting unit had beenpurchased on the analysis date. Once these fair values have been determined, the implied fair value of the unit’s goodwill iscalculated as the excess, if any, of the fair value of the reporting unit determined in step one over the fair value of the net assetsdetermined in step two. The carrying value of goodwill is then reduced to this implied value, or to zero if the fair value of the assetsexceeds the fair value of the reporting unit, through a goodwill impairment charge.
The impairment analysis requires a number of judgments by management. In calculating the estimated fair value of its reportingunits in step one, Veritiv uses the projected future cash flows to be generated by each unit over the estimated remaining usefuloperating lives of the unit’s assets, discounted using the estimated cost-of-capital discount rate for each reporting unit. Thesecalculations require many estimates, including discount rates, future growth rates and cost and pricing trends for each reporting unit.Subsequent changes in economic and operating conditions can affect these assumptions and could result in additional interim testingand goodwill impairment charges in future periods. Upon completion, the resulting
40

estimated fair values are then analyzed for reasonableness by comparing them to earnings multiples for historic industry businesstransactions and by comparing the sum of the reporting unit fair values to the fair value of the Company as a whole.
No long-lived asset or goodwill impairment charges were recorded during the years ended December 31, 2014, 2013 and 2012.
Employee Benefit Plans
In conjunction with the Merger, Veritiv assumed responsibility for Unisource’s defined benefit plans and Supplemental ExecutiveRetirement Plans (‘‘SERP’’) in the U.S. and Canada. These plans were frozen prior to the Merger. See Note 9 of the Notes toConsolidated and Combined Financial Statements for more information about these plans.
Management is required to make certain critical estimates related to actuarial assumptions used to determine our pensionexpense and related obligation. We believe the most critical assumptions are related to (i) the discount rate used to determine thepresent value of the liabilities and (ii) the expected long-term rate of return on plan assets. All of our actuarial assumptions arereviewed annually. Changes in these assumptions could have a material impact on the measurement of our pension expense andrelated obligation.
At each measurement date, we determine the discount rate by reference to rates of high-quality, long-term corporate bonds thatmature in a pattern similar to the future payments we anticipate making under the plans. As of December 31, 2014, the weighted-average discount rates used to compute our benefit obligations was 3.75% and 4.00% for the U.S. and Canadian plans, respectively.
The expected long-term rate of return on plan assets is based upon the long-term outlook of our investment strategy as well asour historical returns and volatilities for each asset class. We also review current levels of interest rates and inflation to assess thereasonableness of our long-term rates. Our pension plan investment objective is to ensure all of our plans have sufficient funds tomeet their benefit obligations when they become due. As a result, the Company periodically revises asset allocations, whereappropriate, to improve returns and manage risk. The weighted-average expected long-term rate of return used to calculate ourpension expense was 8.00% and 5.75% for the U.S. and Canadian plans, respectively.
The following illustrates the effects of a 1% change in the discount rate or return on plan assets on the 2014 net periodicpension cost and projected benefit obligation (in millions):
Net Periodic Projected BenefitAssumption Change Benefit Cost Obligation
Discount rate . . . . . . . . . . . . . . . . . . . . . . . . . . . . . . . . 1% increase $ 0.2 $(22.3)1% decrease (0.3) 28.1
Return on plan assets . . . . . . . . . . . . . . . . . . . . . . . . . . 1% increase (0.7) N/A1% decrease 0.7 N/A
Fair Value of Nonfinancial Assets and Liabilities
We define fair value as the price that would be received from the sale of an asset or paid to transfer a liability in the principalor most advantageous market for the asset or liability in an orderly transaction between market participants on the measurementdate.
We measure certain nonfinancial assets and nonfinancial liabilities at fair value on a nonrecurring basis. These assets andliabilities include assets acquired and liabilities assumed in an acquisition, and property and equipment and goodwill and otherintangible assets that are written down to fair value when they are held for sale or determined to be impaired. Given the nature ofnonfinancial assets and liabilities, evaluating their fair value from the perspective of a market participant is inherently complex.Assumptions and estimates about future values can be affected by a variety of internal and external factors. Changes in these factorsmay require us to revise our estimates and could result in future impairment charges for goodwill and acquired intangible assets, orretroactively adjust provisional amounts that we have recorded for the fair values of assets and liabilities in connection with businesscombinations. These adjustments could have a material impact on our financial condition and results of operations.
41

Income Taxes
Veritiv’s income tax expense, deferred tax assets and liabilities, and liabilities for unrecognized tax benefits reflect management’sbest assessment of estimated current and future taxes to be paid. Veritiv records its global tax provision based on the respective taxrules for the jurisdictions in which it operates. Where Veritiv believes that a tax position is supportable for income tax purposes, theitem is included in the appropriate income tax filings. Where treatment of a position is uncertain, liabilities are recorded based uponan evaluation of the more likely than not outcome considering technical merits of the position. Changes to recorded liabilities aremade only when an identifiable event occurs that alters the likely outcome, such as settlement with the relevant tax authority, theexpiration of statutes of limitation for the subject tax year, change in tax laws or a recent court case that addresses the matter.Significant judgments and estimates are required in determining the consolidated income tax expense.
Valuation allowances are recorded to reduce deferred tax assets when it is more likely than not that a tax benefit will not berealized. Significant judgment is required in evaluating the need for and amount of valuation allowances against deferred tax assets.The realization of these assets is dependent on generating sufficient future taxable income.
Veritiv’s most significant deferred tax asset is for net operating loss (‘‘NOL’’) carryforwards. The NOL carryforwards atDecember 31, 2014 available to offset future taxable income primarily consist of $312.5 million, $230.0 million and $34.4 million infederal, state and foreign (primarily Canada) NOL carryforwards, respectively. In order to fully utilize these NOL carryforwards,Veritiv must generate taxable income prior to the expiration of these carryforwards. The NOL carryforwards will expire at variousdates from 2015 to 2034, with the exception of certain foreign NOL carryforwards that do not expire but have a full valuationallowance.
The Merger resulted in a significant change in the ownership of Veritiv which, pursuant to the Internal Revenue CodeSection 382, limits Veritiv’s ability to utilize its U.S. federal and state NOL carryforwards on an annual basis. Veritiv’s NOLcarryforwards will continue to be available to offset taxable income (until such NOL carryforwards are either utilized or expire)subject to the Section 382 annual limitation and an increase for built-in gains recognized within a 60-month period following theownership change to the extent of total unrealized built-in gains. If the annual limitation amount is not fully utilized in a particulartax year, then the unused portion from that particular tax year will be added to the annual limitation in subsequent years.
As of December 31, 2014, Veritiv has a valuation allowance of $41.8 million established against its federal, state, and foreignNOL carryforwards and other foreign deferred tax assets. This valuation allowance has been established in part due to theSection 382 limitations resulting from the Merger and subsequent ownership change, and in part due to Veritiv’s expected inability toutilize the NOL carryforwards prior to their expiration.
In analyzing the future realization of Veritiv’s deferred tax assets, management evaluated all available positive and negativeevidence and determined that it was more likely than not that the remaining deferred tax assets will be realized. In this analysis,management has considered reversals of deferred tax liabilities, projected future taxable income, available tax-planning strategies, andresults of recent operations. In projecting future taxable income, management begins with historical results and incorporatesassumptions about the amount of future federal, state and foreign pre-tax operating income. The assumptions about future taxableincome require significant judgment and are consistent with Veritiv’s plans and estimates used to manage the underlying businesses.
While Veritiv does not have an earnings history prior to the Merger, both Unisource and xpedx generated income on a stand-alone basis in recent years, with the exception of certain legacy Unisource foreign entities. Veritiv has generated a loss in the currentyear. This loss is primarily attributable to the significant one-time expenses incurred relating to the Merger and subsequentintegration. As these expenses start to decrease, and as expected synergies are realized, Veritiv expects to return to profitability.Despite these losses, Veritiv is projecting sufficient income to support the utilization of the tax attributes and realization of thedeferred tax assets on a more likely than not basis. As a result of the historical stand-alone results and the forecast of future taxableincome, Veritiv believes the positive evidence significantly outweighs the negative evidence. Therefore, Veritiv currently believes thatit is more likely than not that the remaining net deferred tax assets will be realized.
Should Veritiv fail to generate income in the future for a sustained period, an additional valuation allowance may be required.Future changes in the valuation allowance, if required, should not affect Veritiv’s liquidity or compliance with any existing debtcovenants.
42

All legacy Unisource foreign jurisdictions have generated losses in recent years, leading to uncertainty about the ability togenerate income in the future. In evaluating both the positive and negative evidence, management has concluded that it is morelikely that not that Veritiv will be unable to realize the benefit of these foreign deferred tax assets. Furthermore, the Merger had noimpact on the filing positions of these jurisdictions. Approximately $15.7 million of the valuation allowance is against Veritiv’s foreignNOL carryforwards and other foreign deferred tax assets. In contrast, the legacy xpedx foreign jurisdictions have shown consistentand cumulative income. As such, no valuation allowance has been recorded against these deferred tax assets.
Veritiv records unrecognized tax benefits as liabilities in accordance with ASC 740, Income Taxes, and adjusts these liabilitieswhen the judgment changes as a result of the evaluation of new information not previously available. While management believesthat these judgments and estimates are appropriate and reasonable under the circumstances, actual resolution of these matters maydiffer from recorded estimated amounts.
Veritiv’s effective tax rate was 9.7%, 100.0% and 38.7% for the years ended December 31, 2014, 2013 and 2012, respectively. Ifthe effective tax rate used for financial reporting purposes changed by 1.0%, Veritiv would have recognized an increase or decreaseto income taxes of approximately $0.2 million for both the years ended December 31, 2014 and 2012, with no change to income taxesfor the year ended December 31, 2013. Over time, the Company estimates its effective tax rate will be approximately 38-40%.However, it may vary significantly due to potential changes in the amount and mix of pre-tax book income and changes in amountsof non-deductible expenses and other items impacting the effective tax rate.
Cash as of December 31, 2014 consisted of $47.7 million held in the U.S. and $9.9 million held in our foreign subsidiaries. All ofthe cash held by our foreign subsidiaries is available for general corporate purposes. Veritiv considers the earnings of certainnon-U.S. subsidiaries to be indefinitely invested outside the United States on the basis of estimates that future domestic cashgeneration will be sufficient to meet future domestic cash needs and management’s specific plans for reinvestment of those subsidiaryearnings. As of December 31, 2014, Veritiv’s tax basis is in excess of its financial reporting basis of certain investments in non-U.S.subsidiaries. The Company does not believe these temporary differences will reverse in the foreseeable future and, therefore, nodeferred tax asset has been recognized with respect to these basis differences. The Company does have unremitted foreign earningsof approximately $20.4 million with respect to certain of its non-U.S. subsidiaries that would be taxable as dividends if repatriated tothe U.S. The estimated income and withholding tax liability associated with the remittance of these earnings would be approximately$8.0 million. The Company has not recorded a deferred tax liability associated with these unremitted earnings.
Recently Issued Accounting Standards
See Note 1 of the Notes to the Consolidated and Combined Financial Statements for information regarding recently issuedaccounting standards.
43

ITEM 7A. QUANTITATIVE AND QUALITATIVE DISCLOSURES ABOUT MARKET RISK
Veritiv is exposed to the impact of interest rate changes, foreign currency fluctuations, primarily related to the Canadian dollar,and fuel price changes.
Interest Rate Risk
Veritiv’s exposure to fluctuations in interest rates results primarily from its borrowings under the ABL Facility. Under the termsof the ABL Facility, interest rates are based upon LIBOR or the prime rate plus a margin rate, or in the case of Canada, a banker’sacceptance rate or base rate plus a margin rate. LIBOR based loans can be set for durations of one week, or for periods of one tonine months. The margin rate amount can be adjusted upward or downward based upon usage under the line in two increments of25 basis points. Veritiv’s interest rate exposure under the ABL Facility results from changes in LIBOR, bankers’ acceptance rates, theprime/base interest rates and actual borrowings. The weighted-average borrowing interest rate at December 31, 2014 was 2.0%.Based on the average borrowings under the ABL Facility during the six months ended December 31, 2014, a hypothetical 100 basispoint increase in the interest rate would result in approximately $7.9 million of additional interest expense.
As of December 31, 2014, Veritiv had not entered into any derivative instruments to hedge interest rate risk but may do so inthe future.
Foreign Currency Exchange Rate Risk
Veritiv conducts business in various foreign currencies and is exposed to earnings and cash flow volatility associated with changesin foreign currency exchange rates. This exposure is primarily related to international assets and liabilities, whose value could changematerially in reference to the U.S. dollar reporting currency. The most significant impact of changes to foreign currency valuesinclude certain intercompany loans and advances not deemed to be permanently invested and transactions denominated in currencieswhich differ from Veritiv’s own currency.
Veritiv’s significant foreign currency exposure primarily relates to fluctuations in the foreign exchange rate between the U.S.dollar and the Canadian dollar. Net sales from Veritiv’s Canadian operations for the year ended December 31, 2014 representedapproximately 6% of Veritiv’s total net sales. Veritiv has not used foreign exchange currency options or futures agreements to hedgeits exposure to changes in foreign exchange rates.
Fuel Price Risk
Due to the nature of our distribution business, we are exposed to potential volatility in fuel prices. The cost of fuel affects theprice paid by us for products as well as the costs incurred to deliver products to our customers. The price and availability of dieselfuel fluctuates due to changes in production, seasonality and other market factors generally outside of our control. Increased fuelcosts may have a negative impact on our results of operations and financial condition. In times of higher fuel prices, we may havethe ability to pass a portion of our increased costs on to our customers; however, there can be no assurance that we will be able todo so. Based on our 2014 fuel consumption on a combined basis, a 10% increase in the average annual price per gallon of diesel fuelwould result in a potential increase of approximately $5.0 million in our annual transportation fuel costs (excluding any amountsrecovered from customers). We do not use derivatives to manage our exposure to fuel prices.
44

ITEM 8. FINANCIAL STATEMENTS AND SUPPLEMENTARY DATA
TABLE OF CONTENTS
Page
Report of Independent Registered Public Accounting Firm . . . . . . . . . . . . . . . . . . . . . . . . . . . . . . . . . . . . . . . . . . . . . . 46Consolidated and Combined Statements of Operations . . . . . . . . . . . . . . . . . . . . . . . . . . . . . . . . . . . . . . . . . . . . . . . . . 47Consolidated and Combined Statements of Comprehensive Income (Loss) . . . . . . . . . . . . . . . . . . . . . . . . . . . . . . . . . . . . 48Consolidated and Combined Balance Sheets . . . . . . . . . . . . . . . . . . . . . . . . . . . . . . . . . . . . . . . . . . . . . . . . . . . . . . . . 49Consolidated and Combined Statements of Cash Flows . . . . . . . . . . . . . . . . . . . . . . . . . . . . . . . . . . . . . . . . . . . . . . . . . 50Consolidated and Combined Statements of Shareholders’ Equity . . . . . . . . . . . . . . . . . . . . . . . . . . . . . . . . . . . . . . . . . . . 51Notes to Consolidated and Combined Financial Statements . . . . . . . . . . . . . . . . . . . . . . . . . . . . . . . . . . . . . . . . . . . . . . 52
45

Report of Independent Registered Public Accounting Firm
To the Board of Directors and Shareholders ofVeritiv CorporationNorcross, Georgia
We have audited the accompanying consolidated and combined balance sheets of Veritiv Corporation and subsidiaries (the‘‘Company’’) as of December 31, 2014 and 2013, and the related consolidated and combined statements of operations, comprehensiveincome (loss), shareholders’ equity, and cash flows for each of the three years in the period ended December 31, 2014. Thesefinancial statements are the responsibility of the Company’s management. Our responsibility is to express an opinion on the financialstatements based on our audits.
We conducted our audits in accordance with the standards of the Public Company Accounting Oversight Board (United States).Those standards require that we plan and perform the audit to obtain reasonable assurance about whether the financial statementsare free of material misstatement. The Company is not required to have, nor were we engaged to perform, an audit of its internalcontrol over financial reporting. Our audits included consideration of internal control over financial reporting as a basis for designingaudit procedures that are appropriate in the circumstances, but not for the purpose of expressing an opinion on the effectiveness ofthe Company’s internal control over financial reporting. Accordingly, we express no such opinion. An audit also includes examining,on a test basis, evidence supporting the amounts and disclosures in the financial statements, assessing the accounting principles usedand significant estimates made by management, as well as evaluating the overall financial statement presentation. We believe that ouraudits provide a reasonable basis for our opinion.
In our opinion, such consolidated and combined financial statements present fairly, in all material respects, the financial positionof Veritiv Corporation and subsidiaries as of December 31, 2014 and 2013, and the results of their operations and their cash flowsfor each of the three years in the period ended December 31, 2014, in conformity with accounting principles generally accepted inthe United States of America.
As discussed in Note 1 to the consolidated and combined financial statements, on July 1, 2014, UWW Holdings, Inc. was mergedwith and into the Company. Prior to July 1, 2014, the Company was comprised of the assets and liabilities used in managing thexpedx business of International Paper Company. For periods prior to July 1, 2014, the combined financial statements include expenseallocations for certain corporate functions historically provided by International Paper Company. These allocations may not bereflective of the actual expenses which would have been incurred had the Company operated as a separate entity apart fromInternational Paper Company.
/s/ Deloitte & Touche LLP
Cincinnati, OhioMarch 24, 2015
46

VERITIV CORPORATION
CONSOLIDATED AND COMBINED STATEMENTS OF OPERATIONS
(in millions, except share and per share data)
Year Ended December 31,
2014 2013 2012
Net sales (including sales to related parties of $42.7, $53.0 and $65.1 for 2014, 2013 and2012, respectively) . . . . . . . . . . . . . . . . . . . . . . . . . . . . . . . . . . . . . . . . . . . . . . . . . $ 7,406.5 $ 5,652.4 $ 6,012.0
Cost of products sold (including purchases from related parties of $412.6, $604.4 and $639.0for 2014, 2013 and 2012, respectively) (exclusive of depreciation and amortization shownseparately below) . . . . . . . . . . . . . . . . . . . . . . . . . . . . . . . . . . . . . . . . . . . . . . . . . . 6,180.9 4,736.8 5,036.7
Distribution expenses . . . . . . . . . . . . . . . . . . . . . . . . . . . . . . . . . . . . . . . . . . . . . . . . . 426.2 314.2 324.0Selling and administrative expenses . . . . . . . . . . . . . . . . . . . . . . . . . . . . . . . . . . . . . . . 689.1 548.2 580.6Depreciation and amortization . . . . . . . . . . . . . . . . . . . . . . . . . . . . . . . . . . . . . . . . . . . 37.6 17.1 14.0Merger and integration expenses . . . . . . . . . . . . . . . . . . . . . . . . . . . . . . . . . . . . . . . . . 75.1 — —Restructuring charges . . . . . . . . . . . . . . . . . . . . . . . . . . . . . . . . . . . . . . . . . . . . . . . . . 4.0 37.9 35.1
Operating income (loss) . . . . . . . . . . . . . . . . . . . . . . . . . . . . . . . . . . . . . . . . . . . . . . . (6.4) (1.8) 21.6Interest expense, net . . . . . . . . . . . . . . . . . . . . . . . . . . . . . . . . . . . . . . . . . . . . . . . . . 14.0 — —Other expense (income), net . . . . . . . . . . . . . . . . . . . . . . . . . . . . . . . . . . . . . . . . . . . . 1.2 (2.2) (1.9)
Income (loss) from continuing operations before income taxes . . . . . . . . . . . . . . . . . . . . . (21.6) 0.4 23.5Income tax expense (benefit) . . . . . . . . . . . . . . . . . . . . . . . . . . . . . . . . . . . . . . . . . . . . (2.1) 0.4 9.1
Income (loss) from continuing operations . . . . . . . . . . . . . . . . . . . . . . . . . . . . . . . . . . . (19.5) (0.0) 14.4Income (loss) from discontinued operations, net of income taxes . . . . . . . . . . . . . . . . . . . (0.1) 0.2 (10.0)
Net income (loss) . . . . . . . . . . . . . . . . . . . . . . . . . . . . . . . . . . . . . . . . . . . . . . . . . . . $ (19.6) $ 0.2 $ 4.4
Earnings (loss) per share:Basic and diluted
Continuing operations . . . . . . . . . . . . . . . . . . . . . . . . . . . . . . . . . . . . . . . . . . . . . $ (1.61) $ (0.00) $ 1.76Discontinued operations . . . . . . . . . . . . . . . . . . . . . . . . . . . . . . . . . . . . . . . . . . . . (0.01) 0.02 (1.23)
Basic and diluted earnings (loss) per share . . . . . . . . . . . . . . . . . . . . . . . . . . . . . . . $ (1.62) $ 0.02 $ 0.53
Weighted-average shares outstanding—basic and diluted . . . . . . . . . . . . . . . . . . . . . . . . . 12,080,000 8,160,000 8,160,000
See accompanying Notes to Consolidated and Combined Financial Statements.
47

VERITIV CORPORATION
CONSOLIDATED AND COMBINED STATEMENTS OF COMPREHENSIVE INCOME (LOSS)
(in millions)
Year EndedDecember 31,
2014 2013 2012
Net income (loss) . . . . . . . . . . . . . . . . . . . . . . . . . . . . . . . . . . . . . . . . . . . . . . . . . . . . . . . . . . . . . . . . $(19.6) $0.2 $4.4Other comprehensive income (loss):
Foreign currency translation adjustments . . . . . . . . . . . . . . . . . . . . . . . . . . . . . . . . . . . . . . . . . . . . . (10.0) 1.4 1.8Pension liability adjustments, net of $3.4 tax . . . . . . . . . . . . . . . . . . . . . . . . . . . . . . . . . . . . . . . . . . (7.4) — —
Other comprehensive income (loss) . . . . . . . . . . . . . . . . . . . . . . . . . . . . . . . . . . . . . . . . . . . . . . . . . . (17.4) 1.4 1.8
Total comprehensive income (loss) . . . . . . . . . . . . . . . . . . . . . . . . . . . . . . . . . . . . . . . . . . . . . . . . . . . . $(37.0) $1.6 $6.2
See accompanying Notes to Consolidated and Combined Financial Statements.
48

VERITIV CORPORATION
CONSOLIDATED AND COMBINED BALANCE SHEETS
(dollars in millions, except par value)
December 31, December 31,2014 2013
AssetsCurrent assets:
Cash . . . . . . . . . . . . . . . . . . . . . . . . . . . . . . . . . . . . . . . . . . . . . . . . . . . . . . . . . . . . . . . . . $ 57.6 $ 5.7Accounts receivable, less allowances of $39.0 and $22.7 in 2014 and 2013, respectively . . . . . . . . . 1,115.1 669.7Related party receivable . . . . . . . . . . . . . . . . . . . . . . . . . . . . . . . . . . . . . . . . . . . . . . . . . . . 3.9 10.1Inventories . . . . . . . . . . . . . . . . . . . . . . . . . . . . . . . . . . . . . . . . . . . . . . . . . . . . . . . . . . . . 673.2 360.9Other current assets . . . . . . . . . . . . . . . . . . . . . . . . . . . . . . . . . . . . . . . . . . . . . . . . . . . . . . 109.3 26.3Assets held for sale . . . . . . . . . . . . . . . . . . . . . . . . . . . . . . . . . . . . . . . . . . . . . . . . . . . . . . . — 9.3
Total current assets . . . . . . . . . . . . . . . . . . . . . . . . . . . . . . . . . . . . . . . . . . . . . . . . . . . . . . . . 1,959.1 1,082.0Property and equipment, net . . . . . . . . . . . . . . . . . . . . . . . . . . . . . . . . . . . . . . . . . . . . . . . . . . 377.4 107.1Goodwill . . . . . . . . . . . . . . . . . . . . . . . . . . . . . . . . . . . . . . . . . . . . . . . . . . . . . . . . . . . . . . . 52.4 26.4Other intangibles, net . . . . . . . . . . . . . . . . . . . . . . . . . . . . . . . . . . . . . . . . . . . . . . . . . . . . . . . 36.1 9.3Non-current deferred income tax assets . . . . . . . . . . . . . . . . . . . . . . . . . . . . . . . . . . . . . . . . . . 105.6 22.7Other non-current assets . . . . . . . . . . . . . . . . . . . . . . . . . . . . . . . . . . . . . . . . . . . . . . . . . . . . . 43.9 9.4
Total assets . . . . . . . . . . . . . . . . . . . . . . . . . . . . . . . . . . . . . . . . . . . . . . . . . . . . . . . . . . . . . $2,574.5 $1,256.9
Liabilities and EquityCurrent liabilities:
Accounts payable . . . . . . . . . . . . . . . . . . . . . . . . . . . . . . . . . . . . . . . . . . . . . . . . . . . . . . . . $ 589.8 $ 357.3Related party payable . . . . . . . . . . . . . . . . . . . . . . . . . . . . . . . . . . . . . . . . . . . . . . . . . . . . . 11.0 2.6Accrued payroll and benefits . . . . . . . . . . . . . . . . . . . . . . . . . . . . . . . . . . . . . . . . . . . . . . . . 111.1 54.9Deferred income tax liabilities . . . . . . . . . . . . . . . . . . . . . . . . . . . . . . . . . . . . . . . . . . . . . . . 21.1 13.5Other accrued liabilities . . . . . . . . . . . . . . . . . . . . . . . . . . . . . . . . . . . . . . . . . . . . . . . . . . . . 100.5 36.5Current maturities of long-term debt . . . . . . . . . . . . . . . . . . . . . . . . . . . . . . . . . . . . . . . . . . . 3.8 —Financing obligations to related party, current portion . . . . . . . . . . . . . . . . . . . . . . . . . . . . . . . 13.8 —
Total current liabilities . . . . . . . . . . . . . . . . . . . . . . . . . . . . . . . . . . . . . . . . . . . . . . . . . . . . . . 851.1 464.8Long-term debt, net of current maturities . . . . . . . . . . . . . . . . . . . . . . . . . . . . . . . . . . . . . . . . . 855.0 —Financing obligations to related party, less current portion . . . . . . . . . . . . . . . . . . . . . . . . . . . . . . 212.4 —Defined benefit pension obligations . . . . . . . . . . . . . . . . . . . . . . . . . . . . . . . . . . . . . . . . . . . . . 36.3 —Other non-current liabilities . . . . . . . . . . . . . . . . . . . . . . . . . . . . . . . . . . . . . . . . . . . . . . . . . . 107.2 12.5
Total liabilities . . . . . . . . . . . . . . . . . . . . . . . . . . . . . . . . . . . . . . . . . . . . . . . . . . . . . . . . . . . 2,062.0 477.3
Commitments and contingencies (Note 15)Equity:
Parent company investment, prior to Spin-off . . . . . . . . . . . . . . . . . . . . . . . . . . . . . . . . . . . . . — 784.3Shareholders’ equity:
Preferred stock, $0.01 par value, 10.0 million shares authorized, none issued . . . . . . . . . . . . . . — —Common stock, $0.01 par value, 100.0 million shares authorized, 16.0 million shares issued and
outstanding . . . . . . . . . . . . . . . . . . . . . . . . . . . . . . . . . . . . . . . . . . . . . . . . . . . . . . . . . 0.2 —Additional paid-in capital . . . . . . . . . . . . . . . . . . . . . . . . . . . . . . . . . . . . . . . . . . . . . . . . . 562.4 —Accumulated deficit . . . . . . . . . . . . . . . . . . . . . . . . . . . . . . . . . . . . . . . . . . . . . . . . . . . . . (28.0) —Accumulated other comprehensive loss . . . . . . . . . . . . . . . . . . . . . . . . . . . . . . . . . . . . . . . . (22.1) (4.7)
Total shareholders’ equity . . . . . . . . . . . . . . . . . . . . . . . . . . . . . . . . . . . . . . . . . . . . . . . . . . . . 512.5 (4.7)
Total equity . . . . . . . . . . . . . . . . . . . . . . . . . . . . . . . . . . . . . . . . . . . . . . . . . . . . . . . . . . . . . 512.5 779.6
Total liabilities and equity . . . . . . . . . . . . . . . . . . . . . . . . . . . . . . . . . . . . . . . . . . . . . . . . . . . $2,574.5 $1,256.9
See accompanying Notes to Consolidated and Combined Financial Statements.
49

VERITIV CORPORATION
CONSOLIDATED AND COMBINED STATEMENTS OF CASH FLOWS
(in millions)
Year Ended December 31,
2014 2013 2012
Operating ActivitiesNet income (loss) . . . . . . . . . . . . . . . . . . . . . . . . . . . . . . . . . . . . . . . . . . . . . . . . . . . . . . . . . . . . . . . $ (19.6) $ 0.2 $ 4.4Income (loss) from discontinued operations, net of income taxes . . . . . . . . . . . . . . . . . . . . . . . . . . . . . . . . . (0.1) 0.2 (10.0)
Income (loss) from continuing operations . . . . . . . . . . . . . . . . . . . . . . . . . . . . . . . . . . . . . . . . . . . . . . . . (19.5) (0.0) 14.4Depreciation and amortization . . . . . . . . . . . . . . . . . . . . . . . . . . . . . . . . . . . . . . . . . . . . . . . . . . . . . . . 37.6 17.4 15.2Amortization of deferred financing fees . . . . . . . . . . . . . . . . . . . . . . . . . . . . . . . . . . . . . . . . . . . . . . . . . 2.2 — —Net gains on sales of property and equipment . . . . . . . . . . . . . . . . . . . . . . . . . . . . . . . . . . . . . . . . . . . . . (2.3) (6.4) (2.3)Provision for allowance for doubtful accounts . . . . . . . . . . . . . . . . . . . . . . . . . . . . . . . . . . . . . . . . . . . . . . 12.8 6.4 7.5Deferred income tax provision . . . . . . . . . . . . . . . . . . . . . . . . . . . . . . . . . . . . . . . . . . . . . . . . . . . . . . . (9.7) 3.3 1.4Stock-based compensation . . . . . . . . . . . . . . . . . . . . . . . . . . . . . . . . . . . . . . . . . . . . . . . . . . . . . . . . . . 4.3 15.4 13.1Other noncash items, net . . . . . . . . . . . . . . . . . . . . . . . . . . . . . . . . . . . . . . . . . . . . . . . . . . . . . . . . . . 1.6 — —Changes in operating assets and liabilities, net of Merger
Accounts receivable and related party receivable . . . . . . . . . . . . . . . . . . . . . . . . . . . . . . . . . . . . . . . . . . (17.7) (1.3) 27.8Inventories . . . . . . . . . . . . . . . . . . . . . . . . . . . . . . . . . . . . . . . . . . . . . . . . . . . . . . . . . . . . . . . . . . 28.2 12.3 12.3Other current assets . . . . . . . . . . . . . . . . . . . . . . . . . . . . . . . . . . . . . . . . . . . . . . . . . . . . . . . . . . . . (21.8) 3.1 7.8Accounts payable and related party payable . . . . . . . . . . . . . . . . . . . . . . . . . . . . . . . . . . . . . . . . . . . . . (44.5) 7.2 (37.4)Accrued payroll and benefits . . . . . . . . . . . . . . . . . . . . . . . . . . . . . . . . . . . . . . . . . . . . . . . . . . . . . . . 19.9 (0.5) (1.6)Other accrued liabilities . . . . . . . . . . . . . . . . . . . . . . . . . . . . . . . . . . . . . . . . . . . . . . . . . . . . . . . . . . 15.4 4.1 1.0Other . . . . . . . . . . . . . . . . . . . . . . . . . . . . . . . . . . . . . . . . . . . . . . . . . . . . . . . . . . . . . . . . . . . . . (0.4) (8.0) (0.6)
Net cash provided by operating activities—continuing operations . . . . . . . . . . . . . . . . . . . . . . . . . . . . . . . . . . . 6.1 53.0 58.6Net cash used for operating activities—discontinued operations . . . . . . . . . . . . . . . . . . . . . . . . . . . . . . . . . . . . (1.1) (0.8) (2.6)
Net cash provided by operating activities . . . . . . . . . . . . . . . . . . . . . . . . . . . . . . . . . . . . . . . . . . . . . . . . . . 5.0 52.2 56.0
Investing ActivitiesNet cash acquired in Merger . . . . . . . . . . . . . . . . . . . . . . . . . . . . . . . . . . . . . . . . . . . . . . . . . . . . . . . . 31.8 — —Property and equipment additions . . . . . . . . . . . . . . . . . . . . . . . . . . . . . . . . . . . . . . . . . . . . . . . . . . . . . (17.2) (9.8) (13.3)Proceeds from asset sales . . . . . . . . . . . . . . . . . . . . . . . . . . . . . . . . . . . . . . . . . . . . . . . . . . . . . . . . . . 4.8 22.7 5.1Other . . . . . . . . . . . . . . . . . . . . . . . . . . . . . . . . . . . . . . . . . . . . . . . . . . . . . . . . . . . . . . . . . . . . . . . 0.5 0.3 0.5
Net cash provided by (used for) investing activities—continuing operations . . . . . . . . . . . . . . . . . . . . . . . . . . . . . 19.9 13.2 (7.7)Net cash provided by investing activities—discontinued operations . . . . . . . . . . . . . . . . . . . . . . . . . . . . . . . . . . — — 0.2
Net cash provided by (used for) investing activities . . . . . . . . . . . . . . . . . . . . . . . . . . . . . . . . . . . . . . . . . . . . 19.9 13.2 (7.5)
Financing ActivitiesNet cash transfers to Parent . . . . . . . . . . . . . . . . . . . . . . . . . . . . . . . . . . . . . . . . . . . . . . . . . . . . . . . . . (60.3) (70.8) (48.9)Change in book overdrafts . . . . . . . . . . . . . . . . . . . . . . . . . . . . . . . . . . . . . . . . . . . . . . . . . . . . . . . . . . 1.6 (5.8) 1.7Transfer to Parent in connection with Spin-off . . . . . . . . . . . . . . . . . . . . . . . . . . . . . . . . . . . . . . . . . . . . . (432.8) — —Repayment of Unisource Senior Credit Facility . . . . . . . . . . . . . . . . . . . . . . . . . . . . . . . . . . . . . . . . . . . . . (303.9) — —Borrowings of long-term debt . . . . . . . . . . . . . . . . . . . . . . . . . . . . . . . . . . . . . . . . . . . . . . . . . . . . . . . . 3,142.2 — —Repayments of long-term debt . . . . . . . . . . . . . . . . . . . . . . . . . . . . . . . . . . . . . . . . . . . . . . . . . . . . . . . (2,294.4) — —Payments under equipment capital lease obligations . . . . . . . . . . . . . . . . . . . . . . . . . . . . . . . . . . . . . . . . . . (1.3) — —Payments under financing obligations to related party . . . . . . . . . . . . . . . . . . . . . . . . . . . . . . . . . . . . . . . . (6.8) — —Deferred financing fees . . . . . . . . . . . . . . . . . . . . . . . . . . . . . . . . . . . . . . . . . . . . . . . . . . . . . . . . . . . . (22.4) — —
Net cash provided by (used for) financing activities—continuing operations . . . . . . . . . . . . . . . . . . . . . . . . . . . . 21.9 (76.6) (47.2)Net cash provided by financing activities—discontinued operations . . . . . . . . . . . . . . . . . . . . . . . . . . . . . . . . . . 1.1 — 0.9
Net cash provided by (used for) financing activities . . . . . . . . . . . . . . . . . . . . . . . . . . . . . . . . . . . . . . . . . . . 23.0 (76.6) (46.3)
Effect of exchange rate changes on cash . . . . . . . . . . . . . . . . . . . . . . . . . . . . . . . . . . . . . . . . . . . . . . . . . . 4.0 1.5 (1.5)
Net change in cash . . . . . . . . . . . . . . . . . . . . . . . . . . . . . . . . . . . . . . . . . . . . . . . . . . . . . . . . . . . . . . . . 51.9 (9.7) 0.7Cash at beginning of period . . . . . . . . . . . . . . . . . . . . . . . . . . . . . . . . . . . . . . . . . . . . . . . . . . . . . . . . . . 5.7 15.4 14.7
Cash at end of period . . . . . . . . . . . . . . . . . . . . . . . . . . . . . . . . . . . . . . . . . . . . . . . . . . . . . . . . . . . . . . $ 57.6 $ 5.7 $ 15.4
Supplemental Cash Flow InformationCash paid for income taxes, net of refunds . . . . . . . . . . . . . . . . . . . . . . . . . . . . . . . . . . . . . . . . . . . . . . . $ 2.0 $ 0.7 $ 1.1Cash paid for interest . . . . . . . . . . . . . . . . . . . . . . . . . . . . . . . . . . . . . . . . . . . . . . . . . . . . . . . . . . . . . 11.5 — —
Non-Cash TransactionsCommon stock issued in connection with Spin-off . . . . . . . . . . . . . . . . . . . . . . . . . . . . . . . . . . . . . . . . . . . $ 277.9 $ — $ —Common stock issued in connection with Merger . . . . . . . . . . . . . . . . . . . . . . . . . . . . . . . . . . . . . . . . . . . 284.7 — —Contingent liability associated with the Tax Receivable Agreement . . . . . . . . . . . . . . . . . . . . . . . . . . . . . . . . 58.8 — —Non-cash transfers (to) from Parent . . . . . . . . . . . . . . . . . . . . . . . . . . . . . . . . . . . . . . . . . . . . . . . . . . . . (26.0) 20.3 —
See accompanying Notes to Consolidated and Combined Financial Statements.
50

VERITIV CORPORATION
CONSOLIDATED AND COMBINED STATEMENTS OF SHAREHOLDERS’ EQUITY
(in millions)
AccumulatedCommon Stock Additional Parent OtherIssued Paid-in Company Accumulated ComprehensiveShares Amount Capital Investment Deficit Income (Loss) Total
Balance at December 31, 2011 . . . . . . . . . . . . . . . . . . . . — $ — $ — $ 850.2 $ — $ (7.9) $ 842.3Net income . . . . . . . . . . . . . . . . . . . . . . . . . . . . . . . . — — — 4.4 — — 4.4Other comprehensive income . . . . . . . . . . . . . . . . . . . . — — — — — 1.8 1.8Net transfers to Parent . . . . . . . . . . . . . . . . . . . . . . . . . — — — (35.4) — — (35.4)
Balance at December 31, 2012 . . . . . . . . . . . . . . . . . . . . — $ — $ — $ 819.2 $ — $ (6.1) $ 813.1Net income . . . . . . . . . . . . . . . . . . . . . . . . . . . . . . . . — — — 0.2 — — 0.2Other comprehensive income . . . . . . . . . . . . . . . . . . . . — — — — — 1.4 1.4Net transfers to Parent . . . . . . . . . . . . . . . . . . . . . . . . . — — — (35.1) — — (35.1)
Balance at December 31, 2013 . . . . . . . . . . . . . . . . . . . . — — — 784.3 — (4.7) 779.6Net income from January 1, 2014 to June 30, 2014 . . . . . . — — — 8.4 — — 8.4Net loss from July 1, 2014 to December 31, 2014 . . . . . . . — — — — (28.0) — (28.0)Other comprehensive loss, net of tax . . . . . . . . . . . . . . . — — — — — (17.4) (17.4)Net transfers to Parent . . . . . . . . . . . . . . . . . . . . . . . . . — — — (82.0) — — (82.0)Conversion of Parent Company Investment in connection
with Spin-off . . . . . . . . . . . . . . . . . . . . . . . . . . . . . . 8.2 0.1 710.6 (710.7) — — —Transfer to Parent in connection with Spin-off . . . . . . . . . — — (432.8) — — — (432.8)Issuance of common stock for Merger . . . . . . . . . . . . . . 7.8 0.1 284.6 — — — 284.7
Balance at December 31, 2014 . . . . . . . . . . . . . . . . . . . . 16.0 $0.2 $ 562.4 $ — $(28.0) $(22.1) $ 512.5
See accompanying Notes to Consolidated and Combined Financial Statements.
51

1. BUSINESS AND SUMMARY OF SIGNIFICANT ACCOUNTING POLICIES
Description of Business
Veritiv Corporation (‘‘Veritiv’’ or the ‘‘Company’’) is a North American business-to-business distributor of print, publishing,packaging, facility and logistics solutions. Established in 2014, following the merger of International Paper Company’s (‘‘InternationalPaper’’ or ‘‘Parent’’) xpedx division (‘‘xpedx’’) and UWW Holdings, Inc. (‘‘UWWH’’), the Company operates from more than180 distribution centers primarily throughout the U.S., Canada and Mexico.
xpedx was a business-to-business distributor of paper, publishing, packaging and facility supplies products in North America thatoperated in the U.S. and Mexico. xpedx distributed products and services to various customer markets, including printers, publishers,data centers, manufacturers, higher education institutions, healthcare facilities, sporting and performance arenas, retail stores,government agencies, property managers and building service contractors.
UWWH, operating through Unisource Worldwide, Inc. and its other consolidated subsidiaries (collectively, ‘‘Unisource’’), was adistributor of printing and business paper, publishing solutions, packaging supplies and equipment, facility supplies and equipmentand logistics services that operated primarily in the U.S. and Canada. Unisource sold its products to a diverse customer base thatincluded commercial printing, retail, hospitality, healthcare, governmental, distribution and manufacturing sectors.
The Spin-off and Merger
On July 1, 2014 (the ‘‘Distribution Date’’), International Paper completed the previously announced spin-off of xpedx to itsshareholders (the ‘‘Spin-off’’), forming a new public company called Veritiv. Immediately following the Spin-off, UWWH mergedwith and into Veritiv (the ‘‘Merger’’). The primary reason for the business combination was to create a North Americanbusiness-to-business distribution company with a broad geographic reach, an extensive product offering and a differentiated andleading service platform. The Merger has been reflected in Veritiv’s financial statements using the acquisition method of accounting,with Veritiv as the accounting acquirer of UWWH.
On the Distribution Date:
• 8,160,000 shares of Veritiv common stock were distributed on a pro rata basis to the International Paper shareholders ofrecord as of the close of business on June 20, 2014. Immediately following the Spin-off, but prior to the Merger, InternationalPaper’s shareholders owned all of the shares of Veritiv common stock outstanding, and
• A cash payment of $404.2 million was distributed to International Paper, which was comprised of: (i) a special payment of$400.0 million, (ii) reduced by a $15.3 million preliminary working capital adjustment and (iii) increased by $19.5 million oftransaction expense-related adjustments. During the fourth quarter of 2014, the working capital and transaction expense-related adjustments were finalized, resulting in an additional cash payment of $30.7 million to International Paper. Of thetotal payment, $432.8 million was reflected as a reduction to equity while the remaining $2.1 million was recorded in theConsolidated Statement of Operations for 2014.
In addition to the above payment, International Paper also has a potential earnout payment of up to $100.0 million that wouldbecome due in 2020 if Veritiv’s aggregate EBITDA for fiscal years 2017, 2018 and 2019 exceeds an agreed-upon target of$759.0 million, subject to certain adjustments. The $100.0 million potential earnout payment would be reflected by Veritiv as areduction to equity at the time of payment.
Immediately following the Spin-off on the Distribution Date:
• UWW Holdings, LLC, the sole shareholder of UWWH, (the ‘‘UWWH Stockholder’’) received 7,840,000 shares of Veritivcommon stock for all outstanding shares of UWWH common stock that it held on the Distribution Date, in a privateplacement transaction,
• Veritiv and the UWWH Stockholder entered into a registration rights agreement (the ‘‘Registration Rights Agreement’’) thatprovides the UWWH Stockholder with certain demand registration rights and piggyback registration rights which is more fullydescribed in Note 8, Related Party Transactions,
52

1. BUSINESS AND SUMMARY OF SIGNIFICANT ACCOUNTING POLICIES (Continued)
• Veritiv and the UWWH Stockholder entered into a tax receivable agreement (the ‘‘Tax Receivable Agreement’’) which is morefully described in Note 8, Related Party Transactions, and
• The UWWH Stockholder received approximately $33.9 million of cash proceeds associated with preliminary working capitaland net indebtedness adjustments, as well as cash proceeds of $4.7 million associated with transaction expense-relatedadjustments. During the fourth quarter of 2014, the Company finalized the working capital and net indebtedness adjustments,resulting in an additional cash payment of $5.7 million to the UWWH Stockholder. Of the total payment, $39.1 million wasrecorded as part of the purchase price consideration for Unisource while the remaining $5.2 million was recorded in theConsolidated Statement of Operations for 2014.
Immediately following the completion of the Spin-off and Merger, International Paper shareholders owned approximately 51%,and the UWWH Stockholder owned approximately 49%, of the shares of Veritiv common stock on a fully-diluted basis. Immediatelyfollowing the completion of the Spin-off, International Paper did not own any shares of Veritiv common stock. See Note 2, Mergerwith Unisource, for further details on the Merger.
Veritiv’s common stock began regular-way trading on the New York Stock Exchange on July 2, 2014 under the ticker symbolVRTV.
Basis of Presentation
Prior to the Distribution Date, Veritiv’s financial position, results of operations and cash flows consisted of only the xpedxbusiness of International Paper and have been derived from International Paper’s historical accounting records. The financial resultsof xpedx have been presented on a carve-out basis through the Distribution Date, while the financial results for Veritiv, post Spin-off,are prepared on a stand-alone basis. As such, the audited Consolidated and Combined Statements of Operations, Consolidated andCombined Statements of Comprehensive Income (Loss) and Consolidated and Combined Statements of Cash Flows for the yearended December 31, 2014 consist of:
• the combined results of operations of xpedx for the six months ended June 30, 2014 on a carve-out basis, and
• the consolidated results of Veritiv on a stand-alone basis for the six months ended December 31, 2014.
The combined financial statements as of December 31, 2013 and for the years ended December 31, 2013 and 2012 consistentirely of the combined results of xpedx on a carve-out basis.
As of December 31, 2014, all intercompany transactions have been eliminated. Prior to the Distribution Date, all significantintercompany transactions between xpedx and International Paper have been included for the periods prior to the Spin-off and wereconsidered to be effectively settled for cash at the time the transaction was recorded. The total net effect of the settlement of theseintercompany transactions is reflected in the Consolidated and Combined Statements of Cash Flows as a financing activity and in theConsolidated and Combined Balance Sheets as Parent company investment.
For periods prior to the Spin-off, the combined financial statements include expense allocations for certain functions previouslyprovided by International Paper, including, but not limited to, general corporate expenses related to finance, legal, informationtechnology, human resources, communications, insurance and stock-based compensation. These expenses have been allocated on thebasis of direct usage when identifiable, with the remainder principally allocated on the basis of percent of capital employed,headcount, sales or other measures. Management considers the basis on which the expenses have been allocated to reasonably reflectthe utilization of services provided to or for the benefit received by xpedx during those periods. The allocations may not, however,reflect the expenses xpedx would have incurred as an independent company for the periods presented. Actual costs that may havebeen incurred if xpedx had been a stand-alone company would depend on a number of factors, including the organizational structure,whether functions were outsourced or performed by employees and strategic decisions made in areas such as information technologyand infrastructure. Veritiv is unable to determine what such costs would have been had xpedx been independent. See Note 8, RelatedParty Transactions, for further information.
Following the Spin-off, certain corporate and other related functions described above continue to be provided by InternationalPaper under a transition services agreement. Since July 1, 2014, the Company has recognized $15.5 million in selling andadministrative expenses related to this agreement.
For the years ended December 31, 2013 and 2012, certain amounts in the operating activities section of the Statements of CashFlows have been reclassified for comparative purposes to conform to the current year presentation. This
53

1. BUSINESS AND SUMMARY OF SIGNIFICANT ACCOUNTING POLICIES (Continued)
reclassification did not have any impact on net cash flows from operations or the Combined Statements of Operations for the yearsended December 31, 2013 and 2012, or on the Combined Balance Sheet as of December 31, 2013.
Use of Estimates
The preparation of financial statements in conformity with U.S. generally accepted accounting principles (‘‘GAAP’’) requiresmanagement to make estimates and assumptions that affect the reported amounts of assets and liabilities, revenue and expenses, andcertain financial statement disclosures. Estimates and assumptions are used for, but not limited to, revenue recognition, accountsreceivable valuation, inventory valuation, employee benefit plans, income tax contingency accruals and valuation allowances andgoodwill and other intangible asset valuations. Although these estimates are based on management’s knowledge of current events andactions it may undertake in the future, actual results may ultimately differ from these estimates and assumptions. Estimates arerevised as additional information becomes available.
Summary of Significant Accounting Policies
Revenue Recognition
Revenue is recognized when persuasive evidence of an arrangement exists, the price is fixed or determinable, collectability isreasonably assured and delivery has occurred. Revenue is recognized when the customer takes title and assumes the risks andrewards of ownership. Revenue is recorded at the time of shipment for customer terms designated f.o.b. (free on board) shippingpoint. For sales transactions with customers designated f.o.b. destination, revenue is recorded when the product is delivered to thecustomer’s delivery site, when title and risk of loss are transferred. Shipping terms are determined on a customer-by-customer ororder-by-order basis. When management cannot conclude collectability is reasonably assured for shipments to a particular customer,revenue associated with that customer is not recognized until cash is collected or management is otherwise able to establish thatcollectability is reasonably assured.
Certain revenues are derived from shipments arranged by the Company made directly from a manufacturer to a customer. TheCompany is considered to be a principal to these transactions because, among other factors, it controls pricing to the customer, bearsthe credit risk of the customer defaulting on payment and is the primary obligor. Revenues from these sales are reported on a grossbasis in the Consolidated and Combined Statements of Operations and amounted to $2.9 billion, $2.4 billion and $2.5 billion for theyears ended December 31, 2014, 2013 and 2012, respectively.
Taxes collected from customers relating to product sales and remitted to governmental authorities are accounted for on a netbasis. Accordingly, such taxes are excluded from both net sales and expenses.
Purchase Incentives and Customer Rebates
Veritiv enters into agreements with suppliers that entitle Veritiv to receive rebates, allowances and other discounts based on theattainment of specified purchasing levels or sales to certain customers. Purchase incentives are recorded as a reduction to inventoryand recognized in cost of products sold as the product is sold.
Veritiv also enters into incentive agreements with its customers, which are generally based on sales to these customers. Veritivrecords estimated rebates to customers as a reduction to gross sales as customer revenue is recognized.
Distribution Expenses
Distribution expenses consist of storage, handling and delivery costs including freight to the Company’s customers’ destination.Handling and delivery costs were $322.3 million, $252.9 million and $259.7 million for the years ended December 31, 2014, 2013 and2012, respectively.
Merger and Integration Expenses
Merger and integration expenses are expensed as incurred. Merger expenses include advisory, legal and other professional feesdirectly associated with the Merger. Integration expenses include professional services and project management fees, retentioncompensation, termination benefits (including change-in-control bonuses), rebranding and other non-recurring or redundant costs tointegrate the combined businesses of xpedx and Unisource.
54

1. BUSINESS AND SUMMARY OF SIGNIFICANT ACCOUNTING POLICIES (Continued)
Accounts Receivable and Allowances
Accounts receivables are recognized net of allowances that primarily consist of allowance for doubtful accounts of $31.7 millionand $22.5 million as of December 31, 2014 and 2013, respectively, with the remaining balance of $7.3 million and $0.2 million beingcomprised of other allowances as of December 31, 2014 and 2013, respectively. The allowance for doubtful accounts reflects the bestestimate of losses inherent in the Company’s accounts receivable portfolio determined on the basis of historical experience, specificallowances for known troubled accounts and other available evidence. The other allowances balance is inclusive of credit risks,returns, discounts and any other items affecting the realization of these assets. Accounts receivable are written off when managementdetermines they are uncollectible.
Below is a rollforward of the Company’s accounts receivable allowances for the years ended December 31, 2014, 2013 and 2012:
Year EndedDecember 31,
2014 2013 2012(in millions)Beginning balance, January 1 . . . . . . . . . . . . . . . . . . . . . . . . . . . . . . . . . . . . . . . . . . $22.7 $25.3 $26.2Add / (Deduct):
Provision for bad debt expense . . . . . . . . . . . . . . . . . . . . . . . . . . . . . . . . . . . . . . . . 12.8 6.4 8.7Net write-offs and other adjustments . . . . . . . . . . . . . . . . . . . . . . . . . . . . . . . . . . . . (9.8) (9.0) (9.6)Other(1) . . . . . . . . . . . . . . . . . . . . . . . . . . . . . . . . . . . . . . . . . . . . . . . . . . . . . . . 13.3 — —
Ending balance, December 31 . . . . . . . . . . . . . . . . . . . . . . . . . . . . . . . . . . . . . . . . . . $39.0 $22.7 $25.3
(1) Represents accounts receivable allowances recorded in connection with the Merger.
Inventories
The Company’s inventories are primarily comprised of finished goods and primarily valued at cost as determined by the last-infirst-out (‘‘LIFO’’) method. Such valuations are not in excess of market. Elements of cost in inventories include the purchase priceinvoiced by a supplier, plus inbound freight and related costs and reduced by estimated volume-based discounts and early paydiscounts available from certain suppliers. Approximately 86% and 97% of inventories were valued using the LIFO method as ofDecember 31, 2014 and 2013, respectively. If the first-in, first-out method had been used, total inventory balances would haveincreased by approximately $79.1 million and $76.6 million at December 31, 2014 and 2013, respectively.
The Company reduces the value of obsolete and inactive inventory based on the difference between the LIFO cost of theinventory and the estimated market value using assumptions of future demand and market conditions. To estimate the net realizablevalue, the Company considers factors such as age of the inventory, the nature of the products, the quantity of items on-hand relativeto sales trends, current market prices and trends in pricing, its ability to use excess supply in another channel, historical write-offsand expected residual values or other recoveries.
Veritiv had $58.3 million and $17.7 million of consigned inventory as of December 31, 2014 and 2013, respectively.
Property and Equipment, Net
Property and equipment are stated at cost, less accumulated depreciation. Expenditures for replacements and majorimprovements are capitalized, whereas repair and maintenance costs that do not improve service potential or extend economic lifeare expensed as incurred. The Company capitalizes certain computer software and development costs incurred in connection withdeveloping or obtaining software for internal use. Costs related to the development of internally developed software, other than thoseincurred during the application development stage, are expensed as incurred.
55

1. BUSINESS AND SUMMARY OF SIGNIFICANT ACCOUNTING POLICIES (Continued)
The components of property and equipment, net were as follows:
December 31, December 31,2014 2013(in millions)
Land, buildings and improvements . . . . . . . . . . . . . . . . . . . . . . . . . . . . . . . . . . . $ 128.9 $ 143.8Machinery and equipment . . . . . . . . . . . . . . . . . . . . . . . . . . . . . . . . . . . . . . . . . 110.2 72.5Equipment capital leases and assets related to financing obligations with related
party . . . . . . . . . . . . . . . . . . . . . . . . . . . . . . . . . . . . . . . . . . . . . . . . . . . . . 232.0 —Internally developed software . . . . . . . . . . . . . . . . . . . . . . . . . . . . . . . . . . . . . . 114.4 84.5Construction-in-progress . . . . . . . . . . . . . . . . . . . . . . . . . . . . . . . . . . . . . . . . . . 14.0 4.9Less: Accumulated depreciation and software amortization . . . . . . . . . . . . . . . . . . (222.1) (198.6)
Property and equipment, net . . . . . . . . . . . . . . . . . . . . . . . . . . . . . . . . . . . . . . . $ 377.4 $ 107.1
Depreciation is calculated using the straight-line method over the estimated useful lives of the assets. Land is not depreciated,and construction-in-progress (‘‘CIP’’) is not depreciated until ready for service. Leased property and improvements to leased propertyare amortized on a straight-line basis over the lease term or useful life of the asset, whichever is less.
Depreciation and amortization for property and equipment, other than land and CIP, is based upon the following estimateduseful lives:
Buildings . . . . . . . . . . . . . . . . . . . . . . . . . . . . . . . . . . . . . . . . . . . . . . . . . . . . . . . . . . . . . . 40 yearsLeasehold improvements . . . . . . . . . . . . . . . . . . . . . . . . . . . . . . . . . . . . . . . . . . . . . . . . . . . 1 to 20 yearsMachinery and equipment . . . . . . . . . . . . . . . . . . . . . . . . . . . . . . . . . . . . . . . . . . . . . . . . . . 3 to 15 yearsEquipment capital leases and assets related to financing obligations with related party . . . . . . . . . 3 to 15 yearsInternally developed software . . . . . . . . . . . . . . . . . . . . . . . . . . . . . . . . . . . . . . . . . . . . . . . . 3 to 5 years
Depreciation and amortization expenses, including the depreciation expense for assets under capital leases and amortizationexpense of internally developed software, totaled $32.9 million, $15.9 million and $12.9 million for the years ended December 31,2014, 2013 and 2012, respectively. Accumulated depreciation on equipment capital leases and assets related to financing obligationswith related party as of December 31, 2014 was $15.6 million. Veritiv did not have any capital leases as of December 31, 2013.Amortization expense of the internally developed software was $11.0 million, $8.3 million and $3.0 million during the years endedDecember 31, 2014, 2013 and 2012, respectively. During 2014, there were no depreciation amounts included in restructuring. During2013 and 2012, $0.3 million and $1.2 million of depreciation was included in restructuring.
As of December 31, 2014 and 2013, unamortized internally developed software costs, including amounts recorded in CIP, were$44.6 million and $17.1 million, respectively.
Upon retirement or other disposal of property and equipment, the cost and related amount of accumulated depreciation areeliminated from the asset and accumulated depreciation accounts, respectively. The difference, if any, between the net asset valueand the proceeds is included in net income.
Leases
The Company leases certain property and equipment used for operations. Such lease arrangements are reviewed for capital oroperating classification at their inception.
Capital lease obligations consist of delivery equipment, material handling equipment, computer hardware and office equipmentwhich are leased through third parties under non-cancelable leases with terms generally ranging from three to eight years. Many ofthe delivery equipment leases include annual rate increases based on the Consumer Price Index which are included in the calculationof the initial lease obligation. The carrying value of the related equipment associated with these capital leases is included withinproperty and equipment, net in the Consolidated and Combined Balance Sheets at December 31, 2014, and depreciated over theterm of the lease. The Company does not record rent expense for capital leases.
56

1. BUSINESS AND SUMMARY OF SIGNIFICANT ACCOUNTING POLICIES (Continued)
Rather, rental payments under the lease are recognized as a reduction of the capital lease obligation and interest expense.Depreciation expense for assets under capital leases is included in the total depreciation expense disclosed in the Consolidated andCombined Statements of Operations.
All other leases are operating leases. Certain lease agreements include renewal options and rent escalation clauses. Assetssubject to an operating lease and the related lease payments are not recorded on the Company’s balance sheet. Rent expense isrecognized on a straight-line basis over the expected lease term.
The term for all types of leases begins on the date the Company becomes legally obligated for the rent payments or takespossession of the asset, whichever is earlier.
Goodwill and Other Intangible Assets, Net
Goodwill relating to a single business reporting unit is included as an asset of the applicable segment. Goodwill arising frommajor acquisitions that involve multiple reportable segments is allocated to the reporting units based on the relative fair value of thereporting unit.
Goodwill is reviewed by Veritiv for impairment on a reporting unit basis annually on October 1st or more frequently if indicatorsare present or changes in circumstances suggest that impairment may exist. The testing of goodwill for possible impairment is atwo-step process. In the first step, the fair value of a reporting unit is compared with its carrying value, including goodwill. If fairvalue exceeds the carrying value, goodwill is not considered to be impaired. If the fair value of a reporting unit is below the carryingvalue, then step two is performed to measure the amount of the goodwill impairment loss for the reporting unit. This analysisrequires the determination of the fair value of all of the individual assets and liabilities of the reporting unit, including any currentlyunrecognized intangible assets, as if the reporting unit had been purchased on the analysis date. Once these fair values have beendetermined, the implied fair value of the unit’s goodwill is calculated as the excess, if any, of the fair value of the reporting unitdetermined in step one over the fair value of the net assets determined in step two. The carrying value of goodwill is then reduced tothis implied value, or to zero if the fair value of the assets exceeds the fair value of the reporting unit, through a goodwillimpairment charge. The impairment test performed during the fourth quarter of 2014 and 2013 indicated the fair value of thereporting units containing goodwill was in excess of the related carrying value of the net assets.
Intangible assets acquired in a business combination are recorded at fair value. The Company’s intangible assets includecustomer relationships, trademarks and trade names and non-compete agreements. Intangible assets with finite useful lives aresubsequently amortized using the straight-line method over the estimated useful lives of the assets.
Impairment of Long-Lived Assets
Long-lived assets, including finite-lived intangible assets, are amortized and tested for impairment whenever events or changes incircumstances indicate their carrying value may not be recoverable. The Company assesses the recoverability of long-lived assetsbased on the undiscounted future cash flow the assets are expected to generate and recognize an impairment loss when estimatedundiscounted future cash flows expected to result from the use of the asset plus net proceeds expected from disposition of the asset,if any, are less than the carrying value of the asset. When an impairment is identified, the Company reduces the carrying amount ofthe asset to its estimated fair value based on a discounted cash flow approach or, when available and appropriate, to comparablemarket values.
No long-lived asset impairment charges were recorded during the years ended December 31, 2014, 2013 and 2012.
Employee Benefit Plans
The Company sponsors and/or contributes to defined contribution plans, defined benefit pension plans and multi-employerpension plans in the United States. In addition, the Company and its subsidiaries have various pension plans and other forms ofretirement arrangements outside the United States. See Note 9, Employee Benefit Plans, for additional information.
Prior to the Spin-off, certain of xpedx’s employees participated in defined benefit pension and other postretirement benefit planssponsored and accounted for by International Paper. In conjunction with the Spin-off, the above plans were frozen for the xpedxemployees, and International Paper retained the associated liabilities. Certain xpedx union employees
57

1. BUSINESS AND SUMMARY OF SIGNIFICANT ACCOUNTING POLICIES (Continued)
were added as participants to the Unisource defined benefit pension plan. In conjunction with the Merger, Veritiv assumedresponsibility for Unisource’s defined benefit plans and Supplemental Executive Retirement Plan (‘‘SERP’’) in the U.S. and Canada.Except as discussed below, these plans were frozen prior to the Merger. Union employees continue to accrue benefits under the U.S.defined benefit pension plan in accordance with their collective bargaining agreements.
The determination of defined benefit pension and postretirement plan obligations and their associated costs requires the use ofactuarial computations to estimate participant plan benefits to which the employees will be entitled. The Company’s significantassumptions in this regard include discount rates, rate of future compensation increases, expected long-term rates of return on planassets, mortality rates, and other factors. Each assumption is developed using relevant company experience in conjunction withmarket-related data in the U.S. and Canada. All actuarial assumptions are reviewed annually with third-party consultants andadjusted, as necessary.
For the recognition of net periodic postretirement cost, the calculation of the expected long-term rate of return on plan assets isderived using the fair value of plan assets at the measurement date. Actual results that differ from the Company’s assumptions areaccumulated and amortized on a straight-line basis only to the extent they exceed 10% of the higher of the fair value of plan assetsor the projected benefit obligation, over the estimated remaining service period of active participants. The fair value of plan assets isdetermined based on market prices or estimated fair value at the measurement date.
The Company also makes contributions to multi-employer pension plans for its union employees covered by such plans. Forthese plans, the Company recognizes a liability only for any required contributions to the plans or surcharges imposed by the plansthat are accrued and unpaid at the balance sheet date. The Company does not record an asset or liability to recognize the fundedstatus of the plans.
Stock-Based Compensation
The Company measures and records compensation expense for all stock-based awards based on the grant date fair values overthe vesting period of the awards. See Note 14, Equity-Based Incentive Plans, for additional information.
Income Taxes
Veritiv records its global tax provision based on the respective tax rules and regulations for the jurisdictions in which it operates.Where Veritiv believes that a tax position is supportable for income tax purposes, the item is included in the appropriate income taxreturns. Where treatment of a position is uncertain, liabilities are recorded based upon an evaluation of the more likely than notoutcome considering technical merits of the position based on specific tax regulations and facts of each matter. Changes to recordedliabilities are made only when an identifiable event occurs that alters the likely outcome, such as settlement with the relevant taxauthority, the expiration of statutes of limitation for the subject tax year, change in tax laws, or a recent court case that addresses thematter.
Valuation allowances are recorded to reduce deferred tax assets when it is more likely than not that a tax benefit will not berealized. Significant judgment is required in evaluating the need for and magnitude of appropriate valuation allowances againstdeferred tax assets. The realization of these assets is dependent on generating future taxable income, as well as successfulimplementation of various tax planning strategies.
While Veritiv believes that these judgments and estimates are appropriate and reasonable under the circumstances, actualresolution of these matters may differ from recorded estimated amounts.
Fair Value Measurements
Fair value is the price that would be received upon the sale of an asset or paid to transfer a liability in an orderly transactionbetween market participants at the measurement date. The following fair value hierarchy is used in selecting inputs, with the highestpriority given to Level 1, as these are the most transparent or reliable.
Level 1—Quoted market prices in active markets for identical assets or liabilities.
Level 2—Observable market-based inputs other than quoted prices included within Level 1 that are observable forthe asset or liability, either directly or indirectly.
Level 3—Unobservable inputs for the asset or liability reflecting the reporting entity’s own assumptions or externalinputs from inactive markets.
58

1. BUSINESS AND SUMMARY OF SIGNIFICANT ACCOUNTING POLICIES (Continued)
See Note 10, Fair Value Measurements, for further detail.
Foreign Currency
The assets and liabilities of the foreign subsidiaries are translated from their respective local currencies to the U.S. dollars at theappropriate spot rates as of the balance sheet date. Changes in the carrying value of these assets and liabilities attributable tofluctuations in spot rates are recognized in foreign currency translation adjustment, a component of accumulated othercomprehensive income (loss) (‘‘AOCI’’). See Note 13, Shareholders’ Equity, for further detail.
The revenues and expenses of the foreign subsidiaries are translated using the monthly average exchange rates during the year.The gains or losses from foreign currency transactions are included in other expense (income), net in the Consolidated andCombined Statements of Operations.
Recently Issued Accounting Standards
Effect on the FinancialDate of Statements or Other
Standard Description Adoption Significant Matters
Standards that are not yet adopted:
ASU 2014-09, Revenue from Contractswith Customers (Topic 606) . . . . . . The standard will replace existing January 1, The Company is currently evaluating
revenue recognition standards and 2017 the alternative methods of adoptionsignificantly expand the disclosure and the effect on its Consolidatedrequirements for revenue and Combined Financial Statementsarrangements. It may be adopted and related disclosures.either retrospectively or on amodified retrospective basis to newcontracts and existing contracts withremaining performance obligations asof the effective date.
2. MERGER WITH UNISOURCE
As more fully described in Note 1, Business and Summary of Significant Accounting Policies, on July 1, 2014, UWWH mergedwith and into Veritiv. During the year ended December 31, 2014, the Company incurred merger and integration-related expenses of$75.1 million. The following table below summarizes the components of merger and integration expenses:
(in millions)
Legal and other professional and consulting fees . . . . . . . . . . . . . . . . . . . . . . . . . . . . . . . . . . . . $29.7Retention compensation and termination benefits . . . . . . . . . . . . . . . . . . . . . . . . . . . . . . . . . . . . 37.9Other . . . . . . . . . . . . . . . . . . . . . . . . . . . . . . . . . . . . . . . . . . . . . . . . . . . . . . . . . . . . . . . . . 7.5
Total merger and integration expenses . . . . . . . . . . . . . . . . . . . . . . . . . . . . . . . . . . . . . . . . . . . $75.1
The Merger was accounted for in the Company’s financial statements using the acquisition method of accounting, with Veritiv asthe accounting acquirer of Unisource. The preliminary estimated purchase price of $382.6 million was determined in accordance withthe Merger Agreement. During the fourth quarter of 2014, the Company recorded a $3.1 million increase to the purchase price andcorresponding adjustment to goodwill as a result of finalizing the working capital and net indebtedness adjustment with the UWWHStockholder, less a decrease to the fair value of the contingent liability associated with the Tax Receivable Agreement. Thepreliminary purchase price is allocated to tangible and identifiable intangible assets and liabilities based upon their respective fairvalues.
The following table summarizes the components of the preliminary estimated purchase price for Unisource. The fair value ofVeritiv shares transferred represents the aggregate value of 7,840,000 shares issued at the closing ‘‘when-issued’’ market price of theCompany’s stock on June 30, 2014, the day prior to the Merger, less a discount for lack of marketability. See Note 10, Fair ValueMeasurements, regarding the valuation of the contingent liability.
59

2. MERGER WITH UNISOURCE (Continued)
Preliminary estimated purchase price: (in millions)
Fair value of Veritiv shares transferred . . . . . . . . . . . . . . . . . . . . . . . . . . . . . . . . . . . . . . . . . . . $284.7Cash payments associated with customary working capital and net indebtedness adjustments . . . . . . 39.1Fair value of contingent liability associated with the Tax Receivable Agreement . . . . . . . . . . . . . . . 58.8
Total preliminary estimated purchase price . . . . . . . . . . . . . . . . . . . . . . . . . . . . . . . . . . . . . . . . $382.6
The following table summarizes the preliminary allocation of the purchase price to assets acquired and liabilities assumed as ofthe date of the Merger:
Preliminary Allocation: (in millions)
Cash . . . . . . . . . . . . . . . . . . . . . . . . . . . . . . . . . . . . . . . . . . . . . . . . . . . . . . . . . . . . . . . . . . $ 70.9Accounts receivable . . . . . . . . . . . . . . . . . . . . . . . . . . . . . . . . . . . . . . . . . . . . . . . . . . . . . . . . 448.4Inventories . . . . . . . . . . . . . . . . . . . . . . . . . . . . . . . . . . . . . . . . . . . . . . . . . . . . . . . . . . . . . . 353.8Deferred income tax assets . . . . . . . . . . . . . . . . . . . . . . . . . . . . . . . . . . . . . . . . . . . . . . . . . . . 71.1Property and equipment . . . . . . . . . . . . . . . . . . . . . . . . . . . . . . . . . . . . . . . . . . . . . . . . . . . . . 299.0Goodwill . . . . . . . . . . . . . . . . . . . . . . . . . . . . . . . . . . . . . . . . . . . . . . . . . . . . . . . . . . . . . . . 26.0Other intangible assets . . . . . . . . . . . . . . . . . . . . . . . . . . . . . . . . . . . . . . . . . . . . . . . . . . . . . . 31.5Other current and non-current assets (including below market leasehold agreements) . . . . . . . . . . . 61.8Accounts payable . . . . . . . . . . . . . . . . . . . . . . . . . . . . . . . . . . . . . . . . . . . . . . . . . . . . . . . . . (284.2)Long-term debt (including equipment capital leases) . . . . . . . . . . . . . . . . . . . . . . . . . . . . . . . . . . (313.2)Financing obligations to related party . . . . . . . . . . . . . . . . . . . . . . . . . . . . . . . . . . . . . . . . . . . . (233.1)Defined benefit pension obligations . . . . . . . . . . . . . . . . . . . . . . . . . . . . . . . . . . . . . . . . . . . . . (30.3)Other current and non-current liabilities (including above market leasehold agreements) . . . . . . . . . (119.1)
Total purchase price . . . . . . . . . . . . . . . . . . . . . . . . . . . . . . . . . . . . . . . . . . . . . . . . . . . . . . . . $ 382.6
The purchase price allocated to the identifiable intangible assets acquired is as follows:
EstimatedWeighted-Average
Value Useful Life(in millions) (in years)
Customer relationships . . . . . . . . . . . . . . . . . . . . . . . . . . . . . . . . . . . . . . . . . $24.3 14.8Trademarks/Trade names . . . . . . . . . . . . . . . . . . . . . . . . . . . . . . . . . . . . . . . . 4.1 3.6Non-compete agreements . . . . . . . . . . . . . . . . . . . . . . . . . . . . . . . . . . . . . . . 3.1 1
Total identifiable intangible assets acquired . . . . . . . . . . . . . . . . . . . . . . . . . . . $31.5
The allocation of the purchase price above is considered preliminary and was based on valuation information, estimates andassumptions available on December 31, 2014. During the fourth quarter of 2014, the Company finalized certain valuation matters,including property and equipment and certain types of obligations, which resulted in a $5.8 million net decrease to goodwill. TheCompany is still in the process of verifying data and finalizing information related to the valuation and expects to finalize thesematters within the measurement period as final asset and liability valuations are completed. The following assets and liabilities aresubject to change:
• Deferred income tax assets and liabilities;
• Contingent liability associated with the Tax Receivable Agreement; and
• Other intangible assets.
As management receives additional information during the measurement period, these assets and liabilities may be adjusted.
The Company has evaluated and continues to evaluate and gather information relating to the pre-acquisition contingency for theescheat audit described in Note 15, Commitments and Contingencies, that existed as of the acquisition date. Should the Companydevelop an estimate for this contingency during the measurement period, it will be included in the
60

2. MERGER WITH UNISOURCE (Continued)
final valuation and related amounts recognized. Subsequent to the end of the measurement period, any adjustments topre-acquisition contingency amounts will be reflected in the Company’s results of operations.
Preliminary goodwill of $26.0 million arising from the Merger consists largely of the synergies and other benefits expected fromcombining the operations and is not expected to be deductible for income tax purposes. See Note 4, Goodwill and Other IntangibleAssets, for the preliminary allocation of goodwill to the Company’s reportable segments.
Actual and Pro Forma Impact
The operating results for Unisource are included in the Company’s financial statements from July 1, 2014 through December 31,2014. Net sales and pre-tax income attributable to Unisource during this period were $2,040.5 million and $31.2 million, respectively.
The following unaudited pro forma financial information presents results as if the Merger and the related financing, furtherdescribed in Note 5, Debt, occurred on January 1, 2013. The historical consolidated financial information of the Company andUnisource has been adjusted in the pro forma information to give effect to pro forma events that are directly attributable to thetransactions and factually supportable. The unaudited pro forma results do not reflect events that have occurred or may occur afterthe transactions, including the impact of any synergies expected to result from the Merger. Accordingly, the unaudited pro formafinancial information is not necessarily indicative of the results of operations as they would have been had the transactions beeneffected on the assumed date, nor is it necessarily an indication of future operating results.
Year Ended December 31,(Unaudited)(in millions, except share and per share data) 2014 2013
Net sales . . . . . . . . . . . . . . . . . . . . . . . . . . . . . . . . . . . . . . . . . . . . . . . . . . . . . $ 9,314.1 $ 9,741.5Net income(1) . . . . . . . . . . . . . . . . . . . . . . . . . . . . . . . . . . . . . . . . . . . . . . . . . $ 22.7 $ 181.1Earnings per share—basic and diluted . . . . . . . . . . . . . . . . . . . . . . . . . . . . . . . . . $ 1.42 $ 11.32Weighted-average shares outstanding—basic and diluted . . . . . . . . . . . . . . . . . . . . . 16,000,000 16,000,000
(1) Unisource’s historical results for the year ended December 31, 2013 include the reversal of a $238.7 million valuationallowance against its U.S. federal and a substantial portion of its state net deferred tax assets.
The unaudited pro forma information reflects primarily the following pre-tax adjustments for the respective periods:
• Merger and integration expenses: Merger and integration expenses of $75.1 million incurred during the year endedDecember 31, 2014 have been eliminated. Pro forma net income for the year ended December 31, 2013 includes merger andintegration expenses of $103.5 million.
• Incremental depreciation and amortization expense: Pro forma net income for the years ended December 31, 2014 and 2013includes $2.5 million and $14.0 million, respectively, of incremental depreciation and amortization expense related to the fairvalue adjustments to property and equipment and identifiable intangible assets.
A combined effective U.S. federal statutory and state rate of 39.0% was used to determine the after-tax impact on net income ofthe pro forma adjustments.
3. RESTRUCTURING CHARGES
Veritiv Restructuring Plan
As part of the Spin-off and Merger, the Company is executing on a multi-year restructuring program of its North Americanoperations intended to integrate the legacy xpedx and Unisource operations, generate cost savings and capture synergies across thecombined company. The restructuring plan includes initiatives to: (i) consolidate warehouse facilities in overlapping markets,(ii) improve the efficiency of the delivery network, (iii) consolidate customer service centers, (iv) reorganize the field sales andoperations functions and (v) restructure the corporate general and administrative functions.
During the fourth quarter of 2014, the Company initiated the process of consolidating warehouse and customer service locationsof the legacy organizations as well as realigning its field and sales management function.
61

3. RESTRUCTURING CHARGES (Continued)
The Company recorded restructuring charges of $5.1 million during the fourth quarter of 2014 related to these initiatives. SeeNote 17, Segment and Geographic Information, for the impact these charges had on the Company’s reportable segments. Otherdirect costs reported in the table below include facility closing costs and other incidental costs associated with the development,communication, administration and implementation of these initiatives.
The corresponding liability and activity are detailed in the table below.
Severance and Other DirectRelated Costs Costs Total(in millions)
Liability at December 31, 2013 . . . . . . . . . . . . . . . . . . . . . . . . . . . . . . . . $ — $ — $ —Costs incurred . . . . . . . . . . . . . . . . . . . . . . . . . . . . . . . . . . . . . . . . . . 4.7 0.4 5.1Payments . . . . . . . . . . . . . . . . . . . . . . . . . . . . . . . . . . . . . . . . . . . . . (1.0) (0.2) (1.2)
Liability at December 31, 2014 . . . . . . . . . . . . . . . . . . . . . . . . . . . . . . . . $ 3.7 $ 0.2 $ 3.9
xpedx Restructuring Plan
During 2010, xpedx completed a strategic assessment of its operating model, resulting in the decision to begin a multi-yearrestructuring plan. The restructuring plan involved the establishment of a lower cost operating model in connection with therepositioning of the Print segment in response to changing market considerations. The restructuring plan included initiatives to(i) optimize the warehouse network, (ii) improve the efficiency of the sales team and (iii) reorganize the procurement function. Theplan was launched in 2011 and was substantially completed by June 30, 2014.
The restructuring plan identified locations to be affected and a range of time for specific undertakings. During 2013 and 2012,xpedx closed six and 118 locations, respectively. There were no locations closed in 2014 under this plan. xpedx recorded restructuringincome of $1.1 million and charges of $37.9 million and $35.1 million during the years ended December 31, 2014, 2013 and 2012,respectively, related to these closures. The income and charges were as follows:
Year EndedDecember 31,
2014 2013 2012(in millions)Facility costs . . . . . . . . . . . . . . . . . . . . . . . . . . . . . . . . . . . . . . . . . . . . . . . . . . . . . . $ 0.3 $15.2 $13.0Severance . . . . . . . . . . . . . . . . . . . . . . . . . . . . . . . . . . . . . . . . . . . . . . . . . . . . . . . . 0.2 16.9 11.9Personnel costs . . . . . . . . . . . . . . . . . . . . . . . . . . . . . . . . . . . . . . . . . . . . . . . . . . . . — 10.9 10.6Accelerated amortization and depreciation . . . . . . . . . . . . . . . . . . . . . . . . . . . . . . . . . — 0.3 1.2Professional services . . . . . . . . . . . . . . . . . . . . . . . . . . . . . . . . . . . . . . . . . . . . . . . . . — 1.0 1.1Gain on sale of fixed assets . . . . . . . . . . . . . . . . . . . . . . . . . . . . . . . . . . . . . . . . . . . . (1.6) (6.4) (2.7)
Total . . . . . . . . . . . . . . . . . . . . . . . . . . . . . . . . . . . . . . . . . . . . . . . . . . . . . . . . . . . $(1.1) $37.9 $35.1
The corresponding liability and activity during the periods presented are detailed in the table below. In connection with theSpin-off on July 1, 2014, the remaining liability at June 30, 2014 was transferred to International Paper. See Note 8, Related PartyTransactions, for more details.
Total(in millions)Liability at December 31, 2012 . . . . . . . . . . . . . . . . . . . . . . . . . . . . . . . . . . . . . . . . . . . . . . . . . . . . $ 3.8
Costs incurred . . . . . . . . . . . . . . . . . . . . . . . . . . . . . . . . . . . . . . . . . . . . . . . . . . . . . . . . . . . . . 44.0Payments . . . . . . . . . . . . . . . . . . . . . . . . . . . . . . . . . . . . . . . . . . . . . . . . . . . . . . . . . . . . . . . . . (39.7)Adjustment of prior year’s estimate . . . . . . . . . . . . . . . . . . . . . . . . . . . . . . . . . . . . . . . . . . . . . . . (0.4)
Liability at December 31, 2013 . . . . . . . . . . . . . . . . . . . . . . . . . . . . . . . . . . . . . . . . . . . . . . . . . . . . 7.7Costs incurred . . . . . . . . . . . . . . . . . . . . . . . . . . . . . . . . . . . . . . . . . . . . . . . . . . . . . . . . . . . . . 0.1Payments . . . . . . . . . . . . . . . . . . . . . . . . . . . . . . . . . . . . . . . . . . . . . . . . . . . . . . . . . . . . . . . . . (3.9)Adjustment of prior year’s estimate . . . . . . . . . . . . . . . . . . . . . . . . . . . . . . . . . . . . . . . . . . . . . . . (0.3)Liability transferred to Parent in connection with Spin-off . . . . . . . . . . . . . . . . . . . . . . . . . . . . . . . . (3.6)
Liability at December 31, 2014 . . . . . . . . . . . . . . . . . . . . . . . . . . . . . . . . . . . . . . . . . . . . . . . . . . . . $ —
62

4. GOODWILL AND OTHER INTANGIBLE ASSETS
Goodwill
At December 31, 2013, the net goodwill balance was $26.4 million and was specific to the Packaging reportable segment. Therewere no additions to goodwill during the year ended December 31, 2013. The following table sets forth the changes in the carryingamount of goodwill during 2014:
Facility Corporate &Print Publishing Packaging Solutions Other Total(in millions)
Balance at December 31, 2013 . . . . . . . . . . . . . . . . . . . . . . . . . . $— $— $26.4 $ — $ — $26.4Additions to goodwill . . . . . . . . . . . . . . . . . . . . . . . . . . . . . . . . — — 17.9 1.9 6.2 26.0
Balance at December 31, 2014 . . . . . . . . . . . . . . . . . . . . . . . . . . $— $— $44.3 $1.9 $6.2 $52.4
As of December 31, 2013, xpedx had recognized accumulated impairment charges of $265.4 million, $57.1 million and$50.5 million related to its Print, Facility Solutions and Publishing segments, respectively. There were no goodwill impairment chargesfor the year ended December 31, 2014. Additions to goodwill in 2014 represent the preliminary goodwill resulting from the Merger.See Note 2, Merger with Unisource, for further details.
Other Intangible Assets
The components of the Company’s other intangible assets were as follows:
December 31, 2014 December 31, 2013
Gross GrossCarrying Accumulated Carrying AccumulatedAmount Amortization Net Amount Amortization Net(in millions)
Customer relationships . . . . . . . . . . . . . . . . . . . . . . . . . . . . . . . $55.0 $23.7 $31.3 $30.7 $21.5 $9.2Trademarks/Trade names . . . . . . . . . . . . . . . . . . . . . . . . . . . . . 4.3 1.1 3.2 0.2 0.1 0.1Non-compete agreements . . . . . . . . . . . . . . . . . . . . . . . . . . . . . 3.1 1.5 1.6 — — —
Total . . . . . . . . . . . . . . . . . . . . . . . . . . . . . . . . . . . . . . . . . $62.4 $26.3 $36.1 $30.9 $21.6 $9.3
Additions to other intangible assets in 2014 represent the preliminary identifiable intangible assets resulting from the Merger, asdiscussed in Note 2, Merger with Unisource.
The Company recorded amortization expense of $4.7 million, $1.5 million and $2.3 million during the years ended December 31,2014, 2013 and 2012, respectively.
The estimated aggregate amortization expense for each of the five succeeding years is as follows (in millions):
Year Total
2015 . . . . . . . . . . . . . . . . . . . . . . . . . . . . . . . . . . . . . . . . . . . . . . . . . . . . . . . . . . . . . . . . . . . . . . . $5.82016 . . . . . . . . . . . . . . . . . . . . . . . . . . . . . . . . . . . . . . . . . . . . . . . . . . . . . . . . . . . . . . . . . . . . . . . 3.62017 . . . . . . . . . . . . . . . . . . . . . . . . . . . . . . . . . . . . . . . . . . . . . . . . . . . . . . . . . . . . . . . . . . . . . . . 3.62018 . . . . . . . . . . . . . . . . . . . . . . . . . . . . . . . . . . . . . . . . . . . . . . . . . . . . . . . . . . . . . . . . . . . . . . . 3.62019 . . . . . . . . . . . . . . . . . . . . . . . . . . . . . . . . . . . . . . . . . . . . . . . . . . . . . . . . . . . . . . . . . . . . . . . 3.3
63

5. DEBT
The Company did not have any long-term debt obligations as of December 31, 2013. As of December 31, 2014, the Company’slong-term debt obligations were as follows:
December 31, 2014(in millions)ABL Facility . . . . . . . . . . . . . . . . . . . . . . . . . . . . . . . . . . . . . . . . . . . . . . . . . . . . . . . . . $847.8Equipment capital lease obligations . . . . . . . . . . . . . . . . . . . . . . . . . . . . . . . . . . . . . . . . . 11.0
Total debt . . . . . . . . . . . . . . . . . . . . . . . . . . . . . . . . . . . . . . . . . . . . . . . . . . . . . . . . . . . 858.8Less: current portion of long-term debt . . . . . . . . . . . . . . . . . . . . . . . . . . . . . . . . . . . . . . . (3.8)
Long-term debt, net of current maturities . . . . . . . . . . . . . . . . . . . . . . . . . . . . . . . . . . . . . $855.0
ABL Facility
In conjunction with the Spin-off and Merger, and to refinance existing debt of Unisource, Veritiv entered into a commitmentwith a group of lenders for a $1.4 billion asset-based lending facility (the ‘‘ABL Facility’’). The ABL Facility is comprised of U.S. andCanadian sub-facilities of $1,250.0 million and $150.0 million, respectively. The ABL Facility is available to be drawn in U.S. dollars,in the case of the U.S. sub-facilities, and in U.S. dollars or Canadian dollars, in the case of the Canadian sub-facilities, or in othercurrencies that are mutually agreeable. The Company’s accounts receivable and inventories in the U.S. and Canada are collateralunder the ABL Facility.
The ABL Facility will mature and the commitments thereunder will terminate after July 1, 2019; however, it provides for theright of the individual lenders to extend the maturity date of their respective commitments and loans upon the request of Veritiv andwithout the consent of any other lenders. The ABL Facility may be prepaid at Veritiv’s option at any time without premium orpenalty and is subject to mandatory prepayment if the amount outstanding under the ABL Facility exceeds either the aggregatecommitments with respect thereto or the current borrowing base, in an amount equal to such excess.
The ABL Facility has a springing minimum fixed charge coverage ratio of at least 1.00 to 1.00 on a trailing four-quarter basis,which will be tested only when specified availability is less than limits outlined under the ABL Facility. At December 31, 2014, theabove test was not applicable.
Availability under the ABL Facility is determined based upon a monthly borrowing base calculation which includes eligiblecustomer receivables and inventory, less outstanding borrowings, letters of credit and certain designated reserves. As of December 31,2014, the available additional borrowing capacity under the ABL Facility was approximately $392.0 million.
Under the terms of the ABL Facility, interest rates are based upon LIBOR or the prime rate plus a margin rate, or in the caseof Canada, a banker’s acceptance rate or base rate plus a margin rate. At December 31, 2014, the weighted-average borrowinginterest rate was 2.0%.
Financing and other related costs incurred in connection with the ABL Facility are reflected in other non-current assets in theConsolidated and Combined Balance Sheets and are amortized over the ABL Facility term. For the year ended December 31, 2014,interest expense, net in the Consolidated and Combined Statements of Operations included $2.2 million of amortization of deferredfinancing fees.
Senior Credit Facility
Unisource had an asset-based senior credit facility agreement (the ‘‘Senior Credit Facility’’) of which $303.9 million was drawnand outstanding as of July 1, 2014. On July 1, 2014, Veritiv assumed the Senior Credit Facility debt in connection with the Mergerand used a portion of the proceeds borrowed against the ABL Facility to repay all of the outstanding balance under the SeniorCredit Facility. Accordingly, the Senior Credit Facility expired on July 1, 2014 as a result of the prepayment.
64

6. LEASES
Lease Commitments
Future minimum lease payments at December 31, 2014 were as follows:
Financing Obligations Operating Leasesto Related Party andEquipment Capital Lease Sublease
Leases Obligations Income Total(in millions)2015 . . . . . . . . . . . . . . . . . . . . . . . . . . . . . . . . . . . . . . . . . . . . . . . . . . $20.7 $ 77.8 $(0.3) $ 77.52016 . . . . . . . . . . . . . . . . . . . . . . . . . . . . . . . . . . . . . . . . . . . . . . . . . . 19.8 68.1 (0.2) 67.92017 . . . . . . . . . . . . . . . . . . . . . . . . . . . . . . . . . . . . . . . . . . . . . . . . . . 19.4 58.3 (0.1) 58.22018 . . . . . . . . . . . . . . . . . . . . . . . . . . . . . . . . . . . . . . . . . . . . . . . . . . 8.9 49.4 (0.1) 49.32019 . . . . . . . . . . . . . . . . . . . . . . . . . . . . . . . . . . . . . . . . . . . . . . . . . . 0.4 40.7 — 40.7Thereafter . . . . . . . . . . . . . . . . . . . . . . . . . . . . . . . . . . . . . . . . . . . . . . 0.3 87.2 — 87.2
69.5 381.5 (0.7) 380.8Amount representing interest . . . . . . . . . . . . . . . . . . . . . . . . . . . . . . . . . (6.3) — — —
Total future minimum lease payments . . . . . . . . . . . . . . . . . . . . . . . . . . . $63.2 $381.5 $(0.7) $380.8
Financing Obligations to Related Party
In connection with Bain Capital Fund VII, L.P.’s acquisition of its 60% interest in UWWH on November 27, 2002, Unisourcetransferred 40 of its U.S. warehouse and distribution facilities (the ‘‘Properties’’) to Georgia-Pacific who then sold 38 of theProperties to an unrelated third-party (the ‘‘Purchaser/Landlord’’). Contemporaneously with the sale, Georgia-Pacific entered intolease agreements with the Purchaser/Landlord with respect to the individual 38 Properties and concurrently entered into subleaseagreements with Unisource, which are set to expire in June 2018. As a result of certain forms of continuing involvement, thesetransactions did not qualify for sale-leaseback accounting. Accordingly, the leases were classified as financing transactions. At the endof the lease term, the net remaining financing obligation of $174.0 million will be settled by the return of the assets to the Purchaser/Landlord.
The lease and sublease agreements also include rent schedules and escalation clauses throughout the lease and sublease terms.Subject to certain conditions, Unisource has the right to sublease any of the Properties. Under the terms of the lease and subleaseagreements, Georgia-Pacific and Unisource are responsible for all costs and expenses associated with the Properties, including theoperation, maintenance and repair, taxes and insurances. Currently, Unisource leases from Georgia-Pacific two remaining Propertiesthat are directly owned by Georgia-Pacific and has classified them as capital or operating leases in accordance with the accountingguidance.
Operating Leases
Certain properties and equipment are leased under cancelable and non-cancelable agreements. The Company recorded rentexpense of $92.4 million, $65.0 million and $64.4 million for the years ended December 31, 2014, 2013 and 2012, respectively.
65

7. INCOME TAXES
As described in Note 1, Business and Summary of Significant Accounting Policies, Veritiv was formed through a merger ofxpedx, previously a division of International Paper, and Unisource Worldwide, Inc. on July 1, 2014. Accordingly, the tax provisionincluded for the periods prior to July 1, 2014 include only the financial results of xpedx presented on a carve-out basis fromInternational Paper’s historical accounting records. For periods subsequent to July 1, 2014 the tax provision presents the consolidatedresults of Veritiv on a stand-alone basis.
The Company is subject to federal, state and local income taxes in the United States, as well as income taxes in Canada, Mexicoand other foreign jurisdictions. The domestic (United States) and foreign components of the Company’s income (loss) fromcontinuing operations before income taxes were as follows:
Year EndedDecember 31,
2014 2013 2012(in millions)Domestic (United States) . . . . . . . . . . . . . . . . . . . . . . . . . . . . . . . . . . . . . . . . . . . . $(19.0) $(2.1) $15.8Foreign . . . . . . . . . . . . . . . . . . . . . . . . . . . . . . . . . . . . . . . . . . . . . . . . . . . . . . . . . (2.6) 2.5 7.7
Income (loss) from continuing operations before income taxes . . . . . . . . . . . . . . . . . . . $(21.6) $ 0.4 $23.5
Income tax expense (benefit) in the Consolidated and Combined Statements of Operations consisted of the following:
Year EndedDecember 31,
2014 2013 2012(in millions)Current Provision:U.S. Federal . . . . . . . . . . . . . . . . . . . . . . . . . . . . . . . . . . . . . . . . . . . . . . . . . . . . . . . $ 5.0 $(3.3) $4.6U.S. State . . . . . . . . . . . . . . . . . . . . . . . . . . . . . . . . . . . . . . . . . . . . . . . . . . . . . . . . . 0.9 (0.1) 1.0Foreign . . . . . . . . . . . . . . . . . . . . . . . . . . . . . . . . . . . . . . . . . . . . . . . . . . . . . . . . . . 1.7 0.5 2.1
Total current income tax expense (benefit) . . . . . . . . . . . . . . . . . . . . . . . . . . . . . . . . . . $ 7.6 $(2.9) $7.7
Deferred, net:U.S. Federal . . . . . . . . . . . . . . . . . . . . . . . . . . . . . . . . . . . . . . . . . . . . . . . . . . . . . . . $(8.3) $ 3.0 $1.0U.S. State . . . . . . . . . . . . . . . . . . . . . . . . . . . . . . . . . . . . . . . . . . . . . . . . . . . . . . . . . (1.2) 0.2 0.3Foreign . . . . . . . . . . . . . . . . . . . . . . . . . . . . . . . . . . . . . . . . . . . . . . . . . . . . . . . . . . (0.2) 0.1 0.1
Total deferred, net . . . . . . . . . . . . . . . . . . . . . . . . . . . . . . . . . . . . . . . . . . . . . . . . . . . (9.7) 3.3 1.4
Provision for income tax expense (benefit) . . . . . . . . . . . . . . . . . . . . . . . . . . . . . . . . . . $(2.1) $ 0.4 $9.1
Reconciliation between the federal statutory rate and the effective tax rate is as follows:
Year Ended December 31,
2014 2013 2012(in millions)Income from continuing operations before income taxes . . . . . . . . . . . . . . . . . . . . . . . $(21.6) $ 0.4 $23.5Statutory U.S. income tax rate . . . . . . . . . . . . . . . . . . . . . . . . . . . . . . . . . . . . . . . . 35.0% 35.0% 35.0%Tax expense using statutory U.S. income tax rate . . . . . . . . . . . . . . . . . . . . . . . . . . . . $ (7.6) $ 0.1 $ 8.2Foreign income tax rate differential . . . . . . . . . . . . . . . . . . . . . . . . . . . . . . . . . . . . . 0.3 (0.1) (0.6)State tax (net of federal benefit) . . . . . . . . . . . . . . . . . . . . . . . . . . . . . . . . . . . . . . . (0.3) — 0.7Meals and entertainment . . . . . . . . . . . . . . . . . . . . . . . . . . . . . . . . . . . . . . . . . . . . 0.7 0.4 0.6Transaction costs . . . . . . . . . . . . . . . . . . . . . . . . . . . . . . . . . . . . . . . . . . . . . . . . . 1.6 — —Change in valuation allowance . . . . . . . . . . . . . . . . . . . . . . . . . . . . . . . . . . . . . . . . 2.0 — —Executive compensation . . . . . . . . . . . . . . . . . . . . . . . . . . . . . . . . . . . . . . . . . . . . . 0.9 — —Other . . . . . . . . . . . . . . . . . . . . . . . . . . . . . . . . . . . . . . . . . . . . . . . . . . . . . . . . . 0.3 — 0.2
Income tax provision . . . . . . . . . . . . . . . . . . . . . . . . . . . . . . . . . . . . . . . . . . . . . . . $ (2.1) $ 0.4 $ 9.1
Effective income tax rate . . . . . . . . . . . . . . . . . . . . . . . . . . . . . . . . . . . . . . . . . . . . 9.7% 100.0% 38.7%
66

7. INCOME TAXES (Continued)
Deferred income tax assets and liabilities as of December 31, 2014 and 2013 were as follows:
December 31, 2014 December 31, 2013
U.S. Non-U.S. U.S. Non-U.S.(in millions)Deferred income tax assets:
Accrued compensation . . . . . . . . . . . . . . . . . . . . . . . . . . . . . . . . . . . . . . . . . . . . . . $ 16.8 $ — $ 7.1 $ —Capital lease obligations to related party . . . . . . . . . . . . . . . . . . . . . . . . . . . . . . . . . . 86.8 0.8 — —Goodwill and other intangibles, net . . . . . . . . . . . . . . . . . . . . . . . . . . . . . . . . . . . . . . 5.7 — 18.2 —Property and equipment, net . . . . . . . . . . . . . . . . . . . . . . . . . . . . . . . . . . . . . . . . . . — 0.3 — —Long-term compensation . . . . . . . . . . . . . . . . . . . . . . . . . . . . . . . . . . . . . . . . . . . . . 15.2 6.0 8.3 —Net operating losses and credit carryforwards . . . . . . . . . . . . . . . . . . . . . . . . . . . . . . . 120.5 8.7 3.4 —Allowance for doubtful accounts . . . . . . . . . . . . . . . . . . . . . . . . . . . . . . . . . . . . . . . . 13.8 — 8.6 —Other . . . . . . . . . . . . . . . . . . . . . . . . . . . . . . . . . . . . . . . . . . . . . . . . . . . . . . . . . . 1.8 0.5 3.7 0.5
Gross deferred income tax assets . . . . . . . . . . . . . . . . . . . . . . . . . . . . . . . . . . . . . . . 260.6 16.3 49.3 0.5Less valuation allowance . . . . . . . . . . . . . . . . . . . . . . . . . . . . . . . . . . . . . . . . . . . . . (26.1) (15.7) — —
Total deferred tax asset . . . . . . . . . . . . . . . . . . . . . . . . . . . . . . . . . . . . . . . . . . . . . . . 234.5 0.6 49.3 0.5Deferred income tax liabilities:
Property and equipment, net . . . . . . . . . . . . . . . . . . . . . . . . . . . . . . . . . . . . . . . . . . (95.1) — (8.7) —Inventory reserve . . . . . . . . . . . . . . . . . . . . . . . . . . . . . . . . . . . . . . . . . . . . . . . . . . (50.1) — (31.9) —Prepaid assets . . . . . . . . . . . . . . . . . . . . . . . . . . . . . . . . . . . . . . . . . . . . . . . . . . . . (3.8) — — —Other . . . . . . . . . . . . . . . . . . . . . . . . . . . . . . . . . . . . . . . . . . . . . . . . . . . . . . . . . . (1.6) — — —
Total deferred tax liability . . . . . . . . . . . . . . . . . . . . . . . . . . . . . . . . . . . . . . . . . . . . . . $(150.6) $ — $(40.6) $ —
Net deferred income tax asset (liability) . . . . . . . . . . . . . . . . . . . . . . . . . . . . . . . . . . . . $ 83.9 $ 0.6 $ 8.7 $0.5
Deferred income tax asset valuation allowance is as follows:
Year Ended December 31,2014(in millions)
Balance at July 1, 2014 . . . . . . . . . . . . . . . . . . . . . . . . . . . . . . . . . . . . . . . . . . . . . . $39.8Additions . . . . . . . . . . . . . . . . . . . . . . . . . . . . . . . . . . . . . . . . . . . . . . . . . . . . . . . 2.0Subtractions . . . . . . . . . . . . . . . . . . . . . . . . . . . . . . . . . . . . . . . . . . . . . . . . . . . . . —
Balance at end of year . . . . . . . . . . . . . . . . . . . . . . . . . . . . . . . . . . . . . . . . . . . . . . $41.8
The Company recorded a valuation allowance on its deferred income tax assets as of December 31, 2014 of $41.8 million,comprised of $24.4 million against its U.S. federal net deferred tax assets, $1.7 million against its U.S. state net deferred tax assetsand $15.7 million against its foreign net deferred tax assets. There was no valuation allowance recorded as of December 31, 2013 and2012. As a result of the Merger, a significant change in the ownership of the Company occurred which, pursuant to the InternalRevenue Code, limits on an annual basis the Company’s ability to utilize its U.S. federal and state net operating loss carryforwards(‘‘NOLs’’). The Company’s NOLs will continue to be available to offset taxable income and tax liabilities (until such NOLs andcredits are either used or expire) subject to the Section 382 annual limitation. If the annual limitation amount is not fully utilized ina particular tax year, then the unused portion from that particular tax year will be added to the annual limitation in subsequentyears.
In analyzing the future realization of Veritiv’s deferred tax assets, management evaluated all available positive and negativeevidence and determined that it was more likely than not that the remaining deferred tax assets will be realized. In this analysis,management has considered reversals of deferred tax liabilities, projected future taxable income, available tax-planning strategies, andresults of recent operations. In projecting future taxable income, management begins with historical results and incorporatesassumptions about the amount of future federal, state and foreign pre-tax operating income. The assumptions about future taxableincome require significant judgment and are consistent with Veritiv’s plans and estimates used to manage the underlying businesses.
67

7. INCOME TAXES (Continued)
In general, it is the practice and intention of Veritiv to reinvest the earnings of its non-U.S. subsidiaries in those operations. Asof December 31, 2014, Veritiv’s tax basis is in excess of its financial reporting basis of certain investments in non-U.S. subsidiaries.The Company does not believe these temporary differences will reverse in the foreseeable future and, therefore, no deferred taxasset has been recognized with respect to these basis differences. The Company does have unremitted foreign earnings ofapproximately $20.4 million with respect to certain of its non-U.S. subsidiaries that would be taxable as dividends if repatriated to theU.S. The estimated income and withholding tax liability associated with the remittance of these earnings would be approximately$8.0 million. The Company has not recorded a deferred tax liability associated with these unremitted earnings.
Veritiv applies a ‘‘more likely than not’’ threshold to the recognition and de-recognition of uncertain tax positions. A change injudgment related to prior years’ uncertain tax positions is recognized in the period of such change. The following table presents therollforward of activity for the years ended December 31, 2014, 2013 and 2012 for uncertain tax positions:
Year EndedDecember 31,
2014 2013 2012(in millions)Beginning of period . . . . . . . . . . . . . . . . . . . . . . . . . . . . . . . . . . . . . . . . . . . . . . . . . $(0.6) $(1.7) $(1.4)Additions based on tax positions taken during the current period . . . . . . . . . . . . . . . . . . — — (0.3)Reductions based on tax positions taken during a prior period . . . . . . . . . . . . . . . . . . . . 0.6 — —Additions based on tax positions taken during a prior period . . . . . . . . . . . . . . . . . . . . . (1.0) — —Lapses of statutes of limitations . . . . . . . . . . . . . . . . . . . . . . . . . . . . . . . . . . . . . . . . . — 1.1 —
Total gross unrecognized tax benefit . . . . . . . . . . . . . . . . . . . . . . . . . . . . . . . . . . . . . . $(1.0) $(0.6) $(1.7)
Included in the balance as of December 31, 2013 and December 31, 2012 are $0.6 million and $1.7 million, respectively, for taxpositions for which the ultimate benefits are highly certain, but for which there is uncertainty about the timing of such benefits.There are no such amounts included in the balance as of December 31, 2014. However, except for the possible effect of anypenalties, any disallowance that would change the timing of these benefits would not affect the annual effective tax rate, but wouldaccelerate the payment of cash to the taxing authority to an earlier period. Included in the balance of unrecognized tax benefits as ofDecember 31, 2014 is $1.0 million of tax benefits that, if recognized, would affect the effective tax rate. There are no such amountsas of December 31, 2013 or 2012.
The Company accrues interest on unrecognized tax benefits as a component of interest expense. Penalties, if incurred, arerecognized as a component of income tax expense. The Company recorded interest of $0.6 million as of December 31, 2014 and lessthan $0.1 million as of December 31, 2013 and 2012. Additionally, the Company recorded penalties as of December 31, 2014 of$0.2 million. The Company did not record any penalties as of December 31, 2013 and 2012.
During 2015, Veritiv expects to resolve certain tax matters related to U.S. and foreign jurisdictions. As of December 31, 2014,Veritiv estimates that it is reasonably possible that unrecognized tax benefits may decrease by $0.3 million in the next twelve monthsdue to the resolution of these issues or due to a lapse in the statute of limitations. With the exception of these tax matters, Veritivdoes not expect any significant changes in unrecognized tax benefits in 2015.
In the U.S., Veritiv is generally subject to examination by the Internal Revenue Service (‘‘IRS’’) and certain states for fiscal years2010 and later; however, it may be subject to IRS and state tax authority adjustments for years prior to 2010 to the extent of lossesor other tax attributes carrying forward from the earlier years. Unisource Canada remains subject to examination by the CanadianRevenue Agency for fiscal years 2010 and later and certain provinces for fiscal years 2009 and later.
As of December 31, 2014, Veritiv has federal, state and foreign income tax NOLs, available to offset future taxable income, of$312.5 million, $230.0 million and $34.4 million which will expire at various dates from 2015 through 2034, with the exception ofcertain foreign NOLs that do not expire but have a full valuation allowance.
On September 13, 2013, the U.S. Treasury Department and the IRS issued final regulations that address costs incurred inacquiring, producing, or improving tangible property (the ‘‘tangible property regulations’’). The tangible property regulations aregenerally effective for tax years beginning on or after January 1, 2014. The estimated tax impact of these accounting method changeshas an immaterial effect on non-current deferred tax assets, with a corresponding reduction in current taxes payable, and has beenreflected in the Consolidated and Combined Balance Sheet as of December 31, 2014.
68

8. RELATED PARTY TRANSACTIONS
Agreements with the UWWH Stockholder
As described in Note 1, Business and Summary of Significant Accounting Policies, on the Distribution Date the UWWHStockholder, the sole shareholder of UWWH, received 7,840,000 shares of Veritiv common stock for all outstanding shares ofUWWH common stock that it held in a private placement transaction. Additionally, Veritiv and the UWWH Stockholder executedthe following agreements:
• Registration Rights Agreement: The Registration Rights Agreement provides the UWWH Stockholder with certain demand andpiggyback registration rights. Under this Agreement, the UWWH Stockholder is also entitled to transfer its Veritiv commonstock to one or more of its affiliates or equity-holders and may exercise registration rights on behalf of such transferees if suchtransferees become a party to the Registration Rights Agreement. The UWWH Stockholder, on behalf of the holders ofshares of Veritiv’s common stock that are party to the Registration Rights Agreement, under certain circumstances andprovided certain thresholds described in the Registration Rights Agreement are met, may make a written request to theCompany for the registration of the offer and sale of all or part of the shares subject to such registration rights. If theCompany registers the offer and sale of its common stock (other than pursuant to a demand registration or in connection withregistration on Form S-4 and Form S-8 or any successor or similar forms, or relating solely to the sale of debt or convertibledebt instruments) either on its behalf or on the behalf of other security holders, the holders of the registration rights underthe Registration Rights Agreement are entitled to include their shares in such registration. The demand rights describedcommenced 180 days after the Distribution Date. Veritiv is not required to effect more than one demand registration in any150-day period or more than two demand registrations in any 365-day period. If Veritiv believes that a registration or anoffering would materially affect a significant transaction or would require it to disclose confidential information which it ingood faith believes would be adverse to its interest, then Veritiv may delay a registration or filing for no more than 120 daysin a 360-day period.
• Tax Receivable Agreement: The Tax Receivable Agreement sets forth the terms by which Veritiv generally will be obligated topay the UWWH Stockholder an amount equal to 85% of the U.S. federal, state and Canadian income tax savings that Veritivactually realizes as a result of the utilization of Unisource Worldwide, Inc.’s net operating losses attributable to taxable periodsprior to the date of the Merger. For purposes of the Tax Receivable Agreement, Veritiv’s income tax savings will generally becomputed by comparing Veritiv’s actual aggregate U.S. federal, state and Canadian income tax liability for taxable periods (orportions thereof) beginning after the date of the Merger to the amount of Veritiv’s aggregate U.S. federal, state and Canadianincome tax liability for the same periods had Veritiv not been able to utilize Unisource Worldwide, Inc.’s net operating lossesattributable to taxable periods prior to the date of the Merger. Veritiv will pay to the UWWH Stockholder an amount equalto 85% of such tax savings, plus interest at a rate of LIBOR plus 1.00%, computed from the earlier of the date that Veritivfiled its U.S. federal income tax return for the applicable taxable year and the date that such tax return was due (withoutextensions) until payments are made. Under the Tax Receivable Agreement, the UWWH Stockholder will not be required toreimburse Veritiv for any payments previously made if such tax benefits are subsequently disallowed or adjusted (althoughfuture payments under the Tax Receivable Agreement would be adjusted to the extent possible to reflect the result of suchdisallowance or adjustment). The Tax Receivable Agreement will be binding on and adapt to the benefit of any permittedassignees of the UWWH Stockholder and to any successors to any of the parties of the Tax Receivable Agreement to thesame extent as if such permitted assignee or successor had been an original party to the Tax Receivable Agreement.
Transactions with Georgia-Pacific
Veritiv purchases certain inventory items from, and sells certain inventory items to, Georgia-Pacific in the normal course ofbusiness. As a result of the Merger, Georgia-Pacific is a related party. For the year ended December 31, 2014, the Company soldproducts to Georgia-Pacific in the amount of $18.4 million, reflected in net sales. For the year ended December 31, 2014, theCompany purchased and recognized in cost of products sold inventory from Georgia-Pacific of $136.1 million. The aggregate amountof inventories purchased from Georgia-Pacific that remained on Veritiv’s Consolidated Balance Sheet was $26.6 million as ofDecember 31, 2014. Related party payable to and receivable from Georgia-Pacific were $11.0 million and $3.9 million, as ofDecember 31, 2014, respectively.
See Note 6, Leases, for information on the Company’s financing obligations to Georgia-Pacific.
69

8. RELATED PARTY TRANSACTIONS (Continued)
Relationship between Veritiv and International Paper
Transactions with International Paper
Prior to the Spin-off, xpedx purchased certain inventory items from, and sold certain inventory items to, International Paper inthe normal course of business. For the years ended December 31, 2014, 2013 and 2012, the Company sold products to InternationalPaper in the amount of $24.3 million, $53.0 million and $65.1 million, respectively, reflected in net sales. For the years endedDecember 31, 2014, 2013 and 2012, the Company purchased and recognized in cost of products sold inventory from InternationalPaper of $276.5 million, $604.4 million and $639.0 million, respectively. As of December 31, 2013, the aggregate amount ofinventories purchased from International Paper that remained on the Company’s Combined Balance Sheet was $48.5 million. Relatedparty payable to and receivable from International Paper were $2.6 million and $10.1 million as of December 31, 2013, respectively.After the Spin-off and the Merger, Veritiv continues to purchase and sell certain inventory items to International Paper that areconsidered transactions in the normal course of the Company’s operations. While the Company and International Paper have enteredinto a transition services agreement, International Paper is not considered a related party subsequent to the Spin-off.
Parent Company Investment
Net transfers (to) from International Paper are included within Parent company equity on the Combined Balance Sheet as ofDecember 31, 2013. The components of net transfers (to) from Parent for the years ended December 31, 2014, 2013 and 2012, wereas follows:
Year Ended December 31,
2014 2013 2012(in millions)Intercompany sales and purchases, net . . . . . . . . . . . . . . . . . . . . . . . . . . . . . . . . $ 255.4 $ 556.6 $ 575.2Cash pooling and general financing activities . . . . . . . . . . . . . . . . . . . . . . . . . . . . (322.5) (675.8) (695.4)Corporate allocations including income taxes . . . . . . . . . . . . . . . . . . . . . . . . . . . 34.7 84.1 84.8Net adjustments in conjunction with the Spin-off . . . . . . . . . . . . . . . . . . . . . . . . . (49.6) — —
Total net transfers to International Paper . . . . . . . . . . . . . . . . . . . . . . . . . . . . . . $ (82.0) $ (35.1) $ (35.4)
In 2011, xpedx borrowed approximately $20.3 million from the Parent in the form of Promissory Notes. On December 31, 2013,xpedx entered into a General Conveyance Agreement with its Parent whereby the debt was assumed by the Parent.
In conjunction with the Spin-off, certain xpedx assets and liabilities were retained by International Paper. Such assets andliabilities were identified and quantified in accordance with the terms agreed to in the Contribution and Distribution Agreement(‘‘C&DA’’) dated January 28, 2014, entered into by International Paper, xpedx Holding Company, UWWH and the UWWHStockholder. Additionally, in accordance with the C&DA, the parties agreed to settle, within 30 days of the Distribution Date, allintercompany balances outstanding between International Paper and xpedx as of the Distribution Date, determined based on anagreed-upon formula. The net effect of assets and liabilities retained and adjustments to intercompany balances as of the DistributionDate are reflected in the table above in the net adjustments in conjunction with the Spin-off. These primarily include $24.3 million ofnet assets transferred to International Paper and settlement of intercompany balances of $24.6 million as of the Distribution Date.
Allocation of General Corporate Expenses
Prior to the Spin-off, the xpedx financial statements included expense allocations for certain functions previously provided byInternational Paper, including, but not limited to, general corporate expenses related to finance, legal, information technology,human resources, communications, insurance and stock-based compensation. These expenses were allocated on the basis of directusage when identifiable, with the remainder principally allocated on the basis of percent of capital employed, headcount, sales orother measures. Prior to the Spin-off, $25.5 million, $84.0 million and $78.4 million of expenses were allocated to xpedx and wereincluded within selling and administrative expenses in the Consolidated and Combined Statements of Operations for the years endedDecember 31, 2014, 2013 and 2012.
70

8. RELATED PARTY TRANSACTIONS (Continued)
Separation Agreements with Former Unisource CEO
Effective as of the Distribution Date, Allan R. Dragone, Jr. ceased to be the Chief Executive Officer of Unisource and becamea member of Veritiv’s Board of Directors. Under his then existing employment agreement with Unisource, Mr. Dragone was entitledto receive severance benefits, subject to his execution and non-revocation of a general release of claims against Unisource, theCompany and International Paper. Under a Separation and Non-Competition Agreement entered into between the Company andMr. Dragone as of June 30, 2014 (the ‘‘Separation Agreement’’), Mr. Dragone received an additional $3.0 million in severance payand agreed to be bound by the restrictive covenants set forth in the Separation Agreement. For the year ended December 31, 2014,the Company recognized $5.4 million in expense related to Mr. Dragone’s employment agreement and the Separation Agreement,which is reflected in merger and integration expenses in the Consolidated and Combined Statements of Operations. In addition, aspart of his employment agreement, Mr. Dragone exercised his right to sell his personal residence to the Company. The Companycompleted the purchase of the residence on February 10, 2015.
9. EMPLOYEE BENEFIT PLANS
Defined Contribution Plans
Veritiv sponsors qualified defined contribution plans covering its employees in the U.S. and Canada. The defined contributionplans allow eligible employees to contribute a portion of their salary to the plans and Veritiv makes matching contributions toparticipant accounts on a specified percentage of employee deferrals as determined by the provisions of each plan.
Prior to the Spin-off, certain employees of xpedx participated in defined contribution plans sponsored by International Paper.International Paper’s matching contributions to the plans totaled approximately $8.9 million, $16.7 million and $17.3 million for theyears ended December 31, 2014, 2013 and 2012, respectively. After the Spin-off, xpedx employees commenced participating in theVeritiv defined contribution plan (formerly known as Unisource plan). The assets of the xpedx employees under International Paperplans were transferred to Veritiv’s plan. For the year ended December 31, 2014, Veritiv’s matching contributions to this plan totaled$5.6 million.
In conjunction with the Merger, Veritiv assumed responsibility for Unisource’s defined contribution retirement plans in the U.S.and Canada. Veritiv’s total contribution to these plans was $2.4 million for the year ended December 31, 2014.
Deferred Compensation Savings Plans
In conjunction with the Merger, Veritiv assumed responsibility for Unisource’s legacy deferred compensation savings plan.Unisource maintained deferred compensation obligations for certain employees from its past acquisitions. Unisource agreed to paythese employees deferred compensation in return for services rendered prior to their retirement. In general, the payout terms variedfor each employee agreement and were paid in monthly or annual installments ranging up to 15 years from the date of eligibility.
For the year ended December 31, 2014, the cost of the deferred compensation agreements was $2.0 million. The deferredcompensation liability as of December 31, 2014 was $20.9 million with $2.7 million included in other accrued liabilities and$18.2 million included in other non-current liabilities in the Consolidated and Combined Balance Sheets.
Effective January 1, 2015, Veritiv established a deferred compensation savings plan which provides for the deferral of salaries,commissions or bonuses of eligible non-union employees.
Defined Benefit Plans
At December 31, 2014, Veritiv did not maintain any active defined benefit plans for its non-union employees.
Certain of xpedx’s employees participated in defined benefit pension and other post-retirement benefit plans sponsored andaccounted for by International Paper. In conjunction with the Spin-off, the above plans were frozen for the xpedx employees, andInternational Paper retained the associated liabilities. Certain xpedx union employees were added as participants to the Unisource’sdefined benefit pension plan. The amount of net pension and other post-employment benefit
71

9. EMPLOYEE BENEFIT PLANS (Continued)
expense attributable to xpedx related to the International Paper sponsored plans was $8.0 million, $15.1 million and $12.7 million forthe years ended December 31, 2014, 2013 and 2012, respectively.
In conjunction with the Merger, Veritiv assumed responsibility for Unisource’s defined benefit plans and Supplemental ExecutiveRetirement Plans (‘‘SERP’’) in the U.S. and Canada. Except as discussed below, these plans were frozen prior to the Merger.
Unisource sponsored a defined benefit pension plan for its non-union and union employees and a SERP for certain highlycompensated employees. On September 26, 2013, the U.S. defined benefit pension plan received actuarial certification that eligibleU.S. non-union participants were permitted to receive lump sum payments for their full cash balance accounts. Expected benefitpayments in the U.S. plan assume that vested terminated participants will take lump sum payments at retirement age. Unionemployees continue to accrue benefits under the U.S. defined benefit pension plan in accordance with their collective bargainingagreements.
In Canada, Unisource sponsored one non-union and two union defined benefit plans also known as Registered Pension Plans.Additionally, Unisource maintained a nonregistered SERP for certain highly compensated employees in Canada that providedpension benefits in excess of the registered plan compensation limits. The non-union defined benefit plan and the SERP plan werefrozen for service credit, but participants were still eligible for early retirement benefits, and final average earnings continued to beused for calculating retirement benefits. The Canada union defined benefit plans were frozen for new participants under the twocollective bargaining agreements.
Benefit Obligations and Funded Status
The following table provides information about the Unisource U.S. and Canadian defined benefit pension and SERP plansassumed by Veritiv due to the Merger:
U.S. Canada(in millions)Accumulated benefit obligation at December 31, 2014 . . . . . . . . . . . . . . . . . . . . . . . . . . . . . $ 93.7 $ 79.0
Change in projected benefit obligation:Benefit obligation at July 1, 2014 . . . . . . . . . . . . . . . . . . . . . . . . . . . . . . . . . . . . . . . . . . . . $ 87.9 $ 92.7
Service cost . . . . . . . . . . . . . . . . . . . . . . . . . . . . . . . . . . . . . . . . . . . . . . . . . . . . . . . . . 0.4 0.1Interest cost . . . . . . . . . . . . . . . . . . . . . . . . . . . . . . . . . . . . . . . . . . . . . . . . . . . . . . . . 1.7 1.9Actuarial loss . . . . . . . . . . . . . . . . . . . . . . . . . . . . . . . . . . . . . . . . . . . . . . . . . . . . . . . 5.9 4.4Benefits paid . . . . . . . . . . . . . . . . . . . . . . . . . . . . . . . . . . . . . . . . . . . . . . . . . . . . . . . . (2.0) (2.0)Settlements . . . . . . . . . . . . . . . . . . . . . . . . . . . . . . . . . . . . . . . . . . . . . . . . . . . . . . . . . (0.2) —Foreign exchange adjustments . . . . . . . . . . . . . . . . . . . . . . . . . . . . . . . . . . . . . . . . . . . . — (7.7)
Projected benefit obligation at December 31, 2014 . . . . . . . . . . . . . . . . . . . . . . . . . . . . . . . . $ 93.7 $ 89.4
Change in plan assets:Plan assets at July 1, 2014 . . . . . . . . . . . . . . . . . . . . . . . . . . . . . . . . . . . . . . . . . . . . . . . . $ 81.6 $ 68.7
Employer contributions . . . . . . . . . . . . . . . . . . . . . . . . . . . . . . . . . . . . . . . . . . . . . . . . . 0.8 2.0Investment returns . . . . . . . . . . . . . . . . . . . . . . . . . . . . . . . . . . . . . . . . . . . . . . . . . . . . 0.4 4.1Benefits paid . . . . . . . . . . . . . . . . . . . . . . . . . . . . . . . . . . . . . . . . . . . . . . . . . . . . . . . . (2.0) (2.0)Administrative expenses paid . . . . . . . . . . . . . . . . . . . . . . . . . . . . . . . . . . . . . . . . . . . . . (0.4) —Settlements . . . . . . . . . . . . . . . . . . . . . . . . . . . . . . . . . . . . . . . . . . . . . . . . . . . . . . . . . (0.2) —Currency translation adjustments . . . . . . . . . . . . . . . . . . . . . . . . . . . . . . . . . . . . . . . . . . — (6.4)
Plan assets at December 31, 2014 . . . . . . . . . . . . . . . . . . . . . . . . . . . . . . . . . . . . . . . . . . . $ 80.2 $ 66.4
Underfunded status at December 31, 2014 . . . . . . . . . . . . . . . . . . . . . . . . . . . . . . . . . . . . . $(13.5) $(23.0)
72

9. EMPLOYEE BENEFIT PLANS (Continued)
Balance Sheet Positions
December 31,2014
U.S. Canada(in millions)Amounts recognized in the Consolidated and Combined Balance Sheets consist of:Other current liabilities . . . . . . . . . . . . . . . . . . . . . . . . . . . . . . . . . . . . . . . . . . . . . . . . . . . $ 0.1 $ 0.1Defined benefit pension obligations . . . . . . . . . . . . . . . . . . . . . . . . . . . . . . . . . . . . . . . . . . 13.4 22.9
Net liability recognized . . . . . . . . . . . . . . . . . . . . . . . . . . . . . . . . . . . . . . . . . . . . . . . . . . . $13.5 $23.0
December 31,2014
U.S. Canada(in millions)Amounts not yet reflected in net periodic benefit cost and included in AOCI consist of:Net loss, net of tax . . . . . . . . . . . . . . . . . . . . . . . . . . . . . . . . . . . . . . . . . . . . . . . . . . . . . . . $5.2 $2.2
Net Periodic Cost
Total net periodic pension cost associated with the defined benefit pension and SERP plans is summarized below:
Year EndedDecember 31,
2014
U.S. Canada(in millions)Components of net periodic benefit cost:
Service cost . . . . . . . . . . . . . . . . . . . . . . . . . . . . . . . . . . . . . . . . . . . . . . . . . . . . . . . . . $ 0.8 $ 0.1Interest cost . . . . . . . . . . . . . . . . . . . . . . . . . . . . . . . . . . . . . . . . . . . . . . . . . . . . . . . . . 1.7 1.9Expected return on plan assets . . . . . . . . . . . . . . . . . . . . . . . . . . . . . . . . . . . . . . . . . . . . (3.1) (1.9)
Net periodic benefit cost (credit) . . . . . . . . . . . . . . . . . . . . . . . . . . . . . . . . . . . . . . . . . . . $(0.6) $ 0.1
Veritiv does not expect any amounts in AOCI to be recognized as components of net periodic pension cost in 2015.
Fair Value of Plan Assets
U.S. and Canada pension plan assets are primarily invested in broad-based mutual funds and pooled funds comprised of U.S.and non-U.S. equities, U.S. and non-U.S. high-quality and high-yield fixed income securities, and short-term interest bearingsecurities or deposits.
The underlying investments of the plan assets are either valued using quoted prices in active markets (Level 1) or valued as ofthe most recent trade date (Level 2). The following table presents Veritiv’s plan assets using the fair value hierarchy as ofDecember 31, 2014:
Total Level 1 Level 2 Level 3(in millions)Investments—U.S.:
Equity securities . . . . . . . . . . . . . . . . . . . . . . . . . . . . . . . . . . . . . . . . . $53.3 $53.3 $— $—Fixed income securities . . . . . . . . . . . . . . . . . . . . . . . . . . . . . . . . . . . . . 26.7 26.7 — —Cash and short-term securities . . . . . . . . . . . . . . . . . . . . . . . . . . . . . . . . 0.2 0.2 — —
Total . . . . . . . . . . . . . . . . . . . . . . . . . . . . . . . . . . . . . . . . . . . . . . . . . . . $80.2 $80.2 $— $—
73
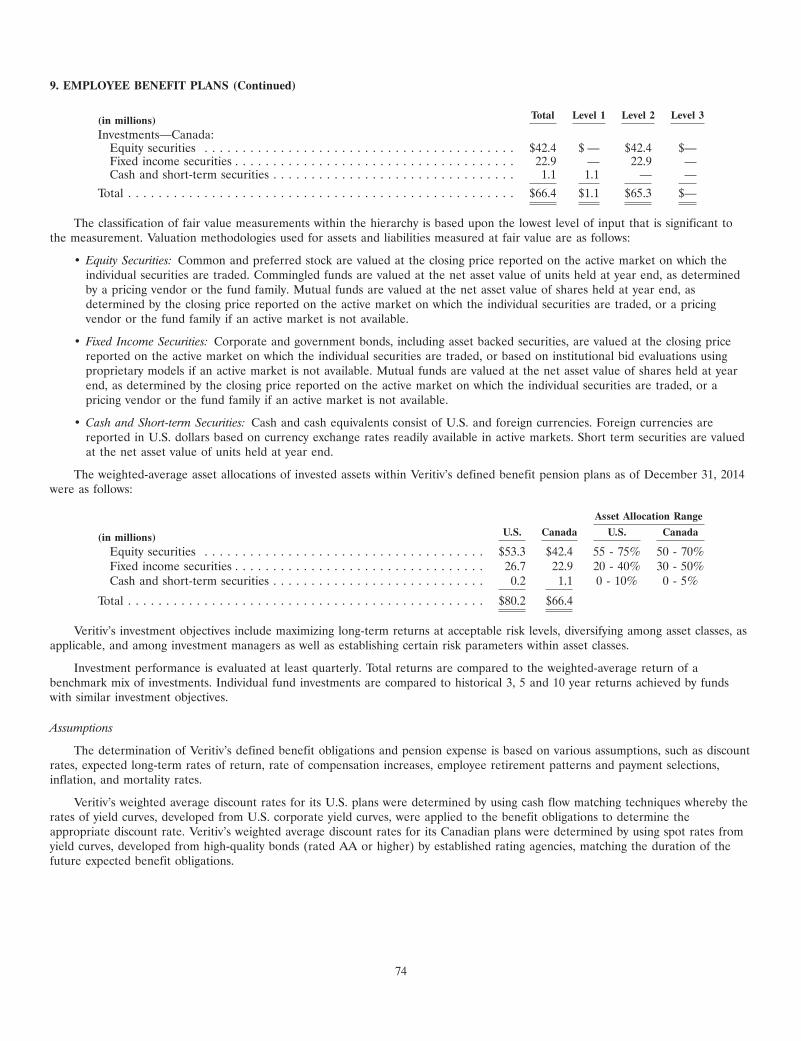
9. EMPLOYEE BENEFIT PLANS (Continued)
Total Level 1 Level 2 Level 3(in millions)Investments—Canada:
Equity securities . . . . . . . . . . . . . . . . . . . . . . . . . . . . . . . . . . . . . . . . . $42.4 $ — $42.4 $—Fixed income securities . . . . . . . . . . . . . . . . . . . . . . . . . . . . . . . . . . . . . 22.9 — 22.9 —Cash and short-term securities . . . . . . . . . . . . . . . . . . . . . . . . . . . . . . . . 1.1 1.1 — —
Total . . . . . . . . . . . . . . . . . . . . . . . . . . . . . . . . . . . . . . . . . . . . . . . . . . . $66.4 $1.1 $65.3 $—
The classification of fair value measurements within the hierarchy is based upon the lowest level of input that is significant tothe measurement. Valuation methodologies used for assets and liabilities measured at fair value are as follows:
• Equity Securities: Common and preferred stock are valued at the closing price reported on the active market on which theindividual securities are traded. Commingled funds are valued at the net asset value of units held at year end, as determinedby a pricing vendor or the fund family. Mutual funds are valued at the net asset value of shares held at year end, asdetermined by the closing price reported on the active market on which the individual securities are traded, or a pricingvendor or the fund family if an active market is not available.
• Fixed Income Securities: Corporate and government bonds, including asset backed securities, are valued at the closing pricereported on the active market on which the individual securities are traded, or based on institutional bid evaluations usingproprietary models if an active market is not available. Mutual funds are valued at the net asset value of shares held at yearend, as determined by the closing price reported on the active market on which the individual securities are traded, or apricing vendor or the fund family if an active market is not available.
• Cash and Short-term Securities: Cash and cash equivalents consist of U.S. and foreign currencies. Foreign currencies arereported in U.S. dollars based on currency exchange rates readily available in active markets. Short term securities are valuedat the net asset value of units held at year end.
The weighted-average asset allocations of invested assets within Veritiv’s defined benefit pension plans as of December 31, 2014were as follows:
Asset Allocation Range
U.S. Canada U.S. Canada(in millions)Equity securities . . . . . . . . . . . . . . . . . . . . . . . . . . . . . . . . . . . . . $53.3 $42.4 55 - 75% 50 - 70%Fixed income securities . . . . . . . . . . . . . . . . . . . . . . . . . . . . . . . . . 26.7 22.9 20 - 40% 30 - 50%Cash and short-term securities . . . . . . . . . . . . . . . . . . . . . . . . . . . . 0.2 1.1 0 - 10% 0 - 5%
Total . . . . . . . . . . . . . . . . . . . . . . . . . . . . . . . . . . . . . . . . . . . . . . . $80.2 $66.4
Veritiv’s investment objectives include maximizing long-term returns at acceptable risk levels, diversifying among asset classes, asapplicable, and among investment managers as well as establishing certain risk parameters within asset classes.
Investment performance is evaluated at least quarterly. Total returns are compared to the weighted-average return of abenchmark mix of investments. Individual fund investments are compared to historical 3, 5 and 10 year returns achieved by fundswith similar investment objectives.
Assumptions
The determination of Veritiv’s defined benefit obligations and pension expense is based on various assumptions, such as discountrates, expected long-term rates of return, rate of compensation increases, employee retirement patterns and payment selections,inflation, and mortality rates.
Veritiv’s weighted average discount rates for its U.S. plans were determined by using cash flow matching techniques whereby therates of yield curves, developed from U.S. corporate yield curves, were applied to the benefit obligations to determine theappropriate discount rate. Veritiv’s weighted average discount rates for its Canadian plans were determined by using spot rates fromyield curves, developed from high-quality bonds (rated AA or higher) by established rating agencies, matching the duration of thefuture expected benefit obligations.
74

9. EMPLOYEE BENEFIT PLANS (Continued)
Veritiv’s weighted-average expected rate of return was developed based on several factors, including projected and historicalrates of returns, investment allocations of pension plan assets and inflation expectations. Veritiv evaluates the expected rate of returnassumptions on an annual basis.
The following table presents significant weighted-average assumptions used in computing the benefit obligations:
Year EndedDecember 31,
2014
U.S. Canada
Discount rate . . . . . . . . . . . . . . . . . . . . . . . . . . . . . . . . . . . . . . . . . . . . . . . . . . . . . . . . . . 3.75% 4.00%Rate of compensation increases . . . . . . . . . . . . . . . . . . . . . . . . . . . . . . . . . . . . . . . . . . . . . . N/A 3.00%
The following table presents significant weighted-average assumptions used in computing net periodic benefit cost:
Year EndedDecember 31,
2014
U.S. Canada
Discount rate . . . . . . . . . . . . . . . . . . . . . . . . . . . . . . . . . . . . . . . . . . . . . . . . . . . . . . . . . . 4.05% 4.30%Rate of compensation increases . . . . . . . . . . . . . . . . . . . . . . . . . . . . . . . . . . . . . . . . . . . . . . N/A 3.00%Expected long-term rate of return on assets . . . . . . . . . . . . . . . . . . . . . . . . . . . . . . . . . . . . . . 8.00% 5.75%
Cash Flows
Veritiv expects to contribute $0.1 million and $3.9 million to its U.S. and Canadian defined benefit pension and SERP plans,respectively, during 2015. Future benefit payments under the defined benefit pension and SERP plans are estimated as follows:
U.S. Canada(in millions)2015 . . . . . . . . . . . . . . . . . . . . . . . . . . . . . . . . . . . . . . . . . . . . . . . . . . . . . . . . . . . . . . . . $ 6.6 $ 2.52016 . . . . . . . . . . . . . . . . . . . . . . . . . . . . . . . . . . . . . . . . . . . . . . . . . . . . . . . . . . . . . . . . 4.7 2.72017 . . . . . . . . . . . . . . . . . . . . . . . . . . . . . . . . . . . . . . . . . . . . . . . . . . . . . . . . . . . . . . . . 4.8 2.82018 . . . . . . . . . . . . . . . . . . . . . . . . . . . . . . . . . . . . . . . . . . . . . . . . . . . . . . . . . . . . . . . . 4.8 2.92019 . . . . . . . . . . . . . . . . . . . . . . . . . . . . . . . . . . . . . . . . . . . . . . . . . . . . . . . . . . . . . . . . 4.9 3.02020 - 2024 . . . . . . . . . . . . . . . . . . . . . . . . . . . . . . . . . . . . . . . . . . . . . . . . . . . . . . . . . . . 27.4 18.3
Multi-employer Plans
In conjunction with the Merger, Veritiv assumed responsibility for Unisource’s multi-employer plans. Veritiv’s contributions were$3.2 million, $2.5 million and $2.6 million for the years ended December 31, 2014, 2013 and 2012, respectively. It is reasonablypossible that changes to Veritiv employees covered under these plans might result in additional contribution obligations to theseplans. Any such obligations would be governed by the specific agreement between Veritiv and any such plan. Veritiv’s contributionsdid not represent more than 5% of total contributions to any multi-employer plans. At the date these Consolidated and CombinedFinancial Statements were issued, Forms 5500 were not available for the plan years ending in 2014.
The risks of participating in these multi-employer pension plans are different from a single employer plan in the followingaspects:
• Assets contributed to the multi-employer plans by one employer may be used to provide benefits to employees of otherparticipating employers,
• If a participating employer ceases contributing to the plan, the unfunded obligations of the plan may be inherited by theremaining participating employers, and
• If the Company stops participating in any of the multi-employer plans, the Company may be required to pay those plans anamount based on the underfunded status of the plan, referred to as a withdrawal liability.
75

9. EMPLOYEE BENEFIT PLANS (Continued)
Veritiv’s participation in the multi-employer plans for the year ended December 31, 2014 is outlined in the table below. The‘‘EIN/Pension Plan Number’’ column provides the Employee Identification Number and the three-digit plan number, if applicable.The Pension Protection Act zone listed below is based on the latest information Veritiv received from the plan and is certified by theplan’s actuary. Plans in the red zone are generally less than 65% funded, plans in the yellow zone are less than 80% funded andplans in the green zone are at least 80% funded. The ‘‘FIP/RP Status Pending/Implemented’’ column indicates plans for which afinancial improvement plan or a rehabilitation plan is either pending or has been implemented. The last column lists the expirationdate(s) of the collective-bargaining agreement(s).
ExpirationPension FIP/RP Date(s) ofVeritiv’sProtection Status CollectiveContributions(in millions) EIN/Pension Act Zone Pending/ Surcharge Bargaining
Pension Fund Plan No. Status Implemented 2014 2013 2012 Imposed Agreement(s)
Western Conference of Teamsters Pension Trust 9/30/2013 -Fund(1) . . . . . . . . . . . . . . . . . . . . . . . . . . . . 916145047/001 Green No $1.5 $1.2 $1.3 No 1/31/2017
Central States, Southeast & Southwest Areas 2/28/2015 -Pension Fund . . . . . . . . . . . . . . . . . . . . . . . . . 366044243/001 Red Implemented 0.3 0.2 0.2 Yes 11/30/2016
3/31/2015 -Teamsters Pension Plan of Philadelphia & Vicinity . 231511735/001 Yellow Implemented 0.3 0.3 0.3 Yes 7/31/2015Graphic Arts Industry Joint Pension Trust . . . . . . . 521074215/001 Red Implemented 0.1 0.1 0.1 Yes 6/16/2016New England Teamsters & Trucking Industry 9/30/2017 &
Pension . . . . . . . . . . . . . . . . . . . . . . . . . . . . . 046372430/001 Red Implemented 0.5 0.5 0.5 Yes 11/30/2017Western Pennsylvania Teamsters and Employers 3/31/2016 &
Pension Plan . . . . . . . . . . . . . . . . . . . . . . . . . 256029946/001 Red Implemented 0.2 0.2 0.2 Yes 3/31/2017
Contributions for individually significant plans . . . . 2.9 2.5 2.6Contributions to other multi-employer plans . . . . . 0.3 — —
Total contributions . . . . . . . . . . . . . . . . . . . . . $3.2 $2.5 $2.6
(1) There are 17 collective bargaining units participating in the Western Conference of Teamsters Pension Trust. As of December 31,2014, five of these were under negotiations.
10. FAIR VALUE MEASUREMENTS
At December 31, 2014 and 2013, the carrying amounts of cash, receivables, payables and other components of other currentassets and other current liabilities approximate their fair value due to the short maturity of these items. Borrowings under the ABLFacility are at variable interest rates and accordingly its carrying amount approximates fair value. There have been no transfersbetween the fair value measurement levels for the years ended December 31, 2014 and 2013. The Company recognizes transfersbetween the fair value measurement levels at the end of the reporting period.
At December 31, 2014, the pension plan assets were primarily comprised of mutual funds and pooled funds. The underlyinginvestments of these funds were valued using either quoted prices in active markets or valued as of the most recent trade date. SeeNote 9, Employee Benefits Plans, for further detail.
At the time of the Merger, the Company recorded a $58.8 million contingent liability associated with the Tax ReceivableAgreement at fair value using a discounted cash flow model that reflected management’s expectations about probability of payment.Key assumptions utilized in the discounted cash flow model included a discount rate of 4.8%, projected revenues and taxable income.The Company’s discounted cash flow model used significant unobservable (Level 3) inputs that were tied to the utilization ofUnisource’s net operating losses, attributable to taxable periods prior to the Merger, by the Company. The contingent liability isremeasured at fair value at each reporting period with the change in fair value recognized in other expense (income), net in theCompany’s Consolidated and Combined Statements of Operations. At December 31, 2014, the Company remeasured the contingentliability using a discount rate of 4.7% and recorded $1.7 million of other expense related to the change in fair value. See Note 8,Related Party Transactions, for further discussion of the Tax Receivable Agreement.
76

10. FAIR VALUE MEASUREMENTS (Continued)
The following table provides a reconciliation of the beginning and ending balance of the contingent liability for the year endedDecember 31, 2014:
ContingentLiability(in millions)
Beginning balance, July 1, 2014 . . . . . . . . . . . . . . . . . . . . . . . . . . . . . . . . . . . . . . . . . . . $58.8Change in fair value adjustment . . . . . . . . . . . . . . . . . . . . . . . . . . . . . . . . . . . . . . . . . . 1.7
Balance at December 31, 2014 . . . . . . . . . . . . . . . . . . . . . . . . . . . . . . . . . . . . . . . . . . . $60.5
11. SUPPLEMENTARY FINANCIAL STATEMENT INFORMATION
Other Current Assets
The components of other current assets were as follows:
December 31, December 31,2014 2013(in millions)
Rebates receivable . . . . . . . . . . . . . . . . . . . . . . . . . . . . . . . . . . . . . . . . . . . . . . $ 58.1 $18.4Prepaid expenses . . . . . . . . . . . . . . . . . . . . . . . . . . . . . . . . . . . . . . . . . . . . . . . 25.7 5.6Other . . . . . . . . . . . . . . . . . . . . . . . . . . . . . . . . . . . . . . . . . . . . . . . . . . . . . . 25.5 2.3
Other current assets . . . . . . . . . . . . . . . . . . . . . . . . . . . . . . . . . . . . . . . . . . . . . $109.3 $26.3
Other Non-Current Assets
The components of other non-current assets were as follows:
December 31, December 31,2014 2013(in millions)
Deferred financing costs . . . . . . . . . . . . . . . . . . . . . . . . . . . . . . . . . . . . . . . . . . $19.9 $ —Investments in real estate joint ventures . . . . . . . . . . . . . . . . . . . . . . . . . . . . . . . 5.7 —Below market leasehold agreements . . . . . . . . . . . . . . . . . . . . . . . . . . . . . . . . . . 6.0 —Other . . . . . . . . . . . . . . . . . . . . . . . . . . . . . . . . . . . . . . . . . . . . . . . . . . . . . . 12.3 9.4
Other non-current assets . . . . . . . . . . . . . . . . . . . . . . . . . . . . . . . . . . . . . . . . . . $43.9 $9.4
Accrued Payroll and Benefits
The components of accrued payroll and benefits were as follows:
December 31, December 31,2014 2013(in millions)
Accrued payroll and related taxes . . . . . . . . . . . . . . . . . . . . . . . . . . . . . . . . . . . . $ 32.4 $11.2Accrued commissions . . . . . . . . . . . . . . . . . . . . . . . . . . . . . . . . . . . . . . . . . . . . 37.0 25.9Other . . . . . . . . . . . . . . . . . . . . . . . . . . . . . . . . . . . . . . . . . . . . . . . . . . . . . . 41.7 17.8
Accrued payroll and benefits . . . . . . . . . . . . . . . . . . . . . . . . . . . . . . . . . . . . . . . $111.1 $54.9
77

11. SUPPLEMENTARY FINANCIAL STATEMENT INFORMATION (Continued)
Other Accrued Liabilities
The components of other accrued liabilities were as follows:
December 31, December 31,2014 2013(in millions)
Accrued taxes . . . . . . . . . . . . . . . . . . . . . . . . . . . . . . . . . . . . . . . . . . . . . . . . . $ 15.3 $ 6.4Accrued customer incentives . . . . . . . . . . . . . . . . . . . . . . . . . . . . . . . . . . . . . . . 24.1 12.8Accrued freight . . . . . . . . . . . . . . . . . . . . . . . . . . . . . . . . . . . . . . . . . . . . . . . . 10.1 2.4Accrued professional fees . . . . . . . . . . . . . . . . . . . . . . . . . . . . . . . . . . . . . . . . . 15.1 —Other . . . . . . . . . . . . . . . . . . . . . . . . . . . . . . . . . . . . . . . . . . . . . . . . . . . . . . 35.9 14.9
Other accrued liabilities . . . . . . . . . . . . . . . . . . . . . . . . . . . . . . . . . . . . . . . . . . $100.5 $36.5
Other Non-Current Liabilities
The components of other non-current liabilities were as follows:
December 31, December 31,2014 2013(in millions)
Contingent liability associated with Tax Receivable Agreement . . . . . . . . . . . . . . . . $ 60.5 $ —Deferred compensation . . . . . . . . . . . . . . . . . . . . . . . . . . . . . . . . . . . . . . . . . . 18.2 —Straight-line rent . . . . . . . . . . . . . . . . . . . . . . . . . . . . . . . . . . . . . . . . . . . . . . . 9.4 9.2Above market leasehold agreements . . . . . . . . . . . . . . . . . . . . . . . . . . . . . . . . . . 7.0 —Other . . . . . . . . . . . . . . . . . . . . . . . . . . . . . . . . . . . . . . . . . . . . . . . . . . . . . . 12.1 3.3
Other non-current liabilities . . . . . . . . . . . . . . . . . . . . . . . . . . . . . . . . . . . . . . . $107.2 $12.5
12. EARNINGS PER SHARE
Basic earnings (loss) per share for Veritiv common stock is calculated by dividing net income (loss) by the weighted averagenumber of shares of common stock outstanding during the period. Diluted earnings (loss) per share is similarly calculated, exceptthat the denominator is increased to include the number of additional common shares that would have been outstanding if thedilutive potential common shares had been issued, except where the inclusion of such common shares would have an anti-dilutiveimpact.
On the Distribution Date, Veritiv had 16,000,000 shares of common stock issued and outstanding, including 7,840,000 sharesissued in a private placement to the UWWH Stockholder. The calculation of both basic and diluted earnings (loss) per share for theyears ended December 31, 2013 and 2012 utilized 8,160,000 shares as no equity-based awards were outstanding prior to theDistribution Date, and Veritiv was a wholly-owned subsidiary of International Paper prior to that date. The calculation of both basicand diluted earnings (loss) per share for the year ended December 31, 2014 utilized 12,080,000 shares based on the weighted-averageshares outstanding during this period, reflecting the impact of the private placement of shares to the UWWH Stockholder on theDistribution Date. Also, as the Company has not issued or granted any dilutive securities since the Distribution Date, there was nodilutive impact to shares outstanding for the year ended December 31, 2014.
78

12. EARNINGS PER SHARE (Continued)
Basic and diluted earnings (loss) per share were as follows:
Year Ended December 31,
2014 2013 2012(in millions, except share and per share data)Income (loss) from continuing operations . . . . . . . . . . . . . . . . . . . . . . . $ (19.5) $ (0.0) $ 14.4Income (loss) from discontinued operations, net of income taxes . . . . . . . (0.1) 0.2 (10.0)
Net income (loss) . . . . . . . . . . . . . . . . . . . . . . . . . . . . . . . . . . . . . . . $ (19.6) $ 0.2 $ 4.4
Weighted-average number of shares outstanding—basic and diluted . . . . . 12,080,000 8,160,000 8,160,000Earnings (loss) per share:
Basic and dilutedContinuing operations . . . . . . . . . . . . . . . . . . . . . . . . . . . . . . . . . $ (1.61) $ (0.00) $ 1.76Discontinued operations . . . . . . . . . . . . . . . . . . . . . . . . . . . . . . . (0.01) 0.02 (1.23)
Basic and diluted earnings (loss) per share . . . . . . . . . . . . . . . . . . . $ (1.62) $ 0.02 $ 0.53
13. SHAREHOLDERS’ EQUITY
On the Distribution Date, Veritiv amended and restated its Certificate of Incorporation and its Bylaws. The followingsummarizes information concerning Veritiv’s capital stock.
Authorized Capital Stock
As a result of the Spin-off, the Company’s authorized capital stock consists of 100,000,000 shares of common stock, par value$0.01 per share, and 10,000,000 shares of preferred stock, par value $0.01 per share.
Common Stock
Shares Outstanding: On the Distribution Date, 8,160,000 shares of Veritiv common stock were distributed on a pro rata basis tothe International Paper shareholders of record as of the close of business on June 20, 2014. Furthermore, the UWWH Stockholder,the sole shareholder of UWWH, received 7,840,000 shares of Veritiv common stock for all outstanding shares of UWWH commonstock that it held on the Distribution Date. Following these distributions, Veritiv had 16,000,000 shares of common stock issued andoutstanding.
Dividends: Each holder of common stock shall be entitled to participate equally in all dividends payable with respect to thecommon stock.
Voting Rights: The holders of the Company’s common stock are entitled to vote only in the circumstances set forth in Veritiv’sAmended and Restated Certificate of Incorporation. Each holder of common stock shall be entitled to one vote for each share ofcommon stock held of record by such holder upon all matters to be voted on by the holders of the common stock.
Other Rights: Each holder of common stock shall be entitled to share equally, subject to any rights and preferences of thepreferred stock (as fixed by resolutions, if any, of the Board of Directors), in the assets of the Company available for distribution, inthe event of any voluntary or involuntary liquidation, dissolution or winding up of the affairs of Veritiv, or upon any distribution ofthe assets of the Company.
Preferred Stock
Subject to the provisions of the Amended and Restated Certificate of Incorporation, the Board of Directors of Veritiv isauthorized to provide for the issuance of up to 10,000,000 shares of preferred stock in one or more series. The Board of Directorsmay fix the number of shares constituting any series and determine the designation of the series, the dividend rates, rights of priorityof dividend payment, the voting powers (if any) of the shares of the series, and the preferences and relative, participating, optionaland other rights, if any, and any qualifications, limitations or restrictions, applicable to the shares of such series. No preferred stockwas issued and outstanding as of December 31, 2014.
79

13. SHAREHOLDERS’ EQUITY (Continued)
Comprehensive Income (Loss)
Comprehensive income (loss) is reported in the Consolidated and Combined Statements of Comprehensive Income (Loss) andconsists of net income (loss) and other gains and losses affecting shareholders’ equity that, under GAAP, are excluded from netincome (loss). AOCI consisted of the following:
December 31, December 31,2014 2013(in millions)
Foreign currency translation adjustments . . . . . . . . . . . . . . . . . . . . . . . . . . . . . . . $(14.7) $(4.7)Adjustments to pension and other benefit liabilities, net of tax . . . . . . . . . . . . . . . . (7.4) —
Accumulated other comprehensive loss . . . . . . . . . . . . . . . . . . . . . . . . . . . . . . . . $(22.1) $(4.7)
For the years ended December 31, 2014, 2013 and 2012, there were no reclassifications out of AOCI.
14. EQUITY-BASED INCENTIVE PLANS
Veritiv Incentive Plans
2014 Omnibus Incentive Plan—In conjunction with the Spin-off and the Merger, Veritiv adopted the Veritiv Corporation 2014Omnibus Incentive Plan (the ‘‘Omnibus Incentive Plan’’). A total of 2,080,000 shares of Veritiv common stock may be issued underthe Omnibus Incentive Plan, subject to certain adjustment provisions. Veritiv may grant options, stock appreciation rights, stockpurchase rights, restricted shares, restricted stock units, dividend equivalents, deferred share units, performance shares, performanceunits and other equity-based awards under the Omnibus Incentive Plan. Awards may be granted under the Omnibus Incentive Planto any employee, director, consultant or other service provider of Veritiv or a subsidiary of Veritiv.
On December 31, 2014, the Company granted 16,064 Deferred Share Units (‘‘DSUs’’) to its non-employee directors. Each DSUis the economical equivalent of one share of Veritiv’s common stock. The DSUs are fully vested and non-forfeitable as of the grantdate and are payable in cash following the individual’s termination of service as a Veritiv director. At December 31, 2014, theCompany recognized $0.8 million in expense related to these units based on the closing market price of the Company’s commonstock. The DSUs were classified as a non-current liability and will be remeasured at each reporting date, with a correspondingadjustment to compensation expense.
Subsequently, on January 1, 2015, the Company granted 63,217 restricted stock units (‘‘RSUs’’) and 252,930 performance stockunits (‘‘PSUs’’) to certain of its employees based on the closing stock price of the Company’s common stock on December 31, 2014.The RSUs will vest at the end of three years based on continued service. The PSUs will vest at the end of three years based on theCompany’s financial results on earnings before interest, taxes, depreciation and amortization (‘‘EBITDA’’) and total shareholderreturn, subject to continuing service. As of December 31, 2014, no expense was recognized for these awards.
International Paper Incentive Plans
At the time of the Spin-off, all equity awards held by employees of xpedx were granted under International Paper’s 2009Incentive Compensation Plan or predecessor plans. In conjunction with the Spin-off and Merger, International Paper retained allrights and obligations of these incentive plans. xpedx’s stock-based compensation expense and related income tax benefits associatedwith these International Paper plans were as follows:
Year EndedDecember 31,
2014 2013 2012(in millions)Total stock-based compensation expense . . . . . . . . . . . . . . . . . . . . . . . . . . . . . . . . . . . . $4.3 $15.4 $13.1Income tax benefit related to stock-based compensation . . . . . . . . . . . . . . . . . . . . . . . . . $1.3 $ 8.5 $ 6.2
80

15. COMMITMENTS AND CONTINGENCIES
Legal Proceedings
From time to time, the Company is involved in various lawsuits, claims, and regulatory and administrative proceedings arisingout of its business relating to general commercial and contractual matters, governmental regulations, intellectual property rights,labor and employment matters, tax and other actions.
Although the ultimate outcome of any legal proceeding or investigation cannot be predicted with certainty, based on presentinformation, including the Company’s assessment of the merits of the particular claim, the Company does not expect that anyasserted or unasserted legal claims or proceedings, individually or in the aggregate, will have a material adverse effect on its cashflow, results of operations or financial condition.
Escheat Audit
During 2013, Unisource was notified by the State of Delaware that they intended to examine the books and records ofUnisource to determine compliance with Delaware escheat laws. Since that date, seven other states have joined with Delaware in theaudit process which is conducted by an outside firm on behalf of the states and covers the period from 1981 to present. TheCompany has been informed that similar audits have generally taken two to four years to complete. Due to the preliminary stage ofthis audit, the Company has determined that the ultimate outcome cannot be estimated at this time. Any claims or liabilitiesresulting from these audits could have a material impact on the Company’s financial condition, results of operations and cash flows.
16. DISCONTINUED OPERATIONS
During 2011, xpedx ceased its Canadian operations, which had provided distribution of printing supplies to Canadian-basedcustomers. Additionally, xpedx ceased its printing press distribution business, which was located in the U.S. Both of these businesseswere historically included in xpedx’s Print segment. The operations and cash flows of these components have been eliminated fromthe ongoing operations of xpedx, and going forward Veritiv will not have any significant continuing involvement in the operations ofthese components, as any assets and related obligations were retained by International Paper as part of the Spin-off. Prior to theSpin-off, these components were included in discontinued operations for all periods presented.
Results of discontinued operations were as follows:
Year EndedDecember 31,
2014 2013 2012(in millions)Loss from operations . . . . . . . . . . . . . . . . . . . . . . . . . . . . . . . . . . . . . . . . . . . . . . . . $(0.1) $(0.5) $ (0.4)Restructuring and disposal income (loss) . . . . . . . . . . . . . . . . . . . . . . . . . . . . . . . . . . — 0.7 (10.1)(Loss) income from discontinued operations, net of income tax benefit of $0.0, $0.0 and
$0.5, respectively . . . . . . . . . . . . . . . . . . . . . . . . . . . . . . . . . . . . . . . . . . . . . . . . . (0.1) 0.2 (10.0)
17. SEGMENT AND GEOGRAPHIC INFORMATION
Effective July 1, 2014, in connection with the Spin-off and Merger, the Company reorganized its reportable segments as a resultof a change in the way the Chief Executive Officer, who serves as the Chief Operating Decision Maker (‘‘CODM’’), manages andevaluates the business. Previously, the Company had three reportable segments: Print, Packaging and Facility Solutions. During thethird quarter of 2014, the Company realigned and expanded the Print segment into two separate reportable segments, Print andPublishing, and, therefore, expanded the number of reportable segments to four. In addition, as a result of the change in how theCODM manages and evaluates the business, certain costs such as executive costs, corporate affairs, finance, human resources, IT andlegal that were previously allocated to the reportable segments are no longer allocated. The Company’s consolidated financial resultsnow include a ‘‘Corporate & Other’’ category which includes certain assets and costs not primarily attributable to any of thereportable segments. Corporate & Other also includes the Veritiv Logistics Solutions business which provides transportation andwarehousing solutions. As a result of these changes in segment reporting, all historical segment information has been revised toconform to the new presentation, with no resulting impact on the consolidated and combined results of operations.
81

17. SEGMENT AND GEOGRAPHIC INFORMATION (Continued)
The following is a brief description of the four reportable segments, organized by major product category:
• Print—The Print segment sells and distributes commercial printing, writing, copying, digital, wide format and specialty paperproducts, graphics consumables and graphics equipment primarily in the U.S., Canada and Mexico. This segment also includescustomized paper conversion services of commercial printing paper for distribution to document centers and form printers.
• Publishing—The Publishing segment sells and distributes coated and uncoated commercial printing papers to publishers,retailers, converters, printers and specialty businesses for use in magazines, catalogs, books, directories, gaming, couponing,retail inserts and direct mail. This segment also provides print management, procurement and supply chain managementsolutions to simplify paper and print procurement processes for its customers.
• Packaging—The Packaging segment provides standard as well as custom and comprehensive packaging solutions for customersbased in North America and in key global markets. The business is strategically focused on higher growth industries includinglight industrial/general manufacturing, food processing and manufacturing, fulfillment and internet retail, as well as nicheverticals based on geographical and functional expertise.
• Facility Solutions—The Facility Solutions segment sources and sells cleaning, break-room and other supplies such as towels,tissues, wipers and dispensers, can liners, commercial cleaning chemicals, soaps and sanitizers, sanitary maintenance suppliesand equipment, safety and hazard supplies, and shampoos and amenities primarily in the U.S., Canada and Mexico.
In conjunction with the change in reportable segments, management re-evaluated its use of key performance metrics.Historically, xpedx presented operating profit, excluding certain charges, as its measure of operating performance for presentation ofsegment results. Based on the recent evaluation, Veritiv management has concluded that Adjusted EBITDA is the metricmanagement uses to assess operating performance. Therefore, the current and prior period segment presentations reflect AdjustedEBITDA as the operating performance measure.
The following tables present net sales, Adjusted EBITDA and certain other measures for each of the reportable segments andtotal continuing operations for the periods presented:
Facility Corporate &Print Publishing Packaging Solutions Other Total(in millions)
Year Ended December 31, 2014Net sales . . . . . . . . . . . . . . . . . . . . . . . . . . . . . . . . . . . . $2,956.1 $1,075.5 $2,259.4 $1,070.3 $ 45.2 $7,406.5Adjusted EBITDA . . . . . . . . . . . . . . . . . . . . . . . . . . . . . $ 55.4 $ 27.1 $ 157.0 $ 33.6 $(151.1) $ 122.0Depreciation and amortization . . . . . . . . . . . . . . . . . . . . . $ 9.7 $ 1.4 $ 9.7 $ 4.6 $ 12.2 $ 37.6Restructuring charges . . . . . . . . . . . . . . . . . . . . . . . . . . . $ 1.5 $ — $ 1.4 $ 0.6 $ 0.5 $ 4.0
Year Ended December 31, 2013Net sales . . . . . . . . . . . . . . . . . . . . . . . . . . . . . . . . . . . . $2,399.6 $ 807.9 $1,600.3 $ 844.6 $ — $5,652.4Adjusted EBITDA . . . . . . . . . . . . . . . . . . . . . . . . . . . . . $ 43.9 $ 16.4 $ 117.9 $ 14.4 $(118.4) $ 74.2Depreciation and amortization . . . . . . . . . . . . . . . . . . . . . $ 4.4 $ 0.6 $ 2.6 $ 1.5 $ 8.0 $ 17.1Restructuring charges . . . . . . . . . . . . . . . . . . . . . . . . . . . $ 15.7 $ 1.1 $ 11.7 $ 7.4 $ 2.0 $ 37.9
Year Ended December 31, 2012Net sales . . . . . . . . . . . . . . . . . . . . . . . . . . . . . . . . . . . . $2,651.2 $ 822.7 $1,593.9 $ 944.2 $ — $6,012.0Adjusted EBITDA . . . . . . . . . . . . . . . . . . . . . . . . . . . . . $ 53.0 $ 13.8 $ 123.6 $ 19.2 $(120.1) $ 89.5Depreciation and amortization . . . . . . . . . . . . . . . . . . . . . $ 6.1 $ 0.6 $ 2.8 $ 1.8 $ 2.7 $ 14.0Restructuring charges . . . . . . . . . . . . . . . . . . . . . . . . . . . $ 20.4 $ 0.3 $ 7.1 $ 5.0 $ 2.3 $ 35.1
82

17. SEGMENT AND GEOGRAPHIC INFORMATION (Continued)
The table below presents a reconciliation of income (loss) from continuing operations before income taxes reflected in theConsolidated and Combined Statements of Operations to Total Adjusted EBITDA:
Year Ended December 31,
2014 2013 2012(in millions)Income (loss) from continuing operations before income taxes . . . . . . . . . . . . . . . $ (21.6) $ 0.4 $23.5Interest expense, net . . . . . . . . . . . . . . . . . . . . . . . . . . . . . . . . . . . . . . . . . . . 14.0 — —Depreciation and amortization . . . . . . . . . . . . . . . . . . . . . . . . . . . . . . . . . . . . 37.6 17.1 14.0Restructuring charges . . . . . . . . . . . . . . . . . . . . . . . . . . . . . . . . . . . . . . . . . . . 4.0 37.9 35.1Non-restructuring stock-based compensation . . . . . . . . . . . . . . . . . . . . . . . . . . . 4.0 13.1 13.1LIFO expense . . . . . . . . . . . . . . . . . . . . . . . . . . . . . . . . . . . . . . . . . . . . . . . . 6.3 3.4 1.0Non-restructuring severance charges . . . . . . . . . . . . . . . . . . . . . . . . . . . . . . . . . 2.6 2.3 0.6Merger and integration expenses . . . . . . . . . . . . . . . . . . . . . . . . . . . . . . . . . . . 75.1 — —Fair value adjustment on TRA contingent liability . . . . . . . . . . . . . . . . . . . . . . . 1.7 — —Other . . . . . . . . . . . . . . . . . . . . . . . . . . . . . . . . . . . . . . . . . . . . . . . . . . . . . (1.7) — 2.2
Total Adjusted EBITDA . . . . . . . . . . . . . . . . . . . . . . . . . . . . . . . . . . . . . . . . . $122.0 $74.2 $89.5
The table below summarizes total assets as of December 31, 2014 and December 31, 2013:
December 31, December 31,2014 2013(in millions)
Print . . . . . . . . . . . . . . . . . . . . . . . . . . . . . . . . . . . . . . . . . . . . . . . . . . . . . . . $ 949.1 $ 517.4Publishing . . . . . . . . . . . . . . . . . . . . . . . . . . . . . . . . . . . . . . . . . . . . . . . . . . . . 207.6 79.8Packaging . . . . . . . . . . . . . . . . . . . . . . . . . . . . . . . . . . . . . . . . . . . . . . . . . . . . 797.6 398.7Facility Solutions . . . . . . . . . . . . . . . . . . . . . . . . . . . . . . . . . . . . . . . . . . . . . . . 381.3 201.7Corporate & Other . . . . . . . . . . . . . . . . . . . . . . . . . . . . . . . . . . . . . . . . . . . . . 238.9 59.3
Total assets . . . . . . . . . . . . . . . . . . . . . . . . . . . . . . . . . . . . . . . . . . . . . . . . . . . $2,574.5 $1,256.9
Prior to the Merger, the Company’s operations and identifiable assets were primarily located in the U.S. After the Merger, theCompany’s operations and identifiable assets are primarily located in the U.S. and Canada. The following table presents net salesand property and equipment, net by geographic area.
Net Sales(1) Property and Equipment, Net
Year Ended December 31, December 31, December 31,2014 2013 2012 2014 2013(in millions)
U.S. . . . . . . . . . . . . . . . . . . . . . . . . . . . . . . . . . . . . . . . . . . . . . $6,848.9 $5,508.5 $5,830.9 $355.0 $106.1Canada . . . . . . . . . . . . . . . . . . . . . . . . . . . . . . . . . . . . . . . . . . . 408.2 25.2 32.6 18.7 —Rest of world . . . . . . . . . . . . . . . . . . . . . . . . . . . . . . . . . . . . . . . 149.4 118.7 148.5 3.7 1.0
Total . . . . . . . . . . . . . . . . . . . . . . . . . . . . . . . . . . . . . . . . . . . . . $7,406.5 $5,652.4 $6,012.0 $377.4 $107.1
(1) Net sales are attributed based on the location of the purchaser/destination.
No single customer accounted for more than 5% of net sales for the years ended December 31, 2014, 2013 and 2012.
83

18. QUARTERLY DATA (UNAUDITED)
The unaudited quarterly results of operations for 2014 and 2013 are summarized below:
2014
Three Months Ended
March 31 June 30 September 30(2) December 31(3)(in millions, except share and per share data)Net sales . . . . . . . . . . . . . . . . . . . . . . . . . . . . . . . . . . . . . . . . . . . $ 1,307.4 $ 1,329.0 $ 2,390.3 $ 2,379.8Cost of products sold . . . . . . . . . . . . . . . . . . . . . . . . . . . . . . . . . . . 1,088.5 1,116.7 1,987.1 1,988.6Income (loss) from continuing operations . . . . . . . . . . . . . . . . . . . . . 5.6 2.9 (14.0) (14.0)Loss from discontinued operations, net of income taxes . . . . . . . . . . . . (0.1) — — —Net income (loss) . . . . . . . . . . . . . . . . . . . . . . . . . . . . . . . . . . . . . 5.5 2.9 (14.0) (14.0)
Weighted-average number of shares outstanding—basic and diluted . . . 8,160,000 8,160,000 16,000,000 16,000,000Earnings (loss) per share(1):
Basic and dilutedContinuing operations . . . . . . . . . . . . . . . . . . . . . . . . . . . . . . . $ 0.69 $ 0.36 $ (0.88) $ (0.88)Discontinued operations . . . . . . . . . . . . . . . . . . . . . . . . . . . . . . (0.01) — — —
Basic and diluted earnings (loss) per share . . . . . . . . . . . . . . . . . $ 0.68 $ 0.36 $ (0.88) $ (0.88)
2013
Three Months Ended
March 31(4) June 30(5) September 30(6) December 31(7)
Net sales . . . . . . . . . . . . . . . . . . . . . . . . . . . . . . . . . . . . . . . . . . . $ 1,388.4 $ 1,402.9 $ 1,442.8 $ 1,418.3Cost of products sold . . . . . . . . . . . . . . . . . . . . . . . . . . . . . . . . . . 1,159.3 1,172.1 1,214.1 1,191.3Income (loss) from continuing operations . . . . . . . . . . . . . . . . . . . . . (0.9) (2.3) 5.2 (2.0)Income (loss) from discontinued operations, net of income taxes . . . . . 0.2 (0.1) (0.1) 0.2Net income (loss) . . . . . . . . . . . . . . . . . . . . . . . . . . . . . . . . . . . . . (0.7) (2.4) 5.1 (1.8)
Weighted-average number of shares outstanding—basic and diluted . . . 8,160,000 8,160,000 8,160,000 8,160,000Earnings (loss) per share(1):
Basic and dilutedContinuing operations . . . . . . . . . . . . . . . . . . . . . . . . . . . . . . . $ (0.11) $ (0.28) $ 0.64 $ (0.25)Discontinued operations . . . . . . . . . . . . . . . . . . . . . . . . . . . . . 0.02 (0.01) (0.01) 0.02
Basic and diluted earnings (loss) per share . . . . . . . . . . . . . . . . . $ (0.09) $ (0.29) $ 0.63 $ (0.23)
(1) See Note 12 of the Notes to the Consolidated and Combined Financial Statements for discussion on the shares of common stockutilized in the computation of basic and diluted earnings per share.
(2) Includes $54.8 million of merger and integration expenses related to the Merger of Unisource and to integrate the combinedbusinesses of xpedx and Unisource.
(3) Includes $18.2 million of merger and integration expenses and $5.1 million of restructuring charges related to Veritiv’srestructuring program of its North American operations.
(4) Includes $7.1 million of restructuring charges related to xpedx’s restructuring plan.
(5) Includes $17.3 million of restructuring charges related to xpedx’s restructuring plan.
(6) Includes $6.0 million of restructuring charges related to xpedx’s restructuring plan.
(7) Includes $7.5 million of restructuring charges related to xpedx’s restructuring plan.
84

ITEM 9. CHANGES IN AND DISAGREEMENTS WITH ACCOUNTANTS ON ACCOUNTING AND FINANCIAL DISCLOSURE
Not applicable.
ITEM 9A. CONTROLS AND PROCEDURES
Evaluation of Disclosure Controls and Procedures
Our management, with the Chief Executive Officer and Chief Financial Officer of the Company, have evaluated theeffectiveness of our disclosure controls and procedures (as defined in Rules 13a-15(e) and 15d-15(e) under the Exchange Act) as ofthe end of the period covered by this report. Any controls and procedures, no matter how well designed and operated, can provideonly reasonable assurance, not absolute assurance, of achieving the desired control objectives. Based on such evaluation, such officershave concluded that, as of the end of the period covered by this report, the Company’s disclosure controls and procedures areeffective at the reasonable assurance level.
Management’s Annual Report on Internal Control Over Financial Reporting
This annual report does not include a report of management’s assessment regarding internal control over financial reporting oran attestation report of the Company’s registered public accounting firm due to a transition period established by rules of the SECfor newly public companies.
Changes in Internal Control Over Financial Reporting
There have been no changes in our internal control over financial reporting during the fourth quarter of 2014 that havematerially affected or are reasonably likely to materially affect the Company’s internal control over financial reporting.
On July 1, 2014, we completed our merger with Unisource. We are currently integrating policies, processes, people, technologyand operations for the combined company. Management will continue to evaluate our internal control over financial reporting as weexecute integration activities.
ITEM 9B. OTHER INFORMATION
Not applicable.
PART III
ITEM 10. DIRECTORS, EXECUTIVE OFFICERS AND CORPORATE GOVERNANCE
(a) Directors of the Company.
This information is incorporated by reference to the Company’s Proxy Statement for the 2015 Annual Meeting of Shareholdersto be filed subsequent to the filing of this report under the heading ‘‘Proposal 1—Election of Directors’’.
(b) Executive Officers of the Company.
This information can be found under ‘‘Executive Officers of the Company’’ in Part I, Item 1 of this report.
(c) Audit Committee Financial Experts.
This information is incorporated by reference to the Company’s Proxy Statement for the 2015 Annual Meeting of Shareholdersto be filed subsequent to the filing of this report under the heading ‘‘Corporate Governance—Board Committees’’.
(d) Identification and Composition of the Audit and Finance Committee.
This information is incorporated by reference to the Company’s Proxy Statement for the 2015 Annual Meeting of Shareholdersto be filed subsequent to the filing of this report under the heading ‘‘Corporate Governance—Board Committees’’.
85

(e) Compliance with Section 16(a) of the Exchange Act.
This information is incorporated by reference to the Company’s Proxy Statement for the 2015 Annual Meeting of Shareholdersto be filed subsequent to the filing of this report under the heading ‘‘Security Ownership of Certain Beneficial Owners andManagement—Section 16(a) Beneficial Ownership Reporting Compliance’’.
(f) Code of Ethics.
This information is incorporated by reference to the Company’s Proxy Statement for the 2015 Annual Meeting of Shareholdersto be filed subsequent to the filing of this report under the heading ‘‘Corporate Governance—Corporate GovernancePrinciples’’.
ITEM 11. EXECUTIVE COMPENSATION
This information is incorporated by reference to the Company’s Proxy Statement for the 2015 Annual Meeting of Shareholdersto be filed subsequent to the filing of this report under the headings ‘‘Executive Compensation’’ and ‘‘Corporate Governance—Director Compensation’’.
ITEM 12. SECURITY OWNERSHIP OF CERTAIN BENEFICIAL OWNERS AND MANAGEMENT AND RELATEDSTOCKHOLDER MATTERS
This information is incorporated by reference to the Company’s Proxy Statement for the 2015 Annual Meeting of Shareholdersto be filed subsequent to the filing of this report under the headings ‘‘Security Ownership of Certain Beneficial Owners andManagement’’ and ‘‘Executive Compensation—Equity Compensation Plans.’’
ITEM 13. CERTAIN RELATIONSHIPS AND RELATED TRANSACTIONS, AND DIRECTOR INDEPENDENCE
This information is incorporated by reference to the Company’s Proxy Statement for the 2015 Annual Meeting of Shareholdersto be filed subsequent to the filing of this report under the headings ‘‘Corporate Governance—Related Person Transaction Policy’’and ‘‘Corporate Governance—Director Independence’’.
ITEM 14. PRINCIPAL ACCOUNTANT FEES AND SERVICES
This information is incorporated by reference to the Company’s Proxy Statement for the 2015 Annual Meeting of Shareholdersto be filed subsequent to the filing of this report under the heading ‘‘Principal Accountant Fees and Services’’.
PART IV
ITEM 15. EXHIBITS AND FINANCIAL STATEMENT SCHEDULES
(a) The following documents are filed or incorporated by reference as part of this Form 10-K:
1. Financial Statements:
See Item 8. Financial Statements and Supplementary Data.
2. Financial Statement Schedules:
All schedules have been omitted as the required information is included in the footnotes or not applicable.
3. Exhibits:
See Exhibit Index of this Form 10-K, which is incorporated herein by reference.
86

SIGNATURES
Pursuant to the requirements of Section 13 or 15(d) of the Securities Exchange Act of 1934, the registrant has duly caused thisAnnual Report on Form 10-K to be signed on its behalf by the undersigned, thereunto duly authorized, on March 24, 2015.
VERITIV CORPORATION(Registrant)
By: /s/ MARY A. LASCHINGER
Name: Mary A. LaschingerTitle: Chairman and Chief Executive Officer
Pursuant to the requirements of the Securities Exchange Act of 1934, this report has been signed by the following persons onbehalf of the registrant and in the capacities indicated on March 24, 2015.
(i) Principal executive officer:
/s/ MARY A. LASCHINGER Chairman of the Board of Directors and ChiefExecutive OfficerMary A. Laschinger
(ii) Principal financial officer:
/s/ STEPHEN J. SMITHSenior Vice President and Chief Financial Officer
Stephen J. Smith
(iii) Principal accounting officer:
/s/ W. FORREST BELLChief Accounting Officer
W. Forrest Bell
(iv) The Directors:
/s/ ALLAN R. DRAGONE, JR.Director
Allan R. Dragone, Jr.
/s/ DANIEL T. HENRYDirector
Daniel T. Henry
/s/ TRACY A. LEINBACHDirector
Tracy A. Leinbach
/s/ SETH A. MEISELDirector
Seth A. Meisel
/s/ WILLIAM E. MITCHELLDirector
William E. Mitchell
/s/ MICHAEL P. MULDOWNEYDirector
Michael P. Muldowney
/s/ CHARLES G. WARD, IIIDirector
Charles G. Ward, III
/s/ JOHN J. ZILLMERDirector
John J. Zillmer
87

EXHIBIT INDEX
Exhibit No. Description
2.1 Agreement and Plan of Merger, dated as of January 28, 2014, by and among International Paper Company, VeritivCorporation (f/k/a/ xpedx Holding Company), xpedx Intermediate, LLC, xpedx, LLC, UWW Holdings, LLC,UWW Holdings, Inc. and Unisource Worldwide, Inc., incorporated by reference from Exhibit 2.1 to the Registrant’sRegistration Statement on Form S-1 (File No. 333-193950) filed on April 4, 2014.
2.2 Amendment No. 1 to the Agreement and Plan of Merger, dated as of May 28, 2014, by and among International PaperCompany, Veritiv Corporation (f/k/a xpedx Holding Company), xpedx Intermediate, LLC, xpedx, LLC,UWW Holdings, LLC, UWW Holdings, Inc. and Unisource Worldwide, Inc., incorporated by reference from Exhibit 2.2to the Registrant’s Registration Statement on Form S-1 (File No. 333-193950) filed on June 5, 2014.
2.3 Amendment No. 2 to the Agreement and Plan of Merger, dated as of June 4, 2014, by and among International PaperCompany, Veritiv Corporation (f/k/a) xpedx Holding Company), xpedx Intermediate, LLC, xpedx, LLC,UWW Holdings, LLC, UWW Holdings, Inc. and Unisource Worldwide, Inc., incorporated by reference from Exhibit 2.3to the Registrant’s Registration Statement on Form S-1 (File No. 333-193950) filed on June 5, 2014.
2.4 Contribution and Distribution Agreement, dated as of January 28, 2014, by and among International Paper Company,Veritiv Corporation (f/k/a/ xpedx Holding Company), UWW Holdings, Inc. and UWW Holdings, LLC, incorporated byreference from Exhibit 2.4 to the Registrant’s Registration Statement on Form S-1 (File No. 333-193950) filed onApril 4, 2014.
2.5 Amendment No. 1 to the Contribution and Distribution Agreement, dated May 28, 2014, by and among InternationalPaper Company, Veritiv Corporation (f/k/a xpedx Holding Company), UWW Holdings, Inc. and UWW Holdings, LLC,incorporated by reference from Exhibit 2.5 to the Registrant’s Registration Statement on Form S-1 (FileNo. 333-193950) filed on June 5, 2014.
3.1 Amended and Restated Certificate of Incorporation of Veritiv Corporation, incorporated by reference from Exhibit 3.1to the Registrant’s Current Report on Form 8-K filed on July 3, 2014.
3.2 Amended and Restated Bylaws of Veritiv Corporation, incorporated by reference from Exhibit 3.2 to the Registrant’sCurrent Report on Form 8-K filed on July 3, 2014.
10.1 Credit Agreement, dated as of July 1, 2014, among Veritiv Corporation, xpedx Intermediate, LLC and xpedx, LLC, asborrowers, the several lenders and financial institutions from time to time parties thereto, Bank of America, N.A., asadministrative agent and collateral agent for the lenders party thereto, and the other parties thereto, together with theABL Joinder Agreement, dated as of July 1, 2014, made by Unisource Worldwide, Inc. and Unisource Canada, Inc. forthe benefit of the Lenders under the Credit Agreement, incorporated by reference from Exhibit 10.1 to the Registrant’sCurrent Report on Form 8-K filed on July 3, 2014.
10.2 U.S. Guarantee and Collateral Agreement, dated as of July 1, 2014, made by xpedx Intermediate, LLC, xpedx, LLC, theSubsidiary Borrowers and the U.S. Guarantors parties thereto and Veritiv Corporation, in favor of Bank of America,N.A., as administrative agent and collateral agent for the Secured Parties (as defined therein), together with theAssumption and Supplemental Agreement, dated as of July 1, 2014, made by Veritiv Corporation, Alco Realty, Inc.,Graph Comm Holdings International, Inc., Graphic Communications Holdings, Inc., Paper Corporation of NorthAmerica, Unisource International Holdings, Inc., Unisource International Holdings Poland, Inc., and UnisourceWorldwide, Inc., in favor of Bank of America, N.A., as collateral agent and as administrative agent, incorporated byreference from Exhibit 10.2 to the Registrant’s Current Report on Form 8-K filed on July 3, 2014.
10.3 Canadian Guarantee and Collateral Agreement, dated as of July 1, 2014, made by Unisource Canada, Inc. and theCanadian Guarantors parties thereto, in favour of Bank of America, N.A., as administrative agent and collateral agentfor the Secured Parties (as defined therein), incorporated by reference from Exhibit 10.3 to the Registrant’s CurrentReport on Form 8-K filed on July 3, 2014.
10.4 Registration Rights Agreement, dated as of July 1, 2014, between UWW Holdings, LLC and Veritiv Corporation,incorporated by reference from Exhibit 10.4 to the Registrant’s Current Report on Form 8-K filed on July 3, 2014.
10.5 Tax Receivable Agreement, dated as of July 1, 2014, by and among Veritiv Corporation and UWW Holdings, LLC,incorporated by reference from Exhibit 10.5 to the Registrant’s Current Report on Form 8-K filed on July 3, 2014.
88

Exhibit No. Description
10.6 Transition Services Agreement, dated as of July 1, 2014, by and between International Paper Company and VeritivCorporation, incorporated by reference from Exhibit 10.6 to the Registrant’s Current Report on Form 8-K filed onJuly 3, 2014.
10.7 Employee Matters Agreement, dated as of January 28, 2014, by and between International Paper Company, VeritivCorporation (f/k/a/ xpedx Holding Company) and UWW Holdings, Inc., incorporated by reference from Exhibit 10.2 tothe Registrant’s Registration Statement on Form S-1 (File No. 333-193950) filed on February 14, 2014.
10.8 Amendment to Employee Matters Agreement, dated as of June 2, 2014, by and between International Paper Company,Veritiv Corporation (f/k/a xpedx Holding Company) and UWW Holdings, Inc., incorporated by reference fromExhibit 10.14 to the Registrant’s Registration Statement on Form S-1 (File No. 333-193950) filed on June 5, 2014.
10.9 Tax Matters Agreement, dated as of January 28, 2014, by and among International Paper Company, Veritiv Corporation(f/k/a/ xpedx Holding Company) and UWW Holdings, Inc., incorporated by reference from Exhibit 10.5 to theRegistrant’s Registration Statement on Form S-1 (File No. 333-193950) filed on February 14, 2014.
10.10 Separation Agreement, dated as of June 30, 2014, between UWW Holdings, Inc. and Allan R. Dragone, incorporatedby reference from Exhibit 10.7 to the Registrant’s Current Report on Form 8-K filed on July 3, 2014.
10.11† Employment Agreement, dated as of January 28, 2014, between Veritiv Corporation (f/k/a xpedx Holding Company) andMary A. Laschinger, incorporated by reference from Exhibit 10.9 to the Registrant’s Registration Statement onForm S-1 (File No. 333-193950) filed on February 14, 2014.
10.12† Offer Letter, dated as of February 13, 2014, between Veritiv Corporation (f/k/a xpedx Holding Company) andStephen J. Smith, incorporated by reference from Exhibit 10.12 to the Registrant’s Form 10-Q filed on August 14, 2014.
10.13† Form of Indemnification Agreement between Veritiv Corporation (f/k/a xpedx Holding Company) and each of itsdirectors, incorporated by reference from Exhibit 10.10 to the Registrant’s Registration Statement on Form S-1 (FileNo. 333-193950) filed on June 11, 2014.
10.14† Veritiv Corporation 2014 Omnibus Incentive Plan, incorporated by reference from Exhibit 10.8 to the Registrant’sCurrent Report on Form 8-K filed on July 3, 2014.
10.15† 2014 Short-Year Veritiv Incentive Plan adopted effective as of August 8, 2014, incorporated by reference fromExhibit 10.15 to the Registrant’s Form 10-Q filed on August 14, 2014.
10.16† Form of Notice of 2014 Long-Term Transition Incentive Award, incorporated by reference from Exhibit 10.16 to theRegistrant’s Form 10-Q filed on August 14, 2014.
10.17† Form of Notice of 2014-15 Long-Term Transition Incentive Award, incorporated by reference from Exhibit 10.17 to theRegistrant’s Form 10-Q filed on August 14, 2014.
10.18† Form of Notice of 2014-15-16 Long-Term Transition Incentive Award, incorporated by reference from Exhibit 10.18 tothe Registrant’s Form 10-Q filed on August 14, 2014.
10.19† Terms and Conditions of Long-Term Transition Incentive Award Opportunities, incorporated by reference fromExhibit 10.19 to the Registrant’s Form 10-Q filed on August 14, 2014.
10.20† Veritiv Corporation Deferred Compensation Savings Plan, incorporated by reference from Exhibit 10.20 to theRegistrant’s Form 10-Q filed on November 14, 2014.
10.21†* Form of Director Deferred Share Unit Award Agreement.
10.22†* Form of Restricted Stock Unit Award Agreement.
10.23†* Form of Performance Share Award Agreement (Adjusted EBITDA Performance Shares).
10.24†* Form of Performance Share Award Agreement (Relative TSR Performance Shares).
10.25†* Veritiv Corporation Annual Incentive Plan (as adopted on March 4, 2015).
10.26†* Veritiv Corporation Executive Severance Plan (as adopted and effective as of March 4, 2015).
89

Exhibit No. Description
21.1* List of Subsidiaries.
23.1* Consent of Deloitte & Touche LLP, Independent Registered Public Accounting Firm.
31.1* Rule 13a-14(a) Certification of the Chief Executive Officer.
31.2* Rule 13a-14(a) Certification of the Chief Financial Officer.
32.1* Section 1350 Certification of the Chief Executive Officer.
32.2* Section 1350 Certification of the Chief Financial Officer.
101.INS* XBRL Instance Document.
101.SCH* XBRL Taxonomy Extension Schema Document.
101.CAL* XBRL Taxonomy Extension Calculation Linkbase Document.
101.DEF* XBRL Taxonomy Extension Definition Linkbase Document.
101.LAB* XBRL Taxonomy Extension Label Linkbase Document.
101.PRE* XBRL Taxonomy Extension Presentation Linkbase Document.
† Management contract or compensatory plans or arrangements
* Filed herewith
90

We leverage our global network of specialized papermakers to deliver the most comprehensive selection of best-in-class commercial, business, and digital paper products in the market.
Veritiv provides paper brokerage and print management services to end users through our two complementary publishing and print management companies, Bulkley Dunton Publishing Group and Graphic Communications.
PUBLISHING & PRINT MANAGEMENT
From concept to design and production to distribution, we have the insights and experience to help customers discover all the ways packaging can generate more efficiencies, more sales, and more profits.
PACKAGING
Our comprehensive selection of facility solutions products, management programs, and advanced analysis tools help customers maintain a clean, healthy environment.
FACILITY SOLUTIONS
TRANSFER AGENT & REGISTRARComputershareP.O. Box 30170College Station, TX 77842
computershare.com/investor866.276.9370
INDEPENDENT REGISTERED PUBLIC ACCOUNTING FIRM FOR 2014Deloitte & Touche LLP Cincinnati, OH
ANNUAL MEETINGThe Veritiv Corporation Annual Meeting will be held on Wednesday, May 20, 2015 in Atlanta, GA.
INVESTOR CONTACTNeil A. Russell Senior Vice President Corporate Affairs
[email protected] 844.845.2136
ANNUAL REPORT & FORM 10-K COPIESCopies of the Annual Report and Form 10-K are available and may be obtained by contacting:
Veritiv Corporationc/o Investor Relations6600 Governors Lake Parkway Norcross, GA 30071
844.845.2136ir.veritivcorp.com
FORWARD-LOOKING STATEMENTSCertain statements contained in this report regarding the Company’s future operating results, performance, business plans, prospects, guidance and any other statements not constituting historical fact are “forward-looking statements” subject to the safe harbor created by the Private Securities Litigation Reform Act of 1995. All forward-looking statements reflect only the Company’s current beliefs and assumptions with respect to future operating results, performance, business plans, prospects, guidance and other matters, and are based on information currently available to the Company. Accordingly, the statements are subject to significant risks, uncertainties and contingencies, which could cause the Company’s actual operating results, performance or business plans or prospects to differ materially from those expressed in, or implied by, these statements.
For a detailed discussion of specific risks and uncertainties that could cause actual results to differ from those contained in the forward-looking statements, see the information under the heading “Risk Factors” in our Annual Report on Form 10-K for the year ended December 31, 2014, which is included in this report, and in other filings we make with the SEC. The Company undertakes no obligation to update or revise the forward-looking statements, whether as a result of new information, future events or otherwise, except as required by law. In addition, historical information should not be considered as an indicator of future performance.
DESIGN: SAVAGE BRANDS, HOUSTON, TEXAS
Shareholder Information

2014 ANNUAL REPORT
SHAPING SUCCESS
Facebook.com/VeritivCorp
Twitter.com/Veritiv Twitter.com/VeritivIR
LinkedIn.com/company/Veritiv
VER
ITIV C
OR
POR
ATION
| 2014 AN
NU
AL R
EPOR
T
6600 Governors Lake Parkway Norcross, Georgia 30071veritivcorp.com