Shape Similarity, Better than Semantic Membership...
21
Shape Similarity, Better than Semantic Membership, Accounts for the Structure of Visual Object Representations in a Population of Monkey Inferotemporal Neurons Carlo Baldassi 1,2. , Alireza Alemi-Neissi 2,3. , Marino Pagan 4,5. , James J. DiCarlo 4 , Riccardo Zecchina 1,2 , Davide Zoccolan 3,4 * 1 Department of Applied Science and Technology & Center for Computational Sciences, Politecnico di Torino, Torino, Italy, 2 Human Genetics Foundation (HuGeF), Torino, Torino, Italy, 3 International School for Advanced Studies (SISSA), Trieste, Italy, 4 Department of Brain and Cognitive Sciences and McGovern Institute for Brain Research, Massachusetts Institute of Technology (MIT), Cambridge, Massachusetts, United States of America, 5 Department of Psychology, University of Pennsylvania, Philadelphia, Pennsylvania, United States of America Abstract The anterior inferotemporal cortex (IT) is the highest stage along the hierarchy of visual areas that, in primates, processes visual objects. Although several lines of evidence suggest that IT primarily represents visual shape information, some recent studies have argued that neuronal ensembles in IT code the semantic membership of visual objects (i.e., represent conceptual classes such as animate and inanimate objects). In this study, we investigated to what extent semantic, rather than purely visual information, is represented in IT by performing a multivariate analysis of IT responses to a set of visual objects. By relying on a variety of machine-learning approaches (including a cutting-edge clustering algorithm that has been recently developed in the domain of statistical physics), we found that, in most instances, IT representation of visual objects is accounted for by their similarity at the level of shape or, more surprisingly, low-level visual properties. Only in a few cases we observed IT representations of semantic classes that were not explainable by the visual similarity of their members. Overall, these findings reassert the primary function of IT as a conveyor of explicit visual shape information, and reveal that low-level visual properties are represented in IT to a greater extent than previously appreciated. In addition, our work demonstrates how combining a variety of state-of-the-art multivariate approaches, and carefully estimating the contribution of shape similarity to the representation of object categories, can substantially advance our understanding of neuronal coding of visual objects in cortex. Citation: Baldassi C, Alemi-Neissi A, Pagan M, DiCarlo JJ, Zecchina R, et al. (2013) Shape Similarity, Better than Semantic Membership, Accounts for the Structure of Visual Object Representations in a Population of Monkey Inferotemporal Neurons. PLoS Comput Biol 9(8): e1003167. doi:10.1371/journal.pcbi.1003167 Editor: Wolfgang Einha ¨user, Philipps-University Marburg, Germany Received January 24, 2013; Accepted June 19, 2013; Published August 8, 2013 Copyright: ß 2013 Baldassi et al. This is an open-access article distributed under the terms of the Creative Commons Attribution License, which permits unrestricted use, distribution, and reproduction in any medium, provided the original author and source are credited. Funding: This work was supported by The National Institute of Mental Health Conte, NIH-P20-MH66239 and NIH-R01-EY014970 (JJD), an HFSP Long Term Postdoctoral Fellowship (DZ), an Accademia Nazionale dei Lincei - Compagnia di San Paolo Grant (DZ), a Programma Neuroscienze Grant of the Compagnia di San Paolo (DZ and RZ), and ERC Grant 267915 (CB and RZ). The funders had no role in study design, data collection and analysis, decision to publish, or preparation of the manuscript. Competing Interests: The authors have declared that no competing interests exist. * E-mail: [email protected] . These authors contributed equally to this work. Introduction In primates, visual object information is processed through a hierarchy of cortico-cortical stages (the ventral visual pathway) that culminates with the inferotemporal cortex (IT) [1–6]. Uncovering the nature of visual object representations in IT is central to our understanding of how visually presented objects are perceived, identified and categorized, yet it is extremely challenging. In fact, because of the non-linear mapping between the visual input space and IT neuronal responses, it is virtually impossible to precisely estimate the tuning of individual IT neurons over the image space (but see [7,8]). As a result, it is somewhat arbitrary to assign IT the proper rank along the continuum that goes from extraction of simple visual features to formation of conceptual, semantic categories – are IT neurons closer to the local edge detectors found in primary visual areas or to the concept cells recently found in human middle temporal lobe [9–11]? While most literature supports the notion that IT neurons code moderately to highly complex configurations of visual features [2,6,12,13], recent work has argued that IT neuronal ensembles code the semantic membership of visual objects (i.e., represent behaviorally salient conceptual categories, such as animate and non-animate objects, animals, body parts, etc) rather than their visual properties [14]. A related study also compared how a set of visual objects was represented in monkey IT and its human homologous, finding that many semantic categories were repre- sented equally well in both species (with a primary, sharp distinction between animate and inanimate objects) and reporting the inadequacy of various image-based similarity metrics to account for the observed patterns of neuronal responses [15]. PLOS Computational Biology | www.ploscompbiol.org 1 August 2013 | Volume 9 | Issue 8 | e1003167
Transcript of Shape Similarity, Better than Semantic Membership...
Shape Similarity, Better than Semantic Membership,Accounts for the Structure of Visual ObjectRepresentations in a Population of MonkeyInferotemporal NeuronsCarlo Baldassi1,2., Alireza Alemi-Neissi2,3., Marino Pagan4,5., James J. DiCarlo4, Riccardo Zecchina1,2,
Davide Zoccolan3,4*
1 Department of Applied Science and Technology & Center for Computational Sciences, Politecnico di Torino, Torino, Italy, 2 Human Genetics Foundation (HuGeF), Torino,
Torino, Italy, 3 International School for Advanced Studies (SISSA), Trieste, Italy, 4 Department of Brain and Cognitive Sciences and McGovern Institute for Brain Research,
Massachusetts Institute of Technology (MIT), Cambridge, Massachusetts, United States of America, 5 Department of Psychology, University of Pennsylvania, Philadelphia,
Pennsylvania, United States of America
Abstract
The anterior inferotemporal cortex (IT) is the highest stage along the hierarchy of visual areas that, in primates, processesvisual objects. Although several lines of evidence suggest that IT primarily represents visual shape information, some recentstudies have argued that neuronal ensembles in IT code the semantic membership of visual objects (i.e., representconceptual classes such as animate and inanimate objects). In this study, we investigated to what extent semantic, ratherthan purely visual information, is represented in IT by performing a multivariate analysis of IT responses to a set of visualobjects. By relying on a variety of machine-learning approaches (including a cutting-edge clustering algorithm that hasbeen recently developed in the domain of statistical physics), we found that, in most instances, IT representation of visualobjects is accounted for by their similarity at the level of shape or, more surprisingly, low-level visual properties. Only in afew cases we observed IT representations of semantic classes that were not explainable by the visual similarity of theirmembers. Overall, these findings reassert the primary function of IT as a conveyor of explicit visual shape information, andreveal that low-level visual properties are represented in IT to a greater extent than previously appreciated. In addition, ourwork demonstrates how combining a variety of state-of-the-art multivariate approaches, and carefully estimating thecontribution of shape similarity to the representation of object categories, can substantially advance our understanding ofneuronal coding of visual objects in cortex.
Citation: Baldassi C, Alemi-Neissi A, Pagan M, DiCarlo JJ, Zecchina R, et al. (2013) Shape Similarity, Better than Semantic Membership, Accounts for the Structureof Visual Object Representations in a Population of Monkey Inferotemporal Neurons. PLoS Comput Biol 9(8): e1003167. doi:10.1371/journal.pcbi.1003167
Editor: Wolfgang Einhauser, Philipps-University Marburg, Germany
Received January 24, 2013; Accepted June 19, 2013; Published August 8, 2013
Copyright: � 2013 Baldassi et al. This is an open-access article distributed under the terms of the Creative Commons Attribution License, which permitsunrestricted use, distribution, and reproduction in any medium, provided the original author and source are credited.
Funding: This work was supported by The National Institute of Mental Health Conte, NIH-P20-MH66239 and NIH-R01-EY014970 (JJD), an HFSP Long TermPostdoctoral Fellowship (DZ), an Accademia Nazionale dei Lincei - Compagnia di San Paolo Grant (DZ), a Programma Neuroscienze Grant of the Compagnia di SanPaolo (DZ and RZ), and ERC Grant 267915 (CB and RZ). The funders had no role in study design, data collection and analysis, decision to publish, or preparation ofthe manuscript.
Competing Interests: The authors have declared that no competing interests exist.
* E-mail: [email protected]
. These authors contributed equally to this work.
Introduction
In primates, visual object information is processed through a
hierarchy of cortico-cortical stages (the ventral visual pathway) that
culminates with the inferotemporal cortex (IT) [1–6]. Uncovering
the nature of visual object representations in IT is central to our
understanding of how visually presented objects are perceived,
identified and categorized, yet it is extremely challenging. In fact,
because of the non-linear mapping between the visual input space
and IT neuronal responses, it is virtually impossible to precisely
estimate the tuning of individual IT neurons over the image space
(but see [7,8]). As a result, it is somewhat arbitrary to assign IT the
proper rank along the continuum that goes from extraction of
simple visual features to formation of conceptual, semantic
categories – are IT neurons closer to the local edge detectors
found in primary visual areas or to the concept cells recently found
in human middle temporal lobe [9–11]?
While most literature supports the notion that IT neurons code
moderately to highly complex configurations of visual features
[2,6,12,13], recent work has argued that IT neuronal ensembles
code the semantic membership of visual objects (i.e., represent
behaviorally salient conceptual categories, such as animate and
non-animate objects, animals, body parts, etc) rather than their
visual properties [14]. A related study also compared how a set of
visual objects was represented in monkey IT and its human
homologous, finding that many semantic categories were repre-
sented equally well in both species (with a primary, sharp
distinction between animate and inanimate objects) and reporting
the inadequacy of various image-based similarity metrics to
account for the observed patterns of neuronal responses [15].
PLOS Computational Biology | www.ploscompbiol.org 1 August 2013 | Volume 9 | Issue 8 | e1003167

Finally, a recent fMRI study concluded that object representations
in monkey IT are spatially segregated according to semantic
relationship [16], a finding that matches the segregation by
function/meaning (rather than by shape) found in the topography
of human high-level representations of visual objects [17–24].
Finding that abstract category information is represented in IT
is not surprising per se, since several studies have shown how IT
neurons can represent the association of arbitrary image pairs,
either through explicit [25,26] or implicit [27–29] associative
learning. However, while these mechanisms can explain why
extensively trained categories [30] or behaviorally salient catego-
ries (such as faces and body parts [31–34]) are represented in IT,
they can hardly explain why category information was found to be
represented in IT more systematically and robustly than visual
shape information [14,15]. In fact, several studies have shown that
IT neurons are robustly tuned for object-defining visual features
[7,8,35–39] and one study has shown that in IT, differently from
prefrontal cortex, semantic category information is not greater
than what expected based on the visual similarity of category
members [40]. Finally, a very recent monkey fMRI study has
found no sharp segregation between the representations of
animate and inanimate objects in IT [34].
In this study, we have applied an array of multivariate
approaches (some of which were recently developed in the domain
of statistical mechanics) to investigate how an IT neuronal
population represents pictures of natural objects. Our analysis
shows that neuronal representations in IT largely depend on
objects’ similarity at the level of shape or, more surprisingly, low-
level visual properties, with semantic membership only accounting
for the representation of a few, behaviorally salient categories of
animate objects (such as four-limbed animals and birds). Overall,
these findings show that monkey IT is primarily a conveyor of
explicit visual shape information, in which a surprisingly broad
spectrum of visual feature complexity is represented.
Results
In this study, we recorded 94 well-isolated single units from the
anterior inferotemporal cortex (IT) of two monkeys. Neurons were
sampled across a ,564 mm area of the ventral superior temporal
sulcus (STS) and ventral surface lateral to the anterior middle
temporal sulcus (AMTS), as shown in Figure 1 (see blue dots and
red-shaded areas). No attempt was done to target specific IT
patches containing cells with similar preference for faces, such as
the AF (anterior fundus), AL (anterior lateral) and AM (anterior
medial) face patches [31–33] (the range of possible locations of
these patches is also shown in Fig. 1, based on [33]), or other IT
regions that are rich of face selective neurons (summarized in
[41,42]). Finally, for a better comparison with previous findings, it
is important to notice that we recorded from a region with a
smaller anteroposterior (AP) and mediolateral (ML) extent than
the region sampled by [14], although both regions were roughly
centered at the same AP position in anterior IT (compare Fig. 1
with Fig. 1 in [14]).
All neurons were probed with a set of 213 grayscale pictures of
natural objects (see Fig. 2) presented at a rate of 5 images/s, while
the animals were engaged in a simple object detection task. To
understand how these objects were mapped into the IT neuronal
space, we used linear classifiers and a variety of clustering
algorithms, and we measured to what extent object clusters in the
IT neuronal representation could be accounted by three different
object attributes: 1) shared semantic membership; 2) shared shape
features (i.e., shape similarity); and 3) shared low-level visual
properties.
Gradient in object area explains object clustering at themost ‘‘superordinate’’ level
The nature of visual object representations in IT can be studied
by examining what features are shared by objects that produce
similar population responses in the IT neuronal representation
space. The similarity between the neuronal representations of a
pair of visual objects (neuronal-level similarity in the following) was
computed as the Pearson correlation coefficient of the normalized
population response vectors produced by the two objects (see
Materials and Methods). To gain some intuition into possible
trends in the representation of our object set, the neuronal-level
similarity between each object pair was color-coded in the matrix
shown in Figure 3A. The order of the objects along the axes of the
similarity matrix was determined by the dendrogram shown at the
top, which was obtained by applying an agglomerative hierarchi-
cal clustering algorithm to the neural population vectors. This
allowed objects evoking similar population responses to lie nearby
in the matrix, so that clusters of objects that were similar in the
neural representation space appeared as compact dark squares
along the diagonal of the matrix.
Contrary to what was recently reported by [14,15], but in
agreement with [34], visual inspection of the similarity matrix
revealed that objects did not show a tendency to cluster into two
main, compact clusters, corresponding to the semantic categories
of animate and inanimate entities. For instance, the set of faces
(top of the ordinate matrix axis) was separated from the set of birds
and four-limbed animals (approximately in the middle of the axis)
by many inanimate objects. Other animate objects (such as insects,
crustaceans, fishes, and some four-limbed animals) were scattered
all over the matrix axis and intermixed with inanimate objects
(such as man-made tools, trees, flowers, etc). Finally, although
some animate objects, such as faces, appeared to cluster according
to the subordinate semantic category they belonged to (i.e., the
face category), such clusters were generally embedded within
Author Summary
To build meaningful representations of the external word,the stream of sensory information that reaches our sensesis continuously processed and interpreted by the brain.Ultimately, such a processing allows the brain to arrangesensory (e.g., visual) inputs into a hierarchy of categories(such as animate and inanimate objects) and sub-catego-ries (such as faces, animals, buildings, tools, etc). Crucially,while many objects can be assigned to the same categorybased on their visual similarity (e.g., oranges and apples),formation of most categories also requires arbitrarilyassociating objects sharing similar functions/meaning,but not similar shape (e.g., bananas and apples). A long-standing debate exists about whether the representationof visual objects in the higher visual centers of the brain(such as the inferotemporal cortex; IT) purely reflects shapesimilarity or also (and, perhaps, mainly) shape-unrelatedcategorical knowledge. In this study, we have addressedthis issue by applying a variety of computationalapproaches. Our results show that the response patternsof a population of inferotemporal neurons are betteraccounted for by shape similarity than categorical mem-bership. This reasserts the primary function of IT as a visualarea and demonstrates how state-of-the-art computationalapproaches can advance our understanding of neuronalcoding in the brain.
Structure of Visual Object Representations in IT
PLOS Computational Biology | www.ploscompbiol.org 2 August 2013 | Volume 9 | Issue 8 | e1003167

larger clusters of animate and inanimate objects with similar shape
(i.e., the face cluster lay within a larger group of similarly round
shapes – a cup, a ball, a brain, an urchin, etc.). To better quantify
whether a segregation between animate and inanimate objects
could be observed at the top level of the dendrogram obtained by
hierarchical clustering, we measured the fraction of animate and
inanimate objects in the first two branches of the dendrogram (i.e.,
the cyan vs. the magenta branch in the dendrogram shown in
Fig. 3A). Animate objects amounted to ,40% of the total in both
branches and their fraction did not significantly differ in the two
branches (p.0.1, x2 test; see Fig. 3B).
While animate and inanimate objects were not sharply
segregated in the neuronal representation space, a different
property appeared to determine object clustering in the two top-
level branches of the dendrogram – a gradient in object area could
be observed along the matrix axes, with bulkier objects (e.g., faces
and other round shapes) at one end of the axes and thinner objects
(e.g., an ant, a dolphin, a guitar, etc) at the other end. To quantify
this trend, objects were divided in two equally sized subsets of
‘‘large’’ and ‘‘small’’ objects, depending on whether their area was
above or below the median of the full object set (object area is
defined in Materials and Methods). The proportion of large and
Figure 2. The stimulus set. The full set of 213 objects used in our study. The set consists of: i) 188 images of real-world objects belonging to 94different categories (e.g., two hats, two accordions, two monkey faces, etc.); ii) 5 cars, 5 human faces, and 5 abstract silhouettes; iii) 5 patches oftexture (e.g., random dots and oriented bars); iv) a blank frame; v) 4 low contrast (10%, 3%, 2% and 1.5%) images of one of the objects (a camera).doi:10.1371/journal.pcbi.1003167.g002
Figure 1. Recording locations. The blue dots show the projections of the recording chamber grid-point locations from the top of the skull to theventral bank of the superior temporal sulcus (STS) and the ventral surface lateral to the anterior middle temporal sulcus (AMTS). The projections areshown over a sequence of MRI images (spanning a 13–17 anteroposterior range; Horsley-Clarke coordinates) that were collected, for one of themonkeys, before the chamber implant surgery. Only the grid locations in which the electrode was inserted at least once are shown. The red-shadedareas highlight the estimated cortical span that was likely sampled during recording, given that: 1) each electrode penetration usually spanned thewhole depth of the targeted cortical bank (either STS or AMTS); and 2) the upper bound of the variability of each recording location along themediolateral axis (due to bending of the electrode during insertion) can be estimated as 62 mm [80]. The figure also shows the range of possiblelocations of the three anterior face patches (AL, AF and AM) according to [33], so as to highlight their potential overlap with the recording locations.doi:10.1371/journal.pcbi.1003167.g001
Structure of Visual Object Representations in IT
PLOS Computational Biology | www.ploscompbiol.org 3 August 2013 | Volume 9 | Issue 8 | e1003167

small objects was significantly different in the first two branches of
the dendrogram (p,0.001, x2 test), with large objects representing
more than 60% of the total in one branch and only about 20% in
the other (Fig. 3C).
To further investigate what properties shaped the representation
of the objects in the IT neuronal space, we performed a Principal
Component Analysis (PCA) of the recorded neuronal population
vectors. The total variance explained by the first two principal
Figure 3. Similarity matrix, hierarchical clustering and PCA of IT population responses to visual objects. (A) Each pixel in the matrixcolor-codes the correlation (i.e., similarity) between the neuronal population vectors representing a pair of visual objects. The order of the objectsalong the axes is defined by the dendrogram produced by hierarchical clustering of the population vectors (to avoid crowding, one every threeobjects is shown; the complete object set is shown in Fig. 2). The first two branches of the dendrogram (shown at the top) are colored in cyan andmagenta. (B) The fraction of animate and inanimate objects is not significantly different in the first two branches of the dendrogram (NS, p.0.1, x2
test). (C) The proportion of large and small objects is significantly different in the first two branches of the dendrogram (**, p,0.001, x2 test), (D)Layout of visual objects in the two-dimensional space defined by the first two principal components of the IT population responses (to avoidcrowding, only some of the objects are shown). (E) Object area and object ranking along the first principal component are linearly related (r = 20.69,p,0.001, t-test).doi:10.1371/journal.pcbi.1003167.g003
Structure of Visual Object Representations in IT
PLOS Computational Biology | www.ploscompbiol.org 4 August 2013 | Volume 9 | Issue 8 | e1003167
components was fairly low (,15%). This is not surprising, since
our object set was highly varied in terms of visual properties and
shape features and it is unlikely that high-level visual neurons, such
as those sampled in our IT population, would represent/code only
a few of such visual properties. Therefore, the goal of this analysis
was not to find a few stimulus dimensions that could account for
most of the variability in the representation of the visual objects.
Rather, our goal was to check whether any principal component
existed that could be associated to the variation of some global
visual property across the object set. Interestingly, plotting the
objects in the 2-dimensional space defined by the first two
principal components revealed a trend that was consistent with the
dendrogram obtained by hierarchical clustering. Namely, objects
were distributed along the first principal component axis according
to a gradient in object area, with large objects at one end of the
axis and thin objects at the other end (see Fig. 3D). This trend was
confirmed by showing that object area and object raking along the
first principal component axis were highly and significantly
anticorrelated (r = 20.69, p,0.001, t-test; see Fig. 3E). Similarly,
object luminance (defined in the Materials and Methods) was
significantly anticorrelated with the third principal component
(r = 20.46, p,0.001, t-test). No significant correlation was found
between the second principal component and any other low-level
visual property considered in this study (i.e., contrast and aspect
ratio, as defined in the Materials and Methods).
Overall, the analyses shown in Figure 3 indicate that visual
objects, in the recorded IT neuronal representation space, were
loosely segregated at the coarser (i.e., more ‘‘superordinate’’) level
according to a low-level visual property – object area (not to be
confused with object size, which, in this study, was kept constant to
2u of visual angle for every object, and which is defined as the
diameter of the larger circle fully enclosing the object).
Definition of three alternative clustering hypothesesTo gain further insight into the principles underlying the
grouping of visual objects in the recorded neuronal representation,
we divided the object set in categories, according to three different
clustering hypotheses: 1) shared semantic membership; 2) shared
shape features (i.e., shape similarity); and 3) shared low-level visual
properties.
Eleven semantic categories were built – four-limbed animals,
birds, faces, fishes, insects, sea invertebrates, trees, vehicles, tools,
music instruments and buildings (see Fig. S1A). The two
superordinate semantic categories of animate and inanimate
objects (which included, respectively, the first 6 and last 5
subordinate categories listed above) were also considered. All the
semantic categories were built according to criteria established in
previous studies [14,15] (e.g., the trees were included in the
inanimate category).
Fifteen categories of objects sharing visual shape features
(named shape-based categories in the following) were defined as the
15 clusters obtained by running a k-means clustering algorithm
over the objects’ representation provided by the output layer of a
brain-inspired object recognition model [43,44] (see Materials and
Methods for details). Each of these categories/clusters contained
objects that occupied nearby positions (and were, therefore,
similar) in the representational space of the object recognition
model. Being such a similarity measured in a high-dimensional
multivariate representation, it is impossible to precisely know what
shared features brought two objects to cluster in the same
category. Therefore, the shape-based categories were simply
labeled by sequential numbers (from 1 to 15; see Fig. S1B).
However, when the shape features underlying formation of a given
category could be guessed by visual inspection, we assigned to such
a category a descriptive name (e.g., the round objects’ category or
the horizontal thin objects’ category). It should be kept in mind that
these names are only used for the sake of readability, but they
cannot possibly capture the true combinations of shape features
underlying object clustering in the model representational space.
Eight Categories of objects sharing low-level visual properties
(named low-level categories in the following) were defined on the base
of four global properties of the images of the objects – luminance,
contrast, area and aspect ratio (defined in the Materials and
Methods). Each category contained 15 images having either the
highest or the lowest values of one of such properties (see Fig.
S1C).
It should be emphasized that no rigorous (or agreed-upon)
definition exists of what should be considered low-level and high-
level in terms of visual feature complexity. For this reason, our
definitions of shape-based and low-level categories are essentially
operational. That is, they refer to the complexity of the image
processing that was performed to obtain them. In the case of the
shape-based categories, the images of the objects were processed
by banks of nonlinear filters in a multi-layered, feed-forward
neural network (see Materials and Methods). Since these filters,
collectively, extract visual features across a wide spectrum of
complexity, the resulting shape-based categories included not only
sets of moderately-to-highly complex visual patterns (such as
round, oriented or star-like shapes), but also object sets that
appeared to be defined mainly (but not exclusively) by lower-level
image properties (such as contrast, luminance or texture). In the
case of the low-level categories, the defining features were global
image properties that could simply be extracted by segmenting the
foreground image from the uniform-gray background. However,
some of these properties, such as aspect ratio, can arguably be
considered as moderately complex shape features. As a result, a
few of the shaped-based categories substantially overlapped with
the low-level categories and were assigned similar names (e.g., the
bright and the dim shape-based categories partially overlapped,
respectively, with the high-luminance and the low-contrast low-level
categories; compare Figs. S1B and C). Such an overlap should not
sound surprising, since the terms shape-based and low-level refer to
the complexity of the operations underlying the definition of the
categories, rather than to the content of the resulting categories.
More in general, it should be stressed that the assessment of shape
coding carried out in this study did not aim at precisely identifying
what visual features were critical to elicit a response in specific
neurons (or neuronal subpopulations). While methods to extract
critical visual features exist (e.g., reverse correlation, image
classification, or other fitting procedures of neuronal/behavioral
responses to image properties [7,8,45–51]), the goal of our analysis
was to assess how well various sets of visually similar objects
clustered in the neuronal representation space, no matter whether
visual similarity could be precisely defined in terms of specific
visual properties (as in the case of the low-level categories) or not
(as in the case of the shape-based categories).
Overlap between clustering hypotheses and k-meansclusters in the IT neuronal space
Having defined object categories based on three different
hypotheses, we assessed to what extent the members of each
category occupied nearby positions in the neuronal representation
space. This was achieved by applying a k-means clustering
algorithm to the neuronal population vectors, with the number
of clusters k set to 15 according to both a Bayes and an Akaike
Information Criterion [52] (hence, the choice of using such a
number also in the k-means procedure that lead to the definition of
the shape-based categories shown in Fig. S1B; see previous
Structure of Visual Object Representations in IT
PLOS Computational Biology | www.ploscompbiol.org 5 August 2013 | Volume 9 | Issue 8 | e1003167
section). The resulting clusters were then compared to the
semantic and visual similarity-based categories defined in the
previous section, to check for any possible substantial overlap.
Figure 4A shows 15 object clusters that were obtained by a
typical run of the k-means algorithm over the neuronal represen-
tation space (the k-means is not deterministic, therefore each run
produces slightly different partitions of the data set; see below for
further discussion). The order of the clusters in the figure was
determined by applying an agglomerative hierarchical clustering
algorithm to their centroids. This produced the dendrogram
shown at the top of the figure, which allows appreciating the
relationship among the k-means clusters (i.e., neighboring clusters
in Fig. 4A lie nearby in the neural representation space). These
clusters (named neuronal-based clusters in the following) were
compared to the object categories of the three clustering
hypotheses defined previously, some of which are shown in
Figure 4B–D (all the categories are shown in Fig. S1). This was
achieved by defining an overlap score that measured the fraction
of objects in common between any given neuronal-based cluster
and any given category in the three hypotheses. For easier
comparison with Kiani et al., 2007, the same score defined in that
study was used (see Materials and Methods; statistical significance
of the overlap was computed through a permutation test, with
Bonferroni corrected significance level p,0.05).
Figure 4 shows what neuronal-based clusters (A), on the one
hand, and what semantic (B; yellow frames), shape-based (C; red
frames) and low-level (D; cyan frames) categories, on the other
hand, significantly overlapped (objects belonging to both a
neuronal-based cluster and its matching category are shown
within the corresponding frames; see the descriptive names on top
of each cluster/category in A-D to navigate the figure and find
matches between neuronal-based clusters and categories). Out of
the fifteen neuronal-based clusters, five significantly overlapped
with a semantic category, seven with a shape-based category, and
three with a low-level category. Interestingly, some clusters
significantly overlapped with multiple categories, each belonging
to a different clustering hypothesis. For instance, the first cluster
shown in Figure 4A overlapped both with the semantic category
of fishes (forth category in Fig. 4B) and with the shape-based
category #6 (that we named horizontal thin; see the second
category in Fig. 4C). Similarly, the twelfth cluster in Figure 4A
overlapped with both the semantic category of faces (first category
in Fig. 4B), the shape-based category #2 (that we named round;
see the fifth category in Fig. 4C), and the low-level category of
high area objects (first category in Fig. 4D). Noticeably, in all these
cases, the overlap was larger with the shape-based (or low-level)
category than with the semantic category. Moreover, the objects
overlapping with the semantic category were typically a subset of
the objects overlapping with the shape-based category (see how
the yellow frames are included within the red/cyan frames in
Fig. 4A). That is, the objects belonging to a given semantic
category were typically embedded within a larger group of
objects with similar shape but different semantic member-
ship (e.g., the fishes were embedded within a set of similarly
horizontally elongated shapes, while the faces were embedded
within a set of similarly round shapes). This implies that shape
similarity (e.g., roundness) and not semantic membership (e.g.,
being a face) was at the root of these clusters within the neuronal
representation space. On the other hand, a few neuronal-based
clusters were found that significantly overlapped only with a
semantic category. This is the case of the third and forth clusters
in Figure 4A, which overlapped, respectively, with the birds (third
category in Fig. 4B) and the four-limbed animals (second category
in Fig. 4B).
To obtain a more robust assessment of what fraction of
neuronal-based clusters significantly overlapped with categories of
the three hypotheses and, in particular, how often semantic
membership could be taken as the only explanation of the
observed clusters, 1,000 runs of the k-means algorithm were
performed (this produced 1,000 slightly different neuronal-based
clusters and shape-based categories; the semantic and low-level
categories were unchanged, since they were not obtained by a k-
means procedure). Figure 4E shows the average number of
neuronal-based clusters that, across these 1,000 k-means runs,
significantly overlapped with categories of the three hypotheses.
On average, about four, five and three clusters were found that
significantly overlapped, respectively, with semantic, shape-based
and low-level categories. Noticeably, more than half of the clusters
that significantly overlapped with a semantic category, did so also
with one of the categories defined by visual object similarity (see
the yellow, red and cyan striped portion of the first bar in Fig. 4E).
In all such cases, since the overlap was larger with the similarity-
based category than with the semantic category, semantic
membership cannot be taken as the factor at the root of object
clustering in the neuronal representation. Rather, it is visual
similarity among the members of those semantic categories that is
driving object clustering.
Finally, to further test whether animate and inanimate objects
were significantly segregated in the IT representation, 100 k-means
runs were performed with k = 2, and the average absolute
difference between the fraction of animate objects in the two
clusters produced by each k-means run was computed. Such a
difference amounted to ,7% and was not significantly larger than
expected by chance (i.e., by randomly shuffling the animate and
inanimate objects among the clusters produced by each k-means
run; p = 0.39), thus confirming the result of the analysis based on
hierarchical clustering (see Fig. 3B).
Overall, the k-means analysis strongly suggests that most object
clusters in the recorded IT neuronal representation are explain-
able by the visual similarity of their members at the level of both
shape and, more surprisingly (being IT the highest purely visual
brain area), low-level visual properties. Nevertheless, at least a
couple of semantic categories exist (i.e., the four-limbed animals and
the birds), whose significant representation in the recorded
neuronal population is not accounted by either the shape-based
or the low-level visual similarity metrics we used.
Overlap between clustering hypotheses and D-MSTclusters in the IT neuronal space
As a more refined way to infer the structure of visual object
representation in IT, we sought an unsupervised approach that
would embody the advantages of k-means-like partition algorithms
(which allow measuring the fraction of overlapping objects
between neuronal-based clusters and arbitrary object categories;
see Fig. 4) and hierarchical approaches (which allow assessing the
fine-grain relationship between objects within the representation
space; see Fig. 3A). This was achieved by applying a method that
has been recently developed in the domain of statistical physics –
the D-MST clustering algorithm [53,54]. This method interpolates
between Affinity Propagation (a recent, state-of-the art partition
algorithm that has been successfully applied in a variety of contexts
[55–59]) and hierarchical Single Linkage clustering [60,61]. The
main advantage of the D-MST method over the k-means (and
similar partition methods, such as Affinity Propagation) is to allow
non-spherical clusters, i.e., to allow loosening the implicit
assumption that all the elements of a cluster lie within some
distance to some point (i.e., the centre of the cluster). In fact, the
output of this method is not simply a partition of the elements into
Structure of Visual Object Representations in IT
PLOS Computational Biology | www.ploscompbiol.org 6 August 2013 | Volume 9 | Issue 8 | e1003167

Structure of Visual Object Representations in IT
PLOS Computational Biology | www.ploscompbiol.org 7 August 2013 | Volume 9 | Issue 8 | e1003167

clusters, but, rather, it is a forest, i.e., a partition of the elements
into trees (see Fig. 5). As a result, the outcome of the D-MST
algorithm contains richer information about the topology/
structure of the data, as compared to the output of the k-means
(see Materials and Methods).
Figure 5 shows the five most stable clusters (see also Fig. S2 and
Text S1) extracted by the D-MST algorithm from the recorded IT
object representation (named neuronal-based clusters in the following).
The fact that the number of D-MST clusters was much lower than
the optimal number of k-means clusters (see previous section and
Fig. 4A) is not surprising – the nature of these two clustering
methods is very different, and the number of clusters they yield
cannot be directly compared. In fact, the D-MST clusters have an
inner hierarchical structure that incorporates as sub-trees what
partition methods (such as the k-means) would segregate into
separate clusters. The advantage of the D-MST approach is to
make explicit the relationship among such sub-trees, thus
providing additional topological information that, with other
methods, would be lost. This can be appreciated by inspecting, for
example, cluster #3, which is mostly made of objects with low
area, but with different sub-trees containing objects with different
features (e.g., vertically oriented edges, horizontally oriented edges,
curved boundaries, etc.); or cluster #4, which is made of two
distinct sub-trees, one containing round objects and another
containing horizontally elongated objects; or cluster #5, in which
there is a transition from star-shaped objects (on the left sub-trees)
to objects containing sharp edges (on the right sub-trees), passing
through a central region of spiky objects.
Figure 5 also shows what subsets of objects, within each cluster,
significantly overlapped with one of the object categories of the
clustering hypotheses. Critically, the significance of the overlap
was computed through a permutation test that took into account
the unrooted-tree internal structure of the D-MST clusters and the
existence of twin objects (i.e., the fact that, as in [14,15], our object
set contained at least two exemplars/twins of any given object –
two horses, two hats, two monkey faces, five human faces, etc; see
Fig. 2). This was achieved by measuring the fraction of
overlapping objects between a given category and all possible
sub-trees of contiguous objects within a cluster, with the
significance of the overlap assessed by randomly permuting sets
of twin objects across the categories of a given clustering
hypotheses (1,000,000 permutations were run; see Text S1 for
details). Twins’ sets, rather than individual objects, were permuted,
because visual inspection of Figure 5 revealed that twins had a
strong tendency to lie nearby in the IT representation space (i.e., a
strong tendency to be directly connected in the D-MST clusters).
This is not surprising, since twins are, in general, very similar at
the pixel level, and, as a result, they typically belong to the same
shape-based and low-level category, beside belonging, by defini-
tion, to the same semantic category (see Fig. S1). Therefore, the
presence of twins tends to inflate the overlap between sub-trees
within the D-MST clusters and object categories. Permuting twins’
sets, rather than individual objects, allows taking into account this
bias in the construction of the null distributions of overlap scores,
against which the measured overlaps are compared to establish
their significance. This yields a very conservative test, in which
each set of twins counts as a single object, thus removing, de facto,
any contribution of pixel-level similarity among twins to the
computation of chance overlap scores.
As expected, this approach provided a very conservative
outcome: only a few categories of the clustering hypotheses were
found that significantly overlapped with sub-trees within the D-
MST clusters (Holm-Bonferroni corrected ** p,0.01 and *
p,0.05; see third-to-last column in Tables 1–3). This number
increased if the Holm-Bonferroni correction was released, yielding
two, four and four significant overlaps with categories, respective-
ly, of the semantic, the shape-based and the low-level hypotheses
(see third-to-last column in Tables 1–3 and corresponding
yellowish, reddish and bluish frames in Fig. 5).
Noticeably, out of the two semantic categories that significantly
overlapped with a sub-tree within a D-MST cluster, only for the
four-limbed animals (in cluster #1) such an overlap was not
accountable by the similarity of their members, since the faces (in
cluster #4) were part of a larger sub-tree of round objects with high
area. Moreover, although cluster #1 contained both a large subset
of four-limbed animals and a large subset of birds, only the former was
compactly represented, while the latter was very scattered, thus
suggesting that the proximity of the birds was mostly mediated by
other objects in the cluster. Since our overlap measure took into
account the compactness of a given object category within a tree
(see above), no significant overlap between the birds category and
any sub-tree within cluster #1 was found.
The results shown in Figure 5 provide a very robust and
conservative assessment of what semantic and visual similarity-
based categories were represented in our recorded IT population.
However, in previous studies [14], the significance of the overlap
between neuronal-based clusters and object categories was
computed without compensating for the existence of multiple
(very similar) exemplars of the same objects (i.e., twins). For easier
comparison with such studies, we also computed the significance of
the overlap scores reported in Tables 1–3 by randomly shuffling
individual objects, rather than twins’ sets. This yielded an
additional set of semantic categories that significantly overlapped
with sub-trees within the D-MST clusters – birds, sea invertebrates,
fishes and music instruments (Holm-Bonferroni corrected ** p,0.01
and * p,0.05; see last column in Table 1). However, an even
larger increase of overlaps was found between sub-trees within the
D-MST clusters and shape-based and low-level object categories
(see last column in Tables 2–3). Critically, in most cases, these
overlaps with the visual similarity-based categories accounted for
the overlaps with the semantic categories (the same way roundness
accounted for the clustering of faces in cluster #4 of Fig. 5). In
fact, the sea invertebrates were part of the larger cluster of star-like
shapes in cluster #5; the fishes were part of the larger cluster of
Figure 4. Overlap between k-means clusters in the IT neuronal space and object categories of the clustering hypotheses. (A) Fifteenobject clusters obtained by a typical run of the k-means algorithm over the IT neuronal representation space. The clusters’ arrangement wasdetermined by applying a hierarchical clustering algorithm to their centroids (see the dendrogram on the top; the same approach was used toarrange the shape-based categories shown in C, which resulted from the k-means object clustering in the output layer of an object recognitionmodel [44]). (B–D) The semantic (B), shape-based (C) and low-level (D) categories that significantly overlapped with some of the neuronal-basedclusters shown in A. Overlapping neuronal-based clusters and categories are indicated by matching names (e.g., faces) in A and B–D, with the objectsin common between a cluster and a category enclosed by either a yellow (semantic), a red (shape-based) or a cyan (low-level) frame. (E) Averagenumber of significant overlaps between neuronal-based clusters and semantic (first bar), shape-based (second bar) and low-level (third bar)categories across 1,000 runs of the k-means algorithm over both the neuronal representation space and the model representation space. The yellow,red and cyan striped portion of the first bar indicates the number of neuronal-based clusters that significantly overlapped with both a semanticcategory and either a shape-based or a low-level category.doi:10.1371/journal.pcbi.1003167.g004
Structure of Visual Object Representations in IT
PLOS Computational Biology | www.ploscompbiol.org 8 August 2013 | Volume 9 | Issue 8 | e1003167

horizontal thick objects in cluster #1; and the music instruments were
part of the larger cluster of horizontal thin objects in cluster #3
(cross-compare Fig. 5 and the third-to-last and last columns of
Tables 1–2). Therefore, regardless of the level of conservativeness
of the permutation test, the D-MST clustering analysis strongly
suggests that visual similarity, rather than semantic membership,
was at the root of the structure of visual object representations in
the recorded IT population (with the noticeable exception to the
four-limbed animals and, to a lesser extent, the birds semantic
categories).
Figure 5. Overlap between D-MST clusters in the IT neuronal space and object categories of the clustering hypotheses. The five moststable clusters resulting from applying the D-MST clustering algorithm to the IT object representation (see also Fig. S2). The colored frames indicatethe subsets of objects that, within each cluster, significantly overlapped with a semantic, a shape-based or a low-level category. The name of theoverlapping category is reported near to each frame, together with the overlap’s significance level (same overlap score and significance level symbolsas in Table 1). The width and shade of the links connecting the images reflect the robustness of the links across different runs of the D-MST algorithm:thinner/lighter links appeared less frequently in the D-MST outcome with respect to thicker/darker links.doi:10.1371/journal.pcbi.1003167.g005
Structure of Visual Object Representations in IT
PLOS Computational Biology | www.ploscompbiol.org 9 August 2013 | Volume 9 | Issue 8 | e1003167
This conclusion was strengthened by the qualitative obser-
vation of the D-MST clusters, whose internal structure
provided a richness of information that was not always
captured by our overlap and similarity metrics. For instance,
four-legged grand-pianos and four-wheeled cars (among other
inanimate objects) belonged to the same cluster of the four-
limbed animals, thus suggesting that some shared, hard-to-
quantify visual property, rather than semantic membership,
may have underlain the grouping of objects in cluster #1.
Similarly, shared visual features likely played a relevant role in
determining the clustering of other groups of objects (see, for
instance, the objects with high spatial frequency texture/
patterns in tree #2, or the objects with curved or round
elements in tree #3).
Overall, the object clustering produced by the D-MST
algorithm suggests the existence of a rich multi-level object
representation in IT, which is largely driven by the similarity of
visual objects across a spectrum of visual properties, ranging from
low-level image attributes to complex combinations of shape
features that are often hard to model and quantify.
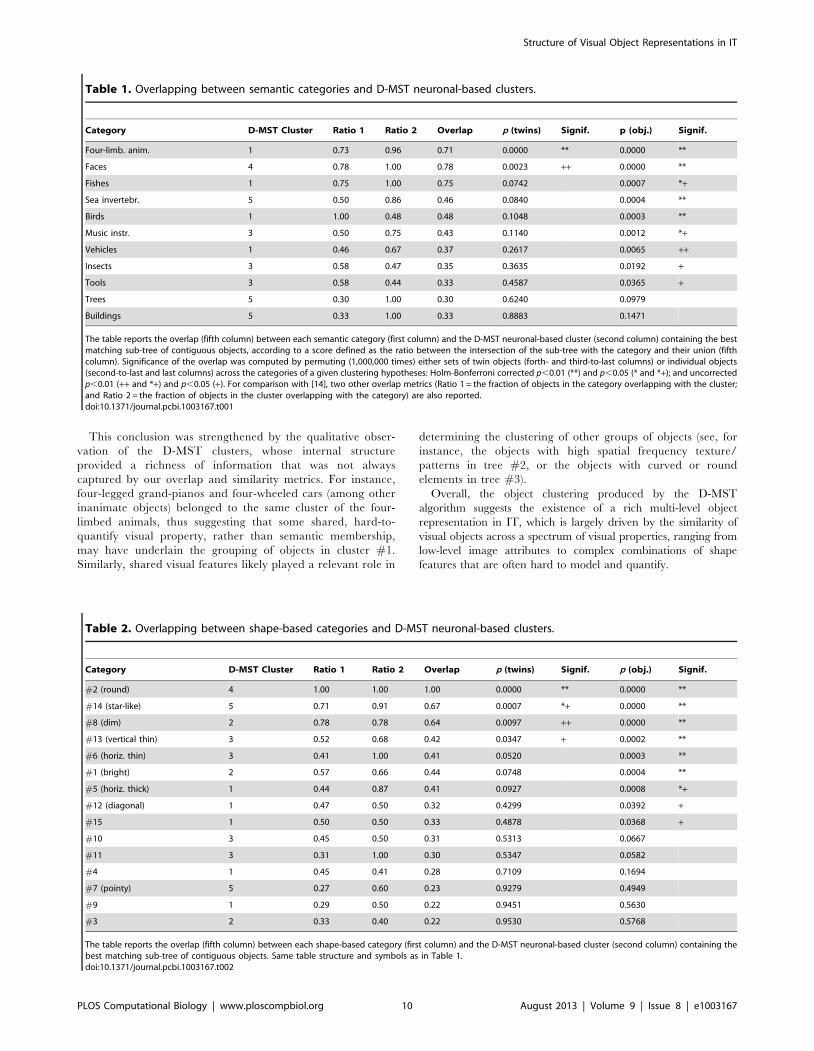
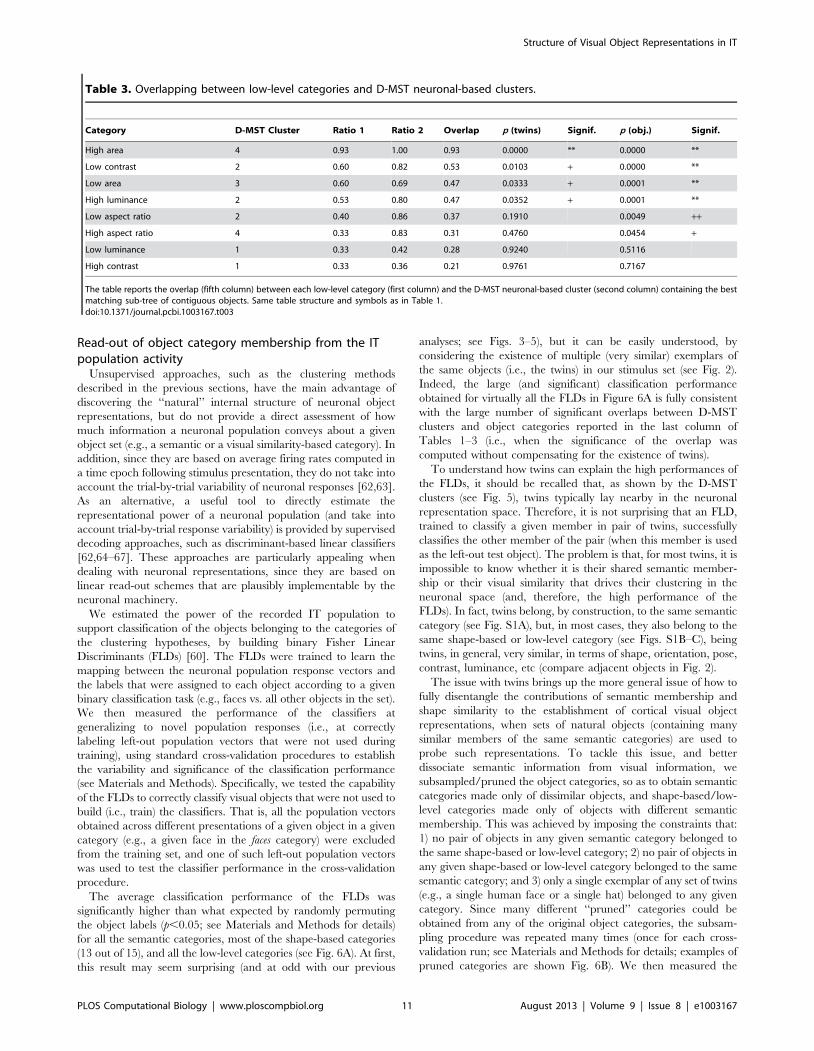
Table 1. Overlapping between semantic categories and D-MST neuronal-based clusters.
Category D-MST Cluster Ratio 1 Ratio 2 Overlap p (twins) Signif. p (obj.) Signif.
Four-limb. anim. 1 0.73 0.96 0.71 0.0000 ** 0.0000 **
Faces 4 0.78 1.00 0.78 0.0023 ++ 0.0000 **
Fishes 1 0.75 1.00 0.75 0.0742 0.0007 *+
Sea invertebr. 5 0.50 0.86 0.46 0.0840 0.0004 **
Birds 1 1.00 0.48 0.48 0.1048 0.0003 **
Music instr. 3 0.50 0.75 0.43 0.1140 0.0012 *+
Vehicles 1 0.46 0.67 0.37 0.2617 0.0065 ++
Insects 3 0.58 0.47 0.35 0.3635 0.0192 +
Tools 3 0.58 0.44 0.33 0.4587 0.0365 +
Trees 5 0.30 1.00 0.30 0.6240 0.0979
Buildings 5 0.33 1.00 0.33 0.8883 0.1471
The table reports the overlap (fifth column) between each semantic category (first column) and the D-MST neuronal-based cluster (second column) containing the bestmatching sub-tree of contiguous objects, according to a score defined as the ratio between the intersection of the sub-tree with the category and their union (fifthcolumn). Significance of the overlap was computed by permuting (1,000,000 times) either sets of twin objects (forth- and third-to-last columns) or individual objects(second-to-last and last columns) across the categories of a given clustering hypotheses: Holm-Bonferroni corrected p,0.01 (**) and p,0.05 (* and *+); and uncorrectedp,0.01 (++ and *+) and p,0.05 (+). For comparison with [14], two other overlap metrics (Ratio 1 = the fraction of objects in the category overlapping with the cluster;and Ratio 2 = the fraction of objects in the cluster overlapping with the category) are also reported.doi:10.1371/journal.pcbi.1003167.t001
Table 2. Overlapping between shape-based categories and D-MST neuronal-based clusters.
Category D-MST Cluster Ratio 1 Ratio 2 Overlap p (twins) Signif. p (obj.) Signif.
#2 (round) 4 1.00 1.00 1.00 0.0000 ** 0.0000 **
#14 (star-like) 5 0.71 0.91 0.67 0.0007 *+ 0.0000 **
#8 (dim) 2 0.78 0.78 0.64 0.0097 ++ 0.0000 **
#13 (vertical thin) 3 0.52 0.68 0.42 0.0347 + 0.0002 **
#6 (horiz. thin) 3 0.41 1.00 0.41 0.0520 0.0003 **
#1 (bright) 2 0.57 0.66 0.44 0.0748 0.0004 **
#5 (horiz. thick) 1 0.44 0.87 0.41 0.0927 0.0008 *+
#12 (diagonal) 1 0.47 0.50 0.32 0.4299 0.0392 +
#15 1 0.50 0.50 0.33 0.4878 0.0368 +
#10 3 0.45 0.50 0.31 0.5313 0.0667
#11 3 0.31 1.00 0.30 0.5347 0.0582
#4 1 0.45 0.41 0.28 0.7109 0.1694
#7 (pointy) 5 0.27 0.60 0.23 0.9279 0.4949
#9 1 0.29 0.50 0.22 0.9451 0.5630
#3 2 0.33 0.40 0.22 0.9530 0.5768
The table reports the overlap (fifth column) between each shape-based category (first column) and the D-MST neuronal-based cluster (second column) containing thebest matching sub-tree of contiguous objects. Same table structure and symbols as in Table 1.doi:10.1371/journal.pcbi.1003167.t002
Structure of Visual Object Representations in IT
PLOS Computational Biology | www.ploscompbiol.org 10 August 2013 | Volume 9 | Issue 8 | e1003167
Read-out of object category membership from the ITpopulation activity
Unsupervised approaches, such as the clustering methods
described in the previous sections, have the main advantage of
discovering the ‘‘natural’’ internal structure of neuronal object
representations, but do not provide a direct assessment of how
much information a neuronal population conveys about a given
object set (e.g., a semantic or a visual similarity-based category). In
addition, since they are based on average firing rates computed in
a time epoch following stimulus presentation, they do not take into
account the trial-by-trial variability of neuronal responses [62,63].
As an alternative, a useful tool to directly estimate the
representational power of a neuronal population (and take into
account trial-by-trial response variability) is provided by supervised
decoding approaches, such as discriminant-based linear classifiers
[62,64–67]. These approaches are particularly appealing when
dealing with neuronal representations, since they are based on
linear read-out schemes that are plausibly implementable by the
neuronal machinery.
We estimated the power of the recorded IT population to
support classification of the objects belonging to the categories of
the clustering hypotheses, by building binary Fisher Linear
Discriminants (FLDs) [60]. The FLDs were trained to learn the
mapping between the neuronal population response vectors and
the labels that were assigned to each object according to a given
binary classification task (e.g., faces vs. all other objects in the set).
We then measured the performance of the classifiers at
generalizing to novel population responses (i.e., at correctly
labeling left-out population vectors that were not used during
training), using standard cross-validation procedures to establish
the variability and significance of the classification performance
(see Materials and Methods). Specifically, we tested the capability
of the FLDs to correctly classify visual objects that were not used to
build (i.e., train) the classifiers. That is, all the population vectors
obtained across different presentations of a given object in a given
category (e.g., a given face in the faces category) were excluded
from the training set, and one of such left-out population vectors
was used to test the classifier performance in the cross-validation
procedure.
The average classification performance of the FLDs was
significantly higher than what expected by randomly permuting
the object labels (p,0.05; see Materials and Methods for details)
for all the semantic categories, most of the shape-based categories
(13 out of 15), and all the low-level categories (see Fig. 6A). At first,
this result may seem surprising (and at odd with our previous
analyses; see Figs. 3–5), but it can be easily understood, by
considering the existence of multiple (very similar) exemplars of
the same objects (i.e., the twins) in our stimulus set (see Fig. 2).
Indeed, the large (and significant) classification performance
obtained for virtually all the FLDs in Figure 6A is fully consistent
with the large number of significant overlaps between D-MST
clusters and object categories reported in the last column of
Tables 1–3 (i.e., when the significance of the overlap was
computed without compensating for the existence of twins).
To understand how twins can explain the high performances of
the FLDs, it should be recalled that, as shown by the D-MST
clusters (see Fig. 5), twins typically lay nearby in the neuronal
representation space. Therefore, it is not surprising that an FLD,
trained to classify a given member in pair of twins, successfully
classifies the other member of the pair (when this member is used
as the left-out test object). The problem is that, for most twins, it is
impossible to know whether it is their shared semantic member-
ship or their visual similarity that drives their clustering in the
neuronal space (and, therefore, the high performance of the
FLDs). In fact, twins belong, by construction, to the same semantic
category (see Fig. S1A), but, in most cases, they also belong to the
same shape-based or low-level category (see Figs. S1B–C), being
twins, in general, very similar, in terms of shape, orientation, pose,
contrast, luminance, etc (compare adjacent objects in Fig. 2).
The issue with twins brings up the more general issue of how to
fully disentangle the contributions of semantic membership and
shape similarity to the establishment of cortical visual object
representations, when sets of natural objects (containing many
similar members of the same semantic categories) are used to
probe such representations. To tackle this issue, and better
dissociate semantic information from visual information, we
subsampled/pruned the object categories, so as to obtain semantic
categories made only of dissimilar objects, and shape-based/low-
level categories made only of objects with different semantic
membership. This was achieved by imposing the constraints that:
1) no pair of objects in any given semantic category belonged to
the same shape-based or low-level category; 2) no pair of objects in
any given shape-based or low-level category belonged to the same
semantic category; and 3) only a single exemplar of any set of twins
(e.g., a single human face or a single hat) belonged to any given
category. Since many different ‘‘pruned’’ categories could be
obtained from any of the original object categories, the subsam-
pling procedure was repeated many times (once for each cross-
validation run; see Materials and Methods for details; examples of
pruned categories are shown Fig. 6B). We then measured the
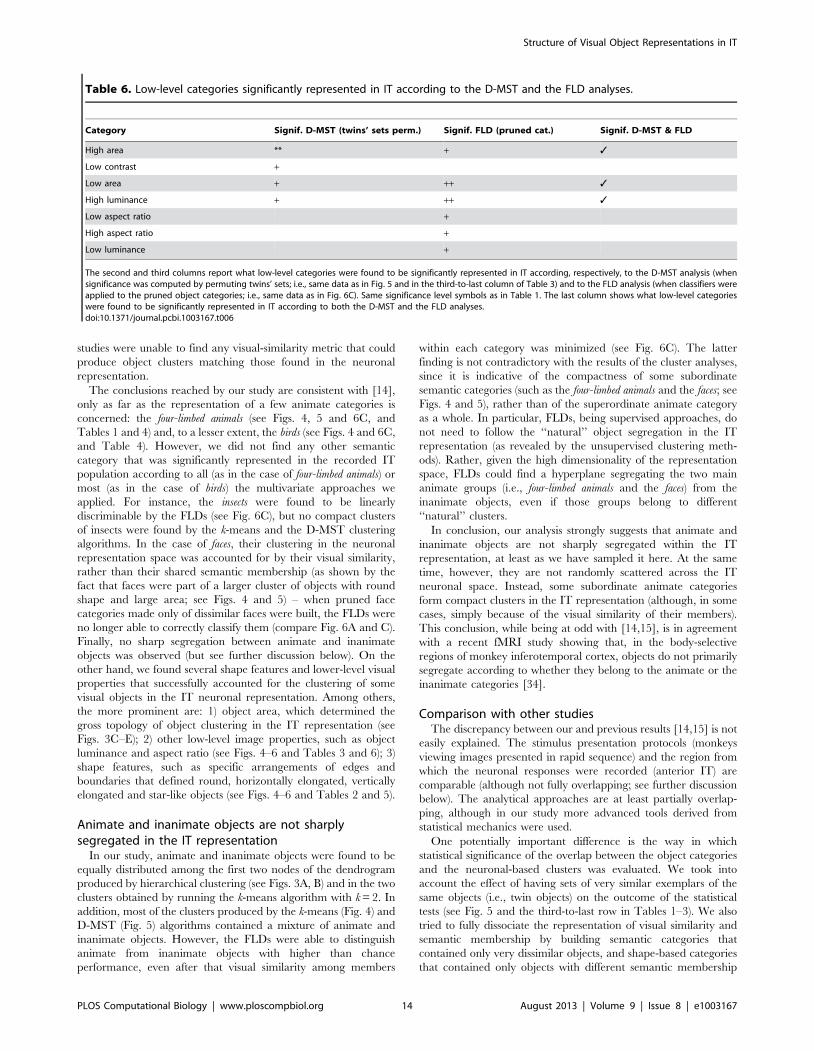
Table 3. Overlapping between low-level categories and D-MST neuronal-based clusters.
Category D-MST Cluster Ratio 1 Ratio 2 Overlap p (twins) Signif. p (obj.) Signif.
High area 4 0.93 1.00 0.93 0.0000 ** 0.0000 **
Low contrast 2 0.60 0.82 0.53 0.0103 + 0.0000 **
Low area 3 0.60 0.69 0.47 0.0333 + 0.0001 **
High luminance 2 0.53 0.80 0.47 0.0352 + 0.0001 **
Low aspect ratio 2 0.40 0.86 0.37 0.1910 0.0049 ++
High aspect ratio 4 0.33 0.83 0.31 0.4760 0.0454 +
Low luminance 1 0.33 0.42 0.28 0.9240 0.5116
High contrast 1 0.33 0.36 0.21 0.9761 0.7167
The table reports the overlap (fifth column) between each low-level category (first column) and the D-MST neuronal-based cluster (second column) containing the bestmatching sub-tree of contiguous objects. Same table structure and symbols as in Table 1.doi:10.1371/journal.pcbi.1003167.t003
Structure of Visual Object Representations in IT
PLOS Computational Biology | www.ploscompbiol.org 11 August 2013 | Volume 9 | Issue 8 | e1003167

performance of the FLDs at correctly classifying left-out objects
from such pruned categories (see Fig. 6C).
As expected, the classification performance of the FLDs was
much reduced, as compared to what obtained with the original
categories (compare Figs. 6A and C). Only three of the
subordinate semantic categories (birds, four-limbed animals, and
insects; see Fig. 6C, first panel) were classified with a performance
that was higher than what expected by chance (p,0.05,
permutation test; see Materials and Methods for details). In
addition, the animate category (as a whole) was discriminated with
higher than chance performance from the inanimate category.
Among the categories defined by visual similarity, five shape-based
categories (round, star-like, horizontal thin, pointy and vertical thin
objects), as well as six low-level categories (high and low area, high
and low luminance and high and low aspect ratio objects), were all
classified with higher than chance performance by the FLDs (see
second and third panels in Figs. 6C). Among all tested categories,
the highest classification performance (.75% correct) was
obtained for the shape-based category of round objects (this was
the only performance to remain significantly higher than chance,
after that a Bonferroni correction for multiple comparisons was
applied).
Overall, the result of the FLD analysis, applied to the pruned
categories, was in good agreement with the result of the D-MST
clustering, when significance was computed by permuting twins’
sets (see Fig. 5 and Tables 1–3, third-to-last column). Comparing
Figure 6. Fisher Linear Discriminant (FLD) analysis of IT population activity. (A) Each gray bar reports the average performance of a binaryFLD at correctly classifying members of a given object category (e.g., faces) from all other objects in the set. For each binary classification task, thestandard deviation of the performance (error bars), and the mean and standard deviation of the null distribution (gray circles and their error bars),against which significant deviation of performance from chance was assessed (same significance level symbols as in Table 1), are also reported (seeMaterials and Methods for a description of the cross-validation and permutation procedures yielding these summary statistics). (B) Examples of‘‘pruned’’ semantic, shape-based and low-level categories that were obtained by subsampling the original object categories (shown in Fig. S1), so asto minimize the overlap between semantic and visual information (see Materials and Methods for details). (C) Performance of the FLDs at correctlyclassifying members of the pruned categories (same symbols as in A).doi:10.1371/journal.pcbi.1003167.g006
Structure of Visual Object Representations in IT
PLOS Computational Biology | www.ploscompbiol.org 12 August 2013 | Volume 9 | Issue 8 | e1003167
the outcome of the two analyses (see Tables 4–6), only a few
differences emerged. For instance, the insects (among the semantic
categories) and the pointy objects (among the shape-based
categories) were significantly represented in the neuronal space
according to the FLD analysis, but not according to the D-MST.
Similarly, the animate and inanimate categories were linearly
separable according to the FLD analysis, although animate and
inanimate objects were not sharply segregated in different D-
MST clusters (as also shown by the hierarchical clustering and k-
means analysis; see Figs. 3A-B and 4). Such discrepancies are not
surprising, since, in general, supervised and unsupervised
multivariate approaches provide complementary information
about data representations – for instance, linear separability (as
measured by FLDs’ classification performance) is not bound to
perfectly match the clustering of data in a representational space
(see further comments in the Discussion). Hence, the importance
of combing both kinds of approaches when exploring a
multivariate data set. When this was done, and the outcomes of
the D-MST and FLD analyses were taken together, a very
conservative assessment of what object categories were repre-
sented by the recorded IT population was achieved (see last
column in Tables 4–6) – one semantic category (the four-limbed
animals), three shape-based categories (round, star-like and vertical
thin objects), and three low-level categories (high area, low area and
high luminance) turned out to be significantly represented according
to both approaches. Overall, this confirmed that visual similarity
(at the level of both shape and lower-order properties) accounted
for the neuronal representation of visual objects better than
semantic membership did.
Discussion
This study investigated what visual object properties were
represented in a neuronal population that was recorded from
monkey inferotemporal cortex. To this aim, we defined three
alternative hypotheses that could underlie the clustering of a
battery of visual objects within the IT neuronal representation
space: 1) shared semantic membership; 2) shared visual shape
features (i.e., shape similarity); and 3) shared low-level visual
properties. We then applied an array of unsupervised and
supervised machine learning approaches to understand whether
the object categories defined by these hypotheses were robustly
represented in the recorded IT neuronal population. Based on
these approaches, we concluded that the coarse clustering of visual
objects in the neuronal representation space was mainly driven by
low-level visual properties, while its finer-grain structure depended
on higher-level shape features, with little role played by semantic
membership (although our analyses cannot exclude that at least
one semantic category – the four-limbed animals – was also robustly
represented in the recorded IT population).
These conclusions are mostly in disagreement with those of two
recent studies [14,15] that also investigated the nature of object
representations in monkey IT (and its human homologous). In
these studies, the authors found a sharp segregation between
animate and inanimate objects, and a finer-grain clustering within
the animate category that matched closely several subordinates
semantic categories (named ‘‘intuitive’’ or ‘‘human-conventional’’
categories by the authors), such as faces, body parts, four-limbed
animals, fishes, reptiles, butterflies, etc. Most remarkably, these
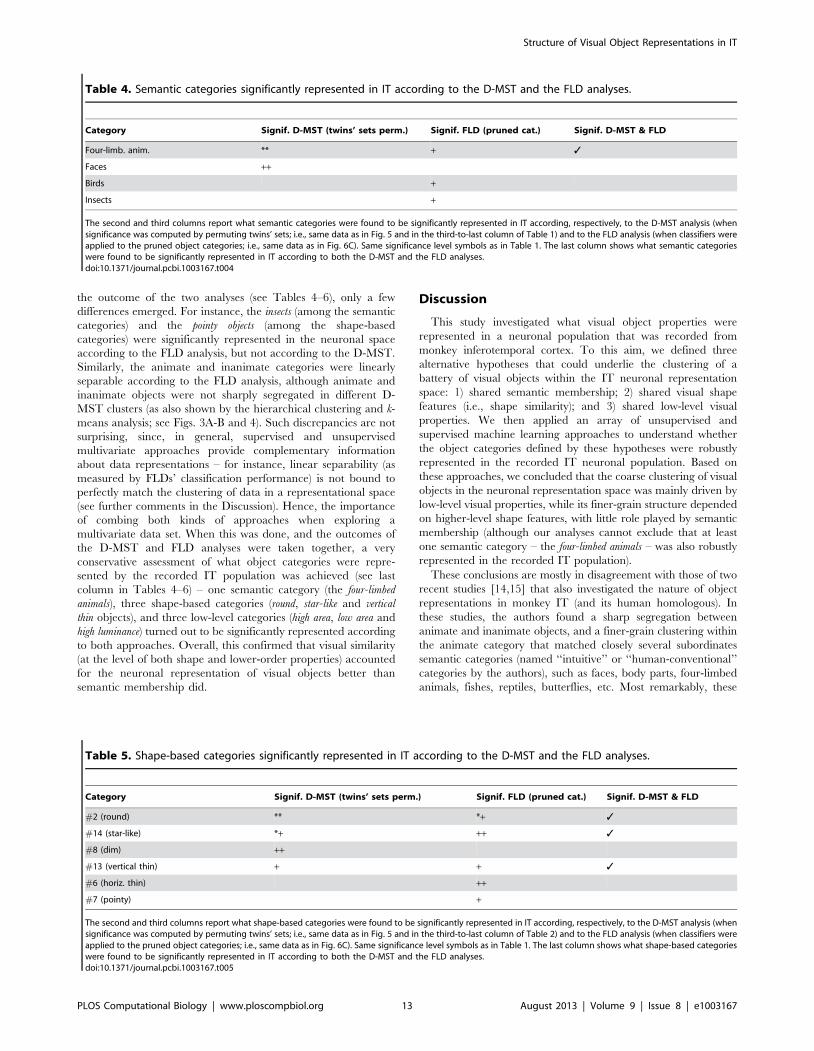
Table 4. Semantic categories significantly represented in IT according to the D-MST and the FLD analyses.
Category Signif. D-MST (twins’ sets perm.) Signif. FLD (pruned cat.) Signif. D-MST & FLD
Four-limb. anim. ** + 3
Faces ++
Birds +
Insects +
The second and third columns report what semantic categories were found to be significantly represented in IT according, respectively, to the D-MST analysis (whensignificance was computed by permuting twins’ sets; i.e., same data as in Fig. 5 and in the third-to-last column of Table 1) and to the FLD analysis (when classifiers wereapplied to the pruned object categories; i.e., same data as in Fig. 6C). Same significance level symbols as in Table 1. The last column shows what semantic categorieswere found to be significantly represented in IT according to both the D-MST and the FLD analyses.doi:10.1371/journal.pcbi.1003167.t004
Table 5. Shape-based categories significantly represented in IT according to the D-MST and the FLD analyses.
Category Signif. D-MST (twins’ sets perm.) Signif. FLD (pruned cat.) Signif. D-MST & FLD
#2 (round) ** *+ 3
#14 (star-like) *+ ++ 3
#8 (dim) ++
#13 (vertical thin) + + 3
#6 (horiz. thin) ++
#7 (pointy) +
The second and third columns report what shape-based categories were found to be significantly represented in IT according, respectively, to the D-MST analysis (whensignificance was computed by permuting twins’ sets; i.e., same data as in Fig. 5 and in the third-to-last column of Table 2) and to the FLD analysis (when classifiers wereapplied to the pruned object categories; i.e., same data as in Fig. 6C). Same significance level symbols as in Table 1. The last column shows what shape-based categorieswere found to be significantly represented in IT according to both the D-MST and the FLD analyses.doi:10.1371/journal.pcbi.1003167.t005
Structure of Visual Object Representations in IT
PLOS Computational Biology | www.ploscompbiol.org 13 August 2013 | Volume 9 | Issue 8 | e1003167
studies were unable to find any visual-similarity metric that could
produce object clusters matching those found in the neuronal
representation.
The conclusions reached by our study are consistent with [14],
only as far as the representation of a few animate categories is
concerned: the four-limbed animals (see Figs. 4, 5 and 6C, and
Tables 1 and 4) and, to a lesser extent, the birds (see Figs. 4 and 6C,
and Table 4). However, we did not find any other semantic
category that was significantly represented in the recorded IT
population according to all (as in the case of four-limbed animals) or
most (as in the case of birds) the multivariate approaches we
applied. For instance, the insects were found to be linearly
discriminable by the FLDs (see Fig. 6C), but no compact clusters
of insects were found by the k-means and the D-MST clustering
algorithms. In the case of faces, their clustering in the neuronal
representation space was accounted for by their visual similarity,
rather than their shared semantic membership (as shown by the
fact that faces were part of a larger cluster of objects with round
shape and large area; see Figs. 4 and 5) – when pruned face
categories made only of dissimilar faces were built, the FLDs were
no longer able to correctly classify them (compare Fig. 6A and C).
Finally, no sharp segregation between animate and inanimate
objects was observed (but see further discussion below). On the
other hand, we found several shape features and lower-level visual
properties that successfully accounted for the clustering of some
visual objects in the IT neuronal representation. Among others,
the more prominent are: 1) object area, which determined the
gross topology of object clustering in the IT representation (see
Figs. 3C–E); 2) other low-level image properties, such as object
luminance and aspect ratio (see Figs. 4–6 and Tables 3 and 6); 3)
shape features, such as specific arrangements of edges and
boundaries that defined round, horizontally elongated, vertically
elongated and star-like objects (see Figs. 4–6 and Tables 2 and 5).
Animate and inanimate objects are not sharplysegregated in the IT representation
In our study, animate and inanimate objects were found to be
equally distributed among the first two nodes of the dendrogram
produced by hierarchical clustering (see Figs. 3A, B) and in the two
clusters obtained by running the k-means algorithm with k = 2. In
addition, most of the clusters produced by the k-means (Fig. 4) and
D-MST (Fig. 5) algorithms contained a mixture of animate and
inanimate objects. However, the FLDs were able to distinguish
animate from inanimate objects with higher than chance
performance, even after that visual similarity among members
within each category was minimized (see Fig. 6C). The latter
finding is not contradictory with the results of the cluster analyses,
since it is indicative of the compactness of some subordinate
semantic categories (such as the four-limbed animals and the faces; see
Figs. 4 and 5), rather than of the superordinate animate category
as a whole. In particular, FLDs, being supervised approaches, do
not need to follow the ‘‘natural’’ object segregation in the IT
representation (as revealed by the unsupervised clustering meth-
ods). Rather, given the high dimensionality of the representation
space, FLDs could find a hyperplane segregating the two main
animate groups (i.e., four-limbed animals and the faces) from the
inanimate objects, even if those groups belong to different
‘‘natural’’ clusters.
In conclusion, our analysis strongly suggests that animate and
inanimate objects are not sharply segregated within the IT
representation, at least as we have sampled it here. At the same
time, however, they are not randomly scattered across the IT
neuronal space. Instead, some subordinate animate categories
form compact clusters in the IT representation (although, in some
cases, simply because of the visual similarity of their members).
This conclusion, while being at odd with [14,15], is in agreement
with a recent fMRI study showing that, in the body-selective
regions of monkey inferotemporal cortex, objects do not primarily
segregate according to whether they belong to the animate or the
inanimate categories [34].
Comparison with other studiesThe discrepancy between our and previous results [14,15] is not
easily explained. The stimulus presentation protocols (monkeys
viewing images presented in rapid sequence) and the region from
which the neuronal responses were recorded (anterior IT) are
comparable (although not fully overlapping; see further discussion
below). The analytical approaches are at least partially overlap-
ping, although in our study more advanced tools derived from
statistical mechanics were used.
One potentially important difference is the way in which
statistical significance of the overlap between the object categories
and the neuronal-based clusters was evaluated. We took into
account the effect of having sets of very similar exemplars of the
same objects (i.e., twin objects) on the outcome of the statistical
tests (see Fig. 5 and the third-to-last row in Tables 1–3). We also
tried to fully dissociate the representation of visual similarity and
semantic membership by building semantic categories that
contained only very dissimilar objects, and shape-based categories
that contained only objects with different semantic membership
Table 6. Low-level categories significantly represented in IT according to the D-MST and the FLD analyses.
Category Signif. D-MST (twins’ sets perm.) Signif. FLD (pruned cat.) Signif. D-MST & FLD
High area ** + 3
Low contrast +
Low area + ++ 3
High luminance + ++ 3
Low aspect ratio +
High aspect ratio +
Low luminance +
The second and third columns report what low-level categories were found to be significantly represented in IT according, respectively, to the D-MST analysis (whensignificance was computed by permuting twins’ sets; i.e., same data as in Fig. 5 and in the third-to-last column of Table 3) and to the FLD analysis (when classifiers wereapplied to the pruned object categories; i.e., same data as in Fig. 6C). Same significance level symbols as in Table 1. The last column shows what low-level categorieswere found to be significantly represented in IT according to both the D-MST and the FLD analyses.doi:10.1371/journal.pcbi.1003167.t006
Structure of Visual Object Representations in IT
PLOS Computational Biology | www.ploscompbiol.org 14 August 2013 | Volume 9 | Issue 8 | e1003167

(see Fig. 6B–C). As far as we understand, the effect of twins on the
overlap score was not taken into account by Kiani and colleagues
[14], in spite of the many different exemplars of the same objects
contained in their object set. As shown by our results, shuffling
objects rather than twins’ sets in the statistical analysis, dramat-
ically increased the number of significant overlaps between D-
MST neuronal-based clusters and object categories (compare the
third-to-last and last columns in Tables 1–3). The impact of shape
similarity on the representation of semantic categories was shown
to be even more dramatic in the case of the FLD analysis –
minimizing shape similarity within semantic categories dramati-
cally reduced the number of categories, whose elements were
classified with higher than chance performance by FLDs (compare
the first panels in Fig. 6A and Fig. 6C).
The failure of the visual similarity metrics used by [14,15] to
account for object clustering in IT could be explained by the
different metrics used in their studies and ours. In particular,
although we used the same object recognition model [43,68] to
quantify shape similarity, our implementation of the model
included a much larger number of output units (24,451) as
compared to [14] (674). In fact, we did not try to match the
number of model output units to the number of recorded neurons
(as done by [14]), since our goal was not to model IT, but, rather,
to find a metric that was as powerful as possible in capturing the
visual shape similarity among the objects in our set.
Another substantial difference is represented by the stimulus set.
The objects used in our experiments were grayscale pictures of
natural objects, while, in the studies of [14,15], color pictures were
used. Color is obviously a very salient object feature that could
have strongly influenced the object clustering reported in those
studies. For instance, human faces, hands, body parts and, to a
lesser extent, monkey faces, as well as the fur of many animals, all
have a pink/brownish hue that could have driven their clustering
in the superordinate category of animate objects. Noticeably, in
the above-mentioned fMRI study that found no segregation
between animate and inanimate objects, grayscale pictures were
used [34]. In conclusion, the use of colorful images in [14,15]
represents a major confounding factor, since IT color tuning may
interact with IT shape tuning in ways that are hard to quantify/
model.
Yet another difference is the lower number of visual objects we
tested (213), the smaller population of IT neurons we recorded
(94), and the smaller extent of IT cortex we sampled, as compared
to Kiani and colleagues (who tested 1,084 objects and recorded the
responses of 674 IT neurons). These are three separate, but
related, issues, each deserving a specific discussion.
While, in general, recording from a wider IT neuronal sample
would lead to a more refined assessment of IT neuronal
population coding, it is unclear whether major qualitative
differences in the structure of visual object representations would
emerge as a function of the size of the recorded neuronal pool.
Previous investigations of population coding in IT have shown a
gradual increase of the amount of information conveyed by a pool
of IT neurons about object identity or category as a function of the
pool size, but they have not reported any dramatic qualitative shift
in what the neuronal pool would code depending on its size
[30,64,66]. In addition, these studies have revealed that small
pools of IT neurons can be as effective (or more effective) than
much larger populations, as long as their selectivity for object
identity or category is very strong. In this regard, it should be
noted that Kiani and colleagues recorded every neuron they could
isolate regardless of its stimulus responsiveness or selectivity, which
could potentially have resulted in a neuronal pool with many
unresponsive or non-selective cells (they report that 38% of their
neurons were category selective). By contrast, we recorded only
cells with a statistically reliable response to at least one of the
objects in our stimulus set, thus obtaining a population of neurons
with robust tuning across the tested objects (see [38]). Based on the
above-mentioned population coding studies, this suggests that
Kiani and colleagues’ larger IT sample could only be marginally
better than our smaller (but more selective) neuronal pool at
estimating IT neuronal representations of visual objects (the large
performances achieved by the FLDs in Fig. 6 confirm the
effectiveness of the sampled IT population at conveying informa-
tion about features/properties of our object set).
As far as the size of the stimulus set is concerned, it should be
noted that a larger stimulus set does not necessarily mean a better
stimulus set, when it comes to disentangling alternative clustering
hypotheses. First, as pointed out above, a large number of very
similar exemplars per category could lead to an overestimation of
the significance of the overlap between neuronal-based clusters
and, for instance, semantic categories, if not properly taken into
account in the statistical analysis. Second, although our semantic
categories typically contained less exemplars than those used by
Kiani and colleagues, the superordinate categories of animate and
animate objects used in our study contained a large number of
exemplars. Nevertheless, as pointed out above, we did not found
any sharp segregation of these two categories in the IT
representation.
Finally, one factor that could explain some of the discrepancies
between our conclusions and those of Kiani and colleagues is the
different extent of IT cortex that was sampled in the two studies.
Our recordings targeted the most medial part of the ventral bank
of STS and of the ventral surface lateral to AMTS (see blue dots
and red-shaded areas in Fig. 1) and spanned a 13–17 mm
anteroposterior range, while Kiani and colleagues sampled a
larger portion of IT, both mediolaterally (i.e., including the gyrus
between STS and AMTS), and anteroposteriorly (i.e., a 13/15–
20 mm span; see Fig. 1 in [14]). This suggests that recordings in
[14] may have sampled sub-regions in IT that are known to
contain enriched populations of face-selective cells (i.e., the
anterior face patches AL and AM [33]; see Fig. 1), while, in our
study, only a minimal overlap between recording sites and face
patch AM could, in principle, be expected (in practice, our IT
sample did not contain any cell that was sharply tuned for faces;
see Fig. S3 and further discussion in the next Section). This could
explain why in [14], differently from our study, a sharp clustering
of human, monkey, and animal faces was found in the IT
representation.
To conclude, it is hard to infer what methodological differences
may be at the root of the discrepancies between our study and
[14,15]. Above, we have listed some of the differences that could
be crucial. Ultimately, however, only a re-analysis of Kiani and
colleagues’ data with our analytical/statistical approaches, or,
better, a full new set of recordings (e.g., with grayscale versions of
the images used by Kiani and colleagues) could shed more light on
the causes of these discrepancies. Both approaches are clearly
beyond the scope of this study, but could be an interesting target of
future investigations by ours or other groups.
Validity and implications of our findingsAs pointed out in a recent review [13], two main competing
ideas exist about what kind of object information is coded by the
ventral stream, and, in particular, by its highest stage – anterior
IT. On the one hand, many single-unit studies in monkeys support
the notion of structural (or shape-based) representations along the
ventral stream – i.e., combinations of object-defining visual
features of increasing complexity are coded along the ventral
Structure of Visual Object Representations in IT
PLOS Computational Biology | www.ploscompbiol.org 15 August 2013 | Volume 9 | Issue 8 | e1003167
steam, with the highest complexity of configural coding reached in
anterior IT (see [2,4,6] for a review). On the other hand, another
line of evidence (mainly coming from human lesion and fMRI
studies) supports the existence of semantic categorical representa-
tions along the ventral stream – i.e., human high-level represen-
tations of visual objects segregate according to object function/
meaning rather than shape [17–24]. The findings reported by
[14,15] have added evidence based on monkey single-unit
recordings to support the latter notion.
Our study, on the contrary, strongly supports the notion that
inferotemporal neuronal ensembles, in the monkey brain, mainly
represent visual, rather than semantic, information. In particular,
our analyses show that IT response patterns code not only
structural/configural shape information of various complexity, but
also a whole array of low-level image properties (such a overall
luminance, area, aspect ratio, etc.). On the one hand, this is
surprising, since this kind of low-level information contained in the
visual input is typically though to be extracted by lower-level visual
areas and not to be preserved and coded in IT. On the other hand,
previous computational and empirical studies have shown that
object identity is represented along with other low-level properties
in IT, namely position and size. In particular, it has been shown
that IT neuronal ensembles can code not only object identity
regardless of position/size [64–66] (thus conveying a position/size
invariant object representation), but they can also code object
position/size regardless of object identity [64], and can jointly
code object position and identity [65] (i.e., report the identity of a
specific object at a specific visual field location). Our findings not
only confirm these previous conclusions (extending them to a
larger set of low-level properties), but also show how, topologically,
some low-level properties (e.g., area of the visual field subtended
by each visual object) and higher-order shape features are co-
represented in IT (with the former determining the gross topology
of object representations and the latter determining their finer-
grain structure).
As far as semantic categories are concerned, only for the four-
limbed animals we observed a significant and robust representa-
tion of semantic membership that could not be accounted by their
visual similarity (see Table 4). This could either be the result of an
extremely transformation-invariant population code of animal-like
objects (and, therefore, still shape-based, although not captured by
our visual similarity metrics), or could reflect learned associations
between objects with dissimilar shape but similar meaning/
function. The latter hypothesis would be consistent with the
finding that neurons in higher-order areas of both the ventral and
the dorsal streams can learn to encode general categorical
associations between arbitrary visual patterns [25–27,69–71],
and would support the notion that semantic (or categorical)
representations do exist in monkey IT [30], at least for a few
selected, behaviorally relevant categories.
This raises the issue of what object categories, in our stimulus
set, can be considered as behaviorally relevant (or meaningful) for
the monkeys. This is obviously an important issue, when
considering the generality of our conclusions, since the failure to
observe a significant representation for most semantic categories
could be due to their lack of ‘‘meaning’’ for the monkeys. While
some animate categories (such as the four-limbed animals and the
faces) are likely meaningful for the monkeys (either because
innately such, or because meaning may have been acquired
through repeated exposure to members of these categories, e.g.,
other monkeys and humans), other categories (especially among
the inanimate set) are likely arbitrary collections of objects for the
monkeys. Regardless of their likely meaningfulness for the
monkeys, there are three reasons why it was important for us to
ask how well all these categories were represented in IT. First, our
semantic categories were defined so as to match as close as possible
those defined by Kiani and colleagues [14], who found a
significant representation in IT not only for four-limbed animals
and faces, but also for most other animate categories (i.e., birds,
reptiles, butterflies, fishes, etc.). Moreover, although in [14] only
one of the inanimate subordinate categories (cars) was found to be
significantly represented in IT, the inanimate category, as a whole,
was sharply segregated from the animate category. Since one of
the goals of our study was to provide a comparison with the
findings of Kiani and colleagues, it was essential to test how well
the animate and inanimate categories, as well as all their possible
subordinate categories were represented in IT. Second, our
monkeys had a daily, prolonged exposure not only to other
monkeys and humans, but also to a variety of inanimate objects,
such as toys, fruits, vegetables, furniture, tools and equipment used
in the animal facility and in the lab (some of which are similar to
the inanimate objects contained of our stimulus set). Therefore, if
the representation of visual objects in monkey IT is organized, at
its most superordinate level, according to an animate/inanimate
distinction (as concluded in [14,15]), there is no reason to believe
that the development of such an animate/inanimate segregation
was precluded to our monkeys. Hence, the relevance of testing the
existence of such a segregation and provide a comparison with
[14]. Third, testing the representation of inanimate (but also
animate) categories without any obvious meaning for the monkeys
(e.g., music instruments or sea invertebrates; see Fig. S1) served as
a demonstration that shape similarity among members of the same
semantic category, if not properly taken into account in the
statistical analysis, can easily lead to an overestimation of how well
semantic membership is represented in visual cortex. This is
shown by the many semantic categories that were found to have a
significant representation in IT according to the D-MST and FLD
analyses, unless shape similarity (e.g., the presence of twins) was
properly accounted for (compare the significance levels in the
third-to-last and last columns of Table 1, and compare Figs. 6A
and C). In summary, testing the many animate and inanimate
categories used in our study provides a valuable comparison with
previous reports [14,15] (e.g., about the animate/inanimate
segregation), and cautions against giving semantic interpretations
of cortical activity patterns that may actually reflect visual shape
similarity. Finally, it is worth pointing out that, as a way to better
understand to what extent behaviorally relevant categories are
represented in monkey IT, future studies should first try to
establish what objects are naturally perceived/judged by monkeys
as belonging to the same categories (e.g., by relying on priming or
adaptation aftereffect paradigms that allow measuring what
objects are spontaneously judged as similar by a subject [72–78]).
To conclude, it should be stressed that the validity and
generality of our conclusions are intrinsically limited by the
limited extent of cortex that was explored through single-unit
recordings here, as compared to the large cortical areas that are
imaged in fMRI studies. In particular, single-unit recordings,
unless paired with fMRI, cannot precisely target cortical regions
that are known to represent specific object categories in monkey
IT. For instance, our recordings did not specifically target any of
the so-called monkey face patches [16,31–33] or other IT regions
that are rich of face selective neurons (summarized in [41,42]) and,
therefore, it is not surprising that no clusters entirely made of faces
were found in our study (instead, the face cluster was part of larger
clusters of objects with round shape and large area; e.g., see cluster
# 4 in Fig. 5). In particular, given the across-monkey variability in
the precise locations of face patches (Fig. 1 shows the range of
possible locations for the three anterior face patches, based on
Structure of Visual Object Representations in IT
PLOS Computational Biology | www.ploscompbiol.org 16 August 2013 | Volume 9 | Issue 8 | e1003167

[33]), the fact that we did not record from the dorsal bank of STS
(thus excluding an overlap between our recording sites and face
patch AF; see Fig. 1), and the fact that our recordings targeted the
most medial part of IT (thus excluding any overlap between our
recording sites and face patch AL; see Fig. 1), it is very unlikely
that our IT sample contained a large fraction of face cells.
Although an overlap between our recording sites and face patch
AM is, in principle, possible (see Fig. 1), we verified that our
sampled IT population did not contain any cell that was sharply
tuned for faces, by computing, for each neuron, the Face
Selectivity Index (FSI) proposed by [32]. Differently from what
reported for face cells (e.g., see Fig. 2 in [32]), none of the neurons
recorded in our study had a FSI exceeding 0.5 (see Fig. S3A).
Moreover, those few cells with FSI,0.5 typically did not show a
sharp segregation between responses to faces and non-faces, and
often had, as preferred stimuli, non-face objects (see Fig. S3B).
Because of such a lack of sharp tuning for faces at the single cell
level, it is not surprising that neither the k-means (see Fig. 4) nor
the D-MST clustering algorithms (see Fig. 5) returned any pure
cluster of faces. Very likely, if our recordings had targeted a wider
extent of IT cortex (as in [14]) or had focused on sub-regions,
within IT, that are rich of face-selective neurons [31–33,41,42],
pure face clusters would have been observed. On the other hand,
having found compact clusters of four-limbed animals and (to a
lesser extent) birds suggests that at least a fraction of the neurons
sampled in our study may have belonged to body selective IT
regions (whose existence is also well-established in monkey IT
[16,31,34]). In other words, our data, while showing that visual
shape similarity is the main factor determining IT object
representations, do not contradict the findings of earlier fMRI
studies about the existence of face and body patches in IT.
In summary, the quantitative characterization of the IT
response patterns performed in this study, while leaving open
the possibility that a few, behaviorally salient semantic categories
may be represented in monkey inferotemporal cortex, strongly
reasserts the primary function of IT as a visual area, in which, in
addition to moderately to highly complex shape information, a
surprisingly large number of low-level visual properties is also
represented.
Materials and Methods
The data analyzed in this study were obtained from the same
experiments described in [38]. We point the reader to this former
study for a full description of surgical, behavioral, and recording
procedures. Here we only provide those details that are essential to
the understanding of the present study. All animal procedures
were performed in accord with National Institute of Health
guidelines and the Massachusetts Institute of Technology Com-
mittee on Animal Care.
Visual stimuli and behavioral taskAll recorded neurons were probed with a fixed set of 213
grayscale pictures of isolated objects that included: 1) 188 images
of real-world objects belonging to 94 different categories (e.g., two
hats, two accordions, two monkey faces, etc.) of the Caltech 101
database [79]; 2) five cars, five human faces, and five abstract
silhouettes; 3) five patches of texture; 4) four low-contrast images of
one of the objects; and 5) a blank frame. The full set is shown in
Figure 2.
All objects subtended 2u of visual angle. During recordings, both
monkeys were engaged in a simple recognition task that required
the detection of a fixed target shape (a red triangle) that was
presented at the end of a temporal sequence of object conditions
drawn from our stimulus set (see [38]). The total number of
stimulus conditions presented on each behavioral trial ranged from
3 to 20. The target was always the last in the sequence, and each
monkey was rewarded for maintaining fixation (1.5u fixation
window) until the appearance of the target and then making a
saccade to a fixed visual field location (7u eccentricity) within
800 ms after the appearance of the target. Visual stimuli were
presented at a rate of 5 per second; i.e., each stimulus condition
was shown for 100 ms, followed by 100 ms of a gray screen (no
stimulus), followed by another stimulus condition for 100 ms, etc.
This task was meant to obtain a large amount of data, while still
engaging the animal in a recognition task
Neuronal recordingsDuring each recording session, a single extracellular metal
electrode was advanced into IT through a stainless still guide tube
that was inserted into a plastic cylindrical recording chamber
(Crist Instruments). The chamber was placed over a craniotomy
targeting the temporal lobe in the left hemisphere from the top of
the skull. Over ,6 months of daily recording sessions in the two
monkeys, we sampled neurons over an ,564 mm area of the
ventral superior temporal sulcus and ventral surface lateral to the
anterior middle temporal sulcus (Horsley-Clarke anteroposterior
coordinates: 13–17 mm), corresponding to several 1 mm-spaced
grid locations of the recording chamber (see Fig. 1). We recorded a
total of 94 well-isolated single units. Each isolated neuron was
initially tested for responsiveness across the set of 213 objects,
presented at the center of gaze, using the following criterion: a
neuron was considered responsive if its mean firing rate was
significantly higher than background rate for at least one of these
objects (t test, p,0.005). Responsive neurons were further screened
to identify their preferred receptive field location (RF center)
within a 2u span around the center of gaze (see [38] for details).
Following these screening procedures, complete recordings from
each neuron were obtained by presenting the full set of 213 objects
at the neuron’s RF center. Five to thirty presentation repetitions
were collected for each object condition.
Similarity metric for population responsesNeuronal responses were quantified by computing the average
number of spikes per second fired by a neuron (i.e., average firing
rate) across all repetitions of a given object, over a time window
starting 100 ms and ending 200 ms after stimulus presentation.
Similarly to what done in [14], the responses of a neuron across the
object set were normalized by first subtracting their mean value
(across the set) and then dividing by their standard deviation. This
normalization compensated for differences in baseline activity and
firing rate range across the recorded neuronal population, and
allowed weighting equally all the neurons contributing to the
population representation of a given object. Each visual object was
thus represented by a neuronal population vector having as
components the normalized responses of all the recorded neurons
to that object. As in [14], the similarity between the population
vectors representing two visual objects i and j was measured by
computing their Pearson correlation coefficient (rij). This metric was
chosen because it is sensitive to the profile of activation of the
neurons produced by a given object, rather than to the absolute
magnitude of the activation. The distance (or dissimilarity) between
the population vectors i and j was then defined as dij = 12rij (the
resulting dissimilarity matrix D is depicted in Fig. 3A).
Unsupervised multivariate approachesThree standard unsupervised approaches were used to under-
stand the structure of visual object representations in IT: 1)
Structure of Visual Object Representations in IT
PLOS Computational Biology | www.ploscompbiol.org 17 August 2013 | Volume 9 | Issue 8 | e1003167
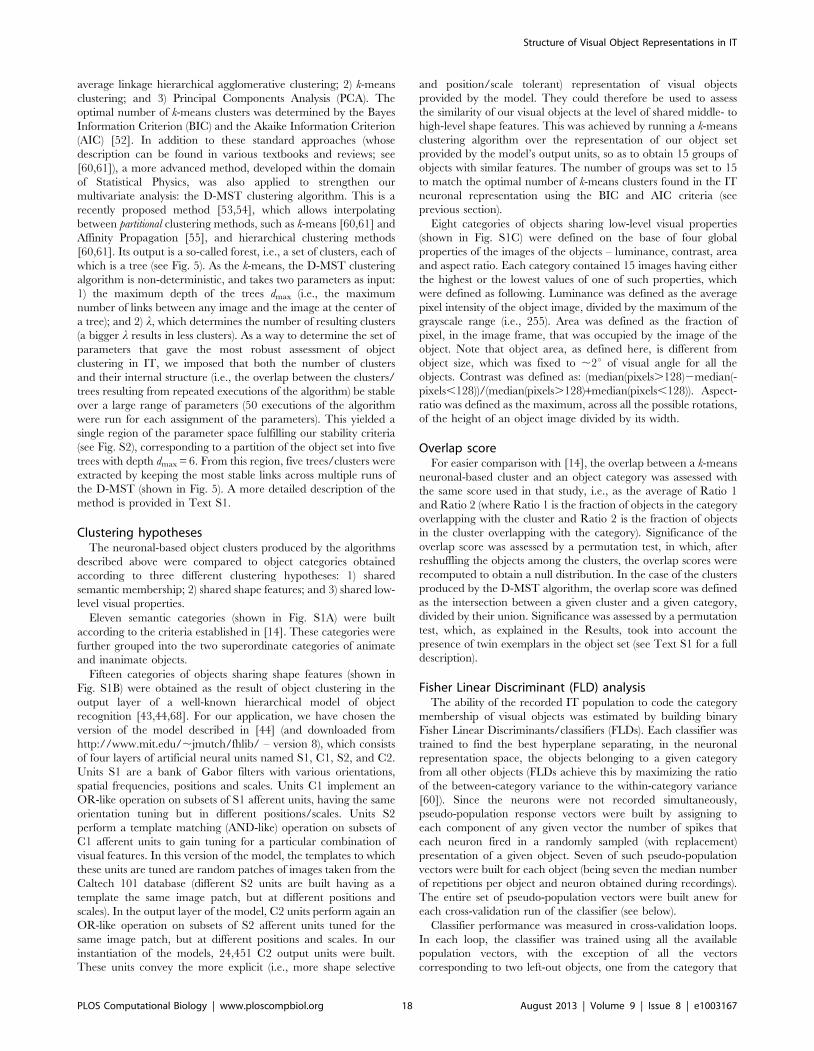
average linkage hierarchical agglomerative clustering; 2) k-means
clustering; and 3) Principal Components Analysis (PCA). The
optimal number of k-means clusters was determined by the Bayes
Information Criterion (BIC) and the Akaike Information Criterion
(AIC) [52]. In addition to these standard approaches (whose
description can be found in various textbooks and reviews; see
[60,61]), a more advanced method, developed within the domain
of Statistical Physics, was also applied to strengthen our
multivariate analysis: the D-MST clustering algorithm. This is a
recently proposed method [53,54], which allows interpolating
between partitional clustering methods, such as k-means [60,61] and
Affinity Propagation [55], and hierarchical clustering methods
[60,61]. Its output is a so-called forest, i.e., a set of clusters, each of
which is a tree (see Fig. 5). As the k-means, the D-MST clustering
algorithm is non-deterministic, and takes two parameters as input:
1) the maximum depth of the trees dmax (i.e., the maximum
number of links between any image and the image at the center of
a tree); and 2) l, which determines the number of resulting clusters
(a bigger l results in less clusters). As a way to determine the set of
parameters that gave the most robust assessment of object
clustering in IT, we imposed that both the number of clusters
and their internal structure (i.e., the overlap between the clusters/
trees resulting from repeated executions of the algorithm) be stable
over a large range of parameters (50 executions of the algorithm
were run for each assignment of the parameters). This yielded a
single region of the parameter space fulfilling our stability criteria
(see Fig. S2), corresponding to a partition of the object set into five
trees with depth dmax = 6. From this region, five trees/clusters were
extracted by keeping the most stable links across multiple runs of
the D-MST (shown in Fig. 5). A more detailed description of the
method is provided in Text S1.
Clustering hypothesesThe neuronal-based object clusters produced by the algorithms
described above were compared to object categories obtained
according to three different clustering hypotheses: 1) shared
semantic membership; 2) shared shape features; and 3) shared low-
level visual properties.
Eleven semantic categories (shown in Fig. S1A) were built
according to the criteria established in [14]. These categories were
further grouped into the two superordinate categories of animate
and inanimate objects.
Fifteen categories of objects sharing shape features (shown in
Fig. S1B) were obtained as the result of object clustering in the
output layer of a well-known hierarchical model of object
recognition [43,44,68]. For our application, we have chosen the
version of the model described in [44] (and downloaded from
http://www.mit.edu/,jmutch/fhlib/ – version 8), which consists
of four layers of artificial neural units named S1, C1, S2, and C2.
Units S1 are a bank of Gabor filters with various orientations,
spatial frequencies, positions and scales. Units C1 implement an
OR-like operation on subsets of S1 afferent units, having the same
orientation tuning but in different positions/scales. Units S2
perform a template matching (AND-like) operation on subsets of
C1 afferent units to gain tuning for a particular combination of
visual features. In this version of the model, the templates to which
these units are tuned are random patches of images taken from the
Caltech 101 database (different S2 units are built having as a
template the same image patch, but at different positions and
scales). In the output layer of the model, C2 units perform again an
OR-like operation on subsets of S2 afferent units tuned for the
same image patch, but at different positions and scales. In our
instantiation of the models, 24,451 C2 output units were built.
These units convey the more explicit (i.e., more shape selective
and position/scale tolerant) representation of visual objects
provided by the model. They could therefore be used to assess
the similarity of our visual objects at the level of shared middle- to
high-level shape features. This was achieved by running a k-means
clustering algorithm over the representation of our object set
provided by the model’s output units, so as to obtain 15 groups of
objects with similar features. The number of groups was set to 15
to match the optimal number of k-means clusters found in the IT
neuronal representation using the BIC and AIC criteria (see
previous section).
Eight categories of objects sharing low-level visual properties
(shown in Fig. S1C) were defined on the base of four global
properties of the images of the objects – luminance, contrast, area
and aspect ratio. Each category contained 15 images having either
the highest or the lowest values of one of such properties, which
were defined as following. Luminance was defined as the average
pixel intensity of the object image, divided by the maximum of the
grayscale range (i.e., 255). Area was defined as the fraction of
pixel, in the image frame, that was occupied by the image of the
object. Note that object area, as defined here, is different from
object size, which was fixed to ,2u of visual angle for all the
objects. Contrast was defined as: (median(pixels.128)2median(-
pixels,128))/(median(pixels.128)+median(pixels,128)). Aspect-
ratio was defined as the maximum, across all the possible rotations,
of the height of an object image divided by its width.
Overlap scoreFor easier comparison with [14], the overlap between a k-means
neuronal-based cluster and an object category was assessed with
the same score used in that study, i.e., as the average of Ratio 1
and Ratio 2 (where Ratio 1 is the fraction of objects in the category
overlapping with the cluster and Ratio 2 is the fraction of objects
in the cluster overlapping with the category). Significance of the
overlap score was assessed by a permutation test, in which, after
reshuffling the objects among the clusters, the overlap scores were
recomputed to obtain a null distribution. In the case of the clusters
produced by the D-MST algorithm, the overlap score was defined
as the intersection between a given cluster and a given category,
divided by their union. Significance was assessed by a permutation
test, which, as explained in the Results, took into account the
presence of twin exemplars in the object set (see Text S1 for a full
description).
Fisher Linear Discriminant (FLD) analysisThe ability of the recorded IT population to code the category
membership of visual objects was estimated by building binary
Fisher Linear Discriminants/classifiers (FLDs). Each classifier was
trained to find the best hyperplane separating, in the neuronal
representation space, the objects belonging to a given category
from all other objects (FLDs achieve this by maximizing the ratio
of the between-category variance to the within-category variance
[60]). Since the neurons were not recorded simultaneously,
pseudo-population response vectors were built by assigning to
each component of any given vector the number of spikes that
each neuron fired in a randomly sampled (with replacement)
presentation of a given object. Seven of such pseudo-population
vectors were built for each object (being seven the median number
of repetitions per object and neuron obtained during recordings).
The entire set of pseudo-population vectors were built anew for
each cross-validation run of the classifier (see below).
Classifier performance was measured in cross-validation loops.
In each loop, the classifier was trained using all the available
population vectors, with the exception of all the vectors
corresponding to two left-out objects, one from the category that
Structure of Visual Object Representations in IT
PLOS Computational Biology | www.ploscompbiol.org 18 August 2013 | Volume 9 | Issue 8 | e1003167

the classifier was being trained to discriminate, and one from the
complementary set. For any given classification task, performance
at correctly classifying left-out vectors was measured over a set of
30 cross-validation loops, with a different pair of left-out objects
randomly chosen in each loop. Each set of cross-validation loops
constituted a cross-validation run and 3,500 such runs were
executed for each binary classification task, so as to obtain average
performances and their standard errors (see histogram bars and
their error bars in Fig. 6). Following [67], significance of the
classification performance was assessed with a permutation test, in
which object labels were shuffled before executing each cross-
validation loop, so as to obtain null distributions of the
performance (see gray circles and their error bars in Fig. 6).
The same cross-validation scheme was used to test the
significance of the performance at classifying ‘‘pruned’’ categories,
i.e., object sets obtained by sub-sampling the original categories
and their complementary (negative) sets, so as to disentangle as
much as possible semantic from visual information. Pruned
categories were built by solving two constraint optimization
problems. The goal was to build the largest possible set of objects
belonging to a given category, such that visual features would not
interfere with semantic features and vice versa. Therefore, when
testing for discrimination of a semantic category, we imposed that
no pair of objects would belong to the same shape-based or low-
level category; when testing for discrimination of a shape-based or
low-level category, we imposed that no pair of objects would
belong to the same semantic category. For example, when testing
for discrimination of the round category, which includes, among
other objects, also many faces (see Fig. S1B), only one of the faces
was allowed to be included in the pruned category (see second
panel in Fig. 6B). We also imposed that no twins appeared
together in any pruned category. These constraints applied both to
the positive and to the negative (i.e., complementary) classes, and,
therefore, the problem had to be solved twice every time. This
problem can be easily framed as an integer linear programming
problem, and solved using standard kits (http://www.gnu.org/
software/glpk/). Since several solutions are possible, we intro-
duced a small random noise and solved the problem repeatedly in
order to sample from the set of all solutions – one pruned version
of the category to be discriminated (and the complementary object
set) was built for each of the 3,500 cross-validation runs (see
above). In a few instances (e.g., the fishes), the resulting ‘‘pruned’’
category had too few objects for the linear classifier analysis to be
performed. To assess the significance of the classification
performances we built null categories, by first shuffling the twin
indices over the whole stimulus set, and then sampling the null
positive and negative categories with the same constraints as
above. That is, we required the null ‘‘semantic’’ categories to be
made of visually dissimilar objects, and the null ‘‘visual-based/low-
level’’ categories to be made of objects with different semantic
membership. In addition, we forced the null categories to have the
same size as the corresponding pruned categories.
Supporting Information
Figure S1 Object categories of the three clusteringhypotheses. The 11 semantic categories (A), the 15 shape-based
categories (B) and the 8 low-level object categories (C). See main
text (Materials and Methods) for a definition of the categories.
(TIF)
Figure S2 Computation of the stability region in theparameter space of the D-MST clustering algorithm.Average number of clusters and average overlap (inset) in repeated
D-MST clustering outcomes, showing the only stable region of the
parameters (found at dmax = 6, l M [0.74,0.88]). The main panel
shows the average number of clusters at dmax = 6 as a function of
the parameter l (error bars = standard deviations across 50
repeated outcomes of D-MST clustering). The stable region is
highlighted in light red. The yellow line represents the linear fit for
that region, corresponding to a number of clusters = 4.5560.03.
The inset shows the average overlap between repeated outcomes
of the clustering at dmax = 6 as a function of l. For each point, the
average overlap is computed over all D-MST outcomes in a sliding
window of width 0.15 centered at that point. The blue dot
represents the value corresponding to the stable region (over-
lap = 0.9460.04). The span of that region is highlighted in light
green.
(TIF)
Figure S3 Face selectivity of the recorded inferotempo-ral neurons. (A) Histogram showing the distribution of the Face
Selectivity Index (FSI) across the recorded population of IT
neurons. The index was defined, according to Tsao et al (Science,
2006), as: FSI = (mean responsefaces2mean responsenon-face objects)/
(mean responsefaces+mean responsenon-face objects). Differently from
Tsao et al, no neurons were found with a sharp tuning for faces
(i.e., with FSI larger than 0.5). (B) Rank-order tuning curves for the
four neurons with the largest FSI. Each plot shows the response
(i.e., average firing rate) of a neuron across the set of 213 objects
used in our study (shown in Fig. 2). For each neuron, objects along
the abscissa are ranked based on the response they evoked. The
responses evoked by faces (either human, monkey, or dog faces)
are marked by specific symbols (see legend in the figure). These
tuning curves show how, even for our most face selective cells,
non-face objects were often the cells’ preferred stimuli, and no
sharp segregation between responses to faces and non-face objects
was found.
(TIF)
Text S1 Supporting Materials and Methods. Description
of how the D-MST clustering algorithm was applied in the context
of this study.
(DOC)
Acknowledgments
We thank G. Kreiman, H. Op de Beeck and T. Shallice for helpful
comments on our manuscript. We thank W. Freiwald for his help in
establishing what fraction of the inferotemporal neurons recorded in this
study may have been sampled from the so-called monkey face patches.
Author Contributions
Conceived and designed the experiments: JJD DZ. Performed the
experiments: DZ. Analyzed the data: CB AAN MP RZ. Contributed
reagents/materials/analysis tools: JJD CB RZ. Wrote the paper: CB AAN
MP DZ.
References
1. Logothetis NK, Sheinberg DL (1996) Visual object recognition. Ann Rev
Neurosci 19: 577–621.
2. Tanaka K (1996) Inferotemporal cortex and object vision. Annual Review of
Neuroscience 19: 109–139.
3. Rolls ET (2000) Functions of the primate temporal lobe cortical visual areas in
invariant visual object and face recognition. Neuron 27: 205–218.
4. Connor CE, Brincat SL, Pasupathy A (2007) Transformation of shape information
in the ventral pathway. Current Opinion in Neurobiology 17: 140–147.
Structure of Visual Object Representations in IT
PLOS Computational Biology | www.ploscompbiol.org 19 August 2013 | Volume 9 | Issue 8 | e1003167

5. Orban GA (2008) Higher Order Visual Processing in Macaque Extrastriate
Cortex. Physiological Reviews 88: 59.
6. DiCarlo JJ, Zoccolan D, Rust NC (2012) How Does the Brain Solve Visual
Object Recognition? Neuron 73: 415–434. doi:10.1016/j.neuron.2012.01.010.
7. Brincat SL, Connor CE (2004) Underlying principles of visual shape selectivity
in posterior inferotemporal cortex. Nat Neurosci 7: 880–886.
8. Yamane Y, Carlson ET, Bowman KC, Wang Z, Connor CE (2008) A neural
code for three-dimensional object shape in macaque inferotemporal cortex. Nat
Neurosci 11: 1352–1360. Available: http://www.ncbi.nlm.nih.gov/entrez/
query.fcgi?db = pubmed&cmd = Retrieve&dopt = AbstractPlus&list_
uids = 18836443.
9. Quiroga RQ, Reddy L, Kreiman G, Koch C, Fried I (2005) Invariant visual
representation by single neurons in the human brain. Nature 435: 1102–1107.
10. Quiroga RQ (2012) Concept cells: the building blocks of declarative memory
functions. Nat Rev Neurosci 13: 587–597. doi:10.1038/nrn3251.
11. Quiroga RQ, Kreiman G, Koch C, Fried I (2008) Sparse but not
‘‘Grandmother-cell’’ coding in the medial temporal lobe. Trends in Cognitive
Sciences 12: 87–91. doi:10.1016/j.tics.2007.12.003.
12. Brincat SL, Connor CE (2006) Dynamic shape synthesis in posterior
inferotemporal cortex. Neuron 49: 17–24.
13. Kourtzi Z, Connor CE (2011) Neural Representations for Object Perception:
Structure, Category, and Adaptive Coding. Annual Review of Neuroscience 34:
45–67. doi:10.1146/annurev-neuro-060909-153218.
14. Kiani R, Esteky H, Mirpour K, Tanaka K (2007) Object category structure in
response patterns of neuronal population in monkey inferior temporal cortex.
Journal of Neurophysiology 97: 4296–4309.
15. Kriegeskorte N, Mur M, Ruff D, Kiani R, Bodurka J, et al. (2008) Matching
Categorical Object Representations in Inferior Temporal Cortex of Man and
Monkey. Neuron 60: 1126–1141. doi:10.1016/j.neuron.2008.10.043.
16. Bell AH, Hadj-Bouziane F, Frihauf JB, Tootell RBH, Ungerleider LG (2009)
Object Representations in the Temporal Cortex of Monkeys and Humans as
Revealed by Functional Magnetic Resonance Imaging. J Neurophysiol 101:
688–700. doi:10.1152/jn.90657.2008.
17. Kanwisher N, McDermott J, Chun MM (1997) The Fusiform Face Area: A
Module in Human Extrastriate Cortex Specialized for Face Perception.
J Neurosci 17: 4302–4311.
18. Downing PE, Jiang Y, Shuman M, Kanwisher N (2001) A Cortical Area
Selective for Visual Processing of the Human Body. Science 293: 2470–2473.
doi:10.1126/science.1063414.
19. Mahon BZ, Milleville SC, Negri GAL, Rumiati RI, Caramazza A, et al. (2007)
Action-Related Properties Shape Object Representations in the Ventral Stream.
Neuron 55: 507–520. doi:10.1016/j.neuron.2007.07.011.
20. Mahon BZ, Caramazza A (2009) Concepts and Categories: A Cognitive
Neuropsychological Perspective. Annual Review of Psychology 60: 27–51.
doi:10.1146/annurev.psych.60.110707.163532.
21. Naselaris T, Prenger RJ, Kay KN, Oliver M, Gallant JL (2009) Bayesian
Reconstruction of Natural Images from Human Brain Activity. Neuron 63: 902–
915. doi:10.1016/j.neuron.2009.09.006.
22. Kanwisher N (2010) Functional specificity in the human brain: A window into
the functional architecture of the mind. PNAS 107: 11163–11170. doi:10.1073/
pnas.1005062107.
23. Clarke A, Taylor KI, Devereux B, Randall B, Tyler LK (2012) From Perception
to Conception: How Meaningful Objects Are Processed over Time. Cereb
Cortex 23:187–197. Available: http://cercor.oxfordjournals.org/content/early/
2012/01/23/cercor.bhs002. Accessed 18 December 2012.
24. Connolly AC, Guntupalli JS, Gors J, Hanke M, Halchenko YO, et al. (2012)
The Representation of Biological Classes in the Human Brain. J Neurosci 32:
2608–2618. doi:10.1523/JNEUROSCI.5547-11.2012.
25. Sakai K, Miyashita Y (1991) Neural organization for the long-term memory of
paired associates. Nature 354: 152–155. doi:101038/354152a0
26. Higuchi S, Miyashita Y (1996) Formation of mnemonic neuronal responses to
visual paired associates in inferotemporal cortex is impaired by perirhinal and
entorhinal lesions. Proc Natl Acad Sci U S A 93: 739–743.
27. Miyashita Y (1988) Neuronal correlate of visual associative long-term memory in
the primate temporal cortex. Nature 335: 817–820. doi:10.1038/335817a0.
28. Li N, DiCarlo JJ (2008) Unsupervised Natural Experience Rapidly Alters
Invariant Object Representation in Visual Cortex. Science 321: 1502–1507.
doi:10.1126/science.1160028.
29. Li N, DiCarlo JJ (2010) Unsupervised Natural Visual Experience Rapidly
Reshapes Size-Invariant Object Representation in Inferior Temporal Cortex.
Neuron 67: 1062–1075. doi:10.1016/j.neuron.2010.08.029.
30. Meyers EM, Freedman DJ, Kreiman G, Miller EK, Poggio T (2008) Dynamic
Population Coding of Category Information in Inferior Temporal and Prefrontal
Cortex. J Neurophysiol 100: 1407–1419. doi:10.1152/jn.90248.2008.
31. Tsao DY, Freiwald WA, Knutsen TA, Mandeville JB, Tootell RBH (2003) Faces
and objects in macaque cerebral cortex. Nature Neuroscience 6: 989–995.
doi:10.1038/nn1111.
32. Tsao DY, Freiwald WA, Tootell RBH, Livingstone MS (2006) A Cortical
Region Consisting Entirely of Face-Selective Cells. Science 311: 670–674.
doi:10.1126/science.1119983.
33. Tsao DY, Moeller S, Freiwald WA (2008) Comparing face patch systems in
macaques and humans. PNAS 105: 19514–19519. doi:10.1073/
pnas.0809662105.
34. Popivanov ID, Jastorff J, Vanduffel W, Vogels R (2012) Stimulus representationsin body-selective regions of the macaque cortex assessed with event-related
fMRI. NeuroImage 63: 723–741. doi:10.1016/j.neuroimage.2012.07.013.
35. Op de Beeck H, Wagemans J, Vogels R (2001) Inferotemporal neurons
represent low-dimensional configurations of parameterized shapes. Nat Neurosci4: 1244–1252.
36. Kayaert G, Biederman I, Vogels R (2003) Shape Tuning in Macaque Inferior
Temporal Cortex. J Neurosci 23: 3016–3027.
37. Kayaert G, Biederman I, Op de Beeck HP, Vogels R (2005) Tuning for shape
dimensions in macaque inferior temporal cortex. European Journal of
Neuroscience 22: 212–224. doi:10.1111/j.1460-9568.2005.04202.x.
38. Zoccolan D, Kouh M, Poggio T, Dicarlo J (2007) Trade-off between object
selectivity and tolerance in monkey inferotemporal cortex. J Neurosci 27:
12292–12307.
39. Zoccolan D, Cox DD, DiCarlo JJ (2005) Multiple object response normalization
in monkey inferotemporal cortex. J Neurosci 25: 8150–8164.
40. Freedman DJ, Riesenhuber M, Poggio T, Miller EK (2003) A comparison ofprimate prefrontal and inferior temporal cortices during visual categorization.
J Neurosci 23: 5235–5246.
41. Baylis GC, Rolls ET, Leonard CM (1987) Functional subdivisions of thetemporal lobe neocortex. J Neurosci 7: 330–342.
42. Rolls ET (2012) Invariant Visual Object and Face Recognition: Neural and
Computational Bases, and a Model, VisNet. Front Comput Neurosci 6: 35.Available: http://www.ncbi.nlm.nih.gov/pmc/articles/PMC3378046/. Ac-
cessed 22 May 2013.
43. Serre T, Oliva A, Poggio T (2007) A feedforward architecture accounts for rapid
categorization. Proc Natl Acad Sci U S A 104: 6424–6429. Available: http://w w w . n c b i . n l m . n i h . g o v / e n t r e z / q u e r y .
fcgi?cmd = Retrieve&db = PubMed&dopt = Citation&list_uids = 17404214.
44. Mutch J, Lowe DG (2008) Object Class Recognition and Localization UsingSparse Features with Limited Receptive Fields. International Journal of
Computer Vision 80: 45–57. doi:10.1007/s11263-007-0118-0.
45. Murray RF (2011) Classification images: A review. J Vis 11. Available: http://www.journalofvision.org/content/11/5/2. Accessed 29 October 2012.
46. Nielsen KJ, Logothetis NK, Rainer G (2008) Object features used by humans
and monkeys to identify rotated shapes. J Vis 8: 9 1–15.
47. Willmore BDB, Prenger RJ, Gallant JL (2010) Neural representation of natural
images in visual area V2. J Neurosci 30: 2102–2114. doi:10.1523/JNEUR-
OSCI.4099-09.2010.
48. Alemi-Neissi A, Rosselli FB, Zoccolan D (2013) Multifeatural Shape Processing
in Rats Engaged in Invariant Visual Object Recognition. J Neurosci 33: 5939–
5956. doi:10.1523/JNEUROSCI.3629-12.2013.
49. Schwartz O, Pillow JW, Rust NC, Simoncelli EP (2006) Spike-triggered neural
characterization. J Vis 6: 484–507.
50. Ringach D, Shapley R (2004) Reverse correlation in neurophysiology. CognitiveScience 28: 147–166. doi:10.1016/j.cogsci.2003.11.003.
51. Gosselin F, Schyns PG (2001) Bubbles: a technique to reveal the use of
information in recognition tasks. Vision Res 41: 2261–2271.
52. Claeskens,Gerda, Hjort NL (2008) Model Selection and Model Averaging.
Cambridge: Cambridge University Press. Available: http://ideas.repec.org/b/
cup/cbooks/9780521852258.html#download. Accessed 22 February 2012.
53. Bayati M, Borgs C, Braunstein A, Chayes J, Ramezanpour A, et al. (2008)
Statistical Mechanics of Steiner Trees. Phys Rev Lett 101: 037208. doi:10.1103/
PhysRevLett.101.037208.
54. Bailly-Bechet M, Bradde S, Braunstein A, Flaxman A, Foini L, et al. (2009)Clustering with shallow trees. Journal of Statistical Mechanics: Theory and
Experiment 2009: P12010. doi:10.1088/1742-5468/2009/12/P12010.
55. Frey BJ, Dueck D (2007) Clustering by Passing Messages Between Data Points.Science 315: 972–976. doi:10.1126/science.1136800.
56. Garnett MJ, Edelman EJ, Heidorn SJ, Greenman CD, Dastur A, et al. (2012)
Systematic identification of genomic markers of drug sensitivity in cancer cells.Nature 483: 570–575. doi:10.1038/nature11005.
57. Iorio F, Bosotti R, Scacheri E, Belcastro V, Mithbaokar P, et al. (2010)
Discovery of drug mode of action and drug repositioning from transcriptionalresponses. PNAS 107: 14621–14626. doi:10.1073/pnas.1000138107.
58. Lindorff-Larsen K, Piana S, Dror RO, Shaw DE (2011) How Fast-Folding
Proteins Fold. Science 334: 517–520. doi:10.1126/science.1208351.
59. Leone M, Sumedha, Weigt M (2007) Clustering by soft-constraint affinity
propagation: applications to gene-expression data. Bioinformatics 23: 2708–
2715. doi:10.1093/bioinformatics/btm414.
60. Duda RO, Hart PE, Stork DG (2001) Pattern classification. Wiley. 688 p.
61. Jain AK, Murty MN, Flynn PJ (1999) Data clustering: a review. ACM Comput
Surv 31: 264–323. doi:10.1145/331499.331504.
62. Quiroga RQ, Panzeri S (2009) Extracting information from neuronal
populations: information theory and decoding approaches. Nature Reviews
Neuroscience 10: 173–185. doi:10.1038/nrn2578.
63. Rolls ET, Treves A (2011) The neuronal encoding of information in the brain.
Progress in Neurobiology 95: 448–490. doi:10.1016/j.pneurobio.2011.08.002.
64. Hung CP, Kreiman G, Poggio T, DiCarlo JJ (2005) Fast readout of objectidentity from macaque inferior temporal cortex. Science 310: 863–866.
65. Li N, Cox DD, Zoccolan D, DiCarlo JJ (2009) What Response Properties Do
Individual Neurons Need to Underlie Position and Clutter ‘‘Invariant’’ Object
Recognition? J Neurophysiol 102: 360–376. doi:10.1152/jn.90745.2008.
Structure of Visual Object Representations in IT
PLOS Computational Biology | www.ploscompbiol.org 20 August 2013 | Volume 9 | Issue 8 | e1003167

66. Rust NC, DiCarlo JJ (2010) Selectivity and Tolerance (‘‘Invariance’’) Both
Increase as Visual Information Propagates from Cortical Area V4 to IT.J Neurosci 30: 12978–12995. doi:10.1523/JNEUROSCI.0179-10.2010.
67. Agam Y, Liu H, Papanastassiou A, Buia C, Golby AJ, et al. (2010) Robust
Selectivity to Two-Object Images in Human Visual Cortex. Current Biology 20:872–879. doi:10.1016/j.cub.2010.03.050.
68. Riesenhuber M, Poggio T (1999) Hierarchical models of object recognition incortex. Nat Neurosci 2: 1019–1025.
69. Miyashita Y (1993) Inferior Temporal Cortex: Where Visual Perception Meets
Memory. Annu Rev Neurosci 16: 245–263. doi:10.1146/annur-ev.ne.16.030193.001333.
70. Freedman DJ, Assad JA (2006) Experience-dependent representation of visualcategories in parietal cortex. Nature 443: 85–88. doi:10.1038/nature05078.
71. Fitzgerald JK, Freedman DJ, Assad JA (2011) Generalized associativerepresentations in parietal cortex. Nature Neuroscience 14: 1075–1079.
doi:10.1038/nn.2878.
72. Leopold DA, O’Toole AJ, Vetter T, Blanz V (2001) Prototype-referenced shapeencoding revealed by high-level aftereffects. Nat Neurosci 4: 89–94.
73. Tafazoli S, Di Filippo A, Zoccolan D (2012) Transformation-Tolerant ObjectRecognition in Rats Revealed by Visual Priming. J Neurosci 32: 21–34.
doi:10.1523/JNEUROSCI.3932-11.2012.
74. Wiggs CL, Martin A (1998) Properties and mechanisms of perceptual priming.
Current Opinion in Neurobiology 8: 227–233. doi:10.1016/S0959-
4388(98)80144-X.
75. Biederman I, Cooper EE (1991) Evidence for complete translational and
reflectional invariance in visual object priming. Perception 20: 585–593.
76. Afraz S-R, Cavanagh P (2008) Retinotopy of the face aftereffect. Vision Res 48:
42–54.
77. Bar M, Biederman I (1998) Subliminal Visual Priming. Psychological Science 9:
464–468. doi:10.1111/1467-9280.00086.
78. Suzuki S, Cavanagh P (1998) A shape-contrast effect for briefly presented
stimuli. Journal of Experimental Psychology: Human Perception and Perfor-
mance 24: 1315–1341. doi:10.1037/0096-1523.24.5.1315.
79. Fei-Fei L, Fergus R, Perona P (2004) Learning generative visual models from few
training examples: an incremental Bayesian approach tested on 101 object
categories. IEEE. CVPR 2004, Workshop on Generative-Model Based Vision.
80. Cox DD, Papanastassiou AM, Oreper D, Andken BB, DiCarlo JJ (2008) High-
Resolution Three-Dimensional Microelectrode Brain Mapping Using Stereo
Microfocal X-ray Imaging. J Neurophysiol 100: 2966–2976. doi:10.1152/
jn.90672.2008.
Structure of Visual Object Representations in IT
PLOS Computational Biology | www.ploscompbiol.org 21 August 2013 | Volume 9 | Issue 8 | e1003167