Shape and size effects in infrared dust spectra
19
Grain shape (and size) effects in infrared dust spectra Harald Mutschke 1 , Michiel Min 2 , Akemi Tamanai 1,3 1 Astrophysikalisches Institut und Universitäts-Sternwarte Jena, Germany 2 Astronomical Institute, University of Utrecht, NL 3 Kirchhoff-Institut, Universität Heidelberg, Germany Dust in Planetary Systems, Japanese-German Workshop, Jena, 27/09-01/10/2010
Transcript of Shape and size effects in infrared dust spectra
Grain shape (and size) effects in infrared dust spectra
Harald Mutschke1, Michiel Min2,
Akemi Tamanai1,3
1Astrophysikalisches Institut und Universitäts-Sternwarte Jena, Germany2 Astronomical Institute, University of Utrecht, NL
3Kirchhoff-Institut, Universität Heidelberg, Germany
Dust in Planetary Systems, Japanese-German Workshop, Jena, 27/09-01/10/2010
Outline
• Motivation: Comparison spectra for thermal dust emission
• Grain shape effects measured with „aerosol IR spectroscopy“
• Analysis by a „Distribution of Form Factors“ model (grains small compared to the wavelength)
• DDA modeling of irregular porous grains (larger grain sizes)
Motivation
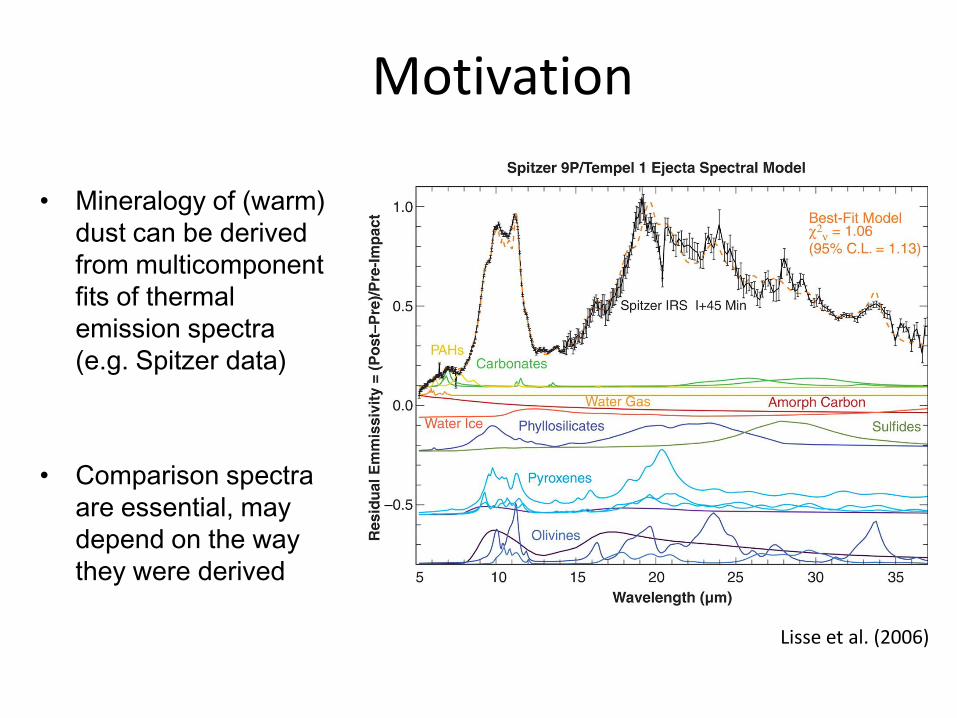
• Mineralogy of (warm)
dust can be derived
from multicomponent
fits of thermal
emission spectra
(e.g. Spitzer data)
• Comparison spectra
are essential, may
depend on the way
they were derived
Lisse et al. (2006)
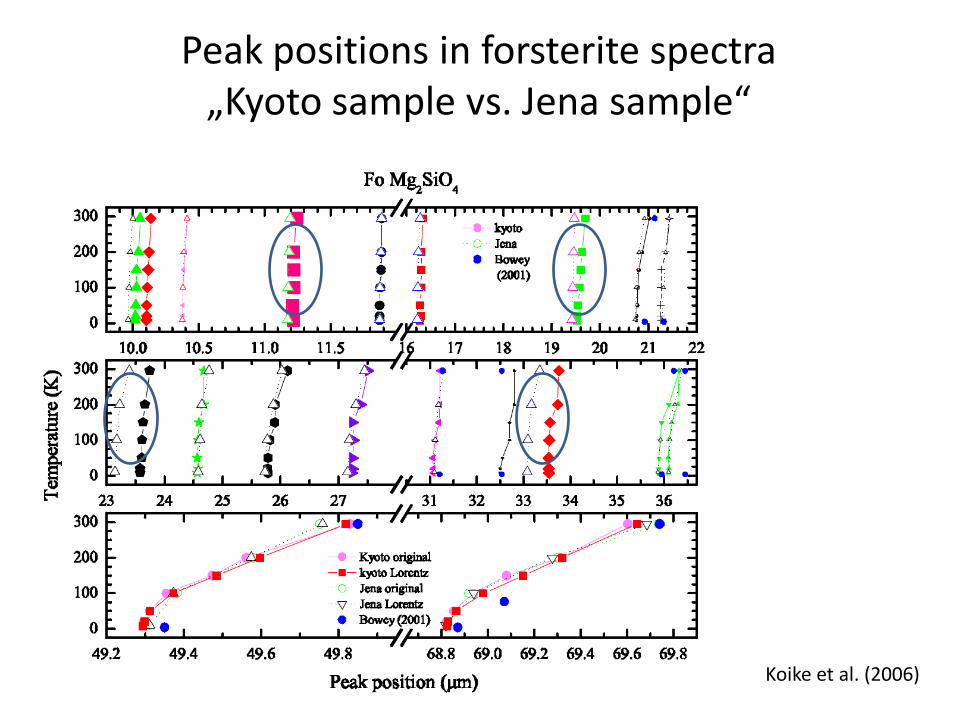
Peak positions in forsterite spectra„Kyoto sample vs. Jena sample“
Koike et al. (2006)
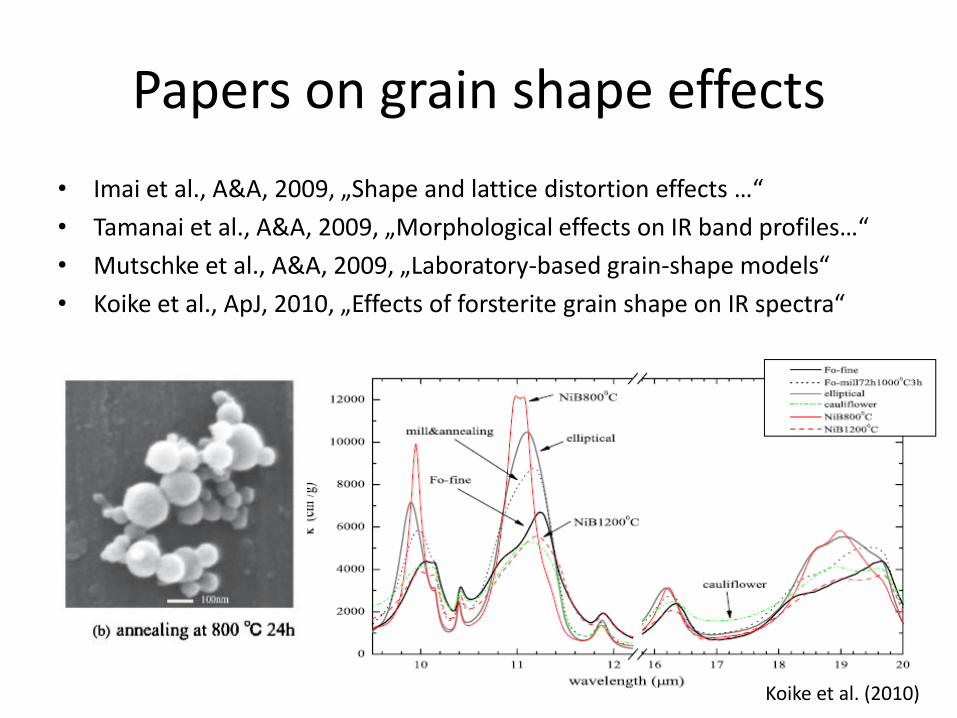
Papers on grain shape effects
• Imai et al., A&A, 2009, „Shape and lattice distortion effects …“
• Tamanai et al., A&A, 2009, „Morphological effects on IR band profiles…“
• Mutschke et al., A&A, 2009, „Laboratory-based grain-shape models“
• Koike et al., ApJ, 2010, „Effects of forsterite grain shape on IR spectra“
Koike et al. (2010)
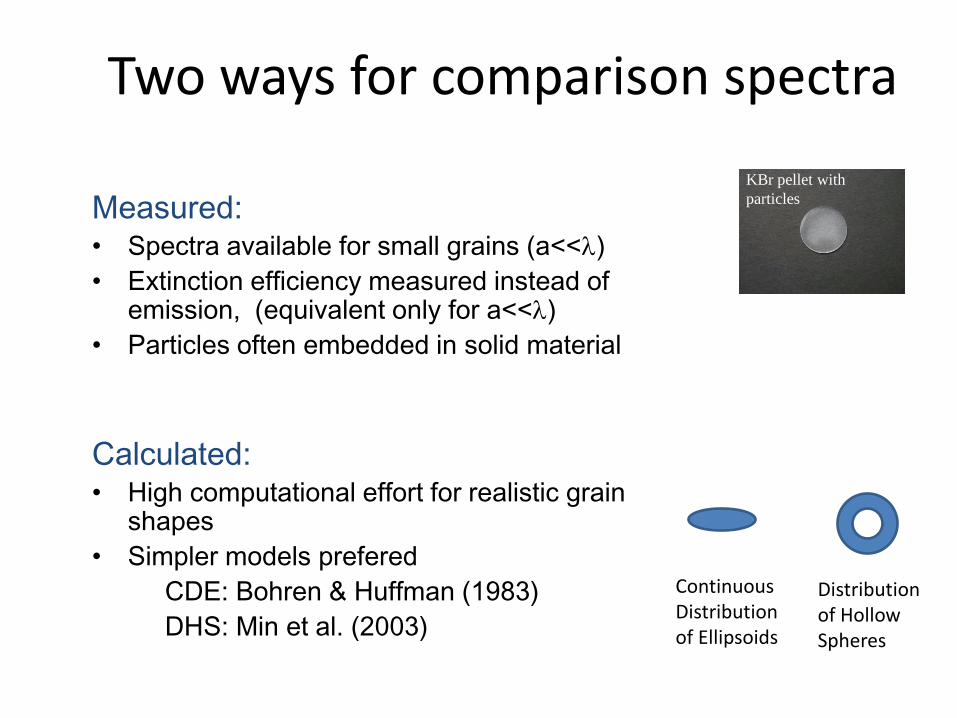
Two ways for comparison spectra
Measured:• Spectra available for small grains (a<<)
• Extinction efficiency measured instead of emission, (equivalent only for a<<)
• Particles often embedded in solid material
Calculated:• High computational effort for realistic grain
shapes
• Simpler models prefered
CDE: Bohren & Huffman (1983)
DHS: Min et al. (2003)
KBr pellet with
particles
Distribution of HollowSpheres
ContinuousDistribution of Ellipsoids
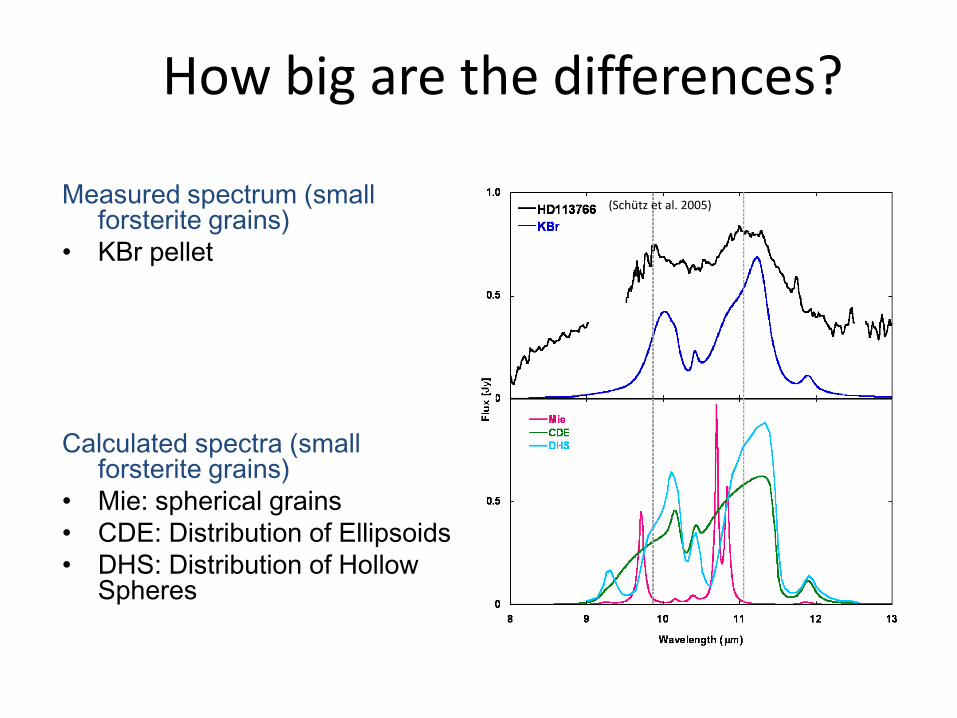
How big are the differences?
Measured spectrum (smallforsterite grains)
• KBr pellet
Calculated spectra (smallforsterite grains)
• Mie: spherical grains
• CDE: Distribution of Ellipsoids
• DHS: Distribution of HollowSpheres
(Schütz et al. 2005)
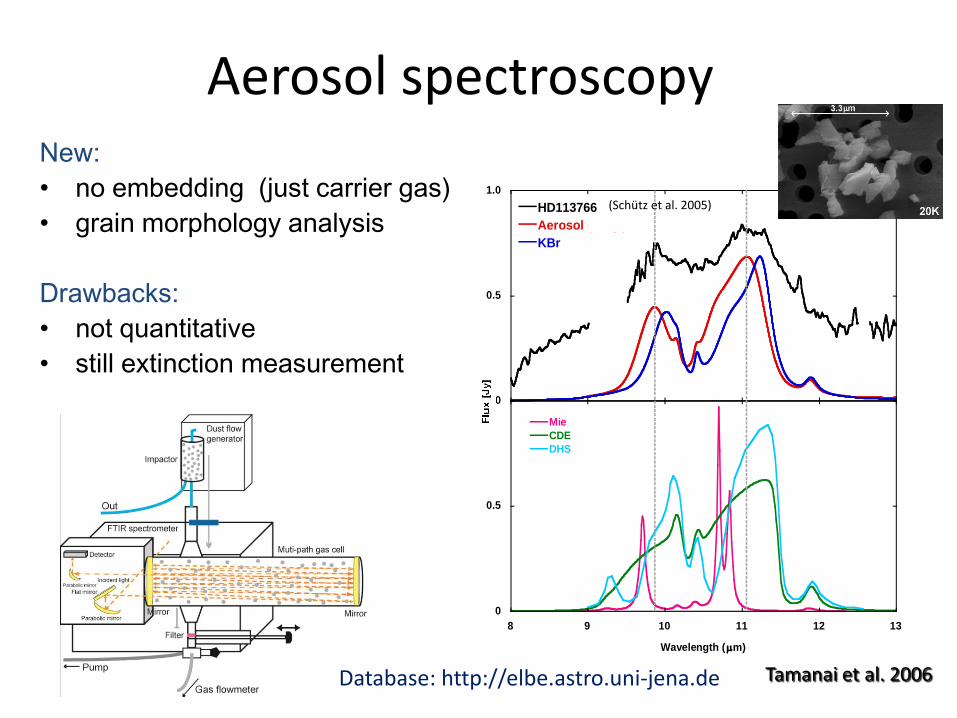
Aerosol spectroscopyNew:
• no embedding (just carrier gas)
• grain morphology analysis
Drawbacks:
• not quantitative
• still extinction measurement
0
0.5
1.0
HD113766
Aerosol (irreg.)
KBr (irreg.)
0
0.5
8 9 10 11 12 13
Mie
CDE
DHS
Wavelength (m)
(Schütz et al. 2005)
Tamanai et al. 2006Database: http://elbe.astro.uni-jena.de
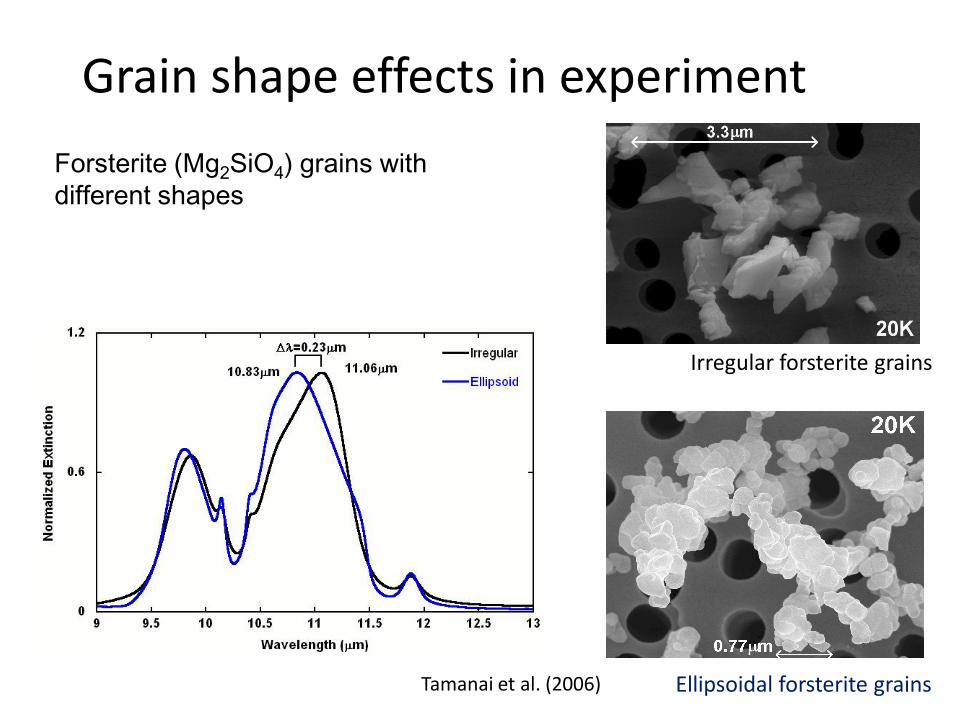
Grain shape effects in experiment
Irregular forsterite grains
Ellipsoidal forsterite grains
Forsterite (Mg2SiO4) grains with
different shapes
Tamanai et al. (2006)
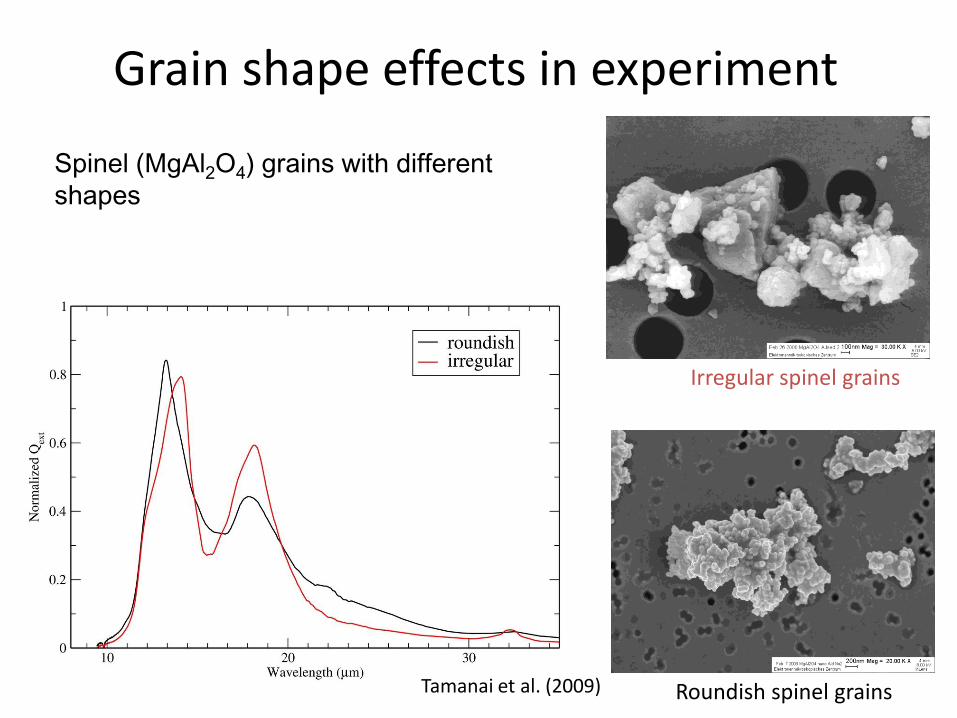
Grain shape effects in experiment
Irregular spinel grains
Roundish spinel grains
Spinel (MgAl2O4) grains with different
shapes
Tamanai et al. (2009)
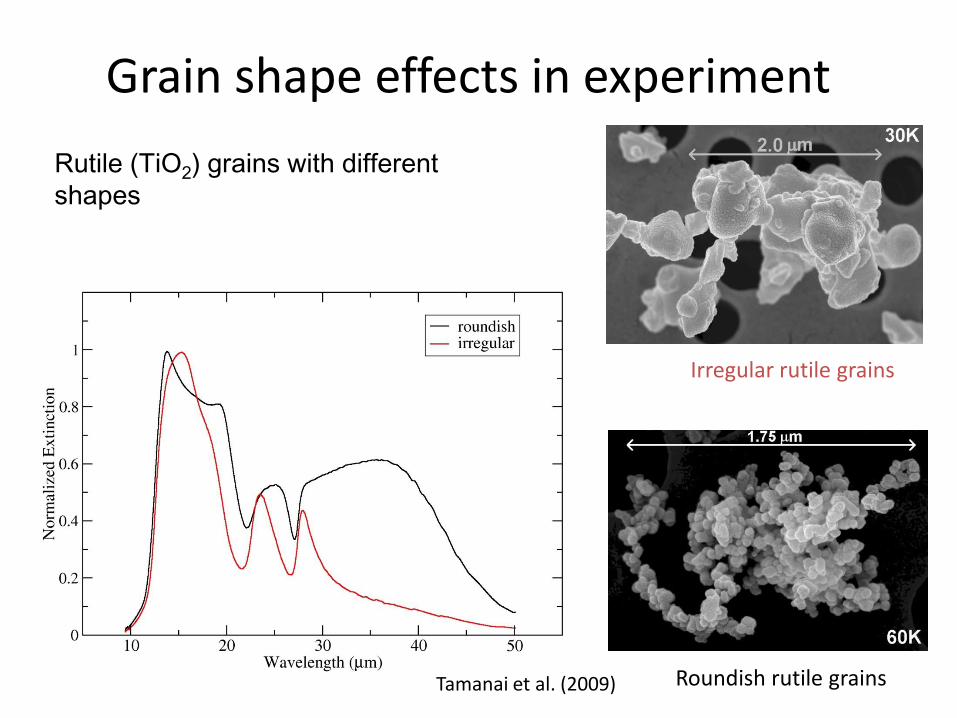
Grain shape effects in experiment
Irregular rutile grains
Roundish rutile grains
Rutile (TiO2) grains with different
shapes
Tamanai et al. (2009)
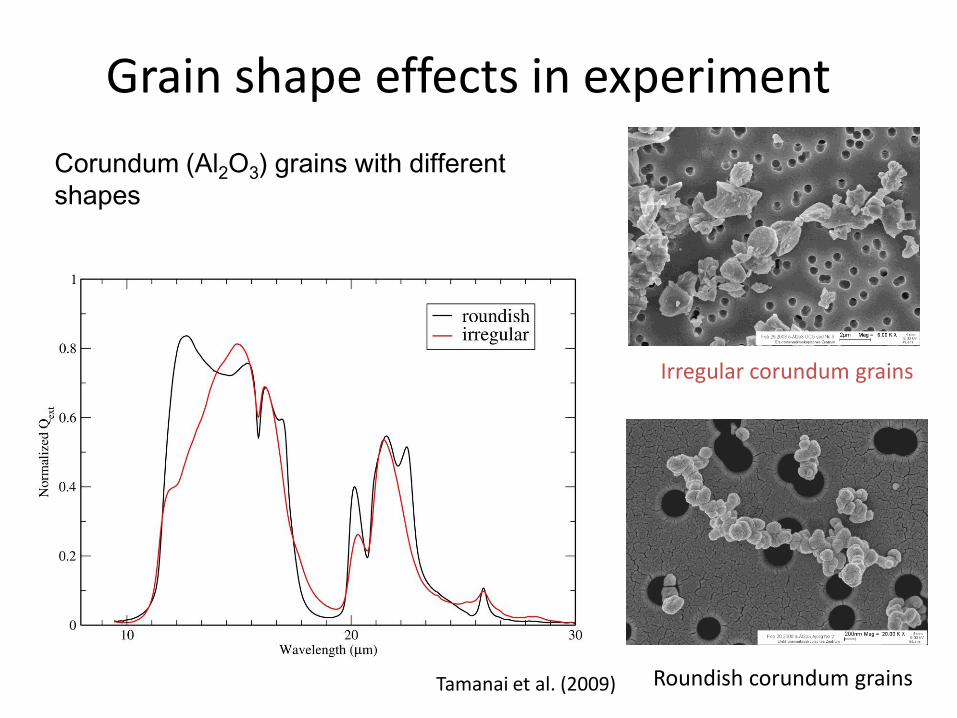
Grain shape effects in experiment
Irregular corundum grains
Roundish corundum grains
Corundum (Al2O3) grains with different
shapes
Tamanai et al. (2009)
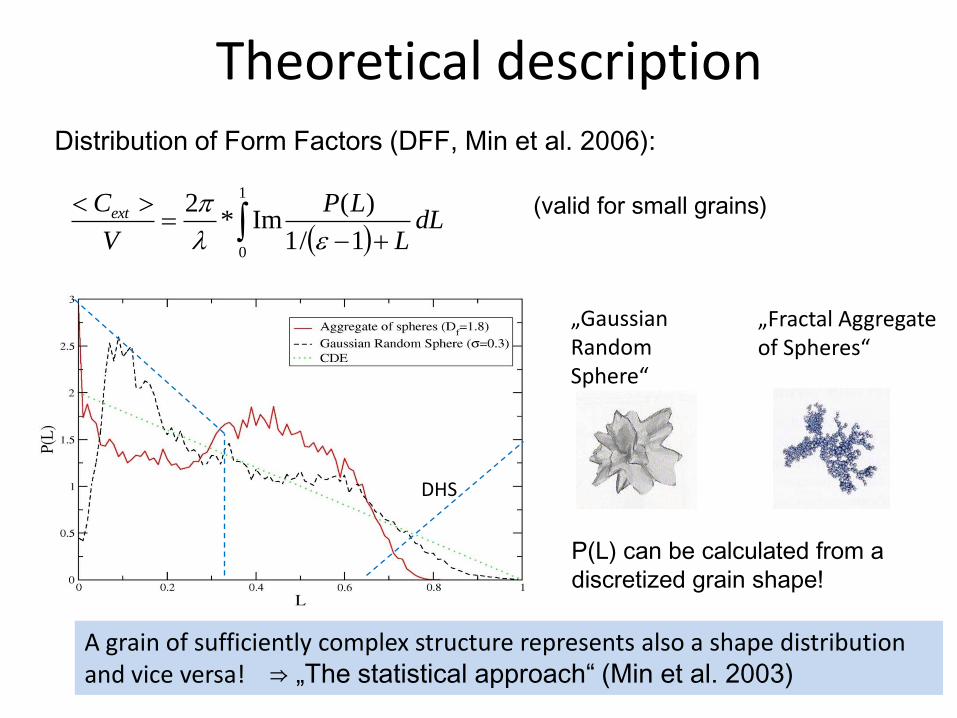
Theoretical description
1
01/1
)(Im*
2dL
L
LP
V
Cext
Distribution of Form Factors (DFF, Min et al. 2006):
(valid for small grains)
P(L) can be calculated from a
discretized grain shape!
„GaussianRandom Sphere“
„Fractal Aggregate of Spheres“
DHS
A grain of sufficiently complex structure represents also a shape distributionand vice versa! ⇒ „The statistical approach“ (Min et al. 2003)
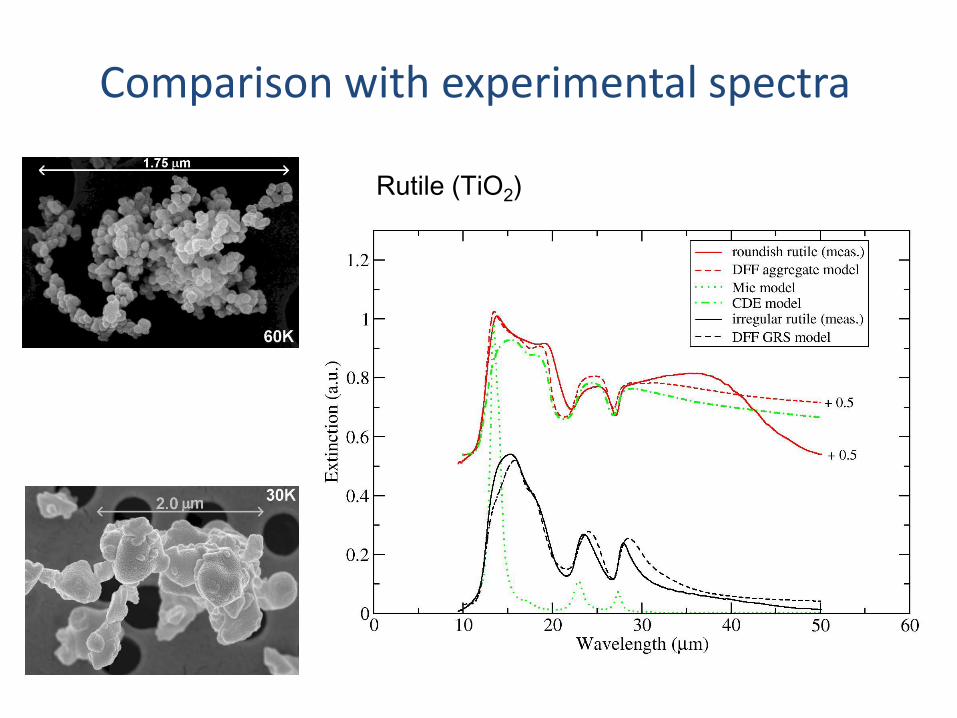
Rutile (TiO2)
Comparison with experimental spectra

Comparison with experimental spectra
Corundum (Al2O3)Mutschke et al. (2009)
=0.1
Df=1.8
Df=2.8
Df=1.2
Df=2.4
=0.3
=0.5
=0.7
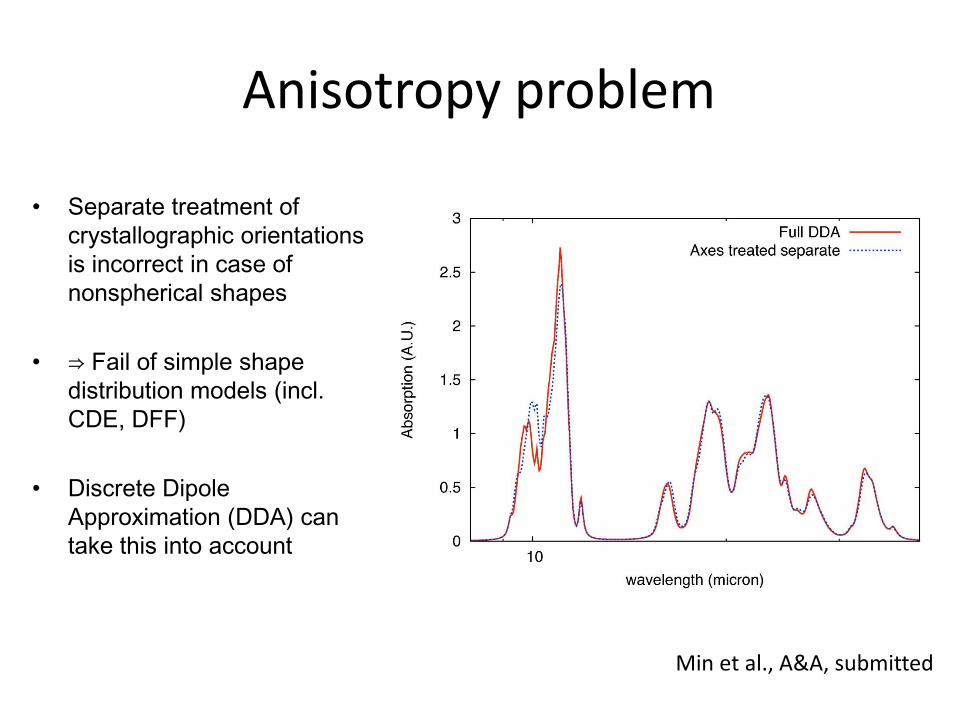
Anisotropy problem
• Separate treatment of
crystallographic orientations
is incorrect in case of
nonspherical shapes
• ⇒ Fail of simple shape
distribution models (incl.
CDE, DFF)
• Discrete Dipole
Approximation (DDA) can
take this into account
Min et al., A&A, submitted
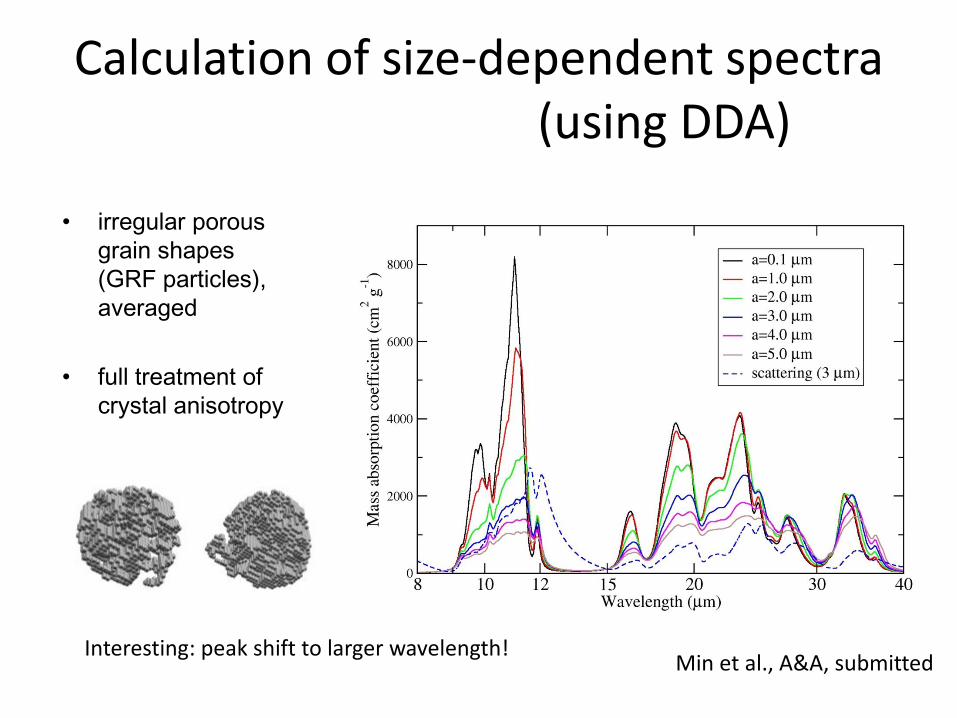
Calculation of size-dependent spectra(using DDA)
• irregular porous
grain shapes
(GRF particles),
averaged
• full treatment of
crystal anisotropy
Min et al., A&A, submittedInteresting: peak shift to larger wavelength!
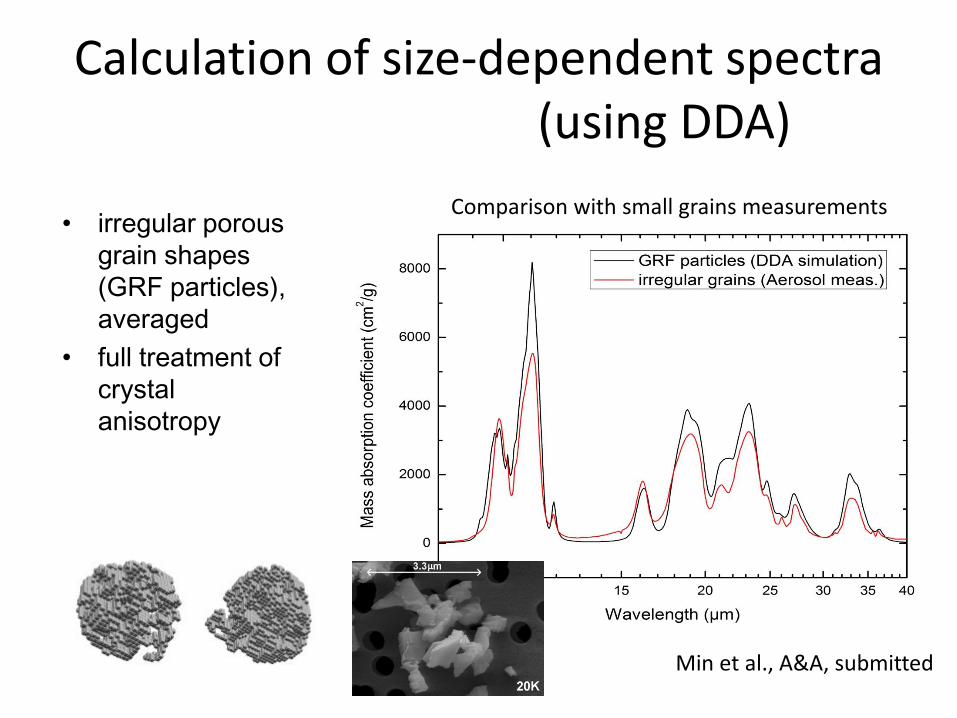
Calculation of size-dependent spectra(using DDA)
Min et al., A&A, submitted
• irregular porous
grain shapes
(GRF particles),
averaged
• full treatment of
crystal
anisotropy
Comparison with small grains measurements
Summary
• Experimental spectra may be safer than simple calculated ones
(as long as small grains are sufficient to consider)
• The grain-shape dependence of these can be understood in
terms of shape factor distributions
• DDA model spectra - taking material anisotropy correctly into
account - are coming up for larger grains