SHANGHAITECH SEM WORKING PAPER SERIES No. 2021-006
38
SHANGHAITECH SEM WORKING PAPER SERIES No. 2021-006 A Merger with a Maverick Firm: Examining the Coordinated Effects in the AA/USAir Merger Soo Jin Kim School of Entrepreneurship and Management, ShanghaiTech University Yongjoon Park Department of Resource Economics, University of Massachusetts, Amherst June 30, 2021 https://ssrn.com/abstract=3877895 School of Entrepreneurship and Management ShanghaiTech University http://sem.shanghaitech.edu.cn
Transcript of SHANGHAITECH SEM WORKING PAPER SERIES No. 2021-006

SHANGHAITECH SEM WORKING PAPER SERIES No. 2021-006
A Merger with a Maverick Firm:
Examining the Coordinated Effects in the AA/USAir Merger
Soo Jin Kim
School of Entrepreneurship and Management, ShanghaiTech University
Yongjoon Park
Department of Resource Economics, University of Massachusetts, Amherst
June 30, 2021
https://ssrn.com/abstract=3877895
School of Entrepreneurship and Management
ShanghaiTech University http://sem.shanghaitech.edu.cn

A Merger with a Maverick Firm: Examining the Coordinated Effects
in the AA/USAir Merger
Soo Jin Kim∗ Yongjoon Park†
June 30, 2021
Abstract
This paper studies the coordinated effects of the merger between American Airlines and USAirways by examining the extent to which the connecting prices of the nonmerging legacy carriers(Delta and United) evolved when the merger eliminated Advantage Fares, a connecting flight pricediscounting program offered by US Airways. In our empirical analysis, we find that postmergernonmerging legacy carriers substantially increased their connecting flight prices in routes where USAirways had a dominant position, and a similar pattern can be found for the merging carriers inroutes where nonmerging legacy carriers had a dominant position. We next conduct a theoreticalanalysis in which we show that these empirical findings can be explained by the elimination ofmaverick firms and how such elimination facilitates coordinated conduct among legacy carriers.Finally, we note the potential importance of connecting services in merger analysis in the airlineindustry.
Keywords: Airline Mergers, Merger Analysis, Coordinated Effects, Maverick FirmJEL Classification Numbers: L93, L41, L44
∗[email protected]; School of Entrepreneurship and Management, ShanghaiTech University, Room 436,393 Middle Huaxia Road, Shanghai.
†[email protected]; Department of Resource Economics, University of Massachusetts, Amherst.

1 Introduction
Competitive authorities investigate anticompetitive effects in markets when evaluating proposed merg-
ers. The anticompetitive effects of mergers arise from the elimination of competition between merging
entities, which increases their market power; this is referred to as the unilateral effects of mergers.
Mergers can also diminish market competition by facilitating coordinated conduct among merging
and nonmerging firms; this is referred to as the coordinated effects of mergers. In merger evaluations,
although the authorities have a formal quantitative procedure to examine the unilateral effects via
merger simulation, there is no systematic procedure for evaluating the coordinated effects largely be-
cause there are many collusive behaviors; therefore, the effect is reviewed case by case (Porter (2020);
Miller and Weinberg (2017); Greenfield et al. (2019)).
Anticompetitive concerns regarding a merger become more relevant when it involves a maverick
firm. A maverick firm—a firm that plays a disruptive role in a market to the benefit of customers—
typically fosters competition and brings innovation to markets; therefore, a proposed merger absorbing
a maverick firm may have substantial unilateral effects. In addition, because a maverick firm can ob-
struct collusive conduct among established firms in concentrated markets, there is a serious concern
that such a merger would increase coordinated interaction among incumbents postmerger. As Hor-
izontal Merger Guidelines (Department of Justice) (2010) explicitly notes, a merger eliminating a
maverick firm that takes place in a market more vulnerable to coordinated conduct, namely, the air-
line industry, is likely to result in anticompetitive effects, particularly those driven by coordinated
effects. Although this concern regarding the coordinated effect has been shown in a wide range of
high profile merger cases in which maverick firms are acquired (ABI/Modelo; H&R Block-TaxACT;
T-Mobile/Sprint; American Airlines/US Airways), the academic literature tends to focus more on the
unilateral effects that can be examined with standardized quantitative approaches.
In this paper, we study the coordinated effects of a merger that involves a maverick firm in the
context of the merger between American Airlines (AA) and US Airways (USAir). Specifically, we
examine the extent to which the connecting prices of nonmerging legacy carriers—Delta Air Lines
(DL) and United Airlines (UA)—evolved when the merger eliminated the Advantage Fares employed
by USAir. There are two reasons we focus on the AA/USAir merger case in the U.S. airline industry.
First, the AA/USAir merger provides an ideal setting for studying the coordinated effect. Prior
to the AA/USAir merger which was completed in December 2013, USAir was considered a maverick
firm due to an attractive lower fare option called Advantage Fares that it offered in its connecting
routes (Department of Justice. (2013)). USAir offered the Advantage Fares that provided discounts
1

on connecting flights for price-sensitive passengers by undercutting rivals’ nonstop prices, especially
for last-minute bookings.1 The USAir pricing strategy, according to the U.S. Department of Justice
(DOJ), was different from the industry norms in which a legacy carrier would respect its rival legacy
carrier’s nonstop pricing for the rival’s dominant route by not aggressively pricing its connecting service
on the route. The carrier would do this with the hope that the rival would adopt the same strategy in
the legacy carrier’s dominant nonstop route (Department of Justice. (2013)). The DOJ claimed that,
in response to the USAir’s disruptive pricing strategy, three other legacy rivals—AA, DL, and UA
(henceafter, Major3 )—also discounted their connecting flight prices in routes where USAir offered
nonstop service, leading to a price war between USAir and those legacy carriers. Merger opponents
argued that the merger would deter aggressive discounting and facilitate collusive conduct among
merging and nonmerging legacy carriers, as the merger would eliminate the Advantage Fares.
Our second reason for focusing on this merger is the U.S. airline industry context, as it has
several unique features that could facilitate coordinated conduct. First, a series of mergers in recent
decades have made the industry more concentrated, with fewer carriers. In theory, collusion is more
sustainable when there are fewer participants. Moreover, carriers can easily monitor the pricing and
seat availability of their rivals in nearly real time. This price and capacity transparency can facilitate
collusion, making the airline industry vulnerable to coordinated conduct. (Department of Justice.
(1993); Horizontal Merger Guidelines (Department of Justice) (2010); Porter (2020)) Additionally,
carriers concomitantly operate services in a large number of markets, leading to a high amount of
multimarket contact; and there is an extensive understanding in the literature that multimarket contact
can facilitate collusive behaviors (Berheim and Whinston (1990); Evans and Kessides (1994); Ciliberto
and Williams (2014); Porter (2020)).2
We first document that around the AA/USAir merger, the connecting service prices of nonmerging
legacy carriers (e.g., DL and UA) dramatically changed in routes where USAir had a dominant posi-
tion. Specifically, premerger, the 90th quantile price of connecting services offered by the nonmerging
legacy carriers, a proxy for tickets transacted at the last minute, was substantially lower in routes
where USAir was the only carrier offering nonstop service (henceafter, USAir nonstop routes) than
1The underlying driving factor that allowed USAir to implement the Advantage Fares is that its hubs, located inCharlotte, Philadelphia, Phoenix, and Washington D.C., generate less revenues from offering nonstop services due tolower traffic than the hubs of other legacy carriers. Note that some previous studies treat USAir as a legacy carrier(e.g., Berry and Jia (2010)), whereas we view it as an example of a maverick carrier because of its innovative ‘AdvantageFares’ pricing strategy. This difference reflects that there is no standard definition of a maverick firm. For example,while Horizontal Merger Guidelines (Department of Justice) (2010) defines one as “a firm that plays a disruptive role inthe market to the benefit of customers,” Ivaldi et al. (2003) views it as “a firm with a drastically different cost structure,which is thus unwilling to participate in a collusive action.”
2These industry features are potentially related to the fairly recent allegation regarding the industry’s “capacitydiscipline”—carriers have limited the growth of seat availability gradually over time and increased prices.
2

in routes where one of the Major3 carriers was the nonstop monopolist (henceafter, Major3 nonstop
routes). However, after the merger, the connecting prices in USAir nonstop routes increased by 27.7%
relative to those in Major3 nonstop routes. We also find that some reciprocity exists for merging
carriers. In routes where DL or UA was the nonstop monopolist premerger (henceafter, nonmerging
legacy nonstop routes), the 90th quantile connecting prices of merging carriers were 10.4% lower than
those of the nonmerging legacy carriers in the same route group, which reflect the discounts of the
Advantage Fares by USAir. Postmerger in the same routes, however, the merging carriers’ connecting
prices increased by 6.6% relative to those of the nonmerging carrier.
We then move on to develop an intuitive theoretical model to characterize the conditions under
which the empirical patterns that we find can be supported. By using the nested logit utility speci-
fication with three airlines (AA, DL, and USAir) that operate in three different markets, we derive
the market share for each carrier. Given that airlines compete in prices in multimarket, we consider a
conduct parameter when defining each airline’s profit function, as in Bresnahan (1982) and Berheim
and Whinston (1990), to capture the degree of coordination among legacy carriers (DL and AA).
In this main theoretical model, we find that when nonmerging entity DL provides a connecting
service, it charges a relatively higher airfare against nonstop legacy carrier AA than nonstop maverick
carrier USAir absent the merger. Furthermore, we find that such strategic pricing behavior by DL
against USAir becomes more aggressive as coordination between DL and AA becomes more feasible.
However, post merger, this aggressive pricing strategy against nonstop maverick carriers disappears.
Additionally, in the market in which DL is the nonstop monopolist, the merged entity of AA and
USAir raises prices postmerger, which suggests that USAir is no longer a maverick firm that provides
a substantial price discount. We also find that the postmerger price for the merging entity increases
in the conduct parameter: that is, as it becomes easier for legacy carriers to engage in collusion, the
merged entity faces less competitive pressure and therefore charges higher prices. In Appendix B, we
extend our theory model by taking cost asymmetry between nonstop and connecting and/or between
legacy and maverick carriers into consideration. From the extended model, we find qualitatively similar
results.
We conclude by remarking on the importance of connecting flights in airline merger analysis and
discussing relevant policy implications. Airline merger analysis primarily focuses on a set of routes
where merging carriers are a nonstop duopoly. On the other hand, a connecting flight is considered a
low-quality product and has a limited ability to constrain market power; hence, it has been of second
order importance in merger analysis. While the nonstop routes represent substantial anticompetitive
concerns, their passenger share is very small (e.g., 1% of passengers were in AA/USAir nonstop
3

duopoly routes). Additionally, given that 20-30% of passengers were in the connecting routes affected
by the elimination of Advantage Fares due to the AA/USAir merger, consumer surplus losses due to
a connecting flight price increase in those routes may be substantial enough to raise anticompetitive
concerns. This potentially suggests that it is important for merger control to consider potential
consumer harm through a wider range of routes rather than focusing on a few sets of local routes in
airline merger analysis.
Literature review This paper contributes to the literature on the coordinated effect of mergers.
Porter (2020) notes that unlike unilateral effects, coordinated effects do not lend themselves to a
standardized merger review procedure. Focusing on the Miller/Coors merger in the U.S. brewing
industry, Miller and Weinberg (2017) find that the postmerger prices are 6 to 8 percent higher than
they would have been if the merger impacted pricing through only unilateral effects and not through
coordinated effects. Miller et al. (2021) extend the previous work by considering price leadership in
the U.S. brewing industry to explain the coordinated effects of the Miller/Coors merger. Focusing
on a merger in the Swedish analgesics market, Bjornerstedt and Verboven (2016) show that partial
coordination explains some of the price increase for nonmerging firms that did not face a marginal cost
increase. Brito et al. (2018) propose an empirical structural methodology to quantify the coordinated
effects of partial horizontal acquisitions. Loertscher and Marx (2021) first develop a theory of collusive
behavior to quantify the adverse effects of such conduct. Then, Loertscher and Marx (2021) not only
identify tradeoffs between unilateral and coordinated effects but also show that whether a merger
involving a maverick firm harms market competition via coordinated effects depends on market-specific
aspects.
Our work is also related to antitrust issues in the U.S. airline industry. A series of mergers and
acquisitions of airline carriers in recent decades have led to more concentrated markets. Accordingly,
there has been a large body of literature on airline mergers (Ashenfelter et al. (2014); Li et al. (2021);
Park (2020); Das (2019)). There are several studies regarding the issues around collusive behaviors in
the industry. Related to multimarket contact, Evans and Kessides (1994) find that a higher amount of
market contact is positively associated with airline ticket prices. Ciliberto and Williams (2014) build a
structural model in which a conduct parameter is a function of carrier-pair multimarket contacts and
explores to what extent the contacts facilitate tacit collusion among airlines. Other studies focus on
“capacity disciplines.” Aryal et al. (2020) study the relationship of public communication via earning
calls with a carrier’s capacity reduction. Hazel (2018) finds that there is a negative relationship
between airline capacity and average domestic revenue per available seat mile.
Our work contributes to the literature in several ways. First, to the best of our knowledge,
4

this is the first study in the literature documenting an unusual price increase of nonmerging legacy
carriers after the AA/USAir merger, which is a merger with a maverick firm, and showing that it
can be theoretically explained by the coordinated effects of mergers. In addition, we emphasize that
connecting flights can play a crucial role in airline merger reviews, which have been overlooked in the
existing framework. Nonstop flight services in concentrated markets (e.g., routes in which merging
carriers are a nonstop duopoly) have been typically at the core of merger reviews due to its strong
consumer preference over connecting services. However, this paper suggests that connecting services
can be used to deter competition among rivals across different markets and anti-competitive effects
may be understated when overlooking the role of connecting services.
Section 2 describes the institutional background for the Advantage Fares and the AA/USAir
merger. Section 3 describes the empirical analysis, followed by Section 4, in which we introduce a
theoretical model to examine the conditions under which the merger softens price competition via
coordinated effects. Section 5 discusses several important aspects of our approach along with the
relevant policy implications, and finally, Section 6 concludes.
2 Institutional Background
In this section, we discuss the Advantage Fares employed by US Airways and the anticompetitive
concerns around the AA/USAir merger by focusing on the merger’s coordinated effect.
2.1 Advantage Fares
Prior to the AA/USAir merger, USAir had adopted “Advantage Fares,” a strategy that provided
cheap connecting services by undercutting other legacy carrier’s nonstop fares, and its main target
was price-sensitive passengers making last-minute bookings. This pricing strategy by USAir was
considered outside an industry norm in which legacy carriers respect the pricing of other legacy nonstop
carrier by offering connecting services at approximately the same price as the rival’s nonstop service.
USAir did not follow the industry norm and adopted this aggressive discounting strategy, which
is often called a cross-market initiative, largely because nonstop traffic at its hub airports was less
lucrative, and it needed to increase its revenue stream (Department of Justice. (2013)).
Figure 1 shows an actual example of Advantage Fares and how the response of other legacy carriers
for a last-minute booking. Figure 1a, for example, shows the price listing of a route from Miami to
Cincinnati one day before the departure date in August 2013. In this route where AA is the only
nonstop carrier, USAir undercut AA’s nonstop fare substantially with its connecting service, whereas
5

(a) Miami to Cincinnati
(b) Charlotte to Syracuse
Note: The screenshots above are taken from Department of Justice. (2013) on the AA/USAir merger.
Figure 1: Connecting Flights on August 13, 2013 (screenshot taken on August 12, 2013)
the prices of connecting services provided by DL and UA are similar to the nonstop fare. Other legacy
carriers responded to the USAir’s Advantage Fares by setting their connecting service prices low in
routes where USAir offered nonstop service. Figure 1b shows that DL and UA offered connecting
services at a price that substantially undercut USAir’s nonstop fare ($685) for a route from Charlotte
to Syracuse.
2.2 AA/USAir Merger and Elimination of Advantage Fares
One of the main anticompetitive concerns in the AA/USAir merger was that the merger would elim-
inate the Advantage Fares employed by USAir, leading to a change in the postmerger competitive
environment. While this merger had unilateral effects in routes where AA and USAir were competing
head-to-head on nonstop services, the merger effects were not directly associated with USAir’s mav-
erick behavior; concerns were more related to coordinated effects in which coordinated conduct among
nonmerging and merging carriers could be facilitated postmerger after the merging entities removed
the disruptive discount program.
To better understand the effects, Figure 2 keeps track of connecting flight prices over time, where
the vertical gray line indicates the date at which the AA/USAir merger was completed. The left panel
keeps track of the mean of the 90th quantile of connecting flight prices by carrier in routes in which
6

Routes where either AA, DL, or UA is nonstop (solid line) Routes where USAir is nonstop (dashed line)
2012 2014 2016 2018 2020 2012 2014 2016 2018 2020
5.6
5.8
6.0
Log(
90th
Qua
ntile
Con
nect
ing
Flig
ht P
rice)
Connecting Carrier AA/USAir Delta or United Other
Figure 2: Connecting flights
AA, DL, or UA was the only consistent nonstop carrier prior to the merger (hereinafter, Major3
nonstop routes).3 We use the 90th quantile of connecting ticket prices of a carrier for a route because
connecting tickets sold at the last minutes tend to be in the highest price range of all connecting
tickets that are purchased. In the figure, the 90th quantile connecting prices offered by USAir in the
Major3 nonstop routes (green solid line) are roughly 20% cheaper than those offered by DL or UA (red
solid line) for the same route group before the merger.4 It is worth noting that this is a descriptive
figure that does not control product- or route-specific characteristics, such as distance flown, that
could be reflected in the price gap between the two groups. However, after the merger, the connecting
flight prices tend to increase and converge. This postmerger price increase appears to be uniquely
related to the legacy carriers, if we compare the two groups (red and green lines) with the connecting
prices offered by other carriers (including Southwest, JetBlue, Alaska) in the Major3 nonstop routes,
marked with the blue solid line.
We also examine the extent to which the connecting flight prices offered by DL or UA, i.e.,
nonmerging legacy carriers, have evolved for different route groups. The right panel of Figure 2
indicates that premerger, the mean of the 90th quantile connecting flight prices by DL or UA in
USAir nonstop routes (red dashed line), routes in which USAir was the only consistent nonstop
carrier prior to the AA/USAir merger, was substantially lower than that by the same carriers in
3Note that the set of routes in the route group is fixed in the entire sample.4We group AA and USAir together to keep track of their prices over the entire period, because we are not able to
see only USAir’s prices postmerger.
7

the Major3 nonstop routes (red solid line). Postmerger, however, the two lines tend to increase and
converge. Additionally, while the connecting flight prices offered by other nonmerging carriers in
USAir nonstop routes (i.e., blue dashed line) tend to increase, the price increase is somewhat mild
compared to that of DL and UA’s connecting flight prices in the same group. This may indicate that
the merger softened competition by allowing nonmerging legacy carriers to compete less aggressively
against USAir.
Motivated by Figure 2, we further analyze the empirical patterns by performing a retrospective
merger analysis using a difference-in-differences regression approach. We find that our regression
results agree with the patterns we see in Figure 2 that nonmerging legacy carriers (DL and UA),
premerger, set more aggressive connecting prices and serve more passengers in USAir nonstop routes
than in Major3 nonstop routes. However, their prices and the level at which they serve passengers in
the two groups of routes converge postmerger at a higher price level and a lower passenger level. It
is worth noting that while other nonlegacy carriers do not seem to have this distinct pattern in the
two route groups around the merger, we find that Southwest’s price pattern is similar to non-merging
legacy carriers, which is in line with the 2015 lawsuit in which Southwest was alleged to limit the
available seats and increase ticket prices with the three legacy carriers (Stevens (2018)).
3 Empirical Analysis
In this section, we document the distinct connecting price patterns of nonmerging legacy carriers (DL
and UA) in USAir nonstop routes and Major3 nonstop routes around the time of the AA/USAir
merger. Additionally, we look at the connecting prices of different carrier groups in routes where
either DL or UA offers nonstop service.
3.1 Data
For this analysis, we mainly use the Airline Origin and Destination Survey (DB1B), a publicly available
dataset from the U.S. Department of Transportation. The DB1B contains a 10% sample of all air travel
passenger itineraries in the U.S. domestic airline industry. This quarterly dataset includes information
on the origin, destination, and connecting (if an itinerary has multiple connections) airports, ticket
prices, the number of passengers, flight distance, and the carriers that ticket and operate the itinerary.
Additionally, we use the Air Carrier Statistics (T-100) that contain monthly flight level information
on the numbers of flights, available seats, and passengers served by carriers given a route. We match
DB1B and T-100 to compute the flight frequency of nonstop flights. When matching, the regional
8

affiliates shown in T-100 are converted to their affiliated ticketing carriers in DB1B.
Following the literature (Ciliberto and Williams (2014); Li et al. (2021)), we define an airline market
as a directional airport pair. This implies that one direction of an airport pair market is different from
the opposite direction of the same pair market. Our dataset spans from the first quarter of 2011 to the
last quarter of 2019, which reasonably captures airline products and markets before and after the 2013
AA/USAir merger. We drop itineraries whose prices are below $12.5 or higher than $1,250, as they
are likely coding errors. In regard to itineraries including connections, we consider those with up to
one connection because those with multiple connections are rare in the data (less than 1% of total U.S.
domestic passengers). However, because it is a common practice for carriers to offer multiple itinerary
options in a market via different connecting airports (e.g., US Airways’ connecting flight from Boston
to Miami via Washington D.C. or via Philadelphia), we group any multiple itineraries offered by the
same carrier in a market into a single connecting product because the prices of these itineraries are
similar and our focus is on carrier’s overall connecting traffic in a route around the time of the merger
rather than on the carrier’s connecting traffic substitution among its individual hub airports.
Route Group We divide routes into several groups to see the extent to which ticket prices are
different in routes with a different nonstop monopolist. Let k be a carrier group and let route m be k’s
nonstop route if one of the carrier members in k is the only carrier who offered at least daily nonstop
flights in route m for twelve consecutive quarters before the AA/USAir merger. For example, the
route from Philadelphia (PHL) to Austin (AUS) is a USAir nonstop route because US Airways is the
only nonstop carrier from 2011Q1 to 2013Q4 with more than one flight a day, while other carriers in
the route either only partially provided nonstop flights or offered connecting services only. Similarly,
route m is a Major3 nonstop route if the only nonstop carrier in the route is one of AA, DL, or UA
and a Southwest nonstop route if the only nonstop carrier is Southwest. Last, route m is an Others
nonstop route if the only nonstop carrier in m is one other than the Major3, US Airways or Southwest.
Carriers in this group are mostly low-cost carriers, such as JetBlue, Frontier, Sprint, Virgin America,
and Alaska Airlines.
It is worth noting that the AA/USAir merger integrated AA and USAir into a single carrier at
the onset of the first quarter of 2014. However, since we classify the route group based on consistent
nonstop service offered before the AA/USAir merger, we can keep track of the extent to which the
merger led to distinct price changes among nonmerging legacy carriers, DL and UA, in USAir nonstop
routes relative to other route groups (e.g., Major3 nonstop routes). There are 442 markets in USAir
nonstop routes, and most of these markets include USAir’s hub airports as end points (e.g. Charlotte
(CLT); Philadelphia (PHL); Phoenix (PHX); and Washington Reagan National (DCA)).
9

Table 1: Summary Statistics of Connecting Flights Offered By Delta or United
Whose Nonstop Routes?
Variable Statistics Major3 USAir Southwest Others
Pre-Merger (2011Q1-2013Q4)Mean 619.921 1188.245 1116.991 1519.340
N. PassengersStd. Dev. 629.978 1245.397 1103.336 1692.718
Mean 274.517 196.860 191.651 215.402Ticket Price (U.S. dollar)
Std. Dev. 68.028 47.140 35.511 49.206
Mean 1.482 1.317 1.384 1.940Distance (1,000 miles)
Std. Dev. 0.587 0.716 0.534 0.716
Observations - 17,187 4,245 7,531 2,213
Postmerger (2014Q1-2019Q4)Mean 747.657 976.460 921.549 1498.079
N. PassengersStd. Dev. 743.199 1110.559 823.338 1448.903
Mean 276.372 233.788 230.011 233.189Ticket Price (U.S. dollar)
Std. Dev. 69.353 49.998 46.419 54.267
Mean 1.476 1.396 1.310 1.860Distance (1,000 miles)
Std. Dev. 0.594 0.753 0.522 0.719
Observations - 37,325 7,820 14,638 4,503
Note: ‘Major3’ column refers to Major3 nonstop routes — a set of routes in which one of three legacy carriers,AA, DL, and UA, was the only carrier offering at least daily nonstop service from 2011Q1 to 2013Q4. Analo-gously, the ‘USAir’, ‘Southwest’ and ‘Others’ columns refer to USAir nonstop routes, Southwest nonstop routes,and Others nonstop routes, respectively.
Table 1 shows the summary statistics of connecting flights offered by DL or UA, nonmerging legacy
carriers, in the different types of nonstop route groups. The table indicates that the average number
of connecting passengers served by DL or UA premerger is 620 in the Major3 nonstop routes, which
is roughly half of the number served in the USAir nonstop routes and Southwest nonstop routes,
or less than half of those served in the Others nonstop routes. After the AA/USAir merger, DL’s
or UA’s connecting passenger level, on average, increased to 747 in the Major3 nonstop routes but
decreased to 976 and 921 in the USAir nonstop routess and Southwest nonstop routes, respectively. In
terms of connecting service prices, the average premerger price is the highest in the Major3 nonstop
routes ($274), followed by that in the Others nonstop routes ($215), USAir nonstop routes ($196),
and Southwest nonstop routes ($191). Whereas the average prices of the nonmerging legacy carriers
increase postmerger in routes where USAir, Southwest, or Others is the only nonstop carrier, the price
tends to stay the same postmerger in Major3 nonstop routes. The average distance of a connecting
10

Table 2: Summary Statistics of Connecting Flights in Delta or United’s Nonstop Routes
Connecting Service Carriers
Variable Statistics DL or UA AA or USAir Southwest Others
Pre-Merger (2011Q1-2013Q4)Mean 592.985 1014.389 1593.642 907.349
N. PassengersStd. Dev. 470.784 931.808 1133.845 639.404
Mean 254.917 244.468 215.658 202.724Ticket Price (U.S. dollar)
Std. Dev. 56.242 43.223 34.694 35.001
Mean 1.501 1.322 1.347 1.642Distance (1,000 miles)
Std. Dev. 0.598 0.626 0.532 0.504
Observations - 4,908 10,368 3,144 1,128
Postmerger (2014Q1-2019Q4)Mean 896.361 1581.530 1525.540 797.339
N. PassengersStd. Dev. 737.641 1307.400 1099.507 698.830
Mean 255.825 250.482 217.024 177.217Ticket Price (U.S. dollar)
Std. Dev. 48.232 42.160 34.573 49.197
Mean 1.545 1.623 1.365 1.598Distance (1,000 miles)
Std. Dev. 0.595 0.554 0.517 0.524
Observations - 9,637 7,207 6,170 1,819
Note: Each column refers to the group of connecting flight services offered by the carrier in the column name in a non-merging legacy carrier’s nonstop routes.
flight is the highest in the Others nonstop routes across all time periods, but the distance in the
remaining route groups looks similar, ranging from 1,310 miles to 1,480 miles.
Table 2 shows the summary statistics for the connecting flight services offered by any carriers in
DL’s or UA’s nonstop routes. In those routes, the average connecting ticket prices are the highest for
the nonmerging legacy carriers and the lowest for other carriers (e.g., low-cost carriers). The price for
the merging carriers (AA or USAir) is $244 premerger, and increases to $250 postmerger, whereas
the other carriers’ prices remain the same or decrease. The merger led to an increase in the average
number of passengers for AA or USAir in the routes by approximately 50%, which partly reflects that
the connecting passengers using the flight services of the two merging carriers were aggregated in the
transition time period immediately after the merger was completed. The samples shown in Table 1
and 2 are used to examine the AA/USAir merger’s coordinated effects.
11

3.2 Econometrics Methods
3.2.1 Connecting Flights Offered by Delta or United
To examine whether the AA/USAir merger led to heterogeneous changes in the connecting flight ticket
prices and passenger shares of nonmerging legacy carriers across different route groups, we employ a
simple difference-in-differences regression analysis. Conditional on those connecting flights offered by
DL or UA in four nonstop route groups (Major3, USAir, Southwest, and Others nonstop routes), we
run the following regression:
yimt =β11{Postmerger}t +∑g∈G
β2,g1{Nonstop Route: g}m
+∑g∈G
β3,g1{Postmerger}t × 1{Nonstop Route: g}m
+Ximtγ + τq + ηm + εimt, (1)
where subscript i is the carrier, m is the market, and t is time. 1{Nonstop Route: g}m is a dummy
variable for carrier group g ∈ G = {USAir,Major3, Southwest,Others}, which takes one if route m
is g’s nonstop route and 0 otherwise. We use the log transformed 90th quantile ticket prices as a main
variable for y because connecting tickets sold at the last minute tend to be in the highest price range
of all purchased connecting tickets.
Premerger, if the nonmerging legacy carriers set more aggressive prices on USAir nonstop routes
in response to USAir’s Advantage Fares, their connecting prices in USAir nonstop routes will be
sufficiently different from those in Major3 nonstop routes after controlling for product- and route-
specific characteristics. β2,g will capture the baseline differences premerger. If the AA/USAir merger
facilitates collusive behaviors among legacy carriers due to the elimination of the Advantage Fares, we
would expect DL or UA to increase its prices in USAir nonstop routes, and the β3,g in the interaction
term between postmerger and nonstop route dummies will capture this effect.
Ximt indicates observable product characteristics, including travel distance and airport presence.5
Additionally, Ximt includes variables associated with market structures such as the number of nonstop
carriers and the number of low-cost legacy carriers, to capture the changes in the postmerger market
structure of those routes that were predefined based on the premerger market structure. We include
quarter fixed effects τq (q ∈ {Q1, Q2, Q3, Q4}), which control for seasonal variation. We also include
5Airport presence of a carrier at an airport is defined as the fraction of nonstop destinations offered by the carrier tothe nonstop destinations offered by all carriers at the airport.
12

Table 3: Regression Result: Connecting Prices and Passengers from Delta or United
Sample: connecting flights offered by Delta or Unitedlog(90th price) log(passengers)
(1) (2) (3) (4) (5) (6)
1{Postmerger} −0.048∗∗∗ −0.007 −0.050∗∗∗ −0.015 0.291∗∗∗ 0.246∗∗∗
(0.006) (0.007) (0.008) (0.010) (0.024) (0.027)
1{NonstopRoute : Others} −0.285∗∗∗ −0.271∗∗∗ −0.211∗∗∗ −0.207∗∗∗ 0.110 0.097(0.018) (0.017) (0.034) (0.036) (0.092) (0.097)
1{NonstopRoute : USAir} −0.283∗∗∗ −0.280∗∗∗ −0.233∗∗∗ −0.234∗∗∗ 0.455∗∗∗ 0.458∗∗∗
(0.030) (0.032) (0.031) (0.034) (0.082) (0.090)
1{NonstopRoute : Southwest} −0.294∗∗∗ −0.288∗∗∗ −0.238∗∗∗ −0.238∗∗∗ 0.129∗ 0.098(0.018) (0.018) (0.023) (0.023) (0.072) (0.079)
1{Postmerger} × 1{NonstopRoute : Others} 0.149∗∗∗ 0.137∗∗∗ 0.140∗∗∗ 0.143∗∗∗ −0.121∗ −0.050(0.018) (0.020) (0.032) (0.038) (0.073) (0.092)
1{Postmerger} × 1{NonstopRoute : USAir} 0.245∗∗∗ 0.286∗∗∗ 0.201∗∗∗ 0.248∗∗∗ −0.578∗∗∗ −0.619∗∗∗
(0.022) (0.027) (0.029) (0.037) (0.053) (0.063)
1{Postmerger} × 1{NonstopRoute : Southwest} 0.245∗∗∗ 0.264∗∗∗ 0.181∗∗∗ 0.201∗∗∗ −0.365∗∗∗ −0.391∗∗∗
(0.011) (0.012) (0.015) (0.017) (0.056) (0.059)
Balanced? N N Y Y Y Y2014-2015 Excluded? N Y N Y N YObservations 74,337 57,032 24,226 18,043 24,226 18,043R2 0.392 0.430 0.315 0.357 0.289 0.310
∗p<0.1; ∗∗p<0.05; ∗∗∗p<0.01
Note: This table shows the regression result of relevant variables when the sample is restricted to those connecting flights offered by DL or UA.The omitted reference group is Major3 nonstop routes. ‘Balanced’ indicates whether the sample includes only those connecting products sur-vived in the entire sample period. ‘2014-2015 Excluded?’ is whether the sample excludes two years of data immediately following the merger.The full regression result can be found in Table A1 in Appendix A.
a market fixed effect ηm to absorb market-specific unobservable characteristics. εimt indicates the
idiosyncratic error term. Last, we exclude any connecting services of a carrier who is also the nonstop
monopolist in a route to rule out the possibility that it sets higher connecting prices to steer passengers
to buy its nonstop service. For example, Delta’s connecting flights in Delta nonstop routes are not
included in the sample.
Table 3 presents the regression results from Equation (1). The coefficients in column (1) indicate
that premerger the 90th quantile prices of the nonmerging legacy carriers in Major3 nonstop routes,
the baseline route group, is 32.7 percent (because exp(0.283)− 1 = 0.327) higher than those in USAir
nonstop routes. However, after merging, their prices in USAir nonstop routes increase by 27.7 percent
(relative to the baseline), placing the connecting service prices in both route groups at a similar level.
This pattern of increase in connecting prices (relative to those in Major3 nonstop routes) is also
shown in Southwest and Other nonstop routes, although the relative price increase is much smaller
in Other nonstop routes. The results for the price regression are essentially unchanged under various
regression specifications. Column (2) excludes the two years of data immediately following the merger,
13

a transition time period in which the merging entities integrated their systems. Column (3) shows the
results when the sample includes only those connecting products that survived over the entire sample
period, which may address the concern that carrier entry/exit could drive the regression result. Last,
Column (4) combines the two restrictions in columns (2) and (3) together.
The change in connecting flight price patterns is negatively correlated with passenger level. Columns
(5) and (6) show the regression results when the dependent variable is the log transformed number
of passengers. The coefficients in those columns indicate that DL or UA carry, on average, 57.6
percent more connecting passengers in the USAir nonstop routes than in the Major3 nonstop routes.
Additionally, they seem to carry more connecting passengers in the Southwest and Others nonstop
routes, but the magnitude is relatively low and statistically insignificant. After the merger, however,
the average level of those connecting passengers dropped significantly in USAir nonstop routes, even
lower than those in Major3 nonstop routes (11.6 percent lower exp(0.455− 0.578)− 1 = 0.116). While
this pattern seems to hold for Southwest nonstop routes, there is not as much change in the level of
nonmerging legacy carrier connecting passengers in Others nonstop routes after the merger. The full
regression results can be found in Table A1 in Appendix A.
3.2.2 Any Connecting Flights in Delta or United’s Nonstop Routes
Next, we examine the extent to which the connecting prices of different carrier groups evolve over time
in Delta’s or United nonstop routes. For this, we restrict our sample to any connecting flights in those
routes in which DL or UA was the only nonstop carrier prior to the AA/USAir merger. For carrier i
in market m at time t, the regression equation is as follows:
yimt =β11{Postmerger}t +∑g∈G
β2,g1{Carrier: g}i
+∑g∈G
β3,g1{Postmerger}t × 1{Carrier: g}i
+Ximtγ + τq + ηm + εimt, (2)
where the notations follow those of Equation (1), by replacing 1{Nonstop Route: g}m with 1{Carrier: g}i,
an indicator function taking 1 if connecting service provider i is from one of the following four carrier
groups—i) DL or UA; ii) AA or USAir; iii) Southwest; or iv) Others.
Table 4 reports the regression results when the sample includes all connecting flights offered by
different carriers in Nonmerging legacy nonstop routes. The dummy for DL or UA is omitted and
served as the reference group. The results indicate that prior to the AA/USAir merger, the connecting
14

Table 4: Regression Result: Connecting Prices and Passengers in Delta or United’s Nonstop Routes
Sample: all connecting flights in Delta or United’s nonstop routeslog(90th price) log(passengers)
(1) (2) (3) (4) (5) (6)
1{Postmerger} −0.063∗∗∗ −0.029∗∗∗ −0.065∗∗∗ −0.035∗∗∗ 0.352∗∗∗ 0.308∗∗∗
(0.007) (0.008) (0.010) (0.012) (0.031) (0.030)
1{Carrier : AAorUSAir} −0.104∗∗∗ −0.106∗∗∗ −0.105∗∗∗ −0.106∗∗∗ 1.166∗∗∗ 1.169∗∗∗
(0.007) (0.007) (0.012) (0.012) (0.047) (0.047)
1{Carrier : Others} −0.398∗∗∗ −0.398∗∗∗ −0.392∗∗∗ −0.392∗∗∗ 0.596∗∗∗ 0.596∗∗∗
(0.014) (0.014) (0.020) (0.020) (0.067) (0.068)
1{Carrier : Southwest} −0.310∗∗∗ −0.307∗∗∗ −0.318∗∗∗ −0.320∗∗∗ 1.007∗∗∗ 0.987∗∗∗
(0.012) (0.012) (0.017) (0.018) (0.050) (0.048)
1{Postmerger} × 1{Carrier : AAorUSAir} 0.066∗∗∗ 0.095∗∗∗ 0.084∗∗∗ 0.111∗∗∗ −0.446∗∗∗ −0.618∗∗∗
(0.007) (0.008) (0.012) (0.013) (0.045) (0.046)
1{Postmerger} × 1{Carrier : Others} −0.099∗∗∗ −0.159∗∗∗ −0.081∗∗∗ −0.134∗∗∗ −0.636∗∗∗ −0.685∗∗∗
(0.015) (0.017) (0.018) (0.020) (0.053) (0.061)
1{Postmerger} × 1{Carrier : Southwest} 0.081∗∗∗ 0.065∗∗∗ 0.092∗∗∗ 0.082∗∗∗ −0.400∗∗∗ −0.402∗∗∗
(0.009) (0.010) (0.014) (0.016) (0.093) (0.091)
Balanced? N N Y Y Y Y2014-2015 Excluded? N Y N Y N YObservations 77,600 60,872 44,726 35,223 44,726 35,223R2 0.420 0.452 0.410 0.445 0.361 0.370
∗p<0.1; ∗∗p<0.05; ∗∗∗p<0.01
Note: This table shows the regression result of relevant variables when the sample is restricted to those connecting flights offered by DL orUA. The omitted carrier dummy is whether DL or UA. ‘Balanced’ indicates whether the sample includes only those connecting productssurvived in the entire sample period. ‘2014-2015 Excluded?’ is whether the sample excludes two years of data immediately following themerger. The full regression result can be found in Table A2 in Appendix A.
flights offered by DL or UA (baseline dummy) are 9.8% more expensive than those offered by AA or
USAir. Postmerger, however, the merged carrier increased its prices to match the price level of the
connecting prices of nonmerging legacy carriers. A similar pattern can be found for Southwest, even
though its premerger price level is much lower (26.6%) than that of the nonmerging legacy carriers.
On the other hand, other carriers, which are mostly low-cost carriers, further decreased their price
postmerger relative to DL or UA. The price regression in Table 4 is robust to various specifications,
similar to the previous regression results. In terms of passengers levels, Columns (5) and (6) show that
premerger, the number of passengers using AA or USAir or Southwest is more than twice the number
using DL’s or UA’s connecting services, whereas postmerger, their passenger numbers decrease by 50%
to 60%, relative to the baseline.
3.2.3 Discussion and Robustness Check
Southwest and Legacy Carriers In our empirical analysis, we find that the connecting prices of
nonmerging legacy carriers have evolved in a very similar way in both USAir and Southwest nonstop
15

routes (Table 3). In addition, in Table 4, postmerger, both merging carriers and Southwest Airlines
increase their connecting prices (6.6% and 8.1%) relative to the baseline, while other (low-cost) carriers’
prices decrease. These findings raise the natural question of whether Southwest and the three legacy
carriers have formed some sort of coordination that could soften competition. In a 2015 lawsuit, in
fact, it was alleged that Southwest limited the available seats and increased ticket prices with the three
legacy carriers. While the carrier settled with members of a class-action lawsuit in 2018, Southwest
denied that it had any unlawful agreements with AA, DL, and UA (Stevens (2018)).
Robustness Check We perform a series of robustness checks. The first main concern is that
flight service entry/exit around the AA/USAir merger may act as a confounding factor that changes
the price or passenger level. To address this concern, we run the regressions with a balanced panel
(‘Balanced’ in Table 3 and 4), a set of connecting products that survive across the entire sample period,
and the results are robust. Second, there is a possibility that how we define a carrier’s nonstop route
affects the regression results. While we chose our definition which helps identify routes in which there
is only one carrier who persistently offers nonstop services prior to the merger, we vary the threshold
of definition such as 8 or 4 quarters instead of 12 quarters or at least two daily nonstop flights instead
of one. With various definitions, our results are robust, as in Table A3 in Appendix A. Last, there
is a concern that the price we have examined may not represent a general connecting service. To
address this, we run the same regression as (Table 3) by replacing the 90th quantile prices with the
average prices which represent a general ticket price. The regression results are reported in Table
A4 in Appendix A, and they are robust. With these consistent empirical findings, we move on to a
theoretical model that can help us better understand the coordinated effects of the merger.
4 Theoretical Model
In this section, we provide a theoretical model to explain the conditions under which the AA/USAir
merger weakened market competition via coordinated effects.
4.1 Primitives
Airlines A consumer in the unit mass chooses one airline from among three alternatives, denoted
as AA, DL, and USAir, respectively. Thus, the set of alternatives conditional on flying is F =
{AA,DL,USAir}. The net utility arising from the outside option, i.e., not flying, denoted as NF , is
normalized to zero.
Markets There are three different markets, m ∈ M, where M = {1, 2, 3}, in which all three
16

airlines operate. We assume that in each market, one of the airlines serves as a nonstop monopolist,
while the remaining two carriers operate connecting flights. Specifically, we assume that DL in m = 1,
USAir in m = 2, and AA in m = 3 are nonstop monopolists in that market. This market structure
reflects the earlier definition of a carrier’s nonstop routes. We also assume that the three markets
have identical characteristics, such as origin/destination airport size and nonstop distance. Given
these three markets with three airlines setups, we examine how the AA/USAir merger affects the
competitive structure across markets. Specifically, our analysis allows us to see how nonmerging
legacy carriers, such as DL, and merging entities, AA and USAir, change their pricing behaviors
before and after the merger. The market structure is summarized in Figure 3.
Figure 3: The market structure
Consumer Utility Specification Consider each market in which three airlines compete with
each other. The indirect utility of a consumer who takes airline j ∈ F in market m is given as follows.
ujm = δjm + αpjm + γ1CONNjm + ξjm︸ ︷︷ ︸≡Vjm
+(1− σ)εjm, (3)
where 1CONNjm is one if j offers connecting flight service in market m and zero otherwise, and γ ≤
0 captures the disutility obtained by a passenger when taking connecting flights, such as a longer
flight time. α ≤ 0 is the service-specific price sensitivity, pjm is airfare for j in market m, and
δjm captures other observable service characteristics. For notational convenience, Vjm represents the
quality of product j including its price. Additionally, ξjm captures unobservable product quality, which
we normalize to zero for all j in m, and εjm is an independent and identically distributed random
unobserved component of consumer utility, which follows a Type I Extreme Value distribution. The
parameter σ represents the degree of independence in unobserved utility among alternatives within a
nest: the higher the value of σ is, the greater the differentiation between products in the same nest.
That is, 1− σ measures the degree of substitution.
A consumer will choose airline j over k if ujm > ukm ∀ k ∈ F \ j. The choice probability of a
17

consumer choosing airline j in market m ∈M is given as follows.
xjm = Pjm|F ×PF (4)
=exp
(Vjm1−σ
)∑
k∈F exp(Vkm1−σ
) ×[∑
k∈F exp(Vkm1−σ
)]1−σ
1 +[∑
k∈F exp(Vkm1−σ
)]1−σ ,
where Pjm|F is the conditional probability of choosing airline j given that a consumer takes a flight,
and PF is the probability of choosing to fly over not flying.
Airline’s Problem Each airline chooses the optimal price pjm as follows.
maxpjm
∑m∈M
(pjm − cjm)xjm(pm)︸ ︷︷ ︸=πjm
+θjk × 1j,k∈L∑
m∈M,j 6=k(pkm − ckm)xkm(pm)︸ ︷︷ ︸
=πkm
, (5)
where pm is a vector of product prices in market m, and cjm is the marginal cost of operation for airline
j in market m. The profit maximization problem first reflects multimarket business strategies. To
emphasize on airline’s strategic choices in multimarket, we allow each airline to maximize its aggregate
profit across markets. That is, airline j chooses pj1, pj2, and pj3 by solving maxpj1,pj2,pj3 πj1+πj2+πj3:
this profit maximization allows airline j to cross-subsidize across markets.
Additionally, we consider a conduct parameter, θjk ∈ [0, 1] for j 6= k, where θjk = θkj , to capture
the degree of coordination among carriers j and k (Bresnahan (1982); Berheim and Whinston (1990);
Ciliberto and Williams (2014); Miller and Weinberg (2017)). If θ is one, it implies perfect coordination,
such that airline j sets pjm by fully internalizing the prices of any relevant rival airlines, whereas θ = 0
indicates that the market returns to a competitive structure without direct coordination. If θ ∈ (0, 1),
firms partially internalize their price externalities. The indicator function, 1j,k∈L, is one if airlines j
and k are AA or DL (i.e., L = {AA,DL}). For notational simplicity, we denote θAA,DL = θDL,AA ≡ θ.
The aforementioned cross-market initiatives among legacy carriers can be described in the model
by a positive conduct parameter between AA and DL, θAA,DL > 0. However, given that USAir’s
Advantage Fares pose a considerable competitive threat, those carriers may not be able to engage
in stable collusive conduct with USAir. Thus, we assume that, as a baseline, there is no collusive
conduct between legacy and maverick carriers, which means that θAA,USAir = θDL,USAir = 0.
Merger Analysis We assume that AA is merged with USAir, whileDL remains an independent
airline. Postmerger, the merged entity maximizes the joint profit of AA and USAir in each market.
We do not endogenize AA’s decision on whether to merge with any rival airline because we place more
emphasis on how the merger between legacy and maverick carriers affects the market’s competitive
18

structure, especially through its impact on nonmerging entity DL, taking the merger between AA and
USAir as given.
As shown in Sections 2.2 and 3, before the AA/USAir merger, major legacy carriers set relatively
low connecting airfares, thereby capturing a greater market share, in USAir nonstop routes, compared
to their prices in the Major3 nonstop routes. However, after the merger, this discrepancy in legacy
carriers’ relative pricing strategies disappeared, such that their connecting price ratios to USAir’s
nonstop service are no longer lower than those to other legacy carriers’ nonstop service. In this
finding, our concern is whether the AA/USAir merger, a merger with a maverick firm, eliminates
intense competition in USAir nonstop routes. In particular, our focus is on the effects of mergers on
nonmerging entities’ pricing strategies, namely, the coordinated effects of mergers.
4.2 Equilibrium
Given the choice probability in Equation (3), each airline j chooses the optimal pjm by solving Equation
(5). As mentioned earlier, our setup views any changes in postmerger competitive structure, followed
by changes in pricing strategies, as resulting from the elimination of the maverick firm. To investigate
the extent to which nonmerging carriers change their connecting flight prices and passenger shares
in different groups of routes over time, we focus on how DL’s pricing strategies change postmerger.
Specifically, in Section 4.2.1, we first focus on markets in which DL offers connecting service while
competing with either USAir as the maverick nonstop monopolist or AA as the legacy nonstop
monopolist. In Section 4.2.2, we focus on the market in which DL is the nonstop monopolist and other
carriers offer connecting flights. Note that both DL and UA are classified as the same nonmerging
legacy carriers; for the sake of discussion, we focus on the effect of the merger on DL below.
4.2.1 Connecting Flights Offered by Delta
To see general effects of maverick firm-driven intense competition on nonmerging entity DL as a
connecting carrier, we focus on markets 2 and 3, in which USAir and AA are nonstop monopolists,
respectively. We compare the price ratio of DL’s connecting to AA’s nonstop service in m = 3 with
the ratio of DL’s connecting to USAir’s nonstop in m = 2, in order to investigate whether DL as
a nonintegrated entity also competes less aggressively against USAir in terms of pricing after the
AA/USAir merger. If so, this suggests that the competition-reducing effects of the merger become
prevalent for all players in the markets, implying coordinated effects.
As depicted in the left panel of Figure 4, premerger, DL as a connecting carrier sets a fare that
19
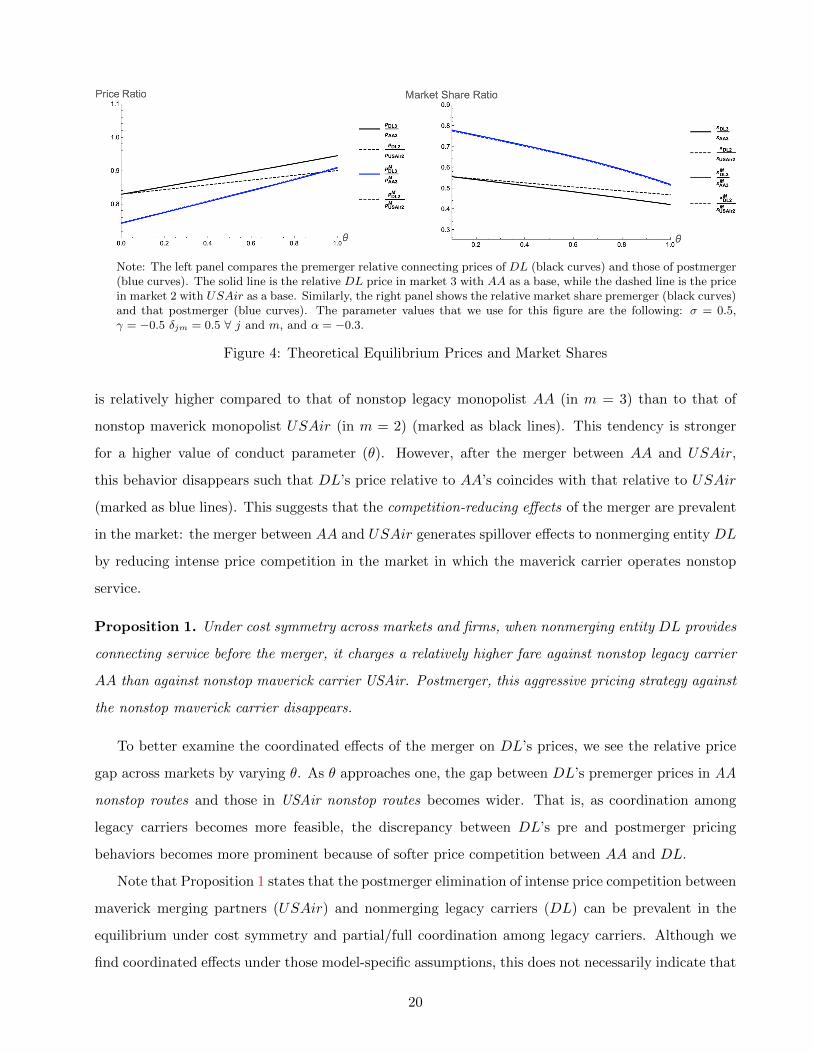
Note: The left panel compares the premerger relative connecting prices of DL (black curves) and those of postmerger(blue curves). The solid line is the relative DL price in market 3 with AA as a base, while the dashed line is the pricein market 2 with USAir as a base. Similarly, the right panel shows the relative market share premerger (black curves)and that postmerger (blue curves). The parameter values that we use for this figure are the following: σ = 0.5,γ = −0.5 δjm = 0.5 ∀ j and m, and α = −0.3.
Figure 4: Theoretical Equilibrium Prices and Market Shares
is relatively higher compared to that of nonstop legacy monopolist AA (in m = 3) than to that of
nonstop maverick monopolist USAir (in m = 2) (marked as black lines). This tendency is stronger
for a higher value of conduct parameter (θ). However, after the merger between AA and USAir,
this behavior disappears such that DL’s price relative to AA’s coincides with that relative to USAir
(marked as blue lines). This suggests that the competition-reducing effects of the merger are prevalent
in the market: the merger between AA and USAir generates spillover effects to nonmerging entity DL
by reducing intense price competition in the market in which the maverick carrier operates nonstop
service.
Proposition 1. Under cost symmetry across markets and firms, when nonmerging entity DL provides
connecting service before the merger, it charges a relatively higher fare against nonstop legacy carrier
AA than against nonstop maverick carrier USAir. Postmerger, this aggressive pricing strategy against
the nonstop maverick carrier disappears.
To better examine the coordinated effects of the merger on DL’s prices, we see the relative price
gap across markets by varying θ. As θ approaches one, the gap between DL’s premerger prices in AA
nonstop routes and those in USAir nonstop routes becomes wider. That is, as coordination among
legacy carriers becomes more feasible, the discrepancy between DL’s pre and postmerger pricing
behaviors becomes more prominent because of softer price competition between AA and DL.
Note that Proposition 1 states that the postmerger elimination of intense price competition between
maverick merging partners (USAir) and nonmerging legacy carriers (DL) can be prevalent in the
equilibrium under cost symmetry and partial/full coordination among legacy carriers. Although we
find coordinated effects under those model-specific assumptions, this does not necessarily indicate that
20

the main result is sensitive to the particular way the market is modeled. Indeed, the model with cost
asymmetry between legacy and maverick carriers and/or between nonstop and connecting carriers also
finds such coordinated effects, as shown in Appendix B.
4.2.2 Any Connecting Flights in DL’s Nonstop Routes
Next, we examine how the connecting flights offered by other carriers (i.e., merging entities AA and
USAir) in m = 1 (i.e., DL nonstop routes) are affected by the merger. As Figure 5 shows, both
AA and USAir raise their fares postmerger. This price increase is mostly driven by the unilateral
effects of the merger. Importantly, this suggests that, postmerger, USAir, which had previously been
providing substantial price discounts for connecting routes premerger, is no longer a maverick airline.
Additionally, the gap between pre and postmerger prices becomes wider as θ approaches one. This
implies that as coordination among carriers becomes easier, AA and USAir, as merging entities, tend
to set higher prices, which widens the price gap.
Note: The solid and dashed curves show AA’s and USAir’s premerger prices in m = 1, respectively. The dottedcurve shows their postmerger prices in the same market.
Figure 5: A comparison of prices for connecting carriers in DL’s nonstop routes
Proposition 2. Under cost asymmetry across markets and firms, AA and USAir, as merging entities,
raise prices postmerger in the market in which nonmerging entity DL is the nonstop monopolist
Discussion of conduct parameter θ In Section 4, we focus on the coordinated effects of the
AA/USAir merger by introducing the conduct parameter θ, which reflects the degree of collusion among
legacy carriers. However, it is worth noting that we can find similar coordinated effects from other
specifications. For instance, as shown in Appendix B, the model with cost asymmetry between legacy
and maverick carriers and/or between nonstop and connecting carriers also results in implications
qualitatively similar to those in the main specification. This suggests that our theoretical findings on
21

coordinated effects are robust to different specifications. Additionally, there can be several different,
and potentially complementary, factors driving coordinated effects, such as collusion-driven and cost-
driven.6
4.2.3 Merger with Maverick Carrier vs. Legacy Carrier
Our main findings show coordinated effects from the AA/USAir merger that are driven by the elim-
ination of maverick carrier USAir’s price innovation, represented by Advantage Fares. Given that
the coordinated effects of mergers can be more salient in the case of a merger involving a maverick
firm, it is worth examining how much this type of merger facilitates postmerger coordinated conduct
compared to a merger between legacy carriers. In the main model, the only difference between legacy
and maverick carriers is the incentive to coordinate: that is, the cross-market initiatives are observ-
able only among legacy carriers, which are reflected by a positive conduct parameter θ. To see how a
merger involving a maverick firm, represented by zero conduct parameter in the relevant profit func-
tions, is different from one involving a non-maverick/legacy firm, represented by a positive conduct
parameter, we compare premerger relative connecting prices of DL with those of postmerger assuming
that there are coordinated conducts between legacy carriers (DL and AA) and USAir. Specifically,
this assumption implies that θAA,USAir = θDL,USAir = θ: all three airlines share the same conduct
parameter.
Note: The left panel compares the premerger relative connecting prices of DL (black curves) and those of postmerger(blue curves). The solid line is the relative DL price in market 3 with AA as a base, while the dashed line is theone in market 2 with USAir as a base. Similarly, the right panel shows the relative market share premerger (blackcurves) and that of postmerger (blue curves). The parameter values that we use for this figure are the following:σ = 0.5, γ = −0.5 δjm = 0.5 ∀ j and m, and α = −0.3.
Figure 6: Theoretical Equilibrium Prices and Market Shares (when USAir is a non-maverick firm).
Unlike in the main finding, as shown in Figure 4, in which USAir is a maverick carrier such that
there is no coordination with other legacy carriers premerger, Figure 6 shows that DL does not price
6However, we do not try to determine what is driving the coordinated effects of mergers because it is beyond thescope of our paper.
22

aggressively in USAir nonstop routes premerger: given that AA and USAir are now symmetric from
DL’s perspective, we do not find merger-driven coordinated effects because the three already engage
in coordinated conduct premerger. This result emphasizes how a merger involving a maverick firm,
which is more likely to lead to coordinated effects, is different from other types of mergers involving
non-disruptive legacy firms.
5 Discussion
In this section, we discuss the potential importance of connecting flights to airline antitrust issues and
the merger remedies imposed in the AA/USAir merger.
5.1 Connecting vs. Nonstop
In the airline industry, while nonstop services are typically effective in constraining rivals’ market
power, connecting flights are considered a poor substitute and that have a limited ability to restrain
rivals from raising prices. For that reason, nonstop flight services in concentrated markets have been
the core elements of analysis in merger reviews in the industry (e.g., routes in which merging carriers are
a nonstop duopoly). However, connecting service options can play a crucial role in market competition
and a careful examination is often required. As documented in this paper, connecting flight services
with a substantial discount (i.e., Advantage Fares) disrupted markets and induced intense competition
across multiple routes. Then, when the AA/USAir merger eliminated the price discounting program,
we witnessed that the market competition originating from those connecting flights became softened.
One might think that only a small number of passengers in a route would be affected by this margin,
but the regression results in Section 3 indicate that postmerger, the number of connecting passengers
of nonmerging legacy carriers, on average, decreased by 50% (or 400 passengers) in USAir nonstop
routes, relative to those in Major3 nonstop routes. In addition, one important factor to consider is the
sheer number of routes and aggregated number of passengers across all affected markets.
Table 5 tabulates the number of markets and passengers in the second quarter of 2013. It shows
that there are, in total, 8,665 markets with 95.2 million passengers, and connecting passengers account
for 25% of the total passengers. When we focus on the set of routes in which AA and USAir are
a nonstop duopoly, these represent only 1.2 million passengers in 24 markets (or 1.26% of the total
passengers). In regard to those routes affected by Advantage Fares, which are routes in which one of
the three legacy carriers offers nonstop service and USAir offers connecting service or vice-versa, there
are approximately 1,700 markets (Group C) with 42.2 million passengers in total. Even if we restrict
23

Table 5: Tabulation of Routes by Market Group in 2013Q2
2013Q2 Passengers (mil.)
Group Category N. Markets Connecting Nonstop Total
A All Markets 8665 23.6 71.6 95.2
B Both AA and USAir Nonstop 24 0.0 1.2 1.2
Major3 NS and USAir Conn 1344 4.9 30.5 35.4CUSAir NS and Major3 Conn 341 1.3 5.4 6.8
Note: This table shows the number of routes and passengers in different types of market groups. ‘All Markets’in Group A indicates the entire market. ‘Both AA and USAir Nonstop’ in Group B refers to the set of routes inwhich American and US Airways are nonstop duopolists. ‘Major3 NS and USAir Conn’ shows the set of routes inwhich one of three major legacy carriers (American, Delta, and United) is the one and only nonstop carrier and USAirways offers connecting services. Similarly, ‘USAir NS and Major3 Conn’ refers to the set of routes in which USAirways is the only nonstop service provider and at least one of the three legacy carriers offers connecting services.
our focus to connecting passengers, 26.3% of the total connecting passengers are in this category. This
implies that potential consumer harm due to the AA/USAir merger in nonstop duopoly routes (Group
B) could be huge in a small number of markets, whereas the harm due to the elimination of Advantage
Fares (Group C) could be small at the route level but considerably large if we aggregate the welfare
losses from all connecting routes and their passengers. This suggests that it is crucial for a merger
control to consider potential consumer harm across a wider range of routes rather than focusing on
a few sets of local routes in airline merger analysis. However, the AA/USAir merger was completed
without addressing the coordinated effects of the merger.
5.2 Merger Remedies
The AA/USAir merger was approved with remedies that mainly addressed the merger’s potential
unilateral effects without considering the specific effect of eliminating a maverick firm or the coordi-
nated effects. Before the trial started, the parties settled through a set of structural remedies that
include requiring merging carriers to divest some of their airport landing slots and gate accesses at
a few slot-controlled airports (e.g., Washington D.C. Reagan National Airport (DCA) and New York
LaGuardia Airport (LGA)) to low-cost carriers (LCCs). Divestitures would allow LCCs to increase
their operating capacity at those airports and mitigate potential consumer harm from merging carri-
ers obtaining greater market power, but they are not designed to block rival carriers from engaging
in collusive conducts (Peterman (2014)). Although the DOJ claimed that the potential benefits of
LCC entry and expansion through divestitures could be comparable to those of the Advantage Fares
(Department of Justice. (2014)), ex post LCC route expansion focused on a limited number of routes
24

based on DCA and LGA.7 Furthermore, as Loertscher and Marx (2021) mentions, asset divestitures as
a merger remedy can raise greater concerns about coordinated effects, although it resolves unilateral
effects.
Our analysis suggests that it is important not to overlook the coordinated effects. If a merger
involving a maverick firm can potentially soften price competition by eliminating disruptive innovation,
such as Advantage Fares, competitive authorities need to take extra care in considering whether to
challenge the merger by quantifying the market harm originating from the acquisition of the maverick
firm. As Horizontal Merger Guidelines (Department of Justice) (2010) notes, if a merger partner
acquires a maverick firm, it can be evidence of the adverse effects of the merger. As we stated earlier,
in the AA/USAir merger, the DOJ’s effort to resolve the merger’s anticompetitive effects did not focus
on the coordinated effects. This could be partly because connecting flights were not crucial aspects of
the airline merger reviews or partly because any remedies that could preserve Advantage Fares would
be costly (e.g., behavioral remedies that force the merged entity to continue to provide Advantage
Fares postmerger may require a high monitoring cost). However, as stated in Section 5.1, the low
consumer harm due to the elimination of Advantage Fares can be substantial when aggregated across
all affected routes; therefore any remedies to address the harm can be rationalized if the aggregated
harm is higher than any costs arising from those remedies. If this is the case, the authorities might take
remedies into account when they do not want to reject the proposed merger but do aim to preserve
disruptive innovation that the maverick firm brings to market.
6 Concluding Remarks
This paper studies the coordinated effects of a merger involving a maverick firm in the context of
the merger between American Airlines (AA) and US Airways (USAir). We find, both theoretically
and empirically, that the merger, which eliminated the Advantage Fares employed by USAir, softens
price competition between the merging and nonmerging carriers. Specifically, nonmerging legacy
carriers (i.e., DL and UA), which had previously set lower prices in USAir’s nonstop monopoly
market premerger, no longer employed such aggressive pricing after the merger. This evidence on a
postmerger price increase for nonmerging entities is supported by a theory of coordinated effects.
Even if it is likely that the elimination of Advantage Fares weakened the market competition
7For example, although divestitures at DCA allowed low-cost carriers to increase their passenger share from 13.7%in 2013 to 24.8% in 2016, the overall passenger growth at the airport was similar to nationwide growth Park (2020). Inregard to entry, low-cost carriers who receive airport slots tend to add leisure-based destinations from DCAs, such asFort Lauderdale and Tampa (Southwest) and Palm Beach (JetBlue).
25

through both unilateral and coordinated effects, less attention has been paid to the latter: although
settlement remedies requiring the divestiture of slots and gates at several airports resolved unilateral
effects, they did not eliminate the anticompetitive harm from coordinated effects. For airline merger
evaluations, in particular, one possible reason for such neglect is that competitive authorities overlook
the importance of connecting flights: given that Advantage Fares only applied to connecting routes,
which are known to be less effective in restricting rivals’ market power, the adverse effects of elim-
inating Advantage Fares following the merger is likely to have underestimated. We emphasize that
the aggregate effects of connecting services, if summed over all markets, are likely to have a signifi-
cant impact on market competition, which is a subject deserving more attention. In this regard, we
primarily focus on the effects of mergers on connecting routes and find substantial price increases of
nonmerging carriers, which are likely to be driven by the Advantage Fares.
Overall, our findings offer evidence supporting the coordinated effects of mergers. In particular,
when a market is more vulnerable to coordinated conduct, such as the airline industry with its price
transparency, coordination among firms is likely to exist even premerger. In this case, postmerger
coordination is rather obvious, and it thus requires more careful merger reviews. Furthermore, if a
proposed merger involves a maverick firm, competitive authorities may need to examine more closely.
Although a maverick firm may only take up a small part of the market and thus seem to have a
negligible impact, its aggregate effect may be significant when we consider the competition-enhancing
effects arising from its disruptive role.
References
Aryal, G., Ciliberto, F., and Leyden, B. T. (2020). Coordinated Capacity Reductions and Public
Communication in the Airline Industry. Working Paper.
Ashenfelter, O., Hosken, D., and Weinberg, M. (2014). Did robert bork understate the competitive
impact of mergers? evidence from consummated mergers. The Journal of Law and Economics,
57(S3):S67–S100.
Berheim, B. and Whinston, M. (1990). Multimarket contact and collusive behavior. The RAND
Journal of Economics, pages 1–26.
Berry, S. and Jia, P. (2010). Tracing the Woes: An Empirical Analysis of the Airline Industry.
American Economic Journal: Microeconomics, 2(3):1–43.
26

Bjornerstedt, J. and Verboven, F. (2016). Does Merger Simulation Work? Evidence from the Swedish
Analgesics Market. American Economic Journal: Applied Economics, 8(4):125–164.
Bresnahan, T. F. (1982). The oligopoly solution concept is identified. Economics Letters, 10(1-2):87–
92.
Brito, D., Ribeiro, R., and Vasconcelos, H. (2018). Quantifying the Coordinated Effects of Partial
Horizontal Acquisitions. European Economic Review, 110:108–149.
Ciliberto, F. and Williams, J. (2014). Does Multimarket Contact Facilitate Tacit Collusion? Inference
on Conduct Parameters in the Airline Industry. The RAND journal of economics, 45(4):764–791.
Das, S. (2019). Effect of Merger on Market Price and Product Quality: American and US Airways.
Review of Industrial Organization, 55(3):339–374.
Department of Justice. (1993). Final Judgement for United States of America v. Airline Tariff Publish-
ing Company. https://www.justice.gov/atr/case-document/file/483626/download. Accessed: 2021-
06-15.
Department of Justice. (2013). Complaint for U.S., et al. v. US Airways Group, Inc. and AMR
Corporation. https://www.justice.gov/atr/case-document/file/514531/download. Accessed: 2021-
05-13.
Department of Justice. (2014). Response of Plaintiff United States to Public Comments on The
Proposed Final Judgement for U.S., et al. v. US Airways Group, Inc. and AMR Corporation.
https://www.justice.gov/atr/case-document/file/514496/download. Accessed: 2021-06-05.
Evans, W. N. and Kessides, I. N. (1994). Living by the “golden rule”: Multimarket contact in the us
airline industry. The Quarterly Journal of Economics, 109(2):341–366.
Greenfield, D., Kobayashi, B., Sandford, J., Taylor, C., and Wilson, N. (2019). Economics at the FTC:
Quantitative Analyses of Two Chemical Manufacturing Mergers. Review of Industrial Organization,
55(4):607–623.
Hazel, R. (2018). Airline capacity discipline in the U.S. domestic market. Journal of Air Transport
Management, 66:76–86.
Horizontal Merger Guidelines (Department of Justice) (2010). Horizontal Merger Guidelines.
27

Ivaldi, M., Jullien, B., Rey, P., Seabright, P., and Tirole, J. (2003). The Economics of Tacit Collusion.
IDEI Working Papers.
Li, S. Y., Mazur, J., Park, Y., Roberts, J., Sweeting, A., and Zhang, J. (2021). Repositioning and
Market Power After Airline Mergers. Working Paper, pages 1–83.
Loertscher, S. and Marx, L. (2021). Coordinated Effects in Merger Review. Journal of Law and
Economics (Forthcoming).
Miller, N., Sheu, G., and Weinber, M. (2021). Oligopolistic Price Leadership and Mergers: The United
States Beer Industry. Working Ppaer.
Miller, N. H. and Weinberg, M. (2017). Understanding the price effects of the MillerCoors joint
venture. Econometrica: Journal of the Econometric Society.
Olley, G. and Town, R. (2018). End of an era: The american airlines–us airways merger. The Antitrust
Revolution: Economics, Competition, and Policy, pages 448–470.
Park, Y. (2020). Structural Remedies in Network Industries: An Assessment of Slot Divestitures in
the American Airlines/US Airways Merger. Working Paper.
Peterman, C. A. (2014). The future of airline mergers after the US Airways and American Airlines
merger. Journal of Air Law and Commerce, 79(4):781–817.
Porter, R. H. (2020). Mergers and coordinated effects. International Journal of Industrial Organiza-
tion, 73:102583.
Stevens, M. (2018). Southwest airlines settles suit but denies colluding to keep ticket prices high.
28

Appendix
A Tables
Table A1: Connecting Prices and Passengers from Delta or United (Full Regression Results)
Sample: connecting flights offered by Delta or Unitedlog(90th price) log(passengers)
(1) (2) (3) (4) (5) (6)
1{Postmerger} −0.048∗∗∗ −0.007 −0.050∗∗∗ −0.015 0.291∗∗∗ 0.246∗∗∗
(0.006) (0.007) (0.008) (0.010) (0.024) (0.027)
1{NonstopRoute : Others} −0.285∗∗∗ −0.271∗∗∗ −0.211∗∗∗ −0.207∗∗∗ 0.110 0.097(0.018) (0.017) (0.034) (0.036) (0.092) (0.097)
1{NonstopRoute : USAir} −0.283∗∗∗ −0.280∗∗∗ −0.233∗∗∗ −0.234∗∗∗ 0.455∗∗∗ 0.458∗∗∗
(0.030) (0.032) (0.031) (0.034) (0.082) (0.090)
1{NonstopRoute : Southwest} −0.294∗∗∗ −0.288∗∗∗ −0.238∗∗∗ −0.238∗∗∗ 0.129∗ 0.098(0.018) (0.018) (0.023) (0.023) (0.072) (0.079)
Number of Nonstop LCCs −0.002 −0.013∗∗∗ −0.041∗∗∗ −0.048∗∗∗ 0.065∗∗ 0.082∗∗∗
(0.005) (0.004) (0.008) (0.009) (0.026) (0.029)
Number of Nonstop Carrier = 1 −0.072∗∗∗ −0.038∗∗∗ −0.081∗∗∗ −0.049∗∗∗ −0.114∗ −0.136∗
(0.012) (0.012) (0.014) (0.014) (0.064) (0.073)
Number of Nonstop Carrier = 2 −0.060∗∗∗ −0.040∗∗∗ −0.070∗∗∗ −0.055∗∗ −0.281∗∗∗ −0.298∗∗∗
(0.014) (0.014) (0.021) (0.023) (0.061) (0.066)
Number of Nonstop Carrier ≥ 3 −0.068∗∗∗ −0.061∗∗∗ −0.095∗∗ −0.089∗∗ −0.232∗ −0.270∗∗
(0.019) (0.021) (0.040) (0.040) (0.121) (0.125)
Distance (1,000 miles) 0.193∗∗∗ 0.192∗∗∗ 0.165∗∗∗ 0.166∗∗∗ 0.200∗∗∗ 0.202∗∗∗
(0.011) (0.011) (0.020) (0.020) (0.046) (0.043)
Airport Presence (Origin) 0.218∗∗∗ 0.225∗∗∗ 0.192∗∗∗ 0.216∗∗∗ 0.037 0.093(0.027) (0.030) (0.038) (0.039) (0.131) (0.138)
Airport Presence (Destination) 0.206∗∗∗ 0.200∗∗∗ 0.166∗∗ 0.205∗∗ 0.369∗∗ 0.334∗∗
(0.042) (0.038) (0.078) (0.085) (0.148) (0.139)
1{Postmerger} × 1{NonstopRoute : Others} 0.149∗∗∗ 0.137∗∗∗ 0.140∗∗∗ 0.143∗∗∗ −0.121∗ −0.050(0.018) (0.020) (0.032) (0.038) (0.073) (0.092)
1{Postmerger} × 1{NonstopRoute : USAir} 0.245∗∗∗ 0.286∗∗∗ 0.201∗∗∗ 0.248∗∗∗ −0.578∗∗∗ −0.619∗∗∗
(0.022) (0.027) (0.029) (0.037) (0.053) (0.063)
1{Postmerger} × 1{NonstopRoute : Southwest} 0.245∗∗∗ 0.264∗∗∗ 0.181∗∗∗ 0.201∗∗∗ −0.365∗∗∗ −0.391∗∗∗
(0.011) (0.012) (0.015) (0.017) (0.056) (0.059)
Balanced? N N Y Y Y Y2014-2015 Excluded? N Y N Y N YObservations 74,337 57,032 24,226 18,043 24,226 18,043R2 0.392 0.430 0.315 0.357 0.289 0.310
∗p<0.1; ∗∗p<0.05; ∗∗∗p<0.01
Note: This table shows the regression result of relevant variables when the sample is restricted to those connecting flights offered by DL orUA. The omitted reference group is Major3 nonstop routes. ‘Balanced’ indicates whether the sample includes only those connecting productssurvived in the entire sample period. ‘2014-2015 Excluded?’ is whether the sample excludes two years of data immediately following the merger.
29

Table A2: Connecting Prices and Passengers in Delta or United’s Nonstop Routes (Full RegressionResults)
Sample: all connecting flights in Delta or United’s nonstop routeslog(90th price) log(passengers)
(1) (2) (3) (4) (5) (6)
1{Postmerger} −0.063∗∗∗ −0.029∗∗∗ −0.065∗∗∗ −0.035∗∗∗ 0.352∗∗∗ 0.308∗∗∗
(0.007) (0.008) (0.010) (0.012) (0.031) (0.030)
1{Carrier : AAorUSAir} −0.104∗∗∗ −0.106∗∗∗ −0.105∗∗∗ −0.106∗∗∗ 1.166∗∗∗ 1.169∗∗∗
(0.007) (0.007) (0.012) (0.012) (0.047) (0.047)
1{Carrier : Others} −0.398∗∗∗ −0.398∗∗∗ −0.392∗∗∗ −0.392∗∗∗ 0.596∗∗∗ 0.596∗∗∗
(0.014) (0.014) (0.020) (0.020) (0.067) (0.068)
1{Carrier : Southwest} −0.310∗∗∗ −0.307∗∗∗ −0.318∗∗∗ −0.320∗∗∗ 1.007∗∗∗ 0.987∗∗∗
(0.012) (0.012) (0.017) (0.018) (0.050) (0.048)
Number of Nonstop LCCs −0.036∗∗∗ −0.042∗∗∗ −0.053∗∗∗ −0.058∗∗∗ 0.180∗∗∗ 0.189∗∗∗
(0.004) (0.003) (0.005) (0.005) (0.033) (0.032)
Number of Nonstop Carrier = 1 −0.059∗∗∗ −0.033∗∗∗ −0.062∗∗∗ −0.035∗∗∗ −0.075 −0.171∗∗∗
(0.010) (0.010) (0.011) (0.012) (0.057) (0.060)
Number of Nonstop Carrier = 2 −0.074∗∗∗ −0.058∗∗∗ −0.072∗∗∗ −0.056∗∗∗ −0.305∗∗∗ −0.376∗∗∗
(0.014) (0.014) (0.015) (0.016) (0.062) (0.069)
Number of Nonstop Carrier ≥ 3 −0.077∗∗∗ −0.068∗∗∗ −0.089∗∗∗ −0.080∗∗∗ −0.480∗∗∗ −0.496∗∗∗
(0.014) (0.015) (0.017) (0.018) (0.078) (0.081)
Distance (1,000 miles) 0.174∗∗∗ 0.181∗∗∗ 0.185∗∗∗ 0.194∗∗∗ 0.081 0.060(0.013) (0.013) (0.013) (0.012) (0.087) (0.094)
Airport Presence (Origin) 0.283∗∗∗ 0.285∗∗∗ 0.278∗∗∗ 0.292∗∗∗ 0.147 0.205∗∗
(0.021) (0.021) (0.037) (0.036) (0.103) (0.102)
Airport Presence (Destination) 0.283∗∗∗ 0.275∗∗∗ 0.305∗∗∗ 0.300∗∗∗ 0.597∗∗∗ 0.627∗∗∗
(0.027) (0.026) (0.039) (0.040) (0.110) (0.106)
1{Postmerger} × 1{Carrier : AAorUSAir} 0.066∗∗∗ 0.095∗∗∗ 0.084∗∗∗ 0.111∗∗∗ −0.446∗∗∗ −0.618∗∗∗
(0.007) (0.008) (0.012) (0.013) (0.045) (0.046)
1{Postmerger} × 1{Carrier : Others} −0.099∗∗∗ −0.159∗∗∗ −0.081∗∗∗ −0.134∗∗∗ −0.636∗∗∗ −0.685∗∗∗
(0.015) (0.017) (0.018) (0.020) (0.053) (0.061)
1{Postmerger} × 1{Carrier : Southwest} 0.081∗∗∗ 0.065∗∗∗ 0.092∗∗∗ 0.082∗∗∗ −0.400∗∗∗ −0.402∗∗∗
(0.009) (0.010) (0.014) (0.016) (0.093) (0.091)
Balanced? N N Y Y Y Y2014-2015 Excluded? N Y N Y N YObservations 77,600 60,872 44,726 35,223 44,726 35,223R2 0.420 0.452 0.410 0.445 0.361 0.370
∗p<0.1; ∗∗p<0.05; ∗∗∗p<0.01
Note: This table shows the regression result of relevant variables when the sample is restricted to those connecting flights offered by DL orUA. The omitted carrier dummy is whether DL or UA. ‘Balanced’ indicates whether the sample includes only those connecting productssurvived in the entire sample period. ‘2014-2015 Excluded?’ is whether the sample excludes two years of data immediately following themerger.
30

Tab
leA
3:C
onn
ecti
ng
Pri
ces
and
Pas
sen
gers
from
Del
taor
Un
ited
,V
aryin
gth
eD
efin
itio
nof
Con
sist
ent
Non
stop
Mon
op
oli
st
Sam
ple
:co
nnec
ting
flig
hts
off
ered
by
Del
taor
Unit
edlo
g(9
0th
pri
ce)
log(p
asse
nger
s)
(1)
(2)
(3)
(4)
(5)
(6)
(7)
(8)
(9)
(10)
(11)
(12)
1{Postmerger}
−0.0
59∗∗∗−
0.0
58∗∗∗−
0.0
41∗∗∗−
0.0
49∗∗∗−
0.0
55∗∗∗
−0.0
47∗∗∗−
0.044∗∗∗
−0.
049∗∗∗
0.3
02∗∗∗
0.27
7∗∗∗
0.2
60∗∗∗
0.2
77∗∗∗
(0.0
06)
(0.0
07)
(0.0
06)
(0.0
06)
(0.0
08)
(0.0
08)
(0.0
09)
(0.0
08)
(0.0
26)
(0.0
30)
(0.0
23)
(0.0
23)
1{N
onstopRoute
:Others}
−0.
273∗∗∗−
0.28
0∗∗∗
−0.
243∗∗∗−
0.2
83∗∗∗−
0.1
93∗∗∗
−0.2
15∗∗∗−
0.2
01∗∗∗
−0.
222∗∗∗
0.1
670.1
450.
305∗∗
0.2
11∗∗
(0.0
22)
(0.0
22)
(0.0
34)
(0.0
35)
(0.0
35)
(0.0
32)
(0.0
33)
(0.0
36)
(0.1
39)
(0.1
38)
(0.1
34)
(0.1
02)
1{N
onstopRoute
:USAir}
−0.3
02∗∗∗−
0.3
31∗∗∗−
0.2
83∗∗∗−
0.292∗∗∗−
0.2
72∗∗∗
−0.2
87∗∗∗−
0.2
20∗∗∗
−0.
247∗∗∗
0.3
88∗∗∗
0.327∗∗∗
0.4
20∗∗∗
0.4
08∗∗∗
(0.0
35)
(0.0
24)
(0.0
27)
(0.0
29)
(0.0
32)
(0.0
29)
(0.0
31)
(0.0
31)
(0.1
10)
(0.1
26)
(0.0
91)
(0.0
90)
1{N
onstopRoute
:Southwest}
−0.
323∗∗∗−
0.31
7∗∗∗
−0.
280∗∗∗−
0.3
02∗∗∗−
0.2
63∗∗∗
−0.2
71∗∗∗−
0.2
23∗∗∗
−0.
244∗∗∗
0.1
410.1
320.
146∗∗
0.131∗
(0.0
16)
(0.0
14)
(0.0
17)
(0.0
16)
(0.0
20)
(0.0
20)
(0.0
22)
(0.0
23)
(0.0
88)
(0.0
89)
(0.0
70)
(0.0
77)
Num
ber
ofN
onst
opL
CC
s0.0
01−
0.0
020.
001
0.0
04
−0.0
17∗∗
−0.0
23∗∗∗−
0.0
34∗∗∗
−0.0
35∗∗∗
0.062∗∗∗
0.0
89∗∗∗
0.0
59∗∗
0.0
75∗∗∗
(0.0
05)
(0.0
05)
(0.0
05)
(0.0
06)
(0.0
08)
(0.0
07)
(0.0
09)
(0.0
08)
(0.0
23)
(0.0
24)
(0.0
23)
(0.0
24)
Num
ber
ofN
onst
opC
arri
er=
1−
0.04
7∗∗∗−
0.04
4∗∗∗
−0.
041∗∗∗−
0.0
19∗∗∗−
0.0
49∗∗∗
−0.0
26∗∗∗−
0.0
42∗∗∗
−0.0
23∗∗∗
−0.
097∗∗
−0.
171∗∗∗
−0.
102∗∗
−0.
131∗∗∗
(0.0
08)
(0.0
07)
(0.0
11)
(0.0
07)
(0.0
10)
(0.0
09)
(0.0
16)
(0.0
09)
(0.0
43)
(0.0
37)
(0.0
42)
(0.0
34)
Num
ber
ofN
onst
opC
arri
er=
2−
0.0
24∗∗
−0.
002
−0.
055∗∗∗−
0.0
27∗∗∗−
0.0
42∗∗∗
0.0
02
−0.0
26−
0.0
21
−0.
240∗∗∗−
0.3
27∗∗∗−
0.22
5∗∗∗−
0.248∗∗∗
(0.0
10)
(0.0
09)
(0.0
14)
(0.0
10)
(0.0
14)
(0.0
17)
(0.0
23)
(0.0
15)
(0.0
53)
(0.0
48)
(0.0
60)
(0.0
55)
Num
ber
ofN
onst
opC
arri
er¿=
3−
0.02
6−
0.0
05−
0.1
11∗∗∗−
0.0
90∗∗∗
−0.0
90∗∗
−0.0
55
−0.0
65−
0.1
01∗∗
−0.1
39−
0.23
6−
0.3
40∗∗∗
0.14
2(0
.018
)(0
.018)
(0.0
25)
(0.0
33)
(0.0
35)
(0.0
41)
(0.0
46)
(0.0
47)
(0.1
12)
(0.1
56)
(0.1
29)
(0.1
18)
Dis
tance
(1,0
00m
iles
)0.
181∗∗∗
0.18
0∗∗∗
0.1
86∗∗∗
0.1
79∗∗∗
0.1
29∗∗∗
0.1
38∗∗∗
0.1
63∗∗∗
0.1
44∗∗∗
0.14
4∗∗∗
0.13
0∗∗
0.17
0∗∗∗
0.183∗∗∗
(0.0
10)
(0.0
09)
(0.0
11)
(0.0
10)
(0.0
19)
(0.0
17)
(0.0
24)
(0.0
19)
(0.0
50)
(0.0
52)
(0.0
60)
(0.0
49)
Air
por
tP
rese
nce
(Ori
gin)
0.20
3∗∗∗
0.1
67∗∗∗
0.28
5∗∗∗
0.2
34∗∗∗
0.1
80∗∗∗
0.1
75∗∗∗
0.2
66∗∗∗
0.198∗∗∗
0.1
46
0.2
06−
0.0
420.0
58(0
.023)
(0.0
23)
(0.0
20)
(0.0
21)
(0.0
37)
(0.0
44)
(0.0
54)
(0.0
34)
(0.1
38)
(0.1
43)
(0.1
15)
(0.1
26)
Air
por
tP
rese
nce
(Des
tinat
ion)
0.16
9∗∗∗
0.1
27∗∗∗
0.26
4∗∗∗
0.2
03∗∗∗
0.1
23∗∗
0.0
98∗
0.1
80∗∗
0.12
3∗∗
0.52
0∗∗∗
0.45
2∗∗
0.1
21
0.42
9∗∗∗
(0.0
39)
(0.0
37)
(0.0
33)
(0.0
41)
(0.0
56)
(0.0
59)
(0.0
82)
(0.0
54)
(0.1
53)
(0.1
85)
(0.1
86)
(0.1
37)
1{Postmerger}×1{N
onstopRoute
:Others}
0.13
8∗∗∗
0.12
7∗∗∗
0.10
9∗∗∗
0.1
53∗∗∗
0.1
29∗∗∗
0.1
16∗∗∗
0.0
96∗∗∗
0.1
55∗∗∗
−0.
196∗∗∗
−0.
173∗∗
−0.0
24
−0.
177∗∗
(0.0
17)
(0.0
17)
(0.0
19)
(0.0
20)
(0.0
24)
(0.0
22)
(0.0
29)
(0.0
26)
(0.0
70)
(0.0
74)
(0.1
01)
(0.0
84)
1{Postmerger}×1{N
onstopRoute
:USAir}
0.25
6∗∗∗
0.26
8∗∗∗
0.24
3∗∗∗
0.2
52∗∗∗
0.2
15∗∗∗
0.2
20∗∗∗
0.1
81∗∗∗
0.1
97∗∗∗
−0.
628∗∗∗
−0.
618∗∗∗−
0.5
33∗∗∗
−0.
575∗∗∗
(0.0
23)
(0.0
18)
(0.0
21)
(0.0
21)
(0.0
29)
(0.0
27)
(0.0
28)
(0.0
29)
(0.0
49)
(0.0
49)
(0.0
52)
(0.0
48)
1{Postmerger}×1{N
onstopRoute
:Southwest}
0.2
55∗∗∗
0.2
53∗∗∗
0.2
29∗∗∗
0.2
36∗∗∗
0.1
78∗∗∗
0.1
85∗∗∗
0.1
71∗∗∗
0.1
69∗∗∗
−0.
373∗∗∗
−0.
384∗∗∗−
0.3
29∗∗∗−
0.337∗∗∗
(0.0
09)
(0.0
10)
(0.0
11)
(0.0
11)
(0.0
14)
(0.0
14)
(0.0
15)
(0.0
16)
(0.0
49)
(0.0
48)
(0.0
59)
(0.0
57)
Bal
ance
d?
NN
NN
YY
YY
YY
YY
2014
-201
5E
xcl
uded
?N
NN
NN
NN
NN
NN
NM
inim
um
Num
ber
ofQ
uar
ters
toB
ea
Non
stop
Mon
opol
ist?
84
128
84
12
88
412
8M
inim
um
Dai
lyF
ligh
tsto
Be
aN
onst
opM
onop
olis
t?1
12
21
12
21
12
2O
bse
rvat
ions
81,4
28
83,
619
62,
167
68,4
94
26,9
24
28,1
79
21,0
19
22,
666
26,
924
28,1
7921
,019
22,
666
R2
0.3
930.
406
0.3
82
0.3
80
0.3
07
0.3
29
0.3
14
0.31
30.
295
0.31
10.
282
0.29
9
∗ p<
0.1;∗∗
p<
0.05
;∗∗∗ p<
0.0
1
Note
:T
his
tab
lesh
ows
the
regr
essi
onre
sult
ofre
leva
nt
vari
ab
les
wh
enth
esa
mp
leis
rest
rict
edto
those
con
nec
tin
gfl
ights
off
ered
byDL
orUA
.T
he
om
itte
dre
fere
nce
grou
pisMajor3
non
stop
rou
tes.
‘Bal
ance
d’
ind
icate
sw
het
her
the
sam
ple
incl
ud
eson
lyth
ose
con
nec
tin
gp
rod
uct
ssu
rviv
edin
the
enti
resa
mp
lep
erio
d.
‘2014
-201
5E
xcl
ud
ed?’
isw
het
her
the
sam
ple
excl
ud
estw
oye
ars
of
data
imm
edia
tely
foll
owin
gth
em
erge
r.‘M
inim
um
Nu
mb
erof
Qu
arte
rsto
Be
aN
onst
opM
onop
-ol
ist?
’re
fers
toth
em
inim
um
nu
mb
erof
pre
mer
ger
quar
ters
requ
ired
for
aca
rrie
rto
be
aco
nsi
sten
tn
on
stop
mon
op
oli
st.
‘Min
imu
mD
ail
yF
lights
toB
ea
Non
stop
Mon
op
oli
st?’
refe
rsto
the
min
imu
mnu
mb
erof
dai
lyn
onst
opfl
ights
that
aca
rrie
rsh
ould
off
erto
be
aco
nsi
sten
tn
on
stop
mon
opol
ist.
31
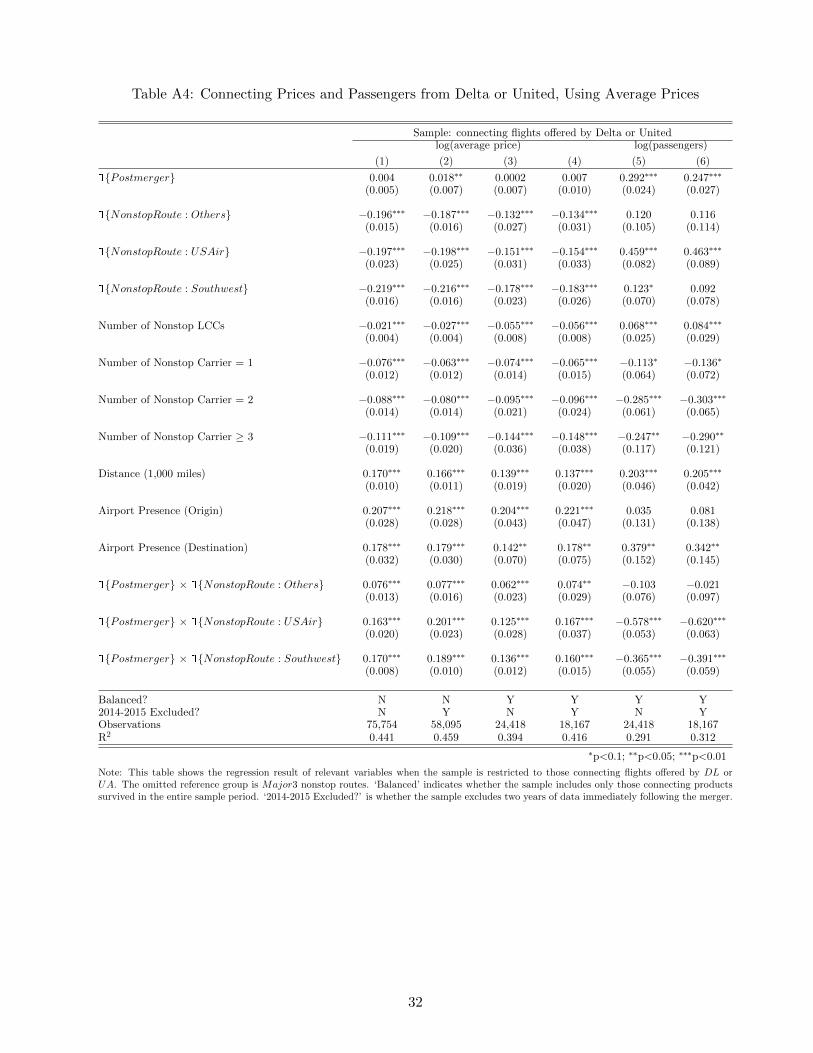
Table A4: Connecting Prices and Passengers from Delta or United, Using Average Prices
Sample: connecting flights offered by Delta or Unitedlog(average price) log(passengers)
(1) (2) (3) (4) (5) (6)
1{Postmerger} 0.004 0.018∗∗ 0.0002 0.007 0.292∗∗∗ 0.247∗∗∗
(0.005) (0.007) (0.007) (0.010) (0.024) (0.027)
1{NonstopRoute : Others} −0.196∗∗∗ −0.187∗∗∗ −0.132∗∗∗ −0.134∗∗∗ 0.120 0.116(0.015) (0.016) (0.027) (0.031) (0.105) (0.114)
1{NonstopRoute : USAir} −0.197∗∗∗ −0.198∗∗∗ −0.151∗∗∗ −0.154∗∗∗ 0.459∗∗∗ 0.463∗∗∗
(0.023) (0.025) (0.031) (0.033) (0.082) (0.089)
1{NonstopRoute : Southwest} −0.219∗∗∗ −0.216∗∗∗ −0.178∗∗∗ −0.183∗∗∗ 0.123∗ 0.092(0.016) (0.016) (0.023) (0.026) (0.070) (0.078)
Number of Nonstop LCCs −0.021∗∗∗ −0.027∗∗∗ −0.055∗∗∗ −0.056∗∗∗ 0.068∗∗∗ 0.084∗∗∗
(0.004) (0.004) (0.008) (0.008) (0.025) (0.029)
Number of Nonstop Carrier = 1 −0.076∗∗∗ −0.063∗∗∗ −0.074∗∗∗ −0.065∗∗∗ −0.113∗ −0.136∗
(0.012) (0.012) (0.014) (0.015) (0.064) (0.072)
Number of Nonstop Carrier = 2 −0.088∗∗∗ −0.080∗∗∗ −0.095∗∗∗ −0.096∗∗∗ −0.285∗∗∗ −0.303∗∗∗
(0.014) (0.014) (0.021) (0.024) (0.061) (0.065)
Number of Nonstop Carrier ≥ 3 −0.111∗∗∗ −0.109∗∗∗ −0.144∗∗∗ −0.148∗∗∗ −0.247∗∗ −0.290∗∗
(0.019) (0.020) (0.036) (0.038) (0.117) (0.121)
Distance (1,000 miles) 0.170∗∗∗ 0.166∗∗∗ 0.139∗∗∗ 0.137∗∗∗ 0.203∗∗∗ 0.205∗∗∗
(0.010) (0.011) (0.019) (0.020) (0.046) (0.042)
Airport Presence (Origin) 0.207∗∗∗ 0.218∗∗∗ 0.204∗∗∗ 0.221∗∗∗ 0.035 0.081(0.028) (0.028) (0.043) (0.047) (0.131) (0.138)
Airport Presence (Destination) 0.178∗∗∗ 0.179∗∗∗ 0.142∗∗ 0.178∗∗ 0.379∗∗ 0.342∗∗
(0.032) (0.030) (0.070) (0.075) (0.152) (0.145)
1{Postmerger} × 1{NonstopRoute : Others} 0.076∗∗∗ 0.077∗∗∗ 0.062∗∗∗ 0.074∗∗ −0.103 −0.021(0.013) (0.016) (0.023) (0.029) (0.076) (0.097)
1{Postmerger} × 1{NonstopRoute : USAir} 0.163∗∗∗ 0.201∗∗∗ 0.125∗∗∗ 0.167∗∗∗ −0.578∗∗∗ −0.620∗∗∗
(0.020) (0.023) (0.028) (0.037) (0.053) (0.063)
1{Postmerger} × 1{NonstopRoute : Southwest} 0.170∗∗∗ 0.189∗∗∗ 0.136∗∗∗ 0.160∗∗∗ −0.365∗∗∗ −0.391∗∗∗
(0.008) (0.010) (0.012) (0.015) (0.055) (0.059)
Balanced? N N Y Y Y Y2014-2015 Excluded? N Y N Y N YObservations 75,754 58,095 24,418 18,167 24,418 18,167R2 0.441 0.459 0.394 0.416 0.291 0.312
∗p<0.1; ∗∗p<0.05; ∗∗∗p<0.01
Note: This table shows the regression result of relevant variables when the sample is restricted to those connecting flights offered by DL orUA. The omitted reference group is Major3 nonstop routes. ‘Balanced’ indicates whether the sample includes only those connecting productssurvived in the entire sample period. ‘2014-2015 Excluded?’ is whether the sample excludes two years of data immediately following the merger.
32

B Cost Asymmetry in Airline Industry
Different carriers are likely to have different cost structures, depending on their operation type (whether
it is nonstop or connecting flight) or carrier type (whether it is a legacy or maverick carrier). Given
that three markets are identical in terms of operation, e.g., the routes in three markets have the same
distance and airport taxes, operating in any market results in no difference in terms of operation costs,
and the only cost difference comes from company-wise efficiency and types of services (i.e., nonstop or
connecting).
We assume that USAir has company-specific cost advantages, compared to rivals, when providing
connecting services in markets 1 and 3, which allows the company to offer such competitive fares: as
stated in Olley and Town (2018), USAir had a competitive cost structure compared to the rivals. For
example, given that USAir and AA serve connecting services in m = 1, we assume that cUSAir1 ≤
cAA1 ≡ c where cUSAir1 denotes USAir’s marginal cost and cAA1 is AA’s marginal cost in m = 1.
Note that c − cUSAir1 represents the cost efficiency of the maverick airline compared to other legacy
carriers when providing the same connecting services.
Additionally, the marginal cost of nonstop service is different from that of connecting service:
DL’s marginal cost when providing direct service in m = 1 is denoted as cDL1, which is lower than the
cost for any connecting flights. This assumes that fuel costs are sufficiently high, such that offering
connecting services, which consumes more fuels than short direct services, incurs higher marginal costs.
For m = 2, we assume that AA and DL, which serve connecting services, incur the same marginal
costs, i.e., cDL2 = cAA2 ≡ c. Furthermore, the cost for USAir when providing direct service in m = 2
is cUSAir2, where cUSAir2 ≥ cDL1. That is, USAir that offers nonstop service in market 2 incurs a
higher cost than DL that conceptually offers the same service in market 1. This asymmetric cost
structure captures the fact that USAir is disadvantaged when offering direct routes due to its less
profitable hubs with low traffic volumes compared to DL offering direct service in a different market:
less profitability is represented by higher cost incurred in our framework. In this sense, market 2
represents the cities of former USAir’ hubs, such as Charlotte, whereas market 1 represents the cities
of DL’s hubs, such as LaGuardia in New York City. However, such a market-specific difference does
not necessarily mean that other legacy carriers offering connecting services in market 2 with low traffic
suffer from less revenues. Given that those connecting airlines have one or more stops between the
origin and destination cities in market 2, their revenue sources are not limited to cities with low traffic.
Thus, we assume that the marginal costs for connecting services provided by legacy carriers, DL and
AA, are symmetric as cAA1 = cAA2 = cDL2 ≡ c.
33

In m = 3, DL and USAir are connecting carriers (with cUSAir2 ≤ cDL3 ≡ c), whereas AA is a
nonstop carrier (with cAA3 ≤ cUSAir2). That is, even in market 3, USAir has a comparative advantage
relative to DL in providing connecting services. In summary, the cost structure that we consider is
given as follows.
Assumption 1. Offering direct flights is less costly than offering connecting flights. Among nonstop
carriers, maverick USAir’s cost when offering nonstop service is higher than that for legacy carriers.
Among connecting carriers, maverick USAir’s cost when offering connecting services is lower than
that for legacy carriers. That is,
cDL1 = cAA3 ≤ cUSAir2︸ ︷︷ ︸Nonstop
≤ cUSAir1 = cUSAir3 ≤ cAA1 = cAA2 = cDL2 = cDL3 ≡ c︸ ︷︷ ︸Connecting
.
Any postmerger changes in pricing strategies, which lead to soft competition, can be partly driven
by either cost-related efficiency gains from the merger. Given that AA’s hubs have more traffic, the
merger results in more profitable business when offering nonstop services. To capture such gains from
the merger, which alters the merged entity’s optimal behaviors accordingly, we assume that USAir’s
postmerger marginal cost when offering nonstop service in m = 2 is lower than its premerger cost.
Specifically, we assume that cMDL1 = cMAA3 = cMUSAir2 ≤ cMUSAir1 ≤ cMAA1 = cMAA2 = cMDL2 = cMDL3 ≡ c,
where M denotes the case of postmerger, which implies that the integrated firm enjoys cost advantages
in m = 2 when offering direct routes: for simplicity, we assume that cDL1 = cMDL1 and cAA3 = cMAA3.
The cost efficiency-enhancing effects of mergers make USAir a nonstop flight and other connecting
flights more differentiated: as USAir’s cost from offering nonstop service decreases, it can provide
high-quality nonstop service at a lower price. Then, USAir’s quality per price improves, which results
in less fierce price competition with other connecting legacy carriers. The competition-reducing effects
arising from the changes in cost efficiency are better captured as θjk approaches zero.
Here, we extend our main specification as in Equation (5), which considers the conduct pa-
rameter θ, by additionally taking into account cost asymmetry across carriers. That is, each air-
line j chooses pjm by solving maxpjm∑
m∈M πjm + θjk × 1j,k∈L∑
m∈M,j 6=k πkm. Postmerger, airline
k ∈ {AA,USAir} chooses pkm by solving maxpkm∑
k∈{AA,USAir}∑3
m=1 πkm+θ∑3
m=1 πDLm, whereas
DL solves maxpDLm
∑3m=1 πDLm + θ
∑k∈{AA,USAir}
∑3m=1 πkm.
B.1 Connecting Flights Offered by DL
As depicted in the left panel of Figure 7, premerger, DL as a connecting carrier sets relatively higher
fare to nonstop legacy monopolist AA (in m = 3) than to nonstop maverick monopolist USAir (in
m = 2).
34
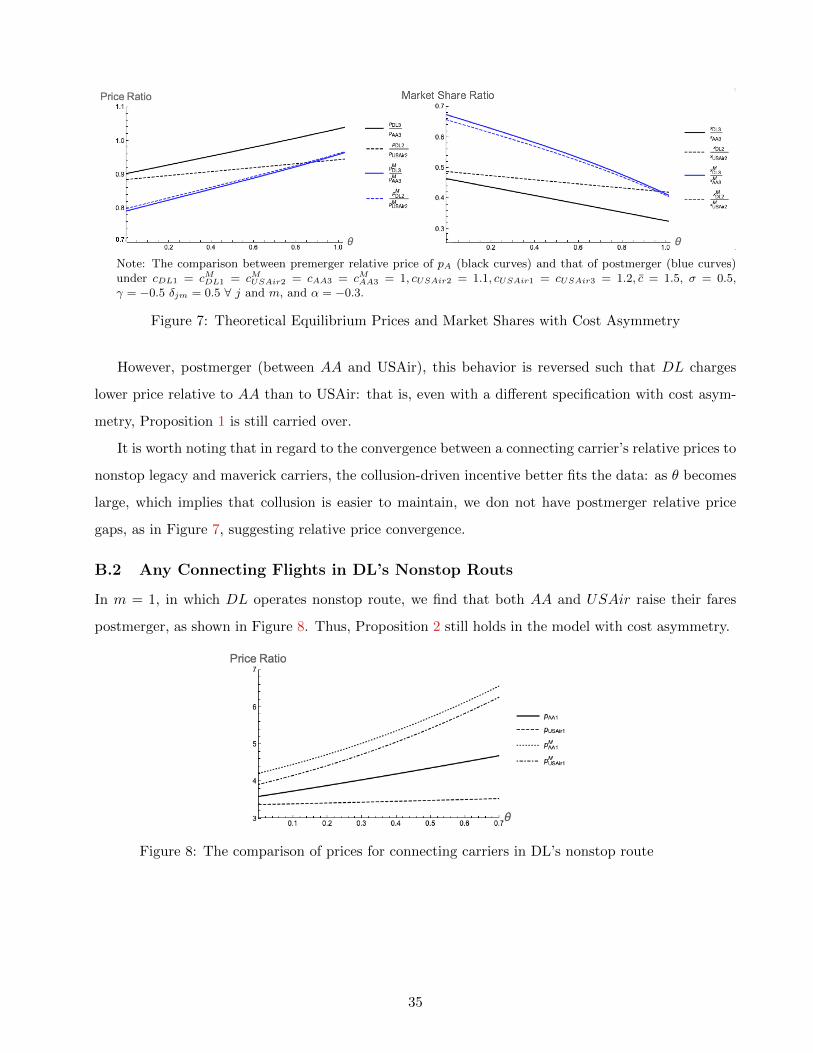
Note: The comparison between premerger relative price of pA (black curves) and that of postmerger (blue curves)under cDL1 = cMDL1 = cMUSAir2 = cAA3 = cMAA3 = 1, cUSAir2 = 1.1, cUSAir1 = cUSAir3 = 1.2, c = 1.5, σ = 0.5,γ = −0.5 δjm = 0.5 ∀ j and m, and α = −0.3.
Figure 7: Theoretical Equilibrium Prices and Market Shares with Cost Asymmetry
However, postmerger (between AA and USAir), this behavior is reversed such that DL charges
lower price relative to AA than to USAir: that is, even with a different specification with cost asym-
metry, Proposition 1 is still carried over.
It is worth noting that in regard to the convergence between a connecting carrier’s relative prices to
nonstop legacy and maverick carriers, the collusion-driven incentive better fits the data: as θ becomes
large, which implies that collusion is easier to maintain, we don not have postmerger relative price
gaps, as in Figure 7, suggesting relative price convergence.
B.2 Any Connecting Flights in DL’s Nonstop Routs
In m = 1, in which DL operates nonstop route, we find that both AA and USAir raise their fares
postmerger, as shown in Figure 8. Thus, Proposition 2 still holds in the model with cost asymmetry.
Figure 8: The comparison of prices for connecting carriers in DL’s nonstop route
35
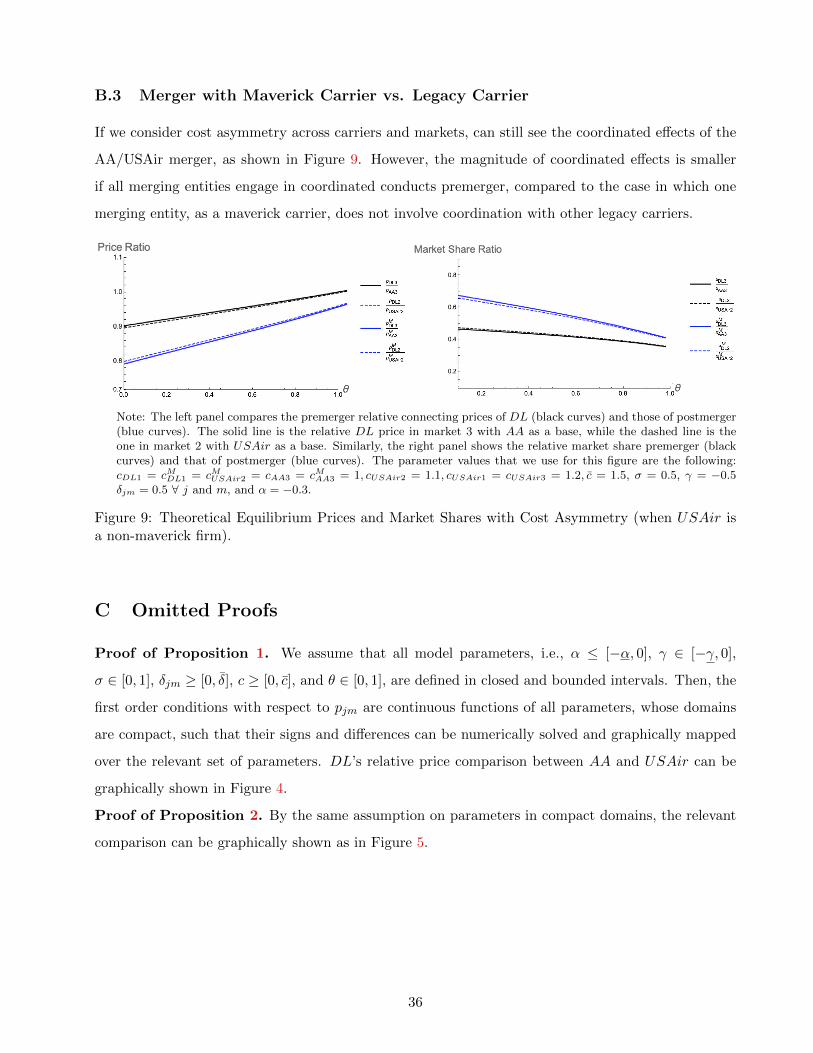
B.3 Merger with Maverick Carrier vs. Legacy Carrier
If we consider cost asymmetry across carriers and markets, can still see the coordinated effects of the
AA/USAir merger, as shown in Figure 9. However, the magnitude of coordinated effects is smaller
if all merging entities engage in coordinated conducts premerger, compared to the case in which one
merging entity, as a maverick carrier, does not involve coordination with other legacy carriers.
Note: The left panel compares the premerger relative connecting prices of DL (black curves) and those of postmerger(blue curves). The solid line is the relative DL price in market 3 with AA as a base, while the dashed line is theone in market 2 with USAir as a base. Similarly, the right panel shows the relative market share premerger (blackcurves) and that of postmerger (blue curves). The parameter values that we use for this figure are the following:cDL1 = cMDL1 = cMUSAir2 = cAA3 = cMAA3 = 1, cUSAir2 = 1.1, cUSAir1 = cUSAir3 = 1.2, c = 1.5, σ = 0.5, γ = −0.5δjm = 0.5 ∀ j and m, and α = −0.3.
Figure 9: Theoretical Equilibrium Prices and Market Shares with Cost Asymmetry (when USAir isa non-maverick firm).
C Omitted Proofs
Proof of Proposition 1. We assume that all model parameters, i.e., α ≤ [−α, 0], γ ∈ [−γ, 0],
σ ∈ [0, 1], δjm ≥ [0, δ], c ≥ [0, c], and θ ∈ [0, 1], are defined in closed and bounded intervals. Then, the
first order conditions with respect to pjm are continuous functions of all parameters, whose domains
are compact, such that their signs and differences can be numerically solved and graphically mapped
over the relevant set of parameters. DL’s relative price comparison between AA and USAir can be
graphically shown in Figure 4.
Proof of Proposition 2. By the same assumption on parameters in compact domains, the relevant
comparison can be graphically shown as in Figure 5.
36