Shands Teaching Hospital and Clinics, Inc. and ...
62
Shands Teaching Hospital and Clinics, Inc. and Subsidiaries Consolidated Basic Financial Statements, Required Supplementary Information and Supplemental Consolidating Information June 30, 2019 and 2018
Transcript of Shands Teaching Hospital and Clinics, Inc. and ...

Shands Teaching Hospital and Clinics, Inc. and Subsidiaries Consolidated Basic Financial Statements, Required Supplementary Information and Supplemental Consolidating Information June 30, 2019 and 2018

Shands Teaching Hospital and Clinics, Inc. and Subsidiaries Index June 30, 2019 and 2018
Page(s)
Management’s Discussion and Analysis (Unaudited) ............................................................................. 1-12
Report of Independent Auditors ........................................................................................................ 13-14
Consolidated Basic Financial Statements
Consolidated Basic Statements of Net Position......................................................................................... 15
Consolidated Basic Statements of Revenues, Expenses and Changes in Net Position ........................... 16
Consolidated Basic Statements of Cash Flows .................................................................................... 17-18
Notes to Consolidated Basic Financial Statements .............................................................................. 19-53
Required Supplementary Information
Schedule of Changes in the Net Pension (Asset) Liability and Related Ratios (Unaudited) ..................... 54
Schedule of Employer Contributions (Unaudited) ...................................................................................... 55
Supplemental Consolidating Information
Consolidating Basic Statements of Net Position ................................................................................... 56-57
Consolidating Basic Statements of Revenues, Expenses and Changes in Net Position ..................... 58-59
Notes to Supplemental Consolidating Information .................................................................................... .60

Shands Teaching Hospital and Clinics, Inc. and Subsidiaries Management’s Discussion and Analysis (Unaudited) June 30, 2019 and 2018
1
Introduction
This section of the Shands Teaching Hospital and Clinics, Inc. and Subsidiaries’ (“Shands”) annual financial report presents Shands’ analysis of its financial performance as of and for the year ended June 30, 2019 with comparative information as of and for the years ended June 30, 2018 and 2017. This discussion has been prepared by management and should be read in conjunction with the consolidated basic financial statements and related note disclosures.
Organization
Shands is an affiliate of the University of Florida (“UF”) where, by statute, the President of UF has the authority to appoint and remove a majority of the members of the Shands Board of Directors. In addition, there is a significant presence of both UF Board of Trustees and senior management personnel on the Shands Board. Governance oversight protocols closely align UF and Shands on material Shands transactional and budgetary decisions.
Shands controls or owns various affiliated entities that operate facilities and provide services as part of Shands. Shands and certain of its affiliated entities, along with the UF Health Science Center, operate under names beginning with “UF Health.” The following identifies the significant component operating units and affiliates of Shands and their respective primary operations:
UF Health Shands Hospital is part of a major academic medical center located in Gainesville, Florida, and is licensed to operate a 1,014-bed acute care hospital. UF Health Shands Hospital is a leading referral center in the State of Florida and provides clinical settings for medical education and training programs at UF.
UF Health Shands Psychiatric Hospital is a psychiatric and substance abuse facility located in Gainesville, Florida, licensed to operate 81 beds, of which 63 are psychiatric and 18 are substance abuse.
UF Health Shands Rehab Hospital is a 40-bed rehabilitation hospital located in Gainesville, Florida. Refer to “Archer Rehab Joint Venture” on page 11 for sale of UF Health Shands Rehab Hospital.
UF Health Shands HomeCare is a hospital-based home care agency providing home care services to residents of north central Florida.
Shands Recovery, LLC (d/b/a “UF Health Florida Recovery Center”) provides outpatient and residential treatment for alcohol and drug abuse, with on-site leased housing for certain programs. Shands is the sole corporate member of UF Health Florida Recovery Center.
Elder Care of Alachua County, Inc. (“Elder Care”) is a Florida not-for-profit corporation providing social and health care related services to the elderly in Alachua County, Florida. Shands is the sole corporate member of Elder Care.
Southeastern Healthcare Foundation, Inc. (“Southeastern”) is a Florida not-for-profit corporation providing charitable aid to UF and Shands. Shands is the sole corporate member of Southeastern.
Joint Ventures: Shands has a 40% minority interest in Lake Shore HMA, LLC, Starke HMA, LLC, and Live Oak HMA, LLC which own or lease three rural community hospitals - Shands Lake Shore located in Lake City, Florida; Shands Starke located in Starke, Florida; and Shands Live Oak located in Live Oak, Florida (the “Rural Hospitals”). Community Health Systems, Inc. (“CHS”) is the majority partner and

Shands Teaching Hospital and Clinics, Inc. and Subsidiaries Management’s Discussion and Analysis (Unaudited) June 30, 2019 and 2018
2
manages the operations of the Rural Hospitals. Shands has a 5% minority interest in Munroe HMA Holdings, LLC (“Munroe”), which previously owned a regional medical center located in Ocala, Florida. CHS is the majority partner (see “CHS Joint Ventures” on page 10).
Shands has a 49.9% minority interest in Shands/Solantic Joint Venture, LLC (d/b/a “CareSpot”), which owns walk-in urgent care centers in north central Florida. Solantic of Orlando, LLC (“Solantic”), owns the remaining 50.1% majority interest and manages the facilities. Prior to September 1, 2018, CareSpot operated three urgent care centers exclusively in Gainesville, Florida. On September 1, 2018, CareSpot acquired a fourth urgent care center located in Ocala, Florida, from Solantic.
Prior to December 11, 2018, Shands and the University of Florida Development Corporation (“UFDC”) were members in Innovation Square, LLC (“Innovation Square”), a planned mixed-use research neighborhood that advances the national and global profile of UF with Shands and the local biotech industry. Shands’ interest in Innovation Square resulted from assets transferred to Innovation Square, net of amounts received from UFDC. On December 11, 2018, Shands sold its interest in Innovation Square to UFDC for an amount equal to its membership value, to be paid over time based on an agreed upon formula.
Shands has a 49% minority interest in Select Specialty Hospital – Gainesville, LLC (“SSH”). Select Specialty Hospitals, Inc. (“Select”), an affiliate of Select Medical Corporation (“SMC”), owns the remaining 51% majority interest. Prior to August 14, 2018, SSH owned and operated a 44-bed long-term acute care hospital (“LTACH”) in a stand-alone facility it leased from an affiliate of Select. On August 14, 2018, the operations of the LTACH were relocated to a 48-bed unit within Shands’ primary hospital facility which SSH leases from Shands. Select Unit Management, Inc., a wholly owned subsidiary of SMC, provides management services to SSH.
Prior to March 5, 2019, Shands owned and operated UF Health Shands Rehab Hospital (“Rehab Hospital”), a 40-bed rehabilitation hospital located in Gainesville, Florida. On March 5, 2019, Shands sold a 51% undivided interest in certain Rehab Hospital assets to Select. Also on March 5, 2019, Shands and Select contributed cash and their respective interests in Rehab Hospital assets to Archer Rehabilitation, LLC (“Archer Rehab”) in exchange for respective interests in Archer Rehab (51% Select and 49% Shands). Concurrent with the sale of the Rehab Hospital assets and subsequent joint venture investment in Archer Rehab, the rehabilitation hospital operations were relocated to a 50-bed facility approximately one mile from Shands’ main hospital campus (see “Archer Rehab Joint Venture” on page 11).
Shands has a 50% interest in UF Health South Central, LLC (“South Central”). Florida Clinical Practice Association, Inc. (“FCPA”), a component unit of UF, owns the remaining 50% interest. South Central owns property in Marion County, Florida, consisting of two medical office buildings, two vacant lots, and certain medical equipment. South Central leases the medical office buildings and equipment to FCPA, which operates various clinical practices therein.
Required Financial Statements
The required statements are the consolidated basic statements of net position, the consolidated basic statements of revenues, expenses and changes in net position and the consolidated basic statements of cash flows. These statements offer short and long-term financial information about Shands’ activities.
The consolidated basic statements of net position reflect all of Shands’ assets, liabilities, deferred inflows and outflows and provide information about the nature and amounts of investments in resources (assets) and the obligations to creditors (liabilities). Assets, liabilities and deferred activity are presented in a
Shands Teaching Hospital and Clinics, Inc. and Subsidiaries Management’s Discussion and Analysis (Unaudited) June 30, 2019 and 2018
3
classified format, which distinguishes between their current and long-term time frame. The difference between the assets plus deferred outflows and liabilities plus deferred inflows is reported as “net position.”
The consolidated basic statements of revenues, expenses and changes in net position present the change in net position resulting from revenues earned and expenses incurred. All changes in net position are reported as revenues are earned and expenses are incurred, regardless of the timing of related cash flows.
The consolidated basic statements of cash flows report cash receipts, cash payments, and net changes in cash resulting from operating, financing (capital and non-capital), and investing activities. The purpose of the statements is to reflect the key sources and uses of cash during the reporting period.
Financial Analysis of Shands
Statements of Net Position
The consolidated basic statements of net position present the financial position of Shands as of June 30, 2019, 2018 and 2017 and include all assets, liabilities and deferred inflows and outflows. Net position is one indicator of the current financial condition of Shands. Changes in net position are an indicator of whether the overall financial condition of the organization has improved or worsened over a period of time. They also provide the basis for evaluating the capital structure, as well as assessing the liquidity and financial flexibility of Shands. However, the financial statement user should consider other nonfinancial factors, such as changes in economic conditions, population change, regulations, and government legislation affecting the health care industry, among other factors.
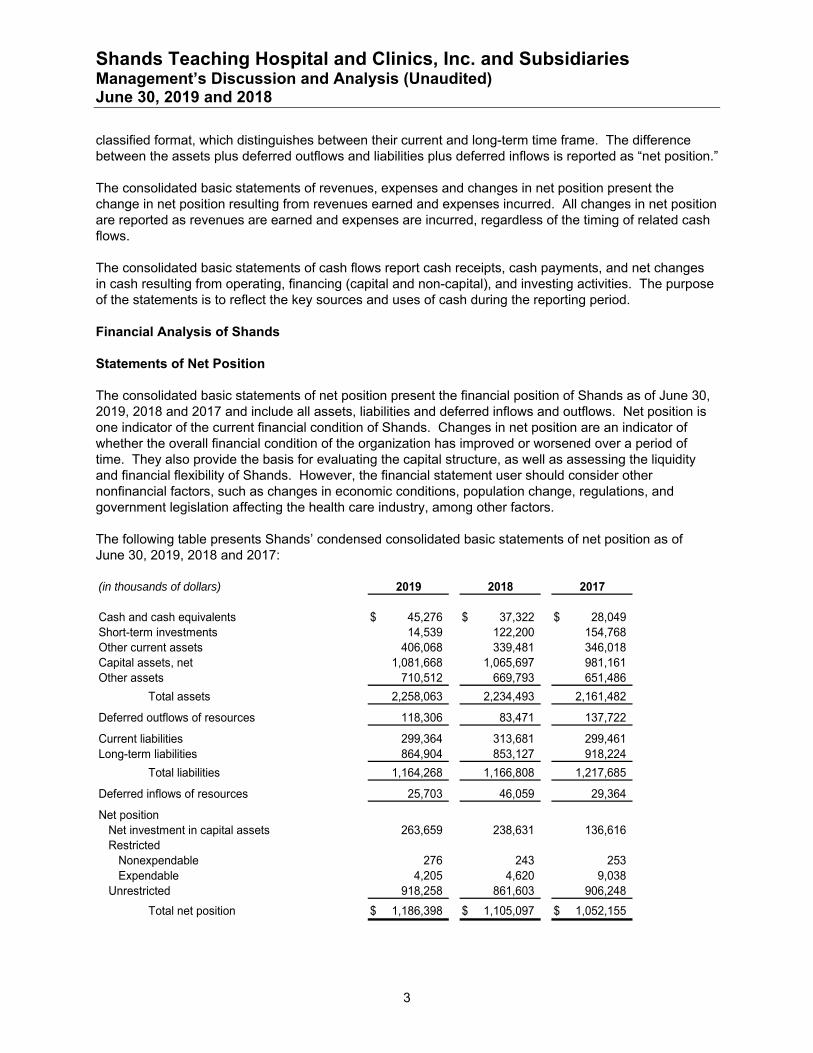
The following table presents Shands’ condensed consolidated basic statements of net position as of June 30, 2019, 2018 and 2017:
(in thousands of dollars) 2019 2018 2017
Cash and cash equivalents 45,276$ 37,322$ 28,049$ Short-term investments 14,539 122,200 154,768Other current assets 406,068 339,481 346,018Capital assets, net 1,081,668 1,065,697 981,161Other assets 710,512 669,793 651,486
Total assets 2,258,063 2,234,493 2,161,482
Deferred outflows of resources 118,306 83,471 137,722
Current liabilities 299,364 313,681 299,461Long-term liabilities 864,904 853,127 918,224
Total liabilities 1,164,268 1,166,808 1,217,685
Deferred inflows of resources 25,703 46,059 29,364
Net positionNet investment in capital assets 263,659 238,631 136,616Restricted
Nonexpendable 276 243 253Expendable 4,205 4,620 9,038
Unrestricted 918,258 861,603 906,248
Total net position 1,186,398$ 1,105,097$ 1,052,155$

Shands Teaching Hospital and Clinics, Inc. and Subsidiaries Management’s Discussion and Analysis (Unaudited) June 30, 2019 and 2018
4
Assets and Deferred Outflows of Resources
In 2019, cash and cash equivalents increased by $8.0 million, or 21.3%. Cash provided by operating activities was $115.1 million. Other significant sources of cash included $109.3 million from the sale (net of purchases) of short-term investments, assets whose use is limited, and assets whose use is restricted, $9.8 million of donations and pledge receipts, $5.7 million of capital contributions, receipt of $4.3 million in distributions from joint venture investments, and $2.4 million in investment income received. Significant cash uses included $69.6 million in support of UF and its health science colleges, capital spending of $99.5 million, principal and interest payments of $47.1 million on outstanding debt and capital lease obligations, $7.3 million in posting of collateral (net of receipts) held as security for certain interest rate swap contracts, and $7.6 million in investments in the CareSpot and Archer Rehab joint ventures. Short-term investments decreased by $107.7 million, or 88.1%, due in part to the transfer of short-term investments to assets whose use is limited which are designated by the Board of Directors to support future strategic capital projects, and to support the cash flow needs of the organization. In 2018, cash and cash equivalents increased by $9.3 million, or 33.1%. Cash provided by operating activities was $181.6 million. Other significant sources of cash included $57.4 million from the sale (net of purchases) of short-term investments, assets whose use is limited, and assets whose use is restricted, $15.9 million from the receipt of collateral (net of postings) held as security for certain interest rate swap contracts, $11.1 million of donations and pledge receipts, $10.5 million of capital contributions, $2.9 million in investment income received, and the receipt of $1.4 million in distributions from joint venture investments. Significant cash uses included $68.1 million in support of UF and its health science colleges, capital spending of $153.2 million, and principal and interest payments of $49.4 million on outstanding debt and capital lease obligations. Short-term investments decreased by $32.6 million, or 21.0%, due in part to the net sale of short-term investments to support the completion of the new UF Health Heart and Vascular and Neuromedicine Hospitals, which opened in December 2017 (see “New Hospitals Project” on page 12).
Other current assets, including net patient accounts receivable, inventories, and prepaid expenses and other current assets, and assets whose use is limited, current portion increased in 2019 by $66.6 million, or 19.6%. Patient accounts receivable, net increased by $16.8 million (7.5%) due to an increase in net patient service revenue (7.1%). Inventory balances increased by $14.3 million due to inventory price inflation and increased inventory stock requirements to support increased volumes and expanded supply locations within the new hospitals. Prepaid expenses and other current assets increased by $42.3 million primarily due to the timing of the receipt of State of Florida graduate medical education and low income pool funds, as well as the timing of payments made on prepaid contracts and payments received on non-patient accounts receivable. Shands received $41.5 million from the State of Florida in July 2019 related to fiscal year 2019 graduate medical education and low income pool funding. In 2018, Shands received these funds prior to the end of the fiscal year. Assets whose use is limited, current portion decreased by $6.8 million due to a decrease in funds required to pay retainage and construction accounts payable and current debt service requirements. In 2018, other current assets, including net patient accounts receivable, inventories, and prepaid expenses and other current assets, and assets whose use is limited, current portion decreased by $6.5 million, or 1.9%. Patient accounts receivable, net decreased by $17.4 million due to certain revenue cycle process improvements implemented by management, resulting in a decrease in the average time to collect on patient accounts, and increased collections. Inventory balances increased by $5.1 million due to the inventory stock requirements of the new hospitals. Prepaid expenses and other current assets increased by $11.3 million due to the timing of payments made on prepaid contracts and payments received on non-patient accounts receivable. Assets whose use is limited, current portion decreased by $5.6 million due to a decrease in funds required to pay retainage and construction accounts payable and current debt service requirements.

Shands Teaching Hospital and Clinics, Inc. and Subsidiaries Management’s Discussion and Analysis (Unaudited) June 30, 2019 and 2018
5
Capital assets, net increased in 2019 by $16.0 million, or 1.5%, reflecting spending of $99.5 million and a $5.9 million capital lease addition, partially offset by a decrease of $5.9 million in retainage and construction payables and depreciation expense of $84.1 million. In 2018, capital assets, net increased by $84.5 million, or 8.6%, reflecting spending of $153.2 million, which included $110.6 million in construction costs for the new hospitals. Other significant capital activity included $5.7 million in capitalized interest, partially offset by a decrease of $2.9 million in retainage and construction payables and depreciation expense of $71.5 million.
In 2019, other assets increased by $40.7 million, or 6.1%, primarily due to an increase of $43.9 million in assets whose use is limited, less current portion and an increase in assets whose use is restricted of $12.0 million, partially offset by a decrease in other assets by $15.2 million. The increase in assets whose use is limited, less current portion is primarily due to the transfer of short-term investments to support future strategic capital projects. The increase in assets whose use is restricted is primarily due to an increase in collateral held as security for certain interest rate swaps. The decrease in other assets is due to a $24.4 million decrease in the pension asset associated with the defined benefit (“DB”) pension plan and a $3.6 million decrease in investments in joint ventures, partially offset by a $4.4 million increase in long-term receivables, a $4.0 million increase in fair value of total return swaps, a $3.3 million increase in plan assets of a non-qualified retirement plan, and a $2.1 million increase in amounts due from Shands’ self-insured employee health plan – GatorCare Health Management Corporation (“GCHMC”). The decrease in investments in joint ventures is primarily due to the sale of Shands’ $8.2 million membership interest in Innovation Square and a $3.3 million impairment loss recognized on Shands’ investment in Munroe (see “CHS Joint Ventures” on page 10), partially offset by a $7.3 million investment in Archer Rehab (see “Archer Rehab Joint Venture” on page 11). The increase in long-term receivables is due to the sale of Shands’ membership interest in Innovation Square. In 2018, other assets increased by $18.3 million, or 2.8%, primarily due to an increase of $32.4 million in other assets, partially offset by a decrease in assets whose use is restricted of $11.7 million and a decrease in assets whose use is limited, less current portion of $2.4 million. The increase in other assets is primarily due to an increase of $47.5 million in the pension asset associated with the DB pension plan, partially offset by a $9.2 million decrease in investments in joint ventures, a $6.3 million decrease in amounts due from GCHMC, and a $3.0 million decrease in goodwill. The decrease in investments in joint ventures is primarily due to the recognition of distributions of $4.7 million and impairment losses of $4.7 million (see “CHS Joint Ventures” on page 10). The decrease in assets whose use is restricted is primarily due to the reduction in collateral held as security for certain interest rate swap contracts.
Deferred outflows of resources increased in 2019 by $34.8 million, or 41.7%, primarily due to a $19.1 million increase in deferred outflows on pension and a $15.8 million increase in the accumulated decrease in fair value of hedging derivatives. The increase in deferred outflows on pension is primarily due to the impact of changes in actuarial assumptions ($20.5 million), largely due to a reduction in the investment return assumption from 6.75% to 6.25%, and the net differences between projected and actual actuarial experience ($2.6 million), partially offset by the net decrease in plan contribution levels ($3.9 million). The change in the accumulated decrease in fair value of hedging derivatives is due to a $15.8 million decline in the fair value of certain interest rate swap contracts used as a hedge against changes in interest rates on certain variable rate debt instruments. In 2018, deferred outflows of resources decreased by $54.3 million, or 39.4%, primarily due to a $40.3 million decrease in deferred outflows on pension and a $13.9 million decrease in the accumulated decrease in fair value of hedging derivatives. The decrease in deferred outflows on pension is due to the net differences between projected and actual earnings on plan investments ($21.7 million) and the impact of changes in actuarial assumptions ($21.6 million), partially offset by differences in projected and actual actuarial experience ($2.8 million). The change in the accumulated decrease in fair value of hedging derivatives is due to a $13.9 million improvement in the fair value of certain interest rate swap contracts used as a hedge against changes in interest rates on certain variable rate debt instruments.

Shands Teaching Hospital and Clinics, Inc. and Subsidiaries Management’s Discussion and Analysis (Unaudited) June 30, 2019 and 2018
6
Liabilities, Deferred Inflows of Resources and Net Position
Current liabilities decreased in 2019 by $14.3 million, or 4.6%, primarily due to an $18.7 million decrease in estimated third-party payor settlements and a $1.1 million decrease in long-term debt, current portion, partially offset by a $5.0 million increase in accrued salaries and leave payable and a $0.4 million increase in capital lease obligations, current portion. The decrease in estimated third-party payor settlements is primarily due to the net repayment of $10.7 million, to settle various outstanding Medicaid cost reports, and $8.0 million of other third-party settlements activity, including changes in settlement estimates. The decrease in long-term debt, current portion is due to a decrease in principal payments currently due on a bank note payable. The increase in accrued salaries and leave payable was primarily due to the timing of the payroll payment cycle. The increase in capital lease obligations, current portion is due to the addition of a new capital lease. In 2018, current liabilities increased by $14.2 million, or 4.7%, primarily due to a $22.4 million increase in accounts payable and accrued expenses, partially offset by a $4.2 million decrease in accrued salaries and leave payable, a $2.9 million decrease in long-term debt, current portion, and a $1.0 million decrease in estimated third-party payor settlements. The increase in accounts payable and accrued expenses is primarily due to a $25.4 million increase in accounts payable due to the timing of the vendor invoice and payment cycles, partially offset by a $2.9 million decrease in retainage and construction payable. The decrease in accrued salaries and leave payable was primarily due to the timing of the payroll payment cycle. The decrease in long-term debt, current portion is due to decreases in principal currently due on the Series 2012A and Series 2012B Bonds ($6.4 million combined), partially offset by an increase in principal currently due on the Series 2016A Bonds ($3.9 million). The decrease in estimated third-party settlements is due to settlement activity to/from certain third-party payors and changes in settlement estimates.
Long-term liabilities increased in 2019 by $11.8 million, or 1.4%, primarily due to a $20.2 million increase in other liabilities and a $4.9 million increase in capital lease obligations, less current portion, partially offset by a $13.3 million decrease in long-term debt, less current portion. The increase in other liabilities is primarily due to a $15.8 million change in the fair value of interest rate swaps in a liability position and used as a hedge against changes in interest rates on certain variable rate debt instruments, a $3.3 million increase in non-qualified retirement plan liability, and a $1.2 million increase in deferred revenue. The increase in capital lease obligations, less current portion, is due to a new capital lease of $5.5 million (long-term portion), partially offset by $0.6 million in principal payments on capital lease obligations. The decrease in long-term debt, less current portion is primarily due to principal payments of $13.3 million. In 2018, long-term liabilities decreased by $65.1 million, or 7.1%, primarily due to a decrease of $35.7 million in the net pension liability for Shands’ DB pension plan, principal payments on debt and capital lease obligations of $16.5 million, and a $13.9 million improvement in the fair value of interest rate swaps in a liability position.
Deferred inflows of resources decreased in 2019 by $20.4 million, or 44.2%, primarily due to a decrease in the deferred inflows on pension of $20.2 million due to the impact of changes in actuarial assumptions ($11.8 million), the net differences in projected and actual earnings on plan investments ($7.6 million), and the differences in projected and actual actuarial experience ($0.7 million). In 2018, deferred inflows of resources increased by $16.7 million, or 56.9%, primarily due to an increase in the deferred inflows on pension of $16.9 million due to the net differences in projected and actual earnings on plan investments.
Total net position increased in 2019 by $81.3 million, or 7.4%, due to an excess margin of $138.9 million, capital contributions of $5.7 million, and a special item for the gain on sale and transfer of UF Health Shands Rehab Hospital assets to Archer Rehab (see “Archer Rehab Joint Venture” on page 11), partially offset by transfers and expenditures in support of UF and its health science colleges of $69.6 million and other changes in net position of $0.5 million. In 2018, total net position increased by $52.9 million, or 5.0%, due to an excess margin of $114.8 million and capital contributions of $10.5 million, partially offset

Shands Teaching Hospital and Clinics, Inc. and Subsidiaries Management’s Discussion and Analysis (Unaudited) June 30, 2019 and 2018
7
by transfers and expenditures in support of UF and its health science colleges of $68.1 million and other changes in net position of $4.3 million.
Statements of Revenues, Expenses and Changes in Net Position
The following table presents Shands’ condensed consolidated basic statements of revenues, expenses and changes in net position for the years ended June 30, 2019, 2018 and 2017:
(in thousands of dollars) 2019 2018 2017
Net patient service revenue 1,571,324$ 1,467,088$ 1,404,889$ Other operating revenue 29,468 22,659 19,702
Total operating revenues 1,600,792 1,489,747 1,424,591Operating expenses 1,482,863 1,386,019 1,269,336
Operating income 117,929 103,728 155,255Nonoperating revenues, net 20,958 11,080 23,355
Excess of revenues over expenses 138,887 114,808 178,610Other changes in net position
Transfers and expenditures in support of the University of Florida and its health science colleges (69,580) (68,062) (66,328)Capital contributions 5,742 10,544 6,200Special Item - Gain on sale and transfer of UF Health Shands Rehab Hospital 6,751 - -Other changes in net position (499) (4,348) (765)
Increase in net position 81,301 52,942 117,717
Net positionBeginning of year 1,105,097 1,052,155 934,438End of year 1,186,398$ 1,105,097$ 1,052,155$
Operating Revenues
Total operating revenues increased in 2019 and 2018 by $111.0 million, or 7.5%, and $65.2 million, or 4.6%, respectively. The increases in both years were primarily due to increased net patient service revenue.
During 2019, net patient service revenue increased by $104.2 million, or 7.1%, reflecting increases in admissions (2.1%), surgical cases (8.0%), outpatient visits (3.2%), case mix intensity (1.8%), and payment rates across various third-party payors. During 2018, net patient service revenue increased by $62.2 million, or 4.4%, reflecting increases in admissions (0.1%), outpatient visits (3.3%), case mix intensity (3.7%), and payment rates across various third-party payors.
Operating Expenses
Operating expenses increased in 2019 by $96.8 million, or 7.0%. Salaries and benefits increased by $61.0 million, or 9.4%. Salaries expense increased by $45.7 million, or 9.0%, reflecting a 4.5% increase in staffing levels due to volume increases and increased labor required to support various functions within the new hospitals, and a 4.3% increase in average hourly wages. The increase in average hourly wages is primarily due to increased reliance on contract and temporary labor in the first two quarters of fiscal year 2019 due to the tight labor market for experienced nurses, surgical technicians, and other allied health professionals to support new patient care units and operating room capacity within the new hospitals combined with normal annual wage increases. There was a steep decline in the use of contract
Shands Teaching Hospital and Clinics, Inc. and Subsidiaries Management’s Discussion and Analysis (Unaudited) June 30, 2019 and 2018
8
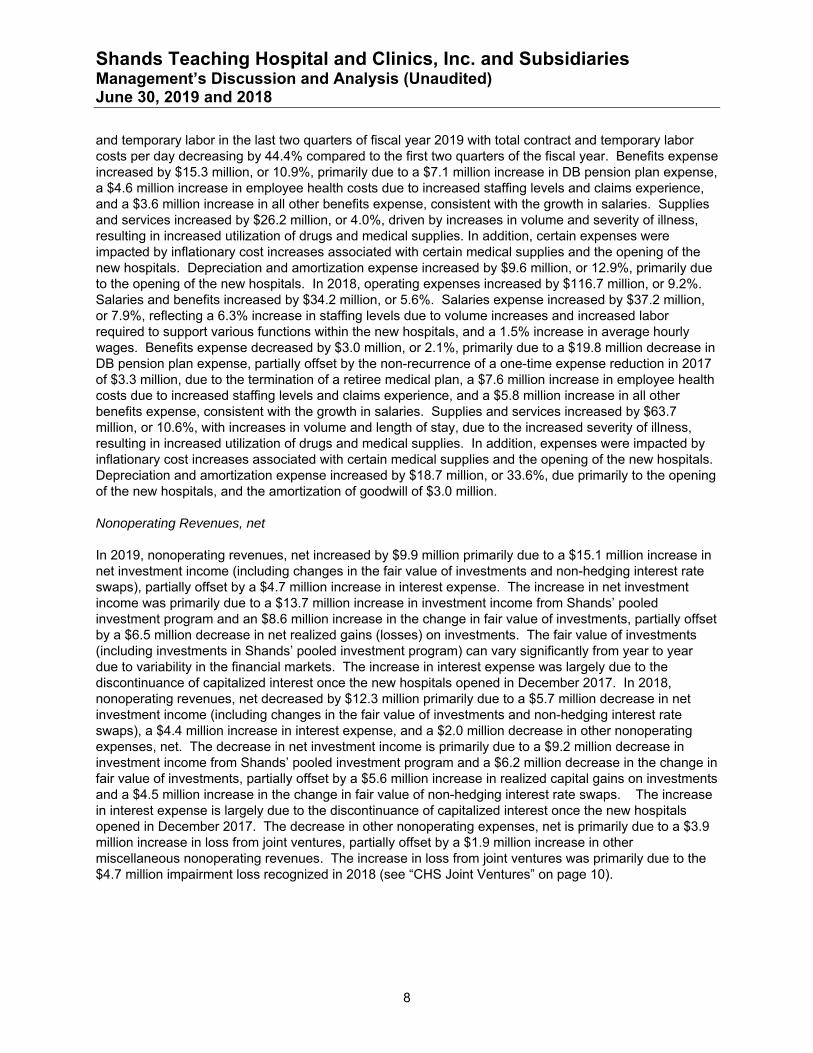
and temporary labor in the last two quarters of fiscal year 2019 with total contract and temporary labor costs per day decreasing by 44.4% compared to the first two quarters of the fiscal year. Benefits expense increased by $15.3 million, or 10.9%, primarily due to a $7.1 million increase in DB pension plan expense, a $4.6 million increase in employee health costs due to increased staffing levels and claims experience, and a $3.6 million increase in all other benefits expense, consistent with the growth in salaries. Supplies and services increased by $26.2 million, or 4.0%, driven by increases in volume and severity of illness, resulting in increased utilization of drugs and medical supplies. In addition, certain expenses were impacted by inflationary cost increases associated with certain medical supplies and the opening of the new hospitals. Depreciation and amortization expense increased by $9.6 million, or 12.9%, primarily due to the opening of the new hospitals. In 2018, operating expenses increased by $116.7 million, or 9.2%. Salaries and benefits increased by $34.2 million, or 5.6%. Salaries expense increased by $37.2 million, or 7.9%, reflecting a 6.3% increase in staffing levels due to volume increases and increased labor required to support various functions within the new hospitals, and a 1.5% increase in average hourly wages. Benefits expense decreased by $3.0 million, or 2.1%, primarily due to a $19.8 million decrease in DB pension plan expense, partially offset by the non-recurrence of a one-time expense reduction in 2017 of $3.3 million, due to the termination of a retiree medical plan, a $7.6 million increase in employee health costs due to increased staffing levels and claims experience, and a $5.8 million increase in all other benefits expense, consistent with the growth in salaries. Supplies and services increased by $63.7 million, or 10.6%, with increases in volume and length of stay, due to the increased severity of illness, resulting in increased utilization of drugs and medical supplies. In addition, expenses were impacted by inflationary cost increases associated with certain medical supplies and the opening of the new hospitals. Depreciation and amortization expense increased by $18.7 million, or 33.6%, due primarily to the opening of the new hospitals, and the amortization of goodwill of $3.0 million.
Nonoperating Revenues, net
In 2019, nonoperating revenues, net increased by $9.9 million primarily due to a $15.1 million increase in net investment income (including changes in the fair value of investments and non-hedging interest rate swaps), partially offset by a $4.7 million increase in interest expense. The increase in net investment income was primarily due to a $13.7 million increase in investment income from Shands’ pooled investment program and an $8.6 million increase in the change in fair value of investments, partially offset by a $6.5 million decrease in net realized gains (losses) on investments. The fair value of investments (including investments in Shands’ pooled investment program) can vary significantly from year to year due to variability in the financial markets. The increase in interest expense was largely due to the discontinuance of capitalized interest once the new hospitals opened in December 2017. In 2018, nonoperating revenues, net decreased by $12.3 million primarily due to a $5.7 million decrease in net investment income (including changes in the fair value of investments and non-hedging interest rate swaps), a $4.4 million increase in interest expense, and a $2.0 million decrease in other nonoperating expenses, net. The decrease in net investment income is primarily due to a $9.2 million decrease in investment income from Shands’ pooled investment program and a $6.2 million decrease in the change in fair value of investments, partially offset by a $5.6 million increase in realized capital gains on investments and a $4.5 million increase in the change in fair value of non-hedging interest rate swaps. The increase in interest expense is largely due to the discontinuance of capitalized interest once the new hospitals opened in December 2017. The decrease in other nonoperating expenses, net is primarily due to a $3.9 million increase in loss from joint ventures, partially offset by a $1.9 million increase in other miscellaneous nonoperating revenues. The increase in loss from joint ventures was primarily due to the $4.7 million impairment loss recognized in 2018 (see “CHS Joint Ventures” on page 10).

Shands Teaching Hospital and Clinics, Inc. and Subsidiaries Management’s Discussion and Analysis (Unaudited) June 30, 2019 and 2018
9
Other Changes in Net Position
In 2019, transfers and expenditures in support of UF and its health science colleges increased by $1.5 million, or 2.2%. Capital contributions decreased by $4.8 million reflecting the release of restrictions on $4.6 million of capital donations previously reflected as restricted-expendable net position compared to $7.8 million in 2018, and a $1.6 million decrease in capital donations. In 2019, a $6.8 million special item was recognized for the gain on sale and transfer of Rehab Hospital assets to Archer Rehab (see “Archer Rehab Joint Venture” on page 11). Other changes in net position changed by $3.8 million primarily due to the decrease in the release of restricted donations. In 2018, transfers and expenditures in support of UF and its health science colleges increased by $1.7 million, or 2.6%. Capital contributions increased by $4.3 million reflecting the release of restrictions on $7.8 million of capital donations previously reflected as restricted-expendable net position compared to $3.8 million in 2017. Other changes in net position changed by $3.6 million primarily due to the increase in the release of restricted capital donations received.
Patient Volumes
The following tables present the associated volumes of each facility on a comparative basis for the years ended 2019, 2018 and 2017:
Net % Net %
2019 2018 Change Change 2017 Change Change
Admissions (1)UF Health Shands Hospital 52,165 50,648 1,517 3.0% 50,734 (86) -0.2%
UF Health Shands Psychiatric Hospital 3,723 3,734 (11) -0.3% 3,555 179 5.0%
UF Health Shands Rehab Hospital (2) 669 991 (322) -32.5% 1,014 (23) -2.3%
Total 56,557 55,373 1,184 2.1% 55,303 70 0.1%
Outpatient Visits (3)UF Health Shands Hospital 1,032,873 1,001,511 31,362 3.1% 966,450 35,061 3.6%
UF Health Shands Psychiatric Hospital 1,084 1,723 (639) -37.1% 1,378 345 25.0%
UF Health Shands Rehab Hospital (2) 143 543 (400) -73.7% 293 250 85.3%
UF Health Florida Recovery Center 23,475 20,741 2,734 13.2% 23,746 (3,005) -12.7%
Total 1,057,575 1,024,518 33,057 3.2% 991,867 32,651 3.3%
(1) Includes inpatient and observation admissions
(2) Volume data for UF Health Rehab Hospital is through March 5, 2019, the effective date of the sale and transfer to Archer Rehab
(3) Includes outpatient visits, emergency room and trauma visits
During 2019, total admissions increased by 2.1%, inpatient admissions increased by 4.3% while observation admissions decreased by 15.5%. Outpatient visits increased by 3.2%. During 2018, total admissions increased by 0.1%, inpatient admissions increased by 4.1% while observation admissions decreased by 23.6%. Outpatient visits increased by 3.3%.

Shands Teaching Hospital and Clinics, Inc. and Subsidiaries Management’s Discussion and Analysis (Unaudited) June 30, 2019 and 2018
10
Statements of Cash Flows
The consolidated basic statements of cash flows provide additional information concerning Shands’ financial results by reporting the major sources and uses of cash. During 2019, cash and cash equivalents increased by $8.0 million, or 21.3%. Cash provided by operating activities was $115.1 million. Other significant sources of cash included $109.3 million from the sale (net of purchases) of short-term investments, assets whose use is limited, and assets whose use is restricted, $9.8 million of donations and pledge receipts, $5.7 million of capital contributions, receipt of $4.3 million in distributions from joint venture investments, and $2.4 million in investment income received. Significant cash uses included $69.6 million in support of UF and its health science colleges, capital spending of $99.5 million, principal and interest payments of $47.1 million on outstanding debt and capital lease obligations, $7.3 million in posting of collateral (net of receipts) held as security for certain interest rate swap contracts, and $7.6 million in investments in the CareSpot and Archer Rehab joint ventures. Shands also funded the DB pension plan by $14.9 million in excess of pension expense ($25.3 million in total) as management proactively works toward improving the pension plan’s funded status.
During 2018, cash and cash equivalents increased by $9.3 million, or 33.1%. Cash provided by operating activities was $181.6 million. Other significant sources of cash included $57.4 million from the sale (net of purchases) of short-term investments, assets whose use is limited, and assets whose use is restricted, $15.9 million from the receipt of collateral (net of postings) held as security for certain interest rate swap contracts, $11.1 million of donations and pledge receipts, $10.5 million of capital contributions, $2.9 million in investment income received, and the receipt of $1.4 million in distributions from joint venture investments. Significant cash uses included $68.1 million in support of UF and its health science colleges, capital spending of $153.2 million, and principal and interest payments of $49.4 million on outstanding debt and capital lease obligations. Shands also funded the DB pension plan by $26.0 million in excess of pension expense ($29.3 million in total).
Defined Benefit Pension Plan Funded Status
As of June 30, 2019, the funded status (as measured under ERISA funding rules) was 79.6%, a decrease from 81.5% as of June 30, 2018. The decrease in the funded status is largely due to an increase in projected plan liabilities primarily due to declining interest rates partially offset by an increase in plan assets due to positive financial market conditions. As of June 30, 2018, the funded status was 81.5%, an increase from 75.8% as of June 30, 2017. The increase in the funded status is largely due to improved financial market conditions and rising interest rates. In June 2018, to improve the funded status of the plan and to decrease the cost of plan administration, the Plan Administrator took several actions resulting in lump-sum payments for 1,561 plan participants. These actions resulted in the reduction in actuarially determined plan obligations of $41.9 million and a reduction in plan assets of $36.3 million.
CHS Joint Ventures
Shands has various joint venture relationships with CHS, successor organization to Health Management Associates, Inc. (“HMA”).
Shands acquired its 5% minority interest in Munroe for $10.0 million on April 1, 2014. On April 18, 2018, Munroe entered into an asset purchase agreement with the Adventist Health System Sunbelt Healthcare Corporation to sell substantially all of the assets of Munroe for $130.0 million and a capital investment obligation of approximately $125.0 million. The sale subsequently closed on August 1, 2018. At the time of the sale transaction, Shands’ share of the purchase price was estimated to be $6.5 million. Accordingly, at June 30, 2018, Shands recognized a $3.5 million impairment loss on its investment in Munroe. Separately, in May 2018, Shands received a distribution of $0.8 million from its investment in

Shands Teaching Hospital and Clinics, Inc. and Subsidiaries Management’s Discussion and Analysis (Unaudited) June 30, 2019 and 2018
11
Munroe. The net effect of the impairment loss and distribution was $2.7 million and is included in other nonoperating expenses, net, in the consolidated basic statement of revenues, expenses and changes in net position for the year ended June 30, 2018. As of June 30, 2019, Shands has not received any further distributions from Munroe and final distribution of the sale proceeds is pending. Due to the passage of time and increased uncertainty regarding the value of its investment in Munroe, Shands recognized an additional $3.3 million impairment loss on its investment in Munroe, which is included in other nonoperating expenses, net, in the consolidated basic statement of revenues, expenses and changes in net position for the year ended June 30, 2019.
Shands acquired its 40% minority interests in the Rural Hospitals on May 26, 2010. At June 30, 2017, the book value of Shands’ investment in the Rural Hospitals was $5.6 million. During 2018, Shands recognized a distribution from the Rural Hospitals totaling $3.2 million, with $2.8 million recorded as a reduction in the investment in the Rural Hospitals and $0.4 million recognized in nonoperating expenses, net. Also during 2018, Shands recorded its share of the Rural Hospitals net losses totaling $1.6 million. At June 30, 2018, Shands determined that its investment in the Rural Hospitals was impaired and recognized a loss of $1.2 million, eliminating the remaining book value of its investment. The net effect of the impairment loss and all other activity was $2.4 million and is included in other nonoperating expenses, net, in the consolidated basic statement of revenues, expenses and changes in net position for the year ended June 30, 2018.
Archer Rehab Joint Venture
On March 5, 2019, Shands sold a 51% undivided interest in certain Rehab Hospital assets to Select for $3.6 million. Also on March 5, 2019, Shands and Select contributed their respective shares of the Rehab Hospital assets to Archer Rehab as initial contributed capital to the newly formed joint venture. Shands’ capital contribution of its remaining 49% share of the Rehab Hospital assets was valued at $3.4 million. Shands’ sale and contribution of the Rehab Hospital assets resulted in a $6.8 million gain which is reported as a special item in the consolidated basic statement of revenues, expenses and changes in net position for the year ended June 30, 2019. Subsequent to March 5, 2019, Shands made additional capital investments in Archer Rehab of $6.4 million to support its share of the estimated working capital needs of the new joint venture and recorded its share of Archer Rehab’s net losses totaling $2.5 million. As of June 30, 2019, an investment of $7.3 million, representing Shands’ 49% interest in Archer Rehab, is included in other assets in the accompanying consolidated basic statement of net position.
Debt Outstanding
As of June 30, 2019, Shands had $810.9 million in debt outstanding compared to $825.2 million at June 30, 2018. Long-term debt is comprised of tax exempt bond issues, taxable notes, and installment debt. Shands utilizes interest rate swaps to synthetically convert interest rates on certain variable rate bonds to fixed rates. Including the effect of the interest rate swaps, 87.1% of Shands’ bonds and notes outstanding are fixed while 12.9% are variable. The Series 2007A Bonds, Series 2007B Bonds, Series 2008A Bonds, and Series 2008C Bonds are variable rate bonds with fixed rate payor interest rate swaps, which synthetically convert the interest rates on the bonds to fixed rates. The Series 2014A Bonds, Series 2014B Bonds, and Series 2016A Bonds are unenhanced fixed rate bonds. The Series 2010A Bonds, Series 2012A Bonds and Series 2012B Bonds are variable rate bonds. The Series 2013A Taxable Notes are taxable fixed rate notes.
As of June 30, 2018, Shands had $825.2 million in debt outstanding compared to $842.4 million at June 30, 2017.
Shands Teaching Hospital and Clinics, Inc. and Subsidiaries Management’s Discussion and Analysis (Unaudited) June 30, 2019 and 2018
12
New Hospitals Project
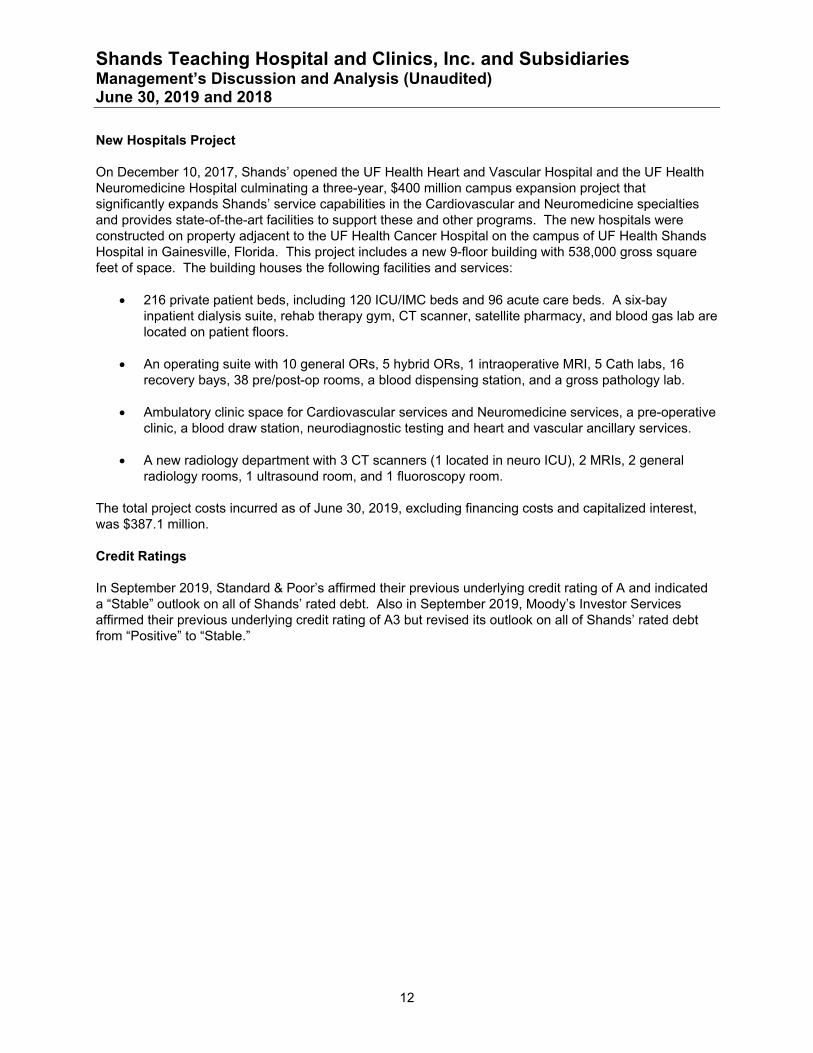
On December 10, 2017, Shands’ opened the UF Health Heart and Vascular Hospital and the UF Health Neuromedicine Hospital culminating a three-year, $400 million campus expansion project that significantly expands Shands’ service capabilities in the Cardiovascular and Neuromedicine specialties and provides state-of-the-art facilities to support these and other programs. The new hospitals were constructed on property adjacent to the UF Health Cancer Hospital on the campus of UF Health Shands Hospital in Gainesville, Florida. This project includes a new 9-floor building with 538,000 gross square feet of space. The building houses the following facilities and services:
216 private patient beds, including 120 ICU/IMC beds and 96 acute care beds. A six-bay inpatient dialysis suite, rehab therapy gym, CT scanner, satellite pharmacy, and blood gas lab are located on patient floors.
An operating suite with 10 general ORs, 5 hybrid ORs, 1 intraoperative MRI, 5 Cath labs, 16 recovery bays, 38 pre/post-op rooms, a blood dispensing station, and a gross pathology lab.
Ambulatory clinic space for Cardiovascular services and Neuromedicine services, a pre-operative clinic, a blood draw station, neurodiagnostic testing and heart and vascular ancillary services.
A new radiology department with 3 CT scanners (1 located in neuro ICU), 2 MRIs, 2 general radiology rooms, 1 ultrasound room, and 1 fluoroscopy room.
The total project costs incurred as of June 30, 2019, excluding financing costs and capitalized interest, was $387.1 million.
Credit Ratings
In September 2019, Standard & Poor’s affirmed their previous underlying credit rating of A and indicated a “Stable” outlook on all of Shands’ rated debt. Also in September 2019, Moody’s Investor Services affirmed their previous underlying credit rating of A3 but revised its outlook on all of Shands’ rated debt from “Positive” to “Stable.”
PricewaterhouseCoopers LLP, 4040 West Boy Scout Blvd., Suite 1000, Tampa, FL 33607 T: (813)229-0221, F: (813)229 3646, www.pwc.com/us
Report of Independent Auditors To the Board of Directors of Shands Teaching Hospital and Clinics, Inc. and Subsidiaries We have audited the accompanying consolidated basic financial statements of Shands Teaching Hospital and Clinics, Inc. and its subsidiaries (the “Company”), a component unit of the University of Florida, which comprise the consolidated basic statements of net position as of June 30, 2019 and 2018, and the related consolidated basic statements of revenues, expenses and changes in net position and of cash flows for the years then ended, and the related notes to the consolidated basic financial statements. Management’s Responsibility for the Consolidated Basic Financial Statements Management is responsible for the preparation and fair presentation of the consolidated basic financial statements in accordance with accounting principles generally accepted in the United States of America; this includes the design, implementation, and maintenance of internal control relevant to the preparation and fair presentation of consolidated basic financial statements that are free from material misstatement, whether due to fraud or error. Auditors’ Responsibility Our responsibility is to express an opinion on the consolidated basic financial statements based on our audits. We conducted our audits in accordance with auditing standards generally accepted in the United States of America. Those standards require that we plan and perform the audit to obtain reasonable assurance about whether the consolidated basic financial statements are free from material misstatement. An audit involves performing procedures to obtain audit evidence about the amounts and disclosures in the consolidated basic financial statements. The procedures selected depend on our judgment, including the assessment of the risks of material misstatement of the consolidated basic financial statements, whether due to fraud or error. In making those risk assessments, we consider internal control relevant to the Company’s preparation and fair presentation of the consolidated basic financial statements in order to design audit procedures that are appropriate in the circumstances, but not for the purpose of expressing an opinion on the effectiveness of the Company’s internal control. Accordingly, we express no such opinion. An audit also includes evaluating the appropriateness of accounting policies used and the reasonableness of significant accounting estimates made by management, as well as evaluating the overall presentation of the consolidated basic financial statements. We believe that the audit evidence we have obtained is sufficient and appropriate to provide a basis for our audit opinion. Opinion In our opinion, the consolidated basic financial statements referred to above present fairly, in all material respects, the financial position of Shands Teaching Hospital and Clinics, Inc. and its subsidiaries as of June 30, 2019 and 2018, the respective changes in financial position and cash flows thereof for the years then ended in accordance with accounting principles generally accepted in the United States of America.

14
Other Matters Required Supplementary Information The accompanying management’s discussion and analysis (unaudited) on pages 1 through 12, the schedule of changes in the net pension (asset) liability and related ratios (unaudited) on page 54, and the schedule of employer contributions (unaudited) on page 55 are required by accounting principles generally accepted in the United States of America to supplement the consolidated basic financial statements. Such information, although not a part of the consolidated basic financial statements, is required by the Governmental Accounting Standards Board who considers it to be an essential part of financial reporting for placing the consolidated basic financial statements in an appropriate operational, economic, or historical context. We have applied certain limited procedures to the required supplementary information in accordance with auditing standards generally accepted in the United States of America, which consisted of inquiries of management about the methods of preparing the information and comparing the information for consistency with management's responses to our inquiries, the consolidated basic financial statements, and other knowledge we obtained during our audits of the consolidated basic financial statements. We do not express an opinion or provide any assurance on the information because the limited procedures do not provide us with sufficient evidence to express an opinion or provide any assurance. Supplementary Information Our audits were conducted for the purpose of forming an opinion on the consolidated basic financial statements taken as a whole. The supplemental consolidating information on pages 56 through 60 is presented for purposes of additional analysis and is not a required part of the consolidated basic financial statements. The supplemental consolidating information is the responsibility of management and was derived from and relates directly to the underlying accounting and other records used to prepare the consolidated basic financial statements. The supplemental consolidating information has been subjected to the auditing procedures applied in the audit of the consolidated basic financial statements and certain additional procedures, including comparing and reconciling such information directly to the underlying accounting and other records used to prepare the consolidated basic financial statements or to the consolidated basic financial statements themselves and other additional procedures, in accordance with auditing standards generally accepted in the United States of America. In our opinion, the supplemental consolidating information is fairly stated, in all material respects, in relation to the consolidated basic financial statements taken as a whole.
Tampa, Florida September 25, 2019

Shands Teaching Hospital and Clinics, Inc. and Subsidiaries Consolidated Basic Statements of Net Position June 30, 2019 and 2018
(In thousands of dollars)
The accompanying notes are an integral part of these consolidated basic financial statements.
15
2019 2018
AssetsCurrent assets
Cash and cash equivalents 45,276$ 37,322$ Short-term investments 14,539 122,200Patient accounts receivable, net of allowance for uncollectibles of $39,670 and $40,465, respectively 242,161 225,358Inventories 36,889 22,577Prepaid expenses and other current assets 101,388 59,077Assets whose use is limited, current portion 25,630 32,469
Total current assets 465,883 499,003
Assets whose use is limited, less current portion 559,489 515,538Assets whose use is restricted 40,165 28,180Capital assets, net 1,081,668 1,065,697Other assets 110,858 126,075
Total assets 2,258,063 2,234,493
Deferred outflows of resourcesAccumulated decrease in fair value of hedging derivatives 50,830 35,073Deferred loss on debt refunding 295 336Deferred outflows on pension 67,181 48,062
Total deferred outflows of resources 118,306 83,471
LiabilitiesCurrent liabilities
Long-term debt, current portion 13,287 14,341Capital lease obligations, current portion 603 203Accounts payable and accrued expenses 132,612 132,602Accrued salaries and leave payable 62,806 57,804Estimated third-party payor settlements 90,056 108,731
Total current liabilities 299,364 313,681
Long-term liabilitiesLong-term debt, less current portion 797,595 810,881Capital lease obligations, less current portion 6,524 1,642Other liabilities 60,785 40,604
Total long-term liabilities 864,904 853,127
Total liabilities 1,164,268 1,166,808
Deferred inflows of resourcesDeferred gain on debt refunding 2,325 2,528Deferred inflows on pension 23,378 43,531
Total deferred inflows of resources 25,703 46,059
Net positionNet investment in capital assets 263,659 238,631Restricted
Nonexpendable 276 243Expendable 4,205 4,620
Unrestricted 918,258 861,603
Total net position 1,186,398$ 1,105,097$
Shands Teaching Hospital and Clinics, Inc. and Subsidiaries Consolidated Basic Statements of Revenues, Expenses and Changes in Net Position Years Ended June 30, 2019 and 2018
(In thousands of dollars)
The accompanying notes are an integral part of these consolidated basic financial statements.
16
2019 2018
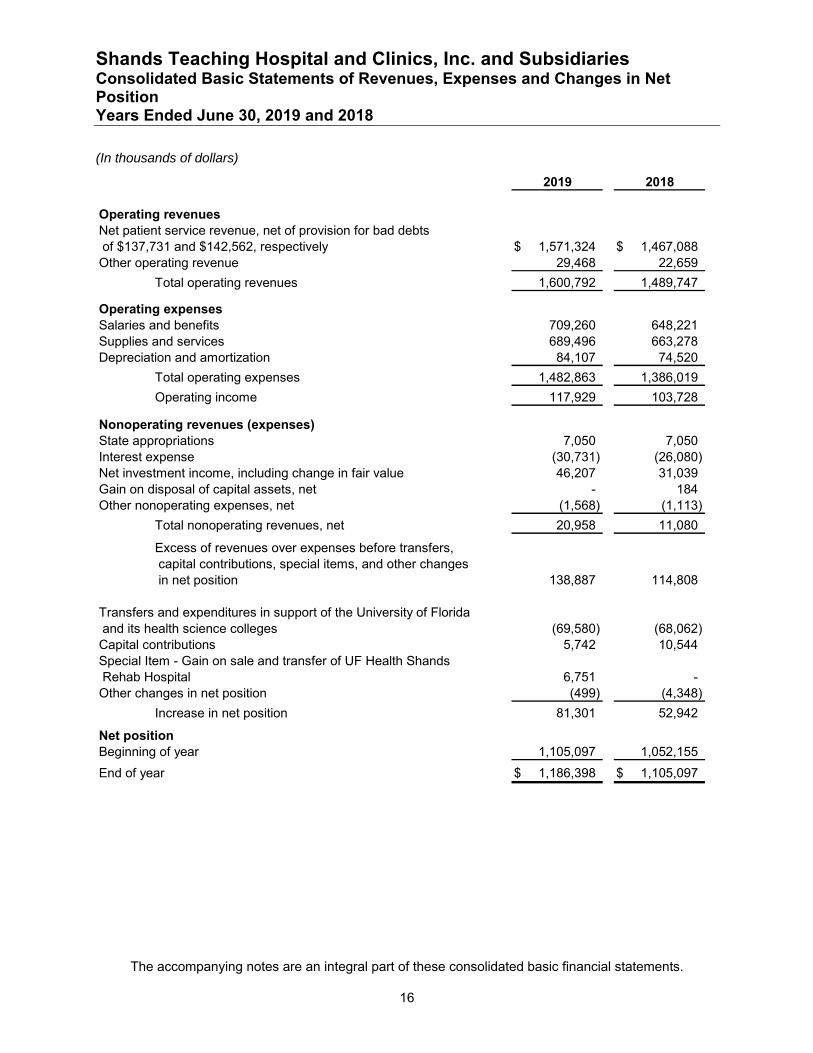
Operating revenuesNet patient service revenue, net of provision for bad debts of $137,731 and $142,562, respectively 1,571,324$ 1,467,088$ Other operating revenue 29,468 22,659
Total operating revenues 1,600,792 1,489,747
Operating expensesSalaries and benefits 709,260 648,221Supplies and services 689,496 663,278Depreciation and amortization 84,107 74,520
Total operating expenses 1,482,863 1,386,019
Operating income 117,929 103,728
Nonoperating revenues (expenses)State appropriations 7,050 7,050Interest expense (30,731) (26,080)Net investment income, including change in fair value 46,207 31,039Gain on disposal of capital assets, net - 184Other nonoperating expenses, net (1,568) (1,113)
Total nonoperating revenues, net 20,958 11,080
Excess of revenues over expenses before transfers, capital contributions, special items, and other changes in net position 138,887 114,808
Transfers and expenditures in support of the University of Florida and its health science colleges (69,580) (68,062)Capital contributions 5,742 10,544Special Item - Gain on sale and transfer of UF Health Shands Rehab Hospital 6,751 -Other changes in net position (499) (4,348)
Increase in net position 81,301 52,942
Net positionBeginning of year 1,105,097 1,052,155
End of year 1,186,398$ 1,105,097$

Shands Teaching Hospital and Clinics, Inc. and Subsidiaries Consolidated Basic Statements of Cash Flows Years Ended June 30, 2019 and 2018
(In thousands of dollars)
The accompanying notes are an integral part of these consolidated basic financial statements.
17
2019 2018
Cash flows from operating activities Cash received from patients and third-party payors 1,492,599$ 1,483,344$ Other receipts from operations 30,535 11,867Salaries and benefits paid to employees (719,135) (678,499)Payments to suppliers and vendors (688,948) (635,076)
Net cash provided by operating activities 115,051 181,636
Cash flows from noncapital financing activitiesPayments received on notes receivable 1,682 1,678Payments in support of the University of Florida and its health science colleges (69,580) (68,062)Donations and pledge receipts 9,820 11,067Other noncapital financing activities (5,448) (8,024)
Net cash used in noncapital financing activities (63,526) (63,341)
Cash flows from capital and related financing activitiesPurchase of capital assets (99,517) (153,170)Proceeds from sale of capital assets 685 17Principal payments on long-term debt (13,330) (16,189)Principal payments on capital lease obligations (644) (278)Interest payments (33,088) (32,900)(Posting) receipt of collateral on interest rate swaps (7,348) 15,853Capital contributions 5,742 10,548
Net cash used in capital and related financing activities (147,500) (176,119)
Cash flows from investing activitiesInvestment income received 2,443 2,936Investment in joint ventures (7,615) -Distributions from joint ventures 4,336 1,438Purchase of short-term investments, assets whose use is limited, and assets whose use is restricted (168,690) (378,702)Sale of short-term investments, assets whose use is limited, and assets whose use is restricted 277,995 436,145Other investing activities (4,540) 5,280
Net cash provided by investing activities 103,929 67,097
Net increase in cash and cash equivalents 7,954 9,273
Cash and cash equivalentsBeginning of year 37,322 28,049
End of year 45,276$ 37,322$
Shands Teaching Hospital and Clinics, Inc. and Subsidiaries Consolidated Basic Statements of Cash Flows (continued) Years Ended June 30, 2019 and 2018
(In thousands of dollars)
The accompanying notes are an integral part of these consolidated basic financial statements.
18
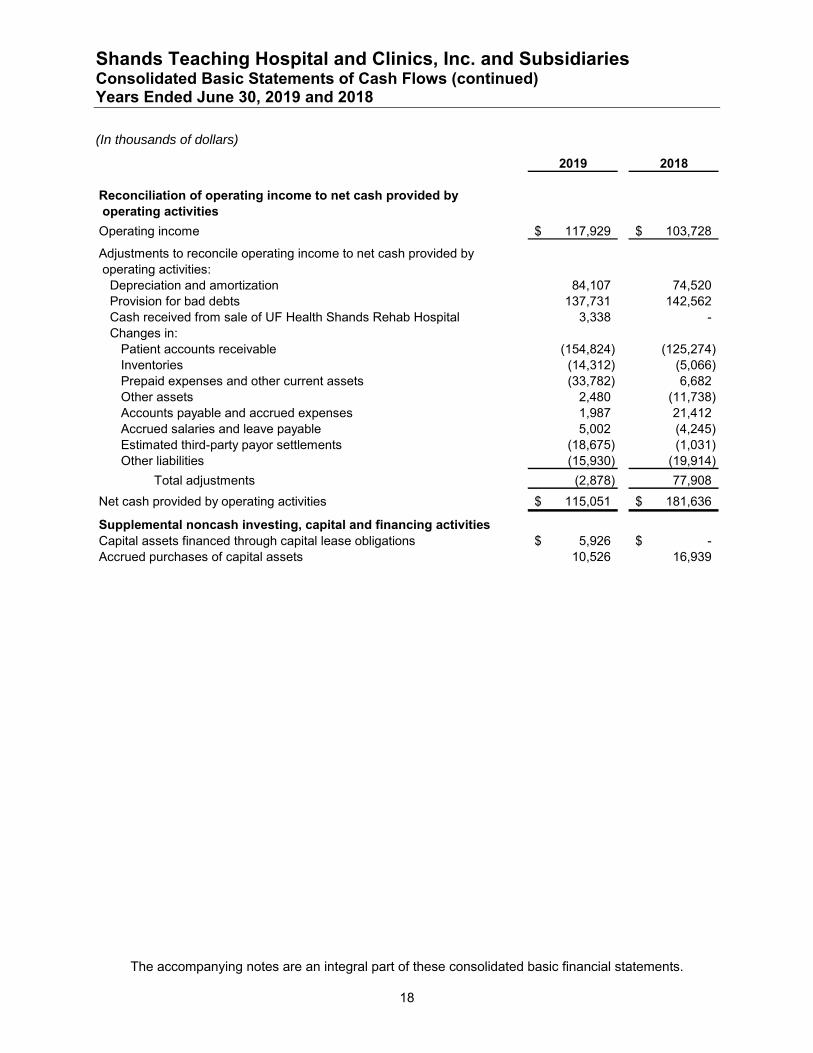
2019 2018
Reconciliation of operating income to net cash provided by operating activities
Operating income 117,929$ 103,728$
Adjustments to reconcile operating income to net cash provided by operating activities:
Depreciation and amortization 84,107 74,520Provision for bad debts 137,731 142,562Cash received from sale of UF Health Shands Rehab Hospital 3,338 -Changes in:
Patient accounts receivable (154,824) (125,274)Inventories (14,312) (5,066)Prepaid expenses and other current assets (33,782) 6,682Other assets 2,480 (11,738)Accounts payable and accrued expenses 1,987 21,412Accrued salaries and leave payable 5,002 (4,245)Estimated third-party payor settlements (18,675) (1,031)Other liabilities (15,930) (19,914)
Total adjustments (2,878) 77,908
Net cash provided by operating activities 115,051$ 181,636$
Supplemental noncash investing, capital and financing activitiesCapital assets financed through capital lease obligations 5,926$ -$ Accrued purchases of capital assets 10,526 16,939
Shands Teaching Hospital and Clinics, Inc. and Subsidiaries Notes to Consolidated Basic Financial Statements June 30, 2019 and 2018
19
1. Organization
Shands Teaching Hospital and Clinics, Inc. and Subsidiaries (“Shands”) was incorporated on October 15, 1979 as a Florida not-for-profit corporation. The President of the University of Florida (“UF”), or his designee, serves as the President of Shands’ Board of Directors (the “Board”) and retains appointment and termination rights over a majority of the members of the Board. The President of UF is deemed a state official as the position is appointed by a Board of Trustees that govern UF (the “UF Board”), and the members of the UF Board are appointed by the Governor and the Board of Governors of the State of Florida. Shands is a component unit of UF.
University of Florida Health or “UF Health” encompasses the UF Health Science Center and Shands. Shands and certain of its affiliated entities operate under names beginning with “UF Health.”
The accompanying consolidated basic financial statements include the accounts of Shands and its subsidiaries. The following identifies the significant affiliates of Shands and their respective primary operations:
UF Health Shands Hospital is part of a major academic medical center located in Gainesville, Florida, and is licensed to operate a 1,014-bed acute care hospital. UF Health Shands Hospital is a leading referral center in the State of Florida and provides clinical settings for medical education and training programs at UF.
UF Health Shands Psychiatric Hospital is a psychiatric and substance abuse facility located in Gainesville, Florida, licensed to operate 81 beds, of which 63 are psychiatric and 18 are substance abuse.
UF Health Shands Rehab Hospital is a 40-bed rehabilitation hospital located in Gainesville, Florida. Refer to Note 2 for sale of UF Health Shands Rehab Hospital.
UF Health Shands HomeCare is a hospital-based home care agency providing home care services to the residents of north central Florida.
Shands Recovery, LLC (d/b/a “UF Health Florida Recovery Center”) provides outpatient and residential treatment for alcohol and drug abuse, with on-site leased housing for certain programs. Shands is the sole corporate member of UF Health Florida Recovery Center.
Elder Care of Alachua County, Inc. (“Elder Care”) is a Florida not-for-profit corporation providing social and health care related services to the elderly in Alachua County, Florida. Shands is the sole corporate member of Elder Care.
Southeastern Healthcare Foundation, Inc. (“Southeastern”) is a Florida not-for-profit corporation providing charitable aid to UF and Shands. Shands is the sole corporate member of Southeastern.
Shands has interests in various joint ventures, fully described in Note 2.

Shands Teaching Hospital and Clinics, Inc. and Subsidiaries Notes to Consolidated Basic Financial Statements June 30, 2019 and 2018
20
2. Summary of Significant Accounting Policies
The following is a summary of the significant accounting policies followed by Shands in the presentation of these consolidated basic financial statements.
Basis of Presentation The accompanying consolidated basic financial statements have been prepared in conformity with accounting principles generally accepted in the United States of America, including all applicable effective statements of the Governmental Accounting Standards Board (“GASB”), on the accrual basis of accounting and include the accounts of Shands and its subsidiaries. Revenues and expenses are recognized on the accrual basis using the economic resources measurement focus. Significant intercompany accounts and transactions have been eliminated.
Use of Estimates The preparation of these consolidated basic financial statements in conformity with accounting principles generally accepted in the United States of America requires management to make estimates and assumptions that affect the amounts reported in the consolidated basic financial statements and accompanying notes. Actual results could differ from those estimates.
Tax Status Shands and its subsidiaries are exempt from federal income taxes pursuant to Section 501(a) as organizations described in Section 501(c) (3) of the Internal Revenue Code and from state income taxes pursuant to Chapter 220 of the Florida Statutes.
Cash and Cash Equivalents Cash and cash equivalents include investments in highly liquid instruments with original maturities of three months or less when purchased, except those classified as assets whose use is restricted in the accompanying consolidated basic statements of net position.
Investments Shands participates in a pooled investment program which consists of various limited liability companies established for the purpose of investing in specific types of investment securities. These entities are referred to as “Pooled Investment Fund(s)” and Shands’ share of the income and losses are included in net investment income, including change in fair value, in the accompanying consolidated basic statements of revenues, expenses, and changes in net position.
Shands’ direct investments primarily consist of fixed income mutual funds, Florida Treasury Investment Pool Special Purpose Investment Account, and a private equity partnership. Investments are carried at fair value. Interest, dividends, and gains and losses on investments, both realized and unrealized, are included in net investment income, including change in fair value, in the accompanying consolidated basic statements of revenues, expenses, and changes in net position.
Assets Whose Use is Limited Assets whose use is limited is comprised of assets designated for specific purposes by the Board. The Board retains control of these assets and may, at its discretion, subsequently designate their use for other purposes. Amounts required to meet current liabilities are reported as current assets.
Assets Whose Use is Restricted Assets whose use is restricted primarily include assets held by trustees under indenture agreements and collateral held by an interest rate swap counterparty.

Shands Teaching Hospital and Clinics, Inc. and Subsidiaries Notes to Consolidated Basic Financial Statements June 30, 2019 and 2018
21
Inventories Inventories consist principally of medical, surgical, and pharmaceutical supplies that are stated at the lower of cost (average cost method) or market.
State of Florida Receivables Shands receives state funding from the Agency for Health Care Administration (“AHCA”) for State of Florida low income pool and graduate medical education programs. Shands recorded a receivable from AHCA of approximately $41,497,000 and $0 as of June 30, 2019 and 2018, respectively, which is included in prepaid expenses and other current assets in the accompanying consolidated basic statements of net position.
Pledges Receivable Pledges receivable represent donor commitments to provide future funding, primarily in association with various capital construction projects at Shands and are generally due over the next three years. Pledges receivable are recorded net of an estimated reserve for uncollectible pledges. The current portion of pledges receivable is reported in prepaid expenses and other current assets in the accompanying consolidated basic statements of net position. The long-term portion of pledges receivable is reported in other assets in the accompanying consolidated basic statements of net position. For the years ended June 30, 2019 and 2018, pledge discount rates range from 0.6% to 3.0% and 0.6% to 2.8%, respectively.
Capital Assets Capital assets are recorded at historical cost at date of purchase or at the acquisition value at date of donation. Buildings and equipment under capital leases are stated at the present value of minimum lease payments at the inception of the lease. Routine maintenance and repairs are expensed when incurred. Expenditures that materially increase the value, change the capacity or extend the useful life of an asset are capitalized. Interest costs incurred on borrowed funds during the period of construction of capital assets are capitalized as a component of the cost of acquiring those assets. Depreciation is computed using the straight-line method over the estimated useful lives of the related depreciable assets as recommended by the American Hospital Association. Buildings and equipment under capital leases are amortized using the straight-line method over the shorter period of the lease term or the estimated useful life of the related assets. Such amortization is included in depreciation and amortization expense in the accompanying consolidated basic statements of revenues, expenses and changes in net position. Gains and losses on disposition are recorded in the year of disposal and are reported as nonoperating revenues (expenses) in the accompanying consolidated basic statements of revenues, expenses and changes in net position.
Joint Ventures Shands has a 40% minority interest in Lake Shore HMA, LLC, Starke HMA, LLC, and Live Oak HMA, LLC which own or lease three rural community hospitals - Shands Lake Shore located in Lake City, Florida; Shands Starke located in Starke, Florida; and Shands Live Oak located in Live Oak, Florida (the “Rural Hospitals”). Community Health Systems, Inc. (“CHS”) is the majority partner and manages the operations of the Rural Hospitals. Shands accounts for the investment in the Rural Hospitals under the equity method of accounting.
In June 2018, the Rural Hospitals approved a distribution, which was paid in July 2018. As such, a distribution receivable of approximately $3,213,000 was recorded in prepaid expenses and other current assets in the accompanying consolidated basic statement of net position as of June 30, 2018. Of the distribution amount, approximately $2,814,000 was recorded as a reduction in other assets in the accompanying consolidated basic statement of net position as of June 30, 2018, and
Shands Teaching Hospital and Clinics, Inc. and Subsidiaries Notes to Consolidated Basic Financial Statements June 30, 2019 and 2018
22
approximately $399,000 was recorded in other nonoperating expenses, net, in the accompanying consolidated basic statement of revenues, expenses and changes in net position for the year ended June 30, 2018.
At June 30, 2018, management determined that Shands’ investment in the Rural Hospitals was impaired and recognized an impairment loss for the remaining book value of the investment. For the year ended June 30, 2018, activity related to Shands’ investment in the Rural Hospitals resulted in a loss of approximately $2,360,000, including a loss on impairment of approximately $1,169,000 and a loss on equity investment of approximately $1,590,000, partially offset by income from distributions earned of approximately $399,000 and is included in other nonoperating expenses, net in the accompanying consolidated basic statement of revenues, expenses, and changes in net position. For the year ended June 30, 2019, there was no activity during the year and the investment balance remained at zero as of June 30, 2019.
Shands has a 5% minority interest in Munroe HMA Holdings, LLC (“Munroe”), which previously owned a regional medical center located in Ocala, Florida. CHS is the majority owner of Munroe. On April 18, 2018, Munroe entered into an asset purchase agreement with the Adventist Health System Sunbelt Healthcare Corporation to sell substantially all of the assets of Munroe for $130,000,000 and other consideration. The sale subsequently closed on August 1, 2018. Shands accounts for the investment in Munroe under the lower of cost or fair market value method of accounting. The original cost of Shands’ investment in Munroe was $10,000,000. At June 30, 2018, Shands’ share of the purchase price was estimated to be $6,500,000. Accordingly, Shands recognized an impairment loss of $3,500,000 for the year ended June 30, 2018. In addition, for the year ended June 30, 2018, Shands received cash distributions of approximately $784,000 as a result of its investment in Munroe. At June 30, 2019, Shands revised its estimate of the value of its investment in Munroe and recognized an impairment loss of $3,250,000. As of June 30, 2019 and 2018, an investment of $3,250,000 and $6,500,000, respectively, was recorded in other assets in the accompanying consolidated basic statements of net position. The net effect of impairment losses and distribution for the years ended June 30, 2019 and 2018, was approximately $3,250,000 and $2,716,000, respectively, and is included in other nonoperating expenses, net, in the accompanying consolidated basic statements of revenues, expenses and changes net position.
Shands has a 49.9% minority interest in Shands/Solantic Joint Venture, LLC (d/b/a “CareSpot”) which owns walk-in urgent care centers located in north central Florida. Solantic of Orlando, LLC, owns the remaining 50.1% majority interest and manages the facilities. Prior to September 1, 2018, CareSpot operated three urgent care centers exclusively in Gainesville, Florida. On September 1, 2018, CareSpot acquired a fourth urgent care center located in Ocala, Florida, from Solantic. Shands invested $1,265,000 as part of the acquisition of the additional center. Shands accounts for the investment in CareSpot under the equity method of accounting. At June 30, 2019 and 2018, an investment of approximately $3,048,000 and $1,839,000, respectively, was recorded in other assets in the accompanying consolidated basic statements of net position. For the years ended June 30, 2019 and 2018, an investment gain of approximately $1,067,000 and $496,000, respectively, was recorded in other nonoperating expenses, net, in the accompanying consolidated basic statements of revenues, expenses and changes in net position. In addition, cash distributions of approximately $1,123,000 and $299,000 were received for the years ended June 30, 2019 and 2018, respectively.
Shands has a 49% minority interest in Select Specialty Hospital – Gainesville, LLC (“SSH”). Select Specialty Hospitals, Inc. (“Select”), an affiliate of Select Medical Corporation (“SMC”), owns the remaining 51% majority interest. Prior to August 14, 2018, SSH owned and operated a 44-bed long-term acute care hospital (“LTACH”) in a stand-alone facility it leased from an affiliate of Select.

Shands Teaching Hospital and Clinics, Inc. and Subsidiaries Notes to Consolidated Basic Financial Statements June 30, 2019 and 2018
23
On August 14, 2018, the operations of the LTACH were relocated to a 48-bed unit within Shands’ primary hospital facility which SSH leases from Shands. Select Unit Management, Inc., a wholly owned subsidiary of SMC, provides management services to SSH. Shands accounts for the investment in SSH under the equity method of accounting. At June 30, 2019 and 2018, an investment of approximately $3,344,000 and $2,688,000, respectively, was recorded in other assets in the accompanying consolidated basic statements of net position. For the years ended June 30, 2019 and 2018, an investment gain (loss) of approximately $656,000 and ($171,000), respectively, was recorded in other nonoperating expenses, net, in the accompanying consolidated basic statements of revenues, expenses and changes in net position.
Prior to March 5, 2019, Shands owned and operated UF Health Shands Rehab Hospital (“Rehab Hospital”), a 40-bed rehabilitation hospital located in Gainesville, Florida. On March 5, 2019, Shands sold a 51% undivided interest in certain Rehab Hospital assets to Select for approximately $3,552,000. Also on March 5, 2019, Shands and Select contributed their respective shares of the Rehab Hospital assets to Archer Rehabilitation, LLC (“Archer Rehab”) as initial contributed capital to this newly formed joint venture. Shands’ capital contribution of its remaining 49% share of the Rehab Hospital assets was valued at approximately $3,412,000. Shands’ sale and contribution of the Rehab Hospital assets resulted in a gain of approximately $6,751,000 which is reported as a special item in the accompanying consolidated basic statement of revenues, expenses and changes in net position for the year ended June 30, 2019. Subsequent to March 5, 2019, Shands made additional capital investments in Archer Rehab of $6,365,000 to support its share of the estimated working capital needs of the new joint venture. For the year ended June 30, 2019, an investment loss of approximately $2,518,000 was recorded in other nonoperating expenses, net, in the accompanying consolidated basic statement of revenues, expenses and changes in net position. An investment of approximately $7,259,000, representing Shands’ 49% interest in Archer Rehab, is included in other assets in the accompanying consolidated basic statement of net position as of June 30, 2019.
Shands has a 50% interest in UF Health South Central, LLC (“South Central”). Florida Clinical Practice Association, Inc. (“FCPA”), a component unit of UF, owns the remaining 50% interest. South Central owns property in Marion County, Florida, consisting of two medical office buildings, two vacant lots, and certain medical equipment. South Central leases the medical office buildings and equipment to FCPA, which operates various clinical practices therein. Shands accounts for the investment in South Central under the equity method of accounting. At June 30, 2019 and 2018, an investment of approximately $6,856,000 and $8,135,000, respectively, was recorded in other assets in the accompanying consolidated basic statements of net position.
Prior to December 11, 2018, Shands and the University of Florida Development Corporation (“UFDC”) were members in Innovation Square, LLC (“Innovation Square”), a planned mixed-use research neighborhood that advances the national and global profile of UF with Shands and the local biotech industry. Shands’ interest in Innovation Square resulted from assets transferred to Innovation Square, net of amounts received from UFDC. On December 11, 2018, Shands sold its interest in Innovation Square to UFDC for an amount equal to its membership value, to be paid over time based on an agreed upon formula. At June 30, 2018, an investment of approximately $8,158,000 was recorded in other assets in the accompanying consolidated basic statement of net position. At June 30, 2019, a receivable of approximately $4,444,000 was recorded in other assets in the accompanying consolidated basic statement of net position. For the year ended June 30, 2019, a loss of approximately $3,714,000 was recorded in other nonoperating expenses, net, in the accompanying consolidated basic statement of revenues, expenses, and changes in net position.

Shands Teaching Hospital and Clinics, Inc. and Subsidiaries Notes to Consolidated Basic Financial Statements June 30, 2019 and 2018
24
Accrued Leave Shands provides paid time off (“PTO”) to eligible employees for vacations, holidays, and short-term illness dependent on their years of continuous service and their payroll classification. Shands accrues the estimated expense related to PTO based on pay rates currently in effect. Upon termination of employment, employees will have their eligible PTO paid in varying amounts. Accrued PTO was approximately $41,434,000 and $39,608,000 as of June 30, 2019 and 2018, respectively, and is included in accrued salaries and leave payable in the accompanying consolidated basic statements of net position.
Bond Issuance Costs Bond issuance costs are expensed at time of issuance.
Bond Premiums and Discounts Bond premiums and discounts are amortized over the period the bonds are outstanding using the effective interest method.
Long-Term Debt Long-term debt is comprised of tax exempt bond issues, taxable notes, and installment debt.
Deferred Outflows and Inflows of Resources Deferred outflows of resources represent a consumption of net assets that is applicable to a future reporting period. Deferred inflows of resources represent an acquisition of net assets that is applicable to a future reporting period. Deferred outflows of resources have a positive effect on net position, similar to assets, and deferred inflows of resources have a negative effect on net position, similar to liabilities. Notwithstanding those similarities, deferred outflows of resources are not assets and deferred inflows of resources are not liabilities and accordingly are not included in those sections of the accompanying consolidated basic statements of net position, but rather, are separately reported.
Derivative Financial Instruments Shands’ derivative financial instruments consist of interest rate swaps, which are utilized by Shands to manage net exposure to interest rate changes associated with its variable rate debt and to lower its overall borrowing costs. Shands entered into floating to fixed interest rate swap agreements to reduce the market risk associated with changes in interest rates related to certain of Shands’ variable rate revenue bonds. These derivative instruments are evaluated to determine if the derivative instrument is effective in reducing the identified financial risk. If the derivative instrument is determined to be an effective hedge, its fair value is recorded in other assets or other liabilities with a corresponding deferred outflow or inflow of resources in the accompanying consolidated basic statements of net position. Deferred outflows or inflows of resources constitute changes in fair value of effectively hedged derivative instruments. If the derivative instrument is determined to be an ineffective hedge or when there is no hedged financial instrument, the derivative instrument is considered to be an investment derivative; its fair value is recorded in other assets or other liabilities within the accompanying consolidated basic statements of net position; and the change in fair value is recognized within net investment income, including change in fair value, in the accompanying consolidated basic statements of revenues, expenses and changes in net position.
Defined Benefit Pension Plan For purposes of measuring the net pension asset or liability, deferred outflows or inflows of resources related to the defined benefit plan, and defined benefit pension expense, information about the fiduciary net position of the Shands HealthCare Pension Plan II (the “Plan”) and additions

Shands Teaching Hospital and Clinics, Inc. and Subsidiaries Notes to Consolidated Basic Financial Statements June 30, 2019 and 2018
25
to and deductions from the Plan’s fiduciary net position have been determined on the same basis as they are reported to the Plan. For this purpose, benefit payments are recognized when due and payable in accordance with the benefit terms. Investments are reported at fair value.
Net Position Net position is categorized as “net investment in capital assets,” “restricted-nonexpendable,” “restricted-expendable,” and “unrestricted.” Net investment in capital assets is intended to reflect the portion of net position associated with capital assets, less outstanding balances due on borrowings used to finance the purchase or construction of those assets. Unspent debt proceeds are excluded from the calculation of net investment in capital assets and are included in unrestricted net position, unless the unspent amounts are externally restricted. Restricted net position has restrictions placed on the use of assets through external constraints imposed by donors. Restricted–nonexpendable net position consists of assets that have been restricted by donors to be maintained by Shands in perpetuity. Restricted–expendable net position includes assets whose use by Shands has been limited by donors to a specific time period or purpose. Unrestricted net position consists of net assets that do not meet the definition of net investment in capital assets and have no external restrictions on use.
Revenues and Expenses Shands’ consolidated basic statements of revenues, expenses and changes in net position distinguish between operating and nonoperating revenues and expenses. Operating revenues result from exchange transactions associated with providing health care services, Shands’ principal activity. Operating expenses are all expenses incurred to provide health care services. State appropriations, interest expense, net investment income, including change in fair value, and gain on disposal of capital assets are reported as nonoperating revenues (expenses).
Net Patient Service Revenue and Patient Accounts Receivable Shands has agreements with Medicare, Medicaid, and other third-party payors that provide for payments to Shands at amounts different from its established rates. Payment arrangements vary significantly and include but are not limited to prospectively determined rates per discharge, reimbursed costs, discounted charges, and per diem payments. Net patient service revenue and patient accounts receivable are reported at estimated net realizable amounts from patients, third-party payors, and others for services rendered and include estimated retroactive revenue adjustments due to future audits, reviews, and investigations. Retroactive adjustments are considered in the recognition of revenue on an estimated basis in the period the related services are rendered, and such amounts are adjusted in future periods as adjustments become known or as years are no longer subject to such audits, reviews, and investigations. For the years ended June 30, 2019 and 2018, net patient service revenue increased by approximately $133,000 and $622,000, respectively, due to such adjustments.
Laws and regulations governing the Medicare and Medicaid programs are complex and subject to interpretation. As a result, there is at least a reasonable possibility that recorded estimates will change by a material amount in the near term. It is management’s opinion that the estimated amounts, which are recorded as current liabilities in the accompanying basic statements of net position, represent the best estimate to date of the estimated liability for settlements of outstanding Medicare and Medicaid cost reports.

Shands Teaching Hospital and Clinics, Inc. and Subsidiaries Notes to Consolidated Basic Financial Statements June 30, 2019 and 2018
26
Medicare Shands participates in the federal Medicare program. Approximately 35% and 34% of Shands’ net patient service revenue for the years ended June 30, 2019 and 2018, respectively, was derived from services to Medicare beneficiaries. Inpatient acute care services rendered to Medicare beneficiaries are reimbursed at prospectively determined rates per discharge. These rates vary according to a patient classification system that is based on clinical, diagnostic, and other factors.
Inpatient non-acute services, outpatient services, and defined capital costs related to Medicare beneficiaries are reimbursed based upon a prospective reimbursement methodology. Shands is paid for certain reimbursable services at a tentative rate with final settlement determined after submission of annual cost reports by Shands and audits by the Medicare fiscal intermediary. Shands’ classification of patients under the Medicare program and the appropriateness of their admission are subject to an independent review. As of June 30, 2019, the Medicare cost reports were final settled by Shands’ Medicare fiscal intermediary through June 30, 2008.
Medicaid Shands participates in the State of Florida Medicaid program. The Agency for Health Care Administration is the administrator of the Statewide Medicaid Managed Care Managed Medical Assistance (“MMA”) Program in the State of Florida. The MMA program is comprised of several types of managed care plans including Health Maintenance Organizations, Provider Service Networks, and Children’s Medical Services Network. The majority of Medicaid beneficiaries are required to enroll in the MMA program. Approximately 18% of Shands’ net patient service revenue for the years ended June 30, 2019 and 2018 was derived from services to Medicaid beneficiaries. Inpatient services rendered to Medicaid program beneficiaries are reimbursed at prospectively determined rates per discharge and outpatient services are reimbursed at prospectively determined rates based upon Enhanced Ambulatory Patient Groupings (“EAPGs”).
In addition to the prospectively determined rates per discharge and EAPG payments received by Shands for the provision of health care services to Medicaid beneficiaries, the State of Florida provides supplemental Medicaid and disproportionate share payments to reflect the additional costs associated with treating the Medicaid population in Florida. These amounts are reflected in net patient service revenue in the accompanying consolidated basic statements of revenues, expenses and changes in net position. As of June 30, 2019, the Medicaid cost reports have been audited by the Medicaid fiscal intermediary through June 30, 2015.
Other Third-Party Payors Shands has also entered into reimbursement agreements with certain commercial insurance carriers, health maintenance organizations, and preferred provider organizations. The basis for reimbursement under these agreements vary significantly and include but are not limited to prospectively determined rates per discharge, discounts from established charges and prospectively determined per diem rates.
Provision for Bad Debts and Allowance for Uncollectible Accounts The provision for bad debts is based on management’s assessment of historical and expected net collections, considering business and economic conditions, trends in federal and state governmental health care coverage, and other collection indicators. Throughout the year, management assesses the adequacy of the allowance for uncollectible accounts based upon these trends. The results of this review are then used to make any modification to the provision for bad debts to establish an appropriate allowance for uncollectible accounts. Patient accounts receivable are written off after collection efforts have been followed under Shands’ policies.

Shands Teaching Hospital and Clinics, Inc. and Subsidiaries Notes to Consolidated Basic Financial Statements June 30, 2019 and 2018
27
Accounting Pronouncements In November 2016, the GASB issued GASB Statement No. 83, Certain Asset Retirement Obligations (“GASB No. 83”). GASB No. 83 addresses accounting and financial reporting for certain asset retirement obligations which are legally enforceable liabilities associated with the retirement of a tangible capital asset. GASB No. 83 is effective for reporting periods beginning after June 15, 2018. Shands adopted GASB No. 83 in the consolidated basic financial statements for the year ended June 30, 2019. The adoption of this statement did not have a material impact on the consolidated basic financial statements.
In January 2017, the GASB issued GASB Statement No. 84, Fiduciary Activities (“GASB No. 84”). The principal objective of GASB No. 84 is to enhance the consistency and comparability of fiduciary activity reporting by state and local governments. GASB No. 84 is effective for reporting periods beginning after December 15, 2018. Shands is currently evaluating the impact GASB No. 84 will have on its consolidated basic financial statements.
In June 2017, the GASB issued GASB Statement No. 87, Leases (“GASB No. 87”). GASB No. 87 establishes standards of accounting and financial reporting by lessees and lessors. GASB No. 87 will require a lessee to recognize a lease liability and an intangible right-to-use lease asset at the commencement of the lease term, with certain exceptions, and will require a lessor to recognize a lease receivable and a deferred inflow of resources at the commencement of the lease term, with certain exceptions. GASB No. 87 is effective for reporting periods beginning after December 15, 2019. Shands is currently evaluating the impact GASB No. 87 will have on its consolidated basic financial statements.
In April 2018, the GASB issued GASB Statement No. 88, Certain Disclosures Related to Debt, Including Direct Borrowings and Direct Placements (“GASB No. 88”). GASB No. 88 requires additional information related to debt to be disclosed in notes to the financial statements. GASB No. 88 is effective for reporting periods beginning after June 15, 2018. Shands adopted GASB No. 88 in the consolidated basic financial statements for the year ended June 30, 2019. The adoption of this statement did not have a material impact on the consolidated basic financial statements.
In June 2018, the GASB issued GASB Statement No. 89, Accounting for Interest Cost Incurred before the End of a Construction Period (“GASB No. 89”). Upon adoption of GASB No. 89, interest cost incurred before the end of a construction period will be recognized as an expense in the period in which the cost is incurred. GASB No. 89 is effective for reporting periods beginning after December 15, 2019. Shands is currently evaluating the impact GASB No. 89 will have on its consolidated basic financial statements.
In August 2018, the GASB issued GASB Statement No. 90, Majority Equity Interests-an amendment of GASB Statements No. 14 and No. 61 (“GASB No. 90”). The primary objective of GASB No. 90 is to improve the consistency and comparability of reporting a government’s majority equity interest in a legally separate organization and to improve the relevance of financial statement information for certain component units. GASB No. 90 is effective for reporting periods beginning after December 15, 2018. Shands is currently evaluating the impact GASB No. 90 will have on its consolidated basic financial statements.
Shands Teaching Hospital and Clinics, Inc. and Subsidiaries Notes to Consolidated Basic Financial Statements June 30, 2019 and 2018
28
In May 2019, the GASB issued GASB Statement No. 91, Conduit Debt Obligations (“GASB No. 91”). GASB No. 91 clarifies the existing definition of a conduit debt obligation, establishes that a conduit debt obligation is not a liability of the issuer, and establishes standards for accounting and financial reporting of additional and voluntary commitments extended by issuers and arrangements associated with conduit debt obligations. GASB No. 91 is effective for reporting periods beginning after December 15, 2020. Shands is currently evaluating the impact GASB No. 91 will have on its consolidated basic financial statements.
3. Unsponsored Community Benefit
Community benefit is a planned, managed, organized, and measured approach to a health care organization’s participation in meeting identified community health needs. It involves collaboration with a “community” to “benefit” its residents, particularly the poor and other underserved groups, by improving health status and quality of life. Community benefit projects and services are identified by health care organizations in response to findings of a community health assessment, strategic and/or clinical priorities, and partnership areas of attention.
Community benefit categories include financial assistance, community health services, health professions education, research, and donations. Shands has a long history of providing community benefits and has quantified these benefits using national guidelines.
Shands has policies for providing financial assistance for patients requiring care but who have limited or no means to pay for that care. These policies provide free or discounted health and health-related services to persons who qualify under certain income and asset criteria. Because Shands does not pursue collection of amounts determined to qualify for financial assistance, they are not reported as net patient service revenue. Shands maintains records to identify and monitor the level of financial assistance it provides. Charges foregone for services provided under Shands’ financial assistance policy as a percentage of total charges for the years ended June 30, 2019 and 2018 were approximately 5.1% and 4.4%, respectively.
In addition to financial assistance, Shands provides benefits for the broader community. The cost of providing these community benefits can exceed the revenue sources available. Examples of the benefits provided by Shands and general definitions regarding those benefits are described below:
Community health services include activities carried out to improve community health. They extend beyond patient care activities and are usually subsidized by the health care organization. Examples include community health education, counseling and support services, and health care screenings.
Health professions education includes education provided in clinical settings such as internships and programs for physicians, nurses, and allied health professionals. It also includes scholarships for health professional education related to providing community health improvement services and specialty in-service programs to professionals in the community.
Research includes studies on health care delivery, unreimbursed studies on therapeutic protocols, evaluation of innovative treatments, and research papers prepared for professional journals.
Donations include funds and in-kind services benefiting the community-at-large.

Shands Teaching Hospital and Clinics, Inc. and Subsidiaries Notes to Consolidated Basic Financial Statements June 30, 2019 and 2018
29
Shands’ valuation of unsponsored community benefits at estimated cost for the years ended June 30, 2019 and 2018 is as follows:
(in thousands of dollars) 2019 2018
Financial assistance provided 76,761$ 62,423$ Government support applied to charity care (1,000) (1,000)
Net unreimbursed financial assistance 75,761 61,423
Benefits for the broader communityCommunity health services 5,650 8,613Health professions education 24,574 38,467Research 14,984 18,379Donations 1,422 2,364
Total quantifiable benefits for the broader community 46,630 67,823
Total unsponsored community benefits 122,391$ 129,246$
The estimated cost of financial assistance provided was determined by applying Shands’ overall cost to charge ratio to total charges foregone. Cost of benefits for the broader community represents actual expenses incurred.
Shands also plays a leadership role in the communities it serves by providing additional community benefits that have not been quantified. This role includes serving as a state designated Level I trauma center in Gainesville, Florida. Shands also maintains air ambulance services at its trauma center, as well as a regional burn intensive care unit to help meet the emergency needs of citizens. Other specialty services provided at Shands’ facilities include transplant centers for adult and pediatric patients in several disciplines including: heart, lung, liver, kidney, and bone marrow. In addition, Shands provides specialized pediatric services including neonatal intensive care, pediatric intensive care, pediatric open heart and cardiac catheterization.
In addition to the community benefits described above, Shands provides benefits to the community through advocacy of community service by employees. Shands employees serve numerous organizations through board representation, in-kind and direct donations, fund-raising, youth sponsorship, and other related activities.

Shands Teaching Hospital and Clinics, Inc. and Subsidiaries Notes to Consolidated Basic Financial Statements June 30, 2019 and 2018
30
4. Investments
Investments are reported in the accompanying consolidated basic statements of net position as follows at June 30, 2019 and 2018:
(in thousands of dollars) 2019 2018
Current assetsShort-term investments 14,539$ 122,200$ Assets whose use is limited, current portion 25,630 32,469
40,169 154,669
Long-term assetsAssets whose use is limited, less current portion 559,489 515,538 Assets whose use is restricted 40,165 28,180
639,823$ 698,387$
Assets whose use is limited include investments internally designated by the Board for capital improvements and debt service.
Assets whose use is restricted are comprised of the following at June 30, 2019 and 2018:
(in thousands of dollars) 2019 2018
Held by trustees under indenture agreements 13,705$ 13,086$ Held by counterparty under interest rate swap agreements 26,410 15,044Held by insurance company under escrow agreement 50 50
40,165$ 28,180$
Pooled Investments Shands, along with certain related organizations, participates in a pooled investment program, managed by the University of Florida Investment Corporation (“UFICO”), a direct support organization of UF, through a management agreement. Participants acquire membership units in one or more of the Pooled Investment Funds and share in the investment income, expenses, gains and losses of each Pooled Investment Fund based on their proportionate share, as determined by membership units. The fair value of the position in the pool is the same as the value of the pool shares. The Pooled Investment Funds are not registered with the Securities and Exchange Commission as an investment company.
Shands holds membership units in the following Pooled Investment Funds:
Florida Global Fixed Income Fund, LLC, which invests in domestic and international fixed income securities including intermediate government and corporate bonds;
Florida Global Equity Fund, LLC, which invests in domestic and international equity and securities and equity funds; and
Florida Hedged Strategies Fund, LLC, which invests in domestic and international hedge funds and exchange traded funds.

Shands Teaching Hospital and Clinics, Inc. and Subsidiaries Notes to Consolidated Basic Financial Statements June 30, 2019 and 2018
31
Direct Investments Shands invests in various fixed income mutual funds.
The Florida State Treasury operates a special investment program for public entities and is called the Special Purpose Investment Account (“SPIA”). The SPIA funds are combined with State Funds and are invested as part of the Florida Treasury Investment Pool. Shands maintains a direct investment in SPIA.
In addition, Shands has a direct investment in Pantheon USA Fund V, L.P., a private equity fund whose investments include limited partnerships which invest in diversified buyout, growth equity and venture capital portfolios.
The maturity of investments at June 30, 2019 is as follows:
(in thousands of dollars)Fair Less Than
Value 1 Year 1–5 Years 6–10 Years N/A
Pooled Investments:Florida Global Fixed Income Fund, LLC 200,183$ -$ -$ -$ 200,183$ Florida Global Equity Fund, LLC 291,177 - - - 291,177Florida Hedged Strategies Fund, LLC 93,810 - - - 93,810
585,170 - - - 585,170
Direct Investments:Fixed income mutual fund 13,754 - - 13,754 -SPIA 14,296 - 14,296 - -Pantheon USA Fund V, L.P. 143 - - - 143Money market funds 50 50 - - -Cash collateral on deposit with interest
rate swap counterparty 26,410 26,410 - - -
54,653 26,460 14,296 13,754 143
639,823$ 26,460$ 14,296$ 13,754$ 585,313$
Investment Maturities
The maturity of investments at June 30, 2018 is as follows:
(in thousands of dollars)Fair Less Than
Value 1 Year 1–5 Years 6–10 Years N/A
Pooled Investments:Florida Global Fixed Income Fund, LLC 197,544$ -$ -$ -$ 197,544$ Florida Global Equity Fund, LLC 268,671 - - - 268,671Florida Hedged Strategies Fund, LLC 81,839 - - - 81,839
548,054 - - - 548,054
Direct Investments:Fixed income mutual funds 31,394 - 8,655 22,739 -SPIA 103,542 - 103,542 - -Pantheon USA Fund V, L.P. 303 - - - 303Money market funds 50 50 - - -Cash collateral on deposit with interest
rate swap counterparty 15,044 15,044 - - -
150,333 15,094 112,197 22,739 303
698,387$ 15,094$ 112,197$ 22,739$ 548,357$
Investment Maturities

Shands Teaching Hospital and Clinics, Inc. and Subsidiaries Notes to Consolidated Basic Financial Statements June 30, 2019 and 2018
32
Investment Risk Factors There are many factors that can affect the value of investments. Some, such as concentration of credit risk, custodial credit risk, interest rate risk and foreign currency risk, may affect both equity and fixed income securities. Equity securities respond to such factors as economic conditions, individual company earnings performance and market liquidity, while fixed income securities may be sensitive to credit risk and changes in interest rates.
Credit Risk This is the risk that an issuer or other counterparty to an investment will not fulfill its obligations. Shands’ investment policy provides guidelines for its fund managers and lists specific allowable investments. The policy provides for the utilization of varying styles of managers so that portfolio diversification is maximized and total portfolio efficiency is enhanced.
The credit risk profile of Shands’ investments as of June 30, 2019 is as follows:
(in thousands of dollars)Fair
Value AA-f N/A
Pooled Investments:Florida Global Fixed Income Fund, LLC 200,183$ -$ 200,183$ Florida Global Equity Fund, LLC 291,177 - 291,177Florida Hedged Strategies Fund, LLC 93,810 - 93,810
585,170 - 585,170
Direct Investments:Fixed income mutual fund 13,754 - 13,754SPIA 14,296 14,296 -Pantheon USA Fund V, L.P. 143 - 143Money market funds 50 - 50Cash collateral on deposit with interest
rate swap counterparty 26,410 - 26,410
54,653 14,296 40,357
639,823$ 14,296$ 625,527$
Ratings
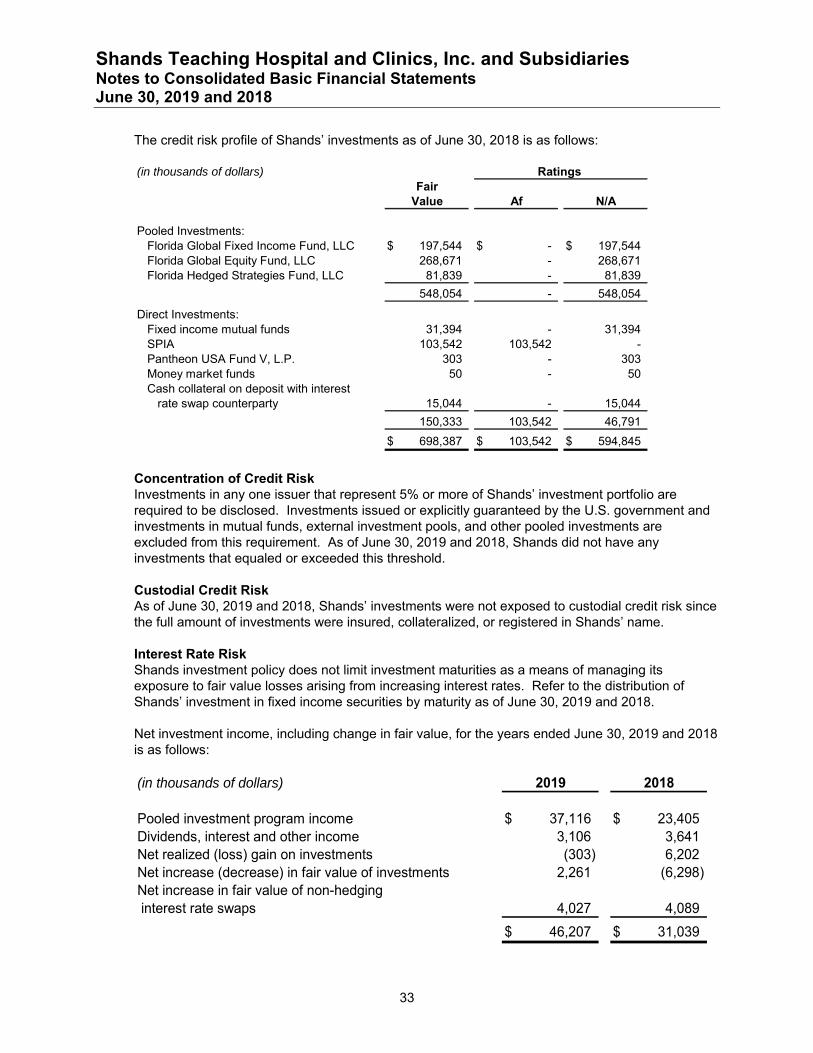
Shands Teaching Hospital and Clinics, Inc. and Subsidiaries Notes to Consolidated Basic Financial Statements June 30, 2019 and 2018
33
The credit risk profile of Shands’ investments as of June 30, 2018 is as follows:
(in thousands of dollars)Fair
Value Af N/A
Pooled Investments:Florida Global Fixed Income Fund, LLC 197,544$ -$ 197,544$ Florida Global Equity Fund, LLC 268,671 - 268,671Florida Hedged Strategies Fund, LLC 81,839 - 81,839
548,054 - 548,054
Direct Investments:Fixed income mutual funds 31,394 - 31,394SPIA 103,542 103,542 -Pantheon USA Fund V, L.P. 303 - 303Money market funds 50 - 50Cash collateral on deposit with interest
rate swap counterparty 15,044 - 15,044
150,333 103,542 46,791
698,387$ 103,542$ 594,845$
Ratings
Concentration of Credit Risk Investments in any one issuer that represent 5% or more of Shands’ investment portfolio are required to be disclosed. Investments issued or explicitly guaranteed by the U.S. government and investments in mutual funds, external investment pools, and other pooled investments are excluded from this requirement. As of June 30, 2019 and 2018, Shands did not have any investments that equaled or exceeded this threshold.
Custodial Credit Risk As of June 30, 2019 and 2018, Shands’ investments were not exposed to custodial credit risk since the full amount of investments were insured, collateralized, or registered in Shands’ name.
Interest Rate Risk Shands investment policy does not limit investment maturities as a means of managing its exposure to fair value losses arising from increasing interest rates. Refer to the distribution of Shands’ investment in fixed income securities by maturity as of June 30, 2019 and 2018.
Net investment income, including change in fair value, for the years ended June 30, 2019 and 2018 is as follows:
(in thousands of dollars) 2019 2018
Pooled investment program income 37,116$ 23,405$ Dividends, interest and other income 3,106 3,641 Net realized (loss) gain on investments (303) 6,202Net increase (decrease) in fair value of investments 2,261 (6,298)Net increase in fair value of non-hedging interest rate swaps 4,027 4,089
46,207$ 31,039$
Shands Teaching Hospital and Clinics, Inc. and Subsidiaries Notes to Consolidated Basic Financial Statements June 30, 2019 and 2018
34
The calculation of net realized (loss) gain on investments is independent of the calculation of the net increase (decrease) in fair value of investments. Realized gains and losses on investments that had been held in more than one fiscal year and sold in the current year are included as net increase (decrease) in fair value of investments in the prior years and the current year.
5. Fair Value
Shands categorizes its fair value measurements within the fair value hierarchy. The hierarchy is summarized in the three broad levels listed below:
Level 1 – quoted prices in active markets for identical securities.
Level 2 – other significant observable inputs (including quoted prices for similar investments, interest rates, credit risks, etc.).
Level 3 – significant unobservable inputs (including Shands’ own assumptions in determining the fair value of investments).
Fixed income mutual funds classified in Level 1 of the fair value hierarchy are valued at quoted market prices for identical securities in active markets.
Shands’ investments in Pooled Investment Funds are measured at the net asset value (“NAV”) per share or its equivalent. Shands can redeem up to 90% of its investment in any Pooled Investment Fund with 45 days’ notice, and under certain conditions, including liquidity needs, can redeem all of its investments with three business days notice.
Shands’ investment in SPIA is measured at the NAV per share or its equivalent. SPIA invests in a combination of short-term liquid instruments and intermediate fixed income securities. A maximum of 40% can be redeemed with 5 days notice including $20,000,000 with same day notice. The remaining 60% can be redeemed with 6 months notice. The 6 months notice can be waived by SPIA administration upon request.
Shands’ investment in Pantheon USA Fund V, L.P. is measured at the NAV per share or its equivalent. Redemptions are allowable only to the extent of distributions received from the fund’s underlying fund investments. It is expected that the underlying assets of the fund will be liquidated over the next 2 years. The remaining unfunded commitment as of June 30, 2019 is approximately $156,000.
Shands’ interest rate swaps are classified in Level 2 of the fair value hierarchy. The fair values of the fixed rate payer interest rate swaps are estimated using the zero-coupon discounting method. This method calculates the future payments required by the interest rate swap, assuming the current forward rates implied by the yield curve are the market’s best estimate of future spot interest rates. These payments are then discounted using the spot rates implied by the current yield curve for a hypothetical zero-coupon bond due on the date of each future net settlement payment on the interest rate swaps. The fair values of the 2007A and 2007B total return swaps are estimated by multiplying each total return swap’s notional amount by the difference between the base price and the current fair value of the underlying bonds. As the Series 2007A Bonds and Series 2007B Bonds are not actively trading, to replicate the fair value of these bonds, the prices were implied by applying a credit spread adjustment based on bonds with similar terms and similar issuers that are trading in active markets. Fair value of the interest rate swaps are included in Note 8.

Shands Teaching Hospital and Clinics, Inc. and Subsidiaries Notes to Consolidated Basic Financial Statements June 30, 2019 and 2018
35
Shands’ long-term debt is classified in Level 2 of the fair value hierarchy. The fair value of fixed rate debt is estimated based on dealer quotes for hospital taxable and tax-exempt debt with similar terms and maturities and using discounted cash flow analyses based on current interest rates for similar types of borrowing arrangements. The fair value of variable rate debt approximates its carrying value. The carrying value of Shands’ long-term debt was approximately $810,882,000 and $825,222,000 at June 30, 2019 and 2018, respectively. The fair value was approximately $827,267,000 and $823,826,000 at June 30, 2019 and 2018, respectively.
6. Capital Assets
A summary of changes in capital assets during fiscal years 2019 and 2018 is as follows:
(in thousands of dollars) Balance at Disposals Balance atJune 30, and June 30,
2018 Additions Transfers 2019 Land 49,701$ -$ -$ 49,701$ Buildings and leasehold improvements 1,202,450 33,223 (1,474) 1,234,199Equipment 586,419 30,935 (14,812) 602,542
Totals at historical cost 1,838,570 64,158 (16,286) 1,886,442
Less accumulated depreciation for: Buildings and leasehold improvements (389,330) (37,646) 752 (426,224) Equipment (409,058) (46,461) 13,958 (441,561)
(798,388) (84,107) 14,710 (867,785)
Construction-in-progress 25,515 71,689 (34,193) 63,011
Capital assets, net 1,065,697$ 51,740$ (35,769)$ 1,081,668$
(in thousands of dollars) Balance at Disposals Balance atJune 30, and June 30,
2017 Additions Transfers 2018 Land 49,701$ -$ -$ 49,701$ Buildings and leasehold improvements 883,669 319,126 (345) 1,202,450Equipment 470,734 120,911 (5,226) 586,419
Totals at historical cost 1,404,104 440,037 (5,571) 1,838,570
Less accumulated depreciation for: Buildings and leasehold improvements (357,356) (32,296) 322 (389,330) Equipment (374,934) (39,242) 5,118 (409,058)
(732,290) (71,538) 5,440 (798,388)
Construction-in-progress 309,347 122,101 (405,933) 25,515
Capital assets, net 981,161$ 490,600$ (406,064)$ 1,065,697$
Depreciation and amortization expense (excluding amortization of goodwill) was approximately $84,107,000 and $71,538,000 for the years ended June 30, 2019 and 2018, respectively. Amortization expense on equipment under capital leases was approximately $653,000 and $286,000 for the years ended June 30, 2019 and 2018, respectively. Interest costs capitalized were approximately $1,182,000 and $5,659,000 for the years ended June 30, 2019 and 2018, respectively. For the years ended June 30, 2019 and 2018, fully depreciated capital assets with an original cost of approximately $14,073,000 and $4,786,000, respectively, were disposed of and are no longer in service. Construction-in-progress at June 30, 2019 consists primarily of costs incurred for hospital building renovations and other related projects.

Shands Teaching Hospital and Clinics, Inc. and Subsidiaries Notes to Consolidated Basic Financial Statements June 30, 2019 and 2018
36
7. Long-Term Debt
Long-term debt is comprised of the following at June 30:
(in thousands of dollars) 2019 2018
Health Facilities Tax Exempt Revenue Bonds:General Obligation Bonds:
Series 2007A, final maturity December 2037 100,395$ 100,395$ Series 2007B, final maturity December 2037 35,000 35,000Series 2008A, final maturity December 2037 49,990 49,990Series 2014A, final maturity December 2044 250,000 250,000Series 2014B, final maturity December 2034 50,000 50,000
485,385 485,385Direct Placement Bonds:
Series 2008C, final maturity October 2028 35,625 39,375Series 2010A, final maturity July 2025 42,158 45,340Series 2012A, final maturity December 2037 28,620 28,965Series 2012B, final maturity December 2037 31,275 31,650Series 2016A, final maturity December 2030 42,720 46,600
180,398 191,930
665,783 677,315
Taxable Notes:General Obligation Notes:
Series 2013A, final maturity December 2042 125,000 125,000
Direct Placement Note: Bank Note Payable, final maturity March 2019 - 1,140
125,000 126,140
Installment debt, final maturity June 2024 2,465 3,123
793,248 806,578
Net unamortized bond premium 17,634 18,644
Total long-term debt 810,882 825,222
Less: Current portion (13,287) (14,341)
Long-term portion 797,595$ 810,881$

Shands Teaching Hospital and Clinics, Inc. and Subsidiaries Notes to Consolidated Basic Financial Statements June 30, 2019 and 2018
37
Changes in Shands’ long-term debt, excluding unamortized discounts or premiums were as follows:
(in thousands of dollars) Balance at Balance at AmountsJune 30, June 30, Due Within
2018 Additions Reductions 2019 One Year
Health Facilities Tax Exempt Revenue Bonds:General Obligation Bonds:
Series 2007A, final maturity December 2037 100,395$ -$ -$ 100,395$ -$ Series 2007B, final maturity December 2037 35,000 - - 35,000 -Series 2008A, final maturity December 2037 49,990 - - 49,990 -Series 2014A, final maturity December 2044 250,000 - - 250,000 -Series 2014B, final maturity December 2034 50,000 - - 50,000 -
485,385 - - 485,385 -Direct Placement Bonds:
Series 2008C, final maturity October 2028 39,375 - (3,750) 35,625 3,750Series 2010A, final maturity July 2025 45,340 - (3,182) 42,158 3,182Series 2012A, final maturity December 2037 28,965 - (345) 28,620 360Series 2012B, final maturity December 2037 31,650 - (375) 31,275 390Series 2016A, final maturity December 2030 46,600 - (3,880) 42,720 3,925
191,930 - (11,532) 180,398 11,607677,315 - (11,532) 665,783 11,607
Taxable Notes:General Obligation Notes:
Series 2013A, final maturity December 2042 125,000 - - 125,000 -Direct Placement Note: Bank Note Payable, final maturity March 2019 1,140 - (1,140) - -
126,140 - (1,140) 125,000 -Installment debt, final maturity June 2024 3,123 - (658) 2,465 669
Total long-term debt 806,578$ -$ (13,330)$ 793,248$ 12,276$
(in thousands of dollars) Balance at Balance at AmountsJune 30, June 30, Due Within
2017 Additions Reductions 2018 One Year
Health Facilities Tax Exempt Revenue Bonds:General Obligation Bonds:
Series 2007A, final maturity December 2037 100,395$ -$ -$ 100,395$ -$ Series 2007B, final maturity December 2037 35,000 - - 35,000 -Series 2008A, final maturity December 2037 49,990 - - 49,990 -Series 2014A, final maturity December 2044 250,000 - - 250,000 -Series 2014B, final maturity December 2034 50,000 - - 50,000 -
485,385 - - 485,385 -Direct Placement Bonds:
Series 2008C, final maturity October 2028 43,125 - (3,750) 39,375 3,750Series 2010A, final maturity July 2025 48,523 - (3,183) 45,340 3,182Series 2012A, final maturity December 2037 32,365 - (3,400) 28,965 345Series 2012B, final maturity December 2037 35,360 - (3,710) 31,650 375Series 2016A, final maturity December 2030 46,600 - - 46,600 3,880
205,973 - (14,043) 191,930 11,532691,358 - (14,043) 677,315 11,532
Taxable Notes:General Obligation Notes:
Series 2013A, final maturity December 2042 125,000 - - 125,000 -Direct Placement Note: Bank Note Payable, final maturity March 2019 2,640 - (1,500) 1,140 1,140
127,640 - (1,500) 126,140 1,140Installment debt, final maturity June 2024 3,769 - (646) 3,123 658
Total long-term debt 822,767$ -$ (16,189)$ 806,578$ 13,330$

Shands Teaching Hospital and Clinics, Inc. and Subsidiaries Notes to Consolidated Basic Financial Statements June 30, 2019 and 2018
38
The current portion of net unamortized bond premium was approximately $1,011,000 as of June 30, 2019 and 2018.
Maturities of long-term debt, including corresponding interest, over the next five years and in five-year increments thereafter are as follows:
(in thousands of dollars)
Year EndingJune 30, General Obligation
Bonds and Notes Direct Placement Bonds Installment DebtPrincipal Interest Principal Interest Principal Interest Principal Interest
2020 -$ 24,617$ 11,607$ 4,616$ 669$ 36$ 12,276$ 29,269$ 2021 - 24,617 11,687 4,296 680 25 12,367 28,938 2022 - 24,617 12,096 3,975 367 13 12,463 28,605 2023 - 24,617 12,236 3,647 372 8 12,608 28,272 2024 - 24,617 10,272 3,342 377 3 10,649 27,962 2025-2029 23,970 120,660 78,340 10,359 - - 102,310 131,019 2030-2034 82,870 114,365 27,575 3,189 - - 110,445 117,554 2035-2039 176,855 88,686 16,585 834 - - 193,440 89,520 2040-2044 281,150 51,522 - - - - 281,150 51,522 2045-2049 45,540 1,089 - - - - 45,540 1,089
610,385$ 499,407$ 180,398$ 34,258$ 2,465$ 85$ 793,248$ 533,750$
Total Debt Service
Cash paid for interest, net of amounts capitalized, was approximately $31,906,000 and $27,241,000 for the years ended June 30, 2019 and 2018, respectively.
Shands entered into a Master Trust Indenture (“MTI”) with U.S. Bank, National Association (“U.S. Bank”) which serves as the primary financing document for Shands excluding Elder Care, Southeastern, and UF Health Florida Recovery Center. All of Shands’ long-term debt is covered by the MTI with the exception of installment debt. Under the terms of the MTI, Shands has pledged a security interest in its gross revenues. The MTI provides for specific restrictive covenants, including a debt service coverage requirement. Shands was in compliance with all such restrictive covenants as of June 30, 2019 and 2018. The direct placement bonds require certain minimum bond ratings and certain financial ratio covenants in order to avoid an event of default. If Shands fails to pay any principal amounts when due or if an event of default occurs, the lender can accelerate payment of the entire amount of principal due immediately.
General Obligation Bonds and Notes
Series 2007A Health Facilities Revenue Bonds and Series 2007B Health Facilities Revenue Refunding Bonds In March 2007, the Alachua County Health Facilities Authority (“Authority”) issued the Series 2007A Health Facilities Revenue Bonds (“Series 2007A Bonds”) and the Series 2007B Health Facilities Revenue Refunding Bonds (“Series 2007B Bonds”) on behalf of Shands. The proceeds of the Series 2007A Bonds were used to finance capital improvement projects and pay related costs of issuance. The proceeds of the Series 2007B Bonds were used to partially refund outstanding principal of the Series 1996A Health Facilities Revenue Bonds and pay related costs of issuance.
The Series 2007A Bonds and Series 2007B Bonds are variable rate bonds based upon 67% of three month London Interbank Offered Rate (“LIBOR”) plus 0.87%. The interest rate on the bonds is reset quarterly and the interest rate was 2.56% and 2.41% at June 30, 2019 and 2018, respectively. The Series 2007A Bonds and Series 2007B Bonds maturing on or after June 1, 2017 are redeemable at Shands’ option at par value.
Shands Teaching Hospital and Clinics, Inc. and Subsidiaries Notes to Consolidated Basic Financial Statements June 30, 2019 and 2018
39
Series 2008A Health Facilities Revenue Bonds In June 2008, the Authority issued the Series 2008A Health Facilities Revenue Bonds (“Series 2008A Bonds”) on behalf of Shands. The proceeds of the Series 2008A Bonds were used to retire the Series 2007C Health Facilities Revenue Bonds.
The Series 2008A Bonds are variable rate bonds issued in the Unit Pricing Mode. Interest periods range from 1 to 270 days. The weighted average interest rate on the Series 2008A Bonds was 1.45% and 1.23% at June 30, 2019 and 2018, respectively. The Series 2008A Bonds are backed by a bank letter of credit for approximately $53,893,000 that expires in January 2024. There were no amounts outstanding under this letter of credit at June 30, 2019 and 2018. The Series 2008A Bonds are redeemable at the option of Shands at par value plus accrued interest at any interest payment date.
Series 2013A Taxable Notes In March 2013, Shands issued the Series 2013A Taxable Notes (“Series 2013A Notes”). The proceeds of the Series 2013A Notes were used to finance capital improvement projects, other business purposes, and pay related costs of issuance.
The interest rate on the Series 2013A Notes is fixed at 4.741% and is payable semiannually.
Series 2014A and Series 2014B Health Facilities Revenue Bonds In October 2014, the Authority issued the Series 2014A Health Facilities Revenue Bonds (“Series 2014A Bonds”) and the Series 2014B Health Facilities Revenue Bonds (“Series 2014B Bonds”) on behalf of Shands. The proceeds of the Series 2014A Bonds and Series 2014B Bonds were used to finance capital improvement projects and pay related costs of issuance.
The Series 2014A Bonds and Series 2014B Bonds are unenhanced fixed rate bonds. Interest rates on the Series 2014A Bonds range from 4.00% to 5.00% and the interest rate on the Series 2014B Bonds is 5.00%. Interest on the Series 2014A Bonds and Series 2014B Bonds is payable semiannually. The Series 2014A Bonds and Series 2014B Bonds maturing on or after December 1, 2024 are redeemable at Shands’ option at par value.
Direct Placement Bonds and Note Series 2008C Health Facilities Revenue Bonds In November 2008, the Authority issued the Series 2008C Health Facilities Revenue Bonds (“Series 2008C Bonds”) on behalf of Shands. The proceeds of the Series 2008C Bonds were used to refund the Series 1996B Health Facilities Revenue Bonds and pay related costs of issuance.
The Series 2008C Bonds are variable rate bonds based upon 65% of one month LIBOR plus 1.30%. The interest rate on the Series 2008C Bonds was 2.89% and 2.59% at June 30, 2019 and 2018, respectively.
Series 2010A Health Facilities Revenue Bonds In June 2010, the Authority issued the Series 2010A Health Facilities Revenue Bonds (“Series 2010A Bonds”) on behalf of Shands. The proceeds of the Series 2010A Bonds were used to finance capital improvement projects and pay related costs of issuance.
The Series 2010A Bonds are variable rate bonds based upon 65% of one month LIBOR plus 1.105% with a minimum rate floor of 1.29%. The interest rate on the Series 2010A Bonds was 2.69% and 2.39% at June 30, 2019 and 2018, respectively.
Shands Teaching Hospital and Clinics, Inc. and Subsidiaries Notes to Consolidated Basic Financial Statements June 30, 2019 and 2018
40
Series 2012A and Series 2012B Health Facilities Revenue Bonds In December 2012, the Authority issued the Series 2012A Health Facilities Revenue Bonds (“Series 2012A Bonds”) and the Series 2012B Health Facilities Revenue Bonds (“Series 2012B Bonds”) on behalf of Shands. The proceeds of the Series 2012A Bonds and Series 2012B Bonds were used to refund outstanding principal of the Series 2008B Health Facilities Revenue Bonds and partially refund outstanding principal of the Series 2008A Bonds.
The Series 2012A Bonds and Series 2012B Bonds are variable rate bonds. The interest rate on the Series 2012A bonds and Series 2012B Bonds was based upon 67% of one month LIBOR plus 0.85% and 67% of one month LIBOR plus 0.93%, respectively, through January 1, 2019, and is based upon 79% of one month LIBOR plus 0.60% and 79% of one month LIBOR plus 0.66%, respectively, effective January 2, 2019. The interest rate on the Series 2012A Bonds and Series 2012B Bonds was 2.53% and 2.59%, respectively, at June 30, 2019 and 2.18% and 2.26%, respectively, at June 30, 2018.
Series 2016A Health Facilities Revenue Refunding Bonds In May 2016, the Authority issued the Series 2016A Health Facilities Revenue Refunding Bonds (“Series 2016A Bonds”) on behalf of Shands. The proceeds of the Series 2016A Bonds were used to advance refund the Series 2008D1 Health Facilities Revenue Bonds (“Series 2008D1 Bonds”) and Series 2008D2 Health Facilities Revenue Bonds (“Series 2008D2 Bonds”) and pay related costs of issuance. As of June 30, 2019, the amount of the Series 2008D1 Bonds and Series 2008D2 Bonds that was advance refunded and still outstanding was $0. As of June 30, 2018, the amount of the Series 2008D1 Bonds and Series 2008D2 Bonds that was advance refunded and still outstanding was $21,715,000 and $22,625,000, respectively.
The interest rate on the Series 2016A Bonds was fixed at 2.15% through January 31, 2018 and is fixed at 2.50% effective February 1, 2018 and is payable quarterly.
Bank Note In 2012, PNC Bank issued a seven year taxable loan to Shands to finance a property purchase, renovations, and equipment. The interest rate on the loan is fixed at 2.08%. Principal and interest payments were payable monthly through final maturity in March 2019.
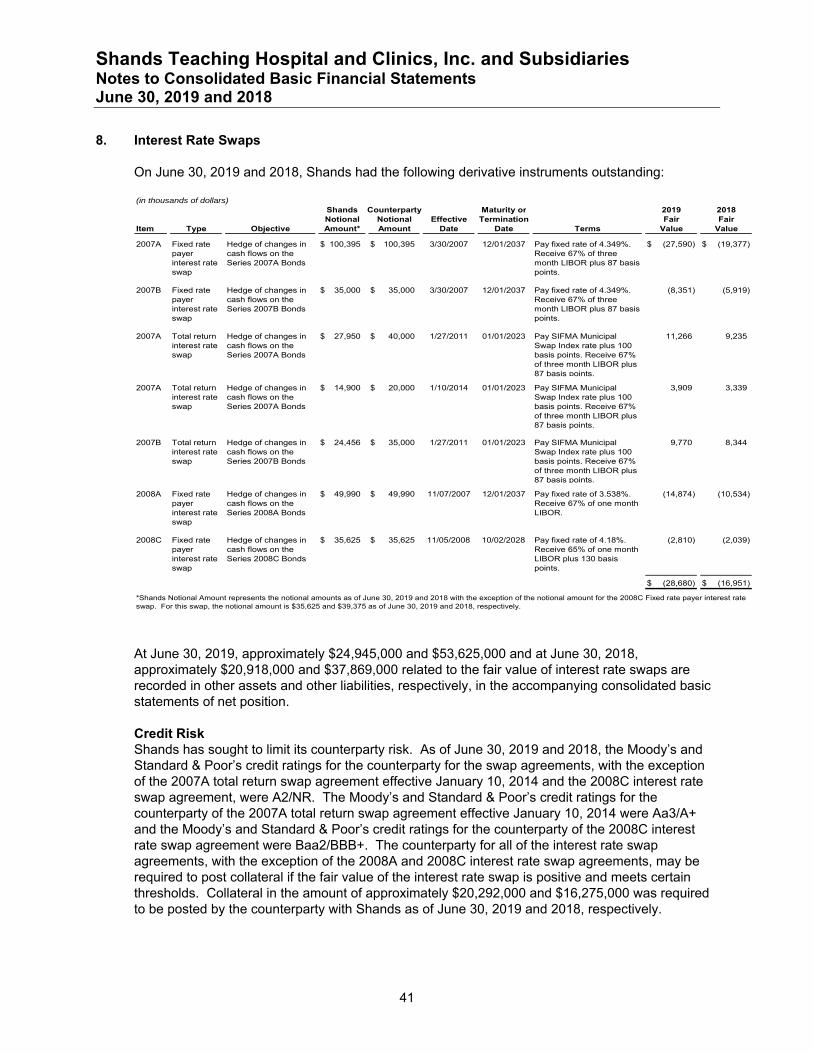
Shands Teaching Hospital and Clinics, Inc. and Subsidiaries Notes to Consolidated Basic Financial Statements June 30, 2019 and 2018
41
8. Interest Rate Swaps
On June 30, 2019 and 2018, Shands had the following derivative instruments outstanding:
(in thousands of dollars)Shands Counterparty Maturity or 2019 2018Notional Notional Effective Termination Fair Fair
Item Type Objective Amount* Amount Date Date Terms Value Value
2007A Fixed rate payer interest rate swap
Hedge of changes in cash flows on the Series 2007A Bonds
100,395$ 100,395$ 3/30/2007 12/01/2037 Pay fixed rate of 4.349%. Receive 67% of three month LIBOR plus 87 basis points.
(27,590)$ (19,377)$
2007B Fixed rate payer interest rate swap
Hedge of changes in cash flows on the Series 2007B Bonds
35,000$ 35,000$ 3/30/2007 12/01/2037 Pay fixed rate of 4.349%. Receive 67% of three month LIBOR plus 87 basis points.
(8,351) (5,919)
2007A Total return interest rate swap
Hedge of changes in cash flows on the Series 2007A Bonds
27,950$ 40,000$ 1/27/2011 01/01/2023 Pay SIFMA Municipal Swap Index rate plus 100 basis points. Receive 67% of three month LIBOR plus 87 basis points.
11,266 9,235
2007A Total return interest rate swap
Hedge of changes in cash flows on the Series 2007A Bonds
14,900$ 20,000$ 1/10/2014 01/01/2023 Pay SIFMA Municipal Swap Index rate plus 100 basis points. Receive 67% of three month LIBOR plus 87 basis points.
3,909 3,339
2007B Total return interest rate swap
Hedge of changes in cash flows on the Series 2007B Bonds
24,456$ 35,000$ 1/27/2011 01/01/2023 Pay SIFMA Municipal Swap Index rate plus 100 basis points. Receive 67% of three month LIBOR plus 87 basis points.
9,770 8,344
2008A Fixed rate payer interest rate swap
Hedge of changes in cash flows on the Series 2008A Bonds
49,990$ 49,990$ 11/07/2007 12/01/2037 Pay fixed rate of 3.538%. Receive 67% of one month LIBOR.
(14,874) (10,534)
2008C Fixed rate payer interest rate swap
Hedge of changes in cash flows on the Series 2008C Bonds
35,625$ 35,625$ 11/05/2008 10/02/2028 Pay fixed rate of 4.18%. Receive 65% of one month LIBOR plus 130 basis points.
(2,810) (2,039)
(28,680)$ (16,951)$
*Shands Notional Amount represents the notional amounts as of June 30, 2019 and 2018 with the exception of the notional amount for the 2008C Fixed rate payer interest rate swap. For this swap, the notional amount is $35,625 and $39,375 as of June 30, 2019 and 2018, respectively.
At June 30, 2019, approximately $24,945,000 and $53,625,000 and at June 30, 2018, approximately $20,918,000 and $37,869,000 related to the fair value of interest rate swaps are recorded in other assets and other liabilities, respectively, in the accompanying consolidated basic statements of net position.
Credit Risk Shands has sought to limit its counterparty risk. As of June 30, 2019 and 2018, the Moody’s and Standard & Poor’s credit ratings for the counterparty for the swap agreements, with the exception of the 2007A total return swap agreement effective January 10, 2014 and the 2008C interest rate swap agreement, were A2/NR. The Moody’s and Standard & Poor’s credit ratings for the counterparty of the 2007A total return swap agreement effective January 10, 2014 were Aa3/A+ and the Moody’s and Standard & Poor’s credit ratings for the counterparty of the 2008C interest rate swap agreement were Baa2/BBB+. The counterparty for all of the interest rate swap agreements, with the exception of the 2008A and 2008C interest rate swap agreements, may be required to post collateral if the fair value of the interest rate swap is positive and meets certain thresholds. Collateral in the amount of approximately $20,292,000 and $16,275,000 was required to be posted by the counterparty with Shands as of June 30, 2019 and 2018, respectively.
Shands Teaching Hospital and Clinics, Inc. and Subsidiaries Notes to Consolidated Basic Financial Statements June 30, 2019 and 2018
42
Interest Rate Risk Shands is not exposed to interest rate risk on its fixed rate payer interest rate swap agreements as they are structured in a receive variable, pay fixed rate mode. The 2007A and 2007B total return swaps are structured in a receive variable, pay variable rate mode and hedge the cash flows associated with the Series 2007A Bonds and Series 2007B Bonds.
Basis Risk Shands is exposed to basis risk on its 2008A fixed rate payer swap agreement because the variable-rate payments received by Shands on the hedging derivative instrument are based on a rate or index other than the interest rates that Shands pays on its hedged variable rate debt, which is remarketed in varying amounts and at various dates. As of June 30, 2019 and 2018, the weighted variable interest rate on Shands’ hedged variable rate debt is 1.45% and 1.23%, respectively, while the swap index is 67% of one month LIBOR, or 1.61% and 1.41%, respectively.
Shands is exposed to basis risk on its 2007A and 2007B total return swap agreements because the variable-rate payments received by Shands are based on a rate or index other than the rate paid by Shands on the respective notional amounts. As of June 30, 2019 and 2018, the swap index rate received by Shands is 67% of three month LIBOR plus 87 basis points, or 2.56% and 2.41%, respectively, while the swap index rate paid by Shands is SIFMA Municipal Swap Index rate plus 100 basis points, or 2.90% or 2.51%, respectively.
Termination Risk The interest rate swap agreements use the International Swap Dealers Association Master Agreement, which includes standard termination event provisions, such as failure to pay and bankruptcy.
Commitments Several of Shands’ interest rate swap agreements require collateral to be posted if the fair value of the interest rate swap is negative and meets certain thresholds. The threshold amount depends on Shands’ unenhanced credit rating as determined by Moody’s and Standard & Poor’s. Collateral in the amount of approximately $26,409,000 and $15,044,000 was required to be posted by Shands with the counterparty as of June 30, 2019 and 2018, respectively.
9. Retirement Benefit Plans
Defined Contribution Plans Shands sponsors two defined contribution plans that cover eligible employees, the Shands HealthCare Matched Savings Account 403(b) (“403(b) Plan”) and the Shands HealthCare Matched Savings Account 401(a) (“401(a) Plan”). Under the provisions of the 403(b) Plan, employees may elect to defer up to 75% of annual compensation (as defined) subject to Internal Revenue Code limitations. Under the 401(a) Plan, Shands makes a non-elective discretionary contribution on behalf of employees (a percentage of compensation based upon years of service) and a matching contribution equal to 75% of the first 4% of compensation that an employee contributes to the 403(b) Plan. Shands’ contributions to the 401(a) Plan were approximately $36,300,000 and $34,528,000 for the years ended June 30, 2019 and 2018, respectively.
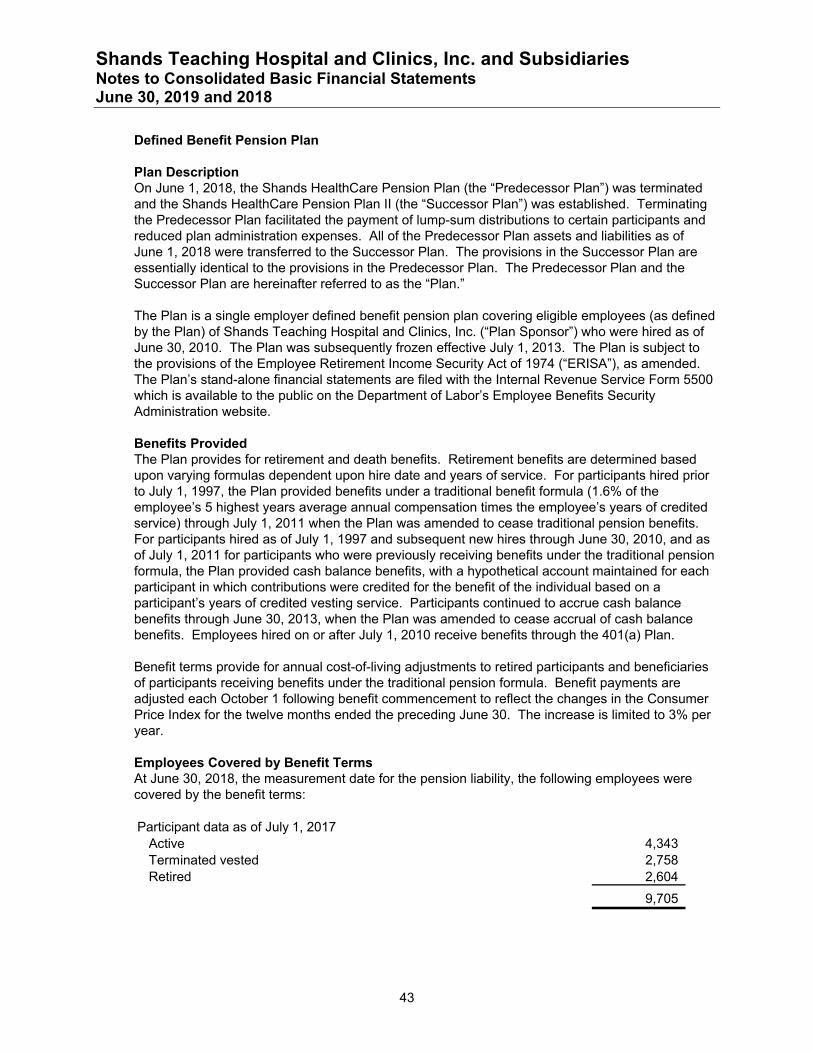
Shands Teaching Hospital and Clinics, Inc. and Subsidiaries Notes to Consolidated Basic Financial Statements June 30, 2019 and 2018
43
Defined Benefit Pension Plan
Plan Description On June 1, 2018, the Shands HealthCare Pension Plan (the “Predecessor Plan”) was terminated and the Shands HealthCare Pension Plan II (the “Successor Plan”) was established. Terminating the Predecessor Plan facilitated the payment of lump-sum distributions to certain participants and reduced plan administration expenses. All of the Predecessor Plan assets and liabilities as of June 1, 2018 were transferred to the Successor Plan. The provisions in the Successor Plan are essentially identical to the provisions in the Predecessor Plan. The Predecessor Plan and the Successor Plan are hereinafter referred to as the “Plan.”
The Plan is a single employer defined benefit pension plan covering eligible employees (as defined by the Plan) of Shands Teaching Hospital and Clinics, Inc. (“Plan Sponsor”) who were hired as of June 30, 2010. The Plan was subsequently frozen effective July 1, 2013. The Plan is subject to the provisions of the Employee Retirement Income Security Act of 1974 (“ERISA”), as amended. The Plan’s stand-alone financial statements are filed with the Internal Revenue Service Form 5500 which is available to the public on the Department of Labor’s Employee Benefits Security Administration website.
Benefits Provided The Plan provides for retirement and death benefits. Retirement benefits are determined based upon varying formulas dependent upon hire date and years of service. For participants hired prior to July 1, 1997, the Plan provided benefits under a traditional benefit formula (1.6% of the employee’s 5 highest years average annual compensation times the employee’s years of credited service) through July 1, 2011 when the Plan was amended to cease traditional pension benefits. For participants hired as of July 1, 1997 and subsequent new hires through June 30, 2010, and as of July 1, 2011 for participants who were previously receiving benefits under the traditional pension formula, the Plan provided cash balance benefits, with a hypothetical account maintained for each participant in which contributions were credited for the benefit of the individual based on a participant’s years of credited vesting service. Participants continued to accrue cash balance benefits through June 30, 2013, when the Plan was amended to cease accrual of cash balance benefits. Employees hired on or after July 1, 2010 receive benefits through the 401(a) Plan.
Benefit terms provide for annual cost-of-living adjustments to retired participants and beneficiaries of participants receiving benefits under the traditional pension formula. Benefit payments are adjusted each October 1 following benefit commencement to reflect the changes in the Consumer Price Index for the twelve months ended the preceding June 30. The increase is limited to 3% per year.
Employees Covered by Benefit Terms At June 30, 2018, the measurement date for the pension liability, the following employees were covered by the benefit terms:
Participant data as of July 1, 2017Active 4,343Terminated vested 2,758Retired 2,604
9,705

Shands Teaching Hospital and Clinics, Inc. and Subsidiaries Notes to Consolidated Basic Financial Statements June 30, 2019 and 2018
44
Contributions The Plan Sponsor’s funding policy is to make contributions to meet the minimum funding requirements of Internal Revenue Code Sections 412(a) and 430 as determined by an independent actuary. Additionally, the Plan Sponsor may contribute an amount above the required contribution. The Plan Sponsor’s contributions of approximately $25,346,000 and $29,279,000 for the years ended June 30, 2019 and 2018, respectively, exceeds the minimum funding requirements of ERISA.
Net Pension Asset/Liability The Shands’ net pension asset as of June 30, 2019 was based on a measurement date of June 30, 2018. The total pension liability used to calculate the net pension asset as of June 30, 2018 was determined based on the results of an actuarial valuation as of July 1, 2017 projected forward to June 30, 2018 using standard actuarial techniques.
The total pension liability in the July 1, 2017 actuarial valuation was determined based on census data as of July 1, 2017, and the following actuarial assumptions:
Investment Rate of Return: 6.25%, net of pension plan investment expense, including inflation.
Salary increases: Not applicable
Inflation: 1.63% for the period July 1, 2017 through June 30, 2018, 1.88% for the period July 1, 2018 through June 30, 2019, and 2.0% per year thereafter.
Retirement Growth Account Interest Crediting Rate: 3.17% for the period July 1, 2017 through June 30, 2018, 4.24% for the period July 1, 2018 through June 30, 2019, and 4.10% per year thereafter. The 3.17% and 4.24% rates represent the actual interest rate credited in each respective period.
Mortality rates were based upon the RP-2014 base mortality rates published in 2014 by the Society of Actuaries, adjusted to remove post-2006 improvement projections with future improvements in mortality from 2006 using the Mercer Modified Scale MMP-2016 applied on a generational basis.
The actuarial assumptions used in the July 1, 2017 valuation related to retirement and termination rates were based on the results of an actual experience study conducted in 2015 which assessed actual experience for the period July 1, 2010 through March 31, 2015.
The long-term expected rate of return on pension plan investments was determined using a building block method in which best-estimate ranges of expected real rates of return (expected returns, net of plan investment expenses and inflation) are developed for each major asset class. These ranges are combined to produce the long-term expected rate of return by weighting the expected future real rates of return by the target asset allocation percentage and adding expected inflation. The target allocation and best estimates of arithmetic real rates of return for each major asset class are summarized in the following table:
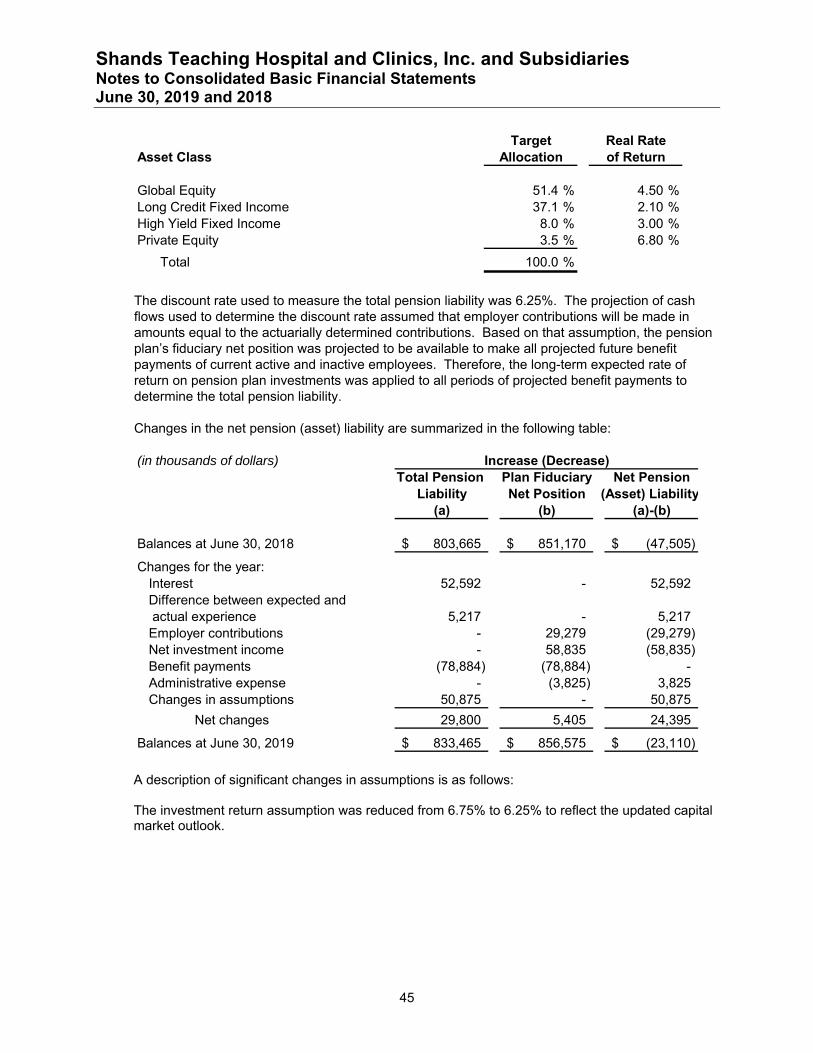
Shands Teaching Hospital and Clinics, Inc. and Subsidiaries Notes to Consolidated Basic Financial Statements June 30, 2019 and 2018
45
Target Real RateAsset Class Allocation of Return
Global Equity 51.4 % 4.50 % Long Credit Fixed Income 37.1 % 2.10 % High Yield Fixed Income 8.0 % 3.00 % Private Equity 3.5 % 6.80 %
Total 100.0 %
The discount rate used to measure the total pension liability was 6.25%. The projection of cash flows used to determine the discount rate assumed that employer contributions will be made in amounts equal to the actuarially determined contributions. Based on that assumption, the pension plan’s fiduciary net position was projected to be available to make all projected future benefit payments of current active and inactive employees. Therefore, the long-term expected rate of return on pension plan investments was applied to all periods of projected benefit payments to determine the total pension liability.
Changes in the net pension (asset) liability are summarized in the following table:
(in thousands of dollars)Total Pension Plan Fiduciary Net Pension
Liability Net Position (Asset) Liability(a) (b) (a)-(b)
Balances at June 30, 2018 803,665$ 851,170$ (47,505)$
Changes for the year:Interest 52,592 - 52,592Difference between expected and actual experience 5,217 - 5,217Employer contributions - 29,279 (29,279)Net investment income - 58,835 (58,835)Benefit payments (78,884) (78,884) -Administrative expense - (3,825) 3,825Changes in assumptions 50,875 - 50,875
Net changes 29,800 5,405 24,395
Balances at June 30, 2019 833,465$ 856,575$ (23,110)$
Increase (Decrease)
A description of significant changes in assumptions is as follows: The investment return assumption was reduced from 6.75% to 6.25% to reflect the updated capital market outlook.

Shands Teaching Hospital and Clinics, Inc. and Subsidiaries Notes to Consolidated Basic Financial Statements June 30, 2019 and 2018
46
The recurring fair value measurement of the Plan fiduciary net position at June 30, 2019 is as follows:
(in thousands of dollars) Quoted Pricesin Active Other
Markets for Significant SignificantIdentical Observable Unobservable
Fair Securities Inputs InputsValue (Level 1) (Level 2) (Level 3)
Investments by fair value levelFixed income funds 387,575$ 314,156$ 73,419$ -$ Equity funds 271,763 - 271,763 -Common stock 170,796 170,796 - -
Total Investments by fair value level 830,134 484,952$ 345,182$ -$
Investments measured at the NAVPrivate equity funds 23,055
Total Investments measured at the NAV 23,055
Total Investments measured at fair value 853,189
OtherOther plan assets, net 3,386
856,575$
The recurring fair value measurement of the Plan fiduciary net position at June 30, 2018 is as follows:
(in thousands of dollars) Quoted Pricesin Active Other
Markets for Significant SignificantIdentical Observable Unobservable
Fair Securities Inputs InputsValue (Level 1) (Level 2) (Level 3)
Investments by fair value levelFixed income funds 333,002$ 154,568$ 178,434$ -$ Equity funds 270,656 - 270,656 -Common stock 215,646 215,646 - -
Total Investments by fair value level 819,304 370,214$ 449,090$ -$
Investments measured at the NAVPrivate equity funds 28,920
Total Investments measured at the NAV 28,920
Total Investments measured at fair value 848,224
OtherOther plan assets, net 2,946
851,170$
Fixed income mutual funds and common stock classified in Level 1 of the fair value hierarchy are valued at quoted market prices for identical assets in active markets. The core fixed income fund, fixed income high yield fund and equity funds classified in Level 2 of the fair value hierarchy are valued at market prices for similar assets in active markets. Private equity funds are measured at the NAV per share or its equivalent.

Shands Teaching Hospital and Clinics, Inc. and Subsidiaries Notes to Consolidated Basic Financial Statements June 30, 2019 and 2018
47
Sensitivity of the Net Pension (Asset) Liability to Changes in the Discount Rate The following presents Shands’ net pension (asset) liability calculated using the discount rate of 6.25%, as well as the net pension (asset) liability using a discount rate that is 1% lower (5.25%) or 1% higher (7.25%):
(in thousands of dollars)Current
1% Decrease Discount Rate 1% Increase (5.25%) (6.25%) (7.25%)
Net pension (asset) liability 78,523$ (23,110)$ (105,851)$
Pension Expense and Deferred Outflows of Resources and Deferred Inflows of Resources Related to Defined Benefit Pension Shands recognized pension expense of approximately $10,470,000 and $3,247,000 for the years ended June 30, 2019 and 2018, respectively. At June 30, 2019, Shands reported deferred outflows of resources and deferred inflows of resources related to defined benefit pension from the following sources:
(in thousands of dollars) Deferred Deferred Outflows of Inflows of
Resources Resources
Differences between expected and actual experience 5,541$ 631$ Changes in assumptions 36,294 13,570Net differences between projected and actual
earnings on pension plan investments - 9,177Contributions made during the year ended June 30, 2019
not yet recognized in fiduciary net position 25,346 -
Total 67,181$ 23,378$
Amounts reported as deferred outflows of resources and deferred inflows of resources related to defined benefit pension will be recognized as a net increase (decrease) in pension expense as follows:
(in thousands of dollars) Year Ending June 302020 9,909$ 2021 12,5022022 (3,553)2023 (401)Thereafter -
Payable to the Defined Benefit Pension Plan As of June 30, 2019 and 2018, there are no payables to the Plan.

Shands Teaching Hospital and Clinics, Inc. and Subsidiaries Notes to Consolidated Basic Financial Statements June 30, 2019 and 2018
48
10. Commitments and Contingencies
Lease Agreements Shands entered into a contractual agreement as of July 1, 1980 with the State Board of Education of the State of Florida (“State Board of Education”), as subsequently restated and amended, which provides for the use of hospital facilities (buildings and improvements) of the patient care and clinical education unit of the J. Hillis Miller Health Center at the University of Florida (“Health Center”) through December 31, 2057, with renewal provisions. In 2002, the powers and authority of the State Board of Education regarding the contractual agreement with Shands were transferred to the UF Board. The contractual agreement also provided for the transfer to Shands of all other assets and liabilities arising from the operation of the Shands facilities prior to July 1, 1980. At termination of the contractual agreement, the net assets of Shands revert to the UF Board. Legal title to all buildings and improvements transferred to Shands remains with UF during the term of the contractual agreement. The contractual agreement provides for a 12-month grace period for any event of default, other than the bankruptcy of Shands. In addition, the contractual agreement limits the right of the UF Board to terminate the contractual agreement solely to the circumstance when Shands declares bankruptcy and, in such event, requires net revenue derived from the operation of the hospital facilities to continue to be applied to the payment of Shands’ debts.
Under the terms of the contractual agreement, Shands is obligated to manage, operate, maintain, and insure the hospital facilities in support of the programs of the Health Center, which include the College of Medicine, and further agrees to contract with the UF Board for the provision of these programs.
In connection with its minority interest in Lake Shore HMA, LLC, Shands provides a 40% guaranty and CHS provides a 60% guaranty on lease payments to the Lake Shore Hospital Authority. The monthly lease payments are approximately $46,350 at June 30, 2019 and are subject to annual increases based upon the change in the Consumer Price Index. The lease expires June 30, 2040.
The following is a schedule, by year, of future minimum lease payments under capital and noncancelable operating leases together with the present value of net minimum capital lease payments as of June 30, 2019:
(in thousands of dollars)Capital Operating
Year Ending Leases Leases
2020 857$ 3,236$ 2021 1,006 2,6012022 1,024 2,1742023 1,037 1,5172024 992 1,4082025-2029 3,618 1,6292030-2034 - 523
Total minimum lease payments 8,534 13,088$
Less: Amount representing interest (1,407)
Present value of net minimum lease payments 7,127$
Shands Teaching Hospital and Clinics, Inc. and Subsidiaries Notes to Consolidated Basic Financial Statements June 30, 2019 and 2018
49
Operating lease expense for the rental of property and equipment for the years ended June 30, 2019 and 2018 was approximately $6,324,000 and $6,221,000, respectively. At June 30, 2019 and 2018, gross assets under capital leases included in capital assets were approximately $8,287,000 and $2,361,000, respectively. Accumulated amortization on capital leases as of June 30, 2019 and 2018 was approximately $1,187,000 and $534,000, respectively.
Commitments Shands has contracts for the construction and renovation of facilities and equipment purchases. As of June 30, 2019, the remaining commitments relating to these contracts were approximately $42,878,000.
Shands has contracts for the maintenance of its computer application software and communications network. As of June 30, 2019, the remaining commitments relating to these contracts were approximately $4,684,000.
Risk Management and Professional Liabilities Shands is exposed to various risks of loss from torts; theft of, damage to, and destruction of assets; business interruption; errors and omissions; employee injuries and illnesses; natural disasters; medical malpractice; and employee health, dental, and accident benefits. Commercial insurance coverage is purchased for claims arising from such matters in excess of self-insured limits. Settled claims have not exceeded this commercial coverage for the years ended June 30, 2019 and 2018.
Shands was granted sovereign immunity under the provision of Chapter 2011-114, Laws of Florida, and further codified in 768.28(2), Florida Statutes. As such, recovery in tort actions are limited to $200,000 for any one person for one incident and all recovery related to one incident are limited to a total of $300,000.
Shands participates with other health care providers in the University of Florida J. Hillis Miller Health Center Self-Insurance Program (“UFSIP”). UFSIP is an operating unit of the Board of Governors of the State of Florida (“FBOG”). UFSIP provides medical malpractice and general liability occurrence-based coverage to Shands. Insurance in excess of the coverage provided by UFSIP is provided by the University of Florida Healthcare Education Insurance Company (“UFHEIC”). UFHEIC is wholly-owned by FBOG. UFHEIC provides coverage to Shands on a claims-reported basis. UFHEIC obtains reinsurance for a substantial portion of the insurance coverage that it provides to the participants in its insurance program. The policies between UFSIP and UFHEIC and Shands are not retrospectively rated. The costs incurred by Shands related to these policies are expensed in the period that coverage is provided.
Shands could be subject to malpractice claims in excess of insurance coverage through UFSIP or UFHEIC; however, the estimated potential loss, if any, cannot be estimated. Management of Shands is not aware of any potential uninsured losses that could materially affect the consolidated financial position of Shands.
Shands Teaching Hospital and Clinics, Inc. and Subsidiaries Notes to Consolidated Basic Financial Statements June 30, 2019 and 2018
50
Self-Insured Health Plan Shands participates with other related party employers controlled by UF including Shands Jacksonville Medical Center (“SJMC”), UFICO, and other eligible employees of UF in “GatorCare”, a self-insured health plan, to provide health and pharmaceutical coverage to its employees. GatorCare Health Management Corporation (“GCHMC”) was incorporated to coordinate and facilitate the management of GatorCare. Funding amounts collected by GCHMC are determined by the level of benefits coverage selected by each employee and to cover administrative costs of the plan. Cash held by GCHMC is largely restricted for payments of self-insured health and pharmacy claims of Shands and the related party employers, with the remaining cash available to cover the administrative functions of GCHMC.
Expenses, net of employee contributions, related to the health and pharmaceutical plan for the years ended June 30, 2019 and 2018 were approximately $82,452,000 and $77,872,000, respectively.
Workers’ Compensation Insurance Shands is self-insured for workers’ compensation up to $600,000 per occurrence for the years ended June 30, 2019 and 2018. Shands has purchased excess coverage from a commercial carrier up to the amount allowed by Florida Statutes. Total workers’ compensation expense for the years ended June 30, 2019 and 2018 was approximately $1,624,000 and $1,736,000, respectively.
Litigation Shands is involved in litigation arising in the normal course of business. After consultation with legal counsel, management believes that these matters will be resolved without material adverse effect on Shands’ future financial position or results of operations.
Other Industry Risks The health care industry is subject to numerous laws and regulations of federal, state, and local governments. Compliance with these laws and regulations can be subject to government review and interpretation, as well as regulatory actions unknown and unasserted at this time. Federal government activity has increased with respect to investigations and allegations concerning possible violations by health care providers of regulations, which could result in the imposition of significant fines and penalties, as well as significant repayments of previously billed and collected revenue from patient services. There have also been numerous lawsuits filed against nonprofit hospitals related to charity care. These lawsuits allege various hospital practices related to the uninsured, including, among other things, charging uninsured patients more than what insurers would pay for the same services, rapidly rising prices, and aggressive collection policies. Management believes that Shands is in compliance with current laws and regulations and that Shands’ ultimate exposure from any such matters would not have a material effect on Shands’ consolidated basic financial statements.

Shands Teaching Hospital and Clinics, Inc. and Subsidiaries Notes to Consolidated Basic Financial Statements June 30, 2019 and 2018
51
11. Transactions with Related Parties
Shands has various agreements for services provided by UF in support of its health science colleges, including physician services, utilities, and various other services. Expenses related to these agreements were approximately $196,804,000 and $187,311,000 for the years ended June 30, 2019 and 2018, respectively, of which approximately $69,580,000 and $68,062,000 for the years ended June 30, 2019 and 2018, respectively, are transfers and expenditures in support of UF and its health science colleges included in the accompanying consolidated basic statements of revenues, expenses and changes in net position. At June 30, 2019 and 2018, approximately $10,967,000 and $13,338,000, respectively, was owed to UF under these agreements and is included in accounts payable and accrued expenses in the accompanying consolidated basic statements of net position.
Shands provides contracted services at cost to UF in support of its health science colleges, including non-physician medical professional services, telephone communication, and various other services. The amount credited against expenses for these contracted services was approximately $117,045,000 and $107,138,000 for the years ended June 30, 2019 and 2018, respectively. At June 30, 2019 and 2018, approximately $6,900,000 and $7,476,000, respectively, was owed to Shands under these agreements and is included in prepaid expenses and other current assets in the accompanying consolidated basic statements of net position.
Shands has an agreement whereby UF provides billing services for emergency room physician fees. UF remits the collections to Shands on a monthly basis, less an administrative fee. The amount collected by UF on Shands’ behalf, less the administrative fee, for the years ended June 30, 2019 and 2018 was approximately $17,154,000 and $15,273,000, respectively. At June 30, 2019 and 2018, approximately $2,387,000 and $2,316,000, respectively, was owed to Shands and is included in prepaid expenses and other current assets in the accompanying consolidated basic statements of net position.
UFSIP provides medical malpractice and general liability occurrence-based coverage to Shands with excess coverage provided by UFHEIC. Expenses related to these coverages were approximately $2,464,000 and $2,358,000 for the years ended June 30, 2019 and 2018, respectively.
Shands has an investment management agreement with UFICO to manage a portion of its investments. UFICO was created by the UF Trustees for the purpose of managing assets held by UF and its related corporations. As of June 30, 2019 and 2018, the fair value of investments managed by UFICO on Shands’ behalf was approximately $585,170,000 and $548,054,000, respectively. Investment management fees of approximately $961,000 and $675,000 were incurred for the years ended June 30, 2019 and 2018, respectively. At June 30, 2019 and 2018, approximately $46,000 and $63,000, respectively, was owed to UFICO and is included in accounts payable and accrued expenses in the accompanying consolidated basic statement of net position.
Shands provides contracted services at cost to SJMC for administrative and information technology support services. The amount credited against expenses for these contracted services was approximately $5,885,000 and $7,372,000 for the years ended June 30, 2019 and 2018, respectively. At June 30, 2019 and 2018, approximately $696,000 and $1,080,000, respectively, was owed to Shands under these agreements and is included in prepaid expenses and other current assets in the accompanying consolidated basic statements of net position.

Shands Teaching Hospital and Clinics, Inc. and Subsidiaries Notes to Consolidated Basic Financial Statements June 30, 2019 and 2018
52
SJMC provides organ procurement services for Shands. Expenses related to these services were approximately $361,000 and $251,000 for the years ended June 30, 2019 and 2018, respectively.
At June 30, 2019 and 2018, Shands had a note receivable of approximately $14,385,000 and $15,321,000, respectively, due from SJMC. Shands receives quarterly payments of approximately $402,000 including interest of 4.5% and the note matures on October 1, 2030. The current portion of the note receivable of approximately $978,000 and $936,000 at June 30, 2019 and 2018, respectively, is included in prepaid expenses and other current assets in the accompanying consolidated basic statements of net position. The long-term portion of the note receivable of approximately $13,407,000 and $14,385,000 at June 30, 2019 and 2018, respectively, is included in other assets in the accompanying consolidated basic statements of net position.
GCHMC collects funds from Shands to pay health and pharmacy claims and expenses for eligible employees. GCHMC pays the health and pharmacy claims on behalf of Shands. Funds provided by Shands to GCHMC for the years ended June 30, 2019 and 2018 were approximately $92,798,000, and $87,664,000, respectively. At June 30, 2019 and 2018, approximately $12,530,000 and $10,391,000, respectively, was due from GCHMC and is included in other assets in the accompanying consolidated basic statements of net position.
Shands provides administrative services to GCHMC. The amount credited against expenses for these contracted services for the years ended June 30, 2019 and 2018 was approximately $1,211,000 and $1,021,000, respectively. At June 30, 2019 and 2018, approximately $419,000 and $311,000, respectively, was owed to Shands and is included in prepaid expenses and other current assets in the accompanying consolidated basic statements of net position.
Shands provided pharmacy discounts to GCHMC through March 31, 2018. The discounts for the year ended June 30, 2018 were approximately $203,000. At June 30, 2018, approximately $17,000 was owed to GCHMC and is included in accounts payable and accrued expenses in the accompanying consolidated basic statements of net position.
Shands leases medical and administrative space from Innovation Square. Expense associated with the leased space was approximately $312,000 and $381,000 for the years ended June 30, 2019 and 2018, respectively.
12. Concentrations of Credit Risk
Shands grants credit without collateral to its patients, many of whom are local residents and are insured under third-party payor agreements. The composition of receivables from third-party payors is as follows:
2019 2018
Medicare (includes HMOs) 25.9% 27.3%Medicaid (includes HMOs) 18.0% 15.7%Blue Cross 21.0% 21.2%Commercial 5.2% 3.8%Managed Care 22.7% 23.3%Other third-party payors 7.2% 8.7%
100.0% 100.0%
Shands Teaching Hospital and Clinics, Inc. and Subsidiaries Notes to Consolidated Basic Financial Statements June 30, 2019 and 2018
53
Concentrations of credit risk with respect to patient accounts receivable are limited to Medicare, Medicaid and various commercial payors.
Shands places its cash and cash equivalents with what management believes to be high-quality financial institutions and thus limits its credit exposure. Shands has deposits in excess of the federal insured amount of $250,000. Management does not anticipate nonperformance risk by the financial institutions.
13. Subsequent Events
Shands has assessed the impact of subsequent events through September 25, 2019, the date the audited consolidated basic financial statements were issued, and has concluded that there were no such events that require adjustment to the consolidated basic financial statements or disclosure in the notes to the consolidated basic financial statements.

Shands Teaching Hospital and Clinics, Inc. and Subsidiaries Schedule of Changes in the Net Pension (Asset) Liability and Related Ratios (Unaudited) June 30, 2014 Through June 30, 2019
54
(in thousands of dollars) 2019 2018 2017 2016 2015 2014
Total pension liabilityService cost -$ -$ -$ -$ -$ 10,341$ Interest 52,592 52,705 55,175 55,119 53,701 49,646Changes of benefit terms - - - - - (4,041)Difference between expected and actual experience 5,217 3,939 (2,690) 402 149 13,022Benefit payments (78,884) (42,399) (91,115) (42,722) (35,351) (32,058)Changes in assumptions 50,875 (12,589) (33,065) 79,285 2,689 22,714
Net change in total pension liability 29,800 1,656 (71,695) 92,084 21,188 59,624
Total pension liability – beginning 803,665 802,009 873,704 781,620 760,432 700,808
Total pension liability – ending (a) 833,465$ 803,665$ 802,009$ 873,704$ 781,620$ 760,432$ Plan fiduciary net position
Employer contributions 29,279$ 29,036$ 21,863$ 23,736$ 35,758$ 38,115$ Net investment income 58,835 106,241 5,857 27,578 124,555 83,888Benefit payments (78,884) (42,399) (91,115) (42,722) (35,351) (32,057)Administrative expense (3,825) (8,019) (7,985) (6,770) (5,790) (4,750)
Net change in plan fiduciary net position 5,405 84,859 (71,380) 1,822 119,172 85,196
Plan fiduciary net position – beginning 851,170 766,311 837,691 835,869 716,697 631,501Plan fiduciary net position – ending (b) 856,575$ 851,170$ 766,311$ 837,691$ 835,869$ 716,697$
Net pension (asset) liability – ending (a)-(b) (23,110)$ (47,505)$ 35,698$ 36,013$ (54,249)$ 43,735$
Plan fiduciary net position as a percentage of total pension liability 102.77% 105.91% 95.55% 95.88% 106.94% 94.25%
Notes to ScheduleShands adopted GASB No. 68, Accounting and Financial Reporting for Pensions, an Amendment of GASB No. 27, as of June 30, 2014, the first period the required supplementary information was available.
Covered payroll information is not provided as the plan is frozen and contributions are not determined by current payroll as benefit accruals ceased July 1, 2013.
Changes in assumptions 2019:The investment return assumption was reduced from 6.75% to 6.25% to reflect the updated capital market outlook.
Changes in assumptions 2018:The mortality projection scale assumption was updated from Mercer Modified Projection-2007 to Mercer Modified Projection-2016.
Changes of assumptions in 2017:The investment return assumption was increased from 6.50% to 6.75% to reflect the updated capital market outlook.
Changes of assumptions in 2016:The investment return assumption was decreased from 7.25% to 6.50% to reflect the updated capital market outlook.The cost of living assumption ultimate rate was decreased from 2.5% to 2.0%.The mortality assumption was updated to the RP-2014 mortality tables adjusted to remove post-2007 improvement projections with future mortality improvement that follows the Mercer Modified Projection-2016 mortality improvement tables.Retirement rates and withdrawal rates were updated based on the results of an experience study performed in 2015.
Changes of assumptions in 2015:The interest credit ultimate rate was changed from 3.83% to 4.10%.
Changes of assumptions in 2014:The cost of living assumption ultimate rate was increased from 2.0% to 2.5%.The interest credit ultimate rate was changed from 4.75% to 3.83%.

Shands Teaching Hospital and Clinics, Inc. and Subsidiaries Schedule of Employer Contributions (Unaudited) July 1, 2013 Through June 30, 2019
55
Schedule of Employer Contributions(in thousands of dollars) 2019 2018 2017 2016 2015 2014
Actuarially determined contribution -$ -$ -$ -$ -$ -$ Contributions in relation to the actuarially
determined contribution 25,346 29,279 29,036 21,863 23,736 35,757
Contribution excess (25,346)$ (29,279)$ (29,036)$ (21,863)$ (23,736)$ (35,757)$
Notes to Schedule Shands adopted GASB No. 68, Accounting and Financial Reporting for Pensions, an Amendment of GASB No. 27, as of June 30, 2014, the first period the required supplementary information was available.
Contributions are based on ERISA minimum funding requirements and shown for the plan year.
Covered payroll information is not provided as the plan is frozen and contributions are not determined by current payroll as benefit accruals ceased effective July 1, 2013.
Methods and assumptions used to determine contributions for the years with available information are:
2019 2018 2017 2016 2015Valuation date July 1, 2018 July 1, 2017 July 1, 2016 July 1, 2015 July 1, 2014
Actuarial cost method Unit Credit Unit Credit Projected Unit Credit Projected Unit Credit Projected Unit Credit
Asset valuation method 2-year smoothed value of assets adjusted to be no greater than 110% and no less than 90% of the fair market value, as defined in IRC Section 430
2-year smoothed value of assets adjusted to be no greater than 110% and no less than 90% of the fair market value, as defined in IRC Section 430
Market value including receivables
Market value including receivables
Market value including receivables
Inflation 2.00% 2.00% 2.00% 2.00% 2.50%
Discount rates PPA segmented yield curve rates of 3.92% for the first 5 years, 5.52% for the next 15 years, and 6.29% thereafter
PPA segmented yield curve rates of 4.16% for the first 5 years, 5.72% for the next 15 years, and 6.48% thereafter
6.50% 6.50% 7.25%
Salary increase N/A N/A N/A N/A N/A
Retirement age Traditional plan and retirement growth account retirement rates vary by age
Traditional plan and retirement growth account retirement rates vary by age
Traditional plan and retirement growth account retirement rates vary by age
Traditional plan and retirement growth account retirement rates vary by age
Traditional plan and retirement growth account retirement rates vary by age
Mortality IRC Section 430(h)(3) prescribed static annuitant and non-annuitant mortality tables. These tables are based on the RP-2000 mortality tables, with improvements beyond 2006 removed with static mortality improvements based on the Internal Revenue Service methodology and projection scale MP-2016.
IRC Section 430(h)(3) prescribed static annuitant and non-annuitant mortality tables. These tables are based on the RP-2000 mortality tables and projected withimprovement to the valuation year plus 7, and 15 years based on Scale AA.
RP-2014 mortality tables adjusted to remove post-2007 improvement projections withfuture mortality improvement that follows the Mercer Modified MP-2016 mortalityimprovement tables.
RP-2014 mortality tables with future mortality improvement that follows theMercer Modified MP-2014 mortality improvement scale.
RP-2000 Healthy Annuitant Mortality Tables projected with mortality improvement to the valuation year plus 7 and 15 years based on Scale AA.

Shands Teaching Hospital and Clinics, Inc. and Subsidiaries Consolidating Basic Statements of Net Position June 30, 2019
(In thousands of dollars)
56
UF Health UF Health UF HealthUF Health Shands Shands Shands TotalShands Psychiatric Rehab Home Obligated ConsolidatedHospital Hospital Hospital Care Eliminations Group Other Eliminations Total
AssetsCurrent assets
Cash and cash equivalents 26,912$ 1$ -$ -$ -$ 26,913$ 18,363$ -$ 45,276$ Short-term investments 14,488 - - - - 14,488 51 - 14,539Patient accounts receivable, net 235,572 3,628 151 1,877 - 241,228 933 - 242,161Inventories 36,889 - - - - 36,889 - - 36,889Prepaid expenses and other current assets 98,350 1,046 2,141 44 (1,391) 100,190 1,198 - 101,388Assets whose use is limited, current portion 25,630 - - - - 25,630 - - 25,630
Total current assets 437,841 4,675 2,292 1,921 (1,391) 445,338 20,545 - 465,883
Assets whose use is limited, less current portion 559,489 - - - - 559,489 - - 559,489Assets whose use is restricted 40,165 - - - - 40,165 - - 40,165Capital assets, net 1,068,088 10,851 - 1,197 - 1,080,136 1,532 - 1,081,668Due from affiliates, net 11,828 - - - - 11,828 - (11,828) -Other assets 110,854 5 - (1) - 110,858 - - 110,858
Total assets 2,228,265 15,531 2,292 3,117 (1,391) 2,247,814 22,077 (11,828) 2,258,063
Deferred outflows of resourcesAccumulated decrease in fair value of hedging derivatives 50,830 - - - - 50,830 - - 50,830Deferred loss on debt refunding 295 - - - - 295 - - 295Deferred outflows on pension 67,181 - - - - 67,181 - - 67,181
Total deferred outflows of resources 118,306 - - - - 118,306 - - 118,306
LiabilitiesCurrent liabilities
Long-term debt, current portion 13,287 - - - - 13,287 - - 13,287Capital lease obligations, current portion 485 - - 118 - 603 - - 603Accounts payable and accrued expenses 126,157 402 247 27 - 126,833 5,779 - 132,612Accrued salaries and leave payable 62,704 44 - 19 - 62,767 39 - 62,806Estimated third-party payor settlements 91,447 - - - (1,391) 90,056 - - 90,056
Total current liabilities 294,080 446 247 164 (1,391) 293,546 5,818 - 299,364
Long-term liabilitiesLong-term debt, less current portion 797,595 - - - - 797,595 - - 797,595Capital lease obligations, less current portion 5,510 - - 1,014 - 6,524 - - 6,524Due to affiliates, net - - - - - - 11,828 (11,828) -Other liabilities 60,785 - - - - 60,785 - - 60,785
Total long-term liabilities 863,890 - - 1,014 - 864,904 11,828 (11,828) 864,904
Total liabilities 1,157,970 446 247 1,178 (1,391) 1,158,450 17,646 (11,828) 1,164,268
Deferred inflows of resourcesDeferred gain on debt refunding 2,325 - - - - 2,325 - - 2,325Deferred inflows on pension 23,378 - - - - 23,378 - - 23,378
Total deferred inflows of resources 25,703 - - - - 25,703 - - 25,703
Net positionNet investment in capital assets 251,211 10,851 - 65 - 262,127 1,532 - 263,659Restricted
Nonexpendable 276 - - - - 276 - - 276Expendable 3,953 - - - - 3,953 252 - 4,205
Unrestricted 907,458 4,234 2,045 1,874 - 915,611 2,647 - 918,258
Total net position 1,162,898$ 15,085$ 2,045$ 1,939$ -$ 1,181,967$ 4,431$ -$ 1,186,398$ The accompanying notes are an integral part of these consolidating basic financial statements.

Shands Teaching Hospital and Clinics, Inc. and Subsidiaries Consolidating Basic Statements of Net Position June 30, 2018
(In thousands of dollars)
57
UF Health UF Health UF HealthUF Health Shands Shands Shands TotalShands Psychiatric Rehab Home Obligated ConsolidatedHospital Hospital Hospital Care Eliminations Group Other Eliminations Total
AssetsCurrent assets
Cash and cash equivalents 24,788$ 1$ -$ -$ -$ 24,789$ 12,533$ -$ 37,322$ Short-term investments 122,152 - - - - 122,152 48 - 122,200Patient accounts receivable, net 215,879 3,472 2,903 1,998 - 224,252 1,106 - 225,358Inventories 22,577 - - - - 22,577 - - 22,577Prepaid expenses and other current assets 57,156 640 1,057 42 (1,009) 57,886 1,191 - 59,077Assets whose use is limited, current portion 32,469 - - - - 32,469 - - 32,469
Total current assets 475,021 4,113 3,960 2,040 (1,009) 484,125 14,878 - 499,003
Assets whose use is limited, less current portion 515,538 - - - - 515,538 - - 515,538Assets whose use is restricted 28,180 - - - - 28,180 - - 28,180Capital assets, net 1,052,964 8,571 1,270 1,358 - 1,064,163 1,534 - 1,065,697Due from affiliates, net 5,891 2 - 24 - 5,917 - (5,917) -Other assets 126,068 6 - - - 126,074 1 - 126,075
Total assets 2,203,662 12,692 5,230 3,422 (1,009) 2,223,997 16,413 (5,917) 2,234,493
Deferred outflows of resourcesAccumulated decrease in fair value of hedging derivatives 35,073 - - - - 35,073 - - 35,073Deferred loss on debt refunding 336 - - - - 336 - - 336Deferred outflows on pension 48,062 - - - - 48,062 - - 48,062
Total deferred outflows of resources 83,471 - - - - 83,471 - - 83,471
LiabilitiesCurrent liabilities
Long-term debt, current portion 14,341 - - - - 14,341 - - 14,341Capital lease obligations, current portion 80 - - 123 - 203 - - 203Accounts payable and accrued expenses 125,579 394 192 45 - 126,210 6,392 - 132,602Accrued salaries and leave payable 57,659 42 39 18 - 57,758 46 - 57,804Estimated third-party payor settlements 109,405 - - - (1,009) 108,396 335 - 108,731
Total current liabilities 307,064 436 231 186 (1,009) 306,908 6,773 - 313,681
Long-term liabilitiesLong-term debt, less current portion 810,881 - - - - 810,881 - - 810,881Capital lease obligations, less current portion 499 - - 1,143 - 1,642 - - 1,642Due to affiliates, net - - - - - - 5,917 (5,917) -Other liabilities 40,604 - - - - 40,604 - - 40,604
Total long-term liabilities 851,984 - - 1,143 - 853,127 5,917 (5,917) 853,127
Total liabilities 1,159,048 436 231 1,329 (1,009) 1,160,035 12,690 (5,917) 1,166,808
Deferred inflows of resourcesDeferred gain on debt refunding 2,528 - - - - 2,528 - - 2,528Deferred inflows on pension 43,531 - - - - 43,531 - - 43,531
Total deferred inflows of resources 46,059 - - - - 46,059 - - 46,059
Net positionNet investment in capital assets 227,419 8,571 1,270 1,358 - 238,618 13 - 238,631Restricted -
Nonexpendable 243 - - - - 243 - - 243Expendable 4,391 - - - - 4,391 229 - 4,620
Unrestricted 849,973 3,685 3,729 735 - 858,122 3,481 - 861,603
Total net position 1,082,026$ 12,256$ 4,999$ 2,093$ -$ 1,101,374$ 3,723$ -$ 1,105,097$ The accompanying notes are an integral part of these consolidating basic financial statements.

Shands Teaching Hospital and Clinics, Inc. and Subsidiaries Consolidating Basic Statements of Revenues, Expenses and Changes in Net Position Year Ended June 30, 2019
(In thousands of dollars)
58
UF Health UF Health UF HealthUF Health Shands Shands Shands TotalShands Psychiatric Rehab Home Obligated ConsolidatedHospital Hospital Hospital Care Eliminations Group Other Eliminations Total
Operating revenuesNet patient service revenue, net of provision for bad debts 1,521,614$ 19,538$ 14,321$ 8,421$ -$ 1,563,894$ 7,430$ -$ 1,571,324$ Other operating revenue 25,367 385 62 1,301 (1,764) 25,351 4,605 (488) 29,468
Total operating revenues 1,546,981 19,923 14,383 9,722 (1,764) 1,589,245 12,035 (488) 1,600,792
Operating expensesSalaries and benefits 672,409 15,553 8,931 7,840 - 704,733 4,527 - 709,260Supplies and services 677,926 4,819 3,329 1,464 (1,764) 685,774 4,210 (488) 689,496Depreciation and amortization 83,021 816 107 161 - 84,105 2 - 84,107
Total operating expenses 1,433,356 21,188 12,367 9,465 (1,764) 1,474,612 8,739 (488) 1,482,863
Operating income (loss) 113,625 (1,265) 2,016 257 - 114,633 3,296 - 117,929
Nonoperating revenues (expenses)State appropriations 7,050 - - - - 7,050 - - 7,050Interest expense (30,681) - - (50) - (30,731) - - (30,731)Net investment income, including change in fair value 46,114 - - - - 46,114 93 - 46,207Gain (loss) on disposal of capital assets, net (156) - 156 - - - - - -Other nonoperating revenues (expenses), net (1,568) 1 (1) - - (1,568) - - (1,568)
Total nonoperating revenues (expenses), net 20,759 1 155 (50) - 20,865 93 - 20,958
Excess (deficit) of revenues over expenses before transfers, capital contributions, special items, and other changes in net position 134,384 (1,264) 2,171 207 - 135,498 3,389 - 138,887
Transfers and expenditures in support of the University - of Florida and its health science colleges (66,471) (998) - - - (67,469) (2,111) - (69,580)Transfer of net assets in association with consolidation and support of other operations and divisions of Shands 990 5,090 (5,126) (361) - 593 (593) - -Capital contributions 5,742 - - - - 5,742 - - 5,742Special Item - Gain on sale and transfer of UF Health Shands Rehab Hospital 6,751 - - - - 6,751 - - 6,751Other changes in net position (524) 1 1 - - (522) 23 - (499)
Increase (decrease) in net position 80,872 2,829 (2,954) (154) - 80,593 708 - 81,301
Net positionBeginning of year 1,082,026 12,256 4,999 2,093 - 1,101,374 3,723 - 1,105,097
End of year 1,162,898$ 15,085$ 2,045$ 1,939$ -$ 1,181,967$ 4,431$ -$ 1,186,398$
The accompanying notes are an integral part of these consolidating basic financial statements.

Shands Teaching Hospital and Clinics, Inc. and Subsidiaries Consolidating Basic Statements of Revenues, Expenses and Changes in Net Position Year Ended June 30, 2018
(In thousands of dollars)
59
UF Health UF Health UF HealthUF Health Shands Shands Shands TotalShands Psychiatric Rehab Home Obligated ConsolidatedHospital Hospital Hospital Care Eliminations Group Other Eliminations Total
Operating revenuesNet patient service revenue, net of provision for bad debts 1,411,187$ 19,867$ 21,674$ 8,139$ (320)$ 1,460,547$ 6,541$ -$ 1,467,088$ Other operating revenue 18,237 435 3 50 - 18,725 4,189 (255) 22,659
Total operating revenues 1,429,424 20,302 21,677 8,189 (320) 1,479,272 10,730 (255) 1,489,747
Operating expensesSalaries and benefits 609,259 14,002 12,970 6,159 1,703 644,093 4,128 - 648,221Supplies and services 651,079 4,816 4,564 1,324 (2,023) 659,760 4,050 (532) 663,278Depreciation and amortization 71,270 1,667 1,422 161 - 74,520 - - 74,520
Total operating expenses 1,331,608 20,485 18,956 7,644 (320) 1,378,373 8,178 (532) 1,386,019
Operating income (loss) 97,816 (183) 2,721 545 - 100,899 2,552 277 103,728
Nonoperating revenues (expenses)State appropriations 7,050 - - - - 7,050 - - 7,050Interest expense (26,025) - - (55) - (26,080) - - (26,080)Net investment income, including change in fair value 30,986 - - - - 30,986 53 - 31,039Gain on disposal of capital assets, net 183 - 1 - - 184 - - 184Other nonoperating revenues (expenses), net (837) 1 - - - (836) - (277) (1,113)
Total nonoperating revenues (expenses), net 11,357 1 1 (55) - 11,304 53 (277) 11,080
Excess (deficit) of revenues over expenses before transfers, capital contributions, and other changes in net position 109,173 (182) 2,722 490 - 112,203 2,605 - 114,808
Transfers and expenditures in support of the University - of Florida and its health science colleges (64,953) (998) - - - (65,951) (2,111) - (68,062)Transfer of net assets in association with consolidation and support of other operations and divisions of Shands 9,603 (23) (4,291) (571) - 4,718 (4,718) - -Capital contributions 10,544 - - - - 10,544 - - 10,544Other changes in net position 19,503 - - - - 19,503 (23,851) - (4,348)
Increase (decrease) in net position 83,870 (1,203) (1,569) (81) - 81,017 (28,075) - 52,942
Net positionBeginning of year 998,156 13,459 6,568 2,174 - 1,020,357 31,798 - 1,052,155
End of year 1,082,026$ 12,256$ 4,999$ 2,093$ -$ 1,101,374$ 3,723$ -$ 1,105,097$
The accompanying notes are an integral part of these consolidating basic financial statements.
Shands Teaching Hospital and Clinics, Inc. and Subsidiaries Notes to Supplemental Consolidating Information June 30, 2019 and 2018
60
Purpose of Consolidating Information The accompanying consolidating information presents the financial position and the changes in financial position of each of the significant component operating units and affiliates of Shands as of June 30, 2019 and 2018 and for the years then ended, in conformity with accounting principles generally accepted in the United States of America, including applicable statements of the GASB, on the accrual basis of accounting. The accompanying consolidating information presents adjustments necessary to eliminate significant intercompany accounts and transactions. The accompanying consolidating information is presented for purposes of additional analysis of the consolidated basic financial statements rather than to present the financial position and the changes in financial position of the individual companies and is not a required part of the consolidated basic financial statements. Reclassification of Previously Issued Consolidating Basic Financial Statements Shands reclassified certain information presented in the consolidating basic statement of net position as of June 30, 2018, and the related consolidating basic statement of revenues, expenses and changes in net position for the year then ended to conform to the presentation in the consolidating basic statement of net position as of June 30, 2019, and the related consolidating basic statement of revenues, expenses and changes in net position for the year then ended. These reclassifications are not material to the previously issued consolidated and consolidating basic financial statements.