Shallow landslide prediction and analysis with risk - nhessd
19
Nat. Hazards Earth Syst. Sci. Discuss., 1, 5199–5236, 2013 www.nat-hazards-earth-syst-sci-discuss.net/1/5199/2013/ doi:10.5194/nhessd-1-5199-2013 © Author(s) 2013. CC Attribution 3.0 License. Natural Hazards and Earth System Sciences Open Access Discussions This discussion paper is/has been under review for the journal Natural Hazards and Earth System Sciences (NHESS). Please refer to the corresponding final paper in NHESS if available. Shallow landslide prediction and analysis with risk assessment using a spatial model in the coastal region in the state of São Paulo, Brazil P. I. M. Camarinha 1 , V. Canavesi 1 , and R. C. S. Alvalá 2 1 National Institute for Space Research, São José dos Campos, Brazil 2 Brazilian Centre for Monitoring and Warnings of Natural Disasters – CEMADEN, Cachoeira Paulista, Brazil Received: 21 August 2013 – Accepted: 29 August 2013 – Published: 1 October 2013 Correspondence to: P. I. M. Camarinha ([email protected]) Published by Copernicus Publications on behalf of the European Geosciences Union. 5199 Abstract In Brazil, most of the disasters involving landslide occur in coastal regions, with popula- tion density concentrated on steep slopes. Thus, different approaches have been used to evaluate the landslide risk, although the greatest difficulty is related to the scarcity of spatial data with good quality. In this context, four cities located on the southeast 5 coast of Brazil – Santos, Cubatão, Caraguatatuba and Ubatuba – in a region with the rough reliefs of the Serra do Mar and with a history of natural disasters were evaluated. Spatial prediction by fuzzy gamma technique was used for the landslide susceptibility mapping, considering environmental variables from data and software in the public do- main. To validate the susceptibility mapping results, it was overlapped with risk sectors 10 provided by the Geological Survey of Brazil (CPRM). A positive correlation was ob- served between the classes most susceptible and the location of these sectors. The results were also analyzed from the categorization of risk levels provided by CPRM. To compare the approach with other studies using landslide-scar maps, correlated in- dexes were evaluated, which also showed satisfactory results, thus indicating that the 15 methodology presented is appropriate for risk assessment in urban areas and can be replicated to municipalities that do not have risk areas mapped. 1 Introduction In Brazil there were around 150 records of natural disasters during the period of 1900 to 2013, which have associated numbers that are also alarming: 10 052 fatalities, 71 20 million people affected and a loss of about USD 16 billion (EM-DAT, 2013). Flood events occurred most (57 % of the total), followed by mass movements (11 %). Most of the disasters in Brazil (over 80 %) are associated with severe atmospheric instability, which is responsible for triggering floods, wind storms, tornadoes, hail and landslides. The number and frequency of natural disasters have increased in recent decades, 25 and this is due mainly to a combination of factors: population growth, socio-spatial seg- 5200
Transcript of Shallow landslide prediction and analysis with risk - nhessd

Nat. Hazards Earth Syst. Sci. Discuss., 1, 5199–5236, 2013www.nat-hazards-earth-syst-sci-discuss.net/1/5199/2013/doi:10.5194/nhessd-1-5199-2013© Author(s) 2013. CC Attribution 3.0 License.
Natural Hazards and Earth System
Sciences
Open A
ccess
Discussions
This discussion paper is/has been under review for the journal Natural Hazards and EarthSystem Sciences (NHESS). Please refer to the corresponding final paper in NHESS if available.
Shallow landslide prediction and analysiswith risk assessment using a spatialmodel in the coastal region in the state ofSão Paulo, BrazilP. I. M. Camarinha1, V. Canavesi1, and R. C. S. Alvalá2
1National Institute for Space Research, São José dos Campos, Brazil2Brazilian Centre for Monitoring and Warnings of Natural Disasters – CEMADEN, CachoeiraPaulista, Brazil
Received: 21 August 2013 – Accepted: 29 August 2013 – Published: 1 October 2013
Correspondence to: P. I. M. Camarinha ([email protected])
Published by Copernicus Publications on behalf of the European Geosciences Union.
5199
Abstract
In Brazil, most of the disasters involving landslide occur in coastal regions, with popula-tion density concentrated on steep slopes. Thus, different approaches have been usedto evaluate the landslide risk, although the greatest difficulty is related to the scarcityof spatial data with good quality. In this context, four cities located on the southeast5
coast of Brazil – Santos, Cubatão, Caraguatatuba and Ubatuba – in a region with therough reliefs of the Serra do Mar and with a history of natural disasters were evaluated.Spatial prediction by fuzzy gamma technique was used for the landslide susceptibilitymapping, considering environmental variables from data and software in the public do-main. To validate the susceptibility mapping results, it was overlapped with risk sectors10
provided by the Geological Survey of Brazil (CPRM). A positive correlation was ob-served between the classes most susceptible and the location of these sectors. Theresults were also analyzed from the categorization of risk levels provided by CPRM.To compare the approach with other studies using landslide-scar maps, correlated in-dexes were evaluated, which also showed satisfactory results, thus indicating that the15
methodology presented is appropriate for risk assessment in urban areas and can bereplicated to municipalities that do not have risk areas mapped.
1 Introduction
In Brazil there were around 150 records of natural disasters during the period of 1900to 2013, which have associated numbers that are also alarming: 10 052 fatalities, 7120
million people affected and a loss of about USD 16 billion (EM-DAT, 2013). Flood eventsoccurred most (57 % of the total), followed by mass movements (11 %). Most of thedisasters in Brazil (over 80 %) are associated with severe atmospheric instability, whichis responsible for triggering floods, wind storms, tornadoes, hail and landslides.
The number and frequency of natural disasters have increased in recent decades,25
and this is due mainly to a combination of factors: population growth, socio-spatial seg-
5200

regation, accumulation of capital in dangerous areas, and global changes (Winchesterand Szalachman, 2009). Such factors have assumed (1) that developing countries andthe poorest are those who will experience the highest number of fatal casualties anddisasters, (2) the dangerous areas (hazard zones) focus on cities in port areas andriver plains (areas that facilitate trade and the sale of products), (3) the technological5
advancement of communications, where the registry, storage and transmission of dis-aster data can lead to a higher count of events in relation to previous periods, (4) andglobal changes, including the change of climate dynamics and the increase in numberof storms in the last decades (Anbalagan, 1992; Kobiyama et al., 2006; Marcelino etal., 2006).10
Several studies have focused on evaluating the causes and mechanisms of inducingmass movements on the slopes and where they can occur based on a set of envi-ronmental characteristics, as well as their intensification in the last decades due totwo main factors: the growing awareness of the economic importance of such disas-ters and increasing pressure from development and urbanization on the environment15
(Varnes et al., 1984; Aleotti and Chowdhury, 1999; Carrara et al., 1995; Guzzetti et al.,2005; Chung and Fabbri, 2005).
However, mapping and prediction of landslides probability are not simple tasks, be-cause they depend on a very complex knowledge of mass movements on the slopesas well as the factors that control them. The reliability of landslide susceptibility maps20
depends mainly on the quantity and quality of available data, the scale of work and theselection of the appropriate methodology of analysis and modeling (Ayalew and Yam-agishi, 2005). A map of slope instability should provide information about the spatialdistribution, type, volume, speed and distance achieved by mass movements in a givenarea in a given period of time (Hartlen and Viberg, 1988; Cascini et al., 2013).25
The mapping of the susceptible landslide areas in urban areas then becomes a workof the utmost importance, because, in particular, of the relationship of the landslidesto losses (human or materials), resulting in a more complex analysis. Some sites aredensely populated areas and the assessed landslide damages are highly significant.
5201
The input data for this analysis include environmental factors, triggering factors, historiclandslide occurrences and elements at risk. Historical information about occurrences oflandslides is the most important, since it is related with the frequency of the phenom-ena, types, volumes and the damage that was caused, but it is not always available(Sassa et al., 2004; van Westen et al., 2006).5
The purposes of the studies involving landslides prediction and assessments are tosupport and promote public policies that use such information on disaster mitigation,essentially exposing the main causal factors in relation to possible anthropogenic inter-ference also for the development of the phenomenon. Particularly in Brazil, in 2011 theBrazilian Centre for Monitoring and Warnings of Natural Disasters (CEMADEN) was10
created, whose goals are to develop, test and implement a system for predicting theoccurrence of natural disasters in susceptible areas of the whole country; to identifyvulnerabilities in the use and occupation of land; and to do acts raising awareness andconsequently raise readiness of the population at risk, leading to early and effectiveactions of prevention and harm reduction (http://www.cemaden.gov.br/).15
One of the regions of Brazil that requires disaster risk assessments involving land-slides is the coastal plain in the state of São Paulo, near the Serra do Mar, which is amountain chain of more than 1000 m above sea level. Such location accompanied bypopulation growth, lack of urban planning and property speculation are some triggersof natural disasters. This region is an important tourist center and has one of the im-20
portant ports of the country, in addition to experience with frequent natural disastersduring the summer rains. So, the objective of this study was to evaluate the landslidesusceptibility (specifically for shallow translational landslides, induced and natural) infour coastal municipalities in the state of São Paulo, based on a methodology using afree geographic information system and a free database, aiming at landslide suscep-25
tibility mapping, which can provide a useful and reliable tool for natural disaster man-agement. Additionally, information on human occupation was integrated with landslidesusceptible areas to indicate possible risk areas, which was validated by comparingthe results with risk sectors previously mapped by the Brazilian Geological Survey.
5202

2 Study area
Located on the coast of São Paulo State, the Serra do Mar region presents a setof rugged mountains, becoming a region of strategic importance for the developmentof the country and the state and national economy, including ports, roads, pipelines,and important tourist centers. The historical recurrence of phenomena associated with5
landsliding on the slopes of the Serra do Mar has often resulted in the loss of humanlives and significant damage to the economy, society and environment (Almeida andCarneiro, 1998). Four municipalities in this region were chosen for a preliminary analy-sis since they have a natural disaster history involving landslides and, also, have greateconomic importance, mainly due to their port facilities, industrial centers and local10
tourism. They are Santos, Ubatuba, Cubatão and Caraguatatuba (Fig. 1).Table 1 characterizes the four municipalities evaluated in this study. They occupy an
area of approximately 1600 km2. Santos and Caraguatatuba stand out for HDI-M (Mu-nicipal Human Development Index) values considered too high; Cubatão and Ubatubawere classified as HDI-M high, reaffirming the importance of these municipalities in15
Brazil.Practically in every rainy season (November–April) there are isolated occurrences of
landslides in the region. Although Fig. 2 represents the monthly distribution of rainfall,the extreme meteorological events that trigger landslides usually occur between Jan-uary and mid-March, and that does not appear necessarily in climatological normals.20
According to IPMet (2013), these municipalities have 21 registered landslide eventsin the last 20 yr (1993–2013), with 2182 victims (homeless and displaced persons) and12 deaths, as shown in Table 2. However, there are also records of great landslidedisasters before this period and those must be highlighted. For example, in the munic-ipality of Santos, on 10 March 1928, there were landslides in large part on the slopes25
of Mont Serrate that buried many homes and several outbuildings of the Holy Houseof Mercy and resulted in 80 deaths (Instituto Geológico, 2009); in 1946 there was alandslide with 56 deaths; and on 24 March 1990 there was a landslide with 2 fatal ca-
5203
sualties and 174 homeless. In the city of Cubatão, on 6 February 1994 the PresidenteBernardes Oil Refinery was partially buried by debris flow without victims, but withdamage of USD 44 million (Cruz et al., 1998; Massad et al., 2004). In the municipalityof Caraguatatuba, on 18 March 1967 the city was the target of an extreme rainfall event(576 mm in 48 h) which triggered hundreds of landslides, resulting in 120 people killed5
and 400 houses destroyed (Kanji et al., 2003).During the second half of the last century, the regular areas that relied on the local in-
frastructure were practically exhausted due to the great population growth and propertyspeculation. These cities have some legal restrictions about the verticalization process,which has led the urban sprawl to migrate toward areas close to the slopes and hills10
(Fig. 3). This feature, linked to property speculation, favors the illegal occupation inconservation areas and/or in risk areas.
3 Methodology
Figure 4 summarizes schematically the data and the methodology used in the presentstudy. The software SPRING, a free GIS (geographic information system) with im-15
age processing functions, spatial analysis, numerical modeling of land and spa-tial databases query, was used. The download is available at http://www.dpi.inpe.br/spring/portugues/download.php. The used satellite images (Resourcesat and oth-ers) are also distributed for free by the National Institute for Space Research – INPE(http://www.dgi.inpe.br/CDSR/).20
The land use and land cover map was obtained based on images of the LISS (LinearImaging Self-Scanner) III sensor, on board in Resourcesat satellite, for the 2012 year,which are also provided by INPE. The supervised classification and graphic edition forthe correction of the commission and omission errors was utilized. The final map, in-cluding agriculture, urban area, Eucalyptus, forest, mangrove, pasture, “restinga” and25
bare soil classes was generated, in which the weights assigned to each land use classdepend on the type of vegetation coverage. As highlighted by Atkinson and Massari
5204

(1998), several factors may influence the landslide susceptibility (enhancing or miti-gating) – such as presence and type of vegetation, vertical and horizontal curvature,slope, soil and geology – and must be evaluated.
The topography was considered by using the database for slope and horizontaland vertical curvatures, provided by TOPODATA project (Valeriano, 2005) and avail-5
able at http://www.dsr.inpe.br/topodata, with 30 m spatial resolution, which is a productof SRTM (Shuttle Radar Topography Mission). The vertical curvature corresponds tothe terrain’s concave/convex character. The horizontal curvature refers to the diver-gent/convergent character of water/matter flows on the ground when analyzed on ahorizontal projection. Several geomorphological studies have called attention to the10
role played by the concave portions of the relief (hollows) on the convergence of wa-ter streams, both surface and sub-surface, favoring the development of soil saturationconditions and ultimately the generation of landslides on the slopes (Tsukamoto et al.,1982; Reneau et al., 1984; Crozier and Vaughan, 1990; Dietrich and Dunne, 1993;Fernandes et al., 1994, 2004). Thus, convergent (horizontal curvature) and concave15
(vertical curvature) relief forms received the highest weights in susceptibility analysis(Neuhauser and Terhorst, 2007; Brenning, 2005; Talebi et al., 2008). For the slope map,the steeper slopes are more disposed to landslides, and this is one of the key factors ininducing slope instability. As the slope angle increases, shear stress on soil or other un-consolidated material generally increases as well. Gentle slopes are expected to have20
a low frequency of landslides because of generally lower shear stress associated withlow gradients (Anbalagan, 1992). The slope classes were given weights in descendingorder. Each class, in each map, was attributed a weight in relation to susceptibility, asshown in the Table 3.
The geological data (1 : 750 000) were obtained from the Brazilian Geological Survey,25
available on the website of the CPRM (Research and Mineral Resources Company,http://www.cprm.gov.br/). The relationships of different types of rock with landslideswere considered as the basis for the weighting. Igneous rocks had the lowest land-
5205
slide probabilities, while intermediate metamorphic and sedimentary rocks had a lowerresistance to weathering, i.e., a greater landslide probability (Dai et al., 2001).
A soil map at a 1 : 500 000 scale was acquired from the IAC (Agronomic Instituteof Campinas), produced by Oliveira et al. (1999). For the different soil classes, theweights were based on the principle that soils with a higher amount of sand and/or5
that are shallow and non-cohesive tend to be more susceptible than soils with moreclay and/or that are deep, generally with high cohesion. The susceptibility values for allclasses present in the different themes addressed are presented in Table 3.
Figure 5 presents some features of the study area. The main geological units inthe study area are the migmatite/gneiss and biotite, the first with a low degree of sus-10
ceptibility to landslides (see Table 3). The Haplic Cambisols are the most common,coming to occupy 80 % of the study area, with high degree of susceptibility. Analyzingthe horizontal curvature of the terrain, the classes are distributed evenly, unlike verticalcurvature for which extreme classes are those that occur more (very convex and con-cave). The class very concave occupies approximately 50 % of the study area and is15
the one that has the greatest degree of susceptibility. The slope of the terrain appearsin about 70 % of the area to fall into strongly wavy and hilly classes, also the mostsusceptible to landslides. The predominant land cover and use is “forest”, occupying75 % of the total area, this mostly on the slopes and tops of the hills. After the forestedarea in presence on the coastal plain was the urban area (8 % of the total area), getting20
close to the mountainous region of the Serra do Mar.The six themes were combined to generate a final susceptibility map using the fuzzy
gamma operator. The fuzzy operator was introduced by Zadeh (1965) and allows amore realistic treatment of the imprecise and subjective data that are part of analy-ses of physical environments. The fuzzy theory employs the idea of member functions25
and expresses the degree of membership with respect to some attribute, in this case
5206
landslide susceptibility. The fuzzy gamma operator is presented in Eq. (1).
µcombination =
(1−
n∏i=1
µi (1−µi )
)γ
·(
n∏i=1
µi
)1−γ
, (1)
where γ (gamma) is a parameter within the range (0,1). Susceptibility maps were gen-erated with values of gamma equal to 0.8, which was divided into five susceptibilityclasses equidistant, with gaps equal to 0.20, from 0 to 1.0. Finally, aiming at a bet-5
ter visualization of the results, a “mask” was created to filter the mapping areas withslopes less than 10 %. This step is based on the regional historical data and consultedliterature that indicate there is no occurrences of landslides for these cases.
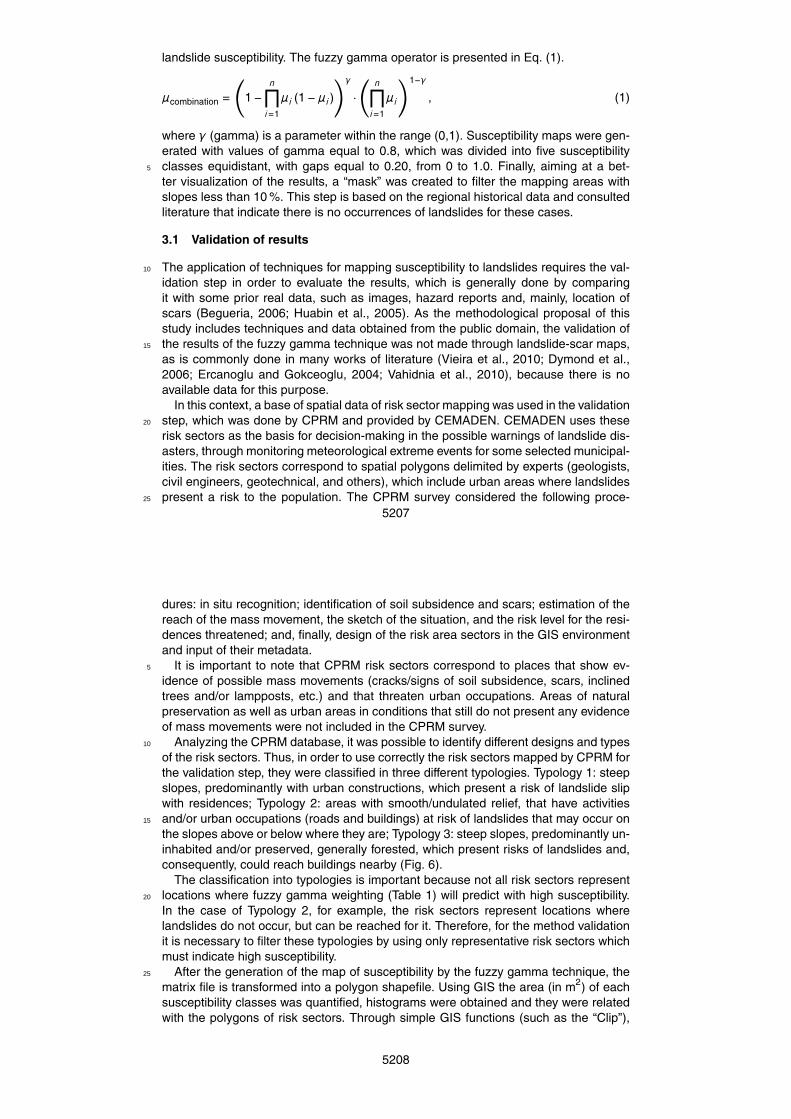
3.1 Validation of results
The application of techniques for mapping susceptibility to landslides requires the val-10
idation step in order to evaluate the results, which is generally done by comparingit with some prior real data, such as images, hazard reports and, mainly, location ofscars (Begueria, 2006; Huabin et al., 2005). As the methodological proposal of thisstudy includes techniques and data obtained from the public domain, the validation ofthe results of the fuzzy gamma technique was not made through landslide-scar maps,15
as is commonly done in many works of literature (Vieira et al., 2010; Dymond et al.,2006; Ercanoglu and Gokceoglu, 2004; Vahidnia et al., 2010), because there is noavailable data for this purpose.
In this context, a base of spatial data of risk sector mapping was used in the validationstep, which was done by CPRM and provided by CEMADEN. CEMADEN uses these20
risk sectors as the basis for decision-making in the possible warnings of landslide dis-asters, through monitoring meteorological extreme events for some selected municipal-ities. The risk sectors correspond to spatial polygons delimited by experts (geologists,civil engineers, geotechnical, and others), which include urban areas where landslidespresent a risk to the population. The CPRM survey considered the following proce-25
5207
dures: in situ recognition; identification of soil subsidence and scars; estimation of thereach of the mass movement, the sketch of the situation, and the risk level for the resi-dences threatened; and, finally, design of the risk area sectors in the GIS environmentand input of their metadata.
It is important to note that CPRM risk sectors correspond to places that show ev-5
idence of possible mass movements (cracks/signs of soil subsidence, scars, inclinedtrees and/or lampposts, etc.) and that threaten urban occupations. Areas of naturalpreservation as well as urban areas in conditions that still do not present any evidenceof mass movements were not included in the CPRM survey.
Analyzing the CPRM database, it was possible to identify different designs and types10
of the risk sectors. Thus, in order to use correctly the risk sectors mapped by CPRM forthe validation step, they were classified in three different typologies. Typology 1: steepslopes, predominantly with urban constructions, which present a risk of landslide slipwith residences; Typology 2: areas with smooth/undulated relief, that have activitiesand/or urban occupations (roads and buildings) at risk of landslides that may occur on15
the slopes above or below where they are; Typology 3: steep slopes, predominantly un-inhabited and/or preserved, generally forested, which present risks of landslides and,consequently, could reach buildings nearby (Fig. 6).
The classification into typologies is important because not all risk sectors representlocations where fuzzy gamma weighting (Table 1) will predict with high susceptibility.20
In the case of Typology 2, for example, the risk sectors represent locations wherelandslides do not occur, but can be reached for it. Therefore, for the method validationit is necessary to filter these typologies by using only representative risk sectors whichmust indicate high susceptibility.
After the generation of the map of susceptibility by the fuzzy gamma technique, the25
matrix file is transformed into a polygon shapefile. Using GIS the area (in m2) of eachsusceptibility classes was quantified, histograms were obtained and they were relatedwith the polygons of risk sectors. Through simple GIS functions (such as the “Clip”),
5208

it was possible to identify and quantify the susceptibility classes that are inside of thepolygons that form the risk sectors.
For the results it is expected that the risk sectors must be composed mostly by thehigher susceptibility classes. Thus, the proportional areas occupied by each class ofsusceptibility inserted in the risk sectors were quantified and are represented through5
the index “Risk Concentration” (RC), i.e., RC is the frequency (percentage) of each sus-ceptibility class within the risk sector boundaries. Another index also was used: “RiskPotential” (RP). The RP index is the ratio between the area occupied by each suscep-tibility class inside of the risk sectors, and the total area of each susceptibility classinside all urban boundaries of study area. In some studies in literature, similar indexes10
are used, generally named “Landslide Concentration” (LC) and “Landslide Potential”,but referring to the same ratio. The different nomenclature is due to the ordinary useof the landslide-scar maps instead of risk sectors (or risk areas) and can be used forcomparison between different studies.
Besides these analyses, another approach was adopted based on the terminology15
“risk levels” used by CPRM and considered by some recent studies (Listo and Vieira,2012; Pascarelli et al., 2011). The risks are classified based on natural and anthro-pogenic factors and represent four probability levels of landslide occurrence and theirprobable impacts, defined through in situ analysis done by experts from the BrazilianGeological Survey. The description of the risk levels is presented below (Table 4). In20
this analysis, the aim is to find correlations between risk levels and the landslide sus-ceptibility classes (the higher the risk level, the higher the susceptibility classes are).
4 Results and discussions
4.1 General discussions for landslide susceptibility maps
In general, the final results (shown in Fig. 7) indicate that the spatial patterns of sus-25
ceptibility to landslides are in accordance with the expected, that is, (i) hilltop regions,
5209
forested and preserved slopes and sedimentary deposits (usually very close to thecoast, where 90 % of the urban area is located) are mostly less susceptible; and (ii)slopes with human activities, usually delineated by mass movements that occurred inthe past (e.g., very convex curvature), with shallow soils or average depth showed up,mostly, with higher susceptibility.5
Detailed analyses of the results indicate that the susceptibility modeling is consistentwith the expected, that is, the risk sectors are located in areas more susceptible to land-slides (“high” and “very high” classes). The frequencies of occurrence for each suscep-tibility classes for whole study area were calculated, which are presented in Fig. 8. Theresults indicate the predominance of “medium” susceptibility class (44.7 %), followed by10
the class with “high” (30.8 %) and “low” susceptibility (23.9 %). The susceptibility class“very low” represents only 0.1 % of the study area, while the “very high” class occupiesa slightly higher proportion, with 0.5 %. This trend of most critical susceptibility classes(high and very high) occupy a larger proportion area than the more stable classes (lowand very low) is consistent with the expected for the great slopes of the Serra do Mar15
and its rugged terrain, as well as the expansion of urban areas towards the hillsides.This trend of high susceptibilities is consistent with the expected high slopes of theSerra do Mar and its rugged terrain, as well as the expansion of urban areas towardsthe slopes.
A detailed analysis of the results indicates that the susceptibility modeling is consis-20
tent with the expected, that is, the risk sectors are located in areas more susceptibleto landslides (represented by “high” and “very high” classes). The “Risk Concentration”index (RC) was calculated for all 233 risk sectors (which totalize an area of 282.44 ha)and correspond to the susceptibilities classes’ distribution of frequency inside them.This step was done for the three typologies of risk sectors in order to have a differenti-25
ated analysis of the three typologies of risk sectors previously defined and are shownin Fig. 9.
When only the risk sector areas are considered (three typologies included), theclasses “high” and “very high” occupy about 56.1 % and 8.6 % of the area, respec-
5210

tively (column “Total” at Fig. 9). These values are much higher than the average ofthe study area (30.8 % and 0.5 %, respectively), which indicates a positive correlationbetween risk sectors and high susceptibility classes. This fact indicates the accuracyof the technique used, and also it becomes more representative when only Typology 1is analyzed, that is, inhabited steep slopes that are at risk of slipping. For Typology 1,5
the two classes “high” and “very high” account together for a RC of 72.5 % (60.5 % and12 %, respectively).
Concerning the classes “low” and “medium” susceptibility, it is expected to find a neg-ative correlation with risk sectors, which should be less composed by these classes.For the whole study area analyzed, 23.3 % of the area belongs to the class “low” and10
44.7 % to “medium” (Fig. 8). On the other hand, the RC index for all risk sectors (con-sidering three typologies) is 1.7 % for the “low” class and 33.7 % for the “medium” class.So, these values are less than the ones found for the average of the study area, espe-cially for “low” class, which really establishes a negative correlation for these classes.
This result indicates that only an insignificant portion of the risk sector is located in15
the “low” susceptibility class and probably this residual value of 1.7 % is due to thedifferent designs/drawing of the sectors. Also, this result is better observed when theTypology 3 is analyzed, which is the one with largest portion in the “lower” class, withRC equal to 6.8 %. Among the three typologies, this is the sector where the risk hasnot been defined from the location of the urban area; so, the risk refers to the slopes20
(usually forested) that can slip and reach nearby residences. For Typology 3, the landuse class is mostly “forest”, whose weight is the lowest (0.4 – Table 3). Therefore, weare likely to find lower values of susceptibility for this type of sector, which justifies thehighest RC for the “low” class. Although the value of 6.8 % is the highest among thetypologies, it should be noted that it is still well below the regional average (23.3 %).25
Analysis of the chart shown on the far right in Fig. 9 also corroborates the importanceof risk sector classification in different typologies, which allows its use for the validationof the results, since they consider different characteristics and make possible separateevaluation. While risk sector of Type 1 stands out in having the highest RC for the
5211
“very high” class, the Typology 3 stands out in the class “low”, and the Typology 2 isintermediate. This distribution is in accordance with the specifications considered foreach typology.
Although six maps have made the fuzzy gamma technique, the good quality of lin-eation/design of susceptibility classes is mainly due to the topographic data for TOPO-5
DATA. The use of the slope and horizontal and vertical curvature with 30m resolutionidentified the reliefs’ specificities and well represented the characteristics that matterin the analysis of landslides, achieving good results even though data was from a freedatabase.
4.2 Comparative discussions10
It was mentioned that the validation method described above is commonly used instudies for landslide susceptibility evaluation. Many of the studies use mathematicalmodels to predict the unstable areas (e.g., SHALSTAB, TRIGRS, SinMAP, among oth-ers) from high-resolution digital elevation models (DEM) and consider, for validation,landslides-scar maps (Dietrich and Montgomery, 1998; Guimarães et al., 2003; Vieira,15
2007; Listo and Vieira, 2012). Although the methods used involve high resolution infor-mation, geotechnical parameters and models based on physical phenomena of land-slide, the accuracy rate found in these studies is similar to the ones found in the presentstudy, as shown below. Moreover, most studies in the literature only analyze areas withlow human intervention or natural regions (commonly watersheds are used as study ar-20
eas). There are few studies focusing on heavily urbanized areas as well as addressingdirectly the issue of risk.
Vieira (2010) conducted a study to evaluate risks in the Serra do Mar (state of SãoPaulo, Brazil) region considering a non-urbanized watershed and using the TRIGRSmodel and a high-resolution DEM (4 m2), in addition to the geotechnical parameters,25
as the input data. His results indicated a concentration of unstable areas (defined forclasses with the safety factor (SF) ≤1) above 50 % within the landslide scars. Morespecifically, in Vieira (2010) the class most critical (SF between 0.4 and 0.8) occupied
5212

20 % of the scars, while the following class (SF between 0.8 and 1.0) held valuesaround 30 %. For the present study (considering Typology 1 and the fuzzy gammatechnique), about 72 % of the area of risk sectors belongs to the classes that are moresusceptible (12 % in areas of “very high” and 60 % for “high” susceptibility). This resultis consistent with the studies carried out considering the concentration of scars for5
validation, that is, around 75 % in the most critical classes (for example, Crosta andFrattini, 2003; Salciarini et al., 2006).
One of the studies considering a similar analysis for heavily urbanized areas in thecity of Juiz de Fora, Minas Gerais State, Brazil, was performed by Zaidan and Fernan-des (2009). They also used a high-resolution DEM and the SHALSTAB mathematical10
model and found about 19 % of the total area in the classes was considered unstable,with a high scar concentration (SC index) in these classes, approximately 70 %. In ourstudy, it was found that 0.5 % of total study area is in the most susceptible class (“veryhigh”), while 30.8 % is in the class “high”, and the RC index (comparative to SC index)is 72.5 %.15
Another approach was used by using the Risk Potential index for all typologies andthe results are presented in Table 5.
For comparative purposes of results presented in Table 5, some important studiesthat used related indexes were listed out. The Landslide Potential index (LP – similarto RP) found in the study presented by Vieira (2010) was approximately 5.7 % for the20
most unstable class (FS between 0.4 and 0.8) and decreasing to 1 % for stable classes(FS between 1.5 and 7.0). Thus, the LP indicates that 5.7 % of all locations identifiedby the model as unstable are inserted into the mapped landslide-scars, and this value(higher than 5 %) is recognized in literature as good quality.
In another study, Listo and Vieira (2010) used SHALSTAB model to map the landslide25
susceptibility in a small catchment area (9 km2), with a high-resolution digital terrainmodel (4 m2) and geotechnical parameters for evaluating only 13 risk sectors. Listoand Vieira (2010) found a RC index close to 70 % for the two classes most unstable(41 % for the most critical) and a RP index equal to 12 % for the most critical class
5213
and reaching values below 1 % for the less critical class. As previously shown, for thepresent study the RP index for Typology 1 (RP1) was about 6.00 % and the RC index forthe two more susceptible classes shown in Fig. 7 was 72.5 % (12 % for “very high” and60 % for “high”). Thus, the indexes used for validation indicate a satisfactory quality ofthe methodology results, approaching the values found in recent literature, even without5
high-resolution data being used.
4.3 Risk levels analysis
In Fig. 10, the comparative analysis between risk levels defined by CPRM (R1, R2, R3and R4) and susceptibility classes are shown. This analysis was performed consider-ing only the risk sector of Typology 1, which among the three types of classification10
presents the risk within the sector boundaries, thus allowing this type of analysis.In Fig. 10 it can be seen that the higher the risk rating, the lower the proportion
of predicted areas with low susceptibility is (low and medium). On the other hand,the classes most susceptible occupy a larger portion of these sectors (when addingclasses “high” to “very high”) as shown in following:15
– 52 % for R1: 21 sectors (12.62 ha), RC=52 % for high, RC=0 % for very high;
– 75 % for R2: 51 sectors (42.31 ha), RC=70 % for high, RC=5 % for very high;
– 76 % for R3: 56 sectors (64.07 ha), RC=57 % for high, RC=19 % for very highand;
– 82 % for R4: 24 sectors (22.63 ha), RC=78 % for high, RC=4 % for very high.20
Interestingly, the R3 risk category showed the highest RC for the “very high” suscep-tibility class (19 %). Analyzing the database, it was noted that this fact occurred due tothe largest risk sector found in the study area (approximately 14.2 ha – 142 000 m2 – inCubatão), almost entirely in an area with “very high” susceptibility. Assuming that thisclassification for risk sectors is defined by criteria which may be considered differently25
5214

by specialists (subjectivity), there is the possibility that this sector would have beenconsidered in other classes. For example, assuming that only this risk sector (that isonly 1 in 59 sectors) had been classified in Class R4, the analysis presented in Fig. 10would be exactly as expected (R4 with the highest percentage of “very high” class).Therefore, it is clear that the evidence found in situ was more important than suscep-5
tibility prediction regarding the categorization of the risk levels, but they are necessaryand complementary to one another.
5 Conclusions
The proposed methodology presented a feasible and practical form for supporting thelandslide-disasters assessments by using a free database and free software. In this10
context, two aspects can be highlighted: (i) the first refers to the quality of resultsachieved in the analysis of risk within densely populated urban areas, a case rela-tively unexplored within the modeling of landslide susceptibility; and (ii) secondly, theusability and easy replicability for other study areas, given that the used variables canbe acquired by any user, and that the weighing of thematic classes is a step that can15
be flexible and appropriate for other areas, from prior knowledge of the local character-istics and their specificities.
The validation of the results by using recognized indexes in the literature (RC andRP) has demonstrated that the methodology has implied satisfactory results, espe-cially considering the scale of the work (medium-resolution). Moreover, a new option20
for validation of landslide susceptibility mapping was proposed using risk sector in-stead of landslide-scar maps, which are constantly used. In this case, the use of thisevaluation unit has involved new considerations and assumptions, but those that couldachieve good indexes of validation and that have demonstrated the effectiveness androbustness from the assessment of such indexes in other studies. In this respect, the25
methodology was effective in determining the risk in urban areas and not only the indi-cation of susceptible areas on slopes in preserved areas, as is commonly done.
5215
The index of Risk Potential, found to be close to the value of 6 %, is within the aver-age found in the literature for high-resolution studies and it means that 1 out of every16 ha categorized from the methodology as “very high” susceptibility class indicatesone area of real risk already mapped. Taking into consideration that there is the possi-bility of some cases that have not been mapped yet, this is indicative for a satisfactory5
quality of the results and points out that the methodology can support the managementof landslide risk, as well as providing a basis for decisions as to warnings of natural dis-asters.
The Risk Concentration index for Typology 1 achieved the value of 72 % by join-ing the two most susceptible classes. Although this value of 72 % is also satisfactory10
in the cited literature, it means that the remaining 28 % of the total area indicatedfrom the model has lower susceptibility areas that belong to the sectors of risk. Inthis case, it was observed that this “error” comes mainly due to the subjectivity of thedrawings/design-stage of sectors at risk, done by the responsible agencies (CPRM).On the other hand, when analyzing the same RC index for the different risk categories15
(R1, R2, R3 and R4), it was found that the model provides enhanced adherence for themost critical sectors: R3 (RC=76 %) and R4 (RC=84 %). Therefore, this fact reflectsa trend that the methodology is best suited to indicate areas of risk in the most criticalsituations.
Thus, in view of the emergency demands of Brazil regarding the mitigation of impacts20
caused by landslides every year, this methodology proved robust and had high usabilitynot only to analyze the risk inherent in the present day, but provided the ability toanalyze future risk areas that may result from population growth toward the slopes.
References
Aleotti, P. and Chowdhury, R.: Landslide hazard assessment: summary review and new per-25
spectives, Bull. Eng. Geol. Environ., 58, 21–44, 1999.
5216

Almeida, F. F. M. and Carneiro, C. D. R.: Origem e evolução da Serra do Mar, Rev. Bras.Geosci., 28, 135–150, 1998.
Anbalagan, R.: Landslide hazard evaluation and zonation mapping in mountainous terrain, Eng.Geol., 32, 269–277, 1992.
Atkinson, P. M. and Massari, R.: Generalised linear modelling of susceptibility to landsliding in5
the Central Apennines, Italy, Comput. Geosci., 24, 373–385, 1998.Ayalew, L. and Yamagish, H.: The application of GIS-based logistic regression for landslide
susceptibility mapping in the Kakuda-Yahiko Mountains, Central Japan, Geomorphology, 65,15–31, 2005.
Begueria, S.: Validation and evaluation of predictive models in hazard assessment and risk10
management, Nat. Hazards, 37, 315–329, 2006.Brenning, A.: Spatial prediction models for landslide hazards: review, comparison and evalua-
tion, Nat. Hazards Earth Syst. Sci., 5, 853–862, doi:10.5194/nhess-5-853-2005, 2005.Carrara, A., Cardinali, M., Guzzetti, F., and Reichenbach, P.: GIS-based techniques for map-
ping landslide hazard, in: Geographical Information Systems in Assessing Natural Hazards,15
edited by: Carrara, A. and Guzzetti, F., Kluwer Academic Publishing, 135–176, 1995.Cascini, L., Peduto, D., Pisciotta, G., Arena, L., Ferlisi, S., and Fornaro, G.: The combination of
DInSAR and facility damage data for the updating of slow-moving landslide inventory maps atmedium scale, Nat. Hazards Earth Syst. Sci., 13, 1527–1549, doi:10.5194/nhess-13-1527-2013, 2013.20
Chung, C. J. F. and Fabbri, A. G.: Systematic procedures of landslide hazard mapping for riskassessment using spatial prediction models, in: Landslide Hazard and Risk, edited by: Glade,T., Anderson, M., and Crozier, M. J., Wiley, Chichester, 139–177, 2005.
Crosta, G. B. and Frattini, P.: Distributed modelling of shallow landslides triggered by intenserainfall, Nat. Hazards Earth Syst. Sci., 3, 81–93, doi:10.5194/nhess-3-81-2003, 2003.25
Crozier, M. J. and Vaughan, E. E.: Relative instability of colluvium-filled bedrock depressions,Earth Surf. Process. Landf., 15, 329–339, 1990.
Dai, F. C., Lee, C. F., Li, J., and Xu, Z. W.: Assessment of landslide susceptibility on the naturalterrain of Lantau Island, Hong Kong, Environ. Geol., 40, 381–391, 2001.
Dietrich, W. E. and Dunne, T.: The channel head, in: Channel Network Hydrology, edited by:30
Beven, K. and Kirkby, M., Wiley, Chichester, 175–219, 1993.
5217
Dietrich, W. E. and Montgomery, D. R.: SHALSTAB: a digital terrain model for mapping shal-low landslide potential. NCASI (National Council of the Paper Industry for Air and StreamImprovement): Technical Report, 1998.
Dymond, J. R., Ausseil, A. G., Shepherd, J. D., and Buettner, L.: Validation of a region-widemodel of landslide susceptibility in the Manawatu-Wanganui region of New Zealand, Geo-5
morphology, 74, 70–79, 2006.EM-DAT: The OFDA/CRED International Disaster Database, http://www.em-dat.net, 2013.Ercanoglu, M. and Gokceoglu, C.: Use of Fuzzy relations to produce landslide susceptibility
map of a landslide prone area (West Black Sea Region, Turkey), Eng. Geol., 75, 229–250,2004.10
Fernandes, N. F., Coelho Netto, A. L., and Lacerda, W.: A Subsurface hydrology of layeredcolluvium mantles in unchannelled valleys – southeastern Brazil, Earth Surf. Process. Landf.,19, 609–626, 1994.
Fernandes, N. F., Guimaraes, R. F., Gomes, R. A. T., Vieira, B. C., Montgomery, D. R., andGreenberg, H.: Topographic Controls of Landslides in Rio de Janeiro: Field Evidences and15
Modeling, Catena, 55, 163–181, 2004.Guimarães, R. F., Montgomery, D. R., Greenberg, H. M., Fernandes, N. F., Gomes, R. A. T.,
and Carvalho Junior, O. A.: Parameterization of soil properties for a model of topographiccontrols on shallow landsliding: application to Rio de Janeiro, Eng. Geol., 69, 99–108, 2003.
Guzzetti, F., Reichenbach, P., Cardinali, M., Galli, M., and Ardizzone, F.: Landslide hazard as-20
sessment in the Staffora basin, northern Italian Apennines, Geomorphology, 72, 272–299,2005.
Hartlen, J. and Viberg, L.: Evaluation of landslide hazard, in: Proceedings of 5th InternationalSymposium on Landslides, Rotterdam, Balkema, 1037–1058, 1988.
Huabin, W., Gangjun, L., Weiya, X., and Gonghui, W.: GIS-based landslide hazard assessment:25
an overview, Progr. Phys. Geogr., 29, 548–567, 2005.INMet – Instituto de Meteorologia: Normais climatológicas do Brasil 1961–1990, available at:
http://www.inmet.gov.br/portal/index.php?r=clima/normaisClimatologicas, 2013.Instituto Geológico: Desastres naturais: conhecer para prevenir, L. K. Tominaga, J. Santoro, R.
Amaral (Orgs.), São Paulo, Instituto Geológico, 2009.30
IPMet – Instituto de Pesquisas Meteorológicas: Banco de Dados de Desastres Nat-urais, available at: http://www.ipmet.unesp.br/index2.php?abre=ipmet_html/defesa_civil/index.php, 2013.
5218

Kanji, M. A., Cruz, P. T., and Massad, F.: Debris flow affecting the Cubatão Oil Refinery, Brazil.Landslides, 5, 71–82, 2008.
Kobiyama, M., Mendonça, M., Moreno, D. A., Marcelino, I. P. V. O., Marcelino, E. V., Gonçalves,E. F., Brazetti, L. L. P., Goerl, R. F., Molleri, G. S. F., and Rudorff, F. M.: Prevenção dedesastres naturais: conceitos básicos, Organic Trading, Curitiba, 2006.5
Listo, F. L. R. and Vieira, B. C.: Mapping of risk and susceptibility of shallow-landslide in the cityof São Paulo, Brazil, Geomorphology, 169–170, 30–44, 2012.
Marcelino, E. V., Nunes, L. H., and Kobiyama, M.: banco de dados de desastres naturais:análise de dados globais e regionais, Caminhos de Geogr., 6, 130–149, 2006.
Ministério das Cidades (Ministry of Cities of Brazil), IPT (Technology Research Institute of the10
São Paulo State): Manual de treinamento de técnicos municipais para o mapeamento egerenciamento de áreas urbanas com risco de escorregamentos, enchentes e inundações,CPRM/SGB, Rio de Janeiro, 2004.
Ministério das Cidades/Cities Alliance: Prevenção de Riscos de Deslizamentos em Encostas:Guia para Elaboração de Políticas Municipais, Carvalho, C. S., Galvão, T. (Org.), Brasília:15
Ministério das Cidades; Cities Alliance, 2006.Neuhäusera, B. and Terhorstb, B.: Landslide susceptibility assessment using “weights-of-
evidence” applied to a study area at the Jurassic escarpment (SW-Germany), Geomorphol-ogy, 86, 12–24, 2007.
Oliveira, J. B., Camargo, M. N., Rossi, M., and Calderano Filho, B.: Mapa pedológico do Es-20
tado de São Paulo: Legenda expandida. Instituto Agronômico/EMBRAPA Solos, Campinas,Brazil, 1999.
Pascarelli, L., lançone, L., Costa, R., Pires, L., Macedo, E., Mirandola, F., Checchinato, F., andCanil, K.: Mapping geological at-risk areas in the city of São Paulo: issues and results fromthe largest risk survey in Brazil. Proceedings of the Second World Landslide Forum, Rome,25
2011.Reneau, S. L., Dietrich, W. E., Wilson, C. J., and Roger, J. D.: Colluvial deposits and associated
landslide in the northern San Francisco Bay area, California, USA, in: Proceedings of 4thInternatinal Symposium on Landslides, Toronto, 425–430, 1984.
Salciarini, D., Godt, J. W., Savage, W. Z., Conversini, P., Baum, R. L., and Michael, J. A.: Mod-30
eling regional initiation of rainfall induced shallow landslides in the eastern Umbria Regionalof Central Italy, Landslides, 3, 181–194, 2006.
5219
Sassa, K., Wang, G., Fukuoka, H., Wang, F., Ochiai, T., Sugiyama, M., and Sekiguchi, T.: Land-slide risk evaluation and hazard zoning for rapid and long-travel landslides in urban develop-ment areas, Landslides, 1, 221–235, 2004.
Talebi, A., Troch, P. A., and Uijlenhoet, R.: A steady-state analytical slope stability model forcomplex hillslopes, Hydrol. Process., 22, 546–553, 2008.5
Tsukamoto, Y., Ohta, T., and Noguchi, H.: Hydrological and geomorphological studies of debrisslides on forested hillslopes in Japan, Int. Assoc. Hydrol. Sci. Publ., 137, 89–98, 1982.
Vahidnia, M. H., Alesheikh, A. A., Alimohammadi, A., and Hosseinali, F.: A GIS-based neuro-Fuzzy procedure for integrating knowledge and data in landslide susceptibility mapping,Comput. Geosci., 36, 1101–1114, 2010.10
Valeriano, M. M.: Modelo digital de variáveis morfométricas com dados SRTM para o territórionacional: o projeto TOPODATA, Proceedings of XII Simpósio Brasileiro de SensoriamentoRemoto, Goiânia, 2005.
van Westen, C. J., van Asch, T. W. J., and Soeters, R.: Landslide hazard and risk zonation –why is it still so difficult?, Bull. Eng. Geol. Env., 65, 167–184, 2006.15
Varnes, D. J.: Landslide hazard zonation: a review of principles and practice, UNESCO, Paris,1984.
Vieira, B. C.: Previsão de Escorregamentos Translacionais Rasos na Serra do Mar (SP) apartir de Modelos Matemáticos em Bases Físicas, Ph.D. Thesis, Federal University of Riode Janeiro, Brazil, 193 pp., 2007.20
Vieira, B. C., Fernandes, N. F., and Filho, O. A.: Shallow landslide prediction in the Serra doMar, São Paulo, Brazil, Nat. Hazards Earth Syst. Sci., 10, 1829–1837, doi:10.5194/nhess-10-1829-2010, 2010.
Winchester, L. and Szalachman, R.: The urban poor’s vulnerability to the impacts of climatechange in Latin America and the Caribbean. A policy agenda. Proceedings of Fifth Urban25
Research Symposium, Marseille, 2009.Zadeh, L. A.: Fuzzy sets, Inf. Control, 8, 338–353, 1965.Zaidan, R. T. and Fernandes, N. F.: Zoneamento de suscetibilidade a escorregamentos em
encostas aplicado à bacia de drenagem urbana do Córrego da Independência – Juiz deFora (MG), Rev. Bras. Geomorfol., 10, 57–76, 2009.30
5220

Table 1. Demographic and geographic characteristics of the four municipalities evaluated.
Population (census 2009)
Municipality Area Total Urban % Rural % Demographic HDI -M(km2) zone Zone density
(pop.) (pop.) (pop. km−2)
Santos 280.30 419 400 419 086 99.93 314 0.07 1496.26 0.840Cubatão 142.28 108 309 107 661 99.40 648 0.60 761.23 0.772Caraguatatuba 483.95 100 899 97 449 96.58 3450 3.42 208.49 0.802Ubatuba 723.82 78 870 76 958 95.58 1912 2.42 108.96 0.751
5221
Table 2. Summary of landslide disasters on the coast of São Paulo, Brazil (last 20 yr), by IPMet(2013) database.
Locale Date No. Affected No. Killed
Santos 01/01/2000 20 homeless –09/06/2009 20 homeless and 1 displaced –01/01/2011 8 homeless and 52 displaced –04/12/2011 2
Cubatão 12/11/2004 3 injured –02/24/2010 34 homeless10/25/2010 34 homeless and 160 displaced –12/31/2010 5 displaced –02/28/2011 9 homeless –12/15/2011 8 displaced –01/10/2013 67 displaced02/22/2013 500 homeless –
Ubatuba 02/13/1996 226 homeless and 2 injured 711/29/2013 3 injured 111/17/2008 34 homeless 102/04/2009 30 homeless and 137 displaced 104/20/2009 20 homeless and 27 displaced –12/31/2009 38 homeless and 500 displaced –01/15/2010 5 displaced –12/23/2011 180 homeless and 55 displaced –
Caraguatatuba 12/17/2009 4 displaced –
5222

Table 3. Evaluated data and their weights associated with landslide susceptibility.
Theme Weight Theme Weight
Geology Type of rocks Vertical/Horizontal CurvatureIgneous Very convex/Very divergent 0.2
Granite 0.37 Convex/Divergent 0.3Migmatite, gneiss 0.43 Retilineous/Flat 0.5
Metamorphics Concave/Convergent 0.8Biotite 0.57 Very concave/Very Convergent 1.0Schist 0.67Metagabro 0.70 Slope ClassMonzogranite 0.60 >45◦ Mountainous 1.0Mylonite 0.77 20 to 45◦ Heavy undulation 0.8Leucogranite 0.50 8 to 20◦ Undulation 0.5Orthogneiss 0.47 3 to 8◦ Smooth undulation 0.3
Sedimentary 0 to 3◦ Plane 0.2Sediments unconsolidated:
1.00alluvium, colluvium Land useAgriculture 0.8
Soil Class Acronym Urban area 1.0Haplic Cambisols CX 0.80 Eucalyptus 0.7Spodosol Ferrocarbic ES 0.75 Roads 0.9Salic Gleisol GZ 1.00 Pasture 0.7Red-yellow Latosol LVA 0.40 Restinga 0.5Urban URB 1.00 Mangrove 0.4
Bare soil 0.9
5223
Table 4. Criteria for defining the probability of occurrence of the destructive processes of land-slide in occupied slopes (version used in the southeast of Brazil by CPRM).
Risk level Description
R1 (low tonull risk):
The geological and geotechnical predisposing factors (slope, terrain types, etc.)and the level of intervention in the sector show low potential for development oflandslide processes. There is no evidence of destructive process developmenton the slopes. This is the least critical condition. Maintaining existing conditions,the occurrence of landslide events in the rainy period is not expected.
R2(medium):
The geological and geotechnical predisposing factors and the level of interven-tion in the sector show low potential for development of landslide processes.Notes the presence of some evidence of instability on slopes, however incipient.Maintaining existing conditions, the possibility of landslide events during heavyrains and prolonged episodes during a rainy period is reduced.
R3 (high): The geological and geotechnical predisposing factors and the level of interven-tion in the sector show high potential for the development of processes of land-slide. Significant evidence of instability is present (cracks in the soil, etc.). Main-taining existing conditions, it is quite possible to have the occurrence of landslideevents during heavy rains and prolonged episodes during a rainy period.
R4 (veryhigh):
The geological and geotechnical predisposing factors and the level of interven-tion in the sector show high potential for the development of processes of land-slide. The evidence of instability (cracks in the soil, fissures in houses or contain-ment walls, trees inclined, landslide scars, erosive features, etc.) is significantand is present in large numbers and/or at magnitude. This is the most criticalcondition. Maintaining existing conditions, the occurrence of landslide events isvery possible during heavy rains and prolonged episodes during a rainy period.
Source: Ministério das Cidades/ Cities Aliance (2006).
5224

Table 5. Risk Potential index calculation for Typology 1 (RP1), Typology 2 (RP2) and Typology 3(RP3).
1 2 3 4 5 6 7 8 9
ClassesTotal Study Urban % Typ1 Typ2 Typ3 RP1 RP2 RP3
Area (ha) Area (ha) (2+1) Area (ha) (4+2) (5+2) (6+2)
Very Low 191 0.7 0.4 % 0.0 0.0 0.0 0.0 % 0.0% 0.0 %Low 38 571 174 0.5 % 1.3 0.2 3.2 0.7 % 0.1% 1.8 %Medium 72 073 4837 6.7 % 48.8 16.9 29.3 1.0 % 0.4 % 0.6 %High 49 649 7449 15.0 % 110.1 33.5 14.8 1.5 % 0.4 % 0.2 %Very High 770 364 47.3 % 21.8 2.3 0.3 6.0 % 0.6 % 0.1 %
Total 161 254 12 825 8.0 % 181.9 52.9 47.6
5225
Fig. 1. Study area in São Paulo State, Brazil. On the right, the image is a color composition(RGB 453) of Resourcesat/LISS III.
5226

Fig. 2. Climate-normal precipitation in the period 1961–1990 for the study area. Source: INMet(http://www.inmet.gov.br/portal/index.php?r=clima/normaisClimatologicas).
5227
Fig. 3. Picture illustrating an irregular occupation of the slopes in Santos, SP, Brazil. Photo by:J. C. de Carvalho.
5228

Fig. 4. Data and methodology flowchart.
5229
Fig. 5. Three main types of risk sectors (red lines) found on CPRM mapping. Examples for: (a)Typology 1, (b) Typology 2, and (c) Typology 3. The images are from Google Earth® 2013.
5230

Fig. 6. Histograms for the six themes considered in the study with their class distributions.
5231
Fig. 7. Caption on next page.
5232

Fig. 7. Landslide susceptibility mapping using the fuzzy gamma technique (γ = 0.8): munic-ipalities of (a.1) Caraguatatuba, (b.1) Ubatuba and, (c.1) Santos and Cubatão. The detailedmaps (a.2, b.2 and c.2) are examples for cases with overlapping between risk sectors and themost susceptible classes. Google Earth® images (a.3, b.3 and c.3) represent the same loca-tion as the maps with zoom in, but only the “very high” susceptibility class is highlighted (in redpolygons), along with the mapped risk sectors (in yellow lines).
5233
Fig. 8. Frequency of occurrence for each susceptibility class for the whole study area.
5234

Fig. 9. Frequency of susceptibility classes related with the three different typologies of risk sec-tor (Risk Concentration index – RC). The far right chart shows the percentage areas occupiedby each susceptibility class, grouping the three typologies.
5235
Fig. 10. Susceptibility classes’ distribution for the four risk levels used by CPRM (R1, R2, R3and R4). Analysis for all 150 risk sectors of Typology 1. Higher risk levels are associated withlarger areas occupied by the most susceptible classes (high and very high).
5236