Shadow Insurance - Brookings
37
Shadow Insurance ∗ Ralph S.J. Koijen † Motohiro Yogo ‡ October 15, 2013 Abstract Liabilities ceded by life insurers to shadow reinsurers (i.e., less regulated off-balance- sheet entities) grew from $11 billion in 2002 to $363 billion in 2012. Companies that are involved in shadow insurance, which capture 50 percent of the market share, ceded 28 cents of every dollar insured to shadow reinsurers in 2012, up from 2 cents in 2002. Our adjustment for shadow insurance reduces risk-based capital by 49 percentage points (or 3 rating notches) and raises expected loss by at least $15.7 billion for the industry. We develop a structural model to estimate the impact of shadow insurance on the equilibrium supply in the retail market. In the absence of shadow insurance, marginal cost would rise by 1.8 percent, and annual insurance underwritten would fall by $1.4 billion at unit demand elasticity. (JEL G22, G28) ∗ A.M. Best Company owns the copyright to their data, which we use with permission. For comments and discussions, we thank Francisco Gomes, Tom Holmes, Adair Morse, and Radek Paluszynski. We also thank seminar participants at Bank of England; INSEAD; London Business School; University of Alberta, California Berkeley, Illinois at Chicago, and Minnesota; and the 2013 FRIC Conference on Financial Frictions. The views expressed herein are those of the authors and not necessarily those of the Federal Reserve Bank of Minneapolis, the Federal Reserve System, or the National Bureau of Economic Research. † London Business School, Regent’s Park, London NW1 4SA, United Kingdom and NBER (e-mail: rkoi- [email protected]) ‡ Federal Reserve Bank of Minneapolis, Research Department, 90 Hennepin Avenue, Minneapolis, MN 55401 (e-mail: [email protected])
Transcript of Shadow Insurance - Brookings
Shadow Insurance∗
Ralph S.J. Koijen† Motohiro Yogo‡
October 15, 2013
Abstract
Liabilities ceded by life insurers to shadow reinsurers (i.e., less regulated off-balance-
sheet entities) grew from $11 billion in 2002 to $363 billion in 2012. Companies that
are involved in shadow insurance, which capture 50 percent of the market share, ceded
28 cents of every dollar insured to shadow reinsurers in 2012, up from 2 cents in 2002.
Our adjustment for shadow insurance reduces risk-based capital by 49 percentage points
(or 3 rating notches) and raises expected loss by at least $15.7 billion for the industry.
We develop a structural model to estimate the impact of shadow insurance on the
equilibrium supply in the retail market. In the absence of shadow insurance, marginal
cost would rise by 1.8 percent, and annual insurance underwritten would fall by $1.4
billion at unit demand elasticity. (JEL G22, G28)
∗A.M. Best Company owns the copyright to their data, which we use with permission. For commentsand discussions, we thank Francisco Gomes, Tom Holmes, Adair Morse, and Radek Paluszynski. We alsothank seminar participants at Bank of England; INSEAD; London Business School; University of Alberta,California Berkeley, Illinois at Chicago, and Minnesota; and the 2013 FRIC Conference on Financial Frictions.The views expressed herein are those of the authors and not necessarily those of the Federal Reserve Bankof Minneapolis, the Federal Reserve System, or the National Bureau of Economic Research.
†London Business School, Regent’s Park, London NW1 4SA, United Kingdom and NBER (e-mail: [email protected])
‡Federal Reserve Bank of Minneapolis, Research Department, 90 Hennepin Avenue, Minneapolis, MN55401 (e-mail: [email protected])

Life insurance and annuity liabilities of U.S. life insurers were $4,068 billion in 2012, which
is substantial even when compared to $6,979 billion in savings deposits for U.S. depository
institutions (Board of Governors of the Federal Reserve System 2013). However, there is little
research on life insurer liabilities, especially in comparison to the large banking literature.
The reason, perhaps, is the traditional view that life insurer liabilities are safe (and boring)
because they are more predictable, longer maturity, and less vulnerable to runs. Hence, all
of the interesting action is on the asset side, where life insurers take on some investment risk.
This paper shows that developments in the life insurance industry over the last decade
shatters this traditional view. As a consequence of changes in regulation, life insurers are
now using reinsurance to move liabilities from operating companies that sell policies to less
regulated and unrated shadow reinsurers. These shadow reinsurers are captives or special
purpose vehicles in U.S. states (e.g., South Carolina and Vermont) or offshore domiciles
(e.g., Bermuda, Barbados, and the Cayman Islands) with more favorable capital regulation
or tax laws. In contrast to traditional reinsurance with third-party reinsurers, there is no risk
transfer in these transactions because the liabilities stay within the same holding company.
Using new data on all life and annuity reinsurance agreements for licensed companies
in the U.S., we map out the financial plumbing of life insurer liabilities, paying particular
attention to the shadow insurance sector. We find that the shadow insurance sector (i.e.,
liabilities ceded to shadow reinsurers) grew rapidly from $11 billion in 2002 to $363 billion in
2012. To put this figure into perspective, asset-backed commercial paper issued by the U.S.
shadow banking sector was $650 billion in 2004, prior to its quick growth and spectacular
collapse during the financial crisis (Acharya et al. 2013). Operating companies that are
involved in shadow insurance are the largest in the industry that capture 50 percent of the
market share for both life insurance and annuities. These companies ceded 28 cents of every
dollar insured to shadow reinsurers in 2012, significantly up from only 2 cents in 2002.
We find that shadow insurance adds a tremendous amount of financial risk for the com-
panies involved, which is not reflected in their current ratings. Our adjustment for shadow
insurance reduces risk-based capital by 49 percentage points, or 3 rating notches, for the
median company. Hence, actual impairment probabilities are likely to be higher than what
may be inferred from reported ratings. Our adjustment for shadow insurance raises expected
loss by at least $15.7 billion for the industry. Through the state guaranty funds, this cost
is ultimately borne by state taxpayers and the companies that are not involved in shadow
insurance.
Although shadow insurance clearly has these costs, its potential benefits are harder to
measure. In theory, shadow insurance lowers the cost of financial frictions for these com-
panies, which leads to lower marginal cost and a higher equilibrium supply in the retail
2

market. To estimate this potential benefit, we develop a model of an insurance holding
company that consists of operating companies that sell policies and captives that assume
reinsurance for the purposes of capital management. We use our structural model to esti-
mate the impact of shadow insurance on the equilibrium supply in the retail market. Our
counterfactual experiment is analogous to asking what would happen to loan markets if we
were to eliminate shadow banking. We find that marginal cost would rise by 1.8 percent
for the average company that is involved in shadow insurance. When aggregated across all
these companies, annual insurance underwritten would fall by $1.4 billion (from its current
level of $84.8 billion) at unit demand elasticity.
Our work on life and annuity reinsurance is related to the literature on property and
casualty reinsurance. This literature finds that property and casualty reinsurance is used
for a variety of reasons including risk transfer and capital and tax management (Mayers
and Smith 1990, Adiel 1996). Froot (2001) finds evidence for limited transfer of catastrophe
event risk, which highlights the importance of capital market frictions in the supply side
of reinsurance markets. For life insurers, risk transfer has always been a less important
motive because of the more predictable nature of their business, which explains why there is
relatively little reinsurance with third-party reinsurers. All of the growth in life and annuity
reinsurance over the last decade is affiliated reinsurance within the same holding company,
which points to capital and tax management as the primary driver of this activity.
The remainder of the paper is organized as follows. Section 1 discusses relevant institu-
tional background and presents a stylized example of captive reinsurance. Section 2 describes
the data on life and annuity reinsurance. Section 3 documents developments in life and annu-
ity reinsurance over the last decade, as a consequence of changes in life insurance regulation
and captive laws. In Section 4, we measure the size of the shadow insurance sector and its
impact on the financial risk of life insurers. In Section 5, we develop a model of optimal
insurance pricing and affiliated reinsurance within a holding company. In Section 6, we use
the structural model to estimate the impact of shadow insurance on the equilibrium supply
in the retail market. Section 7 concludes with broader implications of our findings.
1. Institutional Background on Reinsurance
As discussed in Tiller and Tiller (2009, chapter 1), there are four basic motives for life and
annuity reinsurance.
1. Risk transfer: To transfer mortality and morbidity risk, lapse and surrender risk, or
investment risk.
3

2. Underwriting assistance: To gain access to expertise or experience of a reinsurer, es-
pecially in underwriting a new line of business.
3. Capital management: To increase statutory capital and surplus, to meet risk-based
capital requirements, or to improve or maintain a credit rating.
4. Tax management: To change the timing of taxes to reduce overall tax liabilities.
Over the last decade, the third and fourth motives have become increasingly important
relative to the first and second because of two related developments. On the one hand,
changes in insurance regulation after 2000 forced life insurers to hold more capital against
life insurance liabilities, straining their capital positions. On the other hand, new captive
laws after 2002 allowed life insurers to set up special purpose vehicles, in states like South
Carolina and Vermont, to circumvent the new capital requirements. In this section, we
discuss these developments and related institutional background, to the extent that they are
relevant for this paper.
1.1. Changes in Life Insurance Regulation
In January 2000, the National Association of Insurance Commissioners (NAIC) adopted
Model Regulation 830, commonly referred to as Regulation XXX. This was followed by
Actuarial Guideline 38 in January 2003, commonly referred to as Regulation AXXX. These
regulations forced life insurers to hold much higher statutory reserve on newly issued term
life policies and universal life policies with secondary guarantees.
These changes in life insurance regulation are a matter of statutory accounting principles
and do not apply to generally accepted accounting principles (GAAP). The reserve require-
ments under GAAP are much lower and closer to actuarial value. Therefore, an operating
company that reports under statutory accounting principles can cede reinsurance to a rein-
surer that reports under GAAP, thereby freeing up “redundant reserves” that arise from
these regulations. In practice, however, third-party reinsurance can be expensive because of
the limited supply of capital for this purpose.
1.2. New Captive Laws
Starting in 2002, South Carolina introduced new laws that allow life insurers to establish
captives, whose primary function is to assume reinsurance from affiliated companies for the
purpose of freeing up redundant reserves. Captives are governed by state law that are dif-
ferent from the usual insurance regulation that applies to licensed companies. A captive
4
structure that has proven especially successful is the so-called special purpose financial cap-
tive, which is a type of special purpose vehicle that was introduced by South Carolina in
2004 and by Vermont in 2007.
Captives do not provide risk transfer at the holding-company level (by definition), so
they exist solely for the purpose of capital and tax management. Captives usually have
several advantages over traditional reinsurers (Captives and Special Purpose Vehicle Use
Subgroup 2013). First, they allow life insurers to keep the underwriting profits within the
holding company. Second, they can hold less capital because they report under GAAP
or are not subject to risk-based capital regulation. Third, their financial statements are
confidential to the public, and sometimes even to insurance regulators outside the state of
domicile. Finally, they have a more flexible financial structure that allows them to finance
redundant reserves through letters of credit or securitization.
U.S. tax laws disallow reinsurance for the primary purpose of reducing tax liabilities.
However, it can be an important side benefit of captive reinsurance that motivates where a
life insurer establishes its captive. Life insurance premiums are taxable at the state level,
and the tax rates on premiums vary across states (Cole and McCullough 2008). In addition,
profits are taxable at the federal level, so a life insurer may be able to reduce its tax liabilities
by ceding reinsurance to an offshore captive. Bermuda, Barbados, and the Cayman Islands
are important captive domiciles for this purpose. An excise tax of one percent applies to
life and annuity reinsurance premiums ceded to offshore captives. However, the investment
returns accumulate free of U.S. tax once the capital is offshore.
1.3. A Stylized Example of Captive Reinsurance
The regulation that governs whether an operating company can take reserve credit on rein-
surance ceded depends on whether the reinsurer is authorized (National Association of In-
surance Commissioners 2011, Appendix A-785). An authorized reinsurer is licensed to sell
insurance and, therefore, faces the same capital regulation as the ceding company. In this
case, reserve credit on reinsurance ceded does not require special approval or collateral. An
unauthorized reinsurer, such as a captive, is not subject to the same capital regulation as the
ceding company. In this case, reserve credit on reinsurance ceded requires that the transac-
tion be collateralized through a trust fund established in or an unconditional letter of credit
from a qualified U.S. financial institution.
In Table 1, we illustrate the balance sheet mechanics of how an operating company can
free up capital by ceding reinsurance to an unauthorized captive. Our example is for the
case of coinsurance, which is the most common type of life and annuity reinsurance in the
data. In Appendix A, we show that two other types, coinsurance with funds withheld and
5
modified coinsurance, can be structured to achieve the same economic outcomes. For further
details, we refer to Loring and Higgins (1997) and Tiller and Tiller (2009, chapters 4–5).
The operating company initially starts with $10 in bonds and no liabilities, so that its
equity is $10. For simplicity, the captive is initially a shell company with no assets. In the
first step, the operating company sells policies to retail customers for $100. The operating
company must record statutory reserve of $110, which is higher than the GAAP reserve of
$90 because of Regulation (A)XXX. As a consequence, its equity is reduced to $0.
In the second step, the operating company cedes all the policies to the captive, paying
a reinsurance premium of $100. The captive establishes a trust fund with $90 in bonds
and secures a letter of credit up to $20 to fund the difference between statutory and GAAP
reserve. For simplicity, our example ignores a small fee that the captive would pay to secure
the letter of credit. On the liability side, the captive records GAAP reserve of only $90
because it is not subject to Regulation (A)XXX.1
As a consequence of captive reinsurance, the operating company’s balance sheet is re-
stored to its original position with $10 in equity. The captive ends up with an extra $10 in
cash that it can use for various purposes, including a commission to the operating company
or a dividend to the parent company.
2. Data on Life and Annuity Reinsurance
2.1. Data Construction
We construct our sample of life and annuity reinsurance agreements for U.S. life insurers from
the Schedule S filings for fiscal years 2002 to 2012 (A.M. Best Company 2003–2013b). These
financial statements are annually reported to the NAIC according to statutory accounting
principles, which are conveniently organized along with ratings information by the A.M. Best
Company. The relevant parts of Schedule S for our study are 1.1 (Reinsurance Assumed),
3.1 (Reinsurance Ceded), and 4 (Reinsurance Ceded to Unauthorized Companies).
The data contain all reinsurance agreements (both ceded and assumed) at each fiscal
year-end for any operating company or reinsurer that is licensed to sell insurance in the
U.S. In particular, they contain reinsurance ceded by a licensed company to an unlicensed
reinsurer, such as a domestic captive or a foreign company. However, we do not observe
reinsurance ceded by unlicensed companies that are not required to report to the NAIC.
1Our example assumes that the operating company’s domicile does not require mirror reserving, and thecaptive’s domicile does not count a letter of credit as an admitted asset. If we flip both of these assumptions,the economics of this example remains the same. The captive records the letter of credit as a $20 asset andholds statutory reserve of $110, so that its equity remains $10.
6

For each reinsurance agreement, we observe the identity of the reinsurer, the type of
reinsurance, the effective date, reserve credit taken (or reserves held), and modified coinsur-
ance reserve.2 We know the identity of the reinsurer up to its name, domicile, whether it
is affiliated with the ceding company, whether it is authorized in the domicile of the ceding
company, and whether it is rated by the A.M. Best Company. We define shadow reinsurers
as affiliated and unauthorized reinsurers without an A.M. Best rating. Our definition is
stricter than “captives” because some captives are actually authorized.
We merge the Schedule S data with the annual NAIC financial statements of the ceding
companies (A.M. Best Company 2003–2013c). The relevant parts for our study are Lia-
bilities, Surplus and Other Funds; Exhibit 5 (Aggregate Reserve for Life Contracts); and
Schedule S Part 6 (Restatement of Balance Sheet to Identify Net Credit for Ceded Reinsur-
ance).
2.2. Description of the Sample
Table 2 reports summary statistics for our sample of life and annuity reinsurance agreements,
by whether they were ceded to unaffiliated or affiliated reinsurers. The table also reports
the same statistics for shadow reinsurers, which are a subset of affiliated reinsurers that are
unauthorized and do not have an A.M. Best rating.
Although there are fewer affiliated reinsurance agreements in the sample, the typical
amount ceded is significantly higher than that for unaffiliated reinsurance. For example,
there were 456 new unaffiliated reinsurance agreements in 2009. In comparison, there were
only 120 new affiliated reinsurance agreements, 67 of which were ceded to shadow reinsurers.
Mean unaffiliated reinsurance ceded was $36.9 million, which is much lower than $1,198.9
million for affiliated reinsurance and $2,003.3 million for shadow insurance. The average size
of a shadow reinsurance agreement has generally increased over time from $59.7 million in
2002 to $512.9 million in 2012.
Table 3 describes the characteristics of the operating companies in our sample, by whether
they are ceding reinsurance to shadow reinsurers. Although most of the companies are not
involved in shadow insurance, the ones that are tend to be the largest in the industry, as
measured by either market share or total assets. In 2012, 81 companies had reinsurance
agreements with shadow reinsurers, while 347 companies did not. However, these 81 compa-
nies captured 50 percent of the market share for both life insurance and annuities, and their
median assets were 324 percent higher.
2The types of life reinsurance agreements in the data are coinsurance, modified coinsurance, combinationcoinsurance, yearly renewable term, and accidental death benefit. The types of annuity reinsurance agree-ments are coinsurance, modified coinsurance, combination coinsurance, and guaranteed minimum deathbenefit.
7

In addition to being larger, companies that are involved in shadow insurance are more
leveraged. Their median leverage ratio (i.e., total liabilities over total assets) was 93 per-
cent in 2012, compared to 84 percent for those companies that are not involved in shadow
insurance.
3. Recent Developments in Life and Annuity Reinsurance
In this section, we document developments in life and annuity reinsurance over the last
decade, as a consequence of changes in life insurance regulation and captive laws that we
discussed in Section 1. Since our data are unfamiliar to most readers, we start with a case
study of the MetLife group, which is the largest insurance group in our sample by total assets.
We then show that the rapid growth of affiliated reinsurance, especially with unrated and
unauthorized reinsurers, stands in sharp contrast to the behavior of unaffiliated reinsurance
over the same period.
3.1. A Case Study of the MetLife Group
Table 4 lists the U.S. operating companies of the MetLife group and their affiliated reinsurers
in 2012. All the operating companies have an A.M. Best rating of A+ and cede reinsurance
to the rest of the group. All the reinsurers are unrated and assume reinsurance from the rest
of the group. All the reinsurers are also unauthorized, except for MetLife Reinsurance of
Delaware and MetLife Reinsurance of Charleston since 2009. Overall, the liabilities disappear
from the balance sheets of operating companies that sell policies to retail customers and end
up in a less regulated and non-transparent part of the insurance industry.
Net reinsurance ceded by Metropolitan Life Insurance (the flagship operating company in
New York) was $39.1 billion in 2012, which was nearly three times their capital and surplus.
In the same year, net reinsurance assumed by Missouri Reinsurance (a captive in Barbados)
was $28.4 billion. The sum of net reinsurance ceded across all the companies in Table 4,
which is total reinsurance ceded outside the MetLife group, was $5.5 billion. This shows that
most of the reinsurance activity is within the MetLife group, rather than with unaffiliated
reinsurers.
3.2. Growth of Affiliated Reinsurance
Figure 1 reports total reinsurance ceded by U.S. life insurers to affiliated and unaffiliated
reinsurers. Affiliated reinsurance grew rapidly from $83 billion in 2002 to $547 billion 2012.
In contrast, unaffiliated reinsurance peaked at $287 billion in 2006 and has been flat since
then. Affiliated reinsurance has exceeded unaffiliated reinsurance since 2007.
8
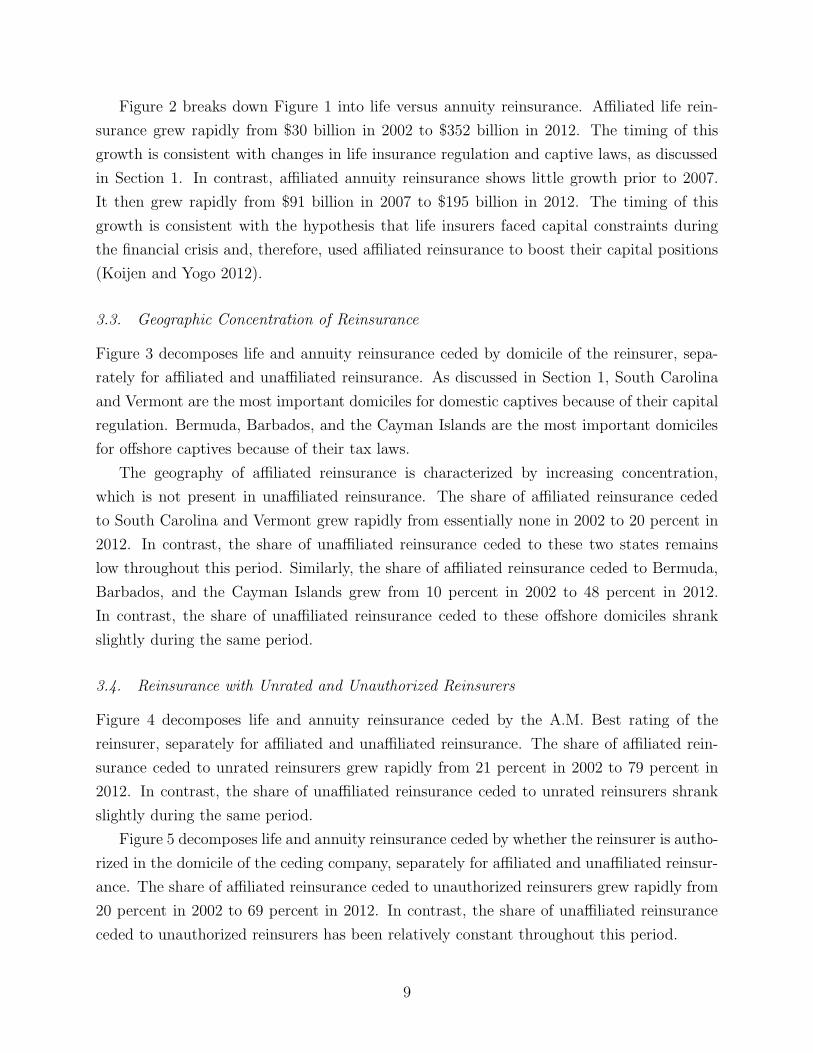
Figure 2 breaks down Figure 1 into life versus annuity reinsurance. Affiliated life rein-
surance grew rapidly from $30 billion in 2002 to $352 billion in 2012. The timing of this
growth is consistent with changes in life insurance regulation and captive laws, as discussed
in Section 1. In contrast, affiliated annuity reinsurance shows little growth prior to 2007.
It then grew rapidly from $91 billion in 2007 to $195 billion in 2012. The timing of this
growth is consistent with the hypothesis that life insurers faced capital constraints during
the financial crisis and, therefore, used affiliated reinsurance to boost their capital positions
(Koijen and Yogo 2012).
3.3. Geographic Concentration of Reinsurance
Figure 3 decomposes life and annuity reinsurance ceded by domicile of the reinsurer, sepa-
rately for affiliated and unaffiliated reinsurance. As discussed in Section 1, South Carolina
and Vermont are the most important domiciles for domestic captives because of their capital
regulation. Bermuda, Barbados, and the Cayman Islands are the most important domiciles
for offshore captives because of their tax laws.
The geography of affiliated reinsurance is characterized by increasing concentration,
which is not present in unaffiliated reinsurance. The share of affiliated reinsurance ceded
to South Carolina and Vermont grew rapidly from essentially none in 2002 to 20 percent in
2012. In contrast, the share of unaffiliated reinsurance ceded to these two states remains
low throughout this period. Similarly, the share of affiliated reinsurance ceded to Bermuda,
Barbados, and the Cayman Islands grew from 10 percent in 2002 to 48 percent in 2012.
In contrast, the share of unaffiliated reinsurance ceded to these offshore domiciles shrank
slightly during the same period.
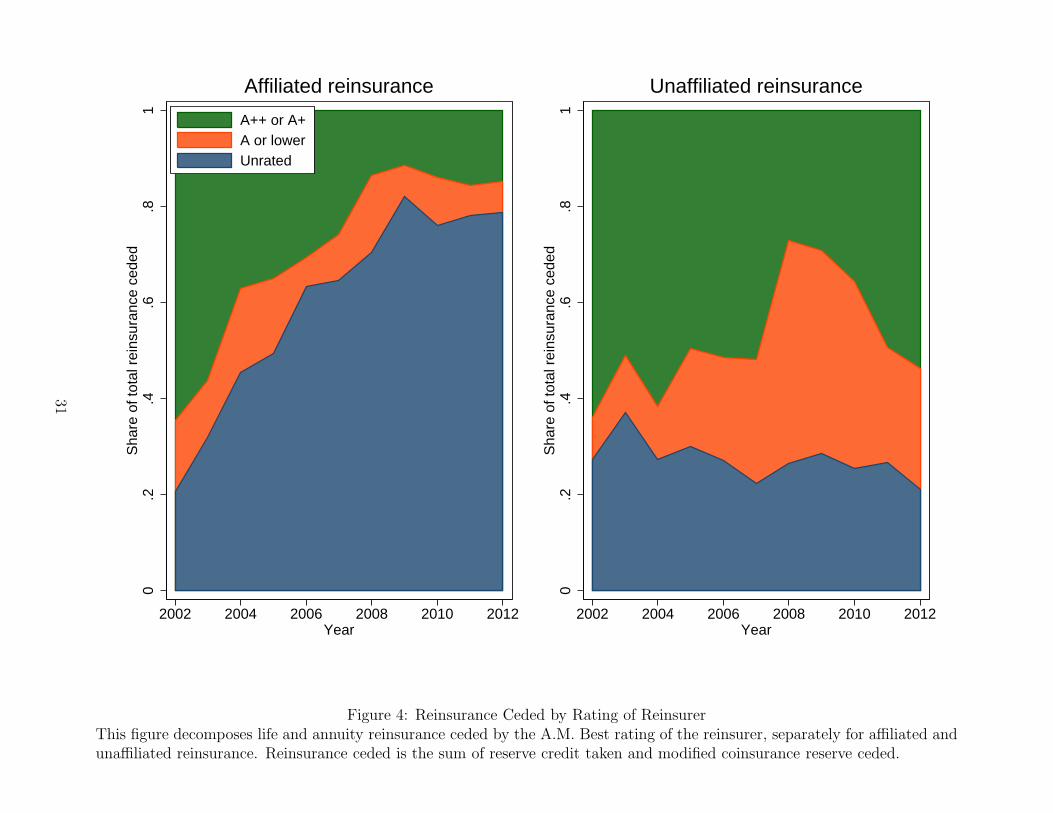
3.4. Reinsurance with Unrated and Unauthorized Reinsurers
Figure 4 decomposes life and annuity reinsurance ceded by the A.M. Best rating of the
reinsurer, separately for affiliated and unaffiliated reinsurance. The share of affiliated rein-
surance ceded to unrated reinsurers grew rapidly from 21 percent in 2002 to 79 percent in
2012. In contrast, the share of unaffiliated reinsurance ceded to unrated reinsurers shrank
slightly during the same period.
Figure 5 decomposes life and annuity reinsurance ceded by whether the reinsurer is autho-
rized in the domicile of the ceding company, separately for affiliated and unaffiliated reinsur-
ance. The share of affiliated reinsurance ceded to unauthorized reinsurers grew rapidly from
20 percent in 2002 to 69 percent in 2012. In contrast, the share of unaffiliated reinsurance
ceded to unauthorized reinsurers has been relatively constant throughout this period.
9
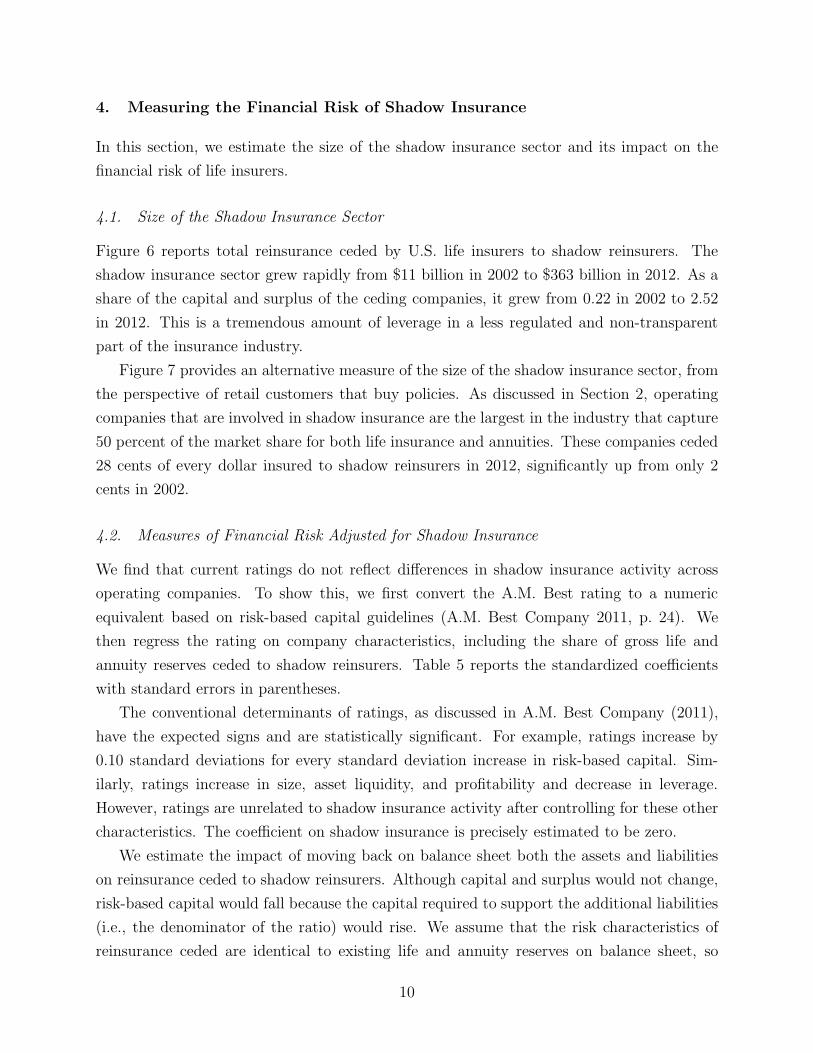
4. Measuring the Financial Risk of Shadow Insurance
In this section, we estimate the size of the shadow insurance sector and its impact on the
financial risk of life insurers.
4.1. Size of the Shadow Insurance Sector
Figure 6 reports total reinsurance ceded by U.S. life insurers to shadow reinsurers. The
shadow insurance sector grew rapidly from $11 billion in 2002 to $363 billion in 2012. As a
share of the capital and surplus of the ceding companies, it grew from 0.22 in 2002 to 2.52
in 2012. This is a tremendous amount of leverage in a less regulated and non-transparent
part of the insurance industry.
Figure 7 provides an alternative measure of the size of the shadow insurance sector, from
the perspective of retail customers that buy policies. As discussed in Section 2, operating
companies that are involved in shadow insurance are the largest in the industry that capture
50 percent of the market share for both life insurance and annuities. These companies ceded
28 cents of every dollar insured to shadow reinsurers in 2012, significantly up from only 2
cents in 2002.
4.2. Measures of Financial Risk Adjusted for Shadow Insurance
We find that current ratings do not reflect differences in shadow insurance activity across
operating companies. To show this, we first convert the A.M. Best rating to a numeric
equivalent based on risk-based capital guidelines (A.M. Best Company 2011, p. 24). We
then regress the rating on company characteristics, including the share of gross life and
annuity reserves ceded to shadow reinsurers. Table 5 reports the standardized coefficients
with standard errors in parentheses.
The conventional determinants of ratings, as discussed in A.M. Best Company (2011),
have the expected signs and are statistically significant. For example, ratings increase by
0.10 standard deviations for every standard deviation increase in risk-based capital. Sim-
ilarly, ratings increase in size, asset liquidity, and profitability and decrease in leverage.
However, ratings are unrelated to shadow insurance activity after controlling for these other
characteristics. The coefficient on shadow insurance is precisely estimated to be zero.
We estimate the impact of moving back on balance sheet both the assets and liabilities
on reinsurance ceded to shadow reinsurers. Although capital and surplus would not change,
risk-based capital would fall because the capital required to support the additional liabilities
(i.e., the denominator of the ratio) would rise. We assume that the risk characteristics of
reinsurance ceded are identical to existing life and annuity reserves on balance sheet, so
10

that required capital rises proportionally. We view this assumption as conservative because
reinsurance ceded to shadow reinsurers is probably riskier than liabilities that remain on
balance sheet.
Our assumption yields a simple adjustment to risk-based capital, based on the available
data:
Adjusted RBC =Reported RBC
1 + Shadow insurance/Reported reserves. (1)
Table 6 reports that our adjustment for shadow insurance reduces median risk-based capital
by 49 percentage points in 2012. An analogous adjustment drops the median rating by 3
notches from A to B+.
Our adjustment for shadow insurance implies that actual impairment probabilities are
likely to be higher than what may be inferred from reported ratings. For each operating
company, we match its adjusted rating to the historical term structure of impairment proba-
bilities by rating (A.M. Best Company 2013a). We also assume a 10 percent loss conditional
on impairment, based on the historical experience (Gallanis 2009). We then calculate the
present value of expected loss and aggregate across all the companies that are involved in
shadow insurance. Table 6 reports that our adjustment for shadow insurance raises expected
loss by $15.7 billion in 2012, significantly up from only $0.6 billion in 2002.
We view our estimate in Table 6 as a lower bound on the actual financial risk of shadow
insurance. The historical impairment probabilities and loss ratios are mostly based on the
idiosyncratic events of smaller life insurers. We expect the actual experience for larger life
insurers that are involved in shadow insurance to be more systemic, leading to larger losses
for the industry. In particular, about 30 percent of shadow insurance is funded by letters of
credit, which are weaker collateral than trust funds or funds withheld. Based on regulatory
information that is not publicly available, Lawsky (2013) reports that a large share of letters
of credit involve parental guarantees, which are vulnerable to systemic shocks to the insurance
sector. Even unconditional letters of credit are vulnerable to rollover risk that can arise from
shocks to the banking sector.
5. A Structural Model of Reinsurance
In this section, we develop a structural model of an insurance holding company that consists
of affiliated companies in domiciles with different capital regulation. Affiliated reinsurance
allows the holding company to reduce the cost of financial frictions, by efficiently moving
capital between its affiliated companies. This lowers marginal cost for operating companies
that sell policies, leading to a higher equilibrium supply in the retail market.
11

Our model has some elements that are familiar from existing models of reinsurance in
the property and casualty literature. For example, Froot and O’Connell (2008) model the
demand for unaffiliated reinsurance (with risk transfer) when insurance companies face cap-
ital market frictions and imperfect competition. In addition to these familiar elements, we
add affiliated reinsurance (without risk transfer) as a powerful tool for capital management,
which has become the predominant form of reinsurance for life insurers over the last decade.
For simplicity, we ignore tax effects because they are difficult to model realistically and mea-
sure. As discussed in Section 1, U.S. tax laws disallow reinsurance for the primary purpose
of reducing tax liabilities.
5.1. An Insurance Holding Company’s Maximization Problem
An insurance holding company consists of I affiliated companies, which we index as i =
1, . . . , I. The affiliated companies may include an operating company whose primary function
is to sell policies to retail customers, a reinsurer whose primary function is to sell reinsurance
to unaffiliated companies, and captives whose primary function is to assume reinsurance from
affiliated companies. The I affiliated companies are domiciled in different jurisdictions that
may have different capital regulation.
Each operating company i faces demand Qi,t(P ) at a given price P for its policies in
period t. The demand curve is downward-sloping with elasticity
εi,t = −Pi,tQ′i,t
Qi,t> 1. (2)
For a captive j that only assumes reinsurance from affiliated companies, we follow the no-
tational convention that Qj,t = 0. We denote the actuarial value (i.e., frictionless marginal
cost) of policies as Vt.
After the sale of policies, an operating company can cede reinsurance to an affiliated
company within the holding company. Let Bij,t ≥ 0 denote the quantity of affiliated reinsur-
ance ceded by company i and assumed by company j in period t. In addition, the operating
company can cede reinsurance to unaffiliated reinsurers outside the holding company. Let
Di,t ≥ 0 denote the quantity of unaffiliated reinsurance ceded at an exogenously given price
PD,t.
The holding company’s total profit is
Πt =
I∑i=1
[(Pi,t − Vt)Qi,t − (PD,t − Vt)Di,t]. (3)
12
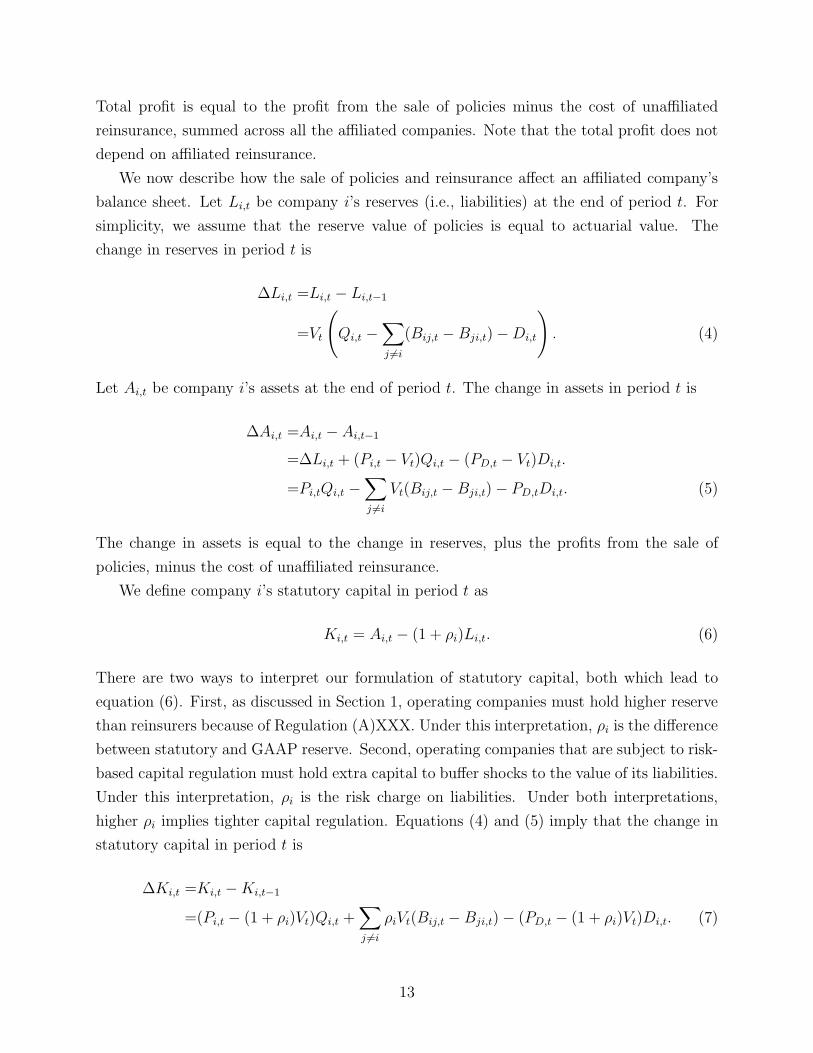
Total profit is equal to the profit from the sale of policies minus the cost of unaffiliated
reinsurance, summed across all the affiliated companies. Note that the total profit does not
depend on affiliated reinsurance.
We now describe how the sale of policies and reinsurance affect an affiliated company’s
balance sheet. Let Li,t be company i’s reserves (i.e., liabilities) at the end of period t. For
simplicity, we assume that the reserve value of policies is equal to actuarial value. The
change in reserves in period t is
ΔLi,t =Li,t − Li,t−1
=Vt
(Qi,t −
∑j �=i
(Bij,t − Bji,t)−Di,t
). (4)
Let Ai,t be company i’s assets at the end of period t. The change in assets in period t is
ΔAi,t =Ai,t − Ai,t−1
=ΔLi,t + (Pi,t − Vt)Qi,t − (PD,t − Vt)Di,t.
=Pi,tQi,t −∑j �=i
Vt(Bij,t − Bji,t)− PD,tDi,t. (5)
The change in assets is equal to the change in reserves, plus the profits from the sale of
policies, minus the cost of unaffiliated reinsurance.
We define company i’s statutory capital in period t as
Ki,t = Ai,t − (1 + ρi)Li,t. (6)
There are two ways to interpret our formulation of statutory capital, both which lead to
equation (6). First, as discussed in Section 1, operating companies must hold higher reserve
than reinsurers because of Regulation (A)XXX. Under this interpretation, ρi is the difference
between statutory and GAAP reserve. Second, operating companies that are subject to risk-
based capital regulation must hold extra capital to buffer shocks to the value of its liabilities.
Under this interpretation, ρi is the risk charge on liabilities. Under both interpretations,
higher ρi implies tighter capital regulation. Equations (4) and (5) imply that the change in
statutory capital in period t is
ΔKi,t =Ki,t −Ki,t−1
=(Pi,t − (1 + ρi)Vt)Qi,t +∑j �=i
ρiVt(Bij,t − Bji,t)− (PD,t − (1 + ρi)Vt)Di,t. (7)
13

The holding company faces an adjustment cost on the statutory capital of its affiliated
companies:
Ct =I∑
i=1
exp{−γΔKi,t}γ
, (8)
where γ > 0 is a curvature parameter. This cost function is a simple way to model financial
frictions, part of which arises from regulatory restrictions on the movement of capital between
affiliated companies (National Association of Insurance Commissioners 2011, Appendix A-
440). To simplify notation, we denote the marginal adjustment cost for company i in period
t as
ci,t = − ∂Ct
∂ΔKi,t
= exp{−γΔKi,t}. (9)
The holding company maximizes firm value, or the present value of profits minus capital
adjustment costs:
Jt = Πt − Ct + Et[Mt+1Jt+1], (10)
where Mt+1 is the stochastic discount factor. Its choice variables are the insurance price Pi,t
for each operating company, affiliated reinsurance Bij,t between all pairs of companies i and
j, and unaffiliated reinsurance Di,t ceded by each company.
5.2. Optimal Pricing of Insurance
The first-order condition for the pricing of insurance by operating company i is
∂Jt
∂Pi,t
=∂Πt
∂Pi,t
+ ci,t∂ΔKi,t
∂Pi,t
=Qi,t + (Pi,t − Vt)Q′i,t + ci,t[Qi,t + (Pi,t − (1 + ρi)Vt)Q
′i,t] = 0. (11)
Rearranging this equation, the optimal insurance price is
Pi,t = Vt
(1− 1
εi,t
)−1(1 + (1 + ρi)ci,t
1 + ci,t
). (12)
The first part of this equation is the standard Bertrand formula, and the second part is an
additional cost that arises from financial frictions. The optimal insurance price rises with
the capital adjustment cost and tighter capital regulation (i.e., higher ρi).
14

5.3. Optimal Affiliated Reinsurance
Assuming an internal optimum, the first-order condition for affiliated reinsurance ceded by
company i to j is
∂Jt
∂Bij,t=ci,t
∂ΔKi,t
∂Bij,t+ cj,t
∂ΔKj,t
∂Bij,t
=ci,tρiVt − cj,tρjVt = 0. (13)
Rearranging this equation,
ρici,t = ρjcj,t (14)
for a pair of companies i and j.
Equation (14) implies that a company subject to tighter capital regulation cedes reinsur-
ance to an affiliated company subject to looser capital regulation. To illustrate this point,
suppose that company i faces tighter capital regulation than company j (i.e., ρi > ρj). Then
the first-order condition (14) requires that ci,t < cj,t, which implies that ΔKi,t > ΔKj,t.
That is, company i’s statutory capital must rise relative to company j’s in order to reduce
the overall capital adjustment cost for the holding company.
By lowering the capital adjustment cost, affiliated reinsurance lowers the optimal insur-
ance price and raises equilibrium supply in the retail market. To show this analytically, we
assume that the demand elasticity is constant for tractability. We then apply the implicit
function theorem to differentiate equation (12) with respect to Bij,t:
∂Pi,t
∂Bij,t
= −γρiVt
[Vt(1− 1/εi,t)
−1ρici,t(Pi,t − Vt(1− 1/εi,t)−1)2
+ γQi,t
(1 + εi,t
(Vt(1 + ρi)
Pi,t
− 1
))]−1
< 0.
(15)
5.4. Optimal Unaffiliated Reinsurance
The derivative of firm value with respect to unaffiliated reinsurance ceded by company i is
∂Jt
∂Di,t=
∂Πt
∂Di,t+ ci,t
∂ΔKi,t
∂Di,t
=− (PD,t − Vt)− ci,t(PD,t − (1 + ρi)Vt). (16)
15

This implies that company i will cede reinsurance to an unaffiliated reinsurer only if
∂Jt(Di,t = 0)
∂Di,t
> 0 ⇐⇒ PD,t < Vt
(1 + (1 + ρi)ci,t
1 + ci,t
). (17)
The right side of this equation can be interpreted as the effective marginal benefit of un-
affiliated reinsurance. It can be higher than the marginal benefit of affiliated reinsurance
because of additional benefits that may include risk transfer, underwriting assistance, or tax
benefits.
6. Impact of Shadow Insurance on the Retail Market
In this section, we use the structural model to estimate the impact of shadow insurance on
the equilibrium supply in the retail market.
6.1. Empirical Specification
Let o index an operating company that cedes reinsurance to a shadow reinsurer, which is
indexed by s. The change in statutory capital for the shadow reinsurer simplifies to ΔKs,t =
−ρsΔLs,t since its only function is to assume reinsurance from affiliated companies (i.e.,
Qs,t = Ds,t = 0 in equation (7)). Similarly, we approximate the change in statutory capital
for the operating company as ΔKo,t ≈ −ρoΔLo,t (which is exact only if Po,t = PD,t = Vt).
Then the first-order condition for affiliated reinsurance (14) and our parametrization of the
capital adjustment cost (9) imply that
ΔLo,t =ρsρoΔLs,t +
log(ρs/ρo)
γρo. (18)
The equation delivers an intuitive prediction. If the operating company faces tighter capital
regulation (i.e., ρo > ρs), its liabilities should move less than dollar-for-dollar with the shadow
reinsurer’s liabilities.
Equation (18) holds for a pair of affiliated companies within the same holding company
in a given period of time. In the data, we observe various holding companies in different
years. Therefore, we estimate
ΔLo,n =ρsρoΔLs,n + β ′xn + en, (19)
where n indexes the observations that are pooled across holding companies and years. The
vector xn includes a full set of year and holding-company fixed effects as well as company
16

characteristics, and en is an error term with conditional mean zero. The key assumption
in going from equation (18) to (19) is that the variation in γ across holding companies and
years is well captured by these fixed effects and company characteristics.
6.2. Estimates of the Structural Model of Reinsurance
To construct our estimation sample, we first isolate pairs of operating companies and shadow
reinsurers, where total reinsurance ceded is greater than $100 million. We then calculate the
change in liabilities for both the operating company and the shadow reinsurer as annualized
changes over the same time period, during which they have a reinsurance agreement in effect.
We end up with a sample of 147 shadow insurance relationships between 2003 and 2012.
Table 7 reports our estimate of equation (19) by ordinary least squares. As predicted
by the theory, the operating company’s labilities move less than dollar-for-dollar with the
shadow reinsurer’s liabilities. The operating company’s liabilities increase by $0.44 for every
dollar increase in the shadow reinsurer’s liabilities. The coefficients on log assets and return
on equity are negative and significant, while the coefficient on leverage is positive and sig-
nificant. This implies that smaller, less profitable, and more leveraged companies have more
curvature (i.e., higher γ) in their capital adjustment cost.
6.3. Retail Market in the Absence of Shadow Insurance
Based on equation (12), we now estimate how shadow insurance lowers the capital adjustment
cost, which leads to lower marginal cost and a higher equilibrium supply in the retail market.
Our structural estimates in Table 7 and equation (18) imply an estimate of γ for each
operating company. We calibrate the parameter ρo to 0.15, based on industry estimates of
redundant life insurance reserves relative to total gross reserves (Stern et al. 2007).
Table 8 reports that marginal cost would rise by 1.8 percent for the average operating
company in the absence of shadow insurance. The change in marginal cost varies significantly
across companies that face different costs of capital, as captured by a standard deviation
of 2.8 percent. When aggregated across all the operating companies in our sample, annual
insurance underwritten would fall by $1.4 billion (from its current level of $84.8 billion) at
unit demand elasticity.
We view our estimate in Table 8 as an upper bound on the actual impact of eliminating
shadow insurance for two reasons. First, life insurers may find new ways to manage capital
that substitute for shadow insurance. Second, only the largest companies that capture 50
percent of the market share are involved in shadow insurance. The smaller companies may
be able to supply more insurance without a significant increase in marginal cost, thereby
17

offsetting the lower supply by the largest companies.
7. Conclusion
Activity in the shadow insurance sector has recently drawn the attention of some insurance
regulators. In particular, New York has called for a national moratorium on further approval
of shadow insurance until more information can be gathered about this activity (Lawsky
2013). However, such efforts are hindered by the fact that insurance is regulated at the
state level, which makes national coordination difficult. Our analysis shows that there are
both costs and benefits to shadow insurance. On the one hand, the current size of the
shadow insurance sector implies an additional expected loss of at least $15.7 billion for the
industry. On the other hand, marginal cost would rise by 1.8 percent in the absence of
shadow insurance, which leads to a $1.4 billion reduction in annual insurance underwritten
at unit demand elasticity.
The actual cost of shadow insurance may be higher than our lower-bound estimate for
several reasons. First, the lack of public disclosure by shadow reinsurers prevents accurate
assessment of their investment risk and the fragility of their funding arrangements. Second,
$363 billion for the current size of the U.S. shadow insurance sector may just be the tip of
an iceberg, if there is additional activity in the rest of the world. Third, the financial crisis
has shown that even relatively small shocks can amplify due to the interconnectedness of
financial institutions and the endogeneity of asset prices. Finally, problems in the insurance
sector could spill over to real economic activity through the corporate bond market.
18

References
Acharya, Viral V., Philipp Schnabl, and Gustavo Suarez, “Securitization without
Risk Transfer,” Journal of Financial Economics, 2013, 107 (3), 515–536.
Adiel, Ron, “Reinsurance and the Management of Regulatory Ratios and Taxes in the
Property-Casualty Insurance Industry,” Journal of Accounting and Economics, 1996,
22 (1), 207–240.
A.M. Best Company, “Best’s Schedule S: Life/Health, United States,” 2003–2013.
, “Best’s Statement File: Life/Health, United States,” 2003–2013.
, “Best’s Credit Rating Methodology: Global Life and Non-Life Insurance Edition,”
2011.
, “Best’s Impairment Rate and Rating Transition Study—1977 to 2012,” 2013.
Board of Governors of the Federal Reserve System, “Financial Accounts of the United
States: Flow of Funds, Balance Sheets, and Integrated Macroeconomic Accounts,” 2013.
Historical Annual Tables 2005–2012.
Captives and Special Purpose Vehicle Use Subgroup, “Captives and Special Purpose
Vehicles,” 2013. National Association of Insurance Commissioners.
Cole, Cassandra R. and Kathleen A. McCullough, “Captive Domiciles: Trends and
Recent Changes,” Journal of Insurance Regulation, 2008, 26 (4), 61–90.
Froot, Kenneth A., “The Market for Catastrophe Risk: A Clinical Examination,” Journal
of Financial Economics, 2001, 60 (2–3), 529–571.
and Paul G.J. O’Connell, “On the Pricing of Intermediated Risks: Theory and
Application to Catastrophe Reinsurance,” Journal of Banking and Finance, 2008, 32
(1), 69–85.
Gallanis, Peter G., “NOLHGA, the Life and Health Insurance Guaranty System, and
the Financial Crisis of 2008–2009,” 2009. National Organization of Life and Health
Insurance Guaranty Associations.
Koijen, Ralph S.J. and Motohiro Yogo, “The Cost of Financial Frictions for Life
Insurers,” 2012. NBER Working Paper 18321.
19

Lawsky, Benjamin M., “Shining a Light on Shadow Insurance: A Little-Known Loophole
That Puts Insurance Policyholders and Taxpayers at Greater Risk,” 2013. New York
State Department of Financial Services.
Loring, Denis W. and G. Michael Higgins, “Introduction to Life Reinsurance 101,”
Record of the Society of Actuaries, 1997, 23 (2), 1–25.
Mayers, David and Clifford W. Smith Jr., “On the Corporate Demand for Insurance:
Evidence from the Reinsurance Market,” Journal of Business, 1990, 63 (1), 19–40.
National Association of Insurance Commissioners, Accounting Practices and Proce-
dures Manual, Kansas City, MO: National Association of Insurance Commissioners,
2011.
Stern, Jeffrey, William Rosenblatt, Bernhardt Nadell, and Keith M. Andruschak,
“Insurance Securitizations: Coping with Excess Reserve Requirements under Regulation
XXX,” Journal of Taxation and Regulation of Financial Institutions, 2007, 20 (6), 30–
34.
Tiller, Jr., John E. and Denise Fagerberg Tiller, Life, Health and Annuity Reinsur-
ance, 3rd ed., Winsted, CT: ACTEX Publications, 2009.
20

Table 1: A Stylized Example of Captive ReinsuranceThis example illustrates how coinsurance or yearly renewable term reinsurance affects the balance sheets of an operating companyand an unauthorized captive, both of which are part of the same holding company. The operating company must hold statutoryreserve of $110, while the captive can hold GAAP reserve of $90.
Operating company(in domicile with tighter capital regulation)
1. Sells insurance for $100. 2. Cedes reinsurance.(Statutory reserve of $110 andGAAP reserve of $90.)
A L A L A L
Bonds $10 =⇒ Bonds $10 =⇒ Bonds $10Premium $100 Reserve $110
Equity $10 Equity $0 Equity $10
Captive(in domicile with looser capital regulation)
2. Assumes reinsurance.Establishes trust with $90 in bonds.Secures letter of credit up to $20.
A L A L
=⇒ Trust: Bonds $90 Reserve $90Letter of creditCash $10
Equity $0 Equity $10
21

Table 2: Summary Statistics for Reinsurance AgreementsThis table reports summary statistics for life and annuity reinsurance agreements that originated within the previous year, bywhether they were ceded to unaffiliated or affiliated reinsurers. Shadow reinsurers are affiliated and unauthorized reinsurerswithout an A.M. Best rating. Reinsurance ceded is the sum of reserve credit taken and modified coinsurance reserve ceded.
Number of reinsurance Mean reinsurance ceded Median reinsurance cededagreements ceded to (million $) (million $)
Year Unaffiliated Affiliated Shadow Unaffiliated Affiliated Shadow Unaffiliated Affiliated Shadow
2002 1,447 153 53 26.6 78.8 59.7 0.2 0.8 1.12003 960 119 70 25.9 116.4 59.3 0.1 2.4 1.52004 753 149 89 101.2 528.4 502.4 0.1 4.5 4.22005 824 182 110 28.3 210.8 162.9 0.0 2.3 4.92006 681 146 85 53.8 227.2 231.0 0.0 4.4 2.82007 599 114 65 38.9 344.8 450.9 0.1 9.2 8.62008 566 132 88 25.1 613.2 717.4 0.0 14.6 10.42009 456 120 67 36.9 1,198.9 2,003.3 0.1 11.1 12.32010 408 116 56 9.8 509.1 776.3 0.0 37.5 23.12011 277 100 49 60.8 684.5 640.4 0.0 36.9 131.82012 289 111 44 98.6 422.4 512.9 0.4 22.8 130.9
22

Table 3: Characteristics of Companies Ceding to Shadow ReinsurersThis table reports summary statistics for operating companies in 2012, by whether they areceding reinsurance to shadow reinsurers. Shadow reinsurers are affiliated and unauthorizedreinsurers without an A.M. Best rating. The market shares are based on gross reserves heldfor life insurance and annuities, respectively.
Ceding toshadow
reinsurers
Statistic No Yes
Number of companies 347 81Market share (percent):Life insurance 50 50Annuities 50 50
Median:Risk-based capital (percent) 205 181Log assets 0.00 3.24Leverage (percent) 84 93Current liquidity (percent) 84 66Return on equity (percent) 7 14
23

Table 4: Affiliated Reinsurance within the MetLife GroupThis table lists the U.S. operating companies of the MetLife group and their affiliated rein-surers in 2012, whose net reinsurance ceded is greater than $100 million in absolute value.Net reinsurance ceded is the sum of reserve credit taken and modified coinsurance reserveceded minus the sum of reserves held and modified coinsurance reserve assumed.
A.M. Net reinsur-Best ance ceded
Company Domicile rating (billion $)
Metropolitan Life Insurance New York A+ 39.1MetLife Investors USA Insurance Delaware A+ 13.3General American Life Insurance Missouri A+ 3.9MetLife Insurance of Connecticut Connecticut A+ 3.6MetLife Investors Insurance Missouri A+ 2.6First MetLife Investors Insurance New York A+ 1.6New England Life Insurance Massachusetts A+ 1.0Metropolitan Tower Life Insurance Delaware A+ 0.8MetLife Reinsurance of Delaware Delaware -0.4MetLife Reinsurance of South Carolina South Carolina -3.1Exeter Reassurance Bermuda -5.8MetLife Reinsurance of Vermont Vermont -9.9MetLife Reinsurance of Charleston South Carolina -12.9Missouri Reinsurance Barbados -28.4Total for the MetLife group 5.5
24

Table 5: Relation between Shadow Insurance and RatingThe A.M. Best rating, converted to a numeric equivalent based on risk-based capital guide-lines, is regressed on company characteristics. The key variable of interest is the share ofgross life and annuity reserves ceded to shadow reinsurers. The sample consists of operatingcompanies between 2002 and 2012. The coefficients are standardized, and the standard er-rors (reported in parentheses) are clustered by holding company. Year fixed effects are notreported for brevity.
Variable Coefficient
Share ceded to 0.00shadow reinsurers (0.02)
Risk-based capital 0.10(0.03)
Log assets 0.79(0.04)
Leverage -0.16(0.04)
Current liquidity 0.07(0.02)
Return on equity 0.04(0.02)
R2 0.45Observations 5,496
25
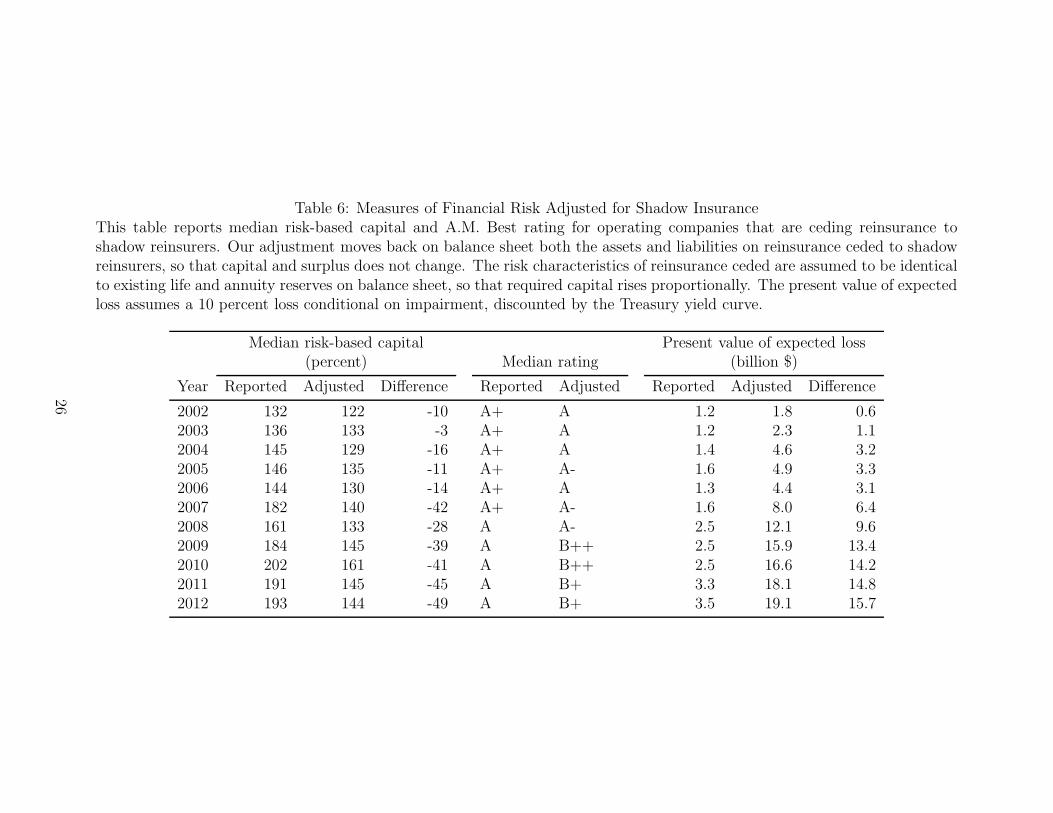
Table 6: Measures of Financial Risk Adjusted for Shadow InsuranceThis table reports median risk-based capital and A.M. Best rating for operating companies that are ceding reinsurance toshadow reinsurers. Our adjustment moves back on balance sheet both the assets and liabilities on reinsurance ceded to shadowreinsurers, so that capital and surplus does not change. The risk characteristics of reinsurance ceded are assumed to be identicalto existing life and annuity reserves on balance sheet, so that required capital rises proportionally. The present value of expectedloss assumes a 10 percent loss conditional on impairment, discounted by the Treasury yield curve.
Median risk-based capital Present value of expected loss(percent) Median rating (billion $)
Year Reported Adjusted Difference Reported Adjusted Reported Adjusted Difference
2002 132 122 -10 A+ A 1.2 1.8 0.62003 136 133 -3 A+ A 1.2 2.3 1.12004 145 129 -16 A+ A 1.4 4.6 3.22005 146 135 -11 A+ A- 1.6 4.9 3.32006 144 130 -14 A+ A 1.3 4.4 3.12007 182 140 -42 A+ A- 1.6 8.0 6.42008 161 133 -28 A A- 2.5 12.1 9.62009 184 145 -39 A B++ 2.5 15.9 13.42010 202 161 -41 A B++ 2.5 16.6 14.22011 191 145 -45 A B+ 3.3 18.1 14.82012 193 144 -49 A B+ 3.5 19.1 15.7
26

Table 7: Estimates of the Structural Model of ReinsuranceThe sample consists of pairs of operating companies and shadow reinsurers between 2003 and2012, where total reinsurance ceded is greater than $100 million. Heteroskedasticity-robuststandard errors are reported in parentheses. Year and holding-company fixed effects are notreported for brevity.
Variable Coefficient
Change in shadow 0.44reinsurer’s liabilities (0.14)
Log assets -1.03(0.25)
Leverage 1.74(0.37)
Current liquidity 0.33(0.26)
Return on equity -1.10(0.34)
Observations 174
Table 8: Retail Market in the Absence of Shadow InsuranceThe structural model of reinsurance is used to estimate the counterfactual of eliminatingshadow insurance. This table reports the change in marginal cost for operating companiesthat are ceding reinsurance to shadow reinsurers. It also reports the total dollar change inannual insurance underwritten, as measured by the change in gross life and annuity reserves.
Change in Value
Marginal cost (percent):Mean 1.8Standard deviation 2.8
Quantity (billion $) -1.4
27

100
200
300
400
500
600
Rei
nsur
ance
ced
ed (
billi
on $
)
2002 2004 2006 2008 2010 2012Year
AffiliatedUnaffiliated
Figure 1: Reinsurance Ceded by U.S. Life InsurersThis figure reports life and annuity reinsurance ceded by U.S. life insurers to affiliated andunaffiliated reinsurers. Reinsurance ceded is the sum of reserve credit taken and modifiedcoinsurance reserve ceded.
28

010
020
030
040
0R
eins
uran
ce c
eded
(bi
llion
$)
2002 2004 2006 2008 2010 2012Year
AffiliatedUnaffiliated
Life reinsurance
010
020
030
040
0R
eins
uran
ce c
eded
(bi
llion
$)
2002 2004 2006 2008 2010 2012Year
Annuity reinsurance
Figure 2: Life versus Annuity Reinsurance Ceded by U.S. Life InsurersThis figure reports reinsurance ceded by U.S. life insurers to affiliated and unaffiliated reinsurers, separately for life and annuityreinsurance. Reinsurance ceded is the sum of reserve credit taken and modified coinsurance reserve ceded.
29

0.2
.4.6
.81
Sha
re o
f tot
al r
eins
uran
ce c
eded
2002 2004 2006 2008 2010 2012Year
Affiliated reinsurance
0.2
.4.6
.81
Sha
re o
f tot
al r
eins
uran
ce c
eded
2002 2004 2006 2008 2010 2012Year
Other internationalBermuda, Barbados& Cayman IslandsOther U.S.South Carolina &Vermont
Unaffiliated reinsurance
Figure 3: Reinsurance Ceded by Domicile of ReinsurerThis figure decomposes life and annuity reinsurance ceded by domicile of the reinsurer, separately for affiliated and unaffiliatedreinsurance. Reinsurance ceded is the sum of reserve credit taken and modified coinsurance reserve ceded.
30
0.2
.4.6
.81
Sha
re o
f tot
al r
eins
uran
ce c
eded
2002 2004 2006 2008 2010 2012Year
A++ or A+A or lowerUnrated
Affiliated reinsurance
0.2
.4.6
.81
Sha
re o
f tot
al r
eins
uran
ce c
eded
2002 2004 2006 2008 2010 2012Year
Unaffiliated reinsurance
Figure 4: Reinsurance Ceded by Rating of ReinsurerThis figure decomposes life and annuity reinsurance ceded by the A.M. Best rating of the reinsurer, separately for affiliated andunaffiliated reinsurance. Reinsurance ceded is the sum of reserve credit taken and modified coinsurance reserve ceded.
31

0.2
.4.6
.81
Sha
re o
f tot
al r
eins
uran
ce c
eded
2002 2004 2006 2008 2010 2012Year
AuthorizedUnauthorized
Affiliated reinsurance
0.2
.4.6
.81
Sha
re o
f tot
al r
eins
uran
ce c
eded
2002 2004 2006 2008 2010 2012Year
Unaffiliated reinsurance
Figure 5: Reinsurance Ceded to Unauthorized ReinsurersThis figure decomposes life and annuity reinsurance ceded by whether the reinsurer is authorized in the domicile of the cedingcompany, separately for affiliated and unaffiliated reinsurance. Reinsurance ceded is the sum of reserve credit taken and modifiedcoinsurance reserve ceded.
32

01
23
As
shar
e of
cap
ital &
sur
plus
010
020
030
040
0R
eins
uran
ce c
eded
(bi
llion
$)
2002 2004 2006 2008 2010 2012Year
Reinsurance ceded (billion $)As share of capital & surplus
Figure 6: Reinsurance Ceded to Shadow ReinsurersThis figure reports life and annuity reinsurance ceded by U.S. life insurers to shadow reinsur-ers, both in total dollars and as a share of the capital and surplus of the ceding companies.Shadow reinsurers are affiliated and unauthorized reinsurers without an A.M. Best rating.Reinsurance ceded is the sum of reserve credit taken and modified coinsurance reserve ceded.
33

0.2
.4.6
.81
Sha
re o
f tot
al g
ross
res
erve
2002 2004 2006 2008 2010 2012Year
Net reserveCeded to other reinsurersCeded to shadow reinsurers
Figure 7: Decomposition of Gross Reserve for Companies Ceding to Shadow ReinsurersThis figure decomposes gross life and annuity reserves into reinsurance ceded versus netreserves held, for operating companies that are ceding reinsurance to shadow reinsurers.Shadow reinsurers are affiliated and unauthorized reinsurers without an A.M. Best rating.
34

Appendix
A. Additional Examples of Captive Reinsurance
In this appendix, we illustrate captive reinsurance when the transaction is structured as
coinsurance with funds withheld or modified coinsurance. The main difference between
these types of reinsurance and coinsurance is that the ceding company retains control of the
assets. Therefore, the captive does not need to establish a trust fund.
A.1. Coinsurance with Funds Withheld
The first step in Table A1 is the same as in Table 1. In the second step, the operating
company cedes all the policies to the captive, paying a reinsurance premium of $10. The
operating company withholds $90 in the transaction, investing it in bonds. The withheld
assets are recorded as a “funds held” liability for the operating company and as a “funds
deposited” asset for the captive. The captive secures a letter of credit up to $20 to fund the
difference between statutory and GAAP reserve. On the liability side, the captive records
GAAP reserve of only $90 because it is not subject to Regulation (A)XXX.
A.2. Modified Coinsurance
The first step in Table A2 is the same as in Table 1. In the second step, the operating
company cedes all the policies to the captive, paying a reinsurance premium of $10. The
operating company withholds $90 in the transaction, investing it in bonds. The withheld
assets are recorded as a “modco reserve” liability for the operating company and as a “modco
deposit” asset for the captive. The captive secures a letter of credit up to $20 to fund the
difference between statutory and GAAP reserve. On the liability side, the captive records
GAAP reserve of only $90 because it is not subject to Regulation (A)XXX.
35
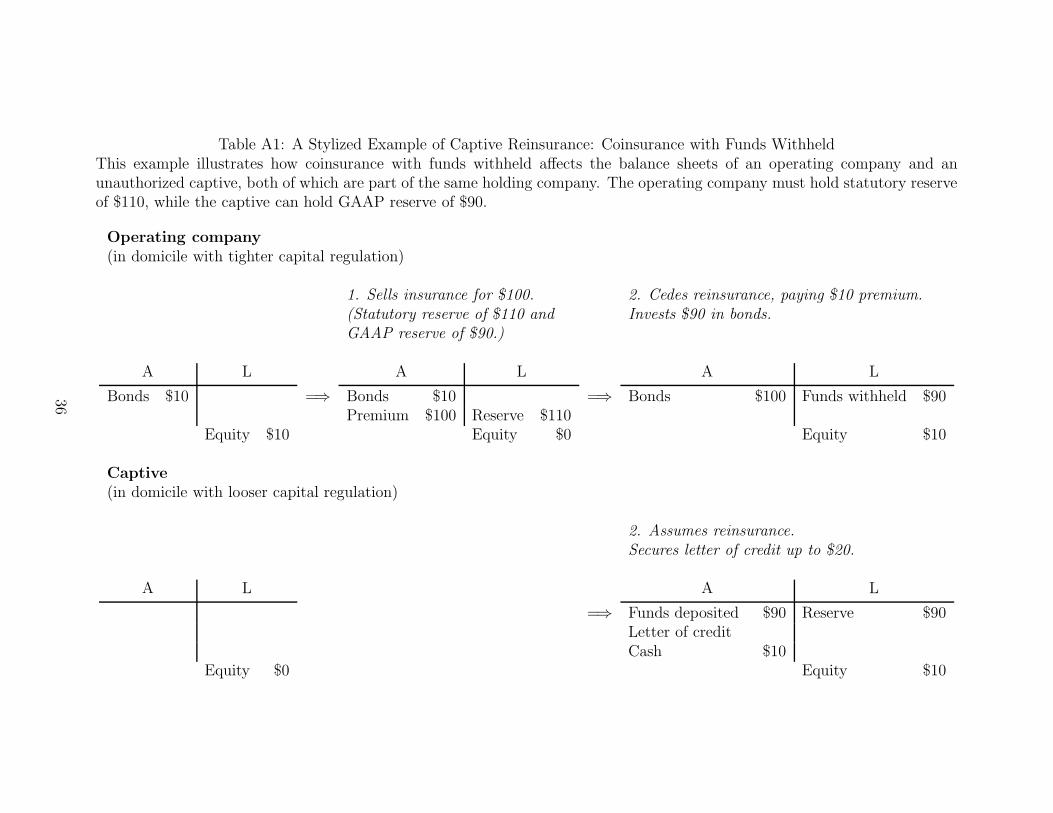
Table A1: A Stylized Example of Captive Reinsurance: Coinsurance with Funds WithheldThis example illustrates how coinsurance with funds withheld affects the balance sheets of an operating company and anunauthorized captive, both of which are part of the same holding company. The operating company must hold statutory reserveof $110, while the captive can hold GAAP reserve of $90.
Operating company(in domicile with tighter capital regulation)
1. Sells insurance for $100. 2. Cedes reinsurance, paying $10 premium.(Statutory reserve of $110 and Invests $90 in bonds.GAAP reserve of $90.)
A L A L A L
Bonds $10 =⇒ Bonds $10 =⇒ Bonds $100 Funds withheld $90Premium $100 Reserve $110
Equity $10 Equity $0 Equity $10
Captive(in domicile with looser capital regulation)
2. Assumes reinsurance.Secures letter of credit up to $20.
A L A L
=⇒ Funds deposited $90 Reserve $90Letter of creditCash $10
Equity $0 Equity $10
36

Table A2: A Stylized Example of Captive Reinsurance: Modified CoinsuranceThis example illustrates how modified coinsurance affects the balance sheets of an operating company and an unauthorizedcaptive, both of which are part of the same holding company. The operating company must hold statutory reserve of $110,while the captive can hold GAAP reserve of $90.
Operating company(in domicile with tighter capital regulation)
1. Sells insurance for $100. 2. Cedes reinsurance, paying $10 premium.(Statutory reserve of $110 and Invests $90 in bonds.GAAP reserve of $90.)
A L A L A L
Bonds $10 =⇒ Bonds $10 =⇒ Bonds $100 Modco reserve $90Premium $100 Reserve $110
Equity $10 Equity $0 Equity $10
Captive(in domicile with looser capital regulation)
2. Assumes reinsurance.Secures letter of credit up to $20.
A L A L
=⇒ Modco deposit $90 Reserve $90Letter of creditCash $10
Equity $0 Equity $10
37