SGR and Medicare Physician Reimbursement · • CMO Hospital, CMO Clinic, Chief Quality/Safety...
67
Health Care, Education and Research www.billingsclinic.com SGR and Medicare Physician Reimbursement A View From the Delivery System Perspective Nicholas Wolter MD Billings Clinic
Transcript of SGR and Medicare Physician Reimbursement · • CMO Hospital, CMO Clinic, Chief Quality/Safety...

Health Care, Education and Research www.billingsclinic.com
SGR and Medicare Physician Reimbursement
A View From the Delivery System Perspective Nicholas Wolter MD Billings Clinic

Who We Are
• Community governed, physician led, patient centric
• Merger/Integration of a MSGP and Community Hospital in 1993NFP
• Organized clinical care • One patient record (& bill) • Multiple clinical providers, but
one team • An obsessive dedication to
quality and service
• 3600+ Employees – Group practice w/250 Physicians, 75
NPs and PAs, 10 clinic locations – 272 (230) bed level II trauma &
tertiary referral hospital – Manage/support 10 CAHs – 3rd largest employer in Montana
• Board of Directors: Community-based w MDs included
• “Internal Board”: Leadership Council – Physicians and Administrators
Multispecialty Group Practice at the Core

Who We Are An outstanding medical foundation built upon the following cornerstones: • A multi-specialty physician group practice in which a “community
of physicians” work together in a collegial manner is at the core of this model.
• The partnering of physicians, excellent business managers, professional staff, and volunteers create a team whose synergies drive our success.
• Not-for-profit, community-owned and governed. • Mission-driven decision-making dedicated to a higher purpose in
the community and the region. • An obsessive dedication to quality and service.

Billings Clinic Physician Group Practice Decision Making Processes/Places • Departments and Chairs • Department Chair Meetings • Divisions- Primary Care, Surgery, Region • All Physician Meetings • Hospital Clinical Units • Physician Compensation Committee • Leadership Council • Administration (SET- Senior Executive Team) • Physician Chief Executive Officer • Board of Directors • CMO Hospital, CMO Clinic, Chief Quality/Safety Officer

Service Area
Riverton
Fremont
Casper
Powell
Park
Cody
Hot Spring
s Thermopolis
Bighorn
Lovell
Washakie Worland
Sheridan
Campbell
Gillette
Crook
Lincoln Flathead
Sanders Lake
Glacier
Missoula
Ravalli
Granite Deer
Lodge
Pondera
Teton
Lewis & Clark
Madison
Gallatin
Park
Sweet Grass
Meagher Wheatland
Judith Basin
Chouteau
Hill Blaine
Fergus
Golden Valley
Carbon Big Horn
Yellowstone
Musselshell
Petroleum
Phillips
Valley
Garfield
Rosebud
Powder River
Carter
Fallon
Prairie Wibaux
Dawson
McCone
Richland
Roosevelt
Sheridan Daniels
Dillon
Lewistown
Livingston
Columbus Billings
Red Lodge
Miles City
Sidney
Glasgow
Weston
Natrona
Williams
Divide
McKenzie
Dickinson
Dunn
Stark
Slope
Bowman Adams
Scobey
Big Timber
Bozeman
June 2011
Hardin
Sheridan
Johnson
Buffalo
Glendive
Williston
Lame Deer
Plentywood
Poplar
Missoula
Silver Bow
Jefferson
Cascade
Toole
Great Falls
Custer
Havre Kalispell
Butte
Forsyth
Primary (62% of admits)
Secondary (15% of admits) Tertiary (20% of admits)
Population Sq. Miles Primary 139,981 2,635 Secondary 54,349 26,101 Tertiary 350,299 92,630 TOTAL: 544,629 121,366 Source: Claritas, Inc. 2007 Population Estimate
US Census Bureau Land Area Sizes
Hospital Satellite Clinic Long-Term Care
Billings Clinic Sites
Colstrip
Managed Facility
Defined Service Areas

Vision
• 2005 Best in Nation Safety, Quality, Service
• 2010 Best in Nation Safety, Quality, Service, Value

Early Adoption and Innovation
• CMS Physician Group Practice Demonstration and Transition Demo
• Magnet Designation • Complexity Theory Initiatives • Medicare Shared Savings Pilot • Bundling: Hip & Knee

Early Adoption and Innovation
• Leadership Billings Clinic • Physician Leadership HayGroup Project • BCBS Medical Home Project • NCQA ACO Designation • Operational Excellence (Lean Six Sigma) • Cerner Partnership

Early Adoption and Innovation • Mayo Clinic Care Network • New West Health Services (Medicare
Advantage) • Research and Center for Translational
Research • Board Quality and Safety Committee • Internal Medicine Residency

Quality and Patient Safety Recognition
HealthGrades Distinguished Hospital Award for Clinical Excellence 2004, 2005, 2013
Solucient 100 Top Hospitals in America Modern Healthcare and Truven Health Analytics 2004, 2013
Magnet™ Designation by the American Nurses Credentialing Center 2006 – 2010, re-designated 2011-2015
HealthGrades Distinguished Hospital Award for Patient Safety 2007, 2010, 2011, 2012
National Cancer Institute Community Cancer Centers Program 2008 – 2014
“A” Rating for Hospital Safety by The Leapfrog Group 2011, 2012
Accredited as an Accountable Care Organization by The National Committee for Quality Assurance 2012
Rated #1 in Nation for Patient Safety by Consumer Reports ® 2012
US News and World Report Best Regional Hospitals - #1 in Montana for Diabetes and Endocrinology, Gynecology, Nephrology and Pulmonology
2012-2013
10

PGP Demo: Financial Outcomes Savings:
Year 1: $9.5M, 2 org $7.3M Year 2: $17M, 4 orgs $13.8M Year 3: $32.3M, 5 orgs $32.3M Year 4: $37.8M, 5 orgs $31.7M Year 5: $36.2M. 4 orgs $29.4M
5 yr. Savings Total= $133M* $115M shared with 6 orgs 1 org captured >50% total 5th year savings payment reflects 1.8% of net patient expend
For most, savings < ↓ revenues/business costs of implement.
Risk adjustment was significant factor in performance Data feedback problematic; reconciliation @ 18 months True patient engagement hampered by retro attribution Overall evaluation of success?
10 separate comparison groups and no national benchmark
*Only amounts >2% threshold are recognized, actual net $218M

PGP Demo: Clinical Outcomes Clinical interventions applied to all patients, payer-neutral
Increased focus on population management and chronic disease Increased outpatient utilization, decreased inpatient utilization. Examples from PGP organizations:
40% reduction of HF hospitalizations ($4M+ revenue) for 15% pop 20% reduction in 1 day psych hospitalizations Planned visits , improved PCP access to reduce emergency visits Chronic condition management for anticoagulation, HF, lipids, diabetes, & 24/7 nurse triage Risk stratification with case management for complex patients Improved coordination for transitions in care
Significant spending on EMR optimization & quality reporting/documentation All 10 orgs with significant quality achievement (year 5, 7@100%)

Billings Clinic ACO has approximately 12,000 beneficiaries
Must achieve about 2.8% in savings before any sharing

MSSP: Billings Clinic View • Attribution improved- still retrospective,
60% stayer rate • Threshold a problem for smaller poulations
(BC 12,000+ bens, 2.7% threshold) • Quality/safety measures reasonable-
reporting vs achieving benchmark issue • Risk adjustment fixed for 3 years • Beneficiary notification • HCAHPS, CCAHPS

Operational Excellence Savings
Year
Dollar Total % Operating
Expense
2009 $2,670,987 0.6%
2010 $3,821,665 0.9%
2011 $5,244,335 1.1%
2012 $9,945,136 2.1%
2013 $8,559,062 1.7%
15

Billings Clinic Annual Overall Charge Increase
FY 2014 0%
FY 2013 1%
FY 2012 1%
FY 2011 4%
16


Reference for Graph
• Data is from the expenditure reports provided to all MSSP ACO participants each quarter
• Expenditures do not include DSH or IME payments
• There is data from 220 MSSP ACO’s that started in 2013 represented on the graph

SGR
• Ineffective policy • Has plagued providers and policymakers
alike • $170 billion fix

SGR scheduled Pmt Cut
Effective increase per CMS
2009 -5.5% 1.1% Medicare Improvements for Patients and Providers Act of 2008 (MIPPA)– Extended through FY 2009. The update to the conversion factor was 1.1 percent
2010 -21.3% 1.3%
Patient Protection and Affordable Care Act of 2010 (ACA) – Extended through FY 2010. In June 2010, Congress passed the Preservation of Access to Care for Medicare Beneficiaries and Pension Relief Act of 2010 (PACMB), which prevented physician payment reductions until December 1, 2010. PACMB legislation not only blocked a 21.3% reduction in physician payment rates then mandated by the SGR, but it also provided a 2.2% increase. Next Congress passed the Physician Payment and Therapy Relief Act of 2010, which contained a one-month extension, freezing payment rates through December 31, 2010. The additional 2.2 percent was continued during December by the one-month extension.
2011 -25.0% 0.9% The Medicare and Medicaid Extenders Act of 2010 was passed in December and maintained PPTRA 's physician payment rates , avoiding a scheduled 25% payment cut.
2012 -27.4% 0.0%
Temporary Payroll Tax Cut Continuation Act of 2011 (TPTCCA) Section 301 of the TPTCCA specified a zero percent update to the PFS claims from January 1, 2012 through February 29, 2012. February 22, 2012, the MCTRJCA was signed into law. Section 3003 extended the zero percent PFS update to the remainder of CY 2012.
2013 -26.5% 0.0% Reflects the zero percent update for calendar year 2013 adopted by section 601(a) of the American Taxpayer Relief Act of 2012.
PFS Update 5 year History

PFS Update History
Source: http://www.cms.gov/Medicare/Medicare-Fee-for-Service-Payment/SustainableGRatesConFact/Downloads/sgr2014p.pdf

Potential Offsets to Pay for SGR Reform
• E&M cut – $11 billion • Post-acute care cuts -- $50 billion • Beneficiary cost-sharing changes -- $55
billion • Drug rebates and related policies $100+
billion

PHYSICIAN WORK COST VS PAYMENT
SPECIALTY
Average Compensation per
Work RVU
Medicare Payment per Work RVU
Billings Clinic difference per Medicare Patient
NEUROSURGERY/NEUROLOGY $ 85.61 $ 34.02 $ 51.59 PSYCHIATRY $ 80.35 $ 34.02 $ 46.33 INTERNAL MEDICINE $ 68.48 $ 34.02 $ 34.46 ONCOLOGY $ 77.25 $ 34.02 $ 43.23 DIABETES/ENDOCRINOLOGY $ 86.59 $ 34.02 $ 52.57 FAMILY PRACTICE $ 65.93 $ 34.02 $ 31.91 CARDIOLOGY/CV SURGERY $ 63.55 $ 34.02 $ 29.53 ORTHOPEDICS $ 68.92 $ 34.02 $ 34.90 SURGERY $ 60.72 $ 34.02 $ 26.70

Fiscal Year 2012 Losses for RVU Based Departments
Department Operating Profit (Loss) Neurology ($986,072) Psychiatric (BHC) ($2,506,317) Internal Medicine ($1,487,923) Oncology
Infusion Center Radiation Oncology
($2,583,029) $1,349,059 $597,699
Family Practice ($1,714,024) Cardiology
Cath Lab ($1,554,855) $18,410,779
Cardiovascular Surgery ($920,661) Orthopedics
Surgery Center ($661,260) $3,297,701
General Surgery ($57,456) Neurosurgery (1,830,139)

Fiscal Year 2012 Service Line Profits (Loss) Service Line Profit (Loss) Primary Care ($13,458,229) Specialty Medicine ($1,986,150) Surgical Services $7,704,895 Medical/Surgical Inpatient Units ($12,860,425) Critical Care Services $2,752,170 Women’s & Children ($2,835,154) Psychiatric Services ($6,664,916) Diagnostic Services $27,253,612 Cardiac Services $15,860,437 Pharmacy $5,531,500 Skilled Nursing Facility ($4,843,359)

Why PCMH within ACO?
• Emphasizes prevention • Encourages cognition/relationship over technology • Less variation in utilization • Allows for most efficient delivery methods: allied
professionals, phone, e-mail, web-enabled • Proven concept in other modern nations, staff-model
HMOs • Access closest to patients • Promotes shared decision making • Leverage point for post-hospital care

Medical Home and ACO • Care Navigator • NPs & PAs • Medical Assistants • Pharmacists • 5% High Risk Patients Special Clinics • PCMH 25-35% Patients • Chronic Disease Management
– CHF, DM, HTN
• (A Different “Site” of Outpatient Care in Many Ways)
27

Integrated Health Care Coalition • Scott and White
Healthcare • Henry Ford Health
System • Munson Health System • Billings Clinic • Cleveland Clinic • University of Michigan
Health System • Trinity Mother Frances
(Texas)
• Indiana University Health
• Geisinger • Essentia Health • Gunderson Lutheran
28

IHCC E&M REFORM CRITERIA • EHR w data platform allowng shared
information between hospital and outpatient and clinic facilities and which is used in clinical decision making
• Use and application of data analytic tools including patient registeries to improve patient care, including focusing on high cost/high volume conditions seen in ambulatory settings in order to more effectively address annual per capita costs
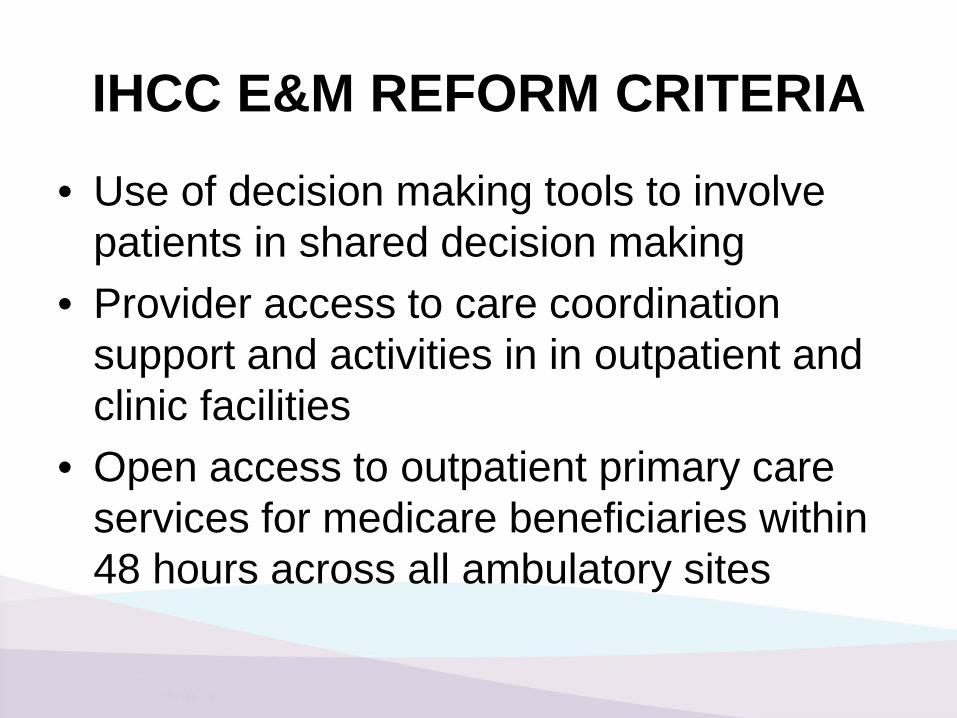
IHCC E&M REFORM CRITERIA
• Use of decision making tools to involve patients in shared decision making
• Provider access to care coordination support and activities in in outpatient and clinic facilities
• Open access to outpatient primary care services for medicare beneficiaries within 48 hours across all ambulatory sites

IHCC E&M REFORM CRITERIA
• Consistent application of charity care and financial assistance across all sites
• Evidence that governing board, hospital leadership, and physicians are participating in integrated quality and safety improvement activities w measurable and transparent results

Medicare Payment Policy
• Many moving parts • Conflicting messages at times

Medicare MD Payment Changes • Primary care incentive program (2011-
2015) • Sequestration • GPCI floors: practice expense and
physician work • Multiple procedure payment cuts for
imaging services

Medicare MD Payment Changes
• Bundling of cardiology codes (ex stents) • e prescribing incentives • e prescribing penalties

External Forces Influencing the Current Payment Environment
24%
5%
6%
2%3%
2%2%
55%
Medicare population health status DSH/GME/IME Medicare wage adjustments
Healthcare supply Population characteristics Population socioeconomic status
Population lifestyle, behavior Unexplained variation
Source: AHA, January 10, 2011 Report of the Task Force on Variation in Health Care Spending

Physician Self-Referral
• When physicians refer patients to facilities in which they have ownership (“self-referral”), the physicians receive payment for their professional services and share in the profits of the facilities they own.
• Potential for conflict of interest resulted in passage of the “Stark Law” in 1989

Increasing Physician Ownership • Prior to 2002 there were fewer than 50 physician-owned
specialty hospitals, yet today there are perhaps as many as 235 nationwide.
– MEDPAC, Report to the Congress: Physician-Owned Specialty Hospitals Revisited (August 2006) http://www.medpac.gov/documents/Aug06_specialtyhospital_mandated_report.pdf
– Center for Healthcare Research and Transformation, Physician Ownership in Hospitals and Outpatient Facilities (July 2013) http://www.chrt.org/public-policy/policy-papers/physician-ownership-in-hospitals-and-outpatient-facilities/
• A 2008 national survey found that one in six physicians owned or leased advanced imaging equipment, and nearly one in seven owned or leased three or more types of medical equipment.
– J. Reschovsky, A. Cassil, and H. Pham. Physician Ownership of Medical Equipment. (December 2010) (Center for Studying Health System Change). http://www.hschange.com/CONTENT/1172/

Physician Self-Referral: Volume • Numerous studies have found that the volume of
services provided is higher in areas with physician-owned specialty hospitals than in areas without specialty hospitals.
– J. Mitchell. August 2007. Utilization Changes Following Market Entry by Physician-Owned Specialty Hospitals. Medical Care Research and Review 64( 4): 395-415..
– Medicare Payment Advisory Commission (MEDPAC). August 2006. Report to Congress: Physician-Owned Specialty Hospitals Revisited.
– B. Nallamothus, M. Rogers, M. Chernew, et al. March 7, 2007. Opening of Specialty Cardiac Hospitals and Use of Coronary Revascularization in Medicare Beneficiaries. Journal of the American Medical Association 297(9): 962-8.
– J. Stensland and A. Winter. Jan-Feb 2006. Do Physician-Owned Cardiac Hospitals Increase Utilization? Health Affairs 25(1): 119-29.

Self-Referral: Volume • The growth in the volume of advanced imaging services
is also positively associated with physician ownership. • Baker (2010) found that once physicians began billing for
the technical component of MRI services, they ordered more scans for their patients than they had before they owned or leased the equipment.
• Numerous older studies highlight the relationship between ownership of imaging equipment and increased utilization.
– S. Radecki and J. Steele. February 1990. Effect of on-site facilities on use of diagnostic radiology by non-radiologists. Investigative Radiology 25(2): 190–193
– B. Hillman, G. Olson, P. Griffith, et al. October 21, 1992. Physicians’ Utilization and Charges for Outpatient Diagnostic Imaging in a Medicare Population. Journal of the American Medical Association 268(15): 2050–4.

Hospital Volume Strategies
• Cardiac Services • Imaging • Orthopedics • Other Surgical Specialties: Urology, ENT,
General Surgery, • Laboratory

Negative Margins
• Hospital Outpatient Care • Primary Care: IM and Family Practice • Geriatrics • End of Life Care • Long Term Care

PGP TD ACO Pioneer
Attribution
retrospective All Specialty
retrospective Primary Care
retrospective Primary Care
retrospective Primary Care
Base Prior Year (2004) 3 -year wt. Averaging
3-year wt. Averaging
3-year wt. Averaging
Term (before re-basing) 3-->5 years 2 3 3
Comparison Local
Rate of growth National
Absolute amount National
Absolute amount
National 50% amount +
50% rate growth
Threshold (MSR) 2% 1.47%-4.65%
2-3.9% or 2% 1%
Savings 80%
above MSR 50%
first dollar 50% above MSR or
60% first dollar 50%
first dollar
Quality Gate 50% 80%, 90% 100% 100%
Quality Measures 32 45 33 33
Loss Risk No No No (1 sided) Yes (2 sided) Yes
Risk Adjustment
retrospective updated yearly
prospective adjusted yearly
prospective fixed for term
prospective fixed for term
Comparison of Shared Savings Models

Bundled Payment Initiative
Major joint replacement or reattachment of lower extremity w/o MCC
Billings Clinic Compare Group
Count of Anchor Admissions: 187 1,878 0-90 days post discharge spend: Total Post Acute Care - Part A and B $5,665 $5,073 Readmissions $156 $408 Skilled Nursing Facility $4,419 $2,328 Home Health $737 $990 All Other $353 $1347
43

Strengths/Opportunities
44
Readmissions: Billings Clinic’s cost for readmissions are well below the compare group and national benchmarks for high performing facilities. Skilled Nursing Facility: Billings Clinic cost for post acute skilled nursing facilities is well above compare group and national benchmarks for high performing facilities. Opportunity is to shift post acute discharge to home health or outpatient rehabilitation when clinically indicated. Both settings provide cost savings for Medicare.

Physician Quality Reporting System (Formerly know as Physician Quality Reporting Incentive [PQRI])
Incentive to Penalty
2008
2009
2010
2011
1.5% of Medicare B
PFS
2% of Medicare B
PFS
2% of Medicare B
PFS
2% of Medicare B
PFS
2012
2013
2014
2015 1% of
Medicare B PFS
.5% of Medicare B
PFS
.5% of Medicare B
PFS
Penalty to be enacted for
non-reporting (1.5-2%)

VBP in Context: Mandatory Delivery System
Reforms for Hospitals
VBP
• Begins October 1, 2012 (FFY 2013)
• Redistributes inpatient payments
• Budget neutral
Readmissions • Begins October 1,
2012 (FFY 2013)
• Cuts Medicare inpatient payments
• $7 billion cut /10 years nationwide
HACs
• Begins October 1, 2014 (FFY 2015)
• Cuts Medicare inpatient payments
• $1.4 billion cut / 10 years nationwide.
EHR Meaningful Use (ARRA)
• Incentives for qualifying hospitals now
• Cuts Medicare inpatient payments in FFY 2015 for hospitals that do not meet “meaningful use” standard
FFY 2013
FFY 2015

Implications of Mandatory Delivery System Reforms
• Hospitals will be competing against each other
• Play or pay
VBP
• Best performers win
• Others break even or lose
Readmissions/HACs
• No winners, only losers
EHR Program
• Carrot and stick

Health Care, Education and Research www.billingsclinic.com
Medicare DRG $$$ at Risk for Quality Performance
2013 2014 2015 2016 2017
Value Based Purchasing
1% of All DRGs
1.25% of All DRGs
1.5% of All DRGs
1.75% of All DRGs
2.0% of All DRGs
Hospital Acquired Conditions
1% of All DRGs
1% of All DRGs
1% of All DRGs
Re-admissions
1% of All DRGs
2% of All DRGs
3% of All DRGs
3% of All DRGs
3% of All DRGs
Total: 2% of
All DRGs 3.25% of All DRGs
5.5% of All DRGs
5.75% of All DRGs
6% of All DRGs

U.S. Health Care
Urgent need to: • Slow cost growth • Reduce cost curve growth • Improve quality and safety • Provide universal access

Total U.S. Spending
• 1999 1 Trillion • 2010 2.6 Trillion 16% of GDP • 2013 18% of GDP • 2006-2016 will grow 6.9% per year • 2016 4 Trillion 20% GDP

National Health Expenditures
• Grew 4.3% in 2012 • 3.9% per year 2009-2011 • 4 consecutive years record low growth for
the first time in 50 years • ? Recession and/or health system delivery
changes

IOM September 2012
• $750 billion waste in healthcare per year • Unnecessary services $210 b • Inefficient care delivery $130 b • Excess admin cost $190 b • Inflated prices $105 b • Prevention failures $55 b • Fraud $75 b


Delivery System Fragmentation
• Culture of Autonomy • Entrepreneurship • Technology Advances • Payment Policy: FFS, Physician Equity Models • Law and Regulation • Hospital Capability and Co-Dependency • Professionalism and Ethics

Why clinical integration?
• Coordinate care across silos and over time • Deliver evidence-based medicine at 100%
levels • Develop system approaches to the safest
and most reliable care • Manage cost of care optimally • Provide access to all in a timely manner

IOM Crossing the Quality Chasm Re-engineering the delivery system to meet six challenges
• Evidence based care processes • Effective use of information technology • Knowledge and skills management • Development of effective teams • Coordination of care across patient conditions, services,
and settings over time • Use of performance and outcome measurement for
continuous quality improvement and accountability
National Academy of Sciences, 2001

IOM’s Description of Key Delivery System Characteristics
“Can be seen as a virtual blueprint for expansion of the multispecialty group model.”
Frances J. Crosson, M.D. The Delivery System Matters
Health Affairs November/December 2005


Commonwealth Fund Commission
Accountable, Coordinated Care
“To end the current fragmentation, waste, and complexity, physicians and other care providers should be rewarded, through financial and non-financial incentives, to band together into traditional or virtual organizations that can provide the support they need to practice 21st century health care.”
November 2007

Importance of the Delivery System • IOM • MedPAC • Commonwealth Fund • Mayo Clinic Health Policy Center • AHA • AMGA and CAPP • HFMA • HC4HR

Exhibit 13. Illustrative Health Reform Goals and Tracking Performance 1. Secure and Stable Coverage for All
• Percent of population insured
• Percent of population with premiums and out-of-pocket expenses within affordability standard
2. Slowing Growth of Total Health Spending and Federal Health Outlays
• Annual growth rate in total health system expenditures
• Annual growth rate in Medicare expenditures
• Impact on federal budget: new spending, net savings, new revenues
3. Health Outcomes and Quality
• Percent of population receiving key preventive services or screenings
• Percent of population with chronic conditions controlled
• Percent reduction in gap between benchmark and actual levels of quality and safety
4. Payment and Delivery System Reform
• Percent of population enrolled in medical homes
• Percent of physicians practicing in accountable care organizations
• Percent of provider revenues based on value
Commonwealth Fund

62

Charles H. Mayo
January 1913
The past 50 years have been marked by advances in the science of medicine. The next 50 will be marked by improvements in the organization and teamwork of how health care is delivered.

Interrelated Determinants of Healthcare Quality
• Aims: better experience of care (STEEEP), better health for the population, lower total per capita costs
• Design of care processes that affect the patient: clinical microsystems
• The health care organization that houses the microsystems: care of patients across silos and over time
• The environment: policy, payment, regulatory, legal, education
Fisher, Berwick, Davis: Achieving Health Care Reform- How Physicians Can Help NEJM June 11, 2009

Payment Policy Observations • Payment for value critically important • Current models are early, complex, ripe
with issues: data/information accuracy and timely feedback, severity adjustment, thresholds, beneficiary engagement
• Underlying FFS system in urgent need of improvement and recalibration
• Intense focus on unit price reduction within separate silos is often counterproductive

Payment Policy Observations
• Payments incenting delivery system organization and performance and care of patients across silos and over time critically important
• Payment policy addressing inappropriate waste and volume variation is the next frontier and urgently needed