
Seybold NE
20
1644 EVALUATING SOIL QUALITY ON RECLAIMED COAL MINE SOILS IN INDIANA 1 C.A. Seybold, R.B. Grossman, H.R. Sinclair, K.M. McWilliams, G.R. Struben, and S.L. Wade 2 Abstract. On cultivated cropland, soil quality of reclaimed soils after surface mining for coal can be lower than that of the quality before mining. The objectives of the study were to evaluate near surface and profile soil quality on eight soils reclaimed to agricultural land in southwestern Indiana. Several near-surface properties were measured and a soil quality index score calculated from a minimum data set (MDS) of six indicators. The scoring function ranges were based on the soil condition before mining. The near-surface properties of bulk density, s oil strength, aggregate stability and particulate organic matter (POM-C) were within the limits observed for cultivated surface horizons. However, surface properties could be improved through best management practices. The profile soil quality was lower on all eight reclaimed sites. The index scores ranged from 68 to 87 on a scale from 0 to 100. The properties that were a major factor in lowering the soil quality of the reclaimed soils were a poor or massive soil structure, lower available water capacity, and increased bulk densities. Organic C, CEC, and s oil pH on most sites wer e generally comparable to the condition before mining. The poor or massi ve structure, higher bulk densities, and lower AWC of the reclaimed soils could result in water stress and/or lower productivity. Under doughty conditions especially under doughty conditions compared to the reference soil condition before mining. Additional Key Words: soil quality index, POM, near surface properties. 1 Paper was presented at the 2004 National Meeting of the American Society of Mining and Reclamation and The 25th West Virginia Surface Mine Drainage Task Force, April 18-24, 2004. Published by ASMR, 3134 Montavesta Rd., Lexington, KY 40502. 2 Cathy A. Seybold, Robert B. Grossman, and H. Raymond Sinclair, soil scientists, USDA- NRCS, Lincoln, NE 68508. Kendall M. McWilliams, soil scientist, USDA-NRCS, Jasper, IN 47546. Gary R. Struben, soil scientist, USDA-NRCS, Indianapolis, IN. Steve L. Wade, soil scientist and agronomist, Indiana Dept. of Natural Resources-Div. of Reclamation, Jasonville, IN.
-
Upload
armin-achmad -
Category
Documents
-
view
234 -
download
0
description
pengaruh reklamasi terhadap tanah
Transcript of Seybold NE

7/17/2019 Seybold NE
http://slidepdf.com/reader/full/seybold-ne 1/20
1644
EVALUATING SOIL QUALITY ON RECLAIMED COAL MINE SOILS IN
INDIANA1
C.A. Seybold, R.B. Grossman, H.R. Sinclair, K.M. McWilliams, G.R. Struben, and S.L. Wade2
Abstract. On cultivated cropland, soil quality of reclaimed soils after surfacemining for coal can be lower than that of the quality before mining. The objectives
of the study were to evaluate near surface and profile soil quality on eight soils
reclaimed to agricultural land in southwestern Indiana. Several near-surface
properties were measured and a soil quality index score calculated from a minimum
data set (MDS) of six indicators. The scoring function ranges were based on the soil
condition before mining. The near-surface properties of bulk density, soil strength,
aggregate stability and particulate organic matter (POM-C) were within the limits
observed for cultivated surface horizons. However, surface properties could be
improved through best management practices. The profile soil quality was lower on
all eight reclaimed sites. The index scores ranged from 68 to 87 on a scale from 0 to
100. The properties that were a major factor in lowering the soil quality of thereclaimed soils were a poor or massive soil structure, lower available water capacity,
and increased bulk densities. Organic C, CEC, and soil pH on most sites were
generally comparable to the condition before mining. The poor or massive structure,
higher bulk densities, and lower AWC of the reclaimed soils could result in water
stress and/or lower productivity. Under doughty conditions especially under doughty
conditions compared to the reference soil condition before mining.
Additional Key Words: soil quality index, POM, near surface properties.
1Paper was presented at the 2004 National Meeting of the American Society of Mining and
Reclamation and The 25th West Virginia Surface Mine Drainage Task Force, April 18-24,
2004. Published by ASMR, 3134 Montavesta Rd., Lexington, KY 40502.2Cathy A. Seybold, Robert B. Grossman, and H. Raymond Sinclair, soil scientists, USDA-
NRCS, Lincoln, NE 68508. Kendall M. McWilliams, soil scientist, USDA-NRCS, Jasper, IN
47546. Gary R. Struben, soil scientist, USDA-NRCS, Indianapolis, IN. Steve L. Wade, soil
scientist and agronomist, Indiana Dept. of Natural Resources-Div. of Reclamation, Jasonville,
IN.
7/17/2019 Seybold NE
http://slidepdf.com/reader/full/seybold-ne 2/20
1645
Introduction
Coal mining in west-central and southwestern Indiana has been occurring for more than 150
years (Indiana Geological Survey, 2003). After coal mining, the land must be restored to its pre-
mining use or a reasonably likely higher use (Surface Mining Control and Reclamation Act of 1977).
Consequently, topsoil removal and handling, and establishment of vegetation become very
important. In general, the reclamation operation consists of stock piling and replacing the A and B
horizons, and may involve deep subsoiling with a deep-ripper after refilling the original excavations.
Reclaimed surface mined soil can have lower soil fertility and organic matter contents, soil
compaction problems, massive soil structure, inadequate rooting depths, low water holding
capacities, and low soil pH values (Bell et al., 1994; Guebert and Gardner, 2001; Akala and Lal,
2001; Steinhardt et al., 1987; McSweeney and Jansen, 1984). As a result, reclaimed sites often have
a lower soil quality for growing crops than the soil before mining.
Soil quality is simply defined as "the capacity of a specific kind of soil to function" (Karlen et
al., 1997). In other words, where land use practices diminish, the capacity of the soil to function and
soil quality is diminished. Soil function refers to what the soil does such as maintaining
productivity, regulating and partitioning water and solute flow, filtering and buffering against
pollutants, and storing and cycling nutrients. In a broader sense, soil quality can be used as an
indicator of sustainability (Doran et al., 1996). Evaluating soil quality involves measuring soil
properties that serve as sensitive indicators of change in soil functions (Karlen et al., 1997). There is
no single measurement that will always be useful for evaluating soil quality. Therefore, a minimum
data set (MDS) of soil properties or indicators has been proposed as a means to infer the soil's ability
to perform basic functions. Many of the soil properties found in these MDSs are those that can limit
productivity on reclaimed surface mine soils (Bendfeldt et al., 2001).
When assessing soil quality using a MDS, the indicators can be integrated into an index of
overall soil quality (Andrews and Carroll, 2001). Karlen et al. (2003) describes three steps that are
involved in developing a soil quality index. The first is selecting appropriate soil quality indicators
too efficiently and effectively monitor critical soil functions as determined by specific management
goals, such as productivity in this paper. Collectively, the indicators reflect how well critical soil
functions associated with each management goal are being performed. Each indicator is scored,
7/17/2019 Seybold NE
http://slidepdf.com/reader/full/seybold-ne 3/20
1646
often using ranges established by the soil=s inherent capacity or from a reference condition. This
step allows for the comparison of the different indicator measurements that have totally different
measurement units. The unitless values are then combined into an overall index of soil quality.
Surface layer properties are the most sensitive to changes in land use and management. Therefore,
soil quality evaluation is focused at, but is not limited to the near soil surface. However, surface
mining disturbs the whole soil, and thus, soil quality should be evaluated to include subsoils as well.
The objective of this study was to evaluate soil quality on eight soils reclaimed to agricultural
land in Indiana. Specifically, a soil quality index was used to evaluate soil quality of the soil profile.
The pre-mining soil condition was used as the reference or standard in the development of the
index. Also, soil quality of the near surface will be evaluated using selected soil quality indicators.
Discussions will include comparisons of relative soil quality among the eight reclaimed soils and
how they compare to agricultural soils in the area before mining.
Materials and Methods
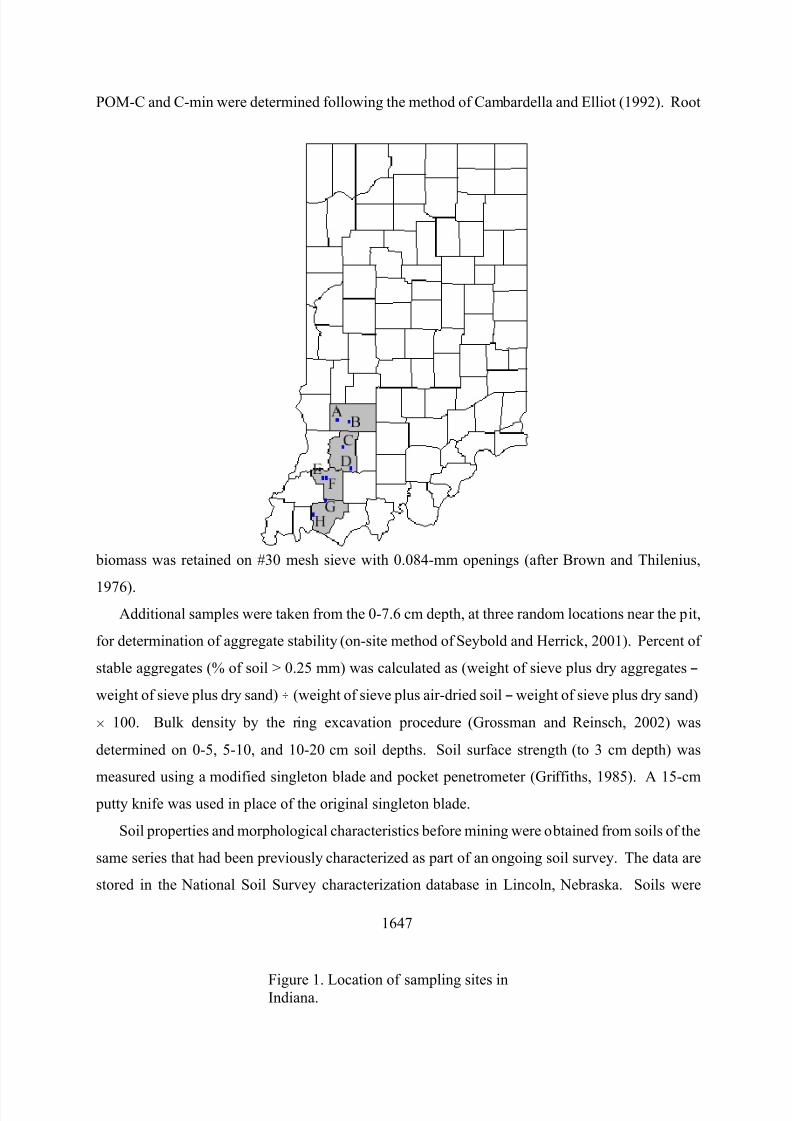
A total of eight reclaimed surface-mine soil sites located in Daviess, Greene, Pike, and Warrick
counties in Indiana were studied (Fig. 1). The classification of the soils before mining and years
since being reclaimed to agricultural land at each site are listed in Table 1. Sites B, C, D, E, G, and
H were in cropland with some combination of a corn-wheat-soybean or corn-wheat-double crop
soybean rotation. Site A was in idle cropland (not cropped because of poor productivity) and site F
was in grass hay. At each site a pit was opened and the soil profile described. Soil depth, texture,
rock fragment content, structure, rupture resistance, color, and root size and density were described
for each horizon using standard soil description techniques (Schoeneberger et al., 2002). Soil
samples were collected from each horizon and sent to the National Soil Survey Laboratory in
Lincoln, Nebraska for analysis. Properties determined were particle size separates (pipette method),
bulk density (clod method), water content at 33 and 1500 kPa, cation-exchange capacity (CEC)
(buffered ammonium acetate), total C, and pH (1:1 soil:water). All methods are described in Soil
Survey Staff (1996). Particulate-organic-matter carbon (POM-C), organic matter associated with the
mineral fraction (C-min) and root biomass were determined on the 0-20 cm soil depth, respectively.
7/17/2019 Seybold NE
http://slidepdf.com/reader/full/seybold-ne 4/20
1647
POM-C and C-min were determined following the method of Cambardella and Elliot (1992). Root
biomass was retained on #30 mesh sieve with 0.084-mm openings (after Brown and Thilenius,
1976).
Additional samples were taken from the 0-7.6 cm depth, at three random locations near the pit,
for determination of aggregate stability (on-site method of Seybold and Herrick, 2001). Percent of
stable aggregates (% of soil > 0.25 mm) was calculated as (weight of sieve plus dry aggregates B
weight of sieve plus dry sand) ) (weight of sieve plus air-dried soil B weight of sieve plus dry sand)
H 100. Bulk density by the ring excavation procedure (Grossman and Reinsch, 2002) was
determined on 0-5, 5-10, and 10-20 cm soil depths. Soil surface strength (to 3 cm depth) was
measured using a modified singleton blade and pocket penetrometer (Griffiths, 1985). A 15-cm
putty knife was used in place of the original singleton blade.
Soil properties and morphological characteristics before mining were obtained from soils of the
same series that had been previously characterized as part of an ongoing soil survey. The data are
stored in the National Soil Survey characterization database in Lincoln, Nebraska. Soils were
Figure 1. Location of sampling sites inIndiana.

7/17/2019 Seybold NE
http://slidepdf.com/reader/full/seybold-ne 5/20
1648
selected that had the closest location to the sites in this study and that were cultivated.
Table 1. The soil classification before mining and years reclaimed to agriculture for eight sites in
Indiana.
Pre-mining Pre-mining Years
Site County soil series classification reclaimed
A Greene Vigo Fine-silty, mixed, superactive, mesic Aeric Glossaqualfs 16
B Greene Shakamak Fine-silty, mixed, active, mesic Aquic Fragiudalfs 17
C Daviess Alford Fine-silty, mixed, superactive, mesic Ultic Hapludalfs 14
D Daviess Hosmer Fine-silty, mixed, active, mesic Oxyaquic Fragiudalfs 6
E Pike Hosmer Fine-silty, mixed, active, mesic Oxyaquic Fragiudalfs 12
F Pike Pike Fine-silty, mixed, superactive, mesic Ultic Hapludalfs 10
G Warrick Hosmer Fine-silty, mixed, active, mesic Oxyaquic Fragiudalfs 15
H Warrick Hosmer Fine-silty, mixed, active, mesic Oxyaquic Fragiudalfs 13
These soil conditions before mining were used as the standard or reference condition for the
reclaimed soils in the calculation of a soil quality index. In addition, properties of an uncultivated
(natural) site of the Alford series were also obtained from the National Soil Survey characterization
database. This natural uncultivated condition was used to demonstrate soil quality differences
between cultivated and noncultivated conditions within the same series.
The near-surface morphological index of Grossman et al. (2001) was modified to provide a
morphological index for the whole soil. The modification was extending the depth of observation
from 30 cm to a deeper depth in the soil profile. In summary, the index combines information about
soil texture, structure, and moist rupture resistance. The index requires a determination of a
texture-weighting class, structure class, and rupture-resistance class for each horizon (Grossman etal., 2001). The texture-weighting class is based on the percentage of clay. The structure class is
determined by type, grade, and size of structural units in combination that are judged to function
similarly. These features are described in the Soil Survey Manual (Soil Survey Division Staff,
1993). The combinations of grade, type, and size of the structural units are grouped into five classes
7/17/2019 Seybold NE
http://slidepdf.com/reader/full/seybold-ne 6/20
1649
based on a judgement for separating levels of soil permeability and resistance to root growth
(Grossman et al., 2001). The structure class and rupture-resistance classes are then integrated into
an index class of structure-rupture resistance (SRI) for each horizon or zone based on a set of rules
(Grossman et al., 2001). The SRI score for each horizon is multiplied by the horizon thickness in
cm. The horizon SRI scores are summed and divided by the profile thickness (cm) to get an overall
index of morphology for the soil. The index score is then put on a 0-100 scale by subtracting one
from the profile index score, dividing by 4, and multiplying by 100. A profile morphological index
was determined for each reclaimed site and reference soil pair.
A soil quality index was calculated for each site from a MDS consisting of organic C content
(OC), CEC, pH, available water capacity (AWC), bulk density (Db), and the morphology index
(structure and rupture resistance) of the soil.
SQ index = f(OC, CEC, pH, AWC, Db, morphology) (1)
The soil quality index model is based on the additive index of Doran and Parkin (1994) and use
of scoring functions described in Karlen et al. (1994) and Andrews and Carol (2001). Each property
of the reclaimed soil is compared to a standard, and placed on a standardized scale from 0 to 1 using
linear scoring functions. The standard or reference condition is the cultivated soil condition before
mining and equates to a score of one. Any score between 0 and 1 is functioning less than the
standard or soil condition before mining. The scores for OC, CEC, pH, AWC, and the morphology
index were based on a Amore is better @ scoring function. The bulk density scores were based on a
Aless is better @ scoring function because of the inhibitory effect that high bulk densities have on root
growth and development. The scores are added together and divided by the number of indicators,
and multiplied by 100. Dividing by the number of indicators corrects for any missing data. The
index range is from 0 to 100. All properties are given equal weight in the index except bulk density,
which is given twice the weight (because of its inhibitory effects on root growth and development).

7/17/2019 Seybold NE
http://slidepdf.com/reader/full/seybold-ne 7/20
1650
Results and Discussion
Near-surface Properties
The near-surface properties are presented in Table 2. The highest bulk densities of the near
surface were found in the 10-20 cm soil depth, which ranged from 1.42 to 1.62 Mg m-3
. Bulk
density values at the higher end of this range ($1.60 Mg m-3
) may affect root growth and
development (Pierce et al., 1983; Grossman et al., 1992). Higher bulk densities at the 10-20 cm soil
depth are common in a cultivated or plowed soil with loamy textures, but are not desirable.
Compaction from tillage equipment is the most likely cause. Surface soil strength measurements
ranged from 20 to 130 N. These soil strength measurements (using the Singleton method) indicate
the degree of packing of the soil particles. The values do not indicate any physical limitation for
root growth and development (Griffiths, 1985).
Table 2. Near-surface soil properties of eight reclaimed soils after surface coal mining in
Indiana. Bulk density of the 10-20 cm soil depth; soil strength and aggregates stability were
measured to 5 cm and POM-C, C-min, root biomass, and root C/N ratios were measured to 20
cm.
Soil Aggregate Root Roots
Site Bulk density Strength stability POM-C C-min biomass C/N
Mg m-3 N % 2-0.25 mm g m-2 g m-2 kg ha-1
A 1.42 60 45 (4.5)H 380 3080 8290 16
B 1.56 130 28 (2.6) 350 3020 4830 18
C 1.61 50 23 (5.6) 330 3500 9950 17
D 1.43 50 32 (2.8) 330 3140 1500 24
E 1.53 20 25 (7.1) 240 2620 8430 17
F 1.62 110 56 (2.5) 230 2440 6170 16
G 1.56 120 33 (6.4) 400 4500 7320 21
H 1.45 30 55 (0.8) 170 3510 4420 15
H Number in parentheses is the standard error.

7/17/2019 Seybold NE
http://slidepdf.com/reader/full/seybold-ne 8/20
1651
Soil aggregates and their stability have a strong influence on physical properties such as
infiltration (hydraulic characteristics), aeration, soil strength, erosion, and the soil's ability to
transmit liquids, solutes, gases, and heat (Topp et al., 1996). Aggregation is a product of interactions
of the soil microbial community, mineral and organic components, the composition of the
above-ground plant community, and what has happened to the ecosystem in the past (Kemper and
Koch, 1966; Tisdall and Oades, 1982; Goldberg et al., 1988). In general, the greater the percentage
of stable aggregates, the less erodible the soil will be. Percent of stable aggregates ranged from 23
to 56% (2-0.25 mm in size). A similar aggregate stability range of 27 to 56% (using the same
method) has been shown for cultivated silt loam surface horizons (Seybold et al., 2002 and 2003).
Aggregate stability can be improved through long-term no-till or conservation tillage practices
(Paustain et al., 1997).
Particulate-organic-matter carbon (POM-C) ranged from 170 to 400 g m-2
in the 0-20 cm soil
depth (Table 2). The POM-C is the amount of organic C found in the particle-size fraction between
0.53 and 2 mm in diameter. It is considered to measure the larger physical fraction of soil organic
matter. This larger physical fraction reflects change in the organic matter pool occurring in one to a
few years (Franks et al., 2001). The POM-C fraction can be an indicator of the soil organic matter
fraction that can move into the active C pool (C. Franks, personal communication, 2003). The active
C pool contributes to nutrient cycling and productivity. Cambardella and Elliott (1992) reported
POM-C contents in a loam soil under four tillage treatments (bare fallow, stubble mulch, no-till, and
native sod) to range from 560 to 1670 g m-2
. Bare fallow had the lowest contents and native sod had
the largest POM-C contents. The POM-C values of the eight sites in the present study are lower
than that obtained under any of the tillage treatments in Cambardella and Elliott (1992). Tillage and
soil disturbances such as soil removal by surface coal mining can deplete the POM-C fraction.
The amount of organic matter associated with the mineral fraction (C-min), that < 53 Fm in
diameter, ranged from 2440 to 4500 g m-2
. The C-min fraction of the eight sites was greater than that
obtained by Cambardella and Elliott (1992). This enrichment may have resulted from
decomposition of the POM-C that was in the soil before coal mining, and subsequent movement into
the mineral associated fraction. The POM-C fraction could be improved through the use of no-till or
conservation tillage practices and use of high residue crops such as corn.
7/17/2019 Seybold NE
http://slidepdf.com/reader/full/seybold-ne 9/20
1652
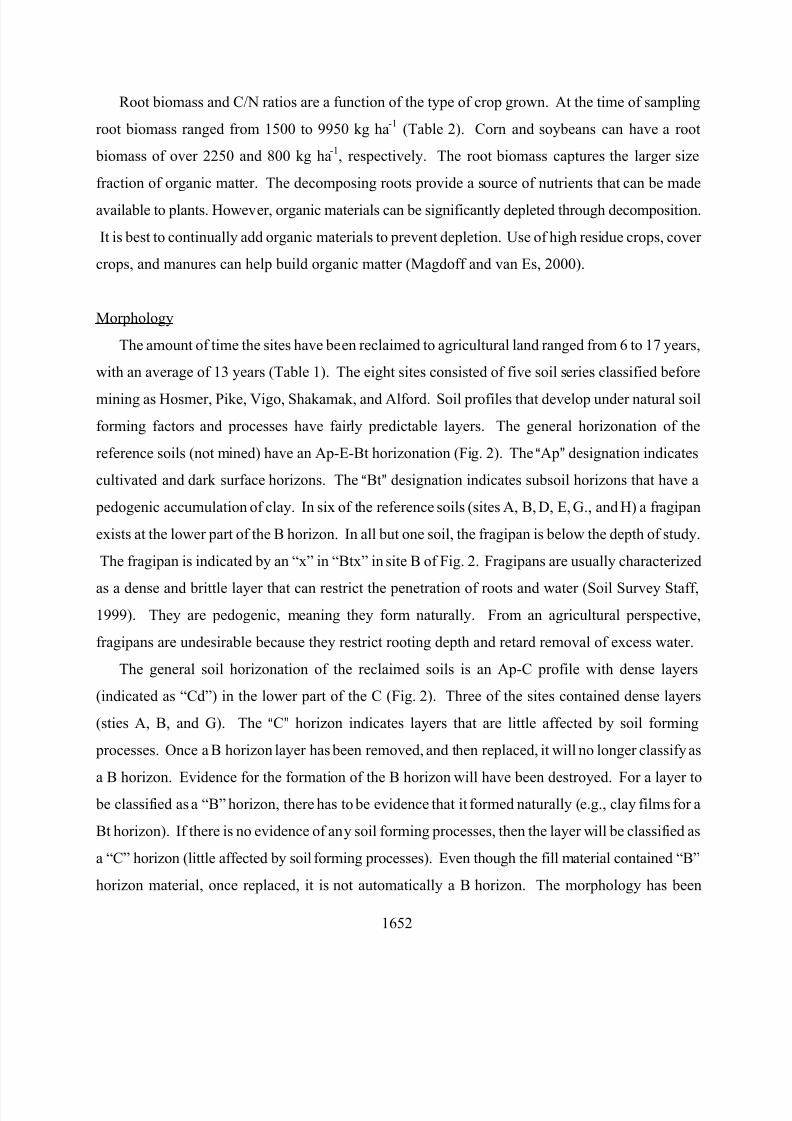
Root biomass and C/N ratios are a function of the type of crop grown. At the time of sampling
root biomass ranged from 1500 to 9950 kg ha-1
(Table 2). Corn and soybeans can have a root
biomass of over 2250 and 800 kg ha-1
, respectively. The root biomass captures the larger size
fraction of organic matter. The decomposing roots provide a source of nutrients that can be made
available to plants. However, organic materials can be significantly depleted through decomposition.
It is best to continually add organic materials to prevent depletion. Use of high residue crops, cover
crops, and manures can help build organic matter (Magdoff and van Es, 2000).
Morphology
The amount of time the sites have been reclaimed to agricultural land ranged from 6 to 17 years,
with an average of 13 years (Table 1). The eight sites consisted of five soil series classified before
mining as Hosmer, Pike, Vigo, Shakamak, and Alford. Soil profiles that develop under natural soil
forming factors and processes have fairly predictable layers. The general horizonation of the
reference soils (not mined) have an Ap-E-Bt horizonation (Fig. 2). The AAp@ designation indicates
cultivated and dark surface horizons. The ABt@ designation indicates subsoil horizons that have a
pedogenic accumulation of clay. In six of the reference soils (sites A, B, D, E, G., and H) a fragipan
exists at the lower part of the B horizon. In all but one soil, the fragipan is below the depth of study.
The fragipan is indicated by an “x” in “Btx” in site B of Fig. 2. Fragipans are usually characterized
as a dense and brittle layer that can restrict the penetration of roots and water (Soil Survey Staff,
1999). They are pedogenic, meaning they form naturally. From an agricultural perspective,
fragipans are undesirable because they restrict rooting depth and retard removal of excess water.
The general soil horizonation of the reclaimed soils is an Ap-C profile with dense layers
(indicated as “Cd”) in the lower part of the C (Fig. 2). Three of the sites contained dense layers
(sties A, B, and G). The AC@ horizon indicates layers that are little affected by soil forming
processes. Once a B horizon layer has been removed, and then replaced, it will no longer classify as
a B horizon. Evidence for the formation of the B horizon will have been destroyed. For a layer to
be classified as a “B” horizon, there has to be evidence that it formed naturally (e.g., clay films for a
Bt horizon). If there is no evidence of any soil forming processes, then the layer will be classified as
a “C” horizon (little affected by soil forming processes). Even though the fill material contained “B”
horizon material, once replaced, it is not automatically a B horizon. The morphology has been

7/17/2019 Seybold NE
http://slidepdf.com/reader/full/seybold-ne 10/20
1653
altered. Soil forming processes must begin to work on the newly deposited material and reform the
B horizon.

7/17/2019 Seybold NE
http://slidepdf.com/reader/full/seybold-ne 11/20
1654
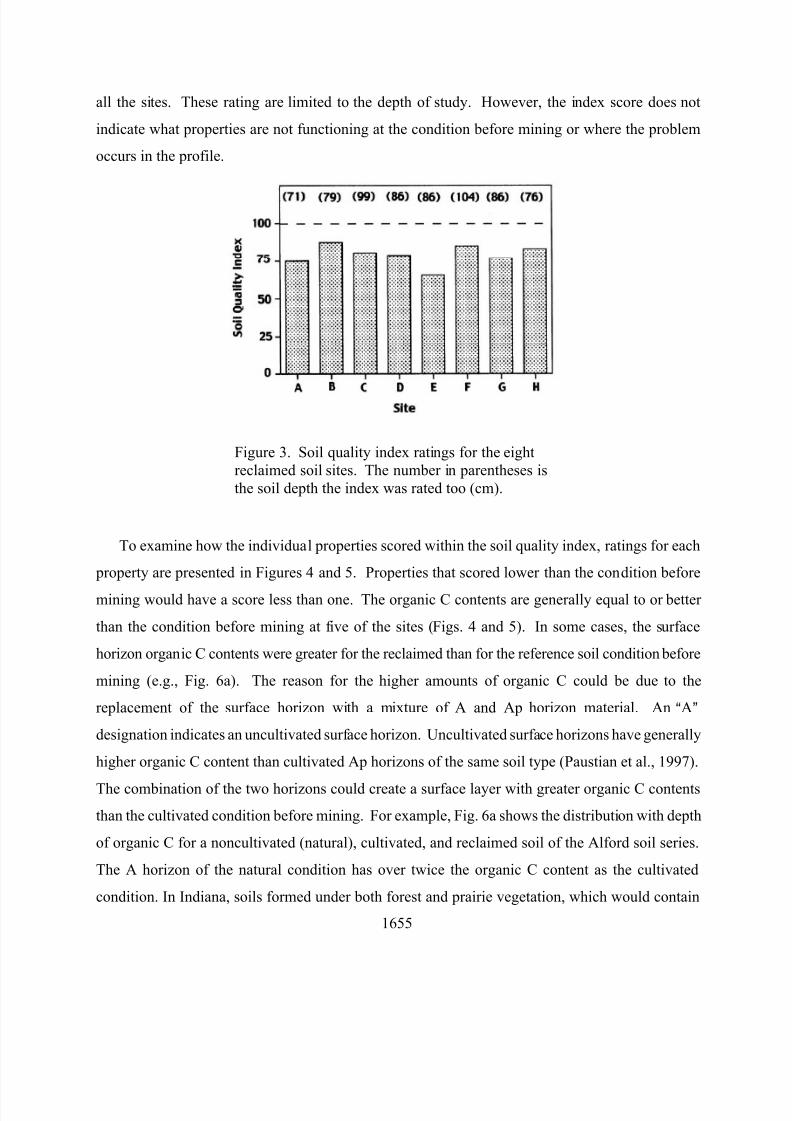
Soil Quality Index
The soil quality index for each site is presented in Fig. 3. An index score of 100 indicates the
soil has the same general quality as the soil condition before mining. The scores range from 68 to 87
with an average score of 82, indicating that soil quality is lower than the condition before mining at
Figure 2. Soil profiles of the eight reclaimed soils (right profile)
compare to their respective pre-mining reference condition (left
profile). Soil depths are in cm.
7/17/2019 Seybold NE
http://slidepdf.com/reader/full/seybold-ne 12/20
1655
all the sites. These rating are limited to the depth of study. However, the index score does not
indicate what properties are not functioning at the condition before mining or where the problem
occurs in the profile.
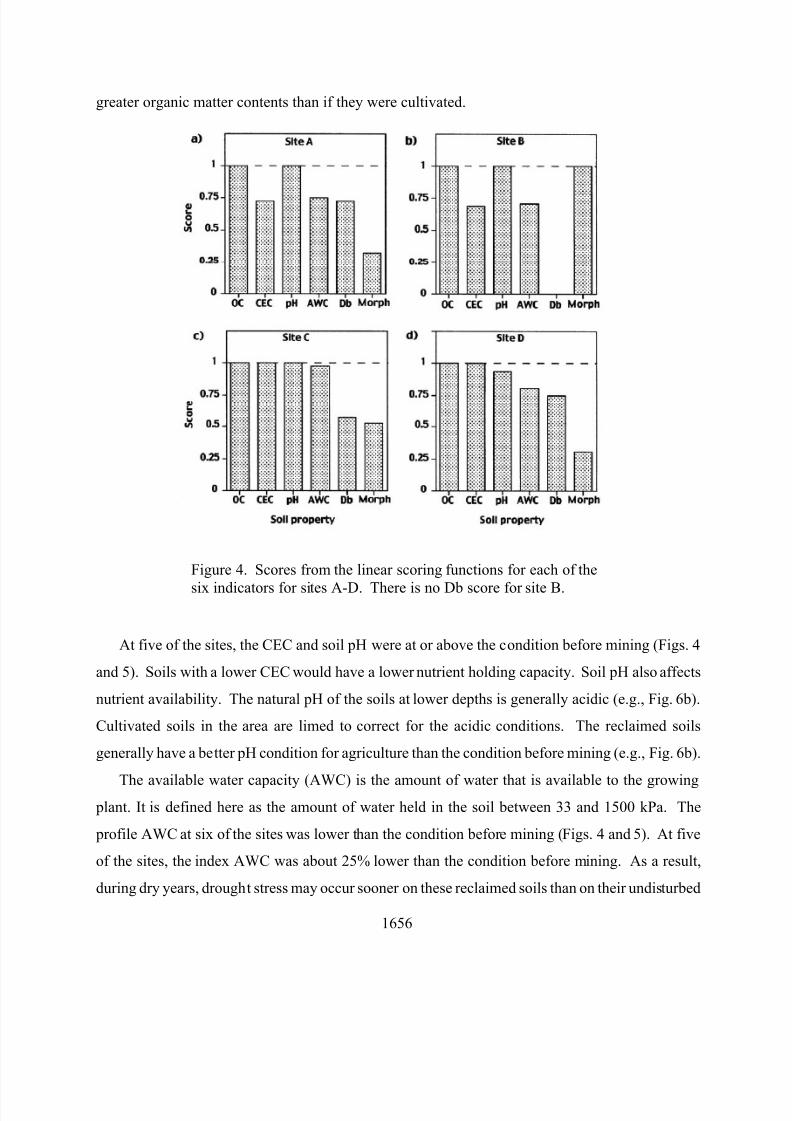
To examine how the individual properties scored within the soil quality index, ratings for each
property are presented in Figures 4 and 5. Properties that scored lower than the condition before
mining would have a score less than one. The organic C contents are generally equal to or better
than the condition before mining at five of the sites (Figs. 4 and 5). In some cases, the surface
horizon organic C contents were greater for the reclaimed than for the reference soil condition before
mining (e.g., Fig. 6a). The reason for the higher amounts of organic C could be due to the
replacement of the surface horizon with a mixture of A and Ap horizon material. An AA@
designation indicates an uncultivated surface horizon. Uncultivated surface horizons have generally
higher organic C content than cultivated Ap horizons of the same soil type (Paustian et al., 1997).
The combination of the two horizons could create a surface layer with greater organic C contents
than the cultivated condition before mining. For example, Fig. 6a shows the distribution with depth
of organic C for a noncultivated (natural), cultivated, and reclaimed soil of the Alford soil series.
The A horizon of the natural condition has over twice the organic C content as the cultivated
condition. In Indiana, soils formed under both forest and prairie vegetation, which would contain
Figure 3. Soil quality index ratings for the eight
reclaimed soil sites. The number in parentheses is
the soil depth the index was rated too (cm).
7/17/2019 Seybold NE
http://slidepdf.com/reader/full/seybold-ne 13/20
1656
greater organic matter contents than if they were cultivated.
At five of the sites, the CEC and soil pH were at or above the condition before mining (Figs. 4
and 5). Soils with a lower CEC would have a lower nutrient holding capacity. Soil pH also affects
nutrient availability. The natural pH of the soils at lower depths is generally acidic (e.g., Fig. 6b).
Cultivated soils in the area are limed to correct for the acidic conditions. The reclaimed soils
generally have a better pH condition for agriculture than the condition before mining (e.g., Fig. 6b).
The available water capacity (AWC) is the amount of water that is available to the growing plant. It is defined here as the amount of water held in the soil between 33 and 1500 kPa. The
profile AWC at six of the sites was lower than the condition before mining (Figs. 4 and 5). At five
of the sites, the index AWC was about 25% lower than the condition before mining. As a result,
during dry years, drought stress may occur sooner on these reclaimed soils than on their undisturbed
Figure 4. Scores from the linear scoring functions for each of the
six indicators for sites A-D. There is no Db score for site B.

7/17/2019 Seybold NE
http://slidepdf.com/reader/full/seybold-ne 14/20
1657
counterparts (Felton, 1992). The reduction in the AWC tends to increase with depth (e.g., Fig. 6c).
This is probably due to the increase in bulk density and lack of structure at lower depths. It has been
shown that crops growing on compacted soils cannot take up enough water to survive and flourish
during periods of even moderate drought stress (Jansen, 1987). In general, reclaimed soils show
considerably more variability in yields, obtaining near normal yields with good rainfall but more
drastic yield reductions if water content is deficient (Steinhardt et al., 1987).
The profile bulk density at six of the sites was greater than the density before mining (Figs. 4 and
5). Only at one site was the profile bulk density at the same density as the soil condition before
mining took place. The remaining site (Fig. 4b) did not have a bulk density before mining available
for comparison. There was generally a 25% or more increase in the bulk density of the soil profile.
The bulk densities tended to increase with depth (e.g., Fig. 6d). Similar bulk density values in
Figure 5. Scores from linear scoring functions for each of the
six indicators for sites E-H.
7/17/2019 Seybold NE
http://slidepdf.com/reader/full/seybold-ne 15/20
1658
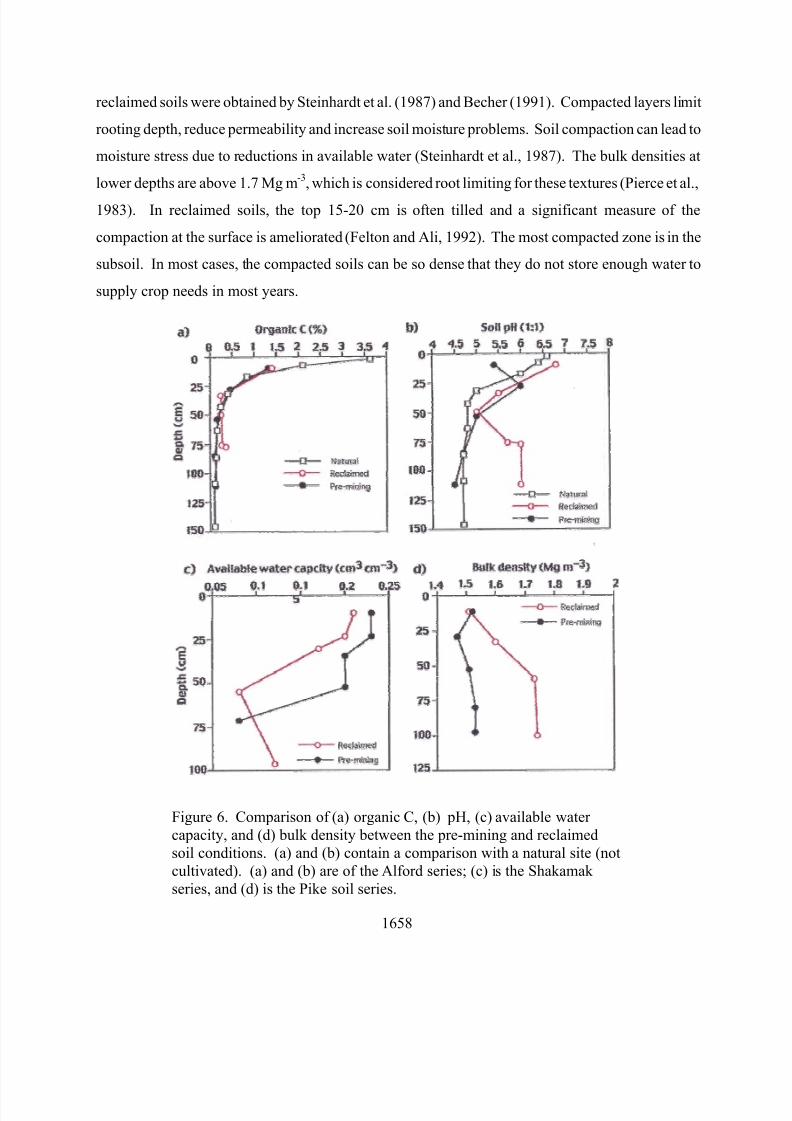
reclaimed soils were obtained by Steinhardt et al. (1987) and Becher (1991). Compacted layers limit
rooting depth, reduce permeability and increase soil moisture problems. Soil compaction can lead to
moisture stress due to reductions in available water (Steinhardt et al., 1987). The bulk densities at
lower depths are above 1.7 Mg m-3
, which is considered root limiting for these textures (Pierce et al.,
1983). In reclaimed soils, the top 15-20 cm is often tilled and a significant measure of the
compaction at the surface is ameliorated (Felton and Ali, 1992). The most compacted zone is in the
subsoil. In most cases, the compacted soils can be so dense that they do not store enough water to
supply crop needs in most years.
Figure 6. Comparison of (a) organic C, (b) pH, (c) available water
capacity, and (d) bulk density between the pre-mining and reclaimed
soil conditions. (a) and (b) contain a comparison with a natural site (not
cultivated). (a) and (b) are of the Alford series; (c) is the Shakamak
series, and (d) is the Pike soil series.
7/17/2019 Seybold NE
http://slidepdf.com/reader/full/seybold-ne 16/20
1659
The profile soil-quality-morphology index provides a general quality placement relative to the
soil condition before mining. Generally, higher placements indicate a better optimal physical
condition for root growth and development, and for free movement of water and air. Seven of the
sites had a lower morphology index score than the soil condition before mining (Figs. 4 and 5). Of
the seven sites, six had a score between 0.17 and 0.5. The low scores indicate poor structure
development in the reclaimed soils compared to the condition before mining. In other words,
structure is less developed in the reclaimed soils. Reclaimed soils of the Hosmer soil series had
about a 50% or more reduction in the morphology index score (Figs. 4d, 5a, 5c, and 5d). The
combination of high bulk densities, poor structure, and moderately-fine texture of reclaimed subsoils
can result in compacted and poorly aerated soil (Felton and Ali, 1992). Natural soil forming
processes cause structure, pores and rooting zones to develop. Mining and reclamation activities
disrupt the soil structure or physical condition of the subsoil. After subsoil replacement, the soil
forming processes, pores and channels due to plant root and microbial action begin to redevelop.
However, this can be a very slow process.
Summary and Conclusions
The near-surface properties of bulk density, soil strength, aggregate stability and POM-C are
within limits observed for cultivated surface horizons. However, in general, cultivated surface
horizons generally have poor soil quality compared to their natural or no till managed counterparts.
In general, management controls the near surface properties. Therefore, through best management
practices (e.g., no-till and use of high residue crops) the near-surface properties can be improved.
The morphology of the reclaimed soils lacked pedogenic B horizons. The general horizonation of
the reclaimed soils was an Ap-C horizonation. The profile soil quality was lower on all eight
reclaimed sites compared to their respective reference condition before mining. The index scores
ranged from 68 to 87 on a scale from 0 to 100. These ratings are limited to the depth of study. The
properties that were a major factor in lowering the soil quality of the reclaimed soils was poor or
massive soil structure, lower available water capacity, and increased bulk density of the subsoils.
Organic C, CEC, and soil pH on most sites were generally comparable to the condition before
mining. There were a couple of sites that had significantly lower scores, especially for the organic C

7/17/2019 Seybold NE
http://slidepdf.com/reader/full/seybold-ne 17/20
1660
content. The poor structure, higher bulk densities, and lower AWC of the reclaimed soils could
result in water stress and/or lower productivity, especially under doughty conditions.
Literature Cited
Akala, V.A. and R. Lal. 2001. Soil organic carbon pools and sequestration rates in reclaimed
Minesoils in Ohio. J. Environ. Qual. 30:2098-2104.
Andrews, S.S., and C.R. Carroll. 2001. Designing a soil quality assessment tool for sustainable
agroecosystem management. Ecological Applications 11:1573-1585.
Becher, H.H. 1991. Soil structure on poorly-reclaimed disturbed sites in Bavaria. Soil Technol.
4:363-371.
Bell, J.C., R.L. Cunningham, and C.T. Anthony. 1994. Morphological characteristics of
reconstructed prime farmland soils in western Pennsylvania. J. Envron. Qual. 23:515-520.
Bendfeldt, E.S., J.A. Burger, and W.L. Daniels. 2001. Quality of amended mine soils after sixteen
years. Soil Sci. Soc. Am. J. 65:1736-1744.
Brown, G.R. and J.F. Thilenius. 1976. A low-cost machine for separation of roots from soil material.
J. Range Management 29:506-508.
Cambardella, C.A. and E.T. Elliott. 1992. Particulate soil organic-matter changes across a grassland
cultivation sequence. Soil Sci. Soc. Am. J. 56:777-783.
Doran, J.W. and T.B. Parkin. 1994. Defining and assessing soil quality. p. 3-21. In: J.W. Doran,
D.C. Coleman, D.F. Bezdicek, and B.A. Stewart (eds.), Defining Soil Quality for a Sustainable
Environment. SSSA Spec. Pub. No. 35. ASA, CSSA, and SSSA, Madison, WI.
Doran, J.W., M. Sarrantonio, and M.A. Liebig. 1996. Soil health and sustainability. p. 1-54. In: D.L.
Sparks (ed.) Advances in Agronomy, Vol. 56. Academic Press, San Diego, CA.
Felton, G.K. 1992. Soil hydraulic properties of reclaimed prime farmland. Transactions of the ASAE
35:871-877.
Felton, G.K. and M. Ali. 1992. Hydraulic parameter response to incorporated organic matter in the
B-horizon. Transaction of the ASAE 35:1153-1160.
Franks, C.D., J.M. Kimble, S.E. Samson-Liebig, and T.M. Sobecki. 2001. Organic carbon methods,
microbial biomass, root biomass, and sampling design under development by NRCS. p. 105-113.
7/17/2019 Seybold NE
http://slidepdf.com/reader/full/seybold-ne 18/20
1661
In: R. Lal, J.M. Kimble, R.F. Follett, and B.A. Stewart (eds.) Assessment methods for soil
carbon. Advances in Soil Science. CRC Press, Boca Raton, FL.
Goldberg, S., D.L. Suarez, and R.A. Glaubig. 1988. Factors affecting clay dispersion and aggregate
stability of arid-zone soils. Soil Sci. 146:317-325.
Griffiths, E. 1985. Interpretation of soil morphology for assessing moisture movement and storage.
N.Z. Soil Bureau Scientific Report 74. Department of Scientific and Industrial Research, Lower
Hutt, New Zealand.
Grossman, R.B., E.C. Benham, D.S. Harms, and H.R. Sinclair. 1992. Physical root restriction
prediction in a mine spoil reclamation protocol. p. 191-196. In: Dunker, R.E., R.I. Barnhisel,
R.G. Darmondy (eds.) Proceedings of the 1992 national symposium on prime farmland
reclamation. Dept. of Agronomy, Univ. of Illinois, Urbana, IL.
Grossman, R.B., D.S. Harms, C.A. Seybold, and M.T. Sucik. 2001. A morphological index for soil
quality evaluation of near-surface mineral horizons. p.637-640. In: D.E. Stott, R..H. Mohtar and
G.C. Steinhardt (eds.) Sustaining the Global Farm. Selected papers from the 10th International
Soil Conservation Organization Meeting held May 24-29, 1999 at Purdue University and the
USDA-ARS National Soil Erosion Research Laboratory. Purdue University, West Lafayette,
Indiana.
Grossman, R.B. and T.G. Reinsch. 2002. The solid phase: bulk density and linear extensibility. p.
201-227. In: J.H. Dane and G.C. Topp (eds.) Methods of soil analysisBPart 4: Physcial methods.
SSSA Book Series, No. 5. Soil Sci. Soc. of Am., Madison, WI, USA.
Guebert, M.D. and T.W. Gardner. 2001. Macropore flow on a reclaimed surface mine: infiltration
and hillslope hydrology. Geomorphology 39:151-169.
Indiana Geological Survey. 2003. CMIS IMS - The Indiana Coal Mine Information System's
Internet Map Server Web Page [Online]. Available at
http://igs.indiana.edu/geology/maps/coal/cmis/index.cfm (verified Feb. 9, 2004).
Jansen, I.J. 1987. Excellent agricultural soils after surface mining. ASAE Paper NO. 87-51. St.
Joseph, MI: ASAE.
Karlen, D.L., C.A. Ditzler, and S.S. Andrews. 2003. Soil quality: why and how? Geoderma 114:145-
156.
Karlen, D.L., M.J. Mausbach, J.W. Doran, R.G. Cline, R.F. Harris, and G.E. Schuman. 1997. Soil
7/17/2019 Seybold NE
http://slidepdf.com/reader/full/seybold-ne 19/20
1662
quality: A concept, definition, and framework for evaluation. Soil Sci. Soc. Am. J. 61:4-10.
Karlen, D.L., N.C. Wollenhaupt, D.C. Erbach, E.C. Berry, J.B. Swan, N.S. Eash, and J.L. Jordahl.
1994. Crop residue effects on soil quality following 10-years of no-till corn. Soil & Tillage Res.
31:149-167.
Kemper, W.D. and E.J. Koch. 1966. Aggregate stability of soils from western United States and
Canada. USDA-ARS Tech. Bull. 1355. U.S. Gov. Print. Office, Washington, DC.
Magdoff, F. and H. van Es. 2000. Building soils for better crops. 2nd
ed. Sustainable Agriculture
Network handbook series, bk. 4. Office of Sustainable Agriculture Programs, Washington, DC.
McSweeney, K. and I.J. Jansen. 1984. Soil structure and associated rooting behavior in minesoils.
Soil Sci. Soc. Am. J. 48:607-612.
Paustain, K., H.P. Collins, and E.A. Paul. 1997. Management controls on soil carbon. p. 15-49. In:
E.A. Paul, E.T. Elliott, K. Paustain, C.V. Cole (eds.) Soil organic matter in temperate
agroecosystems: Long-term experiments in North America. CRC Press, Boca Raton, FL.
Pierce, F.J., W.E. Larson, R.H. Dowdy, and W.A.P. Graham. 1983. Productivity of soils: assessing
long-term changes due to erosion. J. Soil Water Cons. 38:39-44.
Schoeneberger, P.J., D.A. Wysocki, E.C. Benham, and W.D. Broderson (editors). 2002. Field book
for describing and sampling soils, Verson 2.0. Natural Resources Conservation Service, National
Soil Survey Center, Lincoln, NE.
Seybold, C.A. and J.E. Herrick. 2001. Aggregate stability kit for soil quality assessments. Catena
44:37-45.
Seybold, C.A., R.B. Grossman, F.J. Pierce. 2003. On-site assessment of use-dependant properties in
Michigan. Comm. Soil Sci. Plant Anal. 34(5/6):765-780.
Seybold, C.A., D. McGrath, and R.P. Dick. 2002. On-Farm Early Indicators of Cover Crop Effects
on Soil Quality. In: Transactions of the 17th
World Congress of Soil Science, Soil Science:
Confronting new reatlities in the 21st Century. August 14-21, 2002. WCSS, Bangkok, Thailand.
Soil Survey Division Staff. 1993. Soil survey manual. 2nd ed. U.S. Dept. Agric. Handb. 18. U.S.
Gov. Print. Office, Washington, DC.
Soil Survey Staff. 1996. Soil survey laboratory information manual. Soil Survey Investigations
report No. 45. Version 1.0. USDA, Natural Resources Conservation Service, National Soil
Survey Center, Lincoln, NE.

7/17/2019 Seybold NE
http://slidepdf.com/reader/full/seybold-ne 20/20
1663
Steinhardt, G.C., W.C. Moldenhauer, and D.P. Franzmeier. 1987. The effects of bulk density on
available moisture in selected surface mine soil materials. Indiana Academy of Sci. 96:497-502.
Thompson, P.J., I.J. Jansen and C.L. Hooks. 1987. Penetrometer resistance and bulk density as
parameter for predicting root system performance in mine soil. Soil Sci. Soc. Am. J. 51:1288-
1293.
Tisdall, J.M. and J.M. Oades. 1982. Organic matter and water-stable aggregates in soils. J. Soil Sci.
33:141-163.
Topp, G.C., W.D. Reynolds, F.J. Cook, J.M. Kirby and M.R. Carter. 1996. Physical attributes of soil
quality. p.21-58. In: E.G. Gregorich and M.R. Carter (eds.) Soil quality for crop production and
ecosystem health. Elsevier, Amsterdam.


