Sewer Overflows and the Vector Mosquito Proximity to Human West N
159
Walden University ScholarWorks Walden Dissertations and Doctoral Studies 2015 Sewer Overflows and the Vector Mosquito Proximity to Human West Nile Virus Infections Andrea Simone Bowers Walden University Follow this and additional works at: hp://scholarworks.waldenu.edu/dissertations Part of the Entomology Commons , Epidemiology Commons , and the Public Health Education and Promotion Commons is Dissertation is brought to you for free and open access by ScholarWorks. It has been accepted for inclusion in Walden Dissertations and Doctoral Studies by an authorized administrator of ScholarWorks. For more information, please contact [email protected].
-
Upload
simone-bowers -
Category
Documents
-
view
167 -
download
0
Transcript of Sewer Overflows and the Vector Mosquito Proximity to Human West N

Walden UniversityScholarWorks
Walden Dissertations and Doctoral Studies
2015
Sewer Overflows and the Vector MosquitoProximity to Human West Nile Virus InfectionsAndrea Simone BowersWalden University
Follow this and additional works at: http://scholarworks.waldenu.edu/dissertations
Part of the Entomology Commons, Epidemiology Commons, and the Public Health Educationand Promotion Commons
This Dissertation is brought to you for free and open access by ScholarWorks. It has been accepted for inclusion in Walden Dissertations and DoctoralStudies by an authorized administrator of ScholarWorks. For more information, please contact [email protected].

Walden University
College of Health Sciences
This is to certify that the doctoral dissertation by
Andrea Bowers
has been found to be complete and satisfactory in all respects,
and that any and all revisions required by
the review committee have been made.
Review Committee
Dr. Hadi Danawi, Committee Chairperson, Public Health Faculty
Dr. Aaron Mendelsohn, Committee Member, Public Health Faculty
Dr. Namgyal Kyulo, University Reviewer, Public Health Faculty
Chief Academic Officer
Eric Riedel, Ph.D.
Walden University
2015

Abstract
Sewer Overflows and the Vector Mosquito Proximity to Human West Nile Virus
Infections
by
Andrea Simone Bowers
MPH, Walden University, 2009
MBA, University of Phoenix, 2007
BS, Alabama Agricultural and Mechanical University, 1997
Dissertation Submitted in Partial Fulfillment
of the Requirements for the Degree of
Doctor of Philosophy
Public Health Epidemiology
Walden University
November 2015

Abstract
DeKalb and Fulton Counties, which share the metropolitan Atlanta area, have seen an
increase in West Nile infected vector mosquitoes; the increase is associated with close
proximity to combined sewer overflow facilities. Despite completion of the remediation
system in 2008, the mosquito population testing positive for West Nile virus has
increased each year from 2010 through 2012. Guided by the Geographical Information
System framework and using spatial analysis and regression analyses, this study
described and quantified the relationship between sewer system overflows and
amplification of vector mosquitoes; an additional goal was to investigate their proximity
to human cases of West Nile VIrus (WNV) infections. Comparing the prominence of all
WNV vectors revealed how different mosquito species occupy the area. The Culex
species was not detected in adult surveillance in 2012; however, the infection rate of
mosquito pools increased by 15% and the human infection more than doubled. The
influence of sewer system overflows became pronounced when this study analysis also
identified that a proportion of West Nile-virus–positive mosquito pools was significantly
higher in approximately 58% of trap sites within 1 km of sewer overflow events and 30%
over 1 km distance from sewer overflow events. Thus, the research contributes to shared
information both in support of previous findings and considering novel sources that
contribute to the proliferation of WNV. This research can help reduce the rate of WNV
infection and decrease the resources needed to protect the public.

Sewer Overflows and the Vector Mosquito Proximity to Human West Nile Virus
Infections
by
Andrea Simone Bowers
MPH, Walden University, 2009
MBA, University of Phoenix, 2007
BS, Alabama Agricultural and Mechanical University, 1997
Dissertation Submitted in Partial Fulfillment
of the Requirements for the Degree of
Doctor of Philosophy
Public Health Epidemiology
Walden University
November 2015

Dedication
I dedicate my dissertation work to my family and many friends. A special feeling
of gratitude to my loving parents, Jimmy Sr. and Melvenner Bowers whose words of
encouragement helped develop my push for tenacity. My sister Karen and brother Jimmy,
Jr. have always been supportive of my journey and are very special. I also dedicate this
dissertation to my close classmates, many friends and military family who have
supported me throughout the process. I will always appreciate all they have done,
especially my classmates Dr. John Abiodun Orisasona and Dr. Grisseel Cruz-Espaillat for
helping me push through the obstacles of writing. I am thankful for the initial opportunity
my First Army military leaders afforded me in the doctoral program; and 5th Medical
Brigade colleagues, Captain Latricia Spencer and Chief Teresa Kendall for their efforts
after military duty hours. I give special thanks to my great friend Chitauqua Brown for
giving me a peace of mind during my deployment by taking care of my cat Cotton. My
sincere gratitude to all friends that have been a listening ear throughout my entire
doctorate program. Many of you have been my best cheerleaders. I appreciate all along
the way and I thank you.
Acknowledgments
I would like to express my sincere gratitude to my committee chair Dr. Hadi
Danawi for the continuous support of my Ph.D., for his patience, motivation, and
immense knowledge. His guidance helped me in writing for this dissertation. I could not
have imagined having a better advisor and mentor for my Ph.D. study.
Besides my committee chair, I would like to thank Dr. Aaron B. Mendelsohn, my
methodology committee member and the rest of my review committee, for their
insightful comment and encouragement, but also for the hard comments which incented
me to widen my approach from various perspectives. I offer my sincere appreciation for
the learning opportunities provided by my committee.
My sincere thanks also goes to Dr. Rosmarie Kelly, who provided me an
opportunity to join her team as intern, and who gave access to learning the mosquito
identification and surveillance process. Without her precious support it would not be
possible to conduct this research. In addition, the compilation of my data could not have
been accomplished without the support of Dr. Randall Young, who had the patients to
introduce me to the world of geographical information systems. I offer my sincere thank
you to Dr. Young, and gratitude to those who directly or indirectly lent their hand in this
venture.

i
Table of Contents
List of Tables……………………………………………………………………………...v
List of Figures……………………………………………………………………...…….vii
Chapter 1: Introduction to the Study ....................................................................................1
Introduction ....................................................................................................................1
Background ....................................................................................................................2
Problem and Study Purpose ...........................................................................................5
Research Question and Hypotheses ...............................................................................7
Conceptual Framework for the Study ............................................................................8
Nature of the Study ......................................................................................................12
Definitions....................................................................................................................17
Assumptions...........................................................................................................18
Scope and Delimitations........................................................................................ 19
Limitations............................................................................................................. 21
Significance............................................................................................................22
Summary ......................................................................................................................23
Chapter 2: Literature Review .............................................................................................25
Introduction ..................................................................................................................25
Literature Search Strategy............................................................................................26
Conceptual Framework ................................................................................................27
Epidemiology of WNV in Georgia ..............................................................................28
Clinical Description............................................................................................... 29

ii
Virology................................................................................................................. 31
Transmission.......................................................................................................... 32
Habitats.................................................................................................................. 34
Incidence................................................................................................................ 35
Georgia WNV Adult Mosquito Surveillance ...............................................................43
Culex quinquefasciatus as Primary Vector of WNV in Georgia........................... 44
DeKalb County...................................................................................................... 46
Fulton County........................................................................................................ 48
City of Atlanta........................................................................................................49
Wastewater Management .............................................................................................50
DeKalb County Wastewater Management.............................................................52
Fulton County Wastewater Management...............................................................54
City of Atlanta Wastewater Management.............................................................. 56
Mosquito Density Association with Wastewater Systems Overflows...................61
Use of Wastewater Systems to Mitigate Mosquito-Transmitted Disease..............65
Summary ......................................................................................................................66
Chapter 3: Research Methods ............................................................................................67
Introduction ..................................................................................................................67
Research Design...........................................................................................................67
Methodology ................................................................................................................69
Study Area............................................................................................................. 69
Data Sources and Sampling................................................................................... 70

iii
Data Analysis Plan................................................................................................. 73
Statistical analysis.................................................................................................. 78
Ethical Procedures .......................................................................................................82
Summary ......................................................................................................................83
Chapter 4: Research Results ..............................................................................................85
Introduction ..................................................................................................................85
Data Collection ............................................................................................................87
Results. .........................................................................................................................88
RQ1..............................................................................................................................88
RQ2..............................................................................................................................97
RQ3............................................................................................................................109
Summary ....................................................................................................................113
Chapter 5: Discussion ......................................................................................................115
Introduction ................................................................................................................115
Interpretation of the Findings.....................................................................................116
Discussion of RQ1...............................................................................................116
Discussion of RQ2...............................................................................................118
Discussion of RQ3...............................................................................................127
Limitations of the Study.............................................................................................129
Recommendations ......................................................................................................130
Public Health Implications .........................................................................................132
Conclusion .................................................................................................................133

iv
References ........................................................................................................................135
Appendix : Georgia Department of Public Health Permission………………………....145

v
List of Tables
Table 1. Geographical Information System Framework....................................................10
Table 2. Human WNV Disease Cases by Clinical Syndrome, Georgia, United
States, 2001-2012...................................................................................................31
Table 3. Geographical Spread and Major Outbreaks of WNV in the Eastern Hemisphere,
1994 - 2004 .............................................................................................................. 36
Table 4. WNV Positive Cases in United States, 1999-2012. ............................................ 39
Table 5. WNV Positive Cases, Georgia, United States, 2001-2012 ................................. 41
Table 6. WNV Positive Cases, DeKalb and Fulton County Georgia, United
States, 2001-2012...................................................................................................43
Table 7. Positive Pools of WNV Infection in Mosquitoes, DeKalb and Fulton County
Georgia, United States, 2009-2012........................................................................88
Table 8. WNV Positive Vector Mosquito Total Flight Range..........................................95
Table 9. WNV Infection in Mosquitoes, DeKalb and Fulton County Georgia, United
States, 2009-2012...................................................................................................95
Table 10. Distance from CSO Event and WNV Infection Among Mosquitoes, 2009-
2012…..................................................................................................................102
Table 11. Distance from SSO Event and WNV Infection Among Mosquitoes, 2009-
2012......................................................................................................................104
Table 12. Relationship Between Distance to Nearest CSO Event and WNV Infection of
Mosquitoes, 2009-2012........................................................................................106
Table 13. Relationship Between Distance to Nearest SSO Event and WNV Infection of

vi
Mosquitoes, 2009-2012........................................................................................107
Table 14. WNV Infection Rate in Humans, DeKalb and Fulton County Georgia, United
States, 2010-2012.................................................................................................110
Table 15. Distance Between WNV Positive Vector Trap Location and Human Cases,
DeKalb and Fulton County Georgia, United States, 2010-2012.........................111
Table 16. Association Between Human WNV Infection Rate and Distance to Nearest
WNV Positive Mosquito Trap, 2010-2012..........................................................112

vii
List of Figures
Figure 1. Flowchart for analyzing RQ1............................................................................79
Figure 2. Flowchart for analyzing RQ2............................................................................80
Figure 3. Flowchart for analyzing RQ3............................................................................82
Figure 4. Abundance of of Culex quinquefasciatus and Culex spp. in Fulton and DeKalb
County (2009-2012) ..............................................................................................90
Figure 5. Mosquito species abundance, Fulton and DeKalb County (2009).....................91
Figure 6. Mosquito species abundance, Fulton and DeKalb County (2010).....................92
Figure 7. Mosquito species abundance, Fulton and DeKalb County (2011).....................93
Figure 8. Mosquito species abundance, Fulton and DeKalb County (2012).....................94
Figure 9. Distribution of CSO and SSO events in Fulton and DeKalb County
(2009-2012) ...........................................................................................................98
Figure 10. Distribution of mosquito abundance (mosquitoes/per trap night) and CSO
events...................................................................................................................100
Figure 11. Distribution of mosquito abundance (mosquitoes/per trap night) and SSO
events....................................................................................................................101
Figure 12. SSO events by census tract, mosquito WNV infection rate by trap location and
cluster of WNV infected mosquitoes...................................................................103
Figure 13. CSO events by census tract, mosquito WNV infection rate by trap location
and cluster of WNV infected mosquitoes............................................................105
Figure 14. Mosquito trap location with 1 and 2 km buffers, WNV mosquito infection
hotspots, and CSO/SSO events, 2009-2012........................................................108

1
Chapter 1: Introduction to the Study
Introduction
West Nile Virus (WNV), an acute arboviral infection, has spread rapidly in the
United States since 1999, where it was detected in New York (Georgia Department of
Public Health, 2008; Centers for Disease Control and Prevention, 2013). Identifying how
specific environmental factors affect WNV mosquito distribution is critical for public
health control efforts (DeGroote, Sugumaran, Brend, Tucker, & Bartholomay, 2008).
Warm temperatures and short winters in the Southeastern region of the country provide
favorable conditions for WNV-carrying mosquitoes (Shaman, Day, & Stieglitz, 2005;
Calhoun et al., 2007). The Georgia risk for WNV infection is greatest in the metropolitan
Atlanta area, where Culex quinquefasciatus species mosquitoes remain the predominant
vector (Calhoun et al., 2007). From 2001-2012, Georgia reported 346 positive cases of
human infection and 725 West Nile-positive mosquito pools of of which DeKalb and
Fulton Counties reported 87 (25.14%) of the human cases and 725 (63.37%) of the
mosquito pools (Centers for Disease Control and Prevention, 2013). DeKalb and Fulton
counties encompass the area of metropolitan Atlanta, of which has been working to
mitigate aging sewer systems that can discharge of partially treated or untreated
wastewater into community parks and streets. Sewer overflows contribute to recreational
closures, contaminated drinking water and other public health issues. The recent increase
in positive West Nile infections within DeKalb and Fulton counties showed that
knowledge of the ecology of infectious diseases is limited. The environmental factors

2
addressed in this research were intended to understand the human risk of WNV exposure
using spatial patterns of sewer overflows in association with mosquito vectors, of which
are critical to targeted prevention and surveillance resources.
This quantitative research study consist of a spatial analysis of the proximity of
combined sewer overflows (CSO), and sanitary sewer overflows (SSO) and WNV vector
mosquito flight distance to human cases of WNV infections in DeKalb and Fulton
Counties following the remediation, from January 2009 to December 2012. Developing
methodologies to improve disease control measures have promising public health
implications. Identifying specific environmental conditions in relation to mosquito-borne
disease exposure areas can be critical to developing spatial risk modeling based on
epidemiological data. The use of a comprehensive and interdisciplinary approach to
identify and associate environmental factors could improve vector control programs and
personal protection that reduce WNV infections. Factors that affect transmission and
amplification of WNV in the predominantly urban counties of DeKalb and Fulton are
poorly understood. Chapter 1 explore and define the background of WNV; its problem
and purpose; the research questions and hypotheses; the conceptual framework; the
nature of the study; the definitions; the assumptions; the scope and delimitations; the
limitations; and the significance of this study.
Background
DeKalb and Fulton Counties which share the metropolitan Atlanta area that is
associated with discharge waters from combined sewer systems resulting in an increase

3
of West Nile infected mosquitoes in close proximity to the CSO streams and facilities
(Chaves, Keogh, Vazquez-Prokopec, & Kitron, 2009; Ciota et al., 2012). The efficiency
of mosquitoes ability to transmit WNV is associated with environmental factors, such as
temperature, preceding drought, and coincidental rainfall (Reisen, Fang, & Martinez,
2006; Shaman, Day, & Stieglitz, 2005; Shaman, Stieglitz, Stark, Le Blancq, & Cane,
2002). A combination of warm temperature (approximately 80-84°F) and extreme
drought bring avian hosts and mosquito vectors into close contact, of which lead to
increased cases of WNV disease in humans (Reisen, Fang, & Martinez, 2006; Shaman,
Day, & Stieglitz, 2005). Additionally, above average wetting has also lead to the
increased transmission of WNV (Landesman, Allan, Langerhans, Knight, & Chase,
2007).
Mosquitoes are known to travel between a water source for egg laying and a
blood-meal host. Adult mosquitoes tend to aggregate near egg laying (also known as
oviposition) sites (Menach, McKenzie, Flahault, & Smith, 2005). When considering
mosquito flight range for this study, this “flight range” term could refer either to an
effective flying range or the flight distance of a species (Russell, Knipe, Rao, and
Putman, 1944). Russell, Knipe, Rao, and Putman (1944) defined the mosquito flight
range as either “effective flight range,” the maximum density needed to cause a
mosquito-borne disease or nuisance, and the distance a mosquito species fly from its egg
laying site (varying based on conditions); and “total flight range,” as the maximum
known distance a species was observed to have flown from the egg laying site (not based

4
on conditions). For the purpose of this study, the flight range was the “total flight range”
of mosquito species. The Menach, McKenzie, Flahault, and Smith (2005) study
demonstrated that human proximity to water where mosquitoes oviposit increased the
risk of mosquito-borne infections such as malaria. As a way of identifying local mosquito
species, abundance, and prevalence of mosquito-borne diseases, state or county mosquito
surveillance programs conducted trapping of adult mosquitoes. Understanding how the
WNV vector proximity to water maximized the transmission potential to humans was
important in reducing the conditions that enable replication of this debilitating disease
(Menach, McKenzie, Flahault, & Smith, 2005).
Since November 2008, the reduction of combined sewer system wastewater
releases in the Atlanta area should have translated into a reduction of mosquitoes testing
positive WNV infections, but the human cases of WNV increased each year (Centers for
Disease Control and Prevention, 2013). In addition, sanitary sewer system overflows
were not explored as an oviposition source for mosquitoes that carry WNV. Sanitary
(household) type waste is carried to a wastewater treatment plant, treated and then
released into the environment, while stormwater is typically carried by a storm-sewer
system to the nearest surface water body (Environmental Protection Agency, 2012).
Separate drainage systems are the preferred wastewater management system for carrying
sanitary wastewater and stormwater (Environmental Protection Agency, 2012). Sanitary
sewer systems encounter overflows when malfunction due to events, such as blockages
(as grease deposits), line breaks, sewer defects, lapses in sewer system maintenance,

5
power failures, and design flaws or vandalism (Environmental Protection Agency, 2012).
The sewage system has caused widespread environmental concerns and public health
efforts have increased to maintain, improve, or eliminate the current systems.
The variables of wetting, climate, breeding, abundance, survival, host breeding
patterns, and human behavior have strong correlations to WNV replication and
distribution. The nature and magnitude of each variable change based on the geographical
area and socienvironmental conditions. Improved epidemiological forecasting was
needed to develop methodologies for scenario-based predictive modeling to reduce and
eliminate WNV infections and other mosquito-borne illnesses. As with this research, an
assessment of factors to improve the forecasting of WNV disease transmission could be
instrumental for public health programs to identify high risk areas, optimize mosquito
control measures, and to provide timely warnings and protective measures to the public.
Problem and Study Purpose
The combined sewer overflow systems discharge waters in DeKalb and Fulton
counties, have been associated in previous research as a source of local stream pollution.
The city of Atlanta initiated environmental consent decrees in 1998 and 1999 that
addressed the combined and sanitary sewer system overflows. The 1998 consent decree
focus was designed to comply with the national CSO policy and reduce CSO from 100+
per year at each of the seven CSO facilities to four combined sewer facilities with points
for overflow. The 1999 consent decree was designed to eliminate 1000+ annual sewer
spills within the separate sanitary sewer system and the combined sewer system. Atlanta

6
was facing a wastewater system that included 1,500 miles of aging sewers 50 years to
over 100 years old, of which 15% were combined and 85% were separated. During that
time, the wastewater collection system consisted of 1,970 miles of separate sanitary
sewer pipes, of which 113 square miles of separate sanitary sewer service areas
experienced overflows. The combined sewer system consisted of 230 miles of old pipes
built in the 1800s to carry stormwater and sewage. During 1998-1999, the City of Atlanta
was operating seven combined sewer overflow control facilities that discharged
overflows into small urban waterways. Since the CSO consent decree remediation system
(an underground reservoir) completion in November 2008, three of the seven Atlanta area
combined sewer sub-basins (33 miles) were separated to reduce the number of sewage
overflows. As of April 2010, the City accomplishments from the 1999 consent decree
included evaluating 86% of the sewer system, of which 66% of the miles surveyed
require rehabilitation work. Since the base-tracking of 2004, the city overflow volumes
were reduced by over 95% and wet weather overflows were also reduced annually.
Despite the 2008 completion of the CSO Remediation system and a reduction of sewer
system overflows, the West Nile positive mosquito population increased each year from
2010 through 2012. In 2012, Georgia reported 99 cases (7 cases in DeKalb and 9 cases in
Fulton County) of WNV, with 6 deaths. Cases reported in 2012 nearly doubled the
highest number of cases (52) reported in Georgia since 2001. Vazquez-Prokopec (2010)
significantly associated West Nile infection risk with the combined sewer overflows in
urban Atlanta. In addition, combined sewer overflows were associated with supporting

7
dense mosquito population growth based on water flow patterns and organic content
(Calhoun et al., 2007; Chaves, Keogh, Vazquez-Prokopec, & Kitron, 2009). Attention to
combined sewer systems contribution of harboring West Nile infected mosquitoes
increased in the last 5 years. Yet an assessment of the potential contributions of
individual sanitary sewer system overflows as sources of WNV exposure for humans
were not explored. The contributions of sewer system overflows to WNV risks are still
poorly understood.
Research Question and Hypotheses
Spatial analytic methodology was used to explore a unique correspondence of
sewer system overflows to the amplification of WNV positive vector mosquitoes and
investigate their proximity to areas of human WNV infections. The dependent variables
in this study were locations of WNV vector mosquito traps and WNV infected human
cases. The independent variables in this study were locations of WNV vector mosquito
traps, locations of combined sewer system overflows, and locations of sanitary sewer
system overflows. The location of WNV vector mosquito traps was a dependent variable
for RQ2 and respective hypotheses. However, the location of WNV vector mosquito traps
was an independent variable for RQ3 and respective hypotheses. The major research
questions raised from this gap in knowledge were:
1. What is the spatial distribution from 2009-2012 of WNV mosquito infection in
DeKalb and Fulton County?

8
2. What is the association between WNV mosquito infection among combined
sewer overflows following 2008 reduction of combined sewers and sanitary sewer
overflows in DeKalb and Fulton County?
H0: There is no significant association between WNV mosquito infection among
combined sewer overflows following 2008 reduction of combined sewers and sanitary
sewer overflows in DeKalb and Fulton County.
H1: There is a significant association between WNV mosquito infection among
combined sewer overflows following 2008 reduction of combined sewers and sanitary
sewer overflows in DeKalb and Fulton County.
3. What is the spatial association between WNV-infected mosquito pools and
WNV-human infection?
H0: There is no significant association between distances to WNV infected
mosquito pools and WNV human infection.
H1: There is a significant association between distance to WNV infected
mosquito pools and WNV human infection.
Conceptual Framework for the Study
The application of geographical information systems (GIS) technology to identify
associations among high-risk conditions could facilitate efficiency for local vector control
and public health intervention programs. The GIS technology used in this research was
the ArcMap software system (a component of ArcGIS). GIS modeling involves the use of
symbols to represent locational, thematic and temporal attributes that describe features

9
and environment of a certain space and time. The GIS spatial data model was used as
framework for this study (see Table 1). This model provided a statistical interpretation of
relations among map variables, and is founded on spatially explicit data functions. The
spatial distribution of WNV mosquito infection was assessed with the GIS model kernel
density estimation in order to analyze the distribution of sewer system overflows and
mosquito abundance. The kernel density estimation created bandwidths of probability, of
which indicated the risk of WNV infection. The addition of Getis and Ord G*(d) local
statistics detected the spatial clustering of mosquitoes, of which returned hot and cold
spot clustering to identify the statistically significant mosquito locations. They assessed
the association between WNV mosquito infection among combined and sanitary sewer
overflows, began with WNV infection rate among mosquito pools estimation with the
Maximum Likelihood method. Each mosquito trap was coded based on WNV infection
in the mosquitoes; whereas the distance between each mosquito trap location and CSO or
SSO event were calculated using “proximity tools” in ArcGIS software. Fischer’s exact
test was used to determine the association between distance to the nearest CSO/SSO
location and the presence or absence of a WNV infected pool. A logistic regression
model was used to study the association between distance to nearest CSO/SSO event and
the presence or absence of a WNV-infected mosquito pool. The human WNV infection
rate was estimated with the empirical bayes (EB) smoothed data estimation method. The

10
Table 1
GIS Framework
Variable Construct Construct elements Analytic/GIS
tool
Output
RQ
1
Descriptive Spatial
distribution of
WNV
Combined sewer system
overflows
Kernel
density
Bandwidths of
probability
Sanitary sewer system
overflows
Mosquito clusters Getis and
Ord g*(d)
Hot spot/cold spot
clustering
RQ
2
Dependent = locations
of WNV vector
mosquito traps
Independent =
locations of combined
sewer system
overflows
Independent =
locations of sanitary
sewer system
overflows
Mosquito
infection among
sewer system
overflows
WNV mosquito infection Maximum
likelihood
wnv_pool = 1 if
wnv infected
pool
wnv_pool = 0 if
wnv negative pool
Distance between
mosquito trap
location and
CSO/SSO
overflows
Mosquito trap location Proximity
tools, point-
to-point
“within 1 km”
(“event_dist” = 0
if “near_distance”
was less than
1km)
“more than 1 km”
(“event_dist” = 1,
if “near_distance”
was 1km or
greater)
Combined sewer system
overflows
“near_distance”
Sanitary sewer system
overflows
Association
between distance
of CSO/SSO
overflows and
presents/absence
of WNV infected
pool
WNV mosquito infection Fischer’s
exact test
logistic
regression
model
“near_distance”
“wnv_pool” Mosquito trap location
Combined sewer system
overflows
Sanitary sewer system
overflows
RQ
3
Dependent = locations
of WNV infected
human cases
Independent =
locations of WNV
vector mosquito traps
Spatial
association
between WNV
infected pools and
human infection
Human infection rate Empirical
bayes
“eb_rate”
Human WNV infection
clusters
Local
indicators of
spatial
association
If statistically
significant at the
0.001 (or 0.01 or
0.05) level

11
local indicators of spatial association (LISA) was used to determine clusters of human
WNV infection.
Using the GIS model, spatial data was built and stored in special digital formats
called “layers”. Layers were formed from the “vector” and “raster” data structures. The
vector data structures represent the basic features of ArcGIS (e.g., ArcGIS shape files).
Vector data is composed of points, lines and polygons. Vector points represent specific
ground locations. Vector lines represent linear features as rivers and roads. Vector
polygons form boundaries of areas as land masses and water features. The raster data
structure represents the landscape in rectangular arrays of grid cells as a continuous data
form (e.g., raster datasets). The raster layer could represent elevation, slope or reflection
factor when manipulating spatial data. The dependent variables in this study, locations of
WNV vector mosquito traps and WNV-infected human cases, were displayed as points in
the vector data structure (stored as ESRI shape files). The independent variables in this
study, locations of WNV vector mosquito traps, locations of combined sewer system
overflows, and locations of sanitary sewer system overflows were represented as both
points of a vector data structure and as a continuous raster data structure. The ArcGIS
spatial statistics toolbox was employed to shape this research by summarizing the data
distribution characteristics using analyzed patterns and mapping clusters toolsets.
Analyzed patterns evaluate clustered, dispersed, or random spatial pattern (ESRI, 2013).
Mapped clusters were used to identify the hot, cold or outliers of statistically significant
spatial data (ESRI, 2013). The analyzed patterns, as point distance, were used to calculate

12
the distances from input point features (e.g., trap locations, census tract centroid) to all
points in the near features (e.g., CSO/SSO event location) within a specific search radius.
The point distance variables were coded “near_distance” and “case_distance” (of which
the names linked with underscores are used as a required naming convention within the
database). The mapped clusters were used to calculate the census tract clusters of which
had higher rates. In addition, the use of hot spot analysis was employed to identify areas
of high mosquito abundance, using z-score values. Use of the GIS framework with maps
and toolsets helped communicate the context and scope of the questions analyzed in this
research (ESRI, 2013).
Nature of the Study
As the Atlanta region grows, impervious surfaces are replacing the natural
landscape. The increase of impervious surfaces reducing the area where infiltration to
ground water can occur; of which sewer systems capture the runoff. When wet weather
exceed the treatment capacity of the combined sewer overflow control facilities, raw
sewage flows were discharged to a nearby stream or creek. Sanitary sewer systems
malfunctioned when events such as blockages, line breaks, sewer defects, lapses in sewer
system maintenance, power failures, and design flaws or vandalism occurred. Currently,
sewer systems are causing widespread environmental problems, and public health efforts
are growing to control or eliminate the systems. Clean Water Act permit violations for
DeKalb County, Fulton County and the City of Atlanta; have resulted from operational
and capacity problems. The city area has experienced systemic problems with combined

13
sewer and sanitary sewer overflows from stormwater, clogged or broken pipes. In 1999
the City entered a Consent Decree that addressed the sewage collection system, of which
included the combined sewer area and sanitary sewer overflows. Part of the city CSO
remediation plan was to reduce the seven CSO tunnels to four CSO tunnels by separating
Greensferry and McDaniel CSO basins and a portion of the Custer CSO basin. This basin
separation was completed in November 2008. A part of the CSO remediation, it was
planned to reduce the pollution levels of the Chattahoochee River with <10 waste water
releases per year, of which should have translated to less opportunity for mosquito
infestations. Since 2008 CSO remediation completion, the mosquito population increased
each year after 2009, that is, for the following 3 years. In 2012, the cases of WNV had
nearly doubled in Georgia since 2001, of which nearly 20% of the cases were in DeKalb
and Fulton Counties.
Each year since 2001, WNV has remained a reportable condition and continued to
circulate in Georgia. Avians and mosquitoes were identified as vectors in spreading the
WNV. Mosquitoes became infected after feeding on infected birds in its area and
transmitted the virus to people and other animals. From 2001 to 2007, the DeKalb and
Fulton Counties mosquito data encompassed the Metro Atlanta area, providing a
consistent overview of WNV positive cases. DeKalb County human positive cases
averaged 1.86 per year (median = 1.00, s.d. = 2.12) and mosquito positive cases averaged
19.57 pools per year (median = 13.00, s.d. = 16.23). Fulton County human positive cases
averaged 6.29 cases per year (median = 8.00, s.d. = 3.30) and mosquito positive cases

14
averaged 35.29 pools per year (median = 32.00, s.d. = 23.4). The State WNV positive
human cases deviation varied from year to year and county to county between 2001 and
2007. During the State 2008 mosquito surveillance season, the positive WNV human
cases were reduced to 1 incident and 48 positive mosquito pools. In 2009, there were no
incident of WNV positive human cases and 13 cases of WNV-positive mosquito pools.
During 2009 mosquito season peak in September, the Atlanta area experienced a historic,
record-breaking flood with a state estimate of $500 million in damages. As seen in trends
from 2009 to 2012, the WNV positive human cases and mosquito pools increased each
year following the 2009 flooding. From 2009 - 2012, the Atlanta region remained in a
climatic drought. Exploring the relationship between sewer system overflows and the
incidence of WNV infection during a drought could be used to develop a static model of
human risk. Mosquito trap data coupled with the proximity to combined and sanitary
sewer overflow events could help predict the spatial distribution of human WNV
transmission in Georgia.
Human diseases can derive from abnormal genetic expression or transmitted from
person to person. The occurrence of mosquito borne diseases is influenced by
environmental factors that can impact the vector, pathogen or risk of exposure.
Geographical information systems evolved using the knowledge of environmental
associations, of which predictive spatial WNV disease risk models were developed (Eisen
& Eisen, 2008). Analysis of the human risk of exposure to mosquito disease patterns is
critical for targeted preventive surveillance and control. The health of the public can

15
benefit from basic spatial patterns of the vector mosquitoes by raising awareness of
mosquito-borne disease risks in the communities. The benefits of using spatial analysis
on epidemiological data are that based on human cases are formed from vector disease, of
which undeniably demonstrate direct contact with the agent. In contrast, a high
abundance of a diseased vector does not necessarily equate to higher human risk because
(a) mosquitoes habitats could be unavailable to human contact; (b) local human behavior
could affect disease exposure; and (c) humans could use personal protective equipment
and repellents. Therefore spatial models need to include vector abundance, presence,
distribution, and infection rate in conjunction with epidemiological data. A spatial
analysis of vector species risk can enhance information about WNV exposure relative to
the incidence of human WNV disease based on census tracts (Eisen & Eisen, 2008). A
spatial analysis using sewer system, mosquito, and human data was conducted in this
research.
The state population averaged 168.40 people per square mile, whereas the
population for DeKalb County averaged 2,585.70 people per square mile and Fulton
County averaged 1,748.00 people per square mile (2010 US Census). During 2009-2012,
the State of Georgia reported 138 human cases of WNV infection, of which 11 deaths
were attributed to WNV, and 642 WNV positive mosquito pools. DeKalb and Fulton
County reported 26 (26.26%) of the WNV-positive human cases and 293 (45.64%) of the
positive mosquito pools from 2009-2012 for the State. Human WNV cases during 2009-
2012 was available from the Georgia Department of Public Health in accordance with

16
human data release guidelines and data use agreement (Georgia Department of Public
Health, 2013). Human population data was optained from the 2010 United States census
(United States Census, 2012) to estimate WNV infection incidence rates (cases per
100,000 persons). Geographic coordinates of mosquito trap location and WNV infection
data in mosquitoes between 2009-2012 was provided by Georgia Department of Public
Health. Mosquito trapping occured within DeKalb and Fulton County urban settings.
Mosquitoes were collected overnight using either CO2-baited CDC-light traps or gravid
traps. The mosquito surveillance data consisted of collection dates, street locations, cities,
grid coordinates, counties, districts, species, number in mosquito pool, trap type, and the
virus isolation status.
Within the City of Atlanta (90% in Fulton County, 10% in DeKalb County), there
were four CSO points and the streams associated with the combined sewer overflows.
The main combined sewer overflows were into the Chattahoochee and South Rivers. The
Chattahoochee River corridor from the crossing of Interstate 75 in Fulton County,
includes, but is not limited to, all tributary streams in that corridor as Peachtree Creek,
Nancy Creek, Proctor Creek and Utoy Creek. The South River corridor for its entire
length, includes, but is not limited to, all tributary streams in that corridor as
Intrenchment Creek. Geographic locations of county streams were presented as a raster
layer from the CDC Geospatial Data Warehouse. The date, volume, cause, and street
address of sewer system overflows from 2009-2012 were recieved from the
environmental departments of DeKalb County Department of Health, Fulton County

17
Department of Health and Wellness, and the City of Atlanta.
Definitions
Key definitions used in this proposed study are explained as follows:
WNV infection. WNV infection is a mosquito borne virtual invasion of body
tissue, subsequent growth, production of toxins, and injury to the tissue (Centers for
Disease Control and Prevention, 2013).
WNV disease. WNV disease is an abnormal condition of a mosquito borne virtual
infection that impairs physiological functioning (Centers for Disease Control and
Prevention, 2013).
Oviposition. Oviposition is a specific mosquito species habit and condition in
which they lay their eggs (Strickman, 1988; Chaves, Keogh, Vazquez-Prokopec, &
Kitron, 2009).
Combined sewer system. A combined sewer system conveys rainwater runoff,
domestic sewage, and industrial wastewater in one pipe (Environmental Protection
Agency, 2012).
Combined sewer overflow (CSO). A combined sewer overflow is an even that
occurs when the wastewater volume exceed the capacity of the sewer system or treatment
plant and by design, will overflow and discharge excess wastewater directly to nearby
streams, rivers, or other water bodies (Environmental Protection Agency, 2012).
Sanitary sewer system. Sanitary sewer system conveys sewage from houses,
commercial buildings, and industrial areas for treatment or disposal.

18
Sanitary sewer overflow (SSO). Sanitary sewer overflow are the occasional
unintentional discharges of raw sewage from separate municipal sanitary sewers
(Environmental Protection Agency, 2012).
Stormwater sewer system. Storm sewer system conveys rainwater runoff from
streets, sidewalks, and buildings to local streams, from catch basins to prevent floods
during heavy rains (Environmental Protection Agency, 2012).
CDC Gravid Trap. A CDC gravid trap components consist of an oviposition pan,
aspirating fan, and collection net that functions as an attractant technique for surveillance
of virus-positive female mosquitoes (John W. Hock Company, 2010a).
CDC-light traps (CO2-baited). A CDC light trap components consist of an
incandescent light affixed to an aspirating fan and collection net, of which an optional
container with CO2 (dry ice) is attached to functions as an attractant technique for
surveillance of mosquitoes (John W. Hock Company, 2010b).
Assumptions
This study was subject to four assumptions:
1. All mosquitoes captured during surveillance were correctly identified. The
Culex mosquito, with over 560 species described, is one of the largest
genera in the Culicidae and the mosquitoes of this study are based on the
identification of the Culex and other vector species (Miller, Crabtree, &
Savage, 2007).

19
2. The adult mosquito surveillance area near sewer system overflows were
not significantly altered due to applications of adulticides or larvicides.
The application of mosquito pesticides were based on mosquito
abundance, positive pathogen activity, identified high-risk areas, and
community nuisance mosquito requests. For instance in 2012, by October
31, DeKalb County had received 336 call requests for mosquito control
efforts; 251 priority facilities (i.e. senior centers) were larvicided and staff
were educated; and storm drains where larvicided throughout the county.
3. Sewer system spills left deposits of water to support a mosquito life cycle.
4. The volumes of water from sewer system overflows were estimated with a
standard degree of accuracy. Georgia Environmental Protection
Department provided rules and regulations for water quality controls that
required agencies to demonstrate consistency with all spill reporting,
publication, notification, and sampling requirements. The Georgia
Environmental Protection Department assisted wastewater agencies by
providing formulas and charts to calculate sewer system spill volume.
Scope and Delimitations
This research focused on the exploratory relationship between the proximity of
specific sewer system overflows and the mosquito vector to human cases of West Nile
disease. Other than human population data, this study did not include demographic
features as variables for spatial analysis. Previous research on the demographic factors of

20
WNV in Georgia are well documented and further assessment was not part of the
objectives of this study (Boos, 2009; Vazquez-Prokopec et al., 2010). This research did
not assess West Nile positive birds association to human cases. Allan et al. (2009)
correlation of birds as indicators of WNV distribution has been well document and
supported by other research. Local bird data from 2001-2007 was assessed in The Risk of
WNV Infection is Associated with Combined Sewer Overflow Streams in Urban Atlanta,
Georgia, USA, (Vazquez-Prokopec et al., 2010). Vazquez-Prokopec et al. (2010)
provided a description and quantification of the factors that favor WNV infection
distribution, of which included the well-documented use of bird data. The same study
identified that when WNV infection in humans and birds overlap, the results can be
inconsistent from North Fulton to South Fulton County but are significantly associated
with the proximity of CSO-affected streams. Using 2009-2012 data in this research
resulted in 3 cases of birds that were positive for WNV in DeKalb County. The 3 cases of
bird testing were insignificant data for a power analysis (lack of funding for bird testing
programs are prevalent in Georgia). This study did not include environmental factors that
might influence mosquito spatial distribution. The environmental factors typically used,
but not considered in this study, were tree canopy coverage, type of land cover, and
climate. In one instance, landscape associations to vector borne pathogens were identified
as suitable habitats using remote sensing technology (Brownstein et al., 2002). In another
instance, Anyamba, Linthicun, and Tucker (2001) used a normalization of difference
vegetation index and Trawinski and Mackay (2010) developed a novel approach to

21
examine landscape variables to accurately predict mosquito distribution. Landscape
factors that influenced WNV distribution are well established in literature (Ozdenerol,
Bialkowska-Jelinska, & Taff, 2008; Ruiz et al., 2010). Similarly, analysis of climatic
influence on WNV distribution are well documented in literature and were not be
analyzed in this research (Scheraga, 2008; Soverow, Wellenius, Fisman, & Mittleman,
2009; Ozdenerol, Bialkowska-Jelinska, & Taff, 2008; DeGroote, Sugumaran, Brend,
Tucker, & Bartholomay, 2008; Soverow, Wellenius, Fisman, & Mittleman, 2009). Wang,
Minnis, Belant, and Wax (2010) provide broad implications of how dry weather induces
outbreaks of human West Nile infections. From 2006-2012, the State of Georgia
continued to be in a climatic drought and remained in a constant condition during this
research period (U.S. Geological Survey; National Climatic Data Center; National
Weather Service).
Limitations
Start and end dates of mosquito surveillance or sewer system overflow data
collection recordings varied from year to year. Mosquito surveillance seasons depended
on county budgets for the year. The county budget also affected the amount of traps used
and how often the traps were placed for surveillance. Sewer system overflows events did
not occur in until piping conditions were aggravated by substantial weather events,
vandalism, or clogs. Variations in data collection were assessed and displayed using the
Geographic Information system.

22
Significance
Preceding research has given insight to the climatic, demographic, geographic,
and vector-host aspects of WNV concerning humans. Entomological research has
provided a depth of knowledge from the genetics of the pathogen, identification of
species as it relates and possible pathogen carriers, to the ecological factors that influence
mosquito distribution. Across the country, research has associated combined sewer
overflows as an enabling source to mosquito abundance. Local research have provided
many aspects of the aforementioned factors of mosquito and sewer system overflows, but
only concerning data in 2007 and earlier. There have been significant changes to the
Atlanta area sewer systems, and year 2008 mark that significance by eliminating three of
the seven combined sewer systems of which reduced the system overflows. Theoretically,
the less the sewer system overflows then the less chance of providing a breeding medium
for mosquito abundance and therefore reducing West Nile infection risks. In addition to
combined sewer system changes, the middle Georgia area (including Atlanta)
experienced a record-breaking flood in 2009. After the mosquito season of 2009,
mosquito abundance and West Nile infections increased each year. This research
explored the result of changes to the Atlanta area sewer system effects concerning WNV
infection and introduce an alternate consideration of sanitary sewer system overflows.
Combined and sanitary sewer overflows both provide an opportunity for nutrient-rich
standing water that can attract WNV vector females to lay eggs. Identifying and

23
eliminating possible oviposition sources for mosquitoes could prevent the escalation of
human West Nile infections and direct public funds to the source of prevention.
Summary
The key aspects discussed are how local environmental factors as the reduction of
combined sewer wastewater releases in the Atlanta area since November 2008, could
translate into WNV mosquito distribution, of which is critical for public health control
efforts. From 2009-2012, the positive cases of WNV increased each mosquito season.
There was also no known local research that assessed the possible contributory effects of
sanitary sewer system overflows as breeding sources, only combined sewer type systems
were assessed. Appling GIS technology to explore mosquito flight data coupled with the
proximity to combined and sanitary sewer overflows, could help facilitate efficiency for
local vector control and influence a positive social change in support of public health
intervention programs. Having a clear situational analysis of epidemiological factors,
environmental conditions, infrastructure, and uses of technology is necessary in the
assessment of research objectives. In addition, a review of past and current research can
provide support and justification when approaching exploratory research topics.
Chapter 2 will provide a review of literature; the study conceptual framework;
epidemiology of WNV; the surveillance of Georgia adult mosquito; and local wastewater
manangement. Chapter 3 will specify the research design, methodology, and ethical
procedures. Chapter 4 will provide the research results; of which include data collection.
Chapter 5 will complete the research with a discussion, of which include the

24
interpretation of the findings; limitations; recommendations; implications; and a
conclusion of the study.

25
Chapter 2: Literature Review
Introduction
WNV is a nationally notifiable arboviral disease that can cause fever, affect the
nervous system, and lead to death. Two years after the introduction of WNV in the
United States, WNV was considered to be endemic in Georgia. Factors conducive to the
transmission and amplification of WNV in the urban environment of Atlanta, as found in
DeKalb and Fulton Counties, are poorly understood. Waters polluted by combined sewer
overflow represent significant habitats for the WNV mosquito vectors. The purpose of
this study was to spatially explore combined sewer overflows after the 2008 remediation,
of which included sewer systems overflows and the WNV positive mosquito pools
association to risks of human WNV infections.
Human transmission depends on mosquito density, vector feeding habits, and
ecological factors (Centers for Disease Control and Prevention, 2008; Hayes & Gubler,
2006). Of those infected with WNV, 20% develop symptoms and less than 1% develop
moderate to severe neuroinvasive illness. Turell, Sardelis, Dohm, & Oguinn (2001)
identified the Culex quinquefasciatus as the main vector of WNV for the southeastern
United States and Calhoun et al. (2007) identified 95% of all WNV positive mosquito
pools as containing Culex quinquefasciatus in Georgia. Calhoun et al. (2007) also
identified combined sewer overflows as significant urban breeding sites for Culex
mosquitoes. Chaves, Keogh, Vazquez-Prokopec, and Kitron (2009) further associated
CSO as an enhancement to oviposition of Culex quinquefasciatus mosquitoes. The

26
analysis of Vazquez-Prokopec et al. (2010) associated significantly higher rates of WNV
in birds and mosquitoes with combined sewer overflows and creeks. In contrast, the same
study identified a wealthy North Fulton County area that did not experience an increase
in human WNV cases, despite the proximity to two CSO streams. Expounding on the
conditions associated with WNV infections, the literature review will explore the
epidemiology of WNV, local adult mosquito surveillance, and the conditions of
wastewater management.
Literature Search Strategy
The literature search was conducted using the following databases: BIOSIS,
MEDLINE, EMBASE, AGRICOLA, SciSearch, ScienceDirect, EBSCOhost Science
Reference Center, and Google Scholar. The following search terms were used
individually or in combination: West Nile virus, Culex mosquitoes, drought, vector-borne
diseases, zoonotic pathogens, spatial epidemiology, urbanization, insect vectors, viral
diseases of animals and humans, environmental factors, pest monitoring, breeding sites,
climatic factors, temperature, precipitation, adult mosquito surveillance, ecology,
combined sewer overflows, sewer systems overflows, water quality, hydrological
assessment, vector mapping, and spatial modeling.
The scope of the literature review encompassed three overlapping approaches.
The first approach was to search for literature without date limits. The second approach
to the literature search was to only involve dates since the 1999 arrival of WNV in the
United States to the present. The third approach was to find and incorporate various types

27
of sources in addition to peer-reviewed literature. Used resources, dating from 1956 to
2005, include approximately 68% peer reviewed sources. Literature cited between 1956
and 2005 were comprised of 68% peer reviewed journals; 16% local newsletters; 6%
websites; and the remainder were government reports, and a foreign journal. Literature
cited from 2005 to the present were comprised of over 60% peer-reviewed material; 32%
government websites; and the others were state open records reports. DeKalb County,
Fulton County, and the City of Atlanta held the information for sanitary and combined
sewer system overflows that was provided by open records request. The mosquito control
program was data was received from the State of Georgia epidemiology section. In cases
where there was limited current research, information was also received from state
contacts developed during a master’s degree practicum with the State of Georgia health
department and visiting DeKalb and Fulton Counties watershed departments. Phone
contacts were developed from visiting the Georgia Environmental Protection Department
and attending a Georgia Mosquito Control Association conference, of which provided
direct contact with government officials for specific information gathering. Locating and
having access to necessary information required a diversity of information gathering
techniques and directing the information to frame the concepts of the research.
Conceptual Framework
WNV is endemic to Georgia. The Culex quinquefasciatus mosquito is the leading
vector of WNV infections for humans in the State. Vazquez-Prokopec et al. (2010)
studied spatial distribution of WNV infections in birds, mosquitoes, and humans from

28
year 2007 and earlier in the Atlanta area. In addition, integrating the geographic
coordinates of CSO facilities and streams to estimate the risk factor for WNV due to
proximity was significantly associated with higher rates of infection in birds and
mosquitoes (Vazquez-Prokopec et al., 2010). As seen in the trends from 2009 to 2012,
the WNV positive human cases and mosquito pools increased yearly following the CSO
remediation. The wastewater treatment plants and miles of sewer pipes in DeKalb and
Fulton Counties were in need of significant repairs and upgrades. Gaps in literature had
not evaluated the relationship of metropolitan Atlanta, Fulton or DeKalb County sewer
system overflows to WNV infection since the CSO remediation association to WNV
infections. Examining the spatial relationship during a hydrologic drought of SSO and
CSO systems, vector mosquitoes, and the incidence of human disease associated with
WNV can lead to a greater understanding of epidemiological factors.
Epidemiology of WNV in Georgia
Humans, equine, and other animals can be a host for WNV disease. Avians and
mosquitoes play a vector role in spreading the WNV. The main route for WNV is through
wild avians, of which can carry the virus naturally and spread the virus throughout an
area because of their mobility. Mosquitoes bread and live its lifespan in limited areas but
can become infected after feeding on infected birds in its area. A mosquito infected with
the WNV can transmit the virus to people and other animals. A person infected with
WNV will have no symptoms or mild symptoms, of which can progress to severe
symptoms. The disease that develops from the mild symptoms is usually West Nile fever.
29
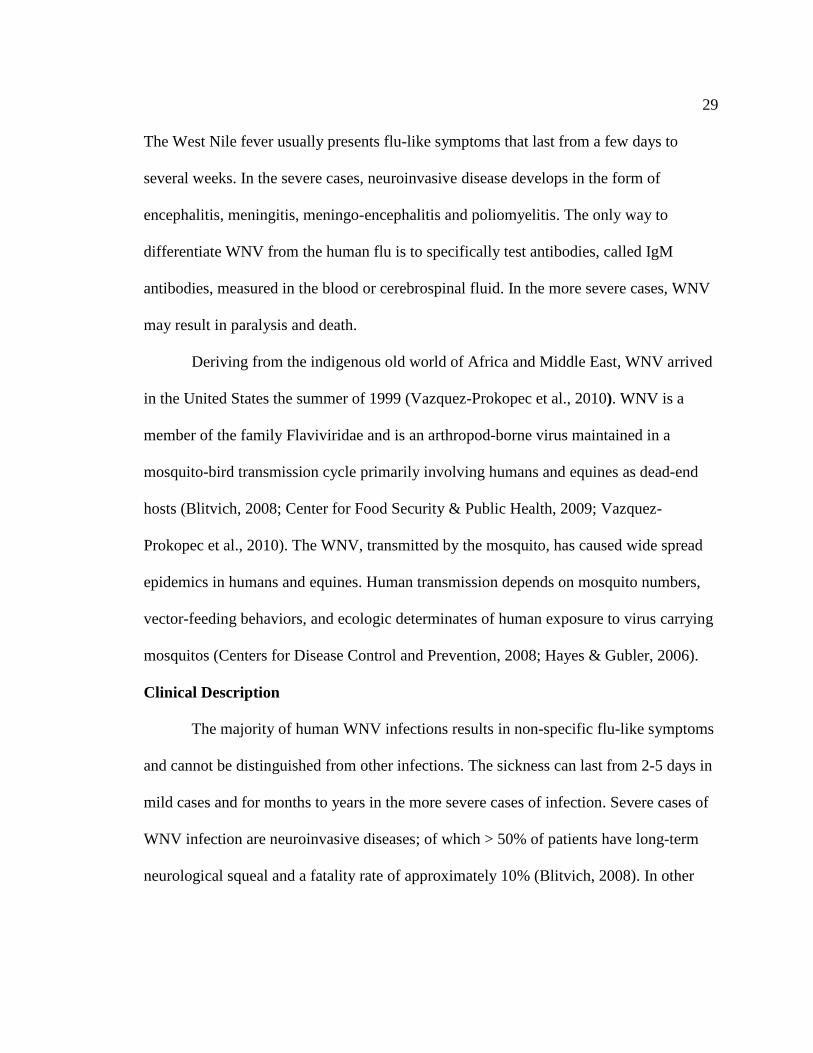
The West Nile fever usually presents flu-like symptoms that last from a few days to
several weeks. In the severe cases, neuroinvasive disease develops in the form of
encephalitis, meningitis, meningo-encephalitis and poliomyelitis. The only way to
differentiate WNV from the human flu is to specifically test antibodies, called IgM
antibodies, measured in the blood or cerebrospinal fluid. In the more severe cases, WNV
may result in paralysis and death.
Deriving from the indigenous old world of Africa and Middle East, WNV arrived
in the United States the summer of 1999 (Vazquez-Prokopec et al., 2010). WNV is a
member of the family Flaviviridae and is an arthropod-borne virus maintained in a
mosquito-bird transmission cycle primarily involving humans and equines as dead-end
hosts (Blitvich, 2008; Center for Food Security & Public Health, 2009; Vazquez-
Prokopec et al., 2010). The WNV, transmitted by the mosquito, has caused wide spread
epidemics in humans and equines. Human transmission depends on mosquito numbers,
vector-feeding behaviors, and ecologic determinates of human exposure to virus carrying
mosquitos (Centers for Disease Control and Prevention, 2008; Hayes & Gubler, 2006).
Clinical Description
The majority of human WNV infections results in non-specific flu-like symptoms
and cannot be distinguished from other infections. The sickness can last from 2-5 days in
mild cases and for months to years in the more severe cases of infection. Severe cases of
WNV infection are neuroinvasive diseases; of which > 50% of patients have long-term
neurological squeal and a fatality rate of approximately 10% (Blitvich, 2008). In other

30
vertebrates, 8% of equines develop clinical signs of WNV infection (Blitvich, 2008).
West Nile infected avians are known to develop neurologic and non-neurologic signs but
often die in the first 24 hours from the onset of clinical signs (Blitvich, 2008). Equine
cases usually do not precede human cases but dead avian cases provide an efficient early
warning sign for human WNV disease in the United States.
It is estimated that 80% of people infected with WNV is asymptomatic, 20%
develop West Nile Fever symptoms, and less than 1% of those infected develop moderate
to severe neuroinvasive illness as encephalitis, meningitis, or flaccid paralysis (Centers
for Disease Control and Prevention, 2008; Hayes & Gubler, 2006; Klee et al., 2004).
From 2001 to 2012, Georgia had 346 total cases of West Nile related diseases; of which
included 182 neuroinvasive, 149 non-neuroinvasive, and 28 deaths reported to Centers
for Disease Control and Prevention (CDC) (see Table 2). The West Nile infection
becomes symptomatic from about 2 to 14 days. A WNV fever maculopapular rash
general occurs on days 5 – 12 of the illness (Centers for Disease Control and Prevention,
2006; Ferguson, Gershman, LeBailly & Peterson, 2005; Kurane, 2005). Centers for
Disease Control and Prevention (2006) reports clinical features of West Nile Fever as
fever, headache, and fatigue with the occasional skin rash, swollen lymph glands and eye
pain. Approximately 25% of West Nile Fever patients develop vomiting or diarrhea and
25% develop a rash on the torso area of the body (Hayes & Gubler, 2006). Ferguson,
Gershman, LeBailly & Peterson (2005) documented 57% of 98 patients with WNV fever
developed a rash. In a 2003 Colorado study, ~60% of 2,947 cases of WNV fever reported

31
Table 2
Human West Nile virus disease cases by clinical syndrome, Georgia, United States,
2001-2012
Note. Presumptively viremic blood donors (PVD) are reported to CDC through state and local health
departments. A PVD is a person whose blood tested positive when screened for the presence of WNV.
Human disease cases reported to CDC as of May 14, 2013. *Not reported/data unavailable.
a rash development (Ferguson, Gershman, LeBailly & Peterson, 2005). In the instances
where 1 in 150 WNV infection progress to severe WNV neuroinvasive disease, resulted
in a fatality rate of 10%, and over 50% having long-term neurological squeal (Blitvich,
2008; Carson et al., 2006). Hayes and Gubler (2006) found 70-100% of WNV
neuroinvasive disease patients developed fevers, 50%-90% developed headaches, 30%–
70% developed vomiting, and 15%–35% developed diarrhea in addition to muscle aches,
weakness, back pain, stiff neck and nausea. Patients that present encephalitis may
Neuroinvasive
disease cases
Nonneuroinvasive
disease cases
Other
Clinical/
Unspecified
Total
cases
Human
fatalities
Presumptive
viremic
donors
2012 46 53 3 99 6 20
2011 14 8 * 22 3 4
2010 4 9 * 13 0 1
2009 4 0 0 4 2 2
2008 4 3 1 8 0 4
2007 23 24 3 50 1 3
2006 2 5 1 8 1 1
2005 9 7 4 20 2 4
2004 14 7 0 21 1 4
2003 27 21 2 50 4 9
2002 28 15 1 44 7 *
2001 6 0 0 6 1 *
Total 181 152 15 345 28 49

32
develop Parkinson type tremors and others might develop a clinical picture of sepsis or
chorioretinitis. When WNV infect motor neurons of the spine, flaccid paralysis occurs.
Flaccid paralysis can result in paralysis in limbs, respiratory muscle failure, or bladder
and bowel dysfunction. In rare cases, WNV patients have developed Guillain Barre
syndrome (Hayes et al., 2005).
Virology
WNV is an enveloped, spherical arbovirus about 50 nm in diameter (Hayes &
Gubler, 2006). The virus body contains a single stranded RNA that encodes protein, of
which binds to unknown cell receptors, resulting in a neutralized antibody response. The
effects of WNV on the proteins are the direct contributor to the level of its virulence. In
the severe cases of WNV infection, histopathology of patient tissues reveals neuron loss,
inflammation, and nodules with pathologic changes mainly in the brainstem, deep gray
nuclei and spinal cells (Hayes & Gubler, 2006). Muscle biopsies of WNV patients
displaying paralysis, revealed scattered muscle fibers and inflammation of small blood
vessels (Hayes & Gubler, 2006; Kurane, 2005). There are indicators that suggest when
WNV transmission begins it replicates in dendritic cells at the mosquito bite site and then
spreads to the lymph nodes and into the bloodstream (Hayes et al., 2005).
Transmission
WNV is naturally maintained in an enzootic transmission cycle. The transmission cycle
involves avians and vector mosquitoes. The mosquitoes serve as the amplification
vectors, of which primarily feeds on avian blood. Only the female mosquitoes take a

33
blood meal because the proteins are needed for the fertile eggs development during the
reproduction process. The female mosquito detects carbon monoxide in the air to locate
the victim for a blood meal and will usually feed on multiple hosts. The general feeding
habits of the mosquito (also considered the bridging vectors) help transmit WNV to
humans, equines and other vertebrates after feeding on viremic avians. Avians are the
natural reservoir host for WNV disease transmission, of which song birds serves as the
principle reservoir host. Humans, equines and other non-avian vertebrates are considered
incidental or dead-end hosts because the viremia cannot be reproduced enough to cause
WNV disease transmission. There is no evidence that WNV can be transmitted between
equines, humans and other non-avian vertebrates without the mosquito as the
amplification vector. WNV has successfully spread over large geographical areas because
of the dynamic capability to infect >300 avian species, >30 species of other non-avian
vertebrates, and >60 species of mosquitoes and arthropods (Blitvich, 2008).
WNV in Humans. Each year since 2001, an acute arboviral infection has
remained a reportable condition and continues to circulate in Georgia. Transmission of
WNV in Georgia increases during late summer months, with peak activity in August and
September. A total of 346 human cases of WNV were reported in Georgia between 2001-
2012, of which over 70% reported the onset of symptoms during the months of August
and September. The prevalence of WNV disease and death increases with age and is
slightly higher among males and those immunosuppressed organ transplant recipients.
There are several mechanisms for WNV disease transmission. Since 2002, WNV has

34
been known to transmit through blood transfusions, trans-placental, during breastfeeding,
organ transplantation, and laboratory-acquired infections (possibly through aerosol and
dialysis) (Hayes & Gubler, 2006).
WNV in Vector Mosquitoes. Determining the mosquito potential to spread
WNV, in addition to laboratory testing, includes evaluating its abundance, host-feeding
preference, other virus associations, and the incidence of positive species detection in
nature (Blitvich, 2008; Drake, 2009; Turell et al., 2005). Under laboratory conditions
Turell et al. (2005) evaluated various mosquitoes for their ability to transmit WNV. All
Culex species of mosquitoes where determined to be efficient enzootic or amplifying
vectors of WNV (Blitvich, 2008; Turell et al., 2005). In addition to the Culex species, 11
other mosquito genera were identified as carriers of WNV (Blitvich, 2008).
Habitats
The Culex species mosquitoes require a water source as found in sewage
treatment ponds, treatment plants, catch basins, sewage systems and drains rich in
organic matter for reproduction development (Calhoun et al., 2007; Chaves, Keogh,
Vazquez-Prokopec, & Kitron, 2009; Vazquez-Prokopec et al., 2010). The specific Culex
mosquitoes identified as WNV vectors for this research include Culex quinquefasciatus,
Culex erraticus, Culex restuans, and Culex spp. Culex quinquefasciatus mosquitoes
prefer breeding in rich organic water collections as stagnant drains, polluted water
collections (sewer overflows), and cesspools. The Culex erraticus species are usually
found in pools of organically rich water along tree roots that extend into the water. The

35
diverse Culex subspecies, Culex spp. enjoy various habitats that is usually associated with
highly polluted sewage water and stagnant organically rich surface water, to include
container sources and drainage systems. Culex restuans also utilizes a diverse habit for
larvae development, of which includes temporary ground water, road ditches, catch
basins, and sewage effluent. In addition, Culex quinquefasciatus and Culex restuans are
consistently found in high numbers in rain filled artificial containers, possibly placing
WNV positive mosquitoes in close contact with human hosts (Shaman, Day, & Stieglitz,
2005). Other WNV vectors of interest for this research include Ades Albopictus,
Ochlerotatus japonicas, Ochlerotatus triseriatus, and Uranotaenia sapphirina
mosquitoes. The Ades Albopictus are internationally known as the “Asian tiger
mosquito,” of which can usually be found in old tires with retained rainwater and in
shaded puddles of water surrounded by grass. The Ochlerotatus japonicas and
Ochlerotatus triseriatus mosquito species prefer larval habitats of rich organic water
sources in natural and artificial containers including catch basins, drainage ditches and
swamp areas. Uranotaenia sapphirina mosquitoes prefer larval habitats in permanent or
semi-permanent pools of water that support rich organic matter and floating vegetation.
Incidence
In 1937, the WNV was first identified in a woman from Uganda. From 1937 until
the 1990’s, the virus was not considered a major pathogen to humans. WNV is
transmitted from wild birds to humans, horses, and other animals by bites of infected
mosquitoes. The virus is maintained in a bird-mosquito-bird relationship and is

36
indigenous to Africa and the Middle Eastern countries (Gomez et al., 2008). In the 1950’s
Israel was the first country to report a human outbreak of WNV, followed by France and
South Africa (Blitvich, 2008). Since year 1994, the increase in human and equine positive
cases of WNV has grown dramatically in the Eastern Hemisphere (see Table 3).
Table 3
Geographical spread and major outbreaks of WNV in the Eastern Hemisphere, 1994 -
2004 Year Country Cases
1994 Algeria 50 human
1996
Romania
Morocco
393 human; 17 deaths
96 equine
1997 Tunisia 173 human
1998 Italy 14 equine
1999 Russia 318 human
2000 Israel
France
417 human; 76 equine
76 equine
2000-2001 Russia 120 human
2004 France 32 equine
Note. Data retrieved from Blitvich, B. J. (2008). Transmission dynamics and changing epidemiology of
WNV. Animal Health Research Reviews, 9(1), 71–86.
In 1999, WNV was detected in the Western hemisphere in North America causing
>16, 000 human disease cases and > 660 deaths (Hayes et al., 2005). The WNV strains in
the United States are mutations of stains from Israel, with 99.7% homology in DNA
sequencing. In July 2001, the first human case of WNV accrued in Georgia with a total of
6 cases of infection and 1 death. The next year, WNV accounted for 44 new positive
cases and 7 deaths in Georgia. Knowledge of mosquito species is important to

37
understanding the dynamics of WNV disease transmission. Culex quinquefasciatus is a
well document species of mosquito that is responsible for over 50% of the positive
mosquito pools reported in the United States (Haynes et al., 2005).
WNV in the United States. The Middle East originating strain of WNV was first
noticed in August of 1999 from a New York hospital diagnosis of encephalitis. This
WNV strain was associated with human and equine outbreaks, increase in disease
incidence, and increased avian deaths during human outbreaks (Georgia Department of
Public Health, 2003). Surveillance data collected during 2000 detected WNV in 12
Northeastern states (VT, NH, MA, RI, CT, NY, NJ, PA, MD, DC, VA, and NC)
indicating that the virus is endemic in the region. In year 2001, 64 of the 66 human cases
of WNV infection were persons diagnosed with WNV meningoencephalitis with a
median age of 68 years (range: 9-90 years) (O'Leary, Nasci, Campbell, & Marfin, 2002).
The same year, 919 mosquito pools with 27 species of mosquitoes tested positive for
WNV. The Culex pipiens and Culex restuans were 59% of the mosquito pools testing
positive and the Culex quinquefasciatus mosquito was noted as one of the enzootic vector
species. In 2002, there were a dramatic and unexpected increase of WNV infections in
the United States with 4156 human cases and 284 deaths. Eighty percent of the WNV
neuroinvasive cases occurred in the Midwestern states with a median age of 46 years
(range: 3 months - 91 years). The median age of WNV encephalitis cases was 64 years
(range: 1 month - 91 years). O’Leary et al. (2004) found a significant correlation of WNV
neuroinvasive illness and mortality to age (p = 0.02; p = 0.01) and being male (p < 0.001;
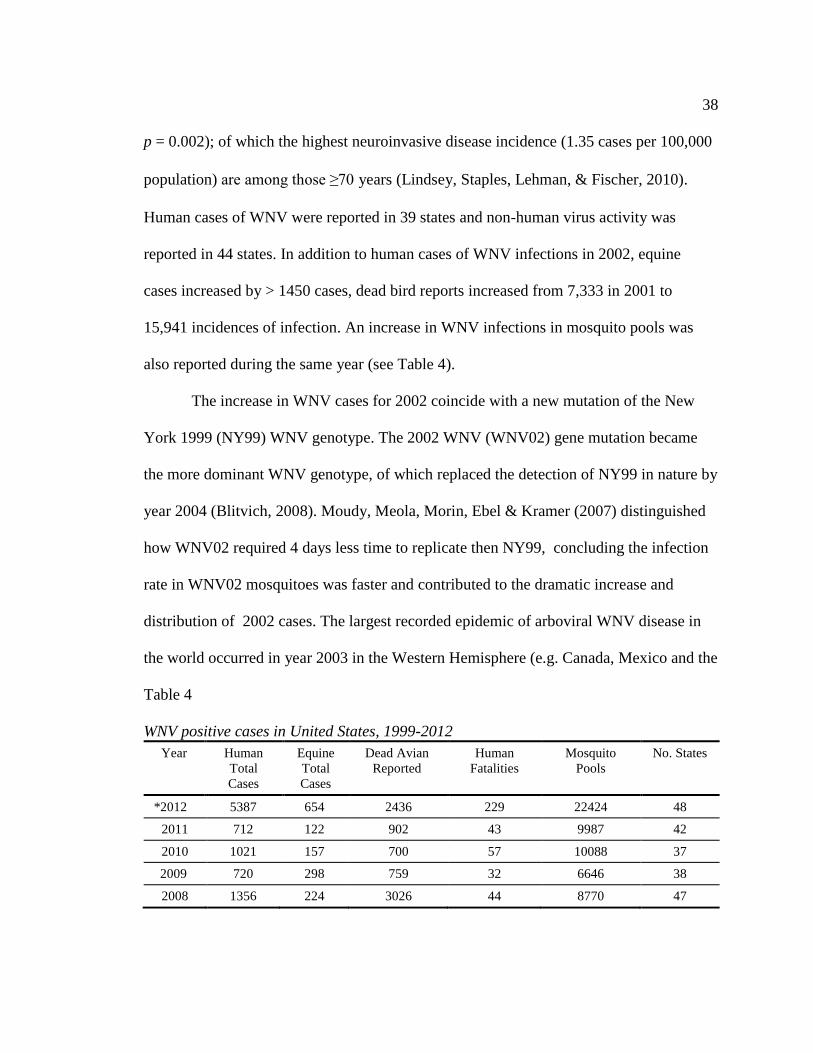
38
p = 0.002); of which the highest neuroinvasive disease incidence (1.35 cases per 100,000
population) are among those ≥years (Lindsey, Staples, Lehman, & Fischer, 2010).
Human cases of WNV were reported in 39 states and non-human virus activity was
reported in 44 states. In addition to human cases of WNV infections in 2002, equine
cases increased by > 1450 cases, dead bird reports increased from 7,333 in 2001 to
15,941 incidences of infection. An increase in WNV infections in mosquito pools was
also reported during the same year (see Table 4).
The increase in WNV cases for 2002 coincide with a new mutation of the New
York 1999 (NY99) WNV genotype. The 2002 WNV (WNV02) gene mutation became
the more dominant WNV genotype, of which replaced the detection of NY99 in nature by
year 2004 (Blitvich, 2008). Moudy, Meola, Morin, Ebel & Kramer (2007) distinguished
how WNV02 required 4 days less time to replicate then NY99, concluding the infection
rate in WNV02 mosquitoes was faster and contributed to the dramatic increase and
distribution of 2002 cases. The largest recorded epidemic of arboviral WNV disease in
the world occurred in year 2003 in the Western Hemisphere (e.g. Canada, Mexico and the
Table 4
WNV positive cases in United States, 1999-2012
Year Human
Total
Cases
Equine
Total
Cases
Dead Avian
Reported
Human
Fatalities
Mosquito
Pools
No. States
*2012 5387 654 2436 229 22424 48
2011 712 122 902 43 9987 42
2010 1021 157 700 57 10088 37
2009 720 298 759 32 6646 38
2008 1356 224 3026 44 8770 47

39
2007 3630 507 2182 98 8215 46
2006 4261 1121 4106 177 11898 48
2005 2744 1088 4761 119 10561 48
2004 2539 1406 7074 100 8263 47
2003 9862 5181 11613 264 7856 46
2002 4156 15257 15941 284 6604 44
2001 66 738 7333 9 919 27
2000 21 63 4305 2 515 12
1999 62 25 292 7 16 4
Note. Data retrieved from CDC WNV, Statistics, Surveillance, and Control Archive
http://www.cdc.gov/ncidod/dvbid/westnile/surv&control.htm *Reported to CDC as of December 11, 2012
United States of America) resulting in 9,858 human cases and 262 deaths (Blitvich,
2008;O’Leary et al., 2004). Since the United States WNV dramatic infection increase in
year 2002-2003, the human cases of WNV has maintained a constant fluctuation of
infection through 2012. The cases of WNV neuroinvasive disease peaked in year 2002 –
2003, then from year 2004 – 2007, followed by decreases in incidences for year 2008 –
2009 when compared to previous years. An exception to the trends of year 2004 – 2012
WNV cases occurred from 2010 – 2012, when the US experienced a sharp increase in
WNV infections in human, equine, avian, and mosquito pools (See Table 4). The human
cases in 2012 consisted of > 2,873 (51%) neuroinvasive diseases, 2,801 (49%) non-
neuroinvasive disease, and 229 fatalities. The 5,674 cases reported in 2012 is the highest
number of WNV disease cases reported to CDC since 2003. WNV activity was reported
from 48 states, of which 70% of positive cases were from Texas, Mississippi, South
Dakota, Michigan, California, Louisiana, Oklahoma, and Illinois and of those states
>35% were reported from Texas (Centers for Disease Control and Prevention, 2012).

40
WNV in Georgia. Detection of human WNV began with 6 cases and 1 fatality in
2001. A total of 345 human cases of WNV and 28 fatalities were reported from 2001-
2012 in Georgia. West Nile neurologic illness is experienced in approximately 54% of
cases and 42% are reported as non-neurologic cases. The median age of WNV illness is
54 years (range: 4 – 91) and the median age of fatal cases is 75 years. On average, 72%
of WNV illnesses in Georgia are reported in males. Since 2001, there have been 258
equine, 1583 dead avian, and 1144 mosquito pools of WNV positive cases reported in
Georgia. In addition to WNV, other mosquito-borne arboviruses reported in Georgia
include Eastern Equine Encephalitis (EEE) virus, LaCrosse (LAC) virus, and
occasionally the St. Louis Encephalitis (SLE) virus. West Nile virus is the most reported
arbovirus in Georgia and LAC is probably the most under reported because it causes only
mild clinical illness. SLE (closely related to WNV genotype) is rarely reported; and EEE
is a severe arbovirus because 30-50% of symptomatic cases lead to death. All acute
arboviruses are reportable in Georgia; and in example to 50 WNV cases in year 2007,
there were 4 domestic (3 LAC, and 1 EEE) and 12 internationally derived cases (11
Dengue, and 1 Chikungunya) reported among residents (Georgia Department of Public
Health, 2008). WNV positive cases dramatically spiked from 2001-2003 season and
cases generally decreased every year to 2009. From 2009-2012 the trend of West Nile
positive human cases in Georgia has increased each mosquito season, with some
variability in human fatality from 2009-2010 (see Table 5).

41
Table 5
WNV positive cases, Georgia, United States, 2001-2012
Year Human
Total Cases
Equine
Total Cases
Dead Avian
Reported
Mosquito
Pools
Human
Fatalities
2012 99 11 1 125 6
2011 22 3 1 394 3
2010 13 2 4 99 0
2009 4 3 1 24 2
2008 8 0 2 47 0
2007 50 0 12 75 1
2006 8 0 15 81 1
2005 20 1 23 67 2
2004 21 3 105 126 1
2003 50 60 479 106 4
2002 44 175 934 * 7
2001 6 * 6 * 1
Total 345 258 1583 1144 28
Note. Disease cases reported to CDC as of May 14, 2013. *Not reported/data unavailable.
WNV in the City of Atlanta, DeKalb and Fulton Counties. Before the 1999
outbreak of WNV in the United States, public health issues were routinely managed
within each county in Georgia. The City of Atlanta recognized the potential for the WNV
disease to spread to the Southeast. Early in year 2000, five health districts (including the
counties of Clayton, Cobb, DeKalb, Douglas, Fulton, Gwinnett, Newton, and Rockdale)
in metro Atlanta and the state health department devised a response plan to allow a
unified approach on WNV public health issues for metro Atlanta. Since 2001 onset of
WNV in Georgia to 2012, DeKalb County has reported 28 human cases and Fulton
County has reported 56 human cases. In 2001, five counties in Georgia reported 6 cases
of WNV illness in humans. Fulton County was one of the five Georgia counties to report

42
a positive WNV case. The following year 20 counties in Georgia reported 44 human
WNV positive cases, of those, Fulton County reported 8 cases and DeKalb County
reported 5 cases. The first case in 2002 was reported by Muscogee County but one of the
last cases reported was in Fulton County. Ending the 2005 year for Georgia human WNV
cases, Fulton County reported 9 cases (largest for the state), followed by 4 cases in
DeKalb County. Since the onset of positive WNV cases in Georgia, both Fulton and
DeKalb Counties experienced no reports of human cases in 2009, of which is when
September floods devastated parts of the counties. Fulton County sustained the highest
property impact of any county in Georgia from the September 2009 floods totaling over
$4.5 million. DeKalb County sustained the fourth highest property impact for the state
with $762 thousand in damages. Since the floods of 2009 the cases of human and
mosquito pool positive case has increased but with fluctuations from year to year. In
parallel to the rise of 2012 WNV cases in the State of Georgia, DeKalb and Fulton
Counties have experienced an increase in human cases since 2010.
In addition to human cases, the adult mosquito surveillance from year 2001-2012
has maintained a yearly prominence when compared to bird and horse surveillance of
WNV disease cases (see Table 6). During DeKalb County 2010 mosquito season (May –
October) 26 pools tested positive. The Georgia Division of Public Health identified six
Fulton County communities before August 2011, as having positive WNV mosquito
pools. Locations of the sites were identified as 1) Tanyard Creek CSO (Atlanta), 2)
Frankie Allen Park (Atlanta), 3) Grove Park (Atlanta), 4) Ronald Bridges Park (College

43
Park), 5) Burdett Park (College Park), and 6) Wills Park (Alpharetta), of which each site
reported at least 1 positive mosquito pool. In 2012, DeKalb County Board of Health
reported 34 pools of WNV positive mosquitoes with a month-and-a-half remaining in the
Table 6
WNV positive cases, DeKalb and Fulton County Georgia, United States, 2001-2012 Year Human Total Cases Mosquito Pools Dead Avian Reported
DeKalb Fulton DeKalb Fulton DeKalb Fulton
2012 7 9 57 7 0 0
2011 3 1 89 34 1 0
2010 5 1 26 67 2 0
2009 0 0 5 8 0 0
2008 0 1 26 22 1 0
2007 4 9 25 8 0 2
2006 0 2 52 18 5 0
2005 3 8 23 37 8 1
2004 1 8 13 63 32 12
2003 0 8 9 19 46 21
2002 5 8 12 70 124 248
2001 0 1 3 32 93 58
Total 28 56 340 385 312 342
Note. Reported to CDC as of May 14, 2013.
Georgia WNV Adult Mosquito Surveillance
Georgia health departments conduct surveillances on avian mortality, equine
health, and mosquito pools for positive cases of WNV. Accounting for avian mortality is
a sensitive method to determine the geographical spread and to predict the risk of human
infection. The equine surveillance is a valuable method to indicate West Nile viral
activity. Mosquito surveillance is used to detect the potential presence of WNV in vectors

44
and to guide mosquito control programs. Although mosquito and vector control agencies
regularly collect mosquito population surveillance data, the data are usually only applied
to short-term questions and are soon put into storage. However, taken as a whole,
mosquito surveillance records compiled across Georgia and applied to human risks are an
irreplaceable and important scientific resource that should receive more attention. One of
the most important activities performed by mosquito and vector control agencies is
mosquito population surveillance. Mosquito population surveillance data are the written
results of adult or larval mosquito sampling, recorded and preserved on paper forms or
entered into electronic spreadsheets or databases. Using an integrated analysis of long-
term mosquito population surveillance data could reveal patterns of invading exotic
mosquito species or patterns of change of mosquito communities, or to help evaluate
vulnerabilities of different regions of the state to emerging mosquito-borne viral threats.
Culex quinquefasciatus as Primary Vector of WNV in Georgia
Turell et al. (2001) identified the Culex quinquefasciatus as the main vector of
WNV transmission for the southeastern United States. In 2005, 63 of 66 WNV positive
mosquito pools contained Culex quinquefasciatus in Georgia (Calhoun et al., 2007).
Species of WNV carrying mosquitoes found in Georgia include Ades Albopictus, Culex
spp., Culex erraticus, Culex nigripalpus, Culex restuans, Ochlerotatus japonicas,
Ochlerotatus triseriatus, and Uranotaenia sapphirina. During Fulton County 2005
mosquito surveillance season, WNV positive pools peaked in the months of August,
September, and October. The positive mosquito pools collected by Fulton County in 2005
45
were comprised of 96% Culex quinquefasciatus, 3% Culex restuans, and 1% Culex
nigripalpus. The Culex species has been documented as a primary bird feeder with
tendencies to feed on mammals, and is involved in WNV amplification. Blitvich (2008)
identified an Arizona study that found 50% of engorged Culex quinquefasciatus feed on
humans, 32% on birds, and 12% on dogs. Another study in Louisiana found 69% of the
Culex quinquefasciatus feed on dogs, 16% on birds, and 11% on humans (Blitvich,
2008).
On average, Georgia has experienced hot and humid summers with temperatures
near 90°F (National Climatic Data Center, 2012). The metro Atlanta area had an average
temperature of 88°F High/70°F Low with 4.3 inches average rain in August and 73°F
High/53°F Low with 3.2 inches average rain in October (Georgia Department of Natural
Resources, 2011). Laboratory testing of several Culex species have demonstrated an
increase in virulence at (80-84°F) higher temperatures then (54-70°F) lower temperatures
(Blitvich, 2008; Reisen et al., 2006). The Culex quinquefasciatus species has a high (83-
90%) survival rate in temperatures ranging from 68-86°F, of which the warm Georgia
months and mild winters could provide an ideal environment for survival (Rueda, Patel,
Axtell, & Stunner, 1990; Strickman, 1988). The rainfall in Georgia averages 45 inches
per year in central Georgia to approximately 75 inches in the northeastern areas (National
Climatic Data Center, 2012). Metropolitan Atlanta area receives an average of 47.2
inches of precipitation a year with the wetter month being March and October as the drier
month. Culex quinquefasciatus is an adept urban breeder using various freshwater

46
sources as provided by precipitation collecting in artificial containers, tires, planting pots,
abandoned swimming pools and standing water puddles. The Culex quinquefasciatus
mosquito flight distance ranges from 0.16 - 1.98 km with a mean flight distance of 1.33
km (Ciota, 2012).
The Culex quinquefasciatus females fly during the late evening hours to nutrient-
rich standing water to lay eggs. The eggs develop to the larvae stage, of which feeds on
the biotic material in the water, requires five to eight days to develop. The larvae develop
into the pupae stage followed by the final stage to adult mosquitoes. Culex species
require rich organic water sources and is found (in high larvae numbers) during mosquito
larvae surveillance, in retention ponds, storm drains, catch basins, and wastewater
systems (Calhoun et al., 2007; Chaves et al., 2009; Reisen et al., 2008; Vazquez-
Prokopec et al., 2010).
DeKalb County
Georgia is divided into 159 counties and DeKalb is located in the central
northwest of the state in the Piedmont region. DeKalb is the third-most-populated county
in the state since 2010 Census, falling behind Fulton and Gwinnett Counties (U.S.
Census, 2012). DeKalb is primarily a suburban city, ranking second as the most affluent
county with an African American majority. A recent trend of incorporated communities
is growing in North DeKalb, of which Decatur and Chamblee are the largest cities in the
county. Of the county total square mileage, 99% is land and 1% is water. The county is
mainly crossed by South River, Nancy Creek, Snapfinger Creek and Peachtree Creek.

47
The tree canopy in DeKalb County has reduced from 51% to 47% total tree canopy
between year 1991 and 2005 while impervious surfaces has increased by 62% from 14%
to 21% (Georgia Department of Natural Resources, 2011).
West Nile mosquito surveillance program. The DeKalb County Board of
Health has an integrated approach to mosquito control. In collaboration with county and
state agencies, the Board of Health conducts surveys for tracking the mosquito population
to eliminate breeding sites and control the WNV vector. Within the DeKalb County
Board of Health, the Division of Environmental Health routinely traps mosquitoes
throughout the county and tests them for WNV. The trapping of mosquitoes is done by
CDC Gravid Trap or CDC Miniature Light Traps. The CDC Gravid Trap was designed
for the selective capture of gravid Culex mosquitoes. By limiting captures to this class of
females, problems associated with calculation of minimum virus infection rates are
reduced. CDC Miniature Light Trap data are also a source of reports to supervisors and
the public concerning the extent of the problem or the results of control operations. In
addition to testing, the Division of Environmental Health places larvicides in public
sources of standing water throughout the county to disrupt the breeding cycle of
mosquitoes.
The Board of Health also promotes the education of the public in mosquito
control and personal protection as preventive measure to stop mosquito-borne diseases.
DeKalb County Board of Health provides information to the public on ways to help
protect themselves, their homes and their communities. The public is provided WNV

48
activity updates in the form of arbovirus program updates, maps of WNV activity,
newsletters, WNV brochure, mosquito prevention checklist, frequently asked questions,
and how to choose an insect repellent. The county provides community outreach
including coordinated efforts with organizations in high-risk area. In areas of positive
WNV activity, door-to-door educational efforts are implemented. The Division of
Environmental Health can also provide, upon request, an assessment of private property
to identify potential breeding grounds and information on risk reduction.
Fulton County
As a neighbor to DeKalb County, Fulton is located in the central northwest of
Georgia in the Piedmont region. Fulton has a total of 534.61 square miles of which
528.66 square miles (98.89%) is land and 5.95 square miles (1.11%) is water. According
to 2010 U.S. Census, Fulton has the largest population of any county in Georgia, of
which 10% of the state population resides. Fulton has 949,599 people (2011 Census
population estimate), making the county the most populous in the metro Atlanta area, but
DeKalb County has the highest population density. North Fulton County was a thriving
agricultural area but known today for the upscale living in the incorporated cities as
Alpharetta, Roswell and Sandy Springs. The tree canopy for Fulton County has decreased
by 51% from 1991-2005.
West Nile Mosquito Surveillance Program. The Fulton County Department of
Health & Wellness, formerly the Fulton County Health Department, was established in
1952. Currently, the City of Atlanta Health Department is merged with Fulton County

49
Department of Health & Wellness. The merge of Atlanta health departments placed the
city health services under the jurisdiction of Fulton County Government. Fulton County
Department of Health & Wellness is the only public health agency in Georgia that is
under the auspices of local government. With a workforce of more than 700 health care
professionals and support staff, the Fulton County Department of Health & Wellness is
the largest county health department in the State of Georgia, covering a 535 square mile
area encompassing approximately 88% of the City of Atlanta (Fulton County Georgia
website, 2012). Included in the population are richly diverse communities of color,
ethnicity and class, and a significantly large uninsured population. The department has 8
health centers, some within the City of Atlanta and others in the surrounding areas of
Fulton County. Fulton County Department of Health and Wellness is committed to the
protection of Fulton County Citizens from the WNV by contracting the mosquito control
program to Clarke, a global environmental products and services company (Lima, Wyatt
& Saunders, 2012). The Clarke team, working with Fulton County, develops and delivers
mosquito control and aquatic services to help prevent disease, control nuisances and
create healthy waterways (Lima, Wyatt & Saunders, 2012).
City of Atlanta
The Atlanta metropolitan area has a population of over 5 million people, ranking
ninth largest metropolitan area in the United States. Serving as the Southeastern
transportation gateway, Atlanta supports primary highways, railroads, and the busiest
airport in the world. Atlanta boasts a gross domestic product of $270 billion, placing 15th

50
among cities and sixth in the nation for economically prosperous places. Atlanta
landscape consists of a succession of hills and dense tree canopies, within the boundaries
of 132.4 square miles (131.7 square miles of land and 0.7 square miles of water). Atlanta
rests at the foothills of the Appalachian Mountains and is divided along the Eastern
Continental Divide, of which the south and east side of the city water flows into the
Atlantic Ocean and the north west side flows into the Gulf of Mexico. The Chattahoochee
River is a main feature of metro Atlanta northwest edge and South River runs through the
population center of metro Atlanta into Lake Jackson. Since 1996 hosting of the Olympic
Games, Atlanta has dramatically altered neighborhoods, demographics, politics and
culture. This growth brought massive changes to the natural landscape through land
disturbance activities that leveled and graded forests and fields. Every day in metro
Atlanta, 54 acres of trees are destroyed, while another 28 acres are covered with hard
impervious surfaces like roads, rooftops and parking lots (Georgia Forestry Commission,
2005). According the United States Census (2010) most the fastest growing metropolitan
Atlanta areas are centrally located: Downtown (25.9%), Midtown, West Midtown, and
close-in eastside neighborhoods (18.4%). Atlanta Southwest area is quickly growing by
45.8%, while Northwest (avg. -24.1%) and Southeast Atlanta (-20.5%) populations are
decreasing.
Wastewater Management
Urban and suburban areas as metropolitan Atlanta, people and businesses reside
closer together. The increased population density in urban environments adds to the

51
demands of wastewater treatment facilities. The local hydrology cycle with wastewater
flow of urban catchment and sewer systems can be divided into four areas: 1) surface
runoff, 2) sewer system flow, 3) movement of pollutants within sewer system, and 4)
processes within the sewer system. Precipitation on urban areas that is not absorbed in the
soil or evaporated, becomes runoff into streams or drainage basins. Urban development
increases runoff due to the amount of impervious surfaces, of which allows no water to
infiltrate the earth. Increased impervious surfaces cause precipitation to be diverted
directly to storm drains. Urbanization is a growing concern for water resources and
nonpoint-source pollutants entering the streams. The wastewater system flow starts with
drains and sewage outlets from individual homes and buildings. A sewer system is
generally gravity-powered (as septic systems) and flows into a sewer main pipe. The
sewer main is usually between 3 to 5 feet in diameter and has periodic vertical manhole
pipes leading from the sewer main to the surface. The manhole is used as access for pipe
maintenance. The sewer mains flow into progressively larger pipes until reaching the
wastewater treatment plant, of which is usually located at a lower elevation, to facilitate
gravity powered movement of wastewater. When gravity power is not enough for
wastewater progression, a grinder-pump or lift station would be used to move the
wastewater flow. The effectiveness of wastewater treatment plants are commonly graded
on different scales but usually the indicators include, pH, bio-chemical oxygen demand
(BOD), dissolved oxygen, suspended solids, total phosphorous and nitrogen, chlorine,

52
and coliform bacteria count. The indicators are of concern when urban wastewater
discharge levels range from 10 million to 100 million gallons per day.
DeKalb County Wastewater Management
DeKalb County Department of Watershed Management has five internal divisions
with approximately 670 employees. The county watershed management had estimated
> 5,000 miles of pipe for water distribution and wastewater collection systems with more
than $5 Billion worth of assets. The major water facilities in the county are Scott Candler
Filter Plant, Pole Bridge Advanced Wastewater Treatment Plant, Snapfinger Advanced
Wastewater Treatment Plant, and John A. Walker Memorial Raw Water Pumping
Station. The water source for all 750,000 people served by the DeKalb County
Department of Watershed Management is supplied from the Chattahoochee River and
treated by the Scott Candler Water Treatment Plant. Source Water Assessments are
completed by the county to identify potential sources of pollution upstream from the
water intake. The John A. Walker Memorial pumping station in Norcross, is the largest
municipal raw water pumping station in the Southeast with a capacity of 300 million
gallons per day and is controlled by Scott Candler Water Treatment Plant. The county
wastewater system consist of an estimated 2,600 miles of sanitary sewers, 55,000
manholes, and 66 wastewater lift stations. Pole Bridge and Snapfinger Advanced
Wastewater Treatment Plants are located on the South River, treating approximately two-
thirds of the county wastewater, while the City of Atlanta, R. M. Clayton Water
Reclamation Center is located on the Chattahoochee River, treating the remaining north

53
DeKalb County wastewater areas. Due to the growing demand, DeKalb County has
proposed that Snapfinger Creek capacity expand to 54 MGD and Pole Creek Bridge
expand to a 39 MGD capacity wastewater treatment plant. The wastewater treatment
plants and miles of sewer pipes in DeKalb County are in need of significant repairs and
upgrades (DeKalb County, 2012). Approximately 16% of the county wastewater pipes
are 50 years old or older, 48% are 25–50 years old, and 36% are 25 years old or less
(DeKalb County, 2012). In 2009, DeKalb County recorded 135 sewer spills, 128 sewer
spills in 2010, 187 sewer spills in 2011, and the sewer spills continued into 2012
(Georgia Department of Environmental Protection, 2012). Extensive work is in progress
to address aged conditions, satisfy federal and state regulations for wastewater, and plan
for future demands due to growth. Dilapidated sewer systems are point sources for
contaminating waterways and can be overwhelmed by heavy rain. Procedures consistent
with Georgia Water Quality Control, the county wastewater facilities provide timely
notice to the Georgia Department of Environmental Protection (GEPD) of the occurrence
of sewer systems overflows. Once the county becomes aware of a spill, a verbal notice
must be reported within 24 hours followed by a written notice within 5 days. The written
spills notice includes: (a) a description and cause(s); (b) the location; (c) the date and
times the spill was reported and stopped; (d) the estimated volume released; (e) if waters
were affected or potentially affected; (f) results of spill on wildlife; and (g) actions taken
to repair and resolve the cause of the spill (U.S.A. v. DeKalb County, 2011). If the cause

54
of a spill requires over 60 days to be repaired a written notice must be sent to the state
environmental protection department.
Fulton County Wastewater Management
Fulton County Water Services Division is comprised of two sections, Technical
Services and Operations and Maintenance. The technical services section is responsible
for managing areas concerning capital improvement projects, geographical information
systems, design and construction engineering of wastewater systems, and general project
management. The operations and maintenance section manages wastewater collection
services to unincorporated and incorporated areas of north Fulton County. Potable and
reuse water is also distributed to unincorporated areas of south Fulton County under
operations and maintenance section management. In addition to the operations and
maintenance section, the county Water Services Division also provides a public education
and outreach program.
Fulton County has three wastewater treatment facilities that discharges treated
sewage into the Chattahoochee River. Historically, permit violations has resulted from
these facilities operational and capacity problems. The county also experienced systemic
problems with sanitary sewer overflows from clogged and broken pipes. In 2009, Fulton
County reported 94 SSO events equaling > 2.8MGD of raw sewage spillage, of which
five SSO events spilled an unknown volume and one event resulted in fish kill. In the
following years from 2010-2012, the county responded to over 157 SSO events resulting
in > 4.9 MGD of raw sewage spills. The county Public Works Department has developed

55
5 year plans to increase wastewater treatment capacity and repair 2,000 miles of sewer
lines that carry sewage from residential, commercial and industrial users to the
wastewater facilities.
Fulton wastewater systems consist of 30 pump stations and 5 Water Reclamation
Facilities (WRF) that serviced over 300,000 people and treated approximately 42.1 MGD
of sewage in 2011, according to county records. The length of Fulton County is more
than 70 miles and is generally referenced as North Fulton and South Fulton County for
municipal purposes. North Fulton County includes the cities of Alpharetta, Johns Creek,
Milton, Mountain Park, Roswell, Sandy Springs and Woodstock. South Fulton County
consists of the cities of Chattahoochee Hills, College Park, East Point, Fairburn,
Hapeville, Palmetto and Union City. Three of the county water reclamation facilities are
located in north Fulton, of which are Big Creek, Johns Creek, and Little River. Big Creek
WRF, located in Roswell, leads as North Fulton County largest service and total flow
handler of wastewater treatment facilities. Johns Creek Environmental Campus, also
located in Roswell, is a 43-acre state-of-the-art wastewater treatment facility that replaced
Johns Creek WRF in 2010. Functioning since 1978 in Woodstock, the Little River WRF
is positioned for a plant upgrade and increased MGD capacity starting in 2013. The
remaining two county water reclamation facilities are located in south Fulton, of which
are Camp Creek WRF and Little Bear WRF. Camp Creek WRF services wastewater from
residential, commercial, and industrial users; whereas, Little Bear WRF processes
wastewater from a south Fulton County subdivision.

56
City of Atlanta Wastewater Management
City of Atlanta Department of Watershed Management was started in 2002,
placing drinking water, wastewater collection and treatment, and stormwater
management under one management system. The city Department of Watershed
Management is managed from three administrative locations on 14th Street, Marietta
Street, and Trinity Avenue in the downtown Atlanta area. Facility and system
maintenance is provided from eight locations throughout the metro Atlanta area. Atlanta
water processing is facilitated by three water treatment plants, six permitted combined
sewer overflow facilities, two CSO Area Regulators, 16 pumping stations, and 2,126
miles of sewer system piping. Of the 2,126 miles of Atlanta sewer system piping, 86
miles are of combined sewers, 1,610 miles of separate sanitary sewers, 430 miles of
service laterals, and 8 miles of force mains.
Historically, Atlanta contained four (West Area) combined sewer overflow
facilities that discharged treated and untreated sewage into the Chattahoochee River
Basin. Currently, three (West Area) CSO facilities continue treatment and discharge in
the Chattahoochee River Basin, and one CSO facility (Greensferry CSO) operates as a
stormwater management facility. Atlanta contain the three (East Area) combined sewer
overflow facilities that discharged treated and untreated sewage into the Ocmulgee River
Basin. As of 2012, one of the three (East Area) Ocmulgee basin CSO facilities (McDaniel
Street CSO) operates as a stormwater management facility. From the late 1900’s, permit
violations has resulted from these facilities operational and capacity problems. The city

57
has experienced systemic problems with combined sewer and sanitary sewer overflows
from stormwater, clogged or broken pipes.
In year 2001, the city submitted the CSO Remedial Measures Report to the U.S.
Environmental Protection Agency and the Georgia Environmental Protection Division.
The CSO Remedial Measure approval, implemented a plan to capture stormwater and
sewage volumes in deep tunnels followed by movement to a separate treatment system
for removal of pollutants and chlorine disinfection before discharging into the
Chattahoochee and Ocmulgee River Basins. The purpose of the CSO Abatement
Improvement Plan was to minimize direct overflows by separating the combined sewer
system into separate sanitary sewers and stormwater pipes. The combined sewers of
Greensferry and McDaniel CSO systems were separated. As a result, the Greensferry and
McDaniel CSO facilities were converted to stormwater facilities, of which reduced the
permitted six CSO points for redirected wastewater overflow to only four overflow
points. The change also reduced flow to the Custer Avenue and Intrenchment Creek CSO
systems. The constructed West Atlanta tunnel stores and convey overflows from the west
area of Atlanta to a new dedicated treatment facility near R.M. Clayton WRC. The
constructed East CSO tunnel direct flows from the east Atlanta area to Custer
Avenue/Intrenchment Creek CSO facility for treatment and is discharged in DeKalb
County’s creeks to the Ocmulgee River Basin. The stormwater runoff from the central
part of downtown Atlanta, Midtown Atlanta, the Georgia Tech and Georgia Dome areas,

58
and parts of east Atlanta are also directed and treated from the West and East CSO
tunnels.
The City of Atlanta have seven CSO facilities, but currently operates six
permitted CSO facilities (includes Intrenchment Creek CSO), of which four facilities
have overflow points. During heavy rains, storm flows often exceed the capacity of the
combined sewer system, of which the combined flow is diverted to the corresponding
CSO control facilities. When wet weather exceeds the treatment capacity of the CSO
control facilities, screened and disinfected flows are discharged to a nearby stream or
creek. The West CSO facilities consist of Clear Creek CSO, North Avenue CSO, Tanyard
Creek CSO, and Greensferry CSO. The East CSO facilities consists of Intrenchment
Creek CSO, Custer Avenue CSO, and McDaniel Street CSO. The Greensferry CSO
facility and McDaniel CSO facility use were changed to stormwater management
facilities upon completing the CSO Abatement Improvement Plan. From the city CSO
Remedial Measure, the 6 permitted overflow points are reduced to only 4 overflow points
with the remaining CSO facilities (Clear Creek, Intrenchment Creek, North Avenue, and
Tanyard Creek). About 10% of the wastewater collection system remains combined; the
remainder of the wastewater systems are separated. Atlanta wastewater system functions
regionally, collecting and treating wastewater from 1.2 million people daily in the
counties of Clayton, DeKalb and Fulton; including the cities of College Park, East Point,
and Hapeville. With a maximum city monthly treatment capacity of 220 MGD, Atlanta
residents generate 55% of wastewater treated. The City of Atlanta wastewater is treated at

59
the Intrenchment Creek WRC, the R.M. Clayton WRC, the South River WRC, and the
Utoy Creek WRC.
Clear Creek Combined Sewer Overflow Facility. Constructed in1996, the
Clear Creek CSO Treatment Facility is one of the West Area CSO facilities. Residing on
3,086 acres and having the capacity to process 5,060 MGD, the Clear Creek CSO is the
largest combined sewershed in the area. Clear Creek CSO services the Downtown
Business District of Atlanta and Midtown Atlanta. When dry weather flow is less than 40
MGD the combined flow is routed to the Peachtree interceptor, then the flow is projected
to the R. M. Clayton WRC for treatment. Dry weather water flows greater than 40 MGD
and wet weather water flows are treated by Clear Creek CSO facility before discharged to
an open channel leading to Clear Creek. The current wastewater treatment by Clear Creek
CSO consists of coarse screening, fine screening and sodium hypochlorite disinfection.
The sodium hypochlorite injects are administered before the wastewater is received at the
Clear Creek CSO facility to minimize chlorine residue before discharge.
Intrenchment Creek Combined Sewer Overflow Facility. Since 1983,
Intrenchment Creek CSO Treatment Facility with Intrenchment Creek CSO Storage
Tunnel became a part of the East Area CSO network, of which previously included
Boulevard and Confederate CSO Regulator Facilities, the McDaniel CSO facility, and the
Custer CSO facility. The Intrenchment Creek CSO Storage Tunnel captures and stores
the first 30 to 34 million gallons of wet weather flow, then a 20 MGD dewatering pump
station diverts the stored flow to the Intrenchment Creek CSO Treatment Facility for

60
physical and chemical treatment. Dry weather flow is routed from Intrenchment Creek
CSO Treatment Facility to the Intrenchment Creek WRC of additional treatment. Wet
weather flow to the treatment facility is screened for solids and disinfected before
discharged to Intrenchment Creek.
North Avenue Combined Sewer Overflow Facility. Constructed in 1994,
North Avenue CSO Treatment Facility is located on a secluded city property area in
northwest Atlanta. The treatment facility serves a 1,600 west area combined watershed
with the overflow capacity to handle 2,600 MGD. The North Avenue facility wastewater
treatment consists of course and fine screening with sodium hypochlorite disinfection.
Dry weather flow is routed to the R. M. Clayton WRC or Utoy Creek WRC for treatment.
Wet weather flow is treated by North Avenue CSO Treatment Facility then released to a
200 yard concrete culvert for discharge to Proctor Creek.
Tanyard Creek Combined Sewer Overflow Facility. Constructed in 1994,
Tanyard Creek is located on a small lot near a residential area. The treatment facility
serves a west area combined watershed of 1,955 acres with the overflow capacity to
handle 3,600 MGD. The North Avenue facility wastewater treatment consists of course
and fine screening with sodium hypochlorite disinfection. Dry weather flow is routed to a
48-inch Orme Street interceptor that leads to R. M. Clayton WRC for treatment. Wet
weather flow is treated by Tanyard Creek CSO Treatment Facility and released through a
0.8 mile concrete discharge tunnel leading to Tanyard Creek.

61
Mosquito Density Association with Wastewater Systems Overflows
The spillage of sewers waters would serve as a form of oviposition medium that
attract female mosquitoes for reproductive purposes, of which provides an opportunity of
increased mosquito populations. Sewage is a major source of excess nitrogen, high
organic content, eutrophication, algae deplete oxygen, of which natural enemies such as
fish cannot survive, and mosquito larvae thrive in anaerobic conditions. Local vector
mosquitoes require rich organic water sources and only need 5-8 days to develop from
egg to adult mosquito. Combining drought conditions, a source of oviposition medium
(SSO or CSO), and an increase in mosquito populations could provide conditions to
support increased WNV infections in humans. Effective maintenance and monitoring of
wastewater systems is essential to mitigating mosquito populations and reducing the
health risks of mosquito-borne diseases in humans. The need for effective wastewater
systems preventive design and maintenance plans is evident from recent research
concerning combined sewage systems and overflow.
Background information was collected on the potential combined sewer systems
hosting vector-borne disease in Georgia. From a Georgia Water Resources Conference,
Kelly, Mead, McNelly, Burkot, and Kerce (2007) discussed three mosquito studies
inquiries, concerning combined sewer systems within the metropolitan-Atlanta area. The
first research approach was a longitudinal study of mosquito ecology in Tanyard Creek
(receives wastewater from Atlanta combined sewage system). The objectives of the study
were to (a) identify mosquito types around the creek; (b) identify increased breeding

62
conditions; and (c) identify factors that regulate mosquito populations. The second
research approach was to identify combined sewer systems infrastructure that provides
overwintering of Culex mosquitoes. The research objectives consisted of determining the
seasonal abundance of the mosquito in the areas of the combined sewer systems and
combined sewer overflows. The final research approach was to determine if the large
abundance of mosquitoes breeding in manmade environments as combined sewer
systems and wetlands are the same mosquitoes transmitting the WNV. The relationships
between Culex quinquefasciatus mosquitoes and WNV association to CSS and CSO
areas were in the initial stages of understanding. A greater understanding of the impact of
CSS and CSO areas to mosquito infestation could translate to an improved wastewater
management plan for vector control and the potential of reducing human WNV risks.
The same year as the Georgia Water Resources Conference mosquito research
inquires, Calhoun et al. (2007) research, Combined Sewage Overflows (CSO)are major
urban breeding sites for Culex quinquefasciatus in Atlanta, Georgia was published in the
American Journal of Tropical Medicine & Hygiene. The purpose of the study was to
define the association of CSO with WNV vector amplification in Atlanta, Georgia. The
objectives include (a) identify mosquito species breeding in combined sewer overflows;
(b) identify the environmental factors conducive to mosquito amplification; and (c) what
are the regulating factors on the mosquito population (Calhoun et al., 2007). The study
used eight collection points along a 3.4 km section of Tanyard Creek CSO facility at the
geographical intersection of Peachtree Creek and Bobby Jones Golf Course. Garmin GPS

63
units mapped the 8 collection sites, of which each site survey consisted of 25 water dips
for mosquito larvae counts. Mosquito egg rafts and pupae were also collected and
counted. Geometric means was calculated and regression was used to compare the mean
count per site and environmental characteristics. Further statistical analysis include a 2-
parameter exponential model to compare percent positive collections and average volume
release from the CSO. The study of CSO release events found that when > 10
kilogallons/minute effluent is release few mosquito larvae is collected and when effluent
release increases to > 15 kilogallons/minute almost all mosquito larvae was eliminated.
Only 5-10 days after the CSO effluent release did the mosquito larvae population
increase significantly. The study found Culex quinquefasciatus followed by Culex
restuans were the dominate species in pupae, but the mosquito life stage population
density varied based on the position and water quality along the creek. Calhoun et al.
(2007) study identified the potential for CSO areas to support a dense mosquito
population growth based on water-flow patterns. Study discussion mentions with drought,
in addition to CSO conditions in Atlanta, the streams would serve as ideal mosquito
breeding areas (infrequent flooding and high organic content). Chaves et al. (2009) study
further associates CSO with enhancing oviposition of Culex quinquefasciatus in urban
areas; of which provide insights on the factors of the female mosquito choosing breeding
habitats.
Since the Calhoun et al. (2007) study, Atlanta completed a CSO remediation
system (an underground reservoir) in 2008, to lower pollution of the Chattahoochee River

64
with < 10 wastewater releases per year and designed to reduce the size and the number of
CSO systems. The change to a CSO remediation system of less wastewater release should
reduce the pollution levels of the Chattahoochee River; but in contrast could serve as the
main conduit for intensified mosquito populations along the combined sewer overflows.
Further evaluations of hydrologic drought association to wastewater streams and WNV
vector amplification are needed to evaluate interventions for controlling disease risks.
Vazquez-Prokopec et al. (2010) study goal was to describe and quantify CSO
association to risk increases of WNV infection. The spatial distribution of WNV infection
in Culex quinquefasciatus mosquitoes, humans, and specific birds were assessed to the
relationship between WNV infection and proximity to combined sewer overflows in
Atlanta, Georgia. Using surveillance data from 2001-2007, Vazquez-Prokopec et al.
(2010) conducted a spatial analysis integrating the geographic coordinates of each CSO
facility and associated streams to estimate the risk factor associations of proximity of
combined sewer overflows, catch basins, land cover, median household income, and
housing characteristics. The analysis associated significantly higher rates of WNV
infection in mosquitoes and birds near combined sewer overflows than those near non-
CSO affected creeks. A higher rate of human infection was best predicted to those
residing in a low-income neighborhood, with greater tree canopy density, in older homes
built in the 1950’s to1960’s, and near combined sewer overflows (Vazquez-Prokopec et
al., 2010). In contrast, residents in the wealthy northern Fulton County area did not
experience an increase in WNV cases, despite the proximity to two combined sewer

65
overflow points (Vazquez-Prokopec et al., 2010). WNV infections are endemic to the
Atlanta area but the mechanisms to explain the human risk factors are evasive and
unclear. The evaluation of Vazquez-Prokopec et al. (2010) data consisted of six years
before the metropolitan-Atlanta area completed the CSO remediation system with an
underground reservoir. During 2001-2007 the mosquito data between the encompassing
DeKalb and Fulton Counties provided a consistent overview of WNV positive cases. As
seen in the trends from 2009-2012 (see Table 6), the WNV positive human cases and
mosquito pools increased approximately twofold or greater, each year following 2009
flooding. Gaps in literature have not addressed both sanitary and combined sewer
overflows to WNV infections.
Use of Wastewater Systems to Mitigate Mosquito-Transmitted Disease
The amended Clean Water Act in 1987 required states to develop source pollution
management programs that reduce the concentration of constituents in stormwater runoff.
Controlling floods and waterborne pathogens connected to wastewater systems are high
public health priorities. Structural designs can be simple or elaborate, depending on the
considered factors of projected runoff, space, cost and area pollutants. Metropolitan
wastewater treatment devices usually include a single or combined approach of vegetated
channels, dry detention basins, wet retention ponds, to include wetlands, media filtration,
belowground sumps, vaults, and basins (Metzger, 2004). Mosquito control requires that
active controls and adjustments minimize standing water to permit emergence of adult
mosquitoes. Metzger (2004) derived that wastewater management mitigates mosquito

66
infestation by (a) rapid release of water in the system; (b) covering potential artificial
breeding sites; and (c) introducing breeding control measures as vegetation management
and mosquitofish. Another source control measure is the application of larvicides and
adulticides. Providing mosquito control within wastewater management programs can
preventing disease and maintaining quality of life for the public.
Summary
The review of literature has provided a depth of information concerning WNV
epidemiology, adult mosquito surveillance, and wastewater systems conditions. The
following chapter will capsulate evidence from the literature review and provide how the
research will be designed to assess the objectives. The research methodology will define
and translate knowledge necessary in the investigation of this study. The use of well-
established statistical procedures will also be defined and explained as a tool to assess the
objectives of this proposed research.

67
Chapter 3: Research Methods
Introduction
Previous research assessed the relationship of the combined sewer systems’
contribution to harboring mosquitoes infected with West Nile (based on data from year
2007 and earlier). The assessment of combined sewer systems contribution to West Nile
infections after the combined sewer system changes in 2008, is unknown. Sanitary sewer
system overflows as a mosquito breeding source and potential contributor of WNV
exposure for humans has not been explored.
This chapter covers the following topics: the research design (of which defines
components of the study and provide the link between research questions and design), the
methodology section (of which provides a description of the population, sampling
procedures, data sources, and instrumentation use, the validity section (of which provides
descriptions of internal and external threats to the research and how the threats are
addressed), and finally, the section on ethical concerns.
Research Design
The objectives of this retrospective analysis of human and mosquito WNV
infection data during drought conditions with respect to locations of the counties
combined and sanitary sewer systems overflows study were to (a) assess the distribution
of West Nile transmitting (vector) mosquitoes from surveillance trap sites; (b) to assess
the relationship of combined sewer overflows following the November 2008 sewer
system remediation, and assess the sanitary sewer overflows that affected the density of

68
the WNV vector mosquitoes; and (c) to access the relationship of WNV human cases and
the proximity to WNV vector mosquito pools infection. The dependent variables in this
study were the locations of WNV vector mosquito traps and the WNV infected human
cases. The WNV vector mosquito traps are at a specific geographic location. The
independent variables in this study were as follows: locations of WNV vector mosquito
traps, locations of combined sewer system overflows, and locations of sanitary sewer
system overflows. The locations of WNV vector mosquito traps, locations of combined
system overflows, and locations of sanitary sewer system overflows had a specific
location. The locations of WNV vector mosquito traps was a dependent variable for RQ2
and respective hypotheses. However, the locations of WNV vector mosquito traps was an
independent variable for RQ3 and respective hypotheses.
Research Questions and Hypotheses
The research questions arising from the gap in knowledge are as follows:
1. What is the spatial distribution from 2009-2012 of WNV mosquito infection in
DeKalb and Fulton County?
2. What is the association between WNV mosquito infection among combined
sewer overflows following 2008 reduction of combined sewers and sanitary sewer
overflows in DeKalb and Fulton County?
H0: There is no significant association between WNV mosquito infection among
combined sewer overflows following 2008 reduction of combined sewers and sanitary
sewer overflows in DeKalb and Fulton County.

69
H1: There is a significant association between WNV mosquito infection among
combined sewer overflows following 2008 reduction of combined sewers and sanitary
sewer overflows in DeKalb and Fulton County.
3. What is the spatial association between WNV-infected mosquito pools and
WNV-human infection?
H0: There is no significant association between distances to WNV infected
mosquito pools and WNV human infection.
H1: There is a significant association between distance to WNV infected
mosquito pools and WNV human infection.
The research questions and associated hypotheses were assessed with spatial
analysis as a means to explore a cross-section of (2009-2012) data. Spatial analysis was
used to determine the relationships of sewer system overflows to the amplification of
WNV positive vector mosquitoes and human onset of WNV disease. This descriptive
cross-section of data for this research can provide sufficient evidence to exclude or reveal
a relationship between variables.
Methodology
Study Area
This research included DeKalb County, Fulton County, and the City of Atlanta
populations. During 2009-2012, DeKalb and Fulton County reported 26 (19%) of the
WNV positive human cases and 293 (46%) of the positive mosquito pools in Georgia.
Both urban counties encompasses a wide range of socio-economic conditions.

70
The 2010 DeKalb County population estimate of 691,893 people is 100% urban
with a population density of 2,786 people per square mile. The main incorporated city in
DeKalb County consists of Atlanta, (pop. 420,005) of which only 10% of the city reside
(U.S. Census, 2012). According to 2010 U.S. Census, Fulton County has the largest
population of any county in Georgia, of which 10% of the state population resides. Fulton
County 2010 U.S. Census population estimate is 920,583 people, making the county the
most populous in the metro Atlanta area, but DeKalb County has the highest population
density. The Atlanta metropolitan area has a population of over 5 million people, ranking
ninth largest metropolitan area in the United States. Atlanta rests at the foothills of the
Appalachian Mountains and is divided along the Eastern Continental Divide, of which
the south and east side of the city water flows into the Atlantic Ocean and the North West
side flows into the Gulf of Mexico. The Chattahoochee River is a main feature of metro
Atlanta northwest edge and South River runs through the population center of metro
Atlanta into Lake Jackson. Most of the fastest growing areas are central: Downtown
(25.9%), Midtown, and West Midtown, close-in east side neighborhoods (18.4%).
Atlanta Southwest area is quickly growing up by 45.8%, while Northwest (avg. -24.1%)
and Southeast Atlanta (-20.5%), populations are decreasing.
Data Sources and Sampling
Human. Human population data was obtained from the US Census Bureau to
calculate the WNV infection rates (cases per 100,000 persons) for the study area. Human
WNV disease cases during 2009-2012 were received from the Georgia Department of

71
Public Health with Institutional Review Board (IRB) approval. Geographic coordinates
was provided by the Georgia Department of Public Health IRB board for plotting and
analysis in the geographic information system software. Protocols to manage the data,
analysis and dissemination was provided with permission and in accordance with the
institutional human data release guidelines and data use agreement.
The initial diagnosis for human WNV disease is often based on clinical signs,
activities for exposure, and epidemiological history of the infected locations. The
laboratory diagnosis is provided by testing cerebrospinal fluid or blood serum to detect
IgM and neutralizing antibodies. Serological testing is performed using WNV specific
immunoglobulin (immediate antibody response to infection) type enzyme-linked
immuno-sorbent assay (IgM ELISA), microsphere-based immunoassay (MIA), and
immunoglobulin (latent antibody response to infection) type IgG ELISA processes for
presumptive laboratory diagnosis. The state health department report the confirmed
positive laboratory tests. West Nile disease can be presented in progressions from fever to
more severe neuroinvasive disease in the forms of encephalitis, meningitis, meningo-
encephalitis and poliomyelitis. The WNV cases reported as secondary transmission
through blood transfusions, trans-placentally, during breastfeeding, organ transplantation,
and laboratory-acquired infection were excluded from this study because geographical
locations of initial infection cannot be determined. T hose WNV cases reported as
primary transmissions, directly from mosquito-to-human was included in this study.

72
Mosquito. The national mosquito data is provided by reporting jurisdictions at the
state level through the ArboNET system, the national electronic surveillance system
established by the CDC to assist states in tracking WNV and other mosquito-borne
viruses (Centers for Disease Control and Prevention, 2010). The ArboNET system
includes a mapping component and the maps produced are available on the United States
Geological Survey (USGS) web site. Geographical coordinates for mosquito abundance
and WNV infections on the state and county level during 2009-2012 was provided by the
State of Georgia Department of Public Health in the form of Excel spreadsheets with
geographic coordinates of trap locations. Mosquito surveillance only occurred in urban
environments of Fulton and DeKalb Counties. The collection of mosquitoes at each
sampling location is overnight with the use of a baited CDC-light trap or CDC Gravid
trap, of which is based on historical mosquito species abundance information for the area.
The county trap locations are clustered whereas the city of Atlanta mosquito traps are
randomly distributed. Adult mosquito surveillance usually accrues every 2-3 weeks per
area from May to November each year.
Mosquitoes are collected from surveillance traps, identified, and pooled by genera
and species. Mosquito pools range between 10-50 mosquitoes, whereas Culex species are
generally pooled 25 mosquitoes or less. A cold chain is maintained for collected
mosquitoes, during shipment, and testing confirmation. Each mosquito pool is tested as
one sample. Pools testing positive for WNV are submitted to University of Georgia for
polymerase chain reaction (PCR) confirmation. Mosquito pools are tested for WNV
73
infections using reverse transcriptase PCR gene expression assays and VectorTest, a
WNV antigen assay standard. The Culex quinquefasciatus is identified in 95% of all
WNV positive mosquito pools in Georgia (Calhoun et al., 2007). For this study, all
available WNV positive and negative pooled mosquito species were differentiated and
assessed.
Sewer system. Fulton County is home to permitted CSO facilities and the
associated streams, of which there are aproximately 76 non-combined sewer overflow
streams (excluding tributary creeks) within the county borders. DeKalb County is mainly
crossed by South River, Nancy Creek, Snapfinger Creek and Peachtree Creek. Other
rivers and creeks within the two counties include Stephenson Creek, Pine Mountain
Creek, Stone Mountain Creek, Sugar Creek, Swift Creek, Panthers Branch, Lee Henry
Branch, and Pole Bridge Creek. Peachtree and Nancy Creeks drain into the
Chattahoochee River leading to the Gulf of Mexico. South River eventually drains in the
Ocmulgee River leading to the Atlantic Ocean. Geographic coordinates for each CSO
location 2009-2012 is displayed as an ESRI shapefile using geographic information
system software.
Data Analysis Plan
Resources. Geospatial Research, Analysis, and Services Program (GRASP),
Division of Toxicology and Human Health Sciences, Agency for Toxic Substances and
Disease Registry, Centers for Disease Control and Prevention provided temporary

74
licensing for use of ArcGIS 10.1, ESRI geospatial software and database for research
analyses.
Geospatial Analysis Technology for Health and Environmental Research
(GATHER) GIS is the system that is maintained and managed by GRASP for GIS
support of public health activities at the CDC. GATHER is used for a variety of purposes
including cartography, demographic and environmental analysis, modeling, geospatial
statistics, public health surveillance, and emergency preparedness and response. The
GATHER GIS Shared Services comprise a set of shared services that are made available
to the entire staff of the CDC. Street level base maps of DeKalb and Fulton County and
the U.S. Census blocks were available with registration in GATHER GIS Geospatial Data
Warehouse.
Methods. Downloading from the Geospatial Data Warehouse, a shape file was
created with the county level base maps of DeKalb and Fulton Counties in ArcGIS. The
U.S. Census blocks was also downloaded from the Geospatial Data Warehouse and added
as an information layer to the base map file.
Database files or Excel spreadsheet received for analysis was assigned certain
fields. In accordance with ArcGIS data type naming convention, field names were
assigned to the columns in a table to establish relationships between tables and their
attribute indexes. Fields in a table stored the same category of data in the same data type.
Data types are classifications that identify possible values, of which operations can be
performed on the data. The ArcGIS geodatabases support storing vector data using

75
Microsoft’s SQL Server geometry and geography types. ArcGIS can access database
tables that contain geometry or geography columns. Each additional data file created
from human infections, mosquito surveillance, and sewer system overflows was field
modified and added as a data layer to the base map file. With the base map as a
foundation, the data layers were applied to ArcGIS geospatial analytics for research
purposes.
Human WNV cases. WNV infection in humans is generally flu-like symptoms
and is difficult to discern from other infections. Incidence rates can be imprecise and not
always diagnosed from common WNV symptoms. It is estimated that up to 80% of
people infected with WNV are asymptomatic, 20% develop West Nile Fever symptoms,
and less than 1% of those infected develop moderate to severe neuroinvasive illness. The
human data received from Georgia Department of Public Health IRB in conjunction with
the United States census data, was used to estimate human WNV incidence rates (cases
per 100,000) for each census tract. Waller and Gotway (2004) suggest the use of spatial
empirical bayes (EB) smoothed and unsmoothed data estimates for inexact diseases as
WNV diagnosis. Empirical bayes smoothing uses the local census data population in the
area as a measure of the confidence in the data, of which higher populations in an area
tend to provide a higher confidence to the events in that location. The EB smoothing use
the locations with low margins of error but balances locations with high margins of error
more toward the local average of the event rate. Smoothing takes the data for rate and a
population at risk and uses them to create new datasets, of which can cause an

76
underestimate of marginal affects for the human WNV incidence rates. This research
used the county census tracks for human WNV incidence rates, of which the application
of EB smoothing and unsmoothing methods reduced variance to balance improved
precision and the introduction of bias. The local indicator of spatial autocorrelation
(LISA) method was used with EB smoothed infection rates to determine clusters of
human WNV infection. The WNV data received from the Georgia Department of Public
health was plotted per census track number and applied as a map layer using ArcGIS for
analysis purposes only. Determining the relationship of combined and sanitary sewer
overflows to the proximity of WNV infections required regression analysis.
Mosquito density. The mosquito control program surveillance data was available
from the Georgia Department of Public Health. The data was returned as an Excel
spreadsheet. The received mosquito surveillance databases provided year, case number,
location, city, zip code, latitude, longitude, county, collection date, district, species,
number of mosquitoes, trap type, and virus isolation. The number of mosquitoes varied
per pool, of which were separated by species and tested. The species of mosquitoes
collected and sent for WNV testing from 2009-2012 data set include Ades albopictus,
Ades vexans, Aedes spp., Culex erraticus, Culex restuans, Culex territans, Culex spp.,
Culex quinquefasciatus Ochlerotatus japonicas, Ochlerotatus triseriatus, and
Uranotaenia sapphirina. Mosquito species were further divided by WNV positive and
negative testing results per month, and year. The databases metadata and attribute cells
were reviewed and modified to ensure appropriate database fields were spatially

77
represented (e.g. county, latitude/ longitude, etc.) and applicable to ArcGIS data field
selections. Where possible when an ArcGIS reference file with the same database field
existed, the fields were joined to an Excel type database, providing a spatial context
without manually creating a layer in ArcGIS.
To describe and quantify the spatial distribution of WNV infection in WNV
vector mosquitoes the maximum likelihood (ML) estimation tool in the form of a
Microsoft Excel add-in by Biggerstaff (2009) provided statistical comparisons for
unequal WNV positive pool samples. Appling the ML estimation derived WNV infection
rates (WNV positive mosquitoes per 1,000 tested) for the differences in pool numbers.
Using the average of ML for 2009-2012 WNV infection rate, provided the intensity of
WNV infection for each mosquito trap location. The abundance of mosquitoes (measured
as number of mosquitoes per night-trap) and its clustering was evaluated with Getis and
Ord Gi*(d) local statistic (Ord & Getis, 2001).
Sewer system analysis. Individually Fulton County, DeKalb County, and the
City of Atlanta water management provided the information for sanitary/combined sewer
system overflows as a result of open records requests. The data was returned as an Excel
spreadsheet and extensive PDF files. The data provided by the county and city was the
date/time, street number, street address, spillage, cause, volume, basin, sewer system area
and county. Assessing the relationship of combined sewer overflows and sanitary sewer
overflows to the proximity of WNV infections in vector mosquitoes, the predictors of
mosquito abundance and infection rates are calculated using the proximity to sewer

78
overflow locations within the 1 km to 2 km average distance of each mosquito trap
location (based on mosquito flight capabilities). Distances (in kilometers) of both human
and the vector mosquito to the combined and sanitary sewer system overflows was
assessed by spatially calculated data and using traditional regression methodologies to
test associations between risk factors and outcome.
Statistical analysis
This research is using the universe of relevant sites because the sample size
cannot be increased for the 2009-2012 data. The GIS spatial data model layers form maps
of the data sets, and how these data sets interact or relate is depictable in a data-centric
flowchart. A flowchart was created, framing research questions with the use of
maps/datasets (depicted as shapes) and the operations/processing steps (depicted as lines)
for this study.
1. What is the spatial distribution from 2009-2012 of WNV mosquito infection in
DeKalb and Fulton County?
For RQ1, kernel density estimation was used to analyze the distribution of sewer
system overflows and mosquito abundance. The kernel density estimation assigned a
value to every data point at its center, creating bandwidths, representing the probability
assigned at the neighborhood of values around the data point. For instance, a larger
bandwidth results in a shorter and wider value that spreads farther from the data point

79
Figure 1. Flowchart for analyzing RQ1.
center and assigns more probability to the neighboring values. Getis and Ord G*(d) local
statistics detected the spatial clustering of mosquitoes. The G*i statistics analysis tool
returned Z scores and the higher positive Z score value, the more intense hot spot
clustering. The statistically significant negative Z score with a lower value returns a more
intense cold spot clustering (see Figure 1).
2. What is the association between WNV mosquito infection among combined
sewer overflows following 2008 reduction of combined sewers and sanitary sewer
overflows in DeKalb and Fulton County?
H0: There is no significant association between WNV mosquito infection among
combined sewer overflows following 2008 reduction of combined sewers and sanitary
sewer overflows in DeKalb and Fulton County.

80
H1: There is a significant association between WNV mosquito infection among
combined sewer overflows following 2008 reduction of combined sewers and sanitary
sewer overflows in DeKalb and Fulton County.
Figure 2. Flowchart for analyzing RQ2.
To assess RQ2 and related hypothesis, WNV infection rate among mosquito pools
were estimated with the Maximum Likelihood method. Each mosquito trap was coded to
“WNV_pool = 1” if it was a WNV infected pool or “WNV_pool = 0” if it was a WNV
negative pool based on WNV infection in the mosquitoes. Also, the distance between
each mosquito trap location and CSO or SSO event was calculated with “point-to-point”
nearest distance using “proximity tools” in ArcGIS software. This distance to the nearest
CSO/SSO event was estimated in kilometers and stored as a continuous variable “near
distance”. Each mosquito trap was grouped into “within 1 km” (“event_dist” = 0 if
“near_distance” was less than 1km) and “More than 1 km” (“event_dist” = 1, if
“near_distance” was 1 km or greater). Fischer’s exact test were used to determine the

81
association between distance to the nearest CSO/SSO location and the presence or
absence of a WNV infected pool. A logistic regression model was used to study the
association between distance to nearest CSO/SSO event (“near_distance”) and
presence/absence of WNV infected mosquito pool (“WNV_pool”) (see Figure 2).
3. What is the spatial association between WNV-infected mosquito pools and
WNV-human infection?
H0: There is no significant association between distances to WNV infected
mosquito pools and WNV human infection.
H1: There is a significant association between distance to WNV infected
mosquito pools and WNV human infection.
For RQ3, human WNV infection rate was estimated with empirical bayes
smoothed data estimation method. The human WNV infection rate was stored as a
continuous variable (“EB_rate”). Local indicators of spatial association was used to
determine clusters of human WNV infection. The LISA combines interpretations of Getis
and Ord G*(d) Local statistics of spatial clustering around a separate location, and the
Anselin Local Moran’s I (Waller & Gotway, 2004) identifying significant hot spots, cold
spots, and outliers of the spatial data. Each LISA location value is derived from the
individual contribution to the global Moran’s I calculation. If the LISA value is

82
Figure 3. Flowchart for analyzing RQ3.
associated with the individual location top 0.1%, then the score is determined to be
statistically significant at the 0.001 (or 0.01 or 0.05) level (see Figure 3).
Ethical Procedures
The solicitation of digital information created or provided by county health
departments and state agencies is considered to be digital data collection. This study has
and will protect the privacy of information received in digital information as text, voice,
or have been converted from one format to a digital format in a software program. Any
forms of broadcast media as Internet websites, private or public networks, emails, and
voice messages is privacy protected. Guidance was sought and authorization granted
before receiving data digitally. The digital data obtained did not contain direct identifiers
or indirect identifiers of human WNV infection results. The digital data obtained
containing direct identifiers or indirect identifiers of mosquito, CSO, and SSO location is
privacy protected. During data manipulation on computer, to ensure information

83
confidentiality, included enforcing file permissions and access control managed by
government identification card access, on an assigned computer, requiring a pin to restrict
sensitive information access. The location of infrastructure as watershed systems
pipelines was secured and protected in digital files or databases by enforcing file
permissions and computer access control. All printed documents containing data was
shredded immediately after use and digital documents containing data after use will only
be accessed by database owner or deleted from computer recall, and stored in accordance
with regulations. The Georgia Department of Public Health Institution Review Board
approved the use of data as project #131108 for this study (see Appendix).
Summary
Various analyses was used to estimate associations of sewer system overflows to
the amplification of vector mosquitoes and investigate human onset of WNV infections.
The geocoded human WNV cases in conjunction with the United States census data,
estimated human WNV incidence rates for each census tract. To describe and quantify
the spatial distribution of mosquitoes, the maximum likelihood estimation tool compared
unequal numbers of WNV pools. The predictors of mosquito abundance and infection
rates was calculated by using the proximity to sewer overflow locations within the 1 km
to 2 km average distance of each mosquito trap location. Logistic regression evaluated
the association between vector mosquitoes and sewer system overflows. Distances of
human and the vector mosquito to combined and sanitary sewer system overflows was
estimated using Poisson regression. A method of inquiry is using regression analysis as a

84
measure of probability for independent variables to predict the dependent variable. The
data plan and statistical procedures where specified for this research. Chapter 4 will
explain how the data were applied according to the data plan and how they determined
the results of the statistical analysis to answer the research objectives.

85
Chapter 4: Research Results
Introduction
The purpose of this quantitative research study was to perform a retrospective
analysis in order to assess the relationship between human and mosquito WNV infections
at the locations of the combined sewer overflows, and the sanitary sewer overflows in
Fulton and DeKalb Counties of Georgia. As a mosquito-harboring source, the combined
sewer systems were reduced starting in 2009, yet the West Nile mosquito population
increased for 3 years after restructuring of the metro area waste water system. Sanitary
sewer systems also carry organically rich water that can overflow and enhance
oviposition of mosquitoes. Assessing the relationship of combined sewer system
overflows and sanitary sewer overflows to the proximity of West Nile vector mosquitoes
was expected to provide insight into the locality of human infection. In sum, the goals of
this study were (a) to assess the distribution of West Nile vector mosquitoes from
surveillance trap sites; (b) to assess whether the relationship between the combined sewer
overflows following the November 2008 sewer system remediation, and the sanitary
sewer overflows affected the density of the WNV vector mosquitoes; and (c) to assess the
relationship between WNV human cases and their proximity to WNV vector mosquito
pools infection. The two dependent variables in this study were the locations of WNV
vector mosquito traps and the WNV infected human cases. The independent variables in
this study were the locations of WNV vector mosquito traps, the locations of the
combined sewer system overflows, and the locations of sanitary sewer system overflows.

86
However, the locations of WNV vector mosquito traps were a dependent variable for
RQ2 and their respective hypotheses; they were an independent variable for RQ3 and
their respective hypotheses. The aim of this research was to answer the following
questions:
1. What is the spatial distribution from 2009-2012 of WNV mosquito infection in
DeKalb and Fulton County?
2. What is the association between WNV mosquito infection among combined
sewer overflows following 2008 reduction of combined sewers and sanitary sewer
overflows in DeKalb and Fulton County?
H0: There is no significant association between WNV mosquito infection among
combined sewer overflows following 2008 reduction of combined sewers and sanitary
sewer overflows in DeKalb and Fulton County.
H1: There is a significant association between WNV mosquito infection among
combined sewer overflows following 2008 reduction of combined sewers and sanitary
sewer overflows in DeKalb and Fulton County.
3. What is the spatial association between WNV-infected mosquito pools and
WNV-human infection?
H0: There is no significant association between distances to WNV infected
mosquito pools and WNV human infection.

87
H1: There is a significant association between distance to WNV infected
mosquito pools and WNV human infection.
These research questions were answered using spatial analysis and regression
methods. The following subsections explains the process of data collection and the
research results. The data collection section describes the data time frame, discrepancies,
demographic characteristics, and sample representation. The data results section report
statistical characterization, assumptions, analysis findings, and includes tables and figures
to illustrate results.
Data Collection
As a retrospective research study, the human WNV infection cases and mosquito
surveillance data was collected from 2009-2012 by the State of Georgia Department of
Public Health. Human WNV data collected was only applicable for 2010, 2011, and
2012, of which those yearly population rates were calculated for the counties. Only 2010
population and 2012 population estimates were used for calculation of crude and
empirical bayes smoothed human rates, as 2011 population estimates were not available
on the U.S. Census website. The tracking of WNV and other mosquito-borne viruses was
available by ArboNET, a CDC national electronic surveillance system. The combined
and sanitary sewer system overflow data was collected from 2009-2012 and retrieved
from the State of Georgia Department of Public Health and the City of Atlanta. All other
sewer system spills data from DeKalb and Fulton County was received as either an Excel

88
spreadsheet or a PDF form, of which data was manually transferred to an Excel
spreadsheet. Addresses and GPS coordinates of data collection sites were verified and
corrected as necessary. Data analysis of mosquito infection rates included the more
applicable chose to use Vector Index or Maximum Likelihood estimates. The use of
Vector Index was conducive to applications in ArcMap but the Maximum Likelihood
estimate corresponds to many well-known estimation methods in statistics and was used
in this research.
Results
RQ1
1. What is the spatial distribution from 2009-2012 of WNV mosquito infection in
DeKalb and Fulton County?
The mosquito data collected from 76 trap sites during 2009 to 2012 was used in
this analysis (see Table 7). The mosquito pools were trapped using gravid (98.7%) and
Table 7
Positive pools of WNV infection in mosquitoes, DeKalb and Fulton County Georgia,
United States 2009-2012 Mosquito Species Positive Pool Count Prop
Aedes albopictus 80 1.28%
Culex erraticus 40 0.64%
Culex quinquefasciatus 2,640 42.12%
Culex restuans 510 8.14%
Culex spp. 1,402 22.37%
Ochlerotatus japonicas 970 15.48%
Ochlerotatus triseriatus 368 5.87%
Uranotaenia sapphirina 258 4.12%

89
CDC light (1.3%). For this study, the distribution of WNV positive vectors were pooled
and compared. The Culex quinquefasciatus and Culex spp. account for 75% of
the pooled and near 65% (64.48 %) of the WNV positive vector pools (see Figure 4). The
distribution of mosquito abundance in DeKalb and Fulton County varies year-to-year by
species, and trap week.

90
Abundance of Culex quinquefasciatus and Culex spp. Mosquitoes 2009-2012
Figure 4. Abundance of Culex quinquefasciatus and Culex spp. in Fulton and DeKalb
County (2009-2012).
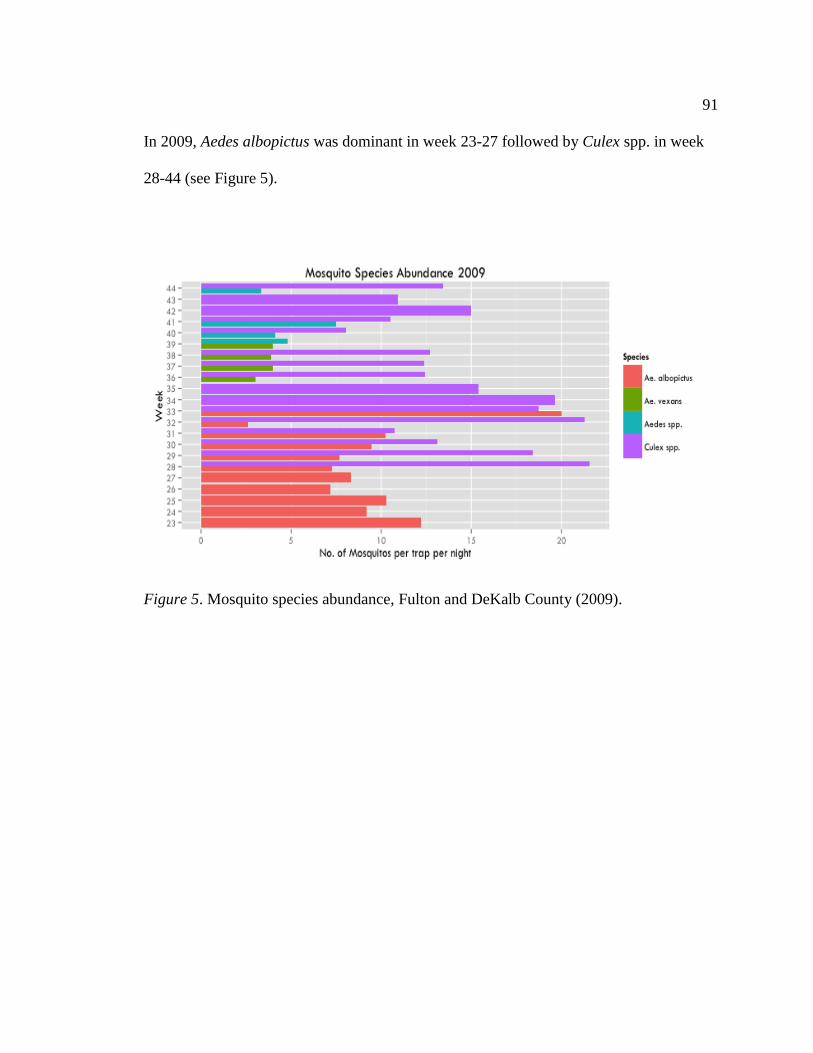
91
In 2009, Aedes albopictus was dominant in week 23-27 followed by Culex spp. in week
28-44 (see Figure 5).
Figure 5. Mosquito species abundance, Fulton and DeKalb County (2009).

92
In 2010, Culex spp. was dominant during week 22-34, the Culex quinquefasciatus species
appeared week 34 and dominated week 35-43 (see Figure 6).
Figure 6. Mosquito species abundance, Fulton and DeKalb County (2010).

93
In 2011, Culex quinquefasciatus was prevalent in week 23-34 and dominated until
opposition in week 35-42 from the Culex restuans (see Figure 7).
Figure 7. Mosquito species abundance, Fulton and DeKalb County (2011).

94
In 2012, Ochlerotatus japonicus species dominated only in week 27-29, of which Ur.
sapphirina only appeared in week 28-29, and Ochlerotatus triseriatus gained domination
week 30-40 (see Figure 8). The same year, Culex quinquefasciatus and Culex spp. only
Figure 8. Mosquito species abundance, Fulton and DeKalb County (2012).
appeared in traps for week 41-43. In addition, the flight distance and prevalent week
varied between mosquito species, of which can be applicable in the ability to spread
disease. WNV vectors in this study had a total flight range from 0.09 km to 12.88 km (see
Table 8).

95
Table 8
WNV positive vector mosquito total flight range
Mosquito Species Total Flight Range (km) Total Fight Range (US)
Aedes albopictus 0.09 to 0.27 100 to 300 yards
Culex erraticus Up to 0.40 up to 0.5 miles
Culex quinquefasciatus 0.40 to 0.80 0.25 to 0.50 miles
Culex restuans 1.61 to 3.22 1 to 2 miles
Culex spp. 0.40 to 8.05 0.25 to 5 miles
Ochlerotatus japonicas up to 1.61 1 mile
Ochlerotatus triseriatus 0.80 to 1.61 0.25 to 1 mile
Uranotaenia sapphirina Up to 12.88 8 miles
The WNV infection rate among mosquito vectors was calculated using Maximum
Likelihood (ML) method to account for variation in number of mosquitoes tested for the
WNV infection (Biggerstaff, 2006). ML estimated WNV among vector mosquitoes
ranged from 1.08 to 10.02 per 1000 mosquitoes (see Table 9). ML Estimated WNV
infection rate was highest in 2012 compared to rates from 2009-2011.
Table 9
WNV infection in mosquitoes, DeKalb and Fulton County Georgia, United States 2009-
2012 Year Number of tested
pools b
Number of
mosquitoes b
Number of
Positive
Pools b
Infection Ratea
(Range between traps)
2009 918 11,601 13 1.08 (1.75 - 11.34)
2010 1239 15,798 93 2.13 (0.27 - 26.24)
2011 1362 22,333 123 2.08 (0.34 - 21.91)
2012 286 4,936 64 10.02 (1.87 - 20.62)
Note. aWNV Infection rate per 1000 mosquitoes estimated using maximum likelihood method. bNumber
retrieved from Georgia Department of Public Health records.

96
The spatial distribution from 2009-2012 of WNV mosquito infection in DeKalb
and Fulton County was found to be consistent with previous research findings, of which
the Culex species remains the highest percent of all WNV positive vectors for the area. A
unique finding in the spatial distribution of WNV mosquito infection, was how various
species occupy areas in turn and did not reach density peaks during the same time. The
combined Culex species consist of 75% of all WNV positive vectors, of which the Culex
quinquefasciatus mosquito lead positive vectors at 57% from 2009 to 2012. Each year the
dominant vector changed according to the time of year but the Culex quinquefasciatus
remained a prominent species in 2010 and 2011. In 2009, the Aedes albopictus and Culex
spp. dominated. In 2010, the Culex spp. and Culex quinquefasciatus dominated. In 2011,
the Culex quinquefasciatus and Culex restuans dominated. In 2012, the Ochlerotatus
japonicas and Ochlerotatus triseriatus dominated the area. When the Culex spp. and
Culex quinquefasciatus species monopolized abundance, the WNV infection rate peaked
between 2.08 to 2.13 per 1,000 mosquitoes. When the Ochlerotatus japonicas and
Ochlerotatus triseriatus species lead abundance, the WNV infection rate spiked to 10.02
per 1,000 mosquitoes. Surprisingly when comparing 2012 to 2009-2011, the number of
tested mosquito pools decreased by 80%. The State Department of Public Health had
funding cuts in 2012, as a result, mosquito testing was not supported. Counties carrying
independent contracts for mosquito surveillance continued and shared some of the data
with the Georgia Department of Public Health. The spatial distribution from 2009-2012
of WNV mosquito infection in DeKalb and Fulton County was presented and the

97
highlighted results include (a) an increase in mosquito infection rates during reduced
sewer overflows without a dominant Culex species; (b) a described variance in
dominating mosquito species; and (c) identified the order of which species occupy areas.
RQ2
2. What is the association between WNV mosquito infection among combined
sewer overflows following 2008 reduction of combined sewers and sanitary sewer
overflows in DeKalb and Fulton County?
H0: There is no significant association between WNV mosquito infection among
combined sewer overflows following 2008 reduction of combined sewers and sanitary
sewer overflows in DeKalb and Fulton County.
H1: There is a significant association between WNV mosquito infection among
combined sewer overflows following 2008 reduction of combined sewers and sanitary
sewer overflows in DeKalb and Fulton County.
During 2009-2012, a total of 3,612 CSO (n = 369) and SSO (n = 3,243) events
were reported with an average rate of 903 events per year. The distribution of the
combined CSO and SSO events per month and year has varied for this study period (see
Figure 9). It appears that a higher number of CSO and SSO events occurred during the
months of February and March each year. In comparison of the combined CSO and SSO
events across s, 2009 (n = 1144, 31.6%) had a higher proportion of events, followed by
2010 (n = 927, 25.6%), 2011 (n = 782, 21.6%), and 2012 (n = 759, 21%). The central and

98
southwest areas of Fulton County are most affected by SSO and CSO spills year-to-year.
This identify temporal trend in CSO and SSO events in Fulton and DeKalb Counties.
The locations of traps with high mosquito abundance (i.e. number of mosquitos
per trap-night), density of mosquitoes and density of CSO and SSO events in both
Figure 9. Distribution of CSO and SSO events in Fulton and DeKalb County (2009-
2012).

99
Counties where identified (see Figure 10 and Figure 11). Mosquito abundance was
greater near the areas with a higher number of CSO and SSO events per square kilometer.
Traps with a high abundance of mosquitoes were clustered within a median radius of 6.5
km (ranging from 0.2 to 18.1 km) of each other (Getis-Ord Gi* p-value <0.05).

100
Figure 10. Distribution of mosquito abundance (mosquitoes/per trap night) and CSO
events.

101
Figure 11. Distribution of mosquito abundance (mosquitoes/per trap night) and SSO
events.

102
The distribution of ML WNV infection rates among mosquitoes by trap location
and its association to CSO and SSO events were identified (see Table 10 and Table 11).
Clusters of traps with WNV infected mosquitoes were observed in DeKalb County with a
median distance of 6.5 km (range 0.21 km to 16 km) between traps. Mosquito traps with
a higher ML WNV infection rates were located in both Fulton and DeKalb Counties. For
all years combined, more than 58% of the traps located within 1 km of a CSO/SSO event
had WNV positive pools compared to only 30% of the traps located more than 1 km
away for the nearest CSO/SSO event.
A total of 369 CSO events occurred in 2009-2012, of which overflows were
reduced each year when compared to 2009. A significantly higher proportion of mosquito
traps within 1 km from a CSO event had a WNV infected pool compared to mosquito
traps more than 1 km from CSO events in 2009 (p-value < 0.05, see Table 10). The CSO
Table 10
Distance from CSO event and WNV infection among mosquitoes, 2009-2012 Year Mosquito pools Distance from CSO event p-value (Fischer’s test)
Within 1km (%) More than 1
km (%)
2009 Positive 5 (60.0) 3 (9.8) 0.017a
Negative 2 (40.0) 46 (90.2)
2010 Positive 5 (83.3) 20 (40.8) 0.08
Negative 1 (16.7) 29 (59.2)
2011 Positive 2 (50.0) 29 (56.9) 0.99
Negative 2 (50.0) 22 (43.1)
2012 Positive 1 (50.0) 24 (55.8) 0.99
Negative 1 (50.0) 19 (44.2)
Note. ap-values for Fischer’s test < 0.05(p-value 0.05).
events by census tract, mosquito WNV infection rate by trap location and cluster of

103
WNV infected mosquitoes where identified (see Figure 12).
Figure 12. CSO events by census tract, mosquito WNV infection rate by trap location
and cluster of WNV infected mosquitoes.

104
A total of 3,243 SSO events occurred in 2009-2012, of which overflows were
highest in 2009 when compared to the temporal trend of years following. In 2010 to
2012, a higher proportion of traps within 1 km from a SSO event had WNV infected
pools when compared to traps more than 1 km from a SSO event (see Table 11).
Table 11
Distance from SSO event and WNV infection among mosquitoes, 2009-2012 Year Mosquito pools Distance from SSO event p-valuea
Within 1km (%) More than 1 km (%)
2009 Positive 4 (16.0) 4 (12.9) 0.74
Negative 21 (84.0) 27 (87.1)
2010 Positive 17(71.0) 8 (26.0) <0.001
Negative 7 (29.0) 23 (74.0)
2011 Positive 19 (76.0) 12 (40.0) 0.007
Negative 6 (24.0) 18 (60.0)
2012 Positive 13 (61.9) 12 (50.0) 0.42
Negative 8 (38.1) 12 (50.0)
Note. ap-values for Chi-square test
Individually, 2010 was associated with a 3 times higher risk near a SSO event and a 55%
decrease the farther removed from a SSO event. Year 2011 proved to be almost 7 times
higher risk near a SSO event and a 67% decrease of WNV mosquito infection the farther
distance from a SSO event. In 2012, the number of WNV positive and negative pools
were nearly equal. The difference of mosquito WNV infection between 1 km distance
and more than 1 km from SSO events were also nearly equal. However, this association
between WNV infected pools and distance from the nearest SSO event was statistically

105
significant for 2010 and 2011 (p-values <0.05). The SSO events by census tract,
mosquito WNV infection rate by trap location and cluster of WNV infected mosquitoes
where identified (see Figure 13).
Figure 13. SSO events by census tract, mosquito WNV infection rate by trap location and
cluster of WNV infected mosquitoes.

106
The results of logistic regression evaluating the association between distance (in
km) from the nearest CSO and SSO event and presence/absence of WNV infected
mosquito pools are in Table 12 and Table 13 respectively. In 2010 and 2011, mosquito
traps closest to a CSO event was associated with almost 2.5 times and 7 times greater risk
of having a WNV infected pool respectively (see Table 12). With each km increase in
distance between trap location and CSO event was associated with 8 to 12% decrease in
risk of WNV infected pool at the trap. This association between distance to a CSO from a
trap location and WNV infected pool in 2011 was statistically significant (p-values
<0.05).
Table 12
Relationship between distance to nearest CSO event and WNV infection of mosquitoes,
2009-2012
Year Intercept (95% CI)
Distance from nearest CSO event
(95% CI)
2009 0.62 (0.17, 2.06) 0.88 (0.76, 0.98)a
2010 2.45 (0.96, 6.80) 0.92 (0.86, 0.98)a
2011 7.27 (2.49, 26.22)a 0.88 (0.81, 0.94)a
2012 3.28 (0.91, 13.99) 0.93 (0.84, 1.01)
Note. ap-value < 0.050
Similar results were observed for the relationship between distance of SSO event,
the mosquito trap, and WNV infected pools (see Table 13). For 2010, the SSO events in
closest proximity to a mosquito trap was associated with almost 3 times higher risk of
WNV infected mosquito pool (distance OR = 2.92). Each kilometer in distance of the
SSO event from a mosquito trap was associated with a 55% decrease in risk of a WNV

107
infected mosquito pool (distance OR = 0.45). In 2011, the SSO events in closest
proximity to a mosquito trap was associated with almost 7 times higher risk of a WNV
infected mosquito pool. Each kilometer in distance of the SSO event from a mosquito
trap was associated with a 67% higher risk of a WNV infected mosquito pool. This
association between distance (in kilometers) from the nearest SSO event and presence or
absence of WNV infected mosquito pools in 2010 and 2011 is statistically significant (p-
value <0.05).
Table 13
Relationship between distance to nearest SSO event and WNV infection of mosquitoes,
2009-2012
Year Intercept (95% CI)
Distance from nearest SSO event
(95% CI)
2009 0.24 (0.08, 0.67)a 0.79 (0.36, 1.16)
2010 2.92 (1.16, 8.37)a 0.45 (0.22, 0.75)a
2011 6.67 (2.39, 23.6)a 0.33 (0.14, 0.63)a
2012 2.16 (0.68, 7.48) 0.62 (0.24, 1.49)
Note. ap-value < 0.050
The overall the presence of CSO in close proximity to a mosquito trap was
associated with more than twice the risk of a WNV infected mosquito pool (intercept OR
= 2.26, see Figure 14). With each kilometer increase in distance of a CSO event from a
mosquito trap location was associated with a 10 percent decrease in risk to WNV infected
mosquito presence or absence of WNV infected mosquito pool is statistically significant
pool (OR = 0.91). This association between distance from the nearest CSO event and (p-
value < 0.05). The overall presence of a SSO event in close proximity to a mosquito trap

108
was associated with a 1.8 times higher risk of WNV infected mosquito pool (intercept OR
= 1.79, see Figure 14).
Figure 14. Mosquito trap location with 1 and 2 km buffers, WNV mosquito infection
hotspots, and CSO/SSO events, 2009-2012.

109
With each kilometer increase in distance of a SSO event from a mosquito trap
location was associated with a 48% decrease in risk to WNV infected mosquito pool (OR
= 0.52). This association between distance (in km) from the nearest SSO event and
presence/absence of WNV infected mosquito pool is statistically significant (p-value <
0.05). The influence of CSO/SSO overflows became pronounced when analysis also
identified a proportion of WNV positive mosquito pools was significantly higher in
approximately 58% of trap sites within 1 km and 30% over 1 km distance from overflow
events. The association between distance to a CSO from a trap location and WNV
infected pool in 2011 was statistically significant (p-values < 0.05). The SSO event and
presence or absence of WNV infected mosquito pools in 2010 and 2011 was statistically
significant (p-value < 0.05). The association between distance from the nearest CSO/SSO
event and presence/ absence of WNV infected mosquito pool was proven statistically
significant. The association between WNV mosquito infection among combined sewer
overflows and sanitary sewer overflows supports the alternate hypothesis; the null
hypothesis was rejected. There is a significant association between WNV mosquito
infection among combined sewer overflows following 2008 reduction of combined
sewers and sanitary sewer overflows in DeKalb and Fulton County.
RQ3
3. What is the spatial association between WNV-infected mosquito pools and
WNV-human infection?

110
H0: There is no significant association between distances to WNV infected
mosquito pools and WNV human infection.
H1: There is a significant association between distance to WNV infected
mosquito pools and WNV human infection.
During 2010-2012, 26 confirmed WNV infected human cases were observed,
including 15 cases in Fulton County and 11 cases in DeKalb County. Human WNV
infection rates showed a clear temporal pattern. The WNV infection rate increased from
0.54 per 100,000 population in 2010 to 0.72 per 100,000 population in 2012 for Fulton
County, and the rate increased from 0.14 per 100,000 population in 2010 to 1.27 per
100,000 population in 2012 in DeKalb County (see Table 14).
Table 14
WNV infection rate in humans, DeKalb and Fulton County Georgia, United States 2010-
2012 Fulton DeKalb
Year Number of confirmed
cases
WNV infection
ratea
Number of confirmed
cases
WNV infection
ratea
2010 5 0.54 1 0.14
2011 3 0.33 1 0.14
2012 7 0.72 9 1.27
Note: aWNV Infection rate per 100,000 population, 2010 census data and 2012 population estimates were
used for rate calculation.
In 2010, the average distance between the mosquito trap in closest proximity with
a WNV positive vector and a positive human case was 3.09 kilometers (or 1.92 miles)

111
with a range from 0.78 kilometers to 5.89 kilometers (0.48 miles to 3.66 miles) (see
Table 15). In 2011, the average distance was 3.43 kilometer (2.13 miles) with the
distance ranging from 0.98 kilometers to 6.33 kilometers (0.61 miles to 3.93 miles). In
2012, the average distance was 4.18 kilometers (2.59 miles) with a distance ranging from
1.13 kilometers to 9.49 kilometers (0.70 miles to 5.90 miles).
Table 15
Distance between WNV positive vector trap location and human cases, DeKalb and
Fulton County Georgia, United States 2010-2012 Year In Kilometers
Avg. (Range)
In Miles
Avg. (Range)
2010 3.09 (0.78 - 5.89) 1.92 (0.49 - 3.66)
2011 3.43 (0.98 - 6.33) 2.13 (0.61 – 3.93)
2012 4.18 (1.13 – 9.49) 2.59 (0.70 – 5.9)
Local indicator of spatial autocorrelation method was used with empirical bayes
(EB) smoothed infection rates to determine clusters of human WNV infection. Clusters of
human WNV infection, clusters of WNV infected mosquito pools and the distribution of
CSO/SSO events was identified and compared. LISA analysis identified two clusters of
human WNV infection. The first cluster was located in the north area of DeKalb County
containing 7 census tracts with human cases of WNV infection. The average EB
smoothed human WNV incidence rate of the cluster was 5.02 per 100,000 (ranging from
4.75 to 5.67 per 100,000 population). The second cluster was located in eastern Fulton
County and western DeKalb County containing 8 census tracts with human WNV cases.
The second cluster had an average EB smoothed human WNV incidence rate of 5.45 per

112
100,000 (ranging from 5.17 to 5.93 per 100,000 population). However, results of Monte
Carlo simulations (2,000 permutations) suggests that these two clusters are not
statistically significant (p-value = 0.2843).
A poisson regression model was used to evaluate the relationship between human
WNV incidence rates, the distance between census tracts centroid, and the closest
mosquito trap location with a positive WNV pool. Results of the regression analysis
showed that, with each 1 km increase in distance between census tract centroid and WNV
positive mosquito trap location was associated with 13% decrease in human WNV
incidence rate (see Table 16). This association was not statistically significant (p-value =
0.9).
Table 16
Association between human WNV infection rate and distance to nearest WNV positive
mosquito trap, 2010-2012
Note. ap-value = 0.9
The human WNV infection rate increased for both Counties from 2010-2012.
Two clusters of human WNV infection was identified, of which Monte Carlo simulations
suggests were not statistically significant. The regression analysis demonstrated that each
1 km increase in distance between census tract centroid and WNV positive mosquito trap
Estimate (IRR) Lower
Confidence
limit
Upper confidence limit
Intercept 0.00 0.00 0.00
Distance in km 0.87a 0.64 1.18

113
location was associated with a decrease in human WNV incidence rate, but was not
significant. The spatial association between WNV infected mosquito pools and WNV
human infection supports the null hypothesis; the null hypothesis failed to be rejected.
There is no association between distance to WNV infected mosquito pools and WNV
human infection.
Summary
Chapter 4 began with details of data collection and descriptive analysis of the
study example. Mosquito distribution varies year-to-year by species and trap week, of
which the Culex quinquefasciatus dominated in abundance and West Nile virulence. The
distribution of sewer systems events and number of mosquitoes collected in traps was
studied with Kernel Density estimation. The abundance of mosquito (measured as
number of mosquitoes per trap-night) and its clustering was evaluated with Getis and Ord
Gi*(d) local statistic. Results showed traps with high mosquito abundance were found in
areas with a higher number of sewer system overflow events. Next, clustering of ML
WNV infection in mosquitoes was studied with Getis and Ord Gi*(d) local statistic and
the association between WNV infected mosquito pool and the distance to the nearest
sewer system overflow event was evaluated with logistic regression, of which presented
statistically significant findings. Results of logistic regression showed that with each
kilometer increase in distance of sewer system overflow events from a mosquito trap
location, the risk of a WNV infected pool decreased by 48%, whereas for combined
sewer events the risk of a WNV infected pool decreased by 10% and was statistically

114
significant. The association between WNV mosquito infection among combined sewer
overflows and sanitary sewer overflows supports the alternate hypothesis. Finally, the
distribution of human WNV infection was studied in relation to WNV infected mosquito
pools. The clustering of EB smoothed human WNV incidence rate was studied using
LISA method. Two prominent clusters of human WNV infection were identified. The
association between human WNV incidence rate and distance of census tract centroid to
WNV positive mosquito pools was evaluated with Poisson regression. Results of the
regression analysis showed that, with each 1 km increase in distance between census tract
centroid and WNV positive mosquito trap location was associated with a decrease in
human WNV incidence rate, but was not statistically significant. The spatial association
between WNV infected mosquito pools and WNV human infection supports the null
hypothesis.
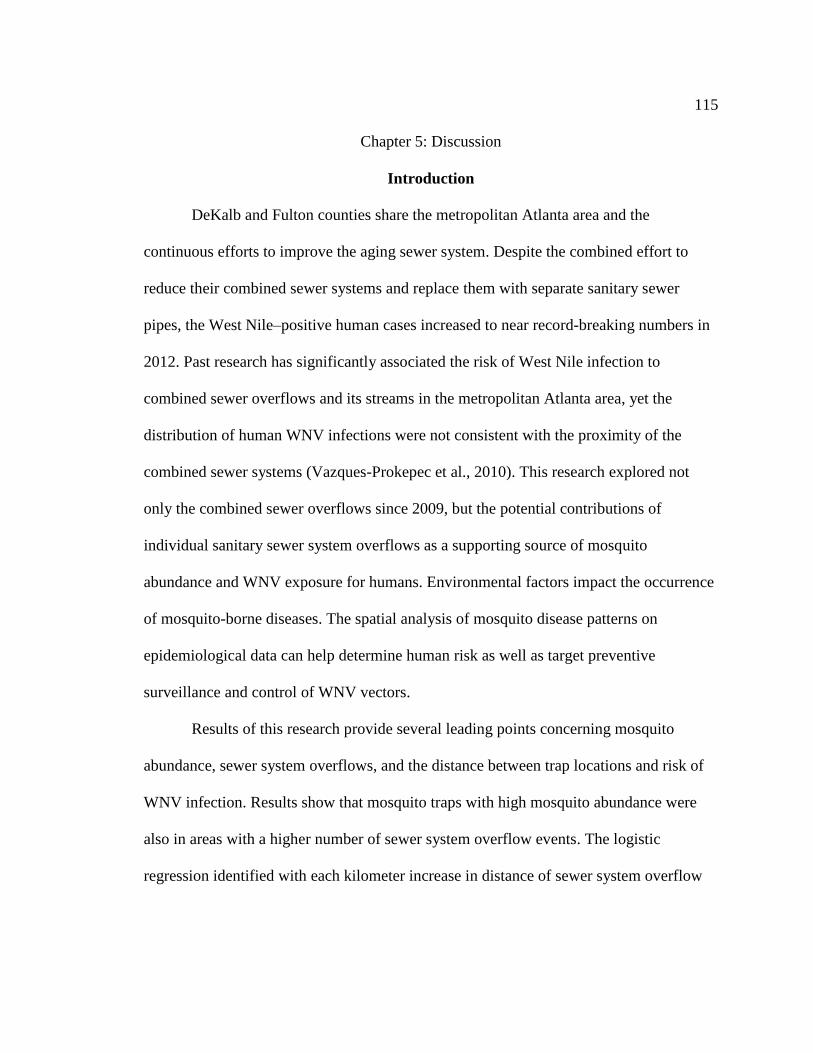
115
Chapter 5: Discussion
Introduction
DeKalb and Fulton counties share the metropolitan Atlanta area and the
continuous efforts to improve the aging sewer system. Despite the combined effort to
reduce their combined sewer systems and replace them with separate sanitary sewer
pipes, the West Nile–positive human cases increased to near record-breaking numbers in
2012. Past research has significantly associated the risk of West Nile infection to
combined sewer overflows and its streams in the metropolitan Atlanta area, yet the
distribution of human WNV infections were not consistent with the proximity of the
combined sewer systems (Vazques-Prokepec et al., 2010). This research explored not
only the combined sewer overflows since 2009, but the potential contributions of
individual sanitary sewer system overflows as a supporting source of mosquito
abundance and WNV exposure for humans. Environmental factors impact the occurrence
of mosquito-borne diseases. The spatial analysis of mosquito disease patterns on
epidemiological data can help determine human risk as well as target preventive
surveillance and control of WNV vectors.
Results of this research provide several leading points concerning mosquito
abundance, sewer system overflows, and the distance between trap locations and risk of
WNV infection. Results show that mosquito traps with high mosquito abundance were
also in areas with a higher number of sewer system overflow events. The logistic
regression identified with each kilometer increase in distance of sewer system overflow

116
events from a mosquito trap location, the risk of a WNV infected pool decreased. Results
of the LISA analysis identified two clusters of human WNV infection, of which the
regression analysis associated each kilometer increase in distance between census tract
centroid and WNV positive mosquito trap location resulted in a decrease in human WNV
incidence rate. The interpretation of all research findings are discussed further.
Interpretation of the Findings
Discussion of RQ1
The first research question was as follows:
What is the spatial distribution from 2009-2012 of WNV infection in DeKalb and
Fulton County?
This question sought to assess the distribution of West Nile vector mosquitoes from
surveillance trap sites. The abundance of mosquitoes, specifically in Fulton and DeKalb
counties, suggested a dominating order of which mosquito species occupy the area. The
combined Culex species consist of two-thirds of all WNV positive vectors, of which, by
volume, the Culex quinquefasciatus mosquito leads positive vectors. Each year the
dominant vector changed according to the time of year, but the Culex quinquefasciatus
remained a prominent species in two of the years. When comparing the years of which
the Culex spp. and Culex quinquefasciatus species monopolized abundance to when
Ochlerotatus japonicas and Ochlerotatus triseriatus species lead abundance, respectively

117
the WNV infection rate spiked four times the 2009-2011 rate.
Research has shown that nutrient-rich releases from combined sewer overflows
have significantly increase the abundance of Culex quinquefasciatus mosquitoes in the
Atlanta area (Calhoun et al., 2007; Vazques-Prokepec et al., 2010). This study included
not only the abundance of Culex quinquefasciatus species, but also all WNV vector
mosquitoes captured during adult mosquito surveillance. In consideration of all WNV
vector mosquitoes, this study support previous research of which Culex species remains
the most abundant species and that Culex quinquefasciatus maintains lead WNV positive
vector for the area (Calhoun et al., 2007; Chaves et al., 2009; Vazques-Prokepec et al.,
2010). Comparing the prominence of all WNV vectors year-to-year introduced some
insight on how different mosquito species occupy the area. Patterns of captured adult
female mosquitoes, suggest different species occupy the area in turn and not necessarily
during the same time of year. What is not previously indicated or explained by research,
is how this study found WNV vector mosquito patterns indicate one species will
dominate the area until the second species is detected in surveillance, of which the second
species then gains dominance in the same year. Another unique finding within this study
time period, is that 2012 presented the highest peak of WNV infected vectors since 2001,
without detecting the Culex species in adult surveillance.
The mosquito trap data and analysis have identified how various mosquito species
occupy and dominate in turn. Previous research addressing the patterns of which and
when mosquito species occupy the Atlanta area have not been identified. This study has

118
begun the insight for future research to not only evaluate abundance, location and
virulence, but also consider why and when mosquito species occupy the area. The 2012
spike in WNV infection have revealed the need for more detailed understanding of the
diversity and distributions of mosquito species in this region. The accurate tracking of
mosquito species patterns of dominance in research, provide implications to improve
accuracy for pesticide applications and developing novel preventive measures.
Discussion of RQ2
The locations of WNV vector mosquito traps, locations of combined system
overflows, and locations of sanitary sewer system overflows are a specific location with a
fixed latitude and longitude. However, the locations of WNV vector mosquito traps was a
dependent variable for RQ2 and respective hypotheses. The following is the interpreted
results using the null/alternative hypotheses:
2. What is the association between WNV mosquito infection among combined
sewer overflows following 2008 reduction of combined sewers and sanitary sewer
overflows in DeKalb and Fulton County?
H0: There is no significant association between WNV mosquito infection among
combined sewer overflows following 2008 reduction of combined sewers and sanitary
sewer overflows in DeKalb and Fulton County.

119
H1: There is a significant association between WNV mosquito infection among
combined sewer overflows following 2008 reduction of combined sewers and sanitary
sewer overflows in DeKalb and Fulton County.
The second research question is answered with the objective to assess if the
relationship of combined sewer overflows following the November 2008 sewer system
remediation, and sanitary sewer overflows affected the density of the WNV vector
mosquitoes.
Combined sewer system overflow discussion. A significantly higher proportion
of mosquito traps within 1 km from a CSO event had a WNV infected pool, when
compared to mosquito traps more than 1 km from CSO events in 2009. The same year,
with a record breaking flood in September, the combined sewer systems had a difference
of 6% increase in events, when compared to temporal trends of the following years. In
2010-2012, the cases of WNV mosquito pools were predominately more than 1 km from
a CSO event. The impact of the mosquito population, as a result of a flood phenomenon,
would be difficult to estimate. Shaman, Day and Stieglitz (2004) associated human
arboviral cases in south-central Florida as significantly associated with spatial-temporal
patterns of drought and wetting. Mosquitoes need nutrient rich water to lay their eggs and
develop, of which flood waters can provide an abundance of water suitable to support
oviposition. In consideration, when sewer systems, creeks and rivers water volume swell
in excess, this event causes currents that would wash away the developing mosquitoes

120
(Metzger, 2004). The timing of 2009 flood disrupted the mosquito’s most abundant
months of August and September in the area. The conditions for mosquito development
require standing water as an ideal condition to lay eggs. There is also the factor that
standing water after the floor waters recede, would be ideal conditions for mosquito
development. Chaves et al. (2009) research indicates the polluted water releases from
combined sewer systems could alter mosquito populations by acting as an attractant and
concentrator of gravid females. Ciota et al. (2012) examined the dispersal and flight
distance of Culex mosquitoes from a wastewater treatment plan in New York. The more
dominant mosquitoes in northeastern United States were examined in the study, of which
included Culex pipiens (of which Culex quinquefasciatus is a member of the species
complex) and Culex restuans. Ciota et al. (2012) determined Culex mosquitoes traveled a
minimum of 0.16 km, a maximum of 1.98 km, and a median of travel of 1.33 km from
the wastewater treatment facility. This study supports the flight distance of Culex
mosquitoes to areas of wastewater processing. A common factor was the dominating
presence of the Culex spp. and Culex quinquefasciatus mosquitoes averaging a 1 km
flight range. In addition, the CSO events in 2009 and 2010 reveal a significantly higher
proportion of negative to positive WNV mosquito pools within 1 km of a CSO event. In
2009, when the Aedes Albopictus was prevalent, the average distance between a WNV
positive vector trap location to a CSO event encompassed 40% of WNV positive
mosquito pools (representing 90% of the total) more than 1 km, but 68% (representing
the remaining 10% of the total) within 1km. This finding suggests mosquito abundance is

121
not as attracted to CSO areas since the reduction, but could concentrate the more virulent
mosquitoes near CSO areas. This finding also supports Vazquez-Prokopec et al. (2010)
study of which the proportion of WNV positive Culex quinquefasciatus pools was found
to be significantly higher within 1 km of a CSO stream. In 2011, the number of WNV
positive pools was nearly equal to 2010, with less CSO events, of which the Culex
quinquefasciatus dominated the entire year until the Culex restuans appearance. Having a
WNV infected pool near a CSO area in 2010 and 2011 respectively, was associated up to
a 7 times greater risk to WNV infected mosquito pool. In addition, each km increase in
distance from trap location was associated with up to 10% decrease in risk to WNV
infected mosquito pool and was found to be statistically significant. In 2012, the number
of WNV positive pools were less than half of 2010 and 2011, with less CSO events,
resulting in significantly higher infection rates in mosquito pools more than 1 km
distance from CSO events. The higher mosquito pool infection rates in 2012 did not
correspond within 1 km of a CSO event, of which the dominant Ochlerotatus japonicas
and Ochlerotatus triseriatus species was collected. The positive pools more than 1 km
from a CSO event is temporal to the less dominate Uranotaenia sapphirina species flight
range, yet the Uranotaenia sapphirina species was only captured by gravid traps in 3
weeks of the entire season. CSO events were not associated with 2012 mosquito
abundance or virulence in pools over 1 km. During the same year, CSO events were
greatly reduced when compared to 2009-2011. In addition, the Culex species were not the
dominant species. This result first suggests the availability in oviposition sources may

122
affect the mosquito species survivability and ability to dominate an area. Second, this
result indicate points of mosquito WNV infections can expand beyond CSO events in
accordance to the dominant vector mosquito flight range. Vazquez-Prokopec et al. (2010)
research from year 2001 to 2007 for the Atlanta area reveal a median mosquito infection
rate (ML 6.93) approximately 50% greater than this research median mosquito infection
rate (ML 3.83) from 2009 to 2012. This research finding provide an indication that the
reduction of CSO systems in the Metropolitan Atlanta area may alter the dynamics of
WNV infections. Further research is needed to support the effects of reduced CSO
systems on WNV infection rates.
Sanitary sewer system overflow discussion. Vazquez-Prokopec et al. (2010)
found human cases near CSO streams did not overlap with clusters of WNV positive
Culex quinquefasciatus mosquitoes in a wealthy area of North Fulton County, stating
differential exposure of the human population in such areas. This result opens the
question of considering the condition of the sewer system pipes in the area. Meaning,
considering the conditions of sanitary sewer systems as an alternate source to hosting
WNV vectors in an area may explain this finding that compared high-income to low-
income areas, where CSO streams may not be a driving factor. This research did not
explore the area conditions of sanitary sewer pipes to income area, but first introduced
sanitary sewer systems spills as a consideration in supporting WNV vectors. This
research included combined sewer system overflows but also considered the effects of
sanitary sewer overflows as a mechanism governing the attraction of female mosquitoes
123
for oviposition preferences.
DeKalb County consists of approximately 2,600 miles of sanitary sewer system
pipes. Fulton County has sanitary sewer system pipes that services expand throughout the
70 miles of county area. Between the two counties, the City of Atlanta contains 1,610
miles of sanitary sewer system pipes, whereas there are 86 miles of combined sewer
systems. The areas of sanitary sewer systems are expansive when compared to the
consolidated area of which combined sewer systems are contained. Conversely, the
combined sewer systems contribute to an expanded area when raw spillage is released
into contributive creeks, but do not expand to most areas of the counties as sanitary sewer
system pipes.
A statistically significant proportion of mosquito traps within 1 km from a SSO
event had a WNV infected pool, in 2010 and 2011. Each year following 2009, the
percentage of WNV infected pools increased within 1 km from a SSO event, and risk
rates increased near a SSO event. During the same years the Culex spp. and Culex
quinquefasciatus species with shorter fight distances were dominant, of which
corresponds to the increase of WNV positive mosquito pool within 1 km of a SSO event.
In 2012, the number of WNV positive and negative pools were nearly equal. The
difference of mosquito WNV infection between distances from SSO events were also
nearly equal. Approximately one half of mosquito abundance, virulence, and distance to
and from SSO events correspond to the dominant Ochlerotatus japonicas and
Ochlerotatus triseriatus species flight range. Whereas, nearly the other half of mosquito

124
abundance, virulence, and distance to and from SSO events correspond to the presents of
the less dominate Uranotaenia sapphirina species flight range extending over 12
kilometers. When considering the potential of sanitary sewer overflow providing an
oviposition source and the mosquito species flight ranges, infected vectors can expand
over significant portions of the county area. This research findings supports previous
research that conclude spatial clustering of WNV infection occur in areas of available
oviposition medium and mosquito vector abundance.
Concluding discussion. The goals for this study includes investigating the
influence of both combined and sanitary sewage overflows on adult mosquito abundance.
Mosquito abundance was greater near areas of higher CSO and SSO events per square
kilometer. Calhoun et al. (2007) study identified 95% of all WNV positive mosquito
pools as containing Culex quinquefasciatus in Georgia, and that Vazques-Prokepec et al.
(2010) found combined sewer overflows were significant urban breeding sites for Culex
mosquitoes in Atlanta. Resent research findings for the metropolitan Atlanta area include
data before the combined sewer systems reduction in November 2008, record flood in
September 2009, and did not consider sanitary sewer systems as an oviposition source.
Within DeKalb and Fulton Counties, human mediated influences include available
combined sewers and maintenance of sanitary sewer pipes due to age and clogging
agents. However, during periods of heavy precipitation the overflow of sewer systems
introduce untreated, nutrient rich water sources (conducive to mosquito proliferation)
onto urban landscapes. An important factor for determining mosquito abundance is to

125
understand the habitat choice of gravid females distinguishing the best habitat for
offspring survival (Chaves et al., 2009). When comparing the density of mosquitoes and
the density of CSO and SSO events, the mosquito abundance was greater near areas of
higher CSO and SSO events per square kilometer. Areas of WNV positive mosquito
vectors appear concentrated in Northern DeKalb County, of which the area sewer is
treated by the R. M. Clayton Plant and is mainly comprised of the Nancy Creek Basin,
the North Fork Creek Basin, and the South Fork Creek Basin. In contrast, no CSO are
within the Northern DeKalb County area, only SSO events. Sewer system overflows
provide the nutrient rich conditions to enhance oviposition of mosquitoes and is a
consideration for the spatial distribution of WNV infection in DeKalb and Fulton County.
Therefore, the amount of combined sewer overflows and conditions of municipal sanitary
sewer pipes has the potential to reduce sources that contribute to mosquito borne disease
risks in the area.
The spatial distribution of WNV infection in DeKalb and Fulton Counties from
sewer overflows were identified. Comparing the census tracts distribution of CSO/SSO
events and clusters of WNV infected vectors identified hot spots of mosquito abundance
near CSO/SSO events in Central Fulton County and hot spots of WNV infected vectors
near SSO events in Mid-West to South DeKalb County. The dramatic difference in 2012,
displayed a shift in prominent WNV vectors and an increase in the WNV infection rate,
and a significant SSO event association. Within the Atlanta area flood year and 2012,
results identified mosquitoes with flight distances within 1 km and over 1 km were in

126
equal proportion near SSO events. The 2010 and 2011 results significantly associate
WNV infection risk closest to SSO events and significantly reducing per 1 km distance
from SSO events. The variability of dominant mosquito species and flight distances also
corresponded to areas of SSO events. Research findings significantly associated sanitary
sewer overflow events to WNV infected mosquito pools. As shown by this research when
SSO events introduce nutrient rich water, the medium can attract and support nonspecific
species in addition to the Culex quinquefasciatus vector. As a result, the degree of
available oviposition sources as SSO events are likely to influence differences of
mosquito species diversity. Therefore, this study encourages the consideration of SSO
events in addition to CSO system sources with other environment conditions.
With significant associations of WNV infection to the proximity of both CSO and
SSO events, there are influencing environmental factors not considered by this study.
Gibbs et al. (2006) provide an alternate insight to the potential of a human altered
environment and the importance of WNV vector dependence on January temperature as
the main factors affecting the geographic distribution of WNV in Georgia. In another
perspective, Chaves et al. (2009) experiments determined “...the supporting local
differences in the oviposition medium as the most important factor governing oviposition
habitat choice”. Whereas, Ellis (2008) propose incorporating a density dependence into
the oviposition preference, as a predicting tool to offspring survivability, of which could
aid in the explanation of the varying dominate mosquito species each year. Overall, this
research finding give insight on how CSO/SSO events govern the local vector mosquito

127
species abundance and the likely proximity of mosquito WNV infection.
Discussion of 3
The following is the interpreted results using the null/alternative hypotheses:
3. What is the spatial association between WNV-infected mosquito pools and
WNV-human infection?
H0: There is no significant association between distances to WNV infected
mosquito pools and WNV human infection.
H1: There is a significant association between distance to WNV infected
mosquito pools and WNV human infection.
The final research question is answered with the objective to access the
relationship of WNV human cases and the proximity to WNV vector mosquito pools
infection. Corresponding to the mosquito species extended flight range during this study
period, average distance for human cases increased by a kilometer. Compared to 2009-
2011, 2012 revealed (a) 28% of the tested pools were positive for WNV infection; (b) the
infection rate of mosquito pools increased by 15%; and (c) the human infection more than
doubled, without detecting evidence of the dominating Culex species at the end of the
adult mosquito surveillance season. The mosquito infection rates to confirmed human
infection rates, suggests a temporal pattern for risk factors of WNV infection. When
comparing the previous distance between WNV positive vector trap location and human

128
cases, the distance increased by 3 kilometers in 2012. In addition, 2012 held the highest
human WNV infection rate that is comparable to the most virulent year of 2001. The
distance of WNV positive vector trap and human cases are temporal to the dominate
mosquito species flight range in 2009-2011, and the dominate mosquito species flight
range in 2012. On a regional scale, DeGroote, Sugumaran, and Ecker, M. (2014)
associations were consistent with the dominant vectors for regions in the United States
and spatial patterns of the presence. DeGroote et al. (2014) also referenced that the
abundance of potential hosts were considered important factors that might help explain
variations in WNV occurrence. The human cases of WNV infection in DeKalb and
Fulton County directly correspond to the mosquito rates of infection collected by adult
surveillance.
The spatial distribution of WNV infection in DeKalb and Fulton County is also
answered by considering the comparison of clusters of human WNV infection and
clusters of WNV infected mosquito pools. Human WNV infection rate was determined
using LISA method with EB smoothed infection rates. The LISA identified two clusters
of human WNV infections, of which one was located in the north area of DeKalb County,
and the second was located in eastern Fulton County and western DeKalb County, and
results suggests that these two clusters are not statistically significant. The regression
analysis did show that with each 1 km increase in distance between a census tract
centroid and WNV positive mosquito trap, was associated with over a 10% decrease in
human WNV incidence rate. The logistic regression model did not find a statistically

129
significant association between human WNV incidence rates, the distance between
census tracts centroid, and closest mosquito trap with a WNV positive pool.
Limitations of the Study
A prospective study may be a preferred design, but a retrospective study can
reveal a useful purpose. This retrospective study was able to determine the feasibility of
considering sanitary sewer systems for a prospective study. With any retrospective
research study, the data recorded existed for purposes other than research. Collecting
additional data or missing data was impossible. The limitation in collecting additional
data includes the trap areas and frequency of mosquito surveillance collection. The
county budgets also influenced the amount of mosquito traps used and how often placed
for surveillance. In addition, there was no feasible way of confirming the influence of the
mosquito species dominance for combining factors as areas of larvicided applications;
human landscape changes; and patterns of WNV reservoir hosts. There were limitations
that sewer system overflow events might not occur until piping conditions are aggravated
by weather events or the quantity of pipe clogging/destructing agents as grease disposal
or vandalism is greater in some areas then others. Another limitation to this study is
confirming where adult mosquito’s bites took place on human subjects leading to WNV
infections. There is no logical or feasible way to confirm the accuracy of this information
but to consider the location estimation of those individual human WNV cases.

130
Recommendations
The goals of this study has been to (a) understand the association of combined
sewer system overflows; (b) introduce the consideration of sanitary sewer system
overflows as a WNV vector attractant; (c) investigate WNV mosquito vector flight
association; and (d) understand the investigating factors to human WNV infections in
DeKalb and Fulton County. The results of this study should be of interest to public health
officials and researchers because there are several findings that have materialized after
consummation of the study that postulate further examination. First, the City of Atlanta
was successful in reducing combined sewer overflows each year since 2009, yet human
WNV infections increased each year. Additional research is necessary to examine the
factors that decisively affects the outcome of increased WNV infection, when the
abundance of CSO overflows/stream has been extensively associated. Next, sanitary
sewer system overflows have not been considered in research as an ovipositional source
for WNV vectors, but was found significantly associated with WNV infections.
Expanding the consideration of sanitary sewer system overflows in research can provide
a more comprehensive analysis of factors for West Nile infections. For instance,
exploring the pipe age of sewer system spills in contrast to income level in a community
could reveal an association of the alternate perspective. Additional knowledge of sanitary
sewer system overflows will aid in increasing priority to developing methods for
repairing aging infrastructure. Last, dominating species of WNV mosquito vectors
changed year to year, of which ranges in flight ability, could vary the proximity of human

131
WNV infection. Further investigation of ecological landscapes that influence mosquito
abundance among species can provide key insights to divergence of species dominance.
Contributions of the ecological and geographical isolation to species abundance are
limited and increasing spatial knowledge makes it possible to accurately estimate the
effect of arboviral diseases. In addition, early identification and tracking of the dominate
mosquito species could facilitate necessary shifts in pesticide control measures based on
the preferred habitat and feeding habits of the species. This research provides a step
toward progress in knowledge that will reduce the rate of WNV infection and
implications of reduce resources needed to protect the public.
This study supports some findings from state and local studies while also
indicating new factors for the spread of WNV infections. Previous research has examined
the impact of climate, demographic, geographic and vector-hosts of human WNV
infection. Entomological research has provided knowledge of pathogen carriers,
ecological factors, and influences of mosquito distribution. Throughout the United States
research has associated combined sewer overflows/streams to enhancing mosquito WNV
vector abundance. With shared knowledge and new findings, results should be communal
to community members, high risk groups, local public health departments, medical
professionals, and to public health officials as they continue to educate the public and
monitor WNV infections. Expanding knowledge is of maximal importance to continued
exploration of environmental influences leading to human WNV disease. For instance,
increasing the understanding of factors that support opportunities for oviposition

132
decisions across a heterogeneous environment, are likely to influence mosquito species
diversity, and ultimately effecting risk for human WNV infection. Determining other
WNV risk factors, as sanitary sewer system overflows, can demonstrate how gained
knowledge provides the influence for managing the sewer system infrastructure to
mitigate potential public health issues. Although there are local priorities currently
established in wastewater management and pest control programs, creating hyper
awareness of how individual households and businesses can contribute to prevention by
exercising such practices as personal protective measures and not disposing grease within
the wastewater system, can help reduce risk factors. Continued evaluation of local
educational programs, existing programs, and introducing complementary programs can
place emphasis on addressing systemic issues that can reduce population risk.
Public Health Implications
In the United States, WNV continues to be prevalent. For instance, in the United
States from 2012 to 2014, CDC confirmed human WNV cases has progressed from 5,674
in 2012, to 2,469 in 2013, and currently 1,177 as of October 1, 2014. In 2012, the United
States experienced the highest number of human WNV cases since onset in 1999;
simultaneously, Georgia experienced the same peak of human WNV cases but since
2002. The fatality count of WNV has been a measuring focus when determining the
impact of the disease. Public health officials must continue to advocate for the meningitis
and encephalitis survivors of WNV disease, representing more than half of confirmed
cases. In addition to educational awareness, research must continue to understand the

133
conditions that associate with the spread of WNV. Since onset in 1999, research has
provided findings that have clearly made an impact for social change through public
health application and education. A key indicator of human WNV infection is determined
with the abundance of the mosquito WNV vector population. This study specifically
explored associations of sewer system overflow, WNV mosquito vectors, and human
cases among DeKalb and Fulton County from 2009-2012. These findings improve the
current understanding of sources for site selection by WNV vector species. As a result,
research implications contribute to shared information both in support of previous
findings and considering novel sources that contribute to WNV proliferation. The key to
raising awareness is incorporating research findings into public health educational
programs that focus on reducing the mosquito population, while also acknowledging the
serious health impact of WNV in support of survivors.
Conclusion
How well sources of WNV disease are researched and findings contribute to the
base knowledge, the more likely education can increase prevention. Investigating
combined sewer overflows, sanitary sewer overflows, mosquito abundance and flight
range, provide significant impacts on the risk of human WNV infection. Gaining insight
to conditions that encourage WNV infection in DeKalb and Fulton County provides a
small part to the overall knowledge base, but the difference can provide direct lifesaving
benefits to the local area. Though this study provides valuable information to researchers
and public health workers, perhaps a prospective study can further assess these

134
associations.

135
References
Allan, B. F., Langerhans, R. B., Ryberg, W. A., Landesman, W. J., Griffin, N.W., Katz,
R. S., ...Chase (2009). Ecological correlates of risk and incidence of West Nile
virus in the United States. Berlin/Heidelberg: Springer-Verlag Oecologia.
Anyamba, A., Linthicum, K.J., & Tucker, C.J. (2001). Climate-disease connections: Rift
Balley fever in Kenya. Cad Sude Publica, 17(Supplement), 133-140.
Biggerstaff, B.J. (2009). PooledInfRate, version 4.0: a Microsoft Excel add-in to compute
prevalence estimates from pooled samples. Centers for Disease Control and
Prevention Fort Collins, CO. Retrieved from
http://www.cdc.gov/ncidod/dvbid/westnile/software.htm
Blitvich, B.J. (2008). Transmission dynamics and changing epidemiology of West Nile
virus. Animal Health Research Reviews, 9(1), 71–86. doi:
10.1017/S1466252307001430
Boos, S.B. (2009). A spatial analysis of demographic factors of West Nile virus in
Georgia (Master’s thesis). Retrieved from
http://digitalarchive.gsu.edu/iph_theses/68. (Paper 68).
Brownstein, J.S., Rosen, H., Purdy, D., Miller, J.R., Merlino, M., Mostashari, R., & Fish,
D. (2002). Spatial analysis of West Nile virus: rapid risk assessment of an
introduced vector-borne zoonosis. Vector Borne and Zoonotic Diseases, 2(3),
157-164.
Calhoun, L.M., Avery, M., Jones, L., Gunarto, K., King, R., Roberts, J., & Burkot, T.R.

136
2007. Combined sewage overflows (CSO) are major urban breeding sites for
Culex quinquefasciatus in Atlanta, Georgia. American Journal of Tropical
Medicine and Hygiene, 77, 478-484.
Carson, P.J., Konewko, P., Wold, K. S., Mariani, P., Goli, S. Bergloff, P., & Crosby, R.
D. (2006). Long-term clinical neuropsychological outcomes of West Nile virus
infection. Clinical Infectious Diseases, 43, 723–730.
Centers for Disease Control and Prevention. (2008). West Nile virus: Clinical
Description. Retrieved from
http://www.cdc.gov/ncidod/dvbid/westnile/clinicians/clindesc.htm#fever
Centers for Disease Control and Prevention. (2010). West Nile Virus: Statistics & Maps.
Retrieved from http://www.cdc.gov/westnile/index.html
Centers for Disease Control and Prevention. (2012, August 1). Press release: West Nile
virus disease cases up this year. Retrieved from
http://www.cdc.gov/media/releases/2012/p0801_west_nile.html
Centers for Disease Control and Prevention. (2013). West Nile Virus. Retrieved from
http://www.cdc.gov/westnile/
Center for Food Security & Public Health. (2009, October 28). West Nile Virus Infection.
Retrieved from http://www.cfsph.iastate.edu/DiseaseInfo/disease.php?name=
west-nile-virus&lang=en
Chaves, L.F., Keogh, C.L., Vazquez-Prokopec, G.M., & Kitron, U.D. (2009). Combined
sewage overflow enhances oviposition of Culex quinquefasciatus in urban areas.

137
Journal of Medical Entomology, 46(2), 220-226. Doi: 10.1603/033.046.0206
Ciota, A.T., Drummond, C.L., Ruby, M.A., Drobnack, J., Ebel, G.D., & Kramer, L.D.
(2012). Dispersal of Culex mosquitoes from a wastewater treatment facility.
Journal of Medical Entomology, 49(1), 35-42.
DeGroote, J.P., Sugumaran, R., Brend, S.M., Tucker, B.J., & Bartholomay, L.C.
(2008). Landscape, demographic, entomological, and climatic associations with
human disease incidence of West Nile virus in the state of Iowa, USA.
International Journal of Health Geographics, 7(19). doi:10.1186/1476-072X-7-19
DeGroote, J.P., Sugumaran, R., & Ecker, M. (2014). Landscape, demographic and
climatic associations with human West Nile virus occurrence regionally in 2012
in the United States of America. Geospatial Health, 9(1), 153-168.
DeKalb County. (2012). Department of watershed management. Retrieved from
http://www.dekalbwatershed.com/
Drake, J. (2009). Evolutionary relationships among human-isolated and wildlife-isolated
West Nile viruses. Infection, Genetics and Evolution.
doi: 10.1016/j.meegrid.2009.07.008
Eisen, R.J. & Eisen, L. (2008). Spatial modeling of human risk of exposure to vector-
borne pathogens based on epidemiological versus arthropod vector data. Journal
of Medical Entomology, 45(2), 181-192.
Ellis, A.M. (2008). Incorporating density dependence into the oviposition preference
offspring performance hypothesis. Journal of Animal Ecology, (77), 247-256.

138
Environmental Protection Agency. (2012). Sanitary sewer overflows and peak flows.
Retrieved from http://cfpub.epa.gov/npdes/home.cfm?program_id=4
ESRI. (2013). An overview of the Spatial Statistics toolbox. Retrieved from ArcGIS Help
10.1. http://www.resources.arcgis.com
Ferguson, D.D., Gershman, K., LeBailly, A. & Peterson, L.R. (2005). Characteristics of
the rash associated with West Nile virus fever. Clinical Infectious Diseases, (41),
1204-1207.
Fulton County Georgia website. (2012). Fulton County Department of Health &
Wellness. Retrieved from http://fultoncountyga.gov/dhw-home
Georgia Department of Environmental Protection. (2012). [Open records, reports from
wastewater facilities]. Unpublished raw data obtained by open records request.
Georgia Department of Natural Resources. (2011). Office of State Climatologist,
Environmental Protection Division. Retrieved from http://www.gadnr.org/natural
Georgia Department of Public Health. (2008). Vector-borne and zoonotic disease
summary 2002-2006. Retrieved from http://health.state.ga.us/epi/zvbd/
Georgia Department of Public Health. (2013). Public Health Information Portal (PHIP).
Retrieved from https://dph.georgia.gov/phip-data-request
Georgia Forestry Commission. (2005). From Greenscapes to Hardscapes: A Study of
Tree Canopy and Impervious Surface Change in the Metro Atlanta Area. A Joint
Project of Upper Chattahoochee Riverkeeper and University of Georgia.
Retrieved from http://www.chattahoochee.org/hardscape.htm
139
Gomez, A., Kilpatrick, A.M., Kramer, L.D., Dupuis, A.P., Maffei, J.G., Goetz, S.J.,
…Aguirre, A.A. (2008). Land use and West Nile virus seroprevalence in wild
mammals. Emerging Infectious Diseases, 14(6), 962-965.
Hayes, E.B. & Gubler, D.J. (2006). West Nile virus: epidemiology and clinical features
of an emerging epidemic in the United States. Annual Reviews of Medicine, (57),
181-194. doi: 10.1146/annurev.med.57.121304.131418
Hayes, E.B., Sejvar, J.J., Zaki, S.R., Lanciotti, R.S., Bode, A.V. & Campbell, G.L.
(2005). Virology, pathology, and clinical manifestations of West Nile virus
disease. Emerging Infectious Diseases, 11(8), 1174-1179.
John W. Hock Company. (2010a). CDC Gravid Trap. Retrieved from
http://johnwhock.com/products/mosquito-sandfly-traps/cdc-gravid-trap/
John W. Hock Company. (2010b). CDC Miniature Light Trap. Retrieved from
http://johnwhock.com/products/mosquito-sandfly-traps/cdc-miniature-light-trap/
Jones, R.C., Weaver, K.N., Smith, S., Blanco, C., Flores, C., Gibbs, K., …Mutebi, J.
(2011). Use of the vector index and geographic Information System to
prospectively inform West Nile virus interventions. Journal of the American
Mosquito Control Association, 27(3), 315-319.
Kelly, R., Mead, D., McNelly, J., Burkot, T., & Kerce, J. (2007, March 27-29).
Combined sewer systems and the potential for vector-borne disease in Georgia.
Proceedings of the 2007 Georgia Water Resources Conference, University of
Georgia, Athens, Georgia.

140
Klee, A.L., Maldin, B., Edwin, B., Poshni, I., Mostashari, F., Fine, A., … Nash, D.
(2004). Long-term prognosis for clinical West Nile virus infection. Emerging
Infectious Diseases, 10(8), 1405-1411.
Kulldorff, M. (1997). A spatial scan statistic. Communications in statistics, theory and
methods, 26, 1481-1496.
Kurane, I. (2005). [West Nile fever and West Nile encephalitis]. Clinical neurology
(Japan), 45(11), 884-886.
Kwan, J.L., Park, B.K., Carpenter, T.E., Ngo, V., Civen, R., & Reisen, W.K. (2012).
Comparison of enzootic risk measures for predicting West Nile disease, Los
Angeles, California, USA, 2004-2010. Emerging Infectious Disease, 18(8), 1298-
1306.
Landesman, W.J., Allan, B.F., Langerhans, R.B., Knight, T.M., & Chase, J.M. (2007).
Inter-annual associations between precipitation and human incidence of West Nile
virus in the United States. Vector-Borne and Zoonotic Diseases, 7, 337-343.
Lima, A., Wyatt, E., & Saunders, M. (2012). Mosquito control efforts of Clark in Fulton
County, GA. Presentation of the 2012 Georgia Mosquito Control Association
Conference, held October 17-19, 2012, at the University of Georgia, Athens,
Georgia.
Lindsey, N.P., Staples, J.E., Lehman, J.A., & Fischer, M. (2010). Surveillance for human
West Nile virus disease – United States, 1999-2008. Morbidity and Mortality
Weekly Report (MMWR), 59(SS-2).

141
Menach, A.L., McKenzie, F.E., Flahault, A., & Smith, D.L. (2005). The unexpected
importance of mosquito oviposition behavior for malaria: non-productive larval
habitats can be sources for malaria transmission. Malaria Journal, 4(23). doi:
10.1186/1475-2875-4-23
Metzger, M.E. (2004). Managing mosquitoes in stormwater treatment devices
(Publication 8125). University of California, Division of Agriculture and Natural
Resources, City, State.
Miller, B.R., Crabtree, M.B., & Savage, H.M. (2007). Phylogeny of fourteen Culex
mosquito species, including the Culex pipiens complex, inferred from the internal
transcribed spacers of ribosomal DNA. Insect Molecular Biology, 5(2), 93-107.
O'Leary, D.R., Nasci, R.S., Campbell, G.L., & Marfin, A.A. (2002). West Nile Virus
Activity-United States, 2001. Morbidity and Mortality Weekly Report (MMWR),
51(23), 497-501.
Ord, J.K. & Getis, A. (2001). Testing for local spatial autocorrelation in the presence of
global autocorrelation, Journal of Regional Science, 41(3), 411-432.
Moudy, R.M., Meola, M.A., Morin, L.L., Ebel, G.D., & Kramer, L.D. (2007). A newly
emergent genotype of West Nile virus is transmitted earlier and more efficiently
by Culex mosquitoes. The American Journal of Tropical Medicine and Hygiene,
77, 365-370.
National Climatic Data Center. (2012). National Oceanic and Atmospheric
Administration. Retrieved from http://www.ncdc.noaa.gov/land-based-station-

142
data/climate-data-online
National Weather Service. (2013). National Oceanic and Atmospheric Administration.
Retrieved from http://www.weather.gov
O’Leary, D.R., Marfin, A.A., Montgomery, S.P., Kipp, A.M., Lehman, J.A., Biggerstaff,
B.J., … Campbell, G.L. (2004). The epidemic of West Nile virus in the United
States, 2002. Vector Borne Zoonotic Diseases, 4(1), 61-70.
Ord, J.K. & Getis, A. (2001). Testing for local spatial autocorrelation in the presence of
global autocorrelation, Journal of Regional Science, 41(3), 411-432.
Ozdenerol, E., Bialkowska-Jelinska, E., Taff, G.N. (2008). Locating suitable habitats for
West Nile Virus-infected mosquitoes through association of environmental
characteristics with infected mosquito locations: a case study in Shelby County,
Tennessee. International Journal of Health Geographics, 7-12.
Reisen, W.K., Fang, Y., & Martinez, V. (2006). Effects of temperature on the
transmission of West Nile virus by Culex tarsalis (Diptera: Culicidae). Journal of
Medical Entomology, 43(2), 309-317.
Rueda, L.M., Patel, K.J., Axtell, R.C., & Stinner, R.E. (1990). Temperature-dependent
development and survival rates of Culex quinquefasciatus and Aedes aegypti
(Diptera: Culicidae). Journal of Medical Entomology, 27(5), 892-898.
Ruiz, M.O., Chaves, L.F., Hamer G.L., Sun, T., Brown, W.M., Walker E.D., …Kitron
U.D. (2010). Local impact of temperature and precipitation on West Nile virus infection
in Culex species mosquitoes in northeast Illinois, USA. Parasites & Vectors, 3(1), 19.

143
Scheraga, J.D. (2008). Opportunities to anticipate and adapt to the effects of climate
change on water quality. National Summit on Coping with Climate Change
[Background Paper for Water Quality Sector], US Environmental Protection
Agency.
Shaman, J., Day, J.F., & Stieglitz, M. (2005). Drought-induced amplification and
epidemic transmission of West Nile virus in southern Florida. Journal of Medical
Entomology, 42(2), 134-141.
Shaman, J., Stieglitz, M., Stark, C., Le Blancq, S. and Cane, M. (2002). Using a dynamic
hydrology model to predict mosquito abundances in flood and swamp water.
Emerging Infectious Diseases, 8(1).
Soverow, J.E., Wellenius, G.A., Fisman, D.N., and Mittleman, M.A. (2009). Infectious
Disease in a Warming World: How weather influenced West Nile virus in the
United States (2001–2005). Environmental Health Perspectives, 117 (7), 1049-
1052.
Strickman, D. (1988). Rate of oviposition by Culex quinquefasciatus in San Antonio,
Texas, during three years. Journal of the American Mosquito Control Association,
4(3), 339-344.
Trawinski, P.R., Mackay, D.S. (2010). Identification of environmental covariates of West
Nile virus vector mosquito population abundance. Vector borne and zoonotic
diseases, 10(5), 515-26.
Turell, M.J., Dohm, D.J., Sardelis, M.R., Oguinn, M.L., Andreasdis, T.G., & Blow, J.A.

144
(2005). An update on the potential of North American mosquitoes (Diptera:
Culicidae) to transmit West Nile Virus. Journal of Medical Entomology, 42(1),
57-62.
Turell, M.J., Sardelis, M.R., Dohm, D.J., & Oguinn, M.L. (2001). Potential North
American vectors of West Nile virus. Annals of the New York Academy of
Sciences, 951, 317-324.
United States of America and the State of Georgia v. DeKalb County. (Dec. 20, 2011).
Consent Decree.
United States Census Bureau. (2012). State & County Quick Facts. Retrieved from
http://quickfacts.census.gov
United States Geographical Survey. Retrieved from
http://www.usgs.gov/pubprod/
Vazquez-Prokopec, G.M., Eng, J.L., Kelly, R., Mead, D.G., Kolhe, P., Howgate, J.,
… Burkot, T.R. (2010). The risk of West Nile virus infection is associated with
combined sewer overflow streams in urban Atlanta, Georgia, USA. Environmental
Health Perspective, 118(10), 1382–1388.
Waller, L.A. & Gotway, C.A. (2004). Applied spatial statistics for public health data.
Hobken, NJ: John Wiley & Sons.
Wang, G., Minnis, R.B., Belant, J.L., & Wax, C.L. (2010). Dry weather induces
outbreaks of human West Nile virus infections. BMC Infectious Diseases, 10(38).
Appendix : Georgia Department of Public Health Permission

145