Seventh National Communication under the Seventh National ... · Contributing authors: Paolo...
352
Seventh National Communication under the UN Framework Convention on Climate Change Italy Seventh National Communication under the UN Framework Convention on Climate Change Italy December 2017
Transcript of Seventh National Communication under the Seventh National ... · Contributing authors: Paolo...

Seventh National Communication under the
UN Framework Convention on Climate Change
Italy
Seventh National Communication under the UN Framework Convention on Climate Change
Italy
December 2017


GENERAL SUPERVISOR:
Francesco La Camera- Ministry for the Environment, Land and Sea (IMELS)
GENERAL COORDINATION AND EDITING
Federica Fricano, Alessandro Negrin, Vanessa Leonardi, Chiara Di Mambro – Ministry for the
Environment, Land and Sea (IMELS)
Riccardo De Lauretis – Institute for Environmental Protection and Research (ISPRA)
AUTHORS:
Chapter 1 – Executive Summary
Chapter 2 - National circumstances
Lead author: Andrea Gagna (ISPRA);
Contributing authors: Antonella Bernetti (ISPRA), Antonio Caputo (ISPRA), Eleonora Di Cristofaro
(ISPRA), Barbara Gonella (ISPRA), Ernesto Taurino (ISPRA), Marina Vitullo (ISPRA), Franco Desiato
(ISPRA).
Chapter 3 – Greenhouse gas inventory
Lead authors: Daniela Romano (ISPRA); Chiara Arcarese (ISPRA).
Contributing authors: Antonella Bernetti (ISPRA), Antonio Caputo (ISPRA), Riccardo De Lauretis
(ISPRA), Eleonora Di Cristofaro (ISPRA), Andrea Gagna (ISPRA), Barbara Gonella (ISPRA), Ernesto
Taurino (ISPRA), Marina Vitullo (ISPRA).
Chapter 4 – Policies and measures
Lead author: Monica Pantaleoni (ISPRA).
Contributing authors: Riccardo De Lauretis (ISPRA), Eleonora Di Cristofaro (ISPRA), Domenico
Gaudioso (ISPRA), Barbara Gonella (ISPRA), Marina Colaiezzi (ISPRA), Ernesto Taurino (ISPRA),
Marina Vitullo (ISPRA), Federico Brocchieri (ISPRA).
Chapter 5 – Projections and effects of policies and measures
Lead authors: Antonio Caputo (ISPRA), Emanuele Peschi (ISPRA).
Contributing authors (ISPRA): Mario Contaldi (ISPRA), Riccardo De Lauretis (ISPRA), Eleonora Di
Cristofaro (ISPRA), Barbara Gonella (ISPRA), Monica Pantaleoni (ISPRA), Daniela Romano (ISPRA),
Ernesto Taurino (ISPRA), Marina Vitullo (ISPRA).
Chapter 6 – Vulnerability assessment, climate change impacts and adaptation measures
Lead authors: Clara Pusceddu (IMELS), Fabiana Baffo (IMELS), Giulia Galluccio (CMCC), Valentina
Mereu (CMCC), Francesca Giordano (ISPRA)
Contributing authors: Mara Balestrieri (IMELS), Andrea Masullo (IMELS), Eleonora Cogo (CMCC).
Chapter 7 – Financial resources and transfer of technology, including information under
Articles 10 and 11 of the Kyoto Protocol
Lead authors: Samantha Sapienza (IMELS), Alessandro Negrin (IMELS), Swan Senesi (IMELS) and
Karima Oustadi (IMELS).
Contributing authors: Paolo Angelini (IMELS), Felice Cappelluti (IMELS), Giorgia Caropreso (IMELS),
Elisabetta Colaiacomo (IMELS), Gabriella Rossi Crespi (IMELS), Loredana Dall’Ora (IMELS), Roberta
Ianna (IMELS), Bruna Kohan (IMELS), Vanessa Leonardi (IMELS), Silvia Massimi (IMELS), Cristiano
Piacente (IMELS), Marco Strincone (CNR-IIA), Verusca Vegini (IMELS), Ludovica Soderini (MEF),
Grammenos Mastrojeni (MFAIC).

Chapter 8 – Research and systematic observations
Lead authors: Giulia Galluccio (CMCC), Antonio Navarra (CMCC)
Contributing authors: Maria Libera Battagliere (ASI), Antonio Bombelli (CMCC), Valentina Bacciu
(CMCC), Giovanni Coppini (CMCC), Silvio Gualdi (CMCC), Paola Mercogliano (CMCC), Nadia Pinardi
(Università di Bologna), Eugenio Sini (CMCC), M. Cristina Facchini (CNR-ISAC), Vito Vitale (CNR-
ISAC), Fabio Trincardi (CNR-ISAC), Antonello Provenzale (ISAC-CNR), Sergio La Motta (ENEA),
Alcide di Sarra (ENEA), Gianmaria Sannino (ENEA), Daniela Meloni (ENEA), Carmine Rinaldo
(Italian Air Force Met Service), Paolo Cristofanelli (ISAC-CNR), Franco Desiato (ISPRA).
Chapter 9 – Education, training and public awareness
Lead author: Stefania Fusani (ISPRA), Sandra Moscone (ISPRA), Federica Rolle (MATTM), Roberta
Ianna (MATTM).
Contributing authors: Daniela Antonietti (ISPRA), Stefania Calicchia (ISPRA), Fabrizio Ciocca
(ISPRA), Antonietta Licenziato (ISPRA), Federico Brocchieri (ISPRA), Vincenza Cipollone (ISPRA),
Giulia Galluccio (CMCC).

5
Summary 1 EXECUTIVE SUMMARY ........................................................................................................ 8
1.1 National Circumstances .................................................................................................... 8 1.2 Greenhouse Gas Inventory ............................................................................................. 10 1.3 Policies and Measures .................................................................................................... 12 1.4 Projections and Effects of Policies and Measures................................................................ 14 1.5 Vulnerability assessment, climate change impacts and adaptation measures ........................ 14 1.6 Financial resources and transfer of technology, including information under Articles 10 and 11 of
the Kyoto Protocol ................................................................................................................... 15 1.7 Research and systematic observations ............................................................................. 17 1.8 Education, training and public awareness ......................................................................... 18
2 NATIONAL CIRCUMSTANCES ............................................................................................ 21 2.1 Introduction ................................................................................................................. 21 2.2 Generic information ....................................................................................................... 21 2.3 Sector specific information ............................................................................................. 32 2.4 Summary of the parameters in this chapter that affect GHG emissions inventory and Projections
(Chapters 3 and 5) .................................................................................................................. 45 3 GREENHOUSE GAS INVENTORY ........................................................................................ 46
3.1 Greenhouse gas emission trends ..................................................................................... 46 3.2 National System for preparing the Italian Greenhouse Gas Inventory .................................. 55 3.3 National registry ........................................................................................................... 65
4 POLICIES AND MEASURES ................................................................................................ 71 4.1 Policy making process .................................................................................................... 71 4.2 Overview on policies and measures ................................................................................. 76 4.3 Cross Cutting policies .................................................................................................... 76 4.4 Policies in Energy Sectors ............................................................................................... 81 4.5 Policies in non-Energy Sectors ...................................................................................... 112 4.6 Costs analysis ............................................................................................................. 123 4.7 Summary of policies and measures ............................................................................... 124 4.8 Summary of policies and measures no longer in place ..................................................... 137 4.9 Minimization of adverse effects in accordance with art.2 paragraph 3 of the Kyoto Protocol .. 141
5 PROJECTIONS AND EFFECTS OF POLICIES AND MEASURES ............................................. 143 5.1 Introduction ............................................................................................................... 143 5.2 WM scenario ............................................................................................................... 145 5.3 Emissions from other sectors ........................................................................................ 161 5.4 Projection results and emissions targets ......................................................................... 168 5.5 Sensitivity analysis ...................................................................................................... 168 5.6 Comparisons with previous National Communications ...................................................... 170
6 VULNERABILITY ASSESSMENT, CLIMATE CHANGE IMPACTS AND ADAPTATION MEASURES 6.1 Climate modelling, projections and scenarios .................................................................. 173 6.2 Assessment of risks and vulnerability and climate change impacts .................................... 176 6.3 Domestic adaptation policies and strategies .................................................................... 189 6.4 Monitoring and evaluation framework ............................................................................ 192 6.5 Progress and outcomes of adaptation action ................................................................... 192
7 FINANCIAL RESOURCES AND TRANSFER OF TECHNOLOGY, INCLUDING INFORMATION UNDER ART. 10-11 OF KYOTO PROTOCOL .............................................................................. 194
7.1 Provision of New and additional resources ...................................................................... 194 7.2 Assistance to developing country Parties that are particularly vulnerable to climate change .. 198 7.3 Provision of financial resources ..................................................................................... 225 7.4 Activities related to transfer of technology ...................................................................... 255
8 RESEARCH AND SYSTEMATIC OBSERVATION ................................................................. 262 8.1 Introduction ............................................................................................................... 262 8.2 General policy on research and systematic observation .................................................... 262 8.3 Systematic observation ................................................................................................ 291
6
8.4 Support to developing countries .................................................................................... 305 9 EDUCATION, TRAINING AND PUBLIC AWARENESS ......................................................... 308
9.1 Education and Public awareness .................................................................................... 308 9.2 Public access to information ......................................................................................... 326 9.3 Public participation ...................................................................................................... 330 9.4 Training ..................................................................................................................... 335 9.5 International cooperation ............................................................................................. 344 9.6 Monitoring, review and evaluation of the implementation of Article 6 of the Convention ....... 350

7
Foreword
I am pleased to present the Italian Seventh National Communication under the United Nations Framework Convention on Climate Change. The National Communication also contains information required under the Kyoto Protocol and Its Doha amendment. This Communication represents a further step forward in the implementation of Italy’s objective to fostering growth with clean technologies and pursuing sustainable development at all level. Policies and measures in all sectors described in the Communication are in fact consistent with the vision set out by the recent updated Italian Sustainable Development Strategy and the new Italian National Energy Strategy which specifically define Italy roadmap for the decarbonisation of its economy up to 2030 and beyond, in line with the EU Paris Agreement commitment. Italy has reached its Kyoto Protocol target, ratified the Doha amendments and it is well on track to meet its 2020 target. Last available data, as presented in this communication, clearly show that in 2015 Italy has already reached Its EU 2020 target, while the economy growth has keeping on steadily recovering from the latest recession. Italy has also adopted its National Adaptation Strategy to climate change. The Strategy analyses the state of scientific knowledge on impacts and vulnerability to climate change for the major socio-economic and environmental sectors and proposes a portfolio of adaptation actions. Those actions, as well as the need for a monitoring, reporting and evaluating system are in the process of being specified in the National Adaptation Plan, whose drafting has already started and it is about to be adopted. Italy strongly believes that climate change is a global challenge and thus need a global response. To this end, Italy acknowledges particular attention to the international cooperation aimed at strengthening the global response to the threat of climate change by both reducing emissions and adapting to climate change. Specific attention is devoted to the least developed and most vulnerable countries in which enhancing the capacity to respond to climate change is for Italy a priority. In the general contest of the cooperation activities, Italy is undertaking continuous efforts to scale-up its international climate finance and will continue to do so. Since 2015, 31 new bilateral agreements with developing countries including regional groups to support mitigation and adaptation actions, to facilitate access to climate finance, to provide capacity building and technology transfer were signed. In the provision of public financial resources, a fair balance between mitigation and adaptation over time has been looked for. Direct support for adaptation in the period 2015-2016 increased more than five times compared to previous years. The adaptation component in 2015-2016 represents 53% of the total public climate finance addressing mitigation and adaptation, without considering crosscutting activities. Italy remains fully committed to the long term temperature goal set out by the Convention, its Protocol and lastly the Paris Agreement and will continue to work constantly with all national and international partners at all level to pursue the decarbonized, resilient and solidarity pathway she has already undertook since the adoption of the UNFCCC Convention.
Francesco La Camera UNFCCC National Focal Point

8
1 EXECUTIVE SUMMARY
1.1 National Circumstances
In Italy, the protection of the environment, ecosystem and cultural resources are under the exclusive
competences of the central Government. The Italian Ministry for the Environment Land and Sea (IMELS)
is also responsible for the implementation of the Kyoto Protocol; under this framework, it has started the
process for the adoption of the National Strategy for Adaptation to Climate Change. The Inter-Ministerial
Committee for Economic Planning (CIPE) is a collective governmental body, chaired by the President of
the Council of Ministers, whose competences also include climate change. In fact, the committee is in
charge for taking resolutions concerning the national plan for the reduction of emissions of gases
responsible for the greenhouse effect. The latest CIPE resolution was adopted in 2013, in order to enable
Italy to reach the goals set by the EU legislation by 2020. The new National Energy Strategy (“SEN
2017”) was adopted on 10th November 2017, setting further goals to be achieved in 2030.
Demographic and social trends of countries are generally considered among the main driving forces for
the emissions trends. Although changes in the national population have occurred over the last 20 years,
they have not directly affected the national trend of emissions significantly. The national population in
2011 increased compared to 2001, according to the national surveys, due to the migratory movements.
The aging trend of population has been increasing because of a low birth rate and a continuous growth of
the elders. Italy is still the second European Union country with the oldest population. The two factors
combined point out that the proportion of population of working age has been shrinking and even positive
migratory movements from abroad cannot avoid the imbalance in the ratio of the young to the elders
from occurring. The family size has been decreasing. In the period 1991-2015, the number of dwellings,
the population and the number of families have increased at different growth rates. So, even if new
buildings are more energy efficient, the increase of number of families and dwellings has also contributed
to increasing residential energy demand through the last two decades.
Due to the climate profile, domestic heating is required through winter months and the use of air
conditioning systems during summer months has been increasing in the last decade. As far as
temperature is concerned, year 2016 was the 6th Italian warmest year since 1961. The indicators about
extreme temperature trends confirm the positive thermal deviation of the year 2016 although it does not
rank as one of the five warmest years. As for the average sea surface temperature, 2016 was the 4th
warmest year after 2015, 2012 and 2014. To date, no statistically significant trend in national
precipitation is registered, except for Central Italy where a negative trend can be detected. Several
extremes of precipitation occurred in 2016, especially in one region.
Italy was the world’s eighth world largest economy and the fourth largest economy among the EU
countries in 2016. During the last decade, a global financial and economic crisis has hit advanced
economies thus resulting into severe recession in the EU, Japan and the United States from 2007-2009.
Between 2012 and 2013, Italy, like many advanced economies, has moved into recession again, but in
the very last years the national economy has been showing a moderate recovery. The driving sector of
the national economy is still the service sector; the industry-related activities have been recovering in the
last years; agriculture has returned to its 2011 values; while construction has remained stable during the
last three years.
Italy is also the world’s ninth largest exporter of goods and the twelfth largest importer of goods. Italian
trade balance registered a deficit in 2009 and 2012-2013, and a surplus in 2010-2011 and 2014-2015.

9
The percentage change of exports of goods turned positive in 2015. At a world scale, Italian exports and
imports have been losing market shares since 2000. In 2016, Italian exports of goods were driven by:
machinery and auto vehicles, pharmaceuticals, shoes, oil refinery products and iron & steel products. The
imports of goods showed an increasing trend from 1990 to 2007 and a fluctuating trend afterwards, due
to the fluctuation of the domestic demand through the last years. In 2016, the main imported goods
were: machinery and auto vehicles, energy products, chemical products and pharmaceuticals.
Compared with others European countries, Italy’s energy primary consumption is characterized by a
major use of oil and gas, a structural electricity imports, a weak coal contribution and the absence of
nuclear power. The share of renewable energy in Italy’s energy supply mix is higher compared with the
OECD’s average, mostly due to hydropower.
In 2015, primary energy demand was about +3.4% compared to 2014. The preliminary value for the
national energy bill for 2016 is lower than the previous year and it has been decreasing since the peak in
2012.
The energy dependence of Italy from abroad is high compared with the average of the EU27 countries.
In 2015, 44.1% of the energy end-uses total consumption was related to the tertiary sector, 29.3% to
the transports sector and 22.3% to the industrial sector. Concerning the electric sector, about 68% of the
production was provided by thermoelectric power plants in 2015 (it was 77% in 2010 and about 82% in
1990), the rest is covered by renewable energy sources (hydropower, wind, photovoltaic and landfill gas)
whose weight has kept growing in the latest years.
Italy’s energy intensity is lower than the EU average mainly due to the shift of the Italian economy from
industrial activities to services. Despite the improvement of energy efficiency in the industry sector, the
gap with the EU average has reduced in the recent years because consumption patterns in the civil sector
have become more energy intensive.
As for passenger transportation, among the EU countries Italy has the third highest motorisation rate
(610 cars per 1,000 inhabitants). Mobility demand and, particularly, road transportation shares have
increased in the period from 1990 to 2015. The number of vehicles for road transportation has kept
growing steadily over the last two decades, and the circulating passenger car fleet has been gradually
aging.
The energy demand in the transportation sector has increased in the period 1990-2015, with significant
increases in the consumption of natural gas, diesel, LPG, renewable and electricity. Transport sector
keeps depending almost completely on oil. Under the EU legislation setting standards and mandatory
targets in the manufacturing of new cars, CO2 emission per km from new cars is targeted to decrease
over time; in Italy, CO2 emissions from passenger cars have been decreasing along the last two decades
(2015 emissions level is lower than in 1995).
Main drivers of GHG emission trends for Agriculture are the number of animals, the variation of cultivated
surface/crop production and use of nitrogen fertilizers. Trends and changes of these parameters at
national level have also been affected by the implementation of the Common Agricultural Policy (CAP) in
the European legislation. Changes in livestock populations have occurred since 1990. The total
agricultural area, the utilized agricultural area and the number of agricultural holdings have been
decreasing since 1982, resulting in the noticeable increase of the average size of the Italian agricultural
holdings along the same years. As for the use of fertilizers, in the last decade the decrease in the use of
mineral products with a corresponding increase of organic formulated products is in line with the CAP and
it is also a consequence of the trend of the fertilizers market prices.

10
In Italy over the last two decades, changes in the land use has resulted in the increase of the forested
area, of the grassland area and of the settlement area; a reduction of cropland area compared to 1990 is
also observed. Italian land surface belonging to “Forest” category was about 31% of our national land
surface in 2015. Although the forest expansion has been decreasing during the last decade, Italian
forested area is spreading due to the dismissal of agriculture practices, mostly in mountain zones, and to
the natural conversion of cultivated lands and grazing into forests.
In 2015, forested areas affected by fires amount to approximately 37.7% of the total land surface burned
by fire in the same year.
The production of municipal waste in Italy increased between 1990 and 2005, it has remained
approximately around 30 Mt since 2013. A reduction trend can be observed for the last years in Italy,
driven mainly by changes in life style and consumption patterns more than the enforcement of waste
legislation. The international crisis of the economy has contributed too. In 2015, the amount of municipal
waste per year and per person was lower than the previous years in Italy.
The production of special waste by manufacturing industries had been increasing since 1990 (about 40 Mt
in 2010), but in 2015 it decreased (26.5 Mt). Although separate collection rates vary across the country,
an overall increasing trend since 1996 can be observed, but figures are still lower than national targets
set by the legislation.
Since early ‘90s, landfilling as a waste disposal practice has been decreasing also due to changes in
national policies which support other waste treatments (e.g. incineration; mechanical-biological
treatment; composting; anaerobic digestion; etc.).
The number of incineration plants in 2015 is approximately the same as in 1990, after a peak
experienced in 2010; the share of waste treated in installations with energy recovery systems was 99%
in 2015.
The production of special waste has been increasing since 1990, reaching 132.4 Mt in 2015; the
correlation between special waste production trend and the Italian GDP trend is good: especially for the
last years, the ups and downs in the special waste production trend are related to the trend of the
national economy. It is worth noting that the amount of special waste destined to the recovery of
material has been increasing for the last years and landfilling of special waste has been reducing for the
same years.
1.2 Greenhouse Gas Inventory
Total greenhouse gas emissions, in CO2 equivalent, excluding emissions and removals from land use,
land use change and forestry (LULUCF), have decreased by 16.7% between 1990 and 2015, varying from
520 to 433 CO2 equivalent million tons (Mt).
The most important greenhouse gas, CO2, which accounts for 82.5% of total emissions in CO2 equivalent,
shows a decrease by 17.9% between 1990 and 2015. In the energy sector, in particular, CO2 emissions
in 2015 are 15.6% lower than in 1990.
CH4 and N2O emissions are equal to 10.0% and 4.2% of the total CO2 equivalent greenhouse gas
emissions, respectively. CH4 emissions have decreased by 20.3% from 1990 to 2015, while N2O has
decreased by 32.5%.
As for other greenhouse gases, HFCs account for 2.8% of total emissions, PFCs and SF6 are equal to
0.4% and 0.1% of total emissions, respectively; the weight of NF3 is less than 0.01%. Among these

11
gases, HFCs show a strong increase in emissions, and the meaningful increasing trend will make them
even more important in next years.
The share of the different sectors, in terms of total emissions, remains nearly unvaried over the period
considered.
Specifically, the energy sector is the largest contributor to national total GHG emissions with a share, in
2015, of 81.8%. Emissions from this sector have decreased by 15.8% from 1990 to 2015; in particular,
an upward trend is noted from 1990 to 2004 (+13.6%) in total greenhouse gas emissions in CO2
equivalent excluding LULUCF, whereas a reduction by 25.8% between 2004 and 2015 is observed. From
2004, GHG emissions from the sector are decreasing as a result of the policies adopted at European and
national level to implement the production of energy from renewable sources and, from the same year, a
further shift from petrol products to natural gas in producing energy has been observed.
Emissions from industrial processes and product use account for 6.9% of total national GHG emissions,
excluding LULUCF. Total emission levels, in CO2 equivalent, reduced by 25.7% from 1990 to 2015.
The decrease is prevalently to be attributed to the drop of emissions in the mineral and chemical
industries, explaining 71.1% and 18.9%, respectively, of the sectoral total. Emissions from mineral
production decreased by 46.3%, mostly for the reduction of cement production whereas the reduction in
chemical industries (-71.9%) is due to the general reduction in the level of productions and the
introduction of abatement technologies especially in the production process of nitric and adipic acid.
The agriculture sector is also contributing with a 6.9% to total greenhouse gases, excluding the LULUCF
sector. Emissions mostly refer to methane and nitrous oxide levels, which account for 61.6% and 37.0%
of total emissions of the sector, respectively. The decrease observed from 1990 to 2015 (-15.9%) is due
to the decrease of CH4 emissions from enteric fermentation (-11.1%) and N2O from agricultural soils (-
18.0%), which account for 46.0% and 29.9% of total agricultural emissions, respectively. Main drivers
behind these downward trends are the reduction in the number of animals, especially cattle, as well as
the use of nitrogen fertilizers, mainly due to the Common Agricultural Policy (CAP) measures. In addition,
there has been a significant increase in the recovery of the amount of biogas produced from animal
manure and used in the energy sector for the production of electricity and combined electricity and heat
production in the last years.
Finally, the waste sector accounts for 3.6% of total national greenhouse gas emissions, excluding
LULUCF. Emissions show a decrease of 10.9% from 1990 to 2015 mainly driven by the reduction of
emissions from solid waste disposal (-17.8%), which account for 71.5% of the total sectoral emissions; in
fact, despite the continuous increase of waste production, solid waste disposal on land has decreased due
to waste management policies in place in the last years, specifically the growth of waste incineration, the
composting and mechanical and biological treatment and the increasing practice of recyclable waste
collected. At the same time, the increase in the methane-recovered percentage has led to a further
reduction in net emissions.
Italy has established a national system, which includes all institutional, legal and procedural
arrangements for estimating emissions and removals of greenhouse gases, as well as reporting and
archiving inventory information.
The National System for the Italian Greenhouse Gas Inventory was established by the Legislative Decree
n° 51 of March 7th 2008. The Institute for Environmental Protection and Research (ISPRA) is the single
entity in charge of the development and compilation of the national greenhouse gas emission inventory.
The Institute annually draws up a document which describes the national system including all updated

12
information on institutional, legal and procedural arrangements for estimating emissions and removals of
greenhouse gases and for reporting and archiving inventory information.
As for the official consideration of the inventory, the Italian Ministry for the Environment, Land and Sea is
responsible for endorsement and for communication to the Secretariat of the UN Framework Convention
on Climate Change and the Kyoto Protocol. The inventory is also submitted to the European Commission
in the context of the Greenhouse Gas Monitoring Mechanism.
A complete description of the Italian National System can be found in the document “National
Greenhouse Gas Inventory System in Italy. Year 2016” (ISPRA, 2016), publicly available at
http://www.sinanet.isprambiente.it/it/sia-ispra/serie-storiche-emissioni.
As single entity, ISPRA is responsible for all aspects of national inventory preparation, reporting and
quality management. A specific unit of the Institute is in charge of the management of the emission
inventory. Activities include the collection and processing of data from different data sources, the
selection of appropriate emissions factors and estimation methods, the compilation of the inventory
following the QA/QC procedures, the assessment of uncertainty, the preparation of the National
Inventory Report and the reporting through the Common Reporting Format, the response to the review
processes, the updating and data storage. The website address where all the information related to the
inventory can be found is: http://www.sinanet.isprambiente.it/it/sia-ispra/serie-storiche-emissioni.
The ‘National Registry for Carbon sinks’, instituted by a Ministerial Decree on 1st April 2008, is part of the
Italian National System.
ISPRA is also responsible for the administration of the national section of the Union Registry under the
European Directive 2009/29/EC, as set out by the Legislative Decree N. 30 of 13 March 2013. The
Institute performs these tasks under the supervision of the national Competent Authority.
The registry is operated by the European Union through the centralization of the EU ETS operations into a
single European Union registry, as established by the Directive 2009/29/EC. With a view to increase
efficiency in the operations of their respective national registries, the EU Member States who are also
Parties to the Kyoto Protocol (25) plus Iceland, Liechtenstein and Norway decided to operate their
registries in a consolidated manner in accordance with all relevant decisions applicable to the
establishment of Party registries, in particular Decision 13/CMP.1 and decision 24/CP.8.
1.3 Policies and Measures
The policies and measures taken by Italy to mitigate climate change are driven by the commitment
undertaken under:
- the Kyoto Protocol target: for the period 2008-2012 in the framework of the EU Burden Sharing
Agreement, Italy has committed to reduce its greenhouse gas emissions by 6.5% below base-
year levels (1990). Moreover, to ensure no gaps occurred between the end of first commitment
period of the Kyoto Protocol in 2012 and the new global agreement, expected to become fully
operational from 2020, the ‘Doha Amendment to the Kyoto Protocol’ for the 2013-2020 period was
adopted on 8 December 2012. The EU and its Member States have committed to this second phase
of the Kyoto Protocol and have established to reduce their collective emissions to 20% below their
levels in 1990.

13
- the “EU Climate Energy Package” for the period 2013-2020: the 8th and 9th March 2007
conclusion of the European Council named “Integrated Energy and Climate Change Package”
(IECCP) commits to European Member States to achieve by 2020, 20% reduction of EU
greenhouse gas emissions compared to 1990, 20% reduction in energy use to be achieved by
improving energy efficiency, 20% use of renewable energy, 10% use of biofuels in the transport
sector. A comprehensive set of legislation act was agreed at EU level and is being implemented to
reach those objectives and according with that all the national emissions should be divided,
starting from year 2013, in two main sectors:
EU – ETS sector: the EU-ETS was established by the Directive 2003/87/EC, this directive has
been recently amended by the Directive 2008/101/EC of 19 November 2008 in order to
include the aviation sector and by Directive 2009/29/EC of 23 April 2009 that introduces
substantive changes in the scheme. The most important one relates to the cap-setting
procedure, where the new system will be no longer based on national-cap setting but on an
EU single wide cap to be allocated to each operator on the basis of benchmarks.
ESD (Effort Sharing Decision) sector: at 2020 Italy should reduce of 13% the GHG emissions,
respect the 2005, in all the sectors not covered by the EU ETS, such as transport, civil,
agriculture and waste, according with the “Decision n. 406/2009/EC of the European
Parliament and of the Council of 23 April 2009 on the effort of Member States to reduce their
greenhouse gas emissions to meet the Community’s greenhouse gas emission reduction
commitments up to 2020 (ESD)”.
On the 12th December 2015, UNFCCC Decision 1/CP.21 adopted the Paris Agreement, a new international
agreement aimed at reducing GHG emissions. Decision 1/CP.21 also welcomes the submission of
Intended Nationally Determined Contributions (INDCs). The European Union submitted an INDC
committing its Member States to reduce its overall GHG emissions by at least 40% by 2030, comparing
to 1990 levels. The new Framework contains the following binding targets to be reached by 2030: at
least 40% reduction in GHG emissions compared to 1990 (-43% and -30% by 2030, compared to 2005
levels, for EU ETS sectors and ESD sectors, respectively), at least 27% of energy consumption from
renewable sources, at least 27% of energy efficiency improvements. Moreover, as a follow-up of the EU
Effort Sharing Decision (ESD), on the 20th July 2016 the European Commission presented the Effort
Sharing Regulation (ESR) proposal, which assigns to Italy a 33% GHG emissions reduction target for
sectors not covered by ETS, to be achieved by 2030 compared to 2005 levels.
The potential emissions reductions of the policies and measures has been assessed up to 2030 and the
policies and measures have been divided into two types : implemented measures by 31st December
2014, plus the Interministerial decree June 26th 2015 “Minimum requirements for buildings” and planned
measures as of 31st May 2017.
In particular have been reported:
- Cross sectoral measures that include the Legislative Decree N. 28 of 3rd March 2011 that defines
the mechanisms, the incentives and the institutional, financial and legal tools necessary to
achieve the 2020 targets regarding the renewable energy use; the 28th December 2012 decree,
the so called “Conto Termico” decree, that implements the incentive scheme introduced by
Legislative Decree 28/2011, the White Certificates system, aimed at promoting energy efficiency
and delivering emission reductions in all the energy end-use sectors, , the legislative decree
20/2007 on the eco-design of energy-using products and the structural funds 2007-2013.

14
- Energy efficiency measures that include cogeneration currently supported by incentive schemes,
energy efficiency in the civil sector through specific actions targeted for existing and new
buildings and appliances; mandatory use of biofuels and infrastructural projects, intermodal and
fleet update measures in the transport sector.
- No Energy measures that include implementation of the most advanced technology to reduce the
N2O emissions in plants for the production of nitric acid; emission reduction from agricultural soil
and electricity generation from animal waste in the agriculture sector; compliance with separate
collection targets and reduction of biodegradable waste disposed into landfills in the waste sector.
All this measures have been considered implemented.
The total GHG reduction for the implemented measure can be estimated as 51,090 kt CO2eq at 2020 and
4,000 kt CO2eq at 2030, regarding the planned measures the reduction impact can be estimated as
12,209 kt CO2eq at 2020 and as 38,124 kt CO2eq at 2030.
1.4 Projections and Effects of Policies and Measures
GHG emissions for the latest available inventory year (2015) report a decrease of 16.7% and 25.3% with
reference to 1990 and 2005, respectively. Italy’s share within the EU target is to achieve a 13%
emissions reduction by 2020 with respect to 2005 in the non-ETS sector. The reduction target for non-
ETS sector to be achieved in 2030 is still under negotiation among EU Member States, although a
provisional target has been set to -33% with reference to 2005 level. According to the WM scenario, Italy
is in line to meet 2020 targets, while there is a sizeable distance between projections and targets
proposed for 2030.
The scenario presented in this NC was elaborated in 2016 and projections include all PaMs implemented
or adopted up to the end of 2014 and minimal efficiency standards for buildings adopted in 2015. The
scenario has been geared taking account of the most recent energy scenarios and specific estimates on
non-energy source emissions.
The projection data are reported by sector and by gas, with a brief explanation of trends. The effect on
2020 EU target and provisional 2030 EU target are reported. GHGs emissions from combustion are drawn
from the partial equilibrium model TIMES. The scenario shows that gross inland consumption in 2020,
estimated according to Eurostat methodology, will be about 154.8 Mtoe, very close to 1990 level. From
2020, gross inland consumption is expected to continue decreasing until 150.4 Mtoe in 2025, to remain
then constant up to 2030.
The scenario takes into account the effects of the economic crisis, that has hit all national activities, and
the evolution trend is based on the current economic recovery and the development of low carbon
technologies, mainly for the electricity generation sector, and efficiency enhancements in the civil sector.
Finally, an historical review of projections from different National Communications is reported in order to
get an insight in emissions trends that would have been occurred without the economic crisis and
measures implemented after 2007.
1.5 Vulnerability assessment, climate change impacts and adaptation measures
Italy is located in an area identified as particularly vulnerable to climate change. Climate observations
already confirm an increase of the average temperature as well as an upward trend in extreme

15
temperatures. Climate projections highlight a general warming by the end of XXI century, along with a
general reduction in precipitation, especially according to the RCP8.5 scenario. Projections also show an
increase in heavy precipitations and extreme temperatures. Italy is prone to natural hazards and climate
change is expected to increase its vulnerability to climate-related hazards over the next decades.
The Italian National Adaptation Strategy (NAS) to climate change analyzes the state of scientific
knowledge on impacts and vulnerability to climate change for the major socio-economic and
environmental sectors, namely: water resources (quality and quantity), desertification, land degradation
and drought, hydrogeological risk, biodiversity and ecosystems (terrestrial, marine, inland water and
transition ecosystems), forestry, agriculture, aquaculture, fishery, coastal zones, tourism, health, urban
settlements, critical infrastructures (cultural heritage, infrastructure and transport, industrial hazards),
energy, and 2 special cases - mountain areas (Alps and Apennines), Po river basin.
The main methods used to perform the assessment were the review of existing literature and experts
appraisal. The Italian Ministry for the Environment, Land and Sea (IMELS), that is the institution in
charge of climate policy, also conducted a public consultation on the perception of the risks of climate
change and on the general concept about adaptation, and an “ad hoc” public consultation for the
involvement of citizens and stakeholders.
In order to lay the foundation of a multilevel governance on adaptation, an horizontal coordination took
place through an Institutional Panel, which involved representatives of the different ministries and other
institutions such as the Department of Civil Protection, regional committees, the national association of
Italian municipalities and the Union of Italian Provinces. The IMELS also established an Interregional
Panel with the national State-Regions Commission for climate change, with the aim to build the ground
for adaptation, having in mind the needs and the perspective of all actors involved in the process of
tackle climate change and its impacts.
The NAS also proposed a portfolio of adaptation actions based on three approaches: 'soft' (i.e.
managerial, legal and policy approaches), 'green' (i.e. ecosystem based approaches) and 'grey' (i.e.
technological and engineering solutions) and two implementation terms: short and medium term. The
NAS is planned to be updated within five years.
The ongoing process toward a National Adaptation Plan, started in 2016, is currently taking into
consideration the need for a Monitoring, Reporting and Evaluation of adaptation, which will be then
defined within the NAP framework.
1.6 Financial resources and transfer of technology, including information under
Articles 10 and 11 of the Kyoto Protocol
Italy is undertaking continuous efforts to scale-up its international climate finance as demonstrated by
the substantial increase of its public climate finance in the period 2015-2016 compared to the levels of
previous years (2013-2014), while improving the quality and transparency of its reporting.
Total public climate specific support that is currently being reported amount, for the biennium 2015-
2016, to 729,75 million US dollars. This represents more than a 70% increase compared to the public
climate specific support reported for the biennium 2013-2014, amounting to 428,76 million US dollars.
The total public climate specific support for the period 2013-2016 amounts to 1.158,51 million US dollars.

16
In the provision of public financial resources, Italy aims to strike a fair balance between mitigation and
adaptation over time. Direct support for adaptation in the period 2015-2016 increased more than five
times compared to previous years. The adaptation component in 2015-2016 represents 53% of the total
public climate finance addressing mitigation and adaptation, without considering crosscutting activities.
In this context, the Italian development cooperation aims at effectively mainstreaming environmental and
climate considerations into its activities. Starting from 2015, the Italian Government allocated additional
financial resources to the international development cooperation. On top of these resources, the
commitment of Italy to tackle climate change and related support to developing countries is strongly
expressed in Decree nr.30 (DLGS n.30 13/03/2013).
The Italian Government increased its efforts on international activities on climate change, over the past
four years through:
• contributing to multilateral funds and development banks, dedicated to reduce the impact of human
activities on climate change, and to support adaptation actions;
• supporting mitigation and adaptation measures in developing countries across different regions
particularly in most vulnerable countries, particularly in Africa and Pacific Small Islands;
• strengthening capacity building in least developing countries.
Since 2015, the Italian Ministry for the Environment signed 31 new bilateral agreements with developing
countries including regional groups to support mitigation and adaptation actions, to facilitate access to
climate finance, to provide capacity building and technology transfer. Priority actions have been focused
on 8 areas: management of extreme events, promotion of renewable energy and energy efficiency, water
resources management, waste management, air quality, address forest degradation, land rehabilitation
and soil improvement, sustainable mobility.
Many Italian adaptation, mitigation and technology transfer programmes are administrated by bilateral
agreements. However, Italy plays a pivotal role in some significant multilateral organizations, such as the
World Bank (WB), the Green Climate Fund (GCF), the Global Environment Facility (GEF), the Least
Developed Countries Fund (LDCF), the Adaptation Fund (AF), the Food and Agriculture Organisation
(FAO) and the African Development Bank (ADB).

17
1.7 Research and systematic observations
In the last years Italy made a particular effort to improve the research sector. The new national research
policy (PNR - Programma Nazionale per la Ricerca 2015-2020) aims at strengthening the research system
in the context of European and international cooperation and competition. It coordinates Italian research
programmes within the European Horizon 2020 framework, in order to align objectives, find synergies
and improve the results at international level. For this reason, Italy shares the same priorities of all EU
countries and climate change is among the most impelling. The PNR 2015-2020 increases funding for
research up to € 2.5 billion. Also other programmes contribute to finance climate change research
projects: the National Research Programme in Antarctica (PNRA – Programma Nazionale di Ricerca in
Antartide) and the Strategical Plan for Research and Innovation in the agricultural, food and forestry
sectors 2014-2020. In this policy frame, Italy increases its participation to European and international
research activities, contributing significantly to climate science.
In the field of climate prediction and simulation, through CMCC Foundation, Italy developed a new Earth
System Model (CMCC-ESM) for seasonal–to–decadal (S2D) forecasting. CMCC Foundation also provided
new high-resolution protocols and flagship simulations for the World Climate Research Programme
(WCRP)’s Coupled Model Intercomparison Project (CMIP6) and for CORDEX Programme. Moreover, Italy
published the results of regional simulations using the COSMO-CLM Model with high resolution to obtain
more detailed climate analysis and scenarios, that can be used for impact models (evaluation of climate
change effects on different hydrogeological hazards).
Concerning systemic observations, Italy is equipped with a comprehensive domestic observation network,
which covers all the national territory in the field of atmosphere, land, ocean and space and it also
contributes to international observation programmes.
The Italian Air Force Meteorological Service, ENEA, CNR, ISPRA, several Universities, the Civil Protection
and the Regional Environmental Agencies manage all together the atmosphere surface stations network.
In particular, the network of Air Force Meteorological Service contributes to the main international
observing systems: the GCOS Surface Network (GSN), the GCOS Upper Air Network (GUAN) and the
GAW (Global Atmospheric Watch). Besides their stations networks in Italy, Italian institutions also
manage polar stations in Arctic and Antarctica: Thule High Arctic Atmospheric Observatory (Greenland),
the Italian Arctic Station Dirigibile Italia (Svalbard Islands), the Italian Meteo-Climatological Antarctic
Observatory (Antarctica) and the International Center for Earth Sciences, together with the Argentina
Dirección Nacional Del Antártico (Jubany, Antarctic Peninsula). All the data collected by the network are
standardized by ISPRA and transmitted to EEA (European Environmental Agency) and to other
international bodies such as EMEP (European Monitoring and Evaluation Programme).
Italy also contributes to ocean observation, providing data from its in-situ and satellite monitoring
systems to international initiative such as: GOOS initiative (participating to EUROGOOS and MONGOOS);
EU Copernicus Programme (Italy manages the Mediterranean Monitoring and Forecasting Centre, the
Ocean Color Thematic Assembly Centre and it contributes to CMEMS in-situ TAC and Global Ocean
Reanalysis); ARGO and REC-MMO-Med (Hub for marine meteorology and oceanography). Italian
institutions operate several ocean observing stations, among them the Mareographic station of Trieste
and the Oceanographic Observatory of Lampedusa.

18
Italy is active in land and ecosystems monitoring, through domestic programmes, such as CONECOFOR
(Forest Ecosystems Controls) and the INFC (National Inventory of Forests and forest Carbon pools) and
international projects, such as eLTER, ECOPOTENTIAL and ETS-ICOS.
Italy is also equipped with a satellite earth observation system: the COSMO-Sky MED. The country is
member of the Polar Space Task Group (PSTG) for the study of ice sheets, permafrost, snow and floating
ice and of the CEOS (Committee on Earth Observations Satellite) for the coordination of more than 30
civil space-based EO programmes.
Finally, Italy directly contributes to capacity building through the participation of several Italian
institutions in international and national climate change-related projects in developing countries.
1.8 Education, training and public awareness
Over the last years Italy has made important progress in improving education and training system thanks
to the Law 13th July n.107 “La Buona Scuola” introducing a comprehensive reform of the school education
system. This progress reflected also on environmental education, education to sustainability and on
climate change and adaptation by the issue of new ”Guidelines for Environmental Education and
Sustainable Development by the Ministry of Environment, Land and Sea (IMELS) in collaboration with
the Ministry for Education, University and Research (MIUR) covering a number of thematic issues
(biodiversity, food, climate change, transport, water, cities..), and differentiated for each level of school.
In addition to this, in November 2016 IMELS and MIUR signed a new Programme of commitments: the
“Rome Charter”, from biodiversity to mobility, from digital communication to climate change. The Rome
Charter is also aimed at supporting the implementation of the renewed Italian National Strategy on
Sustainable Development as well as the 2030 Agenda Objectives.
Al local level, Regional Environmental Agencies, Regional and Provincial Administration and municipalities
are continuing to play an important role in promoting and implementing teaching and learning paths on
climate change issues and awareness raising initiatives.
In order to raise public awareness with specific reference to Climate Change, in view of the UN COP21 in
Paris, Italian Government held, in Spring 2015, the States General on Climate Change presenting an
overview of the risks, actions and opportunities related to climate change, and invited the “Italian
system” to put climate change at the heart of national policy. In addition it’s worth to mention the Global
event Expo Milano 2015, hosted by the city of Milan from 1 May to 31 October 2015 involving all of
Italy’s institutions, a unique international event from educational, cultural and scientific viewpoints.
Several communication campaigns aimed at spreading environmental education and information at large
and disseminating European environmental policies were organized at national level by IMELS, as the
event, called “States General of Youth on Environment” in the framework of the Earth Day
celebrations in April 2017, and “All4theGreen” in Bologna, a set of initiatives aimed at various types of
public introducing and "sensitizing" to the G7 Environment 2017 held in Bologna on June 2017.
A strong encouragement to public participation on climate change policies and related measures came
also from environmental NGOs and non-profit organizations, welcomed and willingly supported by Italian
Ministry of the Environment, as for the initiative “Italian Youth Think Tank on Intergenerational
Equity” aimed at drafting a policy proposal for the implementation of the intergenerational equity

19
principle to be included within the global climate change agreement, which was later signed as Paris
Agreement.
With reference to training offer of Italian Universities is nowadays very diversified and spread throughout
the Italian territory from North to South of the peninsula: long-distance training, Graduate Programs,
Summer and Winter Schools, PhD programmes, Master Degrees are active in many Universities as
Venice, Padua, Milan, Rome, Bologna, Turin, Genoa and Calabria.
Regarding international cooperation activities Italy is undertaking continuous efforts to scale-up its
international climate finance and the Italian Development Cooperation has undergone an important
legislative reform introduced by the Law 125/2014 entered into force in August 2014, leading to a new
institutional framework designed to make it more effective as well as cooperation policies more
consistent.
With regard to environmental intervention lines, the Italian Ministries of Foreign Affairs and International
Cooperation (MAECI) and IMELS act often jointly, focusing their environmental support actions on the
fragile and more vulnerable ecosystems, in areas subject to desertification, Small Island States and
mountains. In particular, the activity of the IMELS is addressed to support actions for the decarbonisation
of the economy; for the implementation of measures for efficient use of resources and to support the
most exposed countries to the effects of global warming: especially in those developing countries with
less resilience capacity and less ability to fight change climate effects.
Following ‘Lima Ministerial Declaration on Education and Awareness-raising’, reaffirming the importance
of Article 6 of the UNFCCC in meeting its ultimate objective and in promoting climate resilient
sustainable development, and in line with what governments agreed in Paris, to cooperate in taking
measures, as appropriate, to enhance climate change-related education, training, public awareness,
public participation and public access to information and recognizing the importance of these steps to
enhance actions under the Paris Agreement, the Italian Ministry for the Environment, Land and Sea,
appointed its national focal points on Action for Climate Empowerment (ACE) activities .
In order to provide a platform for sharing and disseminating initiatives and best practices, a permanent
section specifically dedicated to environmental education and sustainable development has been created
by IMELS on its website. In collaboration with the Italian Ministry of Education “The guidelines on
environmental education” and the “Chart on Environmental education and sustainable Development”
have been produced. This collaboration aiming at enhancing the implementation of the Doha Work
program and toward the definition of a national strategy on Action for Climate Empowerment was
strengthened in 2016 with the signing of a Memorandum of Understanding on environmental education
and sustainable development in schools under the PON (National Operative Plan) School 2014-2020.
According to the revised guidelines for the preparation of national communications by Parties, a new
aspect on education, training and public awareness is being introduced : “Monitoring, review and
evaluation of the implementation of Article 6 of the Convention” . Since the current edition we
have hardly tried to provide some information on the empowerment that the reported initiatives have
generated through the introduction of possible indicators. We have tried to identify “when possible” an
indicator of the effectiveness or at least of the reaction of recipients to the initiatives.

20
The indication in numbers has something to do with the “range” of the initiative and does not always
correspond with the real impact or the quality and strength of the connected empowerment. With social
media for example, through platforms or pages it is more immediate to obtain an acknowledgement of
the appreciation or the sharing of the initiatives through some tools such as “followings”, “followers”, “I
like”, “visualizations” or “thoughts” expressing approval, appreciation or commitment. As for education,
the recurring indicator measure for the monitoring and the evaluation proved to be the number of
students/schools who participated to the initiative.
The way initiatives are implemented and disseminated has changed, from regular live workshop for
example, we have passed through the growing phenomena of virtual meetings or “webinar” where every
participation can be immediately tracked. Another participation tool like “Tweets” on Thematic “hash
tag” proved to be another useful indicator to monitor the participation or interest to a certain topic.
Even public awareness initiatives like campaigns or civic crowd funding reveal a possible indicator, in
terms of acceptance and subscription we may have information on the success of the initiative and the
interest of the public. As for the access to information, “visitors”, “recipients” or downloads of
documents may be representative.

21
2 NATIONAL CIRCUMSTANCES1
2.1 Introduction
This chapter contains relevant information concerning Italy, which helps understanding the national data
on emissions trend (which are presented in chapter 3 of this document) and the factors that produce
them. The main drivers of the emissions trend, according to the IPCC, are discussed, too, specifically:
population dynamics; the rate of urbanization; the mobility for work and study reasons; employment
rate; national economy indicators and a short analysis of the most significant macro sectors.
2.2 Generic information
2.2.1 Government profile
Italy is a bicameral parliamentary Republic administratively divided into 20 Regions, which are part of the
constitutional structure of the State. Thus, in Italy, a sovereign public entity coexists with other territorial
entities, Provinces and Municipalities are lower-level territorial entities too.
The Constitutional law n.3 of 2001 has deeply modified the attributions of powers between the central
and the local Governments with the aim to establish a system of administrative federalism. The Regions
have legislative powers for matters not expressly reserved to the exclusive competence of the central
Government and have the responsibility to administer matters on which they legislate. The Constitutional
Law also rearranged the distribution of administrative functions foreseeing an enhanced administrative
role for municipalities.
The protection of the environment, of the ecosystem and cultural resources are under the exclusive
competences of the central Government. In particular, the Italian Ministry for the Environment was
established in 1986 as the Italian Ministry for the Environment and Territory and renamed as IMELS in
2006. The IMELS is responsible for sustainable development, protection of territory, pollution and
industrial risks, international protection of the environment, appraisal of environmental impact, nature
conservation, waste and clean up, and protection of seas and inland waters. The IMELS is also committed
to promote and support international partnership and cooperation towards global sustainable
development. In some other sectors as the energy production, transport and distribution, the central
Government and the Regions have concurrent legislative powers. Regarding climate change, the IMELS is
responsible for elaborating the national plan for the reduction of greenhouse gas emissions to be
proposed for adoption to the Inter-Ministerial Committee for Economic Planning2 (CIPE) – a collective
governmental body chaired by the President of the Council of Ministers3. The IMELS also adopted the
National Strategy for Adaptation to Climate Change in 2015 (for further details, see chapter 6 of this
document) pursuant to the adoption of the EU Adaptation Strategy in April 2013 (an evaluation of the
implementation and performance of the EU strategy was launched in 2016 and it is scheduled to be
completed by the end of 2018). In 2016, the national plan for the implementation of the National
Strategy for Adaptation to Climate Change was prepared and in February 2017 a public consultation was
1 Lead author: Andrea Gagna (ISPRA); Contributing authors: Antonella Bernetti (ISPRA), Antonio Caputo (ISPRA),
Eleonora Di Cristofaro (ISPRA), Barbara Gonella (ISPRA), Ernesto Taurino (ISPRA), Marina Vitullo (ISPRA). 2 http://www.cipecomitato.it/it/index.html 3 CIPE’s resolution n. 17/2013 was adopted to enable Italy to contribute in the achievements of the goals set by
Decision EC/406/2009 (on the efforts of Member States to reduce their GHG emissions to meet the EU’s GHG emission
reduction commitments up to 2020). The measures to be taken are discussed in chapter 4 of this document.

22
held concerning the national plan.
The national energy policy is within the competences of the Italian Ministry of Economic Development
(IMED), the determination of the policy at the specific sector level is based on the general guidelines set
by the Government as a whole and by Parliament. The new National Energy Strategy was presented by
IMED and IMELS in early 2017 and during June-September 2017 a public consultation was held about it.
The final document was adopted officially on 10th November 2017 setting qualitative and quantitative
goals to be achieved in 2030 in compliance with the EU binding legislation.
2.2.2 Population profile, urban structure and building stock
Demographic and social trends in countries are generally considered among the main driving forces for
the emissions trends. Although changes in the national population have occurred (Figure 2.1) over the
last 20 years they have not directly affected the national trend of emissions significantly. The national
population was 56.744 million in 1991 (13th national survey) and 56.960 million in 2001 (14th national
survey) while it was 59.433 million on October 2011 when the 15th national survey was carried out by the
Italian national institute of statistics (ISTAT)4. According to the results of the survey, the increase in
population, 4.3% compared to 2001, is due to the migratory movements that counterbalance the
negative natural trend. In 2011, there were approximately 3 million people more than in 2002 living in
Italy; the peaks in migratory movements occurred in 2003-2004, in 2007-2008 and in 2009-2010. The
trend in the number of non-EU citizens increased from 2007 to 2010, before undertaking a decreasing
path: in 2011, a 39% reduction compared to 2010 was registered, while a further reduction by 3.8% was
observed in 2015 compared to 20145. The Italian population is expected to reach about 60.08 million in
2030.
Figure 2.1 - The population (1000 inhabs) of Italy along the last two decades
Source: ISTAT (the Italian National Institute of Statistics)
4 http://demo.istat.it/ , ISTAT 5 http://noi-italia.istat.it/ , ISTAT

23
About 46% of the resident population lives in northern Italy, about 20% of the population lives in central
Italy, about 23% of the population lives in southern Italy and the remaining 11% lives in the islands
(Figure 2.2). Based on the official statistics, increases in the resident population since 1991 have
occurred above all in northern and central Italy (especially in north-eastern Italy), while minor increases
have occurred in resident population of southern and insular Italy. The distribution of the population may
have implications for transport demand and for the development of energy supply infrastructure.
Figure 2.2 - Distribution of the Italian population among four statistical regions
Source: ISTAT, the Italian National Institute of Statistics
The aging trend of population has been increasing due to a low birth rate (about 1.35 children per woman
in 2015) and a continuous growth of the elders. Italy is the second European Union country with the
oldest population: on 1st January 2016, the median age of the Italian population was 44.7 years6 (42.6
years is the median age in the EU277) and the Italian old age index was 161.4% in 2016 (123% is the
average value in the EU27 in the same year). The extremely elderly people, people aged 80 and older,
are 7% in 2017 and they were 6% of the population in 2011 and 4.4% in 2002; they represent a
considerable and growing portion of the Italian population (Figure 2.3).
A low birth rate reduces the younger age groups and produces aging from the “foundation” of the
population pyramid, an increasing age index (Figure 2.4, and 2.5) describes the aging “at the top” of the
population pyramid. The two factors combined point out that the proportion of population of working age
has been shrinking and those even positive migratory movements from abroad cannot avoid the
imbalance in the ratio of the young to the elders from occurring.
6 ISTAT, http://dati.istat.it/ 7 EUROSTAT, http://ec.europa.eu/eurostat/statistics-explained/index.php/Population_structure_and_ageing

24
Figure 2.3 - Distribution of Italian population (1000-inhabitants) in age classes through the last three decades
Source: ISTAT, the Italian National Institute of Statistics
Figure 2.4 - Age index in Italy along the last decade (EU average values are in red)
Source: ISTAT, the Italian National Institute of Statistics
0 5000 10000 15000 20000
0-19
20-39
40-59
60-79
80 and older
2017
2011
2006
2001
1996
1991
1986

25
Figure 2.5 - Birth rate in Italy along the last decade and birth rates in 1971 and 1991
Source ISTAT, the Italian National Institute of Statistics
Another characteristic which may affect efficiency consumption patterns and emissions is the average
family size (Figure 2.6). In general, small average family size implies greater consumptions, because of a
larger acquisition and use of durable goods as household appliances, cars, etc., previously shared among
a greater number of people. According to the results of annual surveys concerning Italian families, over
the last decade more than 90% of the families lives in dwellings with domestic heating (92% in 2009), a
washing machine (97,4% in 2009) and a dishwasher (42.2% in 2009); the share of families living in
dwellings with an air conditioning system has been increasing since 2001 (10.7% in 2001; 20.9% in
2005; 30.4% in 2010; and 38.6% in 2016)8. In Italy, according to the National Institute of Statistics,
there are 25.775 million families in 2016 with an average size of 2.3 people per family. The family size
decreased from 3.4 to 2.6 people in the period 1971-2001, while the average value for the years 2013-
2015 is 2.4 people per family9.
8 “ISTAT, National Institute for Statistics 9 ISTAT

26
Figure 2.6 - Average family size in Italy along the last four decades
Source: ISTAT, the Italian National Institute of Statistics
Another factor affecting Italian GHG emissions per capita is the mobility demand for work and study,
which is due to the mismatch between the residential areas and the areas where the economic activities
are concentrated, the so-called local labour market areas. Based on the official statistics, it is possible to
state that in 2015 about 11% of the Italian population walk to reach their work place, while about 90%
goes to work by public or private transportation means. Specifically, about 80% of people goes to work
by private transportation means, about 10% of people uses public transport to go to work, approximately
3% of people goes to work by bicycle.
The population density in Italy has increased in the last decade from 189.7 inhabitants per km2 in 2002,
to 201 inhabitants per km2 in 2015. In fact, in Italy there were 8,046 municipalities in 2015: 5,650
(about 70%) have less than 5,000 inhabitants (17% of the Italian population); 2,350 municipalities
(about 29%) have a number of inhabitants ranging from 5,000 to 100,000 (60% of the Italian
population); the remaining 46 municipalities have more than 100,000 inhabitants (about 23% of the
Italian population) which also correspond to about 3.4% of the total national area. On 31st December
2015, 46 municipalities had a population exceeding 100,000 inhabitants: 25 municipalities out of 46 had
more than 150,000 inhabitants, 6 out of 46 more than 500,000 and 2 out of 46 (Rome and Milan) had
more than 1,000,000 inhabitants.
As regards the building stock, according to the National Institute of Statistics, in Italy there were about
19.7 million occupied dwellings in 1991, 24 million in 2011 and 24.13 million in 2015. In the period 1991-
2015, the number of dwellings has increased by about 22.3%, the population by about 6.8% and the
number of families of around 21%. Although new buildings are more energy efficient, the increase in
number of families and dwellings has resulted in an increase in residential energy demand through the
last two decades.
2.2.3 Climate and geographic profile
Italy is located in the Southern part of Europe and includes the Italian peninsula, that from the Alps

27
stretches into the Mediterranean Sea, and several islands including Sicily (the largest in the
Mediterranean Sea) and Sardinia. The Alps mountain range is the Italian natural northern border which
separates Italy from the rest of Europe. The total national area is 301,340 km2, about 40% of the total
national area is mountainous.
In Italy about 871 areas can be found in the 2010 revised list of protected areas10:
24 National Parks,
27 Marine Protected Areas,
147 State Natural Reserves,
3 Other National Protected Areas,
134 Regional Natural Parks,
365 Regional Natural Reserves,
171 Other Regional Natural Protected Areas
About 10.5% of the national surface over land is included in protected areas.
The Italian peninsula lies between latitudes 47° and 35° N and longitudes 6° and 18° E, it is nearly in the
middle of the temperate area of the boreal hemisphere.
Being Italy surrounded by sea, Italy’s climate is temperate Mediterranean.
From the Alps to Sicily there are 11 latitude degrees. The peninsula is divided into two versants from
Apennines, and the continental part of the country is surrounded by Alps.
Italy’s climate is formally divided in four types, characterized by specific features:
Alpine climate, dominant on Alps and northern and central Apennines, characterized by night and
winter low temperatures and moist summer;
Mediterranean climate, in the island and in the southern Italy, characterized by mild
temperatures and moist winter;
Peninsular climate, peculiar of the central part of the peninsula, characterized by mild
temperatures along the coast and in the prompt hinterland (in the middle where the altitude is
high there is an alpine climate), moist in spring and autumn;
Po valley climate, with low temperatures in the winter, high in the summer, moist in spring and
autumn.
With these features, domestic heating is required through winter months and the use of air conditioning
systems during summer months has been increasing in the last decade.
Regarding the climate state and variations over Italy, temperature and precipitation trends are updated
every year based on climate data, indices and indicators gathered through the National System of climate
data (SCIA, www.scia.isprambiente.it) and reported on the annual bulletin published by the National
System for Environmental Protection (SNPA)11 .
10 Supplemento Ordinario alla Gazzetta Ufficiale n.125 del 31 Maggio 2010 – Serie Generale 11 “Gli indicatori del clima in Italia nel 2016, XII Ed.”, ISPRA – Stato dell’Ambiente N. 72/2017

28
Figure 2.7 - Time series of the inland average thermal deviation at world scale and in Italy, compared with normal climatic values 1961-1990
Sources: NCDC/NOAA and ISPRA. Data processed by ISPRA.
While at the global scale year 2016 resulted again, for the third consecutive year, as the warmest in the
historical record, in Italy it was the sixth among the warmest years, with a mean temperature anomaly of
1.35°C with respect to the climatological normal 1961-1990 (Fig. 2.7). However, the first 8 months
(January-August) of 2017 have been the warmest of the whole record, with a projection of the annual
mean temperature anomaly of about 1.9 °C.
Like the 10 previous years, 2016 has been warmer than the reference climatological normals also for the
extreme temperature indices (heat waves, expressed by the Warm Spell Duration Index; number of
summer days, tropical nights and frost days); however, 2016 doesn’t rank as one of the five warmest
years. Instead, from provisional data August 2017 has been the warmest of the whole series, with an
intense, prolonged heat wave throughout the month, registered almost in the whole national territory;
new maximum temperature records were set in many Italian regions.
As for the sea surface temperature of the Italian seas, 2016 ranks as the 4th warmest year after 2015,
2012 and 2014, with a mean anomaly of +0.99°C with respect to 1961-1990.
Mean cumulated precipitations in 2016 have been about 6% lower than the average, with significant
differences among different geographical areas of Italy: the negative anomaly was stronger in Northern
and Central Italy, while it was weaker in the South. A widespread, common, feature was the very dry
behavior of the month of December 2016, when a prolonged period of relative drought began, which
caused very serious problems of water resources management especially in Northern and Central Italy. It
has been estimated that in the first 8 months of 2017, precipitation over Italy was about 36% lower than
the average (Fig. 2.8).

29
Figure 2.8 - Time series of mean cumulated precipitation anomalies over Italy, for the first 8 months of the year, compared with normals 1961-1990
Source: ISPRA; data from Servizio Meteorologico dell’Aeronautica
In the period 1951-2015, the cumulated precipitation over Italy as a whole slightly decreased, but there
are not statistically significant trends, neither on the annual, nor on the seasonal basis. Only in Central
Italy a statistically significant negative trend is detected, of -2.0 ± 0.9% /10 years.
Several extreme precipitation events occurred in 2016, especially in the Liguria region, where peak
values of 583 mm daily precipitation and 100.8 mm hourly precipitation were measured.
2.2.4 Economic profile and industry
Italy was the fifth largest economy by nominal GDP in the world in 1990 and its rank has been decreasing
since then. According to the World Bank, Italy is the world’s eighth largest economy in 2016 and the
fourth largest economy in 2016 among the EU countries (11.3% of the EU GDP). The GDP at current
prices was 1,568,691 million € in 2016 against 1,604,515 million € in 2010.
During the last decade, a global financial and economic crisis hit the advanced economies thus resulting
into severe recession in the EU, Japan and the United States. By the end of 2009 and in 2010, a general
recovery in the economies appeared to pick up but since 2011 the growth rate of the major advanced
economies, especially in Europe, has been decelerating (Figure 2.8). Between 2012 and 2013, Italy, like
many advanced economies, has moved into recession again: GDP fell by 5.5% in 2009 and by 2.4% in
2012. In the very last years, the national economy has been showing a moderate recovery.

30
Figure 2.8 - GDP growth rate (% changes on previous year) of EU28, Italy and some EU countries in the last decade
Source: EUROSTAT
The Italian GDP per capita in 2016 is about 4% below the average EU28 value (Figure 2.9).
Figure 2.9 - GDP per capita (Italy and EU27) time series
Source: EUROSTAT

31
Figure 2.10 - Italy’s GDP and GVA along the last decade (current prices)
Source: EUROSTAT
Italy’s Gross value-added has increased between 2000 and 2008, then it has fluctuated at around 2007
GVA values during the 2009-2014 period due to the effects of the financial and economic crisis. Since
2015, GVA has been increasing again (Figure 2.10). The driving sector of the national economy is the
service sector, which accounted for 50.5% of GVA in 2000, later increased up to 58.6% in 2009 and
finally slightly decreased to 57.7% in 2016. Industry-related activities accounted for 22.3% of GVA in
2000, then declined to 18.3% in 2010 and finally reached 19.1% in 2016. Agriculture and Constructions
accounted for 2.8% and 4.8% of GVA, respectively, in 2000; later, while Agriculture decreased to 2.0%
in 2010 and to 2.1% in 2016, Construction increased up to 6.0% in 2009 before undertaking a downturn
leading to 4.8% in 2016.
Italy is still the world’s ninth largest exporter of goods (390,182 million € in 2012 and 417,077 million €
in 2016) and it is the twelfth largest importer of goods. The Italian trade balance registered a deficit in
2009 and 2012-2013, and a surplus in 2010-2011 and 2014-2015. The percentage change of exports of
goods was negative in 2009, it turned positive in 2010 and again negative between 2012 and 2014; it
was +3.8% in 2015. At a world scale, the Italian exports and imports have been losing market shares
since 2000: they both accounted for about 3.9% in 2002, then decreased to 3.3% in 2009 and attested
to 2.9% and 2.5% for exports and imports, respectively, in 2016. In 2011, Italian exports accounted for
7.9% of EU exports towards EU28 countries and for 10.6% of EU exports towards extra EU countries;
both shares have undertaken decreasing trends since 2000, and in 2016 attested to 7.3% (“intra EU28”)
and 8.4% (“extra EU28”). In terms of value, Italian exports of goods in 2016 were driven by: machinery
and auto vehicles (9.8%); pharmaceuticals (4.3%), shoes (2.7%), oil refinery products (2.1%) and iron
& steel products (1.8%). European Union (66.3%), the US (9.7%) and East Asia (8.6%) were the largest
markets for the Italian exports of goods in 201612.
The imports of goods and services showed an increasing trend from 1990 to 2007, then a fluctuating
12 “Osservatorio economico. Statistiche relative all’import/export italiano”. 2017, Italian Ministry of Economic Development

32
trend due to the fluctuation of the domestic demand through the last years. In 2016, Italian imports were
mainly from the European Union (70.2%) and East Asia (12.1%). In terms of value, the main imported
goods in 2016 were: machineries including auto vehicles (15.9%), energy products (crude oil, natural gas
and oil refinery products - 9.1%), chemical products (6.4%), pharmaceuticals (5.1%)13.
The unemployment rate in Italy over the last fifteen years is shown in the next Figure 2.11 compared
with the unemployment rate in the EU28: it was 10% in 2000 and it showed a decrease for the following
seven years; after 2006, it increased again up to 2014 (12.7%), well beyond 2000 values, as a
consequence of the recession of the national economy, but it has been decreasing since then.
Figure 2.11 - Unemployment rate in Italy and in the EU28
Source: EUROSTAT
2.3 Sector specific information
2.3.1 Energy
During 1990-2005, in spite of a moderate growth of the national economy, energy consumption has
increased at a different growth rate, while from 2005 to 2014 both the economy and the energy
consumption have reduced, as shown in figure 2.12.
13 “Osservatorio economico. Statistiche relative all’import/export italiano”. 2017, Italian Ministry of Economic Development
0
5
10
15
20
20
00
20
01
20
02
20
03
20
04
20
05
20
06
20
07
20
08
20
09
20
10
20
11
20
12
20
13
20
14
20
15
20
16
Unemployment rate (%), EU28
Unemployment rate (%), Italy

33
Figure 2.12 - GDP (chained link values 2010) and Total energy demand for the years 1990-
2015.
Source: Ministry of Economic Development, National Energy Balance 2015
The primary energy consumption per fuel types is characterized by:
a reduction of the oil share, which has remained the most important energy source since 1990;
the corresponding increase in the use of the natural gas;
and the gradually increasing share of energy from renewable sources.
The consumption trend is also a consequence of the shift from petrol products to natural gas which
started in mid ’90s (see Figure 2.13).
Compared with other European countries, Italy’s energy primary consumption is characterized by a major
use of oil and gas, a structural electricity imports, a weak coal contribution and the absence of nuclear
power. The share of renewable energy (which increased from 4.2% in 1990 to 16.8% in 2015) in Italy’s
energy supply mix is higher than the OECD’s average (9.2% in 2014), mostly due to hydropower14.
14 OECD 2016, “Renewable energy”, in OECD Factbook 2015-2016:Economic, Environmental and Social Statistics DOI: http://dx.doi.org/10.1787/factbook-2015-43-en

34
Figure 2.13 - Final consumption: energy primary sources (%)in Italy, trend from 1990 to 2015
Source: Ministry of Economic Development - *Net import of electricity
Figure 2.14 - Breakdown of Italy energy supply mix in 2015
Source: Ministry of Economic Development, National Energy Balance 2015 - *Net import of electricity

35
In 2015, primary energy demand was about 156.17 Mtoe, +3.4% compared to 2014. The latest trends of
energy consumptions in end-uses sectors can be pictured as:
a stabilization of consumptions in the transport sector (about 40 Mtoe since 2012) after a drop
between 2007-2009;
an overall increase in the consumption trend in the civil sector, mainly driven by consumptions in
the service sector which has increased from 1990 up to 2010, while consumptions in the
residential sectors have been fluctuating around 34 Mtoe since 2010, except for the drop to 29
Mtoe experienced in 2014;
energy consumptions in the industry sector have been decreasing since 2004. The fall in energy
consumption recorded in 2009 (-24% on 2008) was of course related to the national economy
moving into recession and to the fall of the industrial production. In general, the decreasing trend
(-27% in 2015 on 1990) is mainly due to the heavy drop of consumptions in the petrochemical
sector and to the energy consumptions for mechanics, textile and agri-food which have returned
to the early ‘90s levels.
The national energy bill for 2015 was 34.9 billion € (2.2% of the GDP) and the preliminary value for 2016
is 25.3 billion €, showing a decreasing trend since the peak of € 64.4 billion reached in 2012 (4.1% of the
GDP, while during the ‘90s the average energy bill accounted for 1.5% of the GDP). Table 2.2
summarizes the values of the energy bill along the last two decades.
Table 2.2 - Energy bill 1990-2015
1990 1995 2000 2005 2010 2015
(M€)
Solid fuel 731 991 1,009 1,892 2,270 1,316
Natural Gas 1,859 2,661 7,835 12,194 18,998 14,526
Oil 8,561 9,023 18,653 22,412 28,432 16,190
Biofuels and biomass - - 67 135 1,129 837
Others 867 1,563 1,523 2,135 2,409 2,053
total 12,018 14,238 29,087 38,768 53,238 34,922
Source: Unione Petrolifera
The increasing of the energy bill up to 2012 (4% of GDP in 2012) was due to the increase in natural gas
imports and, especially, to the increasing prices of energy sources (together with the trend in the US$/€
exchange rate); since 2013, the energy bill has been decreasing (2.2% of the GDP in 2015) mainly due
to the reduction of the price of oil and natural gas (especially in the last years, the reductions of the
national energy consumption and of the US$/€ exchange rate have been influencing marginally this
trend). The oil bill accounted for the largest share of the total energy bill along the time series, the peak
in 2012 was due to the decrease of oil imports which were compensated by the increase of the average
price paid for 1 ton of oil in the same year.
The energy dependence of Italy from abroad is high compared with the EU27 average (77.1% in 2015 in
Italy; 54% in 2015 in EU) as shown in the following table 2.3.

36
Table 2.3 - Total energy dependence (Italy and EU)
Energy dependence 1990 1995 2000 2005 2010 2015
Italy 84.7 81.9 86.5 83.4 82.6 77.1
EU 44.3 43.1 46.7 52.1 52.6 54
Source: EUROSTAT
Energy end-uses total consumption in 2015 was of 116.4 Mtoe, of which 41.1% related to the tertiary
sector (residential, public and tertiary sectors) and 29.3% to the transports sector. Industrial sector
accounts for 22.3% of total end-uses energy consumption, as shown in the following figure:
Figure 2.15 - Energy end-use consumptions per sector, 2015 (Mtoe)
Source: Processing of data from the National Energy Balance.
Concerning the electric sector, more than 64% of the production in Italy is provided by thermoelectric
power plants15, while the rest is covered by renewable energy sources (hydropower, wind, photovoltaic
and landfill gas). The weight of renewable resources has kept growing in the latest years. Under the EU
Renewable Energy Directive there is a target for 17% of Italy’s energy consumption to be from renewable
sources by 2020. On 10th November 2017, the new proposal of a National Energy Strategy (“SEN 2017”)
was officially adopted by the Government in the version resulting after public consultation. The National
Energy Strategy aims to contribute ensuring Italy’s sustainable growth by identifying qualitative and
quantitative goals. Specifically:
Reduction of the energy bill (actions to improve the energy efficiency; change in the energy mix
used in specific sectors, e.g. residential and transport; reduction of the differences in market
prices of natural gas and electricity);
15 Dati TERNA riferiti 2015

37
Fulfilment of the environmental goals and decarbonisation as set by EU legislation for 2030 in
terms of GHG emissions reductions, reduction of primary consumptions and increase of the use of
renewable energy sources, also in synergy with the National Strategy for Sustainable
Development;
Achievement of safer energy supplying systems, less dependent on supply from abroad;
Deployment of investments plan for “green” and “white” economy, in order to contribute in the
national economic growth.
The impacts of the “SEN 2017” could not be taken into account for the development of emissions
scenarios in chapter 5 of this Communication, due to time reasons (the adoption of the Strategy occurred
when the present document was already finalized) and also because of consistency with the development
of scenario in the National Communication made by the European Union.
Italy’s energy intensity in 2015 (100.2 toe/M€) was higher than 2014, because both GDP and the
national energy demand increased. The national energy intensity in 2015 was also lower than the EU
average (120 toe/M€) mainly due to the shift of the Italian economy from industrial activities to services.
Despite the improvement of energy efficiency for the industry sector, the gap with the EU average has
reduced in the recent years because consumption patterns in the civil sector have become more energy
intensive.
As for the industry sector, since 1990 an improvement in energy efficiency has been achieved as well as
a switch from energy intensive sub-sectors to less energy intensive sub-sectors.
2.3.2 Transport
As for transport facilities, the Italian railroad network had in 2016 about 20,760.24 km, while the Italian
road network had at the end of 2015 about 184,297 km, 13.8% more compared to the road extension in
1990.
The extension of the Italian oil pipeline network in 2015 was 4,022 km, with a coefficient of use equal to
50.2%. The extension of the Italian gas pipeline network in 2015 was 32,508 km.
Passengers’ transportation in Italy, in 2015, was about 900 billion of passengers-km (+4.2%% compared
to 2014). Road transport is the prevailing mean of passengers’ transportation: in 2015 it was 92% of the
total passengers-km, while railroad transport accounted for 6%, water transportation accounted for 0.4%
and air transportation was 2.0% of the total passengers-km. Since 2005, the picture of passenger
transportation has not changed significantly. Among the EU countries, Italy has the third highest
motorisation rate (610 cars per 1,000 inhabitants in 2014). There were about 50.1 million vehicles
circulating in 2016, of which 37.8 million were private cars16.
The goods transported were more than 177 billion tons-km in 2015 (+0.3% on 2014). The analysis of the
related data points out that:
road transportation of goods is the prevailing means of transportation between 2005 and 2015
(about 54% of the total goods transported in 2015);
goods transported by sea have increased (about 29% in 2015);
goods transported by railroad have increased (11.7% in 2015).
16 ACI, Autoritratto 2016

38
Italian families’ average expenditure for the transport sector was about 12% in 2000, while it has been
about 11% from 2005 to 2016.
Mobility demand and, particularly, road transportation shares have increased in the period from 1990 to
2015. The number of vehicles for road transportation has kept growing steadily over the last two decades
(1990-2015) as shown in the following table2.4.
Table 2.4 - Road transportation in Italy: trends in fleet
Vehicle
category
1990 1995 2000 2005 2010 2015 1990-2015
number of vehicles (%)
Passenger Cars
27,431,771 30,363,439
32,573,032 34,665,869
37,636,610 38,503,684
40.4
Light-duty trucks
1,477,403 1,942868
2,679,522 3,317,495
3,898,546 3,944,261
167.0
Heavy-duty
vehicles including
buses
1,015,505
1,011,799
892,598
1,030,621
1,006,059
947,108
-6.7
Mopeds and Motorcycles
6,609,272 7,383,469
8,827,864 9,658,245
10,610,776 9,578,483
44.9
total 36,533,951 40,701,575 44,973,016 48,672,230 53,151,991 52,973,536 45.0
During the last years, the reduction of passenger car sales has affected negatively the replacement rate
of passenger cars, so the average car life has been increasing and the circulating passenger car fleet has
been gradually aging. In 2005, the share of passenger cars in use aged more than 10 years was about
34.5%; since then, this figure has increased up to 51.3% in 2016. The share of passenger cars in use
aged more than 20 years was 8.3% in 2000, 7.2% in 2005 and it has increased up to 14% in 2016.
In 2015, the total number of vehicles was 45% more than it was in 1990: passenger cars have increased
by 40.4%, light-duty trucks have increased by 167%; heavy-duty vehicles can be considered the same
as in 1990, while mopeds and motorcycles have increased by 44.9%. As for the fuel type, the following
table 2.5 describes the distribution of the vehicles per fuel type (Gasoline, Diesel, Liquefied Petroleum
Gas; Compressed Natural Gas):
Table 2.5 - Road transportation in Italy: distribution of vehicles per fuel types
Fuel type
1990 1995 2000 2005 2010 2015 1990-2015
number of vehicles (%)
Gasoline 29,483,790 33,551,154 35,404,960 33,508,446 30,373,198 28,188,320 -4.4
Diesel 5,720,225 5,716,908 7,987,000 13,840,349 18,931,186 20,952,000 266.3
LPG 1,081,816 1,165,746 1,291,826 977,349 2,114,389 2,769,882 156.0
CNG 248,120 267,767 289,230 346,086 713,568 977,200 293.8
E85* - - - - 231 313 -
Hybrid Gasoline* -
- -
- 22,221
85,821 -
total 36,533,951 40,701,575 44,973,016 48,672,230 52,154,793 52,973,536 45.0
* mixture of up to 85% bioethanol fuel ** electricity and gasoline fuelled vehicles

39
Over the last two decades, diesel vehicles increased by 266%; LPG vehicles increased by 156% and CNG
vehicles increased by 293%.
Road Transport sector energy demand in Italy has increased by about 9% in the period 1990-2015, with
significant increases in the consumption of natural gas, diesel, LPG, renewable and electricity, as shown
in the following table 2.6.
Table 2.6 -Road Transport sector energy consumption in Italy per fuel (kToe) referred to 1990-
2015
Fuel 1990 1995 2000 2005 2010 2015 1990-2015
kToe (%)
Renewables Biodiesel na na na 177 1419 1167 559*
Primary fossil
Natural Gas
208 243 327 380 695 901 333
Other oil products
6 5 na na na na
Gasoline 13,547 18,058 17,556 14,175 10,276 8,192 -40
Diesel 15,697 14,814 17,437 22,921 22,017 21,526 37
LPG 1,474 1,624 1,562 1,131 1,334 1,817 23
Secondary Electricity na na na na 5 6 20**
Total 30,932 34,744 36,882 38,784 35,746 33,609 9
*comparison between 2005-2015 **comparison between 2010-2015 Source: National Energy Balance
As shown in the previous table, energy consumption in the road transport sector raised by about 3 Mtoe
in the period 1990-2015. Road transport sector keeps depending almost completely on oil products
(93.8% in 2015).
Energy prices and economic recession had an effect in the transport sector. In the latest years, the
market trends are towards: a downsizing of cars and reduction of engine displacements, a preponderance
of gasoline versus diesel in the low segments of the market and the use of alternative fuels (methane,
LPG, hybrid). In 2009, the EU adopted legislation (Regulation EC No 443/2009) setting standards and
mandatory targets in the manufacturing of new cars; Regulation EC No 333/2014 amended Regulation
443/2009 in order to define the modalities for reaching the 2020 targets to reduce CO2 emissions from
new passenger cars. Emissions of CO2 per km from new cars is targeted to decrease over time, table 2.7
shows the decrease in CO2 emissions from passenger cars along the last two decades (2015 emissions
level is lower than 1995’s).
Table 2.7 - Trend of CO2 emissions from passenger cars in Italy in the period 1990-2015
Emissions from passenger cars 1990 1995 2000 2005 2010 2015
CO2 (Mt) 54.5 64.2 68.0 69.2 61.0 61.7
Source: ISPRA
The EU cars legislation aim to improve the fuel economy of cars sold in the European market. These
factors linked to energy prices are moving the market towards new technologies.

40
2.3.3 Agriculture
Main drivers of GHG emission trends for Agriculture are the number of animals, the variation of cultivated
surface/crop production and use of nitrogen fertilizers. Trends and changes of these parameters at
national level have been affected also by the implementation of a Common Agricultural Policy at EU level.
Specific information about CAP measures (e.g. how they influence the emissions trend) implemented at
national level are provided in chapter 4.
In Italy, 12.9% of the total agricultural holdings in 2013 dealt with livestock farming. Changes in
livestock farms have occurred since 1982: the number of livestock farms has decreased by 77.8%.
Changes in livestock populations have occurred since 1990: specifically, in 2015 cattle reduced by 25.4%
while swine and poultry increased by 3.3% and 13.3%, respectively.
The total agricultural area, the utilized agricultural area (UAA) and the number of agricultural holdings
have been decreasing since 1982 (table 2.8) according to the Agricultural Census conducted by ISTAT
every 10 years; the data related to 2013 are the results of the Farm Structure Survey 2013, a three-year
investigation in the form of sample surveys based on the same definitions of the Census. The reduction in
the number of agricultural holdings (-53.0% in 2013 compared to 1982) is more significant than the
reduction of UAA (-21.5%) thus resulting in the noticeable increase of the average size of Italian
agricultural holdings along the same years (+65.6%). In 30 years, small farms (with UAA less than 1 ha)
declined by 25%, while large-scale farms (with UAA more than 10 ha) increased by 80%. Furthermore,
few farms hold the majority of UUA, as small and medium-sized companies have come to large
companies over the years (large-scale farms have increased the average share of UAA from 65.0% to
76.6%). Official statistics concerning the distribution of agricultural holdings by type show that family-run
business is still a peculiar feature of the Italian agricultural holdings.
Table 2.8 - Agricultural holdings characteristics in Italy between 1982 and 2013
Agricultural holdings characteristics
1982 1990 2000 2010 2013*
Number of agricultural holdings 3,133,118 2,848,136 2,396,274 1,620,884 1,471,185
UAA (ha) 15,832,613 15,025,954 13,181,859 12,856,048 12,425,995
Total agricultural area (ha) 22,397,833 21,628,355 18,766,895 17,081,099 16,678,296
Average size of agricultural
holdings (ha)
5.1 5.3 5.5 7.9 8.4
Source: ISTAT Agricultural Census for the years 1982 to 2010; ISTAT Farm Structure Survey (FSS) 2013 In the last decade, the decrease in the use of fertilizers is the result of both CAP and trend of the
fertilizers market prices. The decrease in the use of mineral products with a corresponding increase of
organic formulated products is also in line with the CAP aiming at promoting the use of organic manures
and fertilizers instead of the use of synthetic mineral products, in order to improve the quality of the
agriculture products, the environment and the health of consumers.
According to FSS2013, the number of agricultural holdings that produce renewable energy is 21,000
(about 1.4% of total agricultural holdings in 2013), representing a six-time increase compared to 2010.
2.3.4 LULUCF
Over the last 25 years, changes in the land use in Italy have resulted in the increase of the forested area
(23%), of wetlands (2%) and of the settlement area (42%); a reduction of grassland area (5%) and of
the cropland area (18%) compared to 1990 areas is also observed.

41
Figure 2.16 - Land use in Italy in 2015
Italy has a rich biological heritage of forest and several types of landscape, as our peninsula constitutes a
bridge between the central European environmental settings, including those of the continental type, and
the Mediterranean ones. The diversification can be observed, in terms of forestry resources, in the
contrast between the Alpine woods of resinous trees, similar to those of central and northern Europe, and
the mixed forests of leave bearing trees, with the range extending to Mediterranean brush and
formations typical of cold, arid climates closely related to those of the North African countries.
Italian land surface belonging to “Forest” category was about 7,590 kHa in 1990; 8,369 kHa in 2000;
9,032 kha in 2010; and 9,305 kHa in 2015, equivalent to 31% of our National land surface. The Italian
forested area is spreading due to the dismissal of agriculture practices, mostly in mountain zones, and to
the natural conversion of cultivated lands and grazing into forests. However, forest expansion rate has
been decreasing along the last decade: it was about 78 kha y-1 in 2000 and it was about 53.8 kha y-1 in
from 2010 to 2015.
The natural protected areas (established on various administrative levels: national, regional and local)
include 30.5% of the total forested areas.
Total forest areas in Italy certified under international forest management certification schemes was
818,293 ha in 2012 and it is 874,783.71 ha in 2017: 92.7% under the Programme for Endorsement of
Forest Certification schemes (PEFC)17 and 7.3% under the Forest Stewardship Council (FSC).
17 https://www.pefc.it/

42
Table 2.9 - Italian land surface areas according to the GHG inventory, along the inventory
period18
Categories Area [kha]
1990 1995 2000 2005 2010 2015
Forest 7,590 7,980 8,369 8,759 9,032 9,305
Grassland 8,891 8,278 8,186 8,265 8,573 8,472
Cropland 10,841 10,924 10,487 9,879 9,159 8,849
Wetland 510 512 515 517 519 519
Settlements 1,644 1,782 1,920 2,058 2,196 2,334
Other land 658 657 656 656 655 655
TOTAL 30,134 30,134 30,134 30,134 30,134 30,134
The areas (forests, cropland and grassland) burnt by fires since 1990 are depicted in figure 2.17:
forested areas affected by fires in 2015 amount to approximately 37.7% (15.18 kha) of the total land
surface burned by fire in the same year (40.25 kha).
Figure 2.17 – Forest land, Cropland and Grassland (kha) affected by fires along the GHG
inventory period.
Source: ISPRA, NIR 2017
18 ISPRA, NIR2017

43
2.3.5 Waste
According to the National Institute of Statistics in 2012 about 99.5% of the Italian municipalities were
served by a sewer system and about 96% of the population was connected to wastewater treatment
plants. In the following table 2.10 estimates of the number of facilities for the treatment of waste in Italy
are reported.
Table 2.10 – Waste and wastewater treatment in Italy: number of facilities
Type of waste facility 1990 1995 2000 2005 2010 2015
Landfills 480 650 657 340 211 149
Incinerators 122 135 132 111 148 124
WWTP 6,673 9,456 12,139 14,823 17,506 20,189
The production of municipal waste in Italy has increased from 22 Mt in 1990 to about 32 Mt in the years
between 2005 and 2010, while it has remained approximately stable around 29.6 Mt since 2013,
although a reduction trend can be observed for the last few years. Changes in life style and consumption
patterns, rather than the enforcement of waste legislation, seem to be the main drivers for the gradual
reduction in MSW production; the international crisis of the economy has contributed too. In 2015,
approximately 29.52 Mt of municipal waste were produced, corresponding to 486.7 kg/year per person
(EU28 average per capita MSW production was about 474 kg/year in 2014).
The production of special waste by manufacturing industries has been increasing since 1990: it accounted
for about 33 Mt in 2000; 36.7 Mt in 2005; 39.4 Mt in 2010; and it decreased to 26.5 Mt in 2015.
Separate collection has been increasing since 1996: in 2015, about 14 Mt of MSW (47.5%) were
subjected to separate collection compared to 8.3 Mt (25.8%) in 2006 and to 1.8 Mt (7.2%) in 1996.
Although separate collection rates vary across the country, an increasing overall trend during the last
years can be observed; but figures are still lower than national targets set by the legislation.
The municipal wastes have been managed as shown in table 2.11 for the last two decades:
Table 2.11 – Main management systems of Municipal Waste (%)
Treatment 1990 2000 2005 2010 2015
Landfilling 91.1 76 48.6 46.2 26
Incineration 6 8 10.2 13.5 19
Mechanical-biological treatment 2 11 22.5 28.8 36
Composting 1 7 5.6 12.1 14
In Italy, the number of landfills has been decreasing since 1999: a reduction of 508 landfill installations
was registered in 2015 due to the decommissioning of unmanaged and smaller size landfills. Since early
‘90s, landfilling as a waste disposal practice has been decreasing also due to changes in national policies
which now support other waste treatments (e.g. incineration; mechanical-biological treatment;
composting; anaerobic digestion; etc). Poor information was available up to 2000 concerning the number
of installations for the recovery of biogas at landfills in Italy: the number of installations was 32 in 2011,
and it has increased since then. The amount of methane deriving from landfill gas and sent to energy
recovery was 132 kt in 2000, 271 kt in 2010 and 278 kt in 2015.
The number of operating incineration plants was 122 in 1990, it reached 138 in 2010 and it was 124 in

44
2015. In 2011, more than 95% of the total amount of incinerated waste was treated in installations with
energy recovery systems and this share has increased up to 99% in 2015.
The production of special waste in Italy has increased since 1990: from 77.1 Mt in 1990, 137 Mt in 2010
and 132.4 Mt in 2015. The per capita production of special waste in 2010 at national level was 2.2 t/y,
2.1 t/y for non-hazardous special waste and 0.1 t/y for hazardous special waste, respectively. The
correlation between special waste production trend and the Italian GDP trend is good: especially for the
last years, the ups and downs in the special waste production trend are related to the trend of the Italian
economy.
For the last two decades, the amounts of special wastes produced in Italy have been reported in the
following table 2.12.
Table 2.12 - Special wastes produced in Italy between 1990 and 2015 (Mt)
1990 1997 2000 2005 2008 2009 2010 2015
Non-hazardous special
waste
- 56.1 51.8 55.6 60.5 58.7 61.1 70.3
Hazardous special waste
- 3.4 3.9 7.9 11.3 10.3 9.6 9.1
Inert waste (Mt) - - 27.3 45.9 70.8 65.3 67 52.9
Total Special Waste 77.1 59.5 83.0 109.4 142.8 134.6 137.9 132.4
The different systems of managing the special wastes in Italy for the last decade are summarized in the
table 2.13.
Table 2.13 - Management of Special Waste (%)
It is worth noting that the amount of special waste destined to the recovery of material has been
increasing for the last years and landfilling of special waste has been reducing for the same years.
As for the wastewater treatment plants, the overall treatment capacity over the last 20 years has been
increasing as reported in the following table:
Table 2.14 - Wastewater treatment capacity in Italy
1990 1995 2000 2005 2010 2015
Number of WWTPs 6,673 9,456 12,139 14,823 17,506 20,189
Total treatment capacity (M
p.e.)
46 60 70 98 101 103
Treatment 2000 2005 2010 2015
Storage 15.1 13.7 13.6 10.8
Other disposal operation 14.5 14.6 17.2 13.7
Energy recovery 2.5 2.7 1.6 1.5
Incineration 1 1.1 0.7 0.7
Recovery of material 39.8 48.6 57.5 65.1
Landfilling 27.1 19.4 8.2 8.2
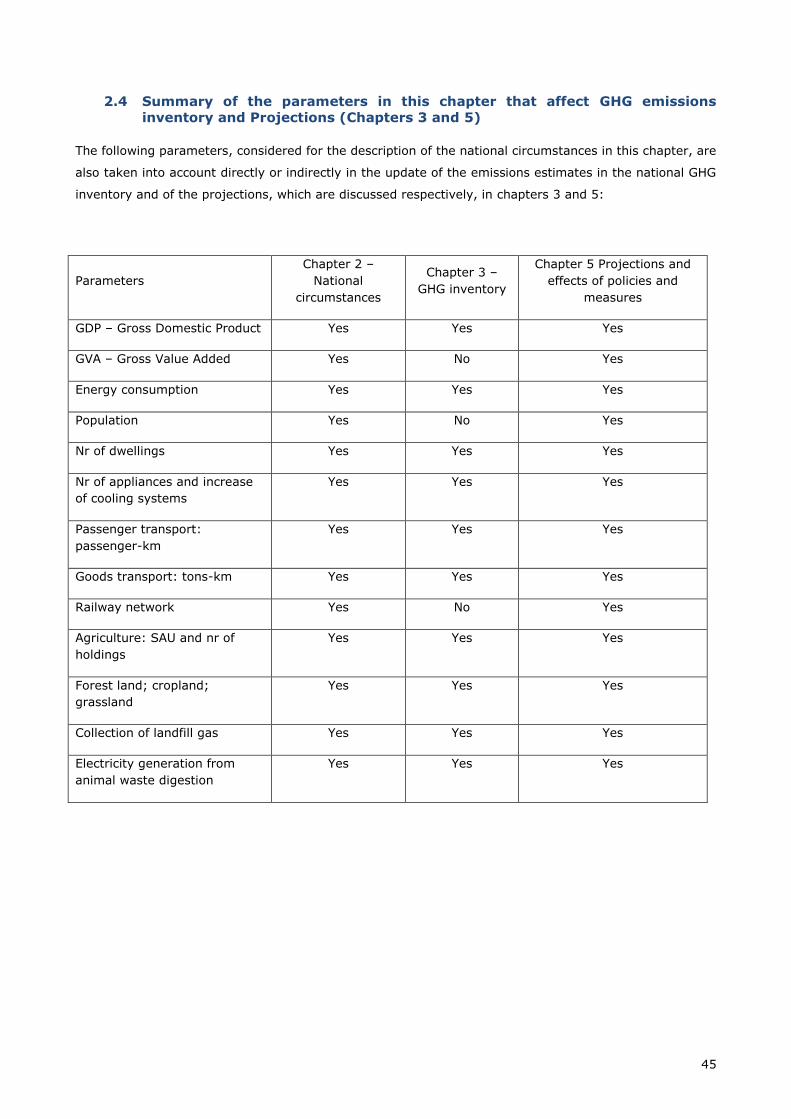
45
2.4 Summary of the parameters in this chapter that affect GHG emissions
inventory and Projections (Chapters 3 and 5)
The following parameters, considered for the description of the national circumstances in this chapter, are
also taken into account directly or indirectly in the update of the emissions estimates in the national GHG
inventory and of the projections, which are discussed respectively, in chapters 3 and 5:
Parameters
Chapter 2 –
National
circumstances
Chapter 3 –
GHG inventory
Chapter 5 Projections and
effects of policies and
measures
GDP – Gross Domestic Product Yes Yes Yes
GVA – Gross Value Added Yes No Yes
Energy consumption Yes Yes Yes
Population Yes No Yes
Nr of dwellings Yes Yes Yes
Nr of appliances and increase
of cooling systems
Yes Yes Yes
Passenger transport:
passenger-km
Yes Yes Yes
Goods transport: tons-km Yes Yes Yes
Railway network Yes No Yes
Agriculture: SAU and nr of
holdings
Yes Yes Yes
Forest land; cropland;
grassland
Yes Yes Yes
Collection of landfill gas Yes Yes Yes
Electricity generation from
animal waste digestion
Yes Yes Yes

46
3 GREENHOUSE GAS INVENTORY19
3.1 Greenhouse gas emission trends
The national greenhouse gas emission (GHG) inventory is communicated through compilation of the
Common Reporting Format (CRF) and the National Inventory Report (NIR), in accord with the guidelines
provided by the United Nations Framework Convention on Climate Change (UNFCCC).
The emissions presented in this document are those communicated in the 2017 submission to the
UNFCCC Secretariat and to the European Commission in the context of the Greenhouse Gas Monitoring
Mechanism. A complete description of the factors underlying the Italian emission trends, the rationale for
the choice of methodologies, the emission factors and parameters used to estimate emissions for the
relevant sectors is provided in the National Inventory Report (ISPRA, 2017)20.
The CRF files, national inventory reports and other related documents can be found at the following
addresses: http://www.sinanet.isprambiente.it/it/sia-ispra/serie-storiche-emissioni;
http://groupware.sinanet.isprambiente.it/reportnet/library;
http://unfccc.int/national_reports/annex_i_ghg_inventories/national_inventories_submissions/items/101
16.php.
Summary tables of emission trends are included in the Third Biennial Report.
Figure 3.1 illustrates the national trend of greenhouse gases for 1990-2015, expressed in CO2-equivalent
and by gas; figures do not include emissions and removals from land use, land use change and forestry.
Figure 3.1 - National greenhouse gas emissions from 1990 to 2015 (excluding LULUCF)
Under the Kyoto Protocol, Italy has set 1990 as the base year for carbon dioxide (CO2), methane (CH4),
nitrous oxide (N2O); as for fluorinated gases (F-gases), 1990 is also the base year for HFCs, PFCs, SF6
whereas 1995 is the base year for NF3.
19 Lead authors: Daniela Romano (ISPRA); Chiara Arcarese (ISPRA; § 3.3). Contributing Authors: Antonella Bernetti (ISPRA), Antonio Caputo (ISPRA), Riccardo De Lauretis (ISPRA), Eleonora Di Cristofaro (ISPRA), Andrea Gagna (ISPRA), Barbara Gonella (ISPRA), Ernesto Taurino (ISPRA), Marina Vitullo (ISPRA). 20 ISPRA, 2017. Italian Greenhouse Gas Inventory 1990-2015. National Inventory Report 2017. ISPRA, 261/2017.
0
100
200
300
400
500
600
CO
2eq
. [M
t] (
ex
clu
din
g L
UL
UC
F)
CO2 CH4 N2O HFCs, PFCs, SF6, NF3

47
Total greenhouse gas emissions, in CO2 equivalent, excluding emissions and removals from LULUCF, have
decreased by 16.7% between 1990 and 2015, varying from 520 to 433 CO2 equivalent million tons (Mt).
It should be noted that the economic recession has had a remarkable influence on the production levels
affecting the energy and industrial process sectors, with a consequent notable reduction of total
emissions, in the last six years.
The most important greenhouse gas, CO2, which accounts for 82.5% of total emissions in CO2 equivalent,
shows a decrease by 17.9% between 1990 and 2015. In the energy sector, in particular, CO2 emissions
in 2015 are 15.6% lower than in 1990.
CH4 and N2O emissions are equal to 10.0% and 4.2% of the total CO2 equivalent greenhouse gas
emissions, respectively. CH4 emissions have decreased by 20.3% from 1990 to 2015, while N2O has
decreased by 32.5%.
As for other greenhouse gases, HFCs account for 2.8% of total emissions, PFCs and SF6 are equal to
0.4% and 0.1% of total emissions, respectively; the weight of NF3 is less than 0.01%. Among these
gases, HFCs show a strong increase in emissions, and the meaningful increasing trend will make them
even more important in next years.
Total greenhouse gas emissions and removals subdivided by sector, including LULUCF, are shown in
Figure 3.2.
Figure 3.2 - National greenhouse gas emissions and removals from 1990 to 2015 by sector
Emission trends excluding LULUCF
The share of the different sectors in terms of total emissions remains nearly unvaried over the period
considered. Specifically, in 2015, the greatest part of the total greenhouse gas emissions is to be
attributed to the energy sector, with a percentage of 81.8%, followed by industrial processes and
agriculture, accounting each for 6.9% of total emissions, and waste contributing with 4.3%.
-60
20
100
180
260
340
420
500
580
CO
2eq
. (M
t)
Energy Industrial Processes and product use Agriculture Waste LULUCF

48
For the energy sector, the decrease in total emissions is equal to 15.8% in the period 1990-2015; in
particular, an upward trend is noted from 1990 to 2004, with an increase by 13.6% in total greenhouse
gas emissions in CO2 equivalent excluding LULUCF, whereas a reduction by 25.8% between 2004 and
2015 is observed.
From 2004, GHG emissions from the sector are decreasing because of the policies adopted at European
and national level to implement the production of energy from renewable sources. From the same year, a
further shift from petrol products to natural gas in producing energy has been observed because of the
starting of the EU greenhouse gas Emission Trading Scheme (EU ETS) in January 1st, 2005. From 2009, a
further drop of the sectoral emissions is due to the economic recession. From 2008 to 2009 the decrease
observed in GHG emissions is, indeed, equal to -10.0% followed by a slight increase (+2.2%) from 2009
to 2010; since then the annual variations are always negative until 2015, when emissions increased by
3.1% with respect to 2014 due to a reduction in energy production by hydroelectric which resulted in an
increase of energy production from thermoelectric plants to satisfy the energy demand.
In general, from 1990 to 2015 the decrease in emissions is driven by the reduction in the energy
industries and manufacturing industries and construction, which account for 29.9% and 14.8% and
reduced by 23.7% and 38.9%, respectively. Specifically, for the manufacturing industries and
construction, the reason for the reduced emissions is the cut in production in some subsectors (e.g.
chemical, construction and building materials, steel) due to the effects of the economic recession but also
to an increase in efficiency, especially identified in the chemical sector.
On the other hand, an increase in emissions still occurs in two relevant sectors, transport and other
sectors, which increased by about 3.2% and 3.5% and account for 29.9% and 23.1%, respectively.
Road transport is the most relevant source in the transport sector, accounting in 2015 for 22.9% of total
national CO2 equivalent emissions. In 2015, GHG emissions from road transport were about 93.8% of the
national emissions from transport. From 1990 to 2015, GHG emissions from the sector increased by
5.2%; this trend has a twofold explanation: on one side, a strong increase starting from 1990 until 2007
(27.3%), due to the increase of vehicle fleet, total mileage and consequently fuel consumptions; on the
other side, from 2007 onwards, a decrease in fuel consumption and emissions basically due to the
economic crisis (emissions decrease of about -17.3%).
The increase in other sectors, which refer to emissions originated from energy use in the civil sector and
from military mobile activities, is due, from 1990 to 2000, to the increase in numbers and size of building
with heating, and to the trend in weather conditions, while from 2002, and especially in the last few
years, to the increase in other greenhouse gas emissions than CO2 for the growing use of woody biomass
and biogas for heating.
The substance with the highest impact, in the energy sector, is CO2, accounting for 96.5% of the total,
whose levels have decreased by 15.6% from 1990 to 2015. The trend is mostly driven by the energy
industry and manufacturing industries and construction sectors, as previously described. The transport
sector shows an increase of emissions until 2007 and then a decrease both for the economic recession
and the penetration of vehicles with low fuel consumption.

49
Describing patterns of other GHGs except for CO2, the trend of N2O emissions is related to the technology
development in road transport and to the switch from gasoline to diesel fuel consumption; CH4 emission
trend is driven by the combined effect of technological improvements that limit volatile organic
compounds (VOCs) from tail pipe and evaporative emissions (for cars) and the expansion of two-
wheelers fleet.
Emissions from industrial processes and product use account for 6.9% of total national greenhouse gas
emissions, excluding LULUCF. Total emission levels, in CO2 equivalent, reduced by 25.7% from 1990 to
2015.
The decrease is prevalently to be attributed to the drop of emissions in the mineral and chemical
industries, explaining 71.1% and 18.9%, respectively, of the sectoral total. Emissions from mineral
production decreased by 46.3%, mostly for the reduction of cement production.
In the chemical industry, emissions diminished by 71.9%; trends are affected by the general reduction in
productions and by the introduction of abatement technologies especially in the production process of
nitric acid from 2008 and adipic acid from 2005, for which the abatement system has been applied with
an increasing operating time and a fully abatement rate.
On the other hand, a considerable increase is observed in F-gas emissions (283.4%), whose share on
total sectoral emissions is 40.8%. The main drivers of the increase are the consumption of HFCs in
refrigeration and air-conditioning devices, together with their use in pharmaceutical aerosols.
The agriculture sector is also contributing with a 6.9% to total greenhouse gases, excluding the LULUCF
sector. Emissions mostly refer to methane and nitrous oxide levels, which account for 61.6% and 37.0%
of total emissions of the sector, respectively; CO2 accounts for the remaining 1.4%.
The decrease observed in total emissions from 1990 to 2015 (-15.9%) is due to the decrease of CH4
emissions from enteric fermentation (-11.1%) and N2O from agricultural soils (-18.0%), which account
for 46.0% and 29.9% of total agricultural emissions, respectively. Main drivers behind these downward
trends are the reduction in the number of animals, especially cattle in the whole period as well as the use
of nitrogen fertilizers, mainly due to the Common Agricultural Policy (CAP) measures. In addition, there
has been a significant increase in the recovery of the amount of biogas produced from animal manure
and used in the energy sector for the production of electricity and combined electricity and heat
production in the last years, thus contributing to the reduction of total emissions.
The waste sector accounts for 3.6% of total national greenhouse gas emissions, excluding LULUCF, and
shows a decrease of 10.9% from 1990 to 2015. The trend is mainly driven by the emissions from solid
waste disposal, accounting for 71.5% of the total sectoral emissions, which decreased by 17.8%; in fact,
despite the continuous increase of waste production, solid waste disposal on land has decreased due to
waste management policies in place in the last years, specifically the growth of waste incineration, the
composting and mechanical and biological treatment and the increasing practice of recyclable waste
collected. At the same time, the increase in the methane-recovered percentage has led to a further
reduction in net emissions.
Conversely, wastewater handling, which accounts for 26.7% of the total, shows an increase in emissions
equal to 22.2% essentially dependent on the number of equivalent inhabitants served.

50
Emission trends including LULUCF
So far, national totals have been described excluding the LULUCF sector. Accounting for emissions and
removals in this sector, national totals show a downward trend of 23.2% from 1990 to 2015.
Total removals, in CO2 equivalent, in the LULUCF sector, show a high variability in the period, remarkably
influenced by the annual fires occurrence and the relevant area burned by fires. Specifically, in the
LULUCF sector, CO2 accounts for 97.8% of total emissions and removals of the sector. The key driver for
this sector is the increase of carbon stock changes from forest land (the area reported under forest land
has raised by 14.9%).
Emissions and removals from the LULUCF sector are reported in Table 3.1.
Table 3.1 - Total emissions from the LULUCF sector by source/sinks
1990 1995 2000 2005 2010 2015
Gg CO2 eq.
Total emissions / removals
-3,256 -21,944 -16,242 -28,385 -31,609 -36,218
Forest land -17,020 -30,954 -25,472 -34,477 -36,541 -39,924
Cropland 2,225 1,861 2,046 1,459 1,335 2,160
Grassland 4,914 -993 669 -2,648 -4,172 -6,658
Wetlands - 5 8 8 - -
Settlements 7,145 8,941 6,982 7,804 7,897 7,936
Other land - - - - - -
Harvested wood products
-520 -804 -476 -531 -128 267
3.1.1 Carbon dioxide emissions
CO2 emissions, excluding CO2 emissions and removals from LULUCF, have decreased by approximately
17.9% from 1990 to 2015, reducing from 435 to 357 million tons.
The most relevant contributions derive from the energy industries (29.5%) and transportation (29.3%).
Non-industrial combustion accounts for 21.6% and manufacturing and construction industries for 14.4%,
while the remaining emissions derive from industrial processes (4.2%) and other sectors (0.1%).
The performance of CO2 emissions by sector is shown in Figure 3.3.

51
Figure 3.3 - CO2 emissions by sector from 1990 to 2015
The main sectors in charge of the reduction of CO2 emissions are the energy industries and
manufacturing industries and construction; in the period 1990-2015, emissions from energy industries
have decreased by 23.8% while those from manufacturing industries and construction show a decrease of
39.1%. The transport sector shows an increase of emissions until 2007, due to an increase in the number
of vehicles and mileages driven in road transport, and then a decrease both for the economic recession
and the penetration of vehicles with low fuel consumption.
Non-industrial combustion emission trend is driven by the annual climatic variation while emissions from
industrial processes decreased by 50.0% mainly for the decrease of cement production.
Figure 3.4 illustrates the performance of the following economic and energy indicators:
Gross domestic product (GDP) at market prices as of 2000 (base year 1990=100);
Total Energy Consumption;
CO2 emissions, excluding emissions and removals from land-use change and forestry;
CO2 intensity, which represents CO2 emissions per unit of total energy consumption.
The trend of CO2 emissions per total energy unit shows that CO2 emissions in the 1990s essentially
mirrored energy consumption. A decoupling between the curves is observed only in recent years, mainly
because of the substitution of fuels with high carbon contents with methane gas in the production of
electric energy and in industry. In the last years, the increase in the use of renewable sources has led to
a notable reduction of CO2 intensity.
0
100
200
300
400
500
600
CO
2 [M
t]
Energy Industries Manufacturing Industries and Construction
Transport Non industrial combustion
Industrial processes and product use Other

52
Figure 3.4 - Energy-related and economic indicators and CO2 emissions
3.1.2 Methane emissions
Methane emissions, excluding the LULUCF sector, represent 10.0% of total greenhouse gases in 2015,
equal to 43.2 Mt in CO2-equivalent, and show a decrease of approximately 20.3% compared to 1990
levels.
CH4 emissions, in 2015, originate mainly from the agriculture sector, which accounts for 42.7% of total
methane emissions, as well as from waste (38.8%) and energy (18.4%).
Emissions in the agriculture sector regard mainly the enteric fermentation (74.7%) and manure
management (16.1%) categories. The agriculture sector shows a decrease of emissions equal to 13.5%
compared 1990, attributable widely to a reduction in livestock and the recovery of biogas for energy
purposes.
Activities typically leading to emissions in the waste-management sector are the operation of dumping
sites and the treatment of industrial waste-water. The waste sector shows a downward trend in emission
levels, equal to -21.7% compared to 1990; the largest emission share origins from the solid waste
disposal on land subcategory (76.5%) and waste-water handling (13.5%), which decreased by 22.3%,
and 22.7%, respectively.
In the energy sector, the reduction of CH4 emissions (-30.1%) is the result of two contrasting factors; on
the one hand there has been a considerable reduction in emissions from energy industries, transport, and
fugitive emissions from fuels (caused by leakage from the extraction and distribution of fossil fuels, due
to the gradual replacement of natural-gas distribution networks); conversely, a strong increase in
emissions is observed in the civil sector due to the increased use of methane and biomass in heating
systems.
Figure 3.5 shows national CH4 emission trends by sector.
70
80
90
100
110
120
130
19
90
=1
00
GDP
Total energy consumption
CO2 emissions
CO2 Intensity

53
Figure 3.5 - CH4 emissions by sector from 1990 to 2015
3.1.3 Nitrous oxide emissions
In 2015 nitrous oxide emissions, excluding the LULUCF sector, represent 4.2% of total greenhouse gases,
with a decrease of 32.5% between 1990 and 2015, decreasing from 26.9 to 18.2 Mt CO2-equivalent.
The major source of N2O emissions is agriculture (60.8%), especially for the use of both chemical and
organic fertilisers, as well as the management of waste from the raising of animals. Emissions from the
agriculture sector show a decrease of 19.9% in the 1990-2015 period, due to a reduction in livestock
number.
N2O emissions in the energy sector (25.4% of the total) increased by 0.3% from 1990 to 2015; this
growth can be traced back primarily to the increase of emissions by 39.0% in the civil sector, which
accounts for 13.3% of the total, as a result of the increased use of biomass in heating systems. This
increase was counterbalanced by the reduction of 40.9% in the manufacturing and construction
industries (which account for 4.3% of the total) mainly due to the reduction in the last years of cement
production.
The industrial sector accounts for about 3.4% of total N2O emissions. The sector shows the most
significant reduction in emission levels due to the chemical industry. Specifically, emissions from the
production of nitric acid have decreased by 98.2% from 1990 to 2015, with a notable decrease in the last
years due to the introduction of the abatement systems in the main production plant; emissions from
production of adipic acid show a decrease from 1990 to 2015 of 97.5% because of the introduction of an
abatement technology. A further component, which has contributed to the reduction, is the decreasing
use of N2O for medical purposes.
Other emissions in the waste sector, primarily regarding the processing of industrial and domestic waste-
water, account for 10.4% of national total.
Figure 3.6 shows national N2O emission figures by sector.
0
500
1,000
1,500
2,000
2,500
CH
4[G
g]
Energy Agriculture Waste Industrial processes and product use

54
Figure 3.6 - N2O emissions by sector from 1990 to 2015
3.1.4 Fluorinated gas emissions
Emissions of fluorinated gases represent 3.3% of total greenhouse gases in CO2-equivalent in 2015 and
they show a significant increase between 1990 and 2015. This increase is the result of different factors
for the different gases.
HFCs, for instance, have increased considerably from 1990 to 2015, from 0.4 to 12.3 Mt in CO2-
equivalent. The main sources of emissions are the consumption of HFC-134a, HFC-125, HFC-32 and HFC-
143a in refrigeration and air-conditioning devices, together with the use of HFC-134a in pharmaceutical
aerosols. Increases during this period are due both to the use of these substances as substitutes for
gases that destroy the ozone layer and to the greater use of air conditioners in vehicles.
Emissions of PFCs show a decrease of 41.9% from 1990 to 2015. The level of PFC emissions in 2015 is
1.7 Mt in CO2-equivalent, and it is due to by product emissions in the fluorochemical production (91.2%)
and the use of the gases in the production of semiconductors (8.1%).
Emissions of SF6 are equal to 0.4 Mt in CO2 equivalent in 2015, with a decrease of 13.3% as compared to
1990 levels. In 2015, about 79.3% of SF6 emissions derive from the gas contained in electrical
equipment and 10.0% from the use of this substance in accelerators and 10.7% from the gas used in the
semiconductors manufacture.
NF3 emissions account for 0.03 Mt in CO2 equivalent in 2015 and derive from the semiconductors
industry.
The National Inventory of fluorinated gases has largely improved in terms of sources and gases identified
and a strict cooperation with the relevant industry has been established. Higher methods are applied to
estimate these emissions; nevertheless, uncertainty still regards some activity data, which are considered
of strategic economic importance and therefore kept confidential.
Figure 3.7 shows emission trends of F-gases by gas, expressed in CO2-equivalent.
0
20
40
60
80
100
120
N2O
[G
g]
Energy Agriculture Industrial processes and product use Waste

55
Figure 3.7 - Emissions of fluorinated gases from 1990 to 2015
3.2 National System for preparing the Italian Greenhouse Gas Inventory
3.2.1 Institutional arrangements
The National System for the Italian Greenhouse Gas Inventory was established by the Legislative Decree
n° 51 of March 7th 2008. The Institute for Environmental Protection and Research (ISPRA), former
Agency for Environmental Protection and Technical Services (APAT), is the single entity in charge of the
development and compilation of the national greenhouse gas emission inventory, as specified by art.14
bis of the above Decree. The Institute annually draws up a document which describes the national system
including all updated information on institutional, legal and procedural arrangements for estimating
emissions and removals of greenhouse gases and for reporting and archiving inventory information; the
plan is submitted to the Ministry for the Environment, Land and Sea for approval.
As for the official consideration of the inventory, the Ministry for the Environment, Land and Sea is
responsible for endorsement and for communication to the Secretariat of the UN Framework Convention
on Climate Change and the Kyoto Protocol. The inventory is also submitted to the European Commission
in the framework of the Greenhouse Gas Monitoring Mechanism.
A complete description of the Italian National System can be found in the document “National
Greenhouse Gas Inventory System in Italy. Year 2016” (ISPRA, 2016), publicly available at
http://www.sinanet.isprambiente.it/it/sia-ispra/serie-storiche-emissioni
No changes with respect to the last submission occurred in the National System.
As single entity, ISPRA is responsible for all aspects of national inventory preparation, reporting and
quality management. A specific unit of the Institute is in charge of the management of the emission
inventory. Activities include the collection and processing of data from different data sources, the
selection of appropriate emissions factors and estimation methods, the compilation of the inventory
following the QA/QC procedures, the assessment of uncertainty, the preparation of the National
0
2,000
4,000
6,000
8,000
10,000
12,000
14,000
16,000
19
90
19
91
19
92
19
93
19
94
19
95
19
96
19
97
19
98
19
99
20
00
20
01
20
02
20
03
20
04
20
05
20
06
20
07
20
08
20
09
20
10
20
11
20
12
20
13
20
14
20
15
CO
2eq
. [G
g]
NF3
SF6
PFCs
HFCs

56
Inventory Report and the reporting through the Common Reporting Format, the response to the review
processes, the updating and data storage. The web address where all the information related to the
inventory can be found is: http://www.sinanet.isprambiente.it/it/sia-ispra/serie-storiche-emissioni.
Different institutions are responsible for communication and publication of statistical basic data, which are
essential for ISPRA to carry out emission estimates. These institutions are part of a National Statistical
System (Sistan), which periodically provides national official statistics; moreover, the National Statistical
System ensures the homogeneity of the methods used for official statistics data through a coordination
plan, involving the entire public administration at central, regional and local levels. The Italian National
Institute of Statistics (ISTAT) coordinates the National Statistical System whereas other participant
bodies are the statistical offices of ministries, national agencies, regions and autonomous provinces,
provinces, municipalities, research institutes, chambers of commerce, local governmental offices, some
private agencies and private subjects.
These bodies are required to provide the data and information specified in an annual statistical plan,
which defines surveys, data elaborations, and project studies for a three-year period; a Prime Minister
Decree approves the plan after consideration of the Interministerial Committee for economic planning
(Cipe). The latest Prime Ministerial Decree, which approved the three-year plan for 2014-2016, updated
for 2015-2016, was issued on 5th November 2015 (GU Serie Generale n.258, 5/11/2015).
Further information on the National Statistical System is found in the National Inventory Report and
National Inventory System.
The main Sistan products, which are primarily necessary for the inventory compilation, are:
National Statistical Yearbooks, Monthly Statistical Bulletins, by ISTAT (National Institute of
Statistics);
Annual Report on the Energy and Environment, by ENEA (Agency for New Technologies, Energy
and the Environment);
National Energy Balance (annual), Petrochemical Bulletin (quarterly publication), by MSE
(Ministry of Economic Development);
Transport Statistics Yearbooks, by MINT (Ministry of Transportation);
Annual Statistics on Electrical Energy in Italy, by TERNA (National Independent System
Operator);
Annual Report on Waste, by ISPRA.
National Forestry Inventory, by MIPAAF (Ministry of Agriculture, Food and Forest Policies). The national emission inventory is a Sistan product.
The ‘National Registry for Carbon sinks’, instituted by a Ministerial Decree on 1st April 2008, is part of the
Italian National System. It includes information on lands subject to activities under Article 3.3 and Article
3.4 and related carbon stock changes. In agreement with the Ministerial decree art.4, the Ministry for the
Environment, Land and Sea is responsible for the management of the National Registry for Carbon sinks.
The Decree also provides that ISPRA and the State Forestry Service are involved by the Ministry as
technical scientific support for specific activities as defined in the relevant protocol. ISPRA is responsible
for the preparation of emission and removals estimates for the LULUCF sector and for KP LULUCF
supplementary information under art.7.1 of the Kyoto Protocol.
The National Registry for Carbon sinks is the instrument to estimate, following the COP/MOP decisions
and in accordance with the IPCC guidelines, greenhouse gases emissions by sources and removals by

57
sinks in the land subject to art. 3.3 and art. 3.4 activities and to account for the net removals in order to
allow the Italian Registry to issue the relevant amount of RMUs. Following the Ministerial Decree of
22.01.2013 by the Ministry of Environment, Land and Sea (MATTM), in agreement with the Ministry of
Agriculture, Food and Forest Policies, the Institute for Services on Agricultural and Agro-food Market
(ISMEA21) has been designated for the technical coordination of the section related to cropland and
grazing land management of the National Registry of Carbon Sinks.
3.2.2 Inventory preparation
The Italian emission inventory is based on methodologies consistent with the IPCC guidelines, IPCC Good
Practice Guidance and EMEP/EEA Guidebook (IPCC, 199722; IPCC, 200623; IPCC, 200024; IPCC, 200325;
EMEP/CORINAIR, 200726; EMEP/EEA, 200927).
In addition, national methodologies are developed and supported by background reference materials.
Emission estimates are characterized by quantitative uncertainty figures calculated at a detailed category
level and for the inventory as a total, following the IPCC Good Practice Guidance; uncertainty is also used
in the assessment of key categories.
The inventory preparation process takes place annually; in case of methodological changes or additional
information, emissions are recalculated from 1990 onwards.
Detailed information on emission figures and estimation methodologies, including all the basic data and
emission factors needed to carry out the final estimates, are provided in the National Inventory Report
(NIR) which completes the stage of inventory preparation. The last report is available at the following
web address http://www.isprambiente.gov.it/en/publications/reports?set_language=en.
In addition to the institutions which are part of the National Statistical System, ISPRA has established
fruitful cooperation with a number of other governmental and research institutes as well as industrial
associations, which helps improving some key categories of the inventory. Specifically, these activities
aim at the improvement of provision and collection of basic data and emission factors, through plant-
specific data, and exchange of information on scientific researches and new studies. Moreover, when in
depth, investigation is needed and a high uncertainty in the estimates is present, specific sector analyses
are commissioned to ad hoc research teams or consultants.
ISPRA also coordinates with different national and regional authorities and private institutions for the
cross-checking of parameters and estimates as well as with ad hoc expert panels in order to improve the
accuracy, completeness and transparency of the inventory.
21 ISMEA is a public body, providing support to public and private sector. According to DPR 31 March 2001, n. 200, ISMEA is part of the National Statistical System – SISTAN and of the National Agricultural Information System – SIAN. 22 IPCC, 1997. Revised 1996 IPCC Guidelines for National Greenhouse Gas Emission Inventories. Three volumes: Reference Manual, Reporting Manual, Reporting Guidelines and Workbook. IPCC/OECD/IEA. IPCC WG1 Technical Support Unit, Hadley Centre, Meteorological Centre, Meteorological Office, Bracknell, UK. 23 IPCC, 2006. 2006 IPCC Guidelines for National Greenhouse Gas Inventories, Prepared by the National Greenhouse Gas Inventories Programme, Eggleston H.S., Buendia L., Miwa K., Ngara T. and Tanabe K. (eds). Published: IGES, Japan. 24 IPCC, 2000. Good Practice Guidance and Uncertainty Management in National Greenhouse Gas Inventories. IPCC National Greenhouse Gas Inventories Programme, Technical Support Unit, Hayama, Kanagawa, Japan. 25 IPCC, 2003. Good Practice Guidance for Land Use, Land-Use Change and Forestry. IPCC Technical Support Unit, Kanagawa, Japan. 26 EMEP/CORINAIR, 2007. Atmospheric Emission Inventory Guidebook. Technical report No 16/2007. 27 EMEP/EEA, 2009. Air Pollutant Emission Inventory Guidebook. Technical report No 9/2009.

58
All the reference material, estimates and calculation sheets, as well as the documentation on scientific
papers and the basic data needed for the inventory compilation, are stored and archived at ISPRA.
In Table 3.2 a summary of the activity data and sources used in the inventory compilation is reported.

59
Table 3.2 - Main activity data and sources for the Italian Emission Inventory
SECTOR ACTIVITY DATA SOURCE
1 Energy
1A1 Energy Industries Fuel use Energy Balance - Ministry of Economic Development
Major national electricity producers
European Emissions Trading Scheme
1A2 Manufacturing Industries Fuel use Energy Balance - Ministry of Economic Development
and Construction
Major National Industry Corporation
European Emissions Trading Scheme
1A3 Transport Fuel use Energy Balance - Ministry of Economic Development
Number of vehicles Statistical Yearbooks - National Statistical System
Aircraft landing and take-off Statistical Yearbooks - Ministry of Transportation
cycles and maritime activities
Statistical Yearbooks - Italian Civil Aviation Authority (ENAC)
Maritime and Airport local authorities
1A4 Residential-public-commercial sector
Fuel use Energy Balance - Ministry of Economic Development
1B Fugitive Emissions from Fuel
Amount of fuel treated, Energy Balance - Ministry of Economic Development
stored, distributed Statistical Yearbooks - Ministry of Transportation
Major National Industry Corporation
2 Industrial Processes Production data National Statistical Yearbooks- National Institute of Statistics
International Statistical Yearbooks-UN
European Emissions Trading Scheme
European Pollutant Release and Transfer Register
Sectoral Industrial Associations
3 Solvent and Other Product Use
Amount of solvent use National Environmental Publications - Sectoral Industrial Associations
International Statistical Yearbooks – UN
4 Agriculture Agricultural surfaces Agriculture Statistical Yearbooks - National Institute of Statistics
Production data Sectoral Agriculture Associations
Number of animals
Fertiliser consumption
5 Land Use, Land Use Change and Forestry
Forest area, biomass increment and stock
National Forestry Service (CFS) - National and Regional Forestry Inventory
Statistical Yearbooks - National Institute of Statistics
Biomass burnt Universities and Research Institutes
6 Waste Amount of waste National Waste Cadastre - Institute for Environmental Protection and Research, National Waste Observatory

60
3.2.3 Key categories identification
A key category analysis of the Italian inventory is carried out according to the Approach 1 and Approach
2 described in the 2006 IPCC Guidelines (IPCC, 2006). According to the IPCC guidelines, a key category
is defined as an emission category that has a significant influence on a country’s GHG inventory in terms
of the absolute level and trend in emissions and removals, or both. Key categories are those which, when
summed together in descending order of magnitude, add up to over 95% of the total emissions or 90%
of total uncertainty.
A quantitative analysis is carried out on the Italian greenhouse gas inventory to establish the
uncertainties of different emission categories, the uncertainty of total emissions for the base year and the
latest inventory year, and the so- called trend uncertainty. The uncertainty assessment helps the
identification of the key categories whose effect on the total uncertainty of the inventory is the highest;
furthermore, by means of such an assessment, the improvement measures can be directed so that the
total uncertainty of the inventory can be lowered as effectively as possible.
Quantitative estimates of uncertainty for the Italian GHG inventory are calculated using Approach 1 as
defined in the 2006 IPCC Guidelines, which provides a calculation based on the error propagation
equations. National emissions are disaggregated, as far as possible, into the categories proposed in the
guidelines; other categories are added to reflect specific national circumstances. Both level and trend
analysis are applied to the base year and to the last submitted inventory including and excluding the
LULUCF sector.
In summary, the overall uncertainty in the national total emissions, excluding LULUCF, is equal to 2.6%
for the year 2015; the uncertainty in the trend between the base year and 2015 is equal to 2.0%. When
considering the LULUCF sector in the analysis, the uncertainty in total GWP emissions and removals
increases to 4.8% for the year 2015 and to 3.8% in the trend.
Further information on these figures is reported in the National Inventory Report.
The uncertainty figures are used to carry out a key category analysis on the inventory applying the IPCC
Approach 2 which helps prioritising activities to improve inventory quality and to reduce overall
uncertainty. Key categories are categories that should receive special consideration in terms of
methodological aspects and quality assurance and quality control verification.
For the categories with a high uncertainty, generally, further improvements are planned whenever
sectoral studies can be carried out. For example, last year, the prioritisation of improvements related to
the results of uncertainty analysis led to a revision of the net carbon stock changes and further activities
are planned for the LULUCF sector to improve the accuracy and reduce the overall uncertainty.
Applying category analysis to the 2015 inventory, without considering the LULUCF sector, 46 key
categories were identified in total, both at level and trend. When considering emissions and removals
from the LULUCF sector, the same number of key categories were identified.
Results of the key category assessment for the 2015 inventory are reported in Table 3.3. More details
can be found in the National Inventory Report.

61
Table 3.3 - Key categories by the IPCC Approach 1 and Approach 2 (L=Level, T=Trend). Year
2015
Key categories (excluding the LULUCF sector)
Biological treatment of Solid waste - N2O L2,T2
Chemical industry - CO2 Ammonia production T1
Chemical industry - HFCs Fluorochemical production T2
Chemical industry - N2O Adipic acid production T
Chemical industry - N2O Nitric acid production T
Chemical industry - PFCs Fluorochemical production L,T
Direct N2O Emissions from Managed soils L
Energy industries - CO2 gaseous fuels L,T
Energy industries - CO2 liquid fuels L,T
Energy industries - CO2 solid fuels L,T
Enteric Fermentation - CH4 L,T
Fugitive - CH4 Oil and natural gas - Natural gas L,T
Fugitive - CO2 Oil and natural gas - Oil L1
Fugitive - CO2 Oil and natural gas - venting and flaring T2
Indirect N2O Emissions from Managed soils L
Indirect N2O Emissions from Manure Management L2
Manufacturing industries and construction - CO2 gaseous fuels L,T1
Manufacturing industries and construction - CO2 liquid fuels L,T
Manufacturing industries and construction - CO2 solid fuels L1,T
Manufacturing industries and construction - N2O liquid fuels T2
Manure Management - CH4 L
Metal industry - CO2 Iron and steel production T
Metal industry - PFCs Aluminium production T
Mineral industry - CO2 Cement production L,T
Mineral industry - CO2 Lime production L1
Mineral industry - CO2 Other processes uses of carbonates T
Non-Energy products from Fuels and Solvent Use - CO2 L2,T2
Other sectors - CH4 commercial, residential, agriculture biomass L,T
Other sectors - CO2 commercial, residential, agriculture gaseous fuels L,T
Other sectors - CO2 commercial, residential, agriculture liquid fuels L,T
Other sectors - CO2 commercial, residential, agriculture other fossil
fuels L1,T
Other sectors - CO2 commercial, residential, agriculture solid fuels T1
Other sectors - N2O commercial, residential, agriculture biomass L2,T
Other sectors - N2O commercial, residential, agriculture liquid fuels L2
Product uses as substitutes for ozone depleting substances - HFCs Fire
protection T2
Product uses as substitutes for ozone depleting substances - HFCs
Foam blowing agents L2,T2
Product uses as substitutes for ozone depleting substances - HFCs
Refrigeration and Air conditioning L,T
Rice cultivations - CH4 L1
Solid waste disposal - CH4 L,T
Transport - CH4 Road transportation T2
Transport - CO2 Civil Aviation L1,T1
Transport - CO2 Road transportation L,T
Transport - CO2 Waterborne navigation L1,T1
Transport - N2O Road transportation L2
Wastewater treatment and discharge - CH4 L,T2
Wastewater treatment and discharge - N2O L2,T2
Key categories (including the LULUCF sector)
Biological treatment of Solid waste - N2O T2
Chemical industry- CO2 Ammonia production T1
Chemical industry- N2O Adipic acid production T
Chemical industry- N2O Nitric acid production T1
Chemical industry- PFCs Fluorochemical production L2,T
Cropland Remaining Cropland - CO2 L,T
Direct N2O Emissions from Managed soils L
Energy industries - CO2 gaseous fuels L,T
Energy industries - CO2 liquid fuels L,T
L1 = level key category by Approach 1 T1 = trend key category by Approach 1 L2 = level key category by Approach 2 T2 = trend key category by Approach 2 L = level key category by Approach 1 and Approach 2 T = trend key category by Approach 1 and Approach 2
L1 = level key category by Approach 1 T1 = trend key category by Approach 1 L2 = level key category by Approach 2 T2 = trend key category by Approach 2 L = level key category by Approach 1 and Approach 2 T = trend key category by Approach 1 and Approach 2

62
Key categories (including the LULUCF sector)
Energy industries - CO2 solid fuels L,T
Enteric Fermentation- CH4 L,T
Forest Land remaining Forest Land - CO2 L,T
Fugitive - CH4 Oil and natural gas - Natural gas L,T
Fugitive - CO2 Oil and natural gas - Oil L1
Grassland Remaining Grassland - CH4 T2
Grassland Remaining Grassland - CO2 L2,T
Harvest Wood Products - CO2 T
Indirect N2O Emissions from Managed soils L
Land Converted to Cropland - CO2 T2
Land Converted to Forest Land - CO2 L,T
Land Converted to Grassland - CO2 L,T
Land Converted to Settlements - CO2 L,T
Manufacturing industries and construction - CO2 gaseous fuels L,T1
Manufacturing industries and construction - CO2 liquid fuels L,T
Manufacturing industries and construction - CO2 solid fuels L1,T
Manure Management - CH4 L
Metal industry - CO2 Iron and steel production T1
Metal industry - PFCs Aluminium production T
Mineral industry - CO2 Cement production L,T
Mineral industry - CO2 Lime production L1
Mineral industry - CO2 Other processes uses of carbonates T1
Non-Energy products from Fuels and Solvent Use - CO2 L2
Other sectors - CH4 commercial, residential, agriculture biomass L,T
Other sectors - CO2 commercial, residential, agriculture gaseous fuels L,T
Other sectors - CO2 commercial, residential, agriculture liquid fuels L,T
Other sectors - CO2 commercial, residential, agriculture other fossil
fuels L1,T1
Other sectors - N2O commercial, residential, agriculture biomass L2,T
Product uses as substitutes for ozone depleting substances - HFCs
Foam blowing agents T
Product uses as substitutes for ozone depleting substances - HFCs
Refrigeration and Air conditioning L,T
Rice cultivations - CH4 L1
Solid waste disposal - CH4 L
Transport - CO2 Civil Aviation L1,T1
Transport - CO2 Road transportation L,T
Transport - CO2 Waterborne navigation L1
Wastewater treatment and discharge - CH4 L
Wastewater treatment and discharge - N2O L2,T2
3.2.4 Recalculations
The entire time series from 1990 is checked and revised during the annual compilation of the national
inventory.
Recalculations are made due to changes in the methodologies used to carry out emission estimates,
different allocation of emissions compared to previous submissions, error corrections and the availability
of new information. Recommendations from the UNFCCC reviews and other national and international
processes are also followed. Explanatory information on the annual major recalculations is reported in the
annual National Inventory Report.
Improvements in the calculation of emission estimates may lead to a recalculation of the entire time
series of the national inventory. For example in the 2015 submission, considering the total GHG
emissions without LULUCF, emission levels of the base year show a decrease in comparison with previous
annual inventory submission (-0.4%) whereas emissions for the year 2014 showed an increase equal to
1.1%. Considering the national total including the LULUCF sector, the base year has increased by 0.2%,
and the 2014 emission levels decreased by 0.8%.

63
In the last years, major changes regarded the energy sector, due to the update of CO2 emission factors
for different fuel on account of information from operators under the European emissions trading scheme,
in particular coal, derived gases and natural gas. In the industrial and in the agriculture sectors, minor
recalculations occurred on account of the update of different activity data and parameters. The LULUCF
sector was also affected by several updates in methodology to calculate emissions and removals, in
parameters and coefficients used to estimate carbon stock changes in the required pools. In the waste
sector, the main revision regarded the update of waste incineration emissions based on data collected at
plant level.
3.2.5 QA/QC plan
ISPRA has elaborated a QA/QC manual for the national emission inventory that describes QA/QC
procedures and verification activities to be followed during the inventory compilation (ISPRA, 2013)28.
Furthermore, specific QA/QC procedures and different verification activities implemented thoroughly the
current inventory compilation, as part of the estimation process, are figured out in the annual QA/QC
plan (ISPRA, 2017)29. These documents are available at http://www.sinanet.isprambiente.it/it/sia-
ispra/serie-storiche-emissioni.
Quality control checks and quality assurance procedures, together with some verification activities, are
applied to the national inventory both as a whole and at sectoral level. Future planned improvements are
prepared for each sector by the relevant inventory compiler; each expert identifies areas for sectoral
improvement based on his own knowledge and in response to inventory UNFCCC reviews and other kind
of processes.
Feedbacks for the Italian inventory are obtained by communicating data to various institutions and/or at
local level. For instance, the communication of the inventory to the European Community results in a pre-
check of the GHG values before its submission to the UNFCCC, allowing possible relevant inconsistencies
to be highlighted. Emission figures are also subjected to a process of re-examination once the inventory,
the inventory related publications and the national inventory reports are posted on a website, specifically
at www.isprambiente.gov.it.
As for official independent reviews, an agreement to conduct a bilateral review between Italy and Spain
was established in 2012, with a focus on the revision of the GHG inventories of both Parties. Two in-
country visits were already held; the Italian team revised part of the energy sector of Spain, specifically
the categories public power plants, petroleum-refining plants, road transport and off-road, whereas the
Spanish team revised the Industrial processes and solvent and other product use, and the LULUCF
sectors of Italy. Aim of the review was to carry out a general quality assurance analysis of the inventories
in terms of the methodologies, the EFs and the references used, as well as analysing critical cross cutting
issues such as the details of the national energy balances and comparison with international data
(Eurostat and IEA), use of plant-specific information.
Additionally, the Aether consultants have undertaken an official independent review of the entire Italian
greenhouse gas inventory. Main findings and recommendations are reported in a final document, and
28 ISPRA, 2013. Quality Assurance/Quality Control plan for the Italian Emission Inventory. Procedures Manual. October 2013. 29 ISPRA, 2017. Quality Assurance/Quality Control plan for the Italian Emission Inventory. Available on line at: http://www.sinanet.isprambiente.it/it/sia-ispra/serie-storiche-emissioni

64
regard the transparency in the NIR, the improvement of QA/QC documentation and some pending issues
in the LULUCF sector. These suggestions have been considered to improve future submissions.
In 2013, ISPRA finalised the provincial inventory at local scale for the year 2010 and updated figures for
1990, 1995, 2000 and 2005 in the framework of the Protocol on Long-term Financing of the Cooperative
Programme for Monitoring and Evaluation of the Long-range Transmission of Air Pollutants in Europe
(EMEP) under the Convention on Long-range Transboundary Air Pollution (CLTRAP). Specifically, ISPRA
has applied a top-down approach to estimate emissions at provincial areas based on proxy variables.
Regional and local environmental agencies and authorities checked out the results; data are available at
the following ISPRA web address: http://www.sinanet.isprambiente.it/it/sia-ispra/inventaria. The
provincial inventory for the year 2015 is under finalization.
The inventory is also presented to a Technical Committee on Emissions (CTE), coordinated by the
Ministry for the Environment, Land and Sea, where all the relevant Ministries and local authorities are
represented; within this context, emission figures and results are shared and discussed. Especially in the
last years, there has been an intensification of the activities in order to establish national policies and
measures to meet the 2020 EU target and implement national programmes for the post-Kyoto period. In
this regard, and as a basis for emission scenarios, the importance of the emission inventory is primary.
Moreover, from 2011, a report concerning the state of implementation of commitments to reduce
greenhouse gases emissions, and describing emission trend and projections, is prepared by IMELS in
consultation with other relevant Ministers. The report is annexed to the economy and financial document
(DEF) to be annually approved by the Government.
Expert peer-reviews of the national inventory also occur annually within the UNFCCC process, and their
results and suggestions can provide valuable feedback on areas where the inventory should be improved.
Moreover, at European level, experts from various Member States for critical sectoral categories
undertake voluntary reviews of the European inventory.
Comparisons between national activity data and data from international databases are usually carried out
in order to identify and explain the main differences.
The quality of the inventory has also been improved through the organization and participation in sector-
specific workshops.
A specific procedure undertaken to improve the inventory was the establishment of national expert
panels (in particular on road transport, land use change and forestry and energy sectors) which involve,
on a voluntary basis, different institutions, local agencies and industrial associations cooperating to
improve activity data and emission factors accuracy.
In addition to these expert panels, ISPRA participates in technical working groups within the National
Statistical System. These groups, named “Circoli di qualità”, coordinated by the National Institute of
Statistics, are constituted by both producers and users of statistical information with the aim of improving
and monitoring statistical information in specific sectors such as transport, industry, agriculture, forest
and fishing. As reported in previous sections, these activities improve the quality and details of basic
data, as well as enable a more organized and timely communication.
A proper archiving and reporting of the documentation related to the inventory compilation process is
also part of the national QA/QC programme. All the material and documents used for the inventory
preparation are stored at the Institute for Environmental Protection and Research.

65
Information relating to the planning, preparation, and management of inventory activities are
documented and archived. A master documentation catalogue is generated for each inventory year and it
is possible to track changes in data and methodologies over time. Specifically, the documentation
includes:
electronic copies of each of the final inventory report and drafts, electronic copies of the final CRF
tables and drafts;
electronic copies of all the final, linked source category spreadsheets for the inventory estimates
(including all spreadsheets that feed the emission spreadsheets);
results of the reviews and, in general, all documentation related to the corresponding inventory
year submission.
After each reporting cycle, all database files, spreadsheets and electronic documents are archived as
‘read-only’ mode.
A ‘reference’ database is also compiled every year to increase the transparency of the inventory. This
database consists of a number of records that references all documentation used during the inventory
compilation, for each sector and submission year, the link to the electronically available documents and
the place where they are stored as well as internal documentation on QA/QC procedures.
3.3 National registry
In March 2006, Italy started operating a national registry under Article 19 of Directive 2003/87/EC of the
European Commission establishing the European Emission Trading Scheme (EU ETS). This registry is
conceived for the administration of emissions allowances allocated to operators participating to the EU
ETS and it is developed according to the UN Data Exchange Standards document. Therefore, in October
2008, after an initialization process and a go-live phase with the UNFCCC, the registry established under
Directive 2003/87/CE also became part of the Kyoto system of registries, ensuring the precise tracking of
holdings, issuances, transfers, cancellations and retirements of allowances and Kyoto units.
In 2009, the European Commission adopted Directive 2009/29/EC, providing for the centralization of the
EU ETS operations into a single European Union registry operated by the European Commission as well as
for the inclusion of the aviation sector. At the same time, and with a view to increasing efficiency in the
operations of their respective national registries, the EU Member States who are also Parties to the Kyoto
Protocol plus Iceland, Liechtenstein and Norway decided to operate their national registries in a
consolidated manner in accordance with all relevant decisions applicable to the establishment of Party
registries - in particular Decision 13/CMP.1 and Decision 24/CP.8.
The consolidated platform which implements the national registries in a consolidated manner (including
the registry of the EU) is called the “Union registry” and was developed together with the new EU registry
on the basis of the following modalities:
1. Each Party retains its organization designated as its registry administrator to maintain the national
registry of that Party and remains responsible for all the obligations of Parties that are to be fulfilled
through registries;
2. Each Kyoto unit issued by the Parties in such a consolidated system is issued by one of the
constituent Parties and continues to carry the Party of origin identifier in its unique serial number;

66
3. Each Party retains its own set of national accounts as required by paragraph 21 of the Annex to
Decision 15/CMP.1. Each account within a national registry keeps a unique account number
comprising the identifier of the Party and a unique number within the Party where the account is
maintained;
4. Kyoto transactions continue to be forwarded to and checked by the UNFCCC Independent Transaction
Log (ITL), which remains responsible for verifying the accuracy and validity of those transactions;
5. The transaction log and registries continue to reconcile their data with each other in order to ensure
data consistency and facilitate the automated checks of the ITL;
6. The requirements of paragraphs 44 to 48 of the Annex to Decision 13/CMP.1 concerning making non-
confidential information accessible to the public is fulfilled by each Party through a publicly available
web page hosted by the Union registry;
7. All registries reside on a consolidated IT platform sharing the same infrastructure technologies. The
chosen architecture implements modalities to ensure that the consolidated national registries are
uniquely identifiable, protected and distinguishable from each other, notably:
With regards to the data exchange, each national registry connects to the ITL directly and
establishes a secure communication link through a consolidated communication channel
(VPN tunnel);
The ITL remains responsible for authenticating the national registries and takes the full
and final record of all transactions involving Kyoto units and other administrative
processes such that those actions cannot be disputed or repudiated;
With regards to the data storage, the consolidated platform continues to guarantee that
data is kept confidential and protected against unauthorized manipulation;
The data storage architecture also ensures that the data pertaining to a national registry
are distinguishable and uniquely identifiable from the data pertaining to other
consolidated national registries;
In addition, each consolidated national registry keeps a distinct user access entry point
(URL) and a distinct set of authorisation and configuration rules.
Following the successful implementation of the Union registry, the 28 national registries concerned were
re-certified in June 2012 and switched over to their new national registry on 20 June 2012. Croatia was
migrated and consolidated as of 1 March 2013. During the go-live process, all relevant transaction and
holdings data were migrated to the Union registry platform and the individual connections to and from
the ITL were re-established for each Party.
A complete description of the consolidated registry was provided in the common readiness documentation
and specific readiness documentation for the national registry of the EU and all consolidating national
registries. This description includes:
• Readiness questionnaire
• Application logging
• Change management procedure
• Disaster recovery
• Manual Intervention
• Operational Plan

67
• Roles and responsibilities
• Security Plan
• Time Validation Plan
• Version change Management
The documents above are annexed to the 2013 National Inventory Report submission.
A new central service desk was also set up to support the registry administrators of the consolidated
system. The new service desk acts as second level of support to the local support provided by the Parties.
It also plays a key communication role with the ITL Service Desk with regards notably to connectivity or
reconciliation issues.
3.3.1 Description of how the Italian registry performs functions defined in the annexes to
decisions 13/CMP.1 and 5/CMP.1, and conformity with the requirements of the
technical standards for data exchange (DES)
a) The name and contact information of the registry administrator designated by the Party to
maintain the national registry
The Italian Registry is administrated by ISPRA (national Institute for Environmental Protection
and Research) under the supervision of the national Competent Authority for the
implementation of the European directive 2003/87/EC, jointly established by the Ministry for
Environment, Land and Sea and the Ministry for Economic Development. ISPRA, as Registry
Administrator, is responsible for the management and functioning of the Registry, including
Kyoto protocol obligations.
The contact person is: Mr Riccardo Liburdi
address: Via Vitaliano Brancati 48 – 00144 Rome – Italy
telephone: +39 0650072544
e-mail: [email protected]
No change of name or contact occurred since the last National Communication report.
b) The names of the other Parties with which the Party cooperates by maintaining their national
registries in a consolidated system
Italy maintains its national registry in a consolidated manner with all the Parties that are also EU
Member States and with the European Union, sharing the same platform hosted and facilitated by
the European Commission.
No change of cooperation arrangement occurred since the last National Communication report.
c) A description of the database structure and capacity of the national registry
The complete description of the consolidated registry was provided in the common readiness
documentation and specific readiness documentation for the national registry of EU and all
consolidating national registries.

68
During certification, the consolidated registry was notably subject to connectivity testing,
connectivity reliability testing, distinctness testing and interoperability testing to demonstrate
capacity and conformance to the Data Exchange Standard (DES). All tests were executed
successfully and lead to successful certification on 1 June 2012.
In 2016, new tables were added to the database for the implementation of the CP2
functionalities.
Versions of the Union registry released after 6.1.6 (the production version at the time of the last
NC submission) introduced other minor changes in the structure of the database. These changes
were limited and only affected EU ETS functionality.
No change was required to the database and application backup plan or to the disaster recovery
plan. Furthermore, no change to the capacity of the national registry occurred since the last
National Communication report.
The database model, including the new tables, has been provided along with NIR submission for
year 2016.
d) A description of how the national registry conforms to the technical standards for data exchange
between registry systems for the purpose of ensuring the accurate, transparent and efficient
exchange of data between national registries, the clean development mechanism registry and the
transaction log (decision 19/CP.7, par. 1)
The overall change to a Consolidated System of EU Registries triggered changes to the registry
software and required new conformance testing. The complete description of the consolidated
registry was provided in the common readiness documentation and specific readiness
documentation for the national registry of EU and all consolidating national registries.
During certification, the consolidated registry was notably subject to connectivity testing,
connectivity reliability testing, distinctness testing and interoperability testing to demonstrate
capacity and conformance to the Data Exchange Standard (DES). All tests were executed
successfully and lead to successful certification on 1 June 2012.
Each release of the registry is subject to both regression testing and tests related to new
functionality. These tests also include thorough testing against the DES and were successfully
carried out prior to each release of a new version in Production. Annex H testing is carried out
every year. No other change in the registry's conformance to the technical standards occurred
since the last National Communication report.
The most recent test results have been provided along with NIR submission for year 2016.
e) A description of the procedures employed in the national registry to minimize discrepancies in the
issuance, transfer, acquisition, cancellation and retirement of ERUs, CERs, tCERs, lCERs, AAUs
and/or RMUs, and replacement of tCERS and lCERs, and of the steps taken to terminate
transactions where a discrepancy is notified and to correct problems in the event of a failure to
terminate the transactions
The overall change to a Consolidated System of EU Registries also triggered changes to
discrepancies procedures, as reflected in the updated manual intervention document and the

69
operational plan. The complete description of the consolidated registry was provided in the
common readiness documentation and specific readiness documentation for the national registry
of EU and all consolidating national registries.
No change of discrepancies procedures occurred since the last National Communication report.
f) An overview of security measures employed in the national registry to prevent unauthorized
manipulations and to prevent operator error and of how these measures are kept up to date
The overall change to a Consolidated System of EU Registries also triggered changes to security,
as reflected in the updated security plan. The complete description of the consolidated registry
was provided in the common readiness documentation and specific readiness documentation for
the national registry of EU and all consolidating national registries.
In 2016, the mandatory use of hard tokens for authentication and signature was introduced for
registry administrators. No other change regarding security occurred since the last National
Communication report.
g) A list of the information publicly accessible by means of the user interface to the national registry
Publicly available information is provided via the Union registry at the national homepage
https://ets-registry.webgate.ec.europa.eu/euregistry/IT/public/reports/publicReports.xhtml
All non-confidential information required by Decision 13/CMP.1 annex II.E paragraphs 44-48, is
publicly accessible with the following exceptions:
paragraph 45(d)(e): account number, representative identifier name and contact
information is deemed as confidential according to Annex III and VIII (Table III-I and
VIII-I) of Commission Regulation (EU) No 389/2013;
paragraph 46: no Article 6 (Joint Implementation) project is reported as conversion to
an ERU under an Article 6 project did not occur in the specified period;
paragraph 47(a)(d)(f): holding and transaction information is provided on an account
type level, due to more detailed information being declared confidential by article 110 of
Commission Regulation (EU) No 389/2013.
No change to list of publicly available information occurred since the last National Communication
report.
h) The Internet address of the interface to its national registry
The Italian registry can be accessed at the following URL:
https://ets-registry.webgate.ec.europa.eu/euregistry/IT/index.xhtml
No change of the registry internet address occurred since the last National Communication report.
i) A description of measures taken to safeguard, maintain and recover data in order to ensure the
integrity of data storage and the recovery of registry services in the event of a disaster

70
The overall change to a Consolidated System of EU Registries also triggered changes to data
integrity measures, as reflected in the updated disaster recovery plan. The complete description
of the consolidated registry was provided in the common readiness documentation and specific
readiness documentation for the national registry of EU and all consolidating national registries.
No change of data integrity measures occurred since the last National Communication report.
j) The results of any test procedures that might be available or developed with the aim of testing
the performance, procedures and security measures of the national registry undertaken pursuant
to the provisions of decision 19/CP.7 relating to the technical standards for data exchange
between registry systems
The consolidated EU system of registries successfully completed a full certification procedure in
June 2012. Notably, this procedure includes connectivity testing, connectivity reliability testing,
distinctness testing and interoperability testing to demonstrate capacity and conformance to the
Data Exchange Standard (DES). This included a full Annex H test. All tests were executed
successfully and led to successful certification on 1 June2012.
On 2 October 2012, a new software release (called V4) including functionalities enabling the
auctioning of phase 3 and aviation allowances, a new EU ETS account type (trading account) and
a trusted account list went into Production. The trusted account list adds to the set of security
measures available in the Union Registry. This measure prevents any transfer from a holding
account to an account that is not trusted. Version 4 was only a minor iteration and changes were
limited to EU ETS functionality and had no impact on Kyoto Protocol functions in the registry.
However, each new release of the registry is subject to both regression testing and tests related
to new functionalities. These tests include thorough testing against the DES and are carried out
prior to the relevant major release of the version to Production. The site acceptance tests are
carried out by quality assurance consultants on behalf of and assisted by the European
Commission. Annex H testing is carried out on an annual basis.
The most recent test results have been provided along with NIR submission for year 2016.

71
4 POLICIES AND MEASURES30
4.1 Policy making process
In the most recent years, actions taken by Italy to mitigate climate change have been driven by the
commitments undertaken under:
- the Kyoto Protocol target and its amendment (‘Doha amendment’);
- the so called “EU Climate and Energy Package” for the period 2013-2020;
- the EU INDC and the so called “2030 EU Climate and Energy Framework” for the period 2021-2030.
4.1.1 The Kyoto Protocol and its amendment (‘Doha amendment’)
Under the Kyoto Protocol, the EU-1531 has agreed to reduce its greenhouse gas (GHG) emissions by 8%
in the period 2008–2012 (commitment period) compared to base year levels and and to distribute the
reduction effort between the Member States through the so called “EU burden sharing agreement”.
In the framework of the EU Burden Sharing Agreement, Italy has committed to reduce its GHG emissions
by 6.5% below base-year levels (1990) over the first commitment period, 2008-2012. After the review of
the initial report of Italy under the Kyoto Protocol (FCCC/IRR/2007/ITA) the Kyoto objective has been
established as 483.26 MtCO2/year for each year of the “commitment period”.
At the end of the first commitment period, Italy had reduced its GHG emissions by 4.6% below base-year
levels. During the true-up period, for fulfilling commitments under Article 3.1 of the Kyoto Protocol32,
Italy undertook adequate actions to achieve compliance.
Moreover, to ensure reductions after 2012, the EU and its Member States have committed to the ‘Doha
Amendment to the Kyoto Protocol’, adopted on 8 December 2012. In Particular, the EU and its Member
States have established to reduce their collective emissions to 20% below their levels in 1990 during the
commitment period 2013-2020, as reflected in the Doha Amendment.. The target is to be fulfilled jointly
with Iceland33.
4.1.2 The “Climate and Energy Package” and the Effort Sharing Decision n. 406/2009/EC
The 8th and 9th March 2007 conclusion of the European Council named “Integrated Energy and Climate
Change Package” (IECCP) committed the European Member States to achieve by 2020 the following
targets:
• 20% reduction of EU GHG emissions compared to 1990. This reduction could be raised to 30%
with a global agreement for the period post 2012.
• 20% reduction in energy use to be achieved by improving energy efficiency.
• 20% use of renewable energy
30 Lead author: Monica Pantaleoni (ISPRA). Contributing authors: Riccardo De Lauretis (ISPRA), Eleonora Di Cristofaro (ISPRA), Domenico Gaudioso (ISPRA), Barbara Gonella (ISPRA), Marina Colaiezzi (ISPRA) Ernesto Taurino (ISPRA), Marina Vitullo (ISPRA), Federico Brocchieri (ISPRA). 31 Until 1 May 2004 the Member States of the EU were 15 (Belgium, Denmark, Germany, Greece, Spain, France, Ireland, Italy, Luxembourg, Netherlands, Austria, Portugal, Finland, Sweden, United Kingdom). After 1 May 2004 thirteen new Member States joined the Union (Bulgaria, Croatia, Czech Republic, Cyprus, Estonia, Hungary, Latvia, Lithuania, Malta, Poland, Romania, Slovakia and Slovenia). 32 http://unfccc.int/kyoto_protocol/true-up_process/items/9023.php 33 NIR 2017

72
• 10% use of biofuels in the transport sector.
This comprehensive set of legislation acts, also known as the ‘Climate and Energy package’ or “20/20/20
package”, was agreed at EU level to reach those objectives and is being implemented. The most relevant
European legislation acts are:
• Directive 2009/28/EC of the European Parliament and of the Council of 23 April 2009 on the
promotion of the use of energy from renewable sources and amending and subsequently
repealing directive 2001/77/EC and 2003/30/EC: this Directive also subdivides the 20%
renewable target between the EU Member States. According to that, by 2020 the 17% of the
national final energy consumption of Italy should come from renewable sources.
• Directive 2009/29/EC of the European Parliament and of the Council of 23 April 2009 amending
Directive 2003/87/EC so as to improve and extend the greenhouse gas emission allowance
trading scheme of the community: this Directive revises and strengthens the EU Emissions
Trading Scheme (EU ETS) already in place since 2005, which commits to an overall EU reduction
of 21% of emissions compared to 2005 levels from the industrial sector.
• Decision n. 406/2009/EC of the European Parliament and of the Council of 23 April 2009 on the
effort of Member States to reduce their greenhouse gas emissions to meet the Community’s
greenhouse gas emission reduction commitments up to 2020 (ESD): by 2020 Italy shall reduce
the GHG emissions by 13% compared to 2005 levels, in all the sectors not covered by the EU
ETS, such as transport, civil, agriculture and waste sectors.
• Directive 2012/27/EC of the European Parliament and of the Council of 25 October 2012 on
energy efficiency, amending Directives 2009/125/EC and 2010/30/EU and repealing Directives
2004/8/EC and 2006/32/EC: this Directive establishes a common framework of measures for the
promotion of energy efficiency within the Union in order to ensure the achievement of the Union’s
2020 20 % headline target on energy efficiency and to pave the way for further energy efficiency
improvements beyond that date.
To monitor progress and assess compliance towards the targets set by Directive 2009/29/CE and by
Decision 406/2009/CE, starting from year 2013 national emissions and projections should be divided in
two main sectors: EU ETS and all other sectors (non-ETS).
4.1.3 The European Union Emission Trading Scheme - ETS sector
Directive 2003/87/EC established an Emissions Trading Scheme (EU-ETS), as the instrument to fulfil the
EU reduction target under the Kyoto protocol for what concerns the industrial sector.
Its application started with a first ‘pilot’ phase as of 2005 to 2007, unlinked to the reaching of the Kyoto
commitment, and then applied from 2008-2012 in order to contribute to the reaching of the Kyoto target.
For what concerns the Kyoto period 2008-2012, Table 4.1 shows verified emissions submitted by ETS
operators by sector in the second trading period (2008-2012) and the difference between the verified
emissions and ex ante allocation.
Table 4.1 - Emissions and allocations for ETS sectors for the years covered by Kyoto Protocol
2008 2009 2010 2011 2012
Mt CO2 Mt CO2 Mt CO2 Mt CO2 Mt CO2
Verified EU ETS operators emissions 220.7 184.9 191.5 190.0 179.1
Allocation (*) 201.6 201.6 201.6 201.6 201.6

73
2008 2009 2010 2011 2012
Difference between verified emissions and allocation 19.1 -16.7 -10.1 -11.6 -22.5
Allowed use of CERs/ERUs 30.2 30.2 30.2 30.2 30.2
(*) Note: the table does not report the annual allocation change from year to year but the average annual cap
This directive has been amended by the Directive 2008/101/CE to include the aviation sector and by
Directive 2009/29/CE, which introduces substantive changes in the scheme for stationary installations
during the period 2013-2020. One of the most important changes relates to the EU wide cap setting
procedure, as the new system is no longer based on national-cap setting but on a single EU-wide
declining cap.
The EU-wide cap is determined according to a linear reduction path arriving at a reduction of 21% below
reported 2005 emissions in 2020. The starting point of such path is the mid-point of the 2008-12 period,
while the starting level is the average annual total quantity of allowances issued by Member States
pursuant to Commission Decisions on Member States’ national allocation plans for the period 2008-12.
This path implies a decrease of the EU wide cap of 1.74% annually. Among the other significant changes
it has to be underlined:
auctioning has become the main allocation method and it’s applied as the only allocation method
for the power sector,
Manufacturing sectors are allocated via benchmarks set as the average EU 10% best CO2
performance per unit of production taking the years 2007-2008 as a basis for data.
the commitment and trading period is extended from 5 to 8 years in order to provide for more
certainty to industry,
Other activities (such as the production of nitric, adipic, glyoxal and glyoxylic acid, the production
of ammonia, aluminium) and greenhouse gases (nitrous oxide and perfluorocarbons) are included
in the scheme.
National and international aviation, only including flights between airports located in the European
Economic Area (EEA), has been included in ETS starting from 2012.
For the third trading period (2013-2020) EU ETS sectors, covering almost 45% of EU GHG emissions34,
will need to reduce emissions by 43% compared to 2005 levels35 but no disaggregation of the objective
at Member State level has been foreseen and an assessment of emissions of operators subject to ETS at
national level is therefore only possible ex post.
4.1.4 Sectors under the Effort Sharing Decision (ESD)
As mentioned above, under the Effort Sharing Decision (Decision No 406/2009/EC) Italy has to reduce
GHG emissions by 13% compared to 2005 levels. On 26th March 2013, the European Commission
adopted a Decision (2013/162/EU) on determining Member States’ annual emissions allocation for the
years from 2013 to 2020. Italy’s targets are reported in Table 4.2. In the table, two series of figures are
reported as ESD targets for the period 2017-2020 have been revised in 2017 by Decision No 1471/2017
EU.
34 https://ec.europa.eu/clima/sites/clima/files/factsheet_ets_en.pdf 35 http://www.consilium.europa.eu/it/policies/climate-change/reform-eu-ets/
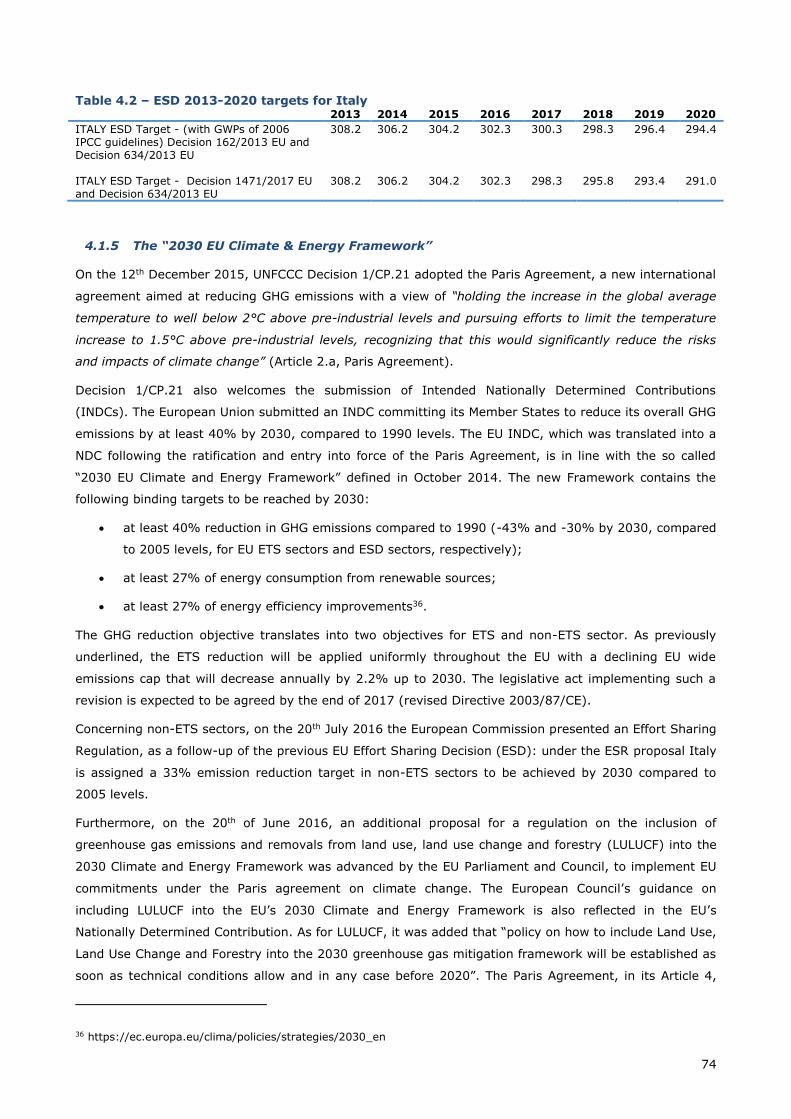
74
Table 4.2 – ESD 2013-2020 targets for Italy 2013 2014 2015 2016 2017 2018 2019 2020
ITALY ESD Target - (with GWPs of 2006 IPCC guidelines) Decision 162/2013 EU and Decision 634/2013 EU
308.2 306.2 304.2 302.3 300.3 298.3 296.4 294.4
ITALY ESD Target - Decision 1471/2017 EU and Decision 634/2013 EU
308.2 306.2 304.2 302.3 298.3 295.8 293.4 291.0
4.1.5 The “2030 EU Climate & Energy Framework”
On the 12th December 2015, UNFCCC Decision 1/CP.21 adopted the Paris Agreement, a new international
agreement aimed at reducing GHG emissions with a view of “holding the increase in the global average
temperature to well below 2°C above pre-industrial levels and pursuing efforts to limit the temperature
increase to 1.5°C above pre-industrial levels, recognizing that this would significantly reduce the risks
and impacts of climate change” (Article 2.a, Paris Agreement).
Decision 1/CP.21 also welcomes the submission of Intended Nationally Determined Contributions
(INDCs). The European Union submitted an INDC committing its Member States to reduce its overall GHG
emissions by at least 40% by 2030, compared to 1990 levels. The EU INDC, which was translated into a
NDC following the ratification and entry into force of the Paris Agreement, is in line with the so called
“2030 EU Climate and Energy Framework” defined in October 2014. The new Framework contains the
following binding targets to be reached by 2030:
at least 40% reduction in GHG emissions compared to 1990 (-43% and -30% by 2030, compared
to 2005 levels, for EU ETS sectors and ESD sectors, respectively);
at least 27% of energy consumption from renewable sources;
at least 27% of energy efficiency improvements36.
The GHG reduction objective translates into two objectives for ETS and non-ETS sector. As previously
underlined, the ETS reduction will be applied uniformly throughout the EU with a declining EU wide
emissions cap that will decrease annually by 2.2% up to 2030. The legislative act implementing such a
revision is expected to be agreed by the end of 2017 (revised Directive 2003/87/CE).
Concerning non-ETS sectors, on the 20th July 2016 the European Commission presented an Effort Sharing
Regulation, as a follow-up of the previous EU Effort Sharing Decision (ESD): under the ESR proposal Italy
is assigned a 33% emission reduction target in non-ETS sectors to be achieved by 2030 compared to
2005 levels.
Furthermore, on the 20th of June 2016, an additional proposal for a regulation on the inclusion of
greenhouse gas emissions and removals from land use, land use change and forestry (LULUCF) into the
2030 Climate and Energy Framework was advanced by the EU Parliament and Council, to implement EU
commitments under the Paris agreement on climate change. The European Council’s guidance on
including LULUCF into the EU’s 2030 Climate and Energy Framework is also reflected in the EU’s
Nationally Determined Contribution. As for LULUCF, it was added that “policy on how to include Land Use,
Land Use Change and Forestry into the 2030 greenhouse gas mitigation framework will be established as
soon as technical conditions allow and in any case before 2020”. The Paris Agreement, in its Article 4,
36 https://ec.europa.eu/clima/policies/strategies/2030_en

75
indicates that the contribution from land use and forests will be critical in reaching “a balance between
anthropogenic emissions by sources and removals by sinks of greenhouse gases”.
As pointed out in this proposal, the implementation of the current LULUCF Decision (529/2013/EU) is
under way and will deliver improved accounting systems by 2020. However, without a legal framework
consolidating this implementation and defining the applicable rules for the period post-2020, the way in
which LULUCF would be included in the overall framework could be heterogeneous across the EU.
Accordingly, the objective of this proposal is to determine how the LULUCF sector will be included into the
EU climate policy framework, as of 202137.
The two legislative acts deriving from the proposals on effort sharing and LULUCF are now in the last
phases of negotiations between the EU institutions.
4.1.6 National decision-making process related to climate change policies
The Ministry of the Environment, Land and Sea (IMELS) is responsible for elaborating the national plan
for GHG emissions reduction to be proposed for adoption to the Inter-Ministerial Committee for Economic
Planning - CIPE (see paragraph 2.2.1).
The financial support and legislative instruments to implement the plan are identified through the
Financial Law and are allocated to the central and local bodies on the basis of the respective
competences.
Law N. 79/2016, the Ratification of the Doha amendment to the Kyoto Protocol”, establishes under its
article 5 and according to article 12 of 525/2013/EU (the Monitoring Mechanism Regulation), the National
system for policies, measures and emissions projections. The National Institute for Environmental
Protection and Research (ISPRA) is responsible of the system and, in cooperation with IMELS, collects all
the information and data from the competent Ministries. Article 1 of the Decree implementing law N. 79
(9th December 2016), reports the list of information and data that are to be sent by the competent
ministries to IMELS and ISPRA and also the timing for providing such information.
4.1.7 Monitoring and evaluation of progress with climate policies and measures
According with law No 79 (article 6), IMELS ensures the collection of information related to GHG
emissions and other information concerning climate changes. IMELS also updates the document on the
state of implementation of commitments to reduce GHG emissions, through an annex to the Financial
Law.
The monitoring and evaluation of progress on policies and measures to cut greenhouse emissions are also
reported in the documents submitted, every two years, by Member States to the European Commission
under the Monitoring Mechanism Regulation38.
Moreover, the Manager for Energy Services (GSE) sends to the European Commission the “Progress
Report Under Art. 22 of the 2009/28/EU Directive” every two years, where an ex post assessments of the
most relevant national measures related to renewable energy use and energy efficiency are reported. The
37 http://eur-lex.europa.eu/legal-content/EN/TXT/?uri=CELEX:52016PC0479 38 http://eur-lex.europa.eu/legal-content/EN/TXT/?uri=CELEX:32013R0525

76
document is available at the following address : https://ec.europa.eu/energy/en/topics/renewable-
energy/progress-reports39.
4.2 Overview on policies and measures
This section gives a description of the main policies and measures that have had or are expected to have
a direct or indirect effect on the reduction of greenhouse gas emissions in Italy.
The potential emissions reduction has been assessed up to 2030. The policies and measures hereinafter
described are divided into two types:
Measures implemented up to the end of 2014 and minimal efficiency standards for buildings adopted
in 2015 ;
Measures planned at 31st May 2017. The measures envisaged as planned are consistent with the ones
reported in the 2017 National Energy Strategy (SEN 201740), but the assessment of impacts in terms of
expected reductions is not yet available for all policies and measures. For this reason and as further
described in Chapter 5, a With Additional Measures (WAM) scenario has not been performed in this
Communication.
4.3 Cross Cutting policies
4.3.1 National Action Plan for Renewable Energy 2010 and Legislative decree 28/2011
In January 2007, the Commission published a Renewable Energy Roadmap outlining a long-term strategy
and in 2009 the EU adopted Directive 2009/28/EC aiming at increasing the average renewable share
across the EU to 20% by 2020. Such Directive sets mandatory national targets for the overall share of
energy from renewable sources in gross final consumption of energy: the national target for Italy is
17%.. EU countries are free to decide their own preferred 'mix' of renewable sources, allowing them to
take account of their different potentials. They had to present National Action Plans (NAPs) based on
indicative trajectories to the European Commission by 30 June 2010, followed by progress reports to be
submitted every two years. The objective expressed in the form of a share of energy from renewable
sources relative to total consumption in transport, electricity and heating and cooling in 2020 also takes
into account the effects of other policy measures addressing energy efficiency.
The Directive 2009/28/EU has been transposed by the Legislative Decree N. 28 of 3rd March 2011. The
decree defines the mechanisms, the incentives and the institutional, financial and legal tools necessary to
achieve the 2020 targets regarding the renewable energy use. The decree also provides for a substantial
reorganization of existing incentive schemes, in particular in the field of green certificates and white
certificates system, both described below.
39 In the 2015 submission, please find the folder “Member State progress reports translated into English” and then, inside the
folder, the file “Report 2015 Italy-EN”.
40 http://www.sviluppoeconomico.gov.it/index.php/it/energia/strategia-energetica-nazionale

77
4.3.2 Decree 28th December 2012 - Conto Termico (“Thermal/Heat Account”)
The 28th December 2012 decree, the so called “Conto Termico” decree, implements the incentive scheme
introduced by Legislative Decree 28/2011; in particular, it encourages small-scale energy efficiency
measures in public sector buildings and the production of thermal energy from renewable sources (in
both public and private sectors).
The measures covered by the decree are: building shells, replacement of heating plants with more
efficient ones and replacement or installation of equipment using renewable energy.
The incentives are identified based on the energy saving achievable for the building and on energy
production from renewable sources.
At the beginning of 2016, a revision of the Thermal/Heat Account has been introduced. The new
legislation is now fully complementary to the Tax deductions (described below). In addition to the
introduction of new energy efficiency measures, the scope of eligible subjects has been expanded and the
size of eligible plants has been increased. In addition, the direct access procedure was simplified, the
incentive disbursement period decreased, and the one-off payment limit increased. First results show
more success than the first Thermal/Heat Account.
4.3.3 Directive 2012/27/EC – Energy Efficiency and Legislative Decree 102/2014
The Directive 2012/27/UE establishes a EU wide common framework for the promotion of energy
efficiency, without setting mandatory targets but at the same time pointing out measures in the areas of
energy-supply and energy end-use.
The most relevant provisions are the ones related to the renovation of buildings in the public sector, the
metering and accounting of energy efficiency, the promotion of heating and cooling (the impact on heat
generation), processing, transmission and distribution of energy.
The Directive 2012/72/EU has been transposed by the Legislative Decree N. 102/2014. Articles 5 and 6
of the decree envisage that from 2014 to 2020 measures should be undertaken to redevelop the
buildings of central administration. The decree establishes a “New fund for Energy Efficiency”. This fund
will grant loans with subsidized rates to public and private entities to implement energy efficiency
measures.
Moreover, in July 2014 an energy efficiency plan “PAEE 2014 - Piano di Azione per l’Efficienza
Energetica”41 has been approved by the Government. The PAEE reports the national energy efficiency
objectives and all the measures put in place to achieve them. In particular, the plan proposes to
strengthen the measures already implemented (in particular the “White Certificates”). The plan is
available online: https://ec.europa.eu/energy/sites/ener/files/documents/2014_neeap_it_italy.pdf.
4.3.4 The White Certificates system
The White Certificates or Energy Efficiency Titles (EETs) system represents a cross cutting policy aimed at
promoting energy efficiency and delivering emissions reductions in all end-use energy sectors: industrial,
residential, and tertiary. The system was firstly introduced in July 2001 by means of two ministerial
decrees. The history of this measure was described in detail in paragraph 4.3 of the 5NC. The system
41 https://ec.europa.eu/energy/sites/ener/files/documents/2014_neeap_it_italy.pdf

78
introduces and enforces energy saving targets for electricity and natural gas distributors.
In December 2012, the so called “White Certificate Decree” was issued, concerning the determination of
national quantitative targets of energy savings that must be pursued by distribution companies for
electricity and gas from 2013 to 2016, and the expansion of the White Certificates mechanism. The
decree also defines the criteria, the conditions and the procedures to implement energy efficiency
measures in end-use energy and transfers competences to the GSE from 2013 concerning the
management, assessment and certification of energy saving projects carried out under white certificates.
Table 4.3 - National target for primary energy savings
REVISED TARGET FOR THE ITALIAN WHITE CERTIFICATE
SYSTEM 2013-2016
(Mtoe/Year)
Year Electricity distributors Gas distributors
2013 3.03 2.48
2014 3.71 3.04
2015 4.26 3.49
2016 5.23 4.28
The certification of energy savings produced by each project is made via the issue of Energy Efficiency
Titles (EETs). 1 EET is equivalent to 1 Mtoe of energy savings.
The eligible projects are: re-phasing of electric systems, electric motors and their applications, lighting
systems, reduction of electricity leaking, switching from electricity to other fuels when this produces
primary energy savings, reduction of electricity consumption for heating purposes, reduction of electricity
consumption for air conditioning, high efficient electric appliances, high efficient office equipment,
switching from other fuels to electricity when this produces primary energy savings, reduction of primary
energy consumption in industrial processes, reduction of primary energy consumption for heating,
ventilation and air conditioning system, promotion of end-use technologies fuelled by renewable sources,
electric and gas-fuelled vehicles, information campaigns to raise awareness and promote energy savings.
A further extension of the White Certificates system objective until 2030 is foreseeable because the
decree 102/2014 highlights that White Certificates are the relevant measure to achieve the energy
efficiency target. This extension has been considered as a planned measure.
4.3.5 “Fondo Rotativo Kyoto” (“Kyoto Revolving Fund”)
The “Fondo Rotativo di Kyoto” is a plan originally designed to promote public and private investment for
energy efficiency in the building sector and in the industrial sector, and to promote small high-efficiency
systems for the production of electricity, heating and cooling, use of renewable sources in small plants,
the sustainable forest management and the promotion of innovative technologies in the energy sector.
The Fund provides long term lending at low interest rate: the loans reimbursed by the operator are
reused in other projects.
In June 2012, the Fund was re-oriented to finance private corporate “green” investment. An eligibility
criterion to access the Fund was to create new jobs hiring young people under 35y.
In June 2015, the resources of the Fund have been re-allocated for the increase of the energy efficiency
of public schools. The energy efficiency target is the improvement of two energy efficiency classes. Both

79
works for replacement of equipment and for building envelopes are financed. The loans can also be
granted for reducing the seismic risks of the public schools subject to energy efficiency improvements.
The interest rate is 0,25% and the loan duration is 20 years. The Fund is currently open and the deadline
for financing requests is 30 June 2018.
4.3.6 The Kyoto mechanisms
For the first commitment period, the project-based Kyoto Protocol Mechanisms (Joint Implementation (JI)
and Clean Development Mechanism (CDM))42 played a role in meeting the Italian target under the
Protocol and operators’ commitments under Directive 2003/87/CE. The supplementarity principle
embodied in the Kyoto Protocol was interpreted by the EU and its Member States as the possibility to use
CERs/ERUs up to 50% of the GHG emissions reduction efforts.
Under the EU ETS Italian operators have been allowed to use CERs/ERUs up to 15% of the total quantity
of allowances to be allocated. Considering that such quantity is equal to 201.6 MtCO2/year, the maximum
quantity of CERs/ERUs to be used by operators under Directive 2003/87/CE is equal to 30.2 MtCO2/year.
In order to respect the supplementarity principle, the maximum quantity of CERs/ERUs to be used by the
Government to meet its Kyoto Protocol target is limited to the difference between the 50% of the GHG
emissions reduction efforts43 and the quantity of CERs/ERUs allowed to ETS operators, to date a ceiling of
12.9 Mt/year.
The credits from project-based mechanisms used for the first commitment period and financed by the
Italian Ministry for the Environment Land and Sea through the ICF (Italian Carbon Fund), CDCF
(Community Development Carbon Fund) and BioCF (BioCarbon Fund) are reported in the table below.
For the second commitment period, an amount of credits from project-based mechanisms would be
voluntary cancelled by the Italian Ministry for the Environment Land and Sea to offset emissions from
events hosted by the Italian government in order to enhance mitigation ambition, according to decision
1/CP.19, paragraph 5(c), and decision 1/CP.21.
Table 4.4 - Quantitative contribution of Kyoto mechanisms for the first commitment period
Kyoto mechanism Total projected quantities for the first commitment period
(Gg CO2 equivalent)
Total for all Kyoto mechanisms 10.15 International emissions trading 2.0 All project based activities
joint implementation 0.15 clean development mechanism 8.0
The table does not include credits used by ETS operators to comply with their surrender obligation under
the EU ETS.
4.3.7 Ecodesign of energy-using products
The directive 2005/32/CE has established the first eco-design requirements for energy-using products.
This directive has been transposed into the national legal system with the legislative decree 201/2007. In
the 2009 the Energy-related-Products Directive 2009/125 / EC - ErP –has amended the Directive

80
2005/32/EC and through specific implementing regulations has set a framework related to the eco-design
requirements for all products that use energy, except for those destined for the transport sector. This is
the first directive that covers the entire life cycle of the product
4.3.8 Structural funds 2007-2013
This policy has been described in detail in the 5NC (see paragraph 4.3 and, in particular, table 4.3).
Measures foresee a EU contribution in investments focused on the improvement of energy efficiency, the
development of renewable energies and the improvement of transport networks and waste management.
Although financial resources were exhausted, the effects of such funds are still in place.
4.3.9 Global Covenant of Mayors for Climate and Energy
The Global Covenant of Mayors is the result of the merging between the world’s main initiatives of cities
and local governments committed to undertake a transition towards a low emission and climate resilient
economy. On October 15th, 2015, the Covenant of Mayors and the Mayors Adapt initiatives merged into
the New Covenant of Mayors for Climate and Energy.
In the framework of the Global Covenant of Mayors for Climate and Energy, signatories are request to set
targets for 2030 and to undertake the preparation and submission of a Sustainable Energy and Climate
Action Plan (SECAP) to turn their commitment into specific actions, measures and projects. The SECAP is
the key document in which the Global Covenant signatory outlines how it intends to reach its CO2
reduction target and adaptation actions and/or strategies by 2030, also outlining means and provisions to
achieve the targets, as well as time frames and assigned responsibilities.
The Covenant of Mayors was an initiative launched by the European Commission to endorse and support
the voluntary efforts deployed by local authorities in the implementation of sustainable energy policies. It
played an important role in mobilising local and regional actors around the fulfilment of the EU’s climate
and energy targets for 2020. By the end of 2017, a number of 3,298 local authorities have signed the
Covenant of Mayors with a view of submitting a SEAP (Sustainable Energy Action Plan). Following the
beginning of the new phase under the Global Covenant of Mayors, some signatories are now in the
process of submitting a SECAP (Sustainable Energy and Climate Action Plan).
Through their participation to the above initiative, Italian municipalities achieved a number of positive
results, in particular by increasing local political attention on the issues of energy efficiency, renewable
energy, sustainable mobility, waste, and establishing channels to provide information to citizens.
At the same time, the following problems have emerged:
• difficulties in ensuring compliance with the commitments arising from the accession to the Covenant
of Mayors (e.g. the submission of SEAPs within one year from the signature of the covenant);
• lack of human and financial resources to achieve objectives;
• Identification, planning and implementation of actions in all key areas, which will lead to the
objective of reducing CO2 emissions (especially for smaller municipalities).
For these reasons, the Ministry for the Environment will provide in the future increasing support to the
Communities participating to the initiative, by:

81
• supporting technical work concerning the preparation of baseline inventories (e.g. identification of a
common set of data-bases for energy consumption, homogenization of software for inventory
calculations)
• providing guidelines and handbooks for public administrations concerning issues such as energy
audits of buildings, EU funding, energy performance contracting, preparation of joint SEAPs;
• Establishing a web site providing examples of good practices and experiences of various Italian
subjects.
The same provisions are also supposed to apply to SECAPs within the new Global Covenant.
The Compact of Mayors was a global coalition of mayors and city officials pledging to reduce local
greenhouse gas emissions enhance resilience to climate change, and to track their progress
transparently. The Compact was launched in September of 2014 by UN Secretary-General Ban Ki-moon
and his Special Envoy for Cities and Climate Change, Michael R. Bloomberg. The Compact was activated
under the leadership of the global city networks — C40 Cities Climate Leadership Group (C40), ICLEI –
Local Governments for Sustainability (ICLEI) and the United Cities and Local Governments (UCLG) — and
with support from UN-Habitat, the UN’s lead agency on urban issues44.
On January 1st, 2017, the New Covenant of Mayors for Climate and Energy and the Compact of Mayors
merged into the Global Covenant of Mayors for Climate and Energy to act as a unique platform worldwide
in the next years.45
4.4 Policies in Energy Sectors
The Energy production and transformation sector is included in the Emission Trading Scheme. Emissions
from this sector are also influenced by other measures that traditionally can be grouped into four main
measures:
Use of renewable energy
Cogeneration
Improving the efficiency for electricity and thermal use of thermoelectric power plants
Improving of energy efficiency in industry
4.4.1 Energy Industries
4.4.1.1 Renewable Energy Sources
In Italy, the electricity production by renewable use has registered a sizeable increase in the period
2010-2013, growing from about 76.9 to 108.9 GWh.
This growth was driven by the financial incentives in the form of feed-in-tariffs, in particular for
photovoltaic production. The incentive for photovoltaic production has now been greatly reduced and
increase rate in production is now much lower. Feed-in-tariffs are still operative for new biogas
production.
44 https://www.compactofmayors.org/history/ 45 http://www.globalcovenantofmayors.org/about/history-compact-of-mayors/

82
The thermal renewable sources have a relevant role in achieving the IECCP targets, as well. Heat
consumption represents the largest share of our energy consumption, both in the civil and industrial
sectors (approximately 45% of total final consumption). Thermal renewable sources are generally more
efficient and less expensive than the electric ones, either in terms of cost per tonne of CO2 avoided or
cost per kWh of final energy produced, involving the significant benefits of saving fossil fuels for the final
consumer (e.g. through biomass heating) and for the country as a whole (by reducing imports).
The development of renewable thermal energy use over the past five years has occurred in line with the
objectives (5.4 Mtoe in 2010) and was driven by measures regarding energy efficiency, tax deductions or
white certificates.
The most relevant measures implemented and planned to achieve the renewable target are reported
below.
The Green Certificates system
Green Certificates (GCs) are tradable instruments that GSE grants to qualified renewable-energy power
plants (IAFR qualification) which have been commissioned before 31 December 2012 as per Legislative
Decree 28/2011.
The number of certificates issued is proportional to the electricity generated by the plant/system and
varies depending on the type of renewable source used and of project (new, reactivated, upgraded,
renovated system/plant).
The Green Certificates support scheme is based on the legislation which requires producers and importers
of non-renewable electricity to inject a minimum quota of renewable electricity into the power system
every year.
Green Certificates represent proof of compliance with the renewable quota obligation: each Green
Certificate is conventionally worth 1 MWh of renewable electricity. Green Certificates are valid for three
years: those issued in respect of electricity generation in a given year (reference year) may be used
towards compliance with the obligation also in the following two years. In order to fulfil their obligation,
producers and importers may inject renewable electricity into the grid or purchase an equivalent number
of Green Certificates from green electricity producers.
Green Certificates incentive mechanism was replaced as of 1st January 2016 by other supporting
mechanisms outlined below.
The All-Inclusive Feed-in tariff
The All-Inclusive Feed-in tariff is a support system based on granting a fixed charge to renewable energy
installations in the energy function electric grid (feed in tariff). This rate is applicable only to facilities of
less than 1 MW (200 kW for wind) of power and includes both an incentive (differentiated by technology)
and the remuneration for the energy fed into the grid. The rate is all-encompassing and is recognized for
a variable period depending by technology. This system has been replaced all other incentives schemes
for small installations.
Ministerial Decree of 6th July 2012

83
Through Ministerial Decree of 6th July 2012, changes were made to the incentives for electrical renewable
energy (excluding photovoltaic). In particular, new plants starting from 1st January 2013 are no longer
subject to the “Green Certificates” and the “All-Inclusive Feed-in” tariffs, which were replaced by a new
scheme, deemed less expensive for end-users, people and companies. The main changes introduced by
the decree concern the way of access to incentives that are now divided into three parts depending on
type and power of plants:
Direct access to incentives: for new or fully reconstructed or restarted plants below a threshold
level; the system is very similar to current “all inclusive” tariff;
Register enrolment: for new or fully reconstructed or restarted plants that have power greater
than the “Direct access” level but lesser than the auction level;
Auction: for new or fully reconstructed or restarted plants with power greater than a certain
threshold value.
In the following table, the threshold for the access to the different incentives divided by type of
renewable energy sources are reported:
Table 4.5 – Ministerial Decree of 6th July 2012 - Incentives scheme
Source Direct access Register Auction
Wind - on shore 1-≤60kW >60kW-≤5MW >5MW
Wind - offshore 1-≤60kW
>5W
Hydroelectric 1-≤50kW >50kW-≤10MW >10MW
Hydroelectric (art.4, c. 3, b) 1-≤250kW >250kW-≤10MW >10MW
Oceanic (sea waves) 1-≤60kW >60kW-≤5MW
Geothermal 1kW-≤20MW
>20MW
Geothermal (art.4, c. 3, f) 1kW-≤5MW
Biomass (art.8, c. 4, a) e b) 1-≤200kW >200kW-≤5MW >5MW
Biomass (art.8, c. 4, c) e d) from waste water
treatment sludge, biogas and bio-liquid
1kW- ≤5MW >5MW
Biogas 1-≤100kW >100kW-≤5MW >5MW
Source: FIRE – Federazione Italiana per l’uso Razionale dell’Energia
The Decree also covers the procedures under which plants already in service and supported under the
Ministerial Decree of 18 Dec. 2008 shall pass from the green certificates scheme to the new support
schemes in 2016.
A following decree, dated 23rd June 2016, establishes new procedures for supporting electricity
generation by RES-E plants (other than photovoltaic ones) with a capacity of at least 1 kW. The
incentives covered by the Decree apply to new, totally rebuilt, reactivated, repowered/upgraded or
renovated plants which will be commissioned on or after 1 January 2013.
The “Conto Energia” (Energy Account) – Feed-in scheme

84
The “Conto Energia” is a support system that provides constant support to electricity produced by solar
photovoltaic and thermodynamic, for a fixed period (20 years for photovoltaic systems, solar systems and
25 years for thermodynamic) through a tariff for all energy produced by the plants (feed in premium).
The system has exhausted the available financial allowances in mid-2013.

85
Table 4.6 – Summary of implemented policies and measures in the energy sector – Renewable energy sources
PaMs
number Name of PAM
Target and/or activity
affected
GHG
affected
Type of
instrument
Status and
start year of
implementat
ion
Implementing
entity or
entities
TOTAL GHG
Reduction
(Kt CO2 eq.)
2020 2030
1
Third "Conto Energia" (art.3
paragraph 1, decree 6 august
2010) and Fourth "Conto
Energia" (Decree 5 May 2011)
Supporting the expansion of
photovoltaic plants through
feed in tariffs until a maximum
capacity of 8000 MW
CO2 Economic
Implemented
2010
Ministry of
economic
development
2300 -
2
Third "Conto Energia":
photovoltaic (art.3 paragraph 2,
decree 6 august 2010)
Supporting the expansion of
photovoltaic plants through
feed in tariffs until a maximum
capacity of 3000 MW
CO2 Economic Implemented
2010
Ministry of
economic
development
900 -
3 Green Certificate - budget law
2008
Green Certificate increased
every year by 0,75% for 2007 -
2012 and establishment of "all-
inclusive" rate for plants <1
Mwe
CO2 Economic
Implemented
2009
Ministry of
economic
development
4000 -
4
European regional development
fund (ERDF), National Strategic
Framework 2008-2013 -
increase of renewable energy in
electricity production
Supporting system for RES with
Regional operative program
(POR) and Interregional
operative program (POIN)
CO2 Economic Implemented
2008
Ministry of
economic
development
1400 -
Total effect of implemented policies
8600

86
Table 4.7 – Summary of planned policies and measures in the energy sector – Renewable energy sources
PaMs
number Name of PAM
Target and/or activity
affected
GHG
affected
Type of
instrument
Status and
start year of
implementat
ion
Implementing
entity or
entities
TOTAL GHG
Reduction
(Kt CO2 eq.)
2020 2030
25
New measure to promote and
support renewable energy
sources for electricity (RES-E) -
photovoltaic
Renewable energy -
photovoltaic: supporting the
expansion of photovoltaic and
concentrated solar power plants
(CSP) through feed in tariffs
until a maximum capacity of 40
GW. (Current installed capacity
in 2015 18 GW, total new
capacity 2016-2030: 22+2 GW)
CO2 Economic
Planned
2020
Ministry of
Economic
Development
8568
26
New measure to promote and
support renewable energy
sources for electricity (RES-E) -
- wind
Renewable energy - Wind:
promotion of new plants and
repowering of existing ones up
to a maximum of 16 GW of
installed power (current
installed capacity in 2015 9.2
GW)
CO2 Economic Planned
2018
Ministry of
Economic
Development
- 4229

87
PaMs
number Name of PAM
Target and/or activity
affected
GHG
affected
Type of
instrument
Status and
start year of
implementat
ion
Implementing
entity or
entities
TOTAL GHG
Reduction
(Kt CO2 eq.)
2020 2030
27
New measure to promote and
support renewable energy
sources for electricity (RES-E) -
Biomass
Renewable energy - Biomass:
further extension of incentives
so that existing plants run up to
2030. New bioenergy
(agriculture and urban waste
and secondary product) with
incentives only for small plants
capacity < 70 kW
CO2 Economic Planned
2018
Ministry of
Economic
Development
- To be
estimated
28
New measure of promoting and
supporting renewable energy
sources for electricity (RES-E) -
Other renewables
Renewable energy - Other:
review of auction rules and
mechanisms for hydro,
geothermal energies and high
efficiency cogeneration
CO2 Economic
Planned
2018
Ministry of
Economic
Development
- To be
estimated
30 2017 National Grid Development Plan - Grid upgrade
Development of the national
electricity transmission and
distribution network to allow
the increase of the Distributed
Generation (DG) - the effect of
this measure is distributed in all
PAMs regarding electricity
consumption
CO2 Planning
Planned
2020
TERNA -
Manager for the
electricity
transmission
grids
- IE

88
PaMs
number Name of PAM
Target and/or activity
affected
GHG
affected
Type of
instrument
Status and
start year of
implementat
ion
Implementing
entity or
entities
TOTAL GHG
Reduction
(Kt CO2 eq.)
2020 2030
31 2017 National Grid Development Plan - Smart grid
Increasing flexibility of
electricity network for the
management of production
from RES - the effect of this
measure is included in
measures 25 and 26
CO2 Planning
Planned
2020
TERNA -
Manager for the
electricity
transmission
grids
- IE
Total effect of planned policies
12797

89
4.4.1.2 Cogeneration and District Heating
Cogeneration is currently supported by incentive schemes, rewarding both the production of heat and the
production of electricity. In particular, all cogeneration plants benefit from the White Certificate system
while cogeneration from renewable energy sources are additionally entitled to receive incentive to reward
the green electricity produced.
In the field of high-efficiency cogeneration, in accordance with the provisions of the new directive on
energy efficiency, further measures of a regulatory nature will be introduced in addition to the incentive
scheme in force, in order to facilitate this technology that has significant potential of primary energy
savings. In this sector, Italy already has a historically high use in the industrial sector, with many existing
plants from medium to large size. Public support can point to the development of new facilities, in
particular of small dimensions, but especially should aim to the revamping of existing installations,
structures and technologies towards higher-yielding processes.
The heating demand in the residential sector has been the most relevant factor for the development of
district heating; however, it is still possible to exploit an increase in thermal energy distributed through
district heating networks, equal to approximately 30%. In order to develop this potential, it will be
essential to adapt and strengthen the tools available today to encourage the new construction and
expansion of the urban heating infrastructure. This measure is considered as planned.
In the following paragraphs, planned policies and measures for this sub-sector are reported:
Coal phase out
As planned measure, the gradual coal phase out by 2025 has also been envisaged. This measure included
as a political choice in the National Energy Strategy 2017 should be implemented taking into account an
adequate capacity replacement, the development of the electricity grid and the preservation of the
employment.
Enhancement of natural gas supply and network
Italy is the third European market for natural gas consumption (about 67 billion cubic meters in 2015),
with a dependence on 'Imports higher than the European average (about 90% compared to a Community
average of 70%) due to that reason the energy security is important at national level. The development
of liquefied natural gas (LNG) through methane vessels is an opportunity to improve the natural gas
supply flexibility and to deal with possible security and resilience problems of the Italian gas system.
Furthermore, 35 billion Bcm of natural gas long-term contracts will expire by 2020, with the terms of
renegotiation not yet been defined. For those reasons, it is important to plan a diversification of the
possible sources of import.
The distribution of natural gas in the Sardinia has been also envisaged with the development of terminals
for gas vessels, small coastal depots and a medium and high-pressure distribution network. These
measures are reported as planned.
Bio-refineries
The European Directive 1513/2015 promotes the transition towards low GHG emissions fuels and
foresees a minimum share of advanced biofuels as urban waste biologics, agricultural waste, animal

90
waste, etc. To achieve that target, the refinery of Venezia Porto Marghera has been converted into a bio
refinery; the same process is currently on-going for the plant located in Gela.
In Tables 4.8 impacts of implemented policies and measures within this sector are reported and in table
4.9 impacts of planned ones.

91
Table 4.8 – Summary of implemented policies and measures in the energy sector – Cogeneration and District Heating
PaMs number
Name of PAM Target and/or activity
affected GHG
affected Type of
instrument
Status and
start year of
implementation
Implementing entity or entities
TOTAL GHG Reduction (kt CO2 eq.)
2020 2030
5
White certificates -
decree December 2007 -
CHP
Supporting CHP and district
heating plants for 2008-2012 CO2 Economic Implemented 2008
Government, GSE and electricity and gas distributors
970 -
6
National Strategic
Framework 2007-2013 -
ERDF
Supporting CHP and energy
savings with POR (Operative
Regional Programs) and POIN
(Operative Regional
Programs)
CO2 Economic Implemented 2007
Regions 240 -
Total effect of implemented policies
1210

92
Table 4.9 – Summary of planned policies and measures in the energy sector – Cogeneration and District Heating
PaMs number
Name of PAM Target and/or activity
affected GHG
affected Type of
instrument
Status and
start year of
implementation
Implementing entity or entities
TOTAL GHG Reduction (kt CO2 eq.)
2020 2030
29 Coal phase out
Gradual phase-out of coal-
fired installations subject to
system adequacy (adequate
replacement capacity) and
measures to preserve
employment (still available
3280MW in 2030)
CO2 Planning Planned
2020
Ministry of
Economic
Development - 7758
32 Development of district
heating network
30% development of the
district heating (renewable
energy and high efficiency
cogeneration)
CO2 Planning
Planned
2018
Municipalities - .
33 Installation of two news
LNG terminals
LNG terminals with a capacity
of 4 bcm annual CO2 Planning
Planned
2018
Ministry of
Economic
Development - -
34 Natural gas in Sardinia
Development of terminals for
gas vessels, small coastal
storage area and a medium
and high pressure distribution
network
CO2 Planning
Planned
2017
Ministry of
Economic
Development - -

93
PaMs number
Name of PAM Target and/or activity
affected GHG
affected Type of
instrument
Status and
start year of
implementation
Implementing entity or entities
TOTAL GHG Reduction (kt CO2 eq.)
2020 2030
35 Reconversion of refinery
industry
Conversion of at least another
1 or 2 refineries (beyond
Porto Marghera) to bio-
refineries
CO2 Planning Planned 2018
Ministry of
Economic
Development - -
Total effect of planned policies
7758

94
4.4.1.3 Thermoelectric power plants
The liberalization of the electricity sector brought in by Legislative Decree 79/99 started a deep
refurbishment of the power generation sector. The decree had the main purpose of reducing the
dominant position of Enel, the former state monopolist, by forcing it to sell part of its generation capacity
to new entrants.
Subsequent Decree 4 August 1999 identified the plants that had to be sold to new entrants and specified
those that had to be converted from fuel oil steam plants to new combined cycle gas turbine plants
(CCGT) using natural gas. This last provision was intended to increase the overall efficiency in power
generation and to reduce CO2 emissions of the energy supply sector. Out of a total capacity of 15,000
MW to be divested, 9,400 MW were forced to be converted to CCGT.
Law 55 of 9 April 2002 was introduced to simplify the authorization procedure for the construction and
operation of power plants with a capacity of over 300 MW. From 2002 to the end of 2006, the Ministry of
Economic Development issued 45 authorizations for a new overall capacity of 21,400 MWe; among these,
23 authorizations (amounting to 9,897 MW) were issued according to the new procedure brought in by
law 55/02.
Law 239 of 23 August 2004 introduced some important changes in the energy sector. One of its main
purposes was to speed up the authorization process for the construction of new power plants and energy
infrastructures, particularly grid lines.
Since the entry into force of law 239/04, new energy infrastructures for approximately 2,300 MW have
been developed and new CCGT plants for about 3,200 MW have been constructed, which led to consistent
emissions reductions.
The overall effect of these substitutions was the decline of emissions from electricity production in
thermoelectric plants from 708 g/kWh in 1990 to 489 g/kWh in 2015.
The decline in the specific emissions, essentially due to an increase in the overall efficiency in the
thermoelectric production and a decline in the carbon content of the fuel used in the power plants, has
contributed to limit the increase of the emissions due to the increase of the overall thermoelectric
production.
From 2000 to 2016, in Italy, an increase in the use of natural gas and a decrease in the use of petroleum
derived fuels use were registered. Other energy sources are quite stable, as shown in Figure 4.1.

95
Figure 4.1 - Electricity production (TWh) by energy source
Source: ISPRA elaboration of TERNA data
4.4.2 Manufacturing Industry and Construction
Policies affecting CO2 emissions in the industry sector are generally designed to improve industrial energy
efficiency. All the policies implemented or planned are reported in table 10.
The main instrument is represented by the White Certificates system which is aimed at promoting energy
efficiency and deliver emissions reductions in all the energy end-use sectors. The implementation of
directive 2006/32/CE on energy end use efficiency and energy services in the industrial sector and the
Action Plan 2007 impose new targets for White Certificates to 2016, and an extension of the scheme is
envisaged up to 2030.
Another important initiative introduced by the Government concerns the replacement of existing
inefficient electric motors with high efficient ones. This measure can help to achieve substantial CO2
emissions reductions, although engines with high purchase price, as well as the lack of information about
their energy saving potential, represent main obstacles to their diffusion.
The Budget laws 2007 and 2008 therefore provide for tax credits for high efficiency electric engines and
inverters. European regulations 640/2009 and 641/2009, related to Legislative decree 201/2007
(directive 2005/32/CE) imposed minimum efficiency requirements on new electric motors and pumps,
with a gradual introduction between 2011 and 2017.
In 2015, in Italy, 63.5% of emissions from this sector were subject to ETS while 36.5% were accounted
for under the ESD.
-
50,0
100,0
150,0
200,0
250,0
300,0
350,0
1990 1995 2000 2001 2002 2003 2004 2005 2006 2007 2008 2009 2010 2011 2012 2013 2014 2015 2016
Solids Natural gas Petroleum and derivated fuels Renewables Other

96
Table 4.10 - Summary of implemented policies and measures in the industry sector
PaMs number
Name of PAM Target and/or activity
affected
GHG affected
Type of instrument
Status and
start year of
implementation
Implementing entity or entities TOTAL GHG Reduction
(kt CO2 eq.)
2020* 2030
7
White certificates -
decree December 2007 -
Industry
Supporting electric energy
savings for the period 2008-2012 CO2 Economic Implemented 2008
GSE- Manager for
Energy Service 2020 -
8
Eco-design of energy-
using products -
Legislative decree
201/07 (transposition of
directive 2005/32/EC-
first regulations)
Installation of highly efficient
electric motors and inverters
through minimum mandatory
standards
CO2 Regulatory Implemented 2008
Italian Regulatory
Authority for
Electricity Gas and
Water
1920 -
9
European regional
development fund
(ERDF), National
Strategic Framework
2008-2013 - Electric
energy saving in the
energy industry sector
Supporting electric energy saving
with POR (Operative Regional
Programs) and POIN (Operative
INterregional Programs)
CO2 Economic Implemented 2008
Regions 660 -
Total effect of implemented policies
4600

97
Table 4.11 - Summary of planned policies and measures in the industry sector
PaMs number
Name of PAM Target and/or activity
affected
GHG affected
Type of instrument
Status and
start year of
implementation
Implementing entity or entities TOTAL GHG Reduction
(kt CO2 eq.)
2020* 2030
36
Further extend of energy
saving targets (White
certificates 2020-2030)
Energy efficiency measures in
industry ETS and non-ETS up to
2.2 Mtoe saved
CO2 Economic
Planned
2018
GSE- Manager for
Energy Service 3700 4400
Total effect of planned policies
3700 4400

98
4.4.3 Civil (Residential and Tertiary)
The package of policies deployed in this sector aims to improve energy efficiency through specific actions
targeted at both existing and new buildings and appliances. Improving the energy efficiency of buildings
and reducing the related emissions have become priorities in the last few years.
The implementation of directive 2002/91/CE on Energy Efficiency has been an opportunity to introduce
stricter energy requirements and to promote the diffusion of renewable energy sources in the building
sector. The Directive lays down requirements on the application of minimum standards for the energy
performance of new buildings and on the performance of large existing buildings undergoing major
renovation. The directive also requires the provision of energy performance certificates when buildings
are constructed, sold or rented out. The directive has been transposed by legislative decree 102/2005
subsequently amended by legislative decree 311/2006 to strengthen buildings thermal demand
requirements. The new law can be applied to new and existing buildings subject to major renovation46
and provides for some important measures. Amongst the main provisions, the following obligations are
worth mentioning:
installation of technical blinds for solar protection and insulation of new buildings and
buildings subject to overall renovation (limited to buildings over 1000 m2);
laying down of all the necessary works to allow the connection of new buildings (and buildings
subject to major renovation) to district heating systems, when existing (and not further than
1 km) or planned;
installation of solar thermal systems that cover at least 50% of hot water demand for all new
buildings and in case of replacement or renovation of the existing heating system;
installation of PV systems (with a power capacity to be defined in a subsequent ministerial
decree) in all new buildings and in existing buildings with a total floor area over 1000m2.
Directive 2010/31/EC recasts the European Energy Performance of Buildings Directive (EPBD)
(transposed into national law with the decree 63/2013). This measure defines mandatory standards for
new buildings, in particular, article 9 foresees that by 31 December 2020, all new buildings will be nearly
zero- energy buildings and after 31 December 2018, new buildings occupied and owned by public
authorities will be nearly zero-energy buildings
The transposition of this directive has raised the requirement on new buildings and mad it consistent in
all regions.
An important contribution will also come from the application of the Inter-ministerial Decree 26 June
2015 "Application of energy performance calculation methodologies and definition of minimum
requirements and requirements for buildings.
There are also minimal efficiency requirements on new domestic appliances (TV, refrigerator, lamps,
etc.), with a gradual introduction between 2009 and 2015. Those standards take into account the
European regulations 644/2009, 278/2009 242/2009 243/2009 and 1275/2008 and are put into practice
by the Legislative decree 201/2007 (directive 2006/32/CE).
Consistent reductions are also expected from the introduction of other regulations for energy efficiency
standards for new energy-consuming products introduced by law 201/2007 (transposition of directive
46 As regards the minimum energy performance requirements of existing buildings subject to major renovation, the decree applies only in case of large buildings of over 1000 m2 and in case of expansion of existing buildings (over 20%). The decree applies only partially to existing buildings under the 1000m2 threshold.

99
2005/32/CE).
A tax rebates system allows, in a 10-year time, the recovery of up to 55%/65% of capital expenses for
high efficiency appliances or building shell improvements. It is extended and modified on an annual basis
with the annual state budget law. In order to promote energy efficiency interventions in the civil sector
and to minimize system costs at the same time, an optimization of the tax deduction mechanism is
foreseen.
The most significant improvements concern a differentiation between the percentage of deductible
expenditure and/or the duration of the refund, in proportion to the actual saving produced by the
intervention, orienting the mechanism to radical interventions on the building (Deep renovation) and
coupling the instrument with other incentive mechanisms, with specific reference to measures for anti-
seismic construction.

100
Table 4.12 - Summary of implemented policies and measures in the civil (residential and tertiary) sector
PaMs number
Name of PAM Target and/or activity
affected GHG
affected Type of
instrument
Status and
start year of
implementati
on
Implementing entity or entities
TOTAL GHG Reduction (kt CO2 eq.)
2020* 2030
11
Building Regulation
(Legislative decree
192/05 as amended by
legislative decree
311/06)
Minimum mandatory standards
on new and existing buildings
(Energy Efficiency) CO2 Regulatory
Implemented 2006
Municipalities,
Ministry of
Economic
Development;
3610 -
12
Tax deduction for energy
saving in buildings -
Budget law 2007, Budget
law 2008 and Budget law
2009
Supporting energy savings in
existing buildings through tax
deduction of 55% CO2 Fiscal
Implemented 2008
Ministry of
Finance 1050 -
13
White certificates -
decree December 2007 -
Commercial
Supporting energy savings
2008-2012 (Energy Efficiency) CO2 Economic Implemented 2008
GSE- Manager for Energy Service
3120 -
14
Legislative decree
201/07 (transposition of
directive 2005/32/EC) -
Increase efficiency of
appliances in residential
sector
First regulation on mandatory
energy efficiency standards for
energy-using products CO2 Regulatory
Implemented 2008
Ministry of
Economic
Development 2600 -
15
National Strategic
Frame-work 2007-2013 -
ERDF - Residential
energy saving
Supporting electric energy
saving with POR (Operative
Regional Programs) and POIN
(Operative Interregional
CO2 Economic Implemented 2007
Regions 420 -

101
PaMs number
Name of PAM Target and/or activity
affected GHG
affected Type of
instrument
Status and
start year of
implementati
on
Implementing entity or entities
TOTAL GHG Reduction (kt CO2 eq.)
2020* 2030
Programs) in buildings
24
Minimum requirement
for building (Inter-
ministerial decree June
26th, 2015)
Application of the minimum
energy performance
requirements for buildings.
These requirements apply to
public and private buildings,
whether they are new buildings
or existing buildings subject to
restructuring
CO2 Regulatory
Implemented
2015
Ministry of
Economic
Development
4000
Total effect of implemented policies
10800 4000

102
Table 4.13 - Summary of planned policies and measures in the civil (residential and tertiary) sector
PaMs number
Name of PAM Target and/or activity
affected GHG
affected Type of
instrument
Status and
start year of
implementati
on
Implementing entity or entities
TOTAL GHG Reduction (kt CO2 eq.)
2020* 2030
37
Energy efficiency in
residential building with
tax deduction
Restructuring for thermal
insulation in residential
buildings, 0.5% annual
renovation rate, to be achieved
through an improved tax
deduction scheme (65-55-36%)
based on expected saving.
CO2 Fiscal
Planned
2018
Ministry of
Finance,
Ministry of
Economic
Development
385 1569
38
Energy efficiency in
residential building -
upgrade entire building -
tax deduction
Restructuring for thermal
insulation in residential
buildings, 0.5% annual
renovation rate, focused on
"deep renovation" to be
achieved through the
remodelling of the tax
deduction (The assessment of
the impact of this measure has
not been finalized yet because
the implementation involves
public and private resources. It
has still to be decided the type
of instrument and the extent of
public support)
CO2 Fiscal Planned
2018
Ministry of
Finance,
Ministry of
Economic
Development
- -

103
PaMs number
Name of PAM Target and/or activity
affected GHG
affected Type of
instrument
Status and
start year of
implementati
on
Implementing entity or entities
TOTAL GHG Reduction (kt CO2 eq.)
2020* 2030
39
Energy efficiency in
residential building -
measure for supporting
low income families
Introduce title portability or
structuring an incentive system
integrated with energy
redevelopment
CO2 Economic
Planned
2020
Ministry of
Finance - -
40
Energy efficiency in
residential building -
provision to rebuild
housing including seismic
upgrade
Link the instrument with other
incentive mechanisms by
introducing measures for anti-
seismic building
CO2 Economic
Planned
2020
Ministry of
Economic
Development
- -
41
Energy efficiency in
tertiary building
Restructuring for thermal
insulation in tertiary buildings,
including very low emission
building for central
administration (The assessment
of the impact of this measure
has not been finalized yet
because the implementation
involves public and private
resources. It has still to be
decided the type of instrument
and the extent of public
support)
CO2 Fiscal Planned
2017
Regions,
Ministry of
Economic
Development
894 -

104
PaMs number
Name of PAM Target and/or activity
affected GHG
affected Type of
instrument
Status and
start year of
implementati
on
Implementing entity or entities
TOTAL GHG Reduction (kt CO2 eq.)
2020* 2030
42
Promoting energy saving
in building (public,
domestic, tertiary):
insulation, replacement
windows and boilers,
installation of heat
pumps and solar thermal
panels (Legislative
decree 28/2011)
Investments of air conditioning
systems (cooling and heating)
in the residential sector,
restructuring of the service
sector’s buildings. Installation of
gas and electric heating pumps,
high efficiency boilers and floor
heating system. Replacement of
appliances (The assessment of
the impact of this measure has
not been finalized for 2030
because the implementation
involves public and private
resources. It has still to be
decided the type of instrument
and the extent of public
support)
CO2 Economic
Planned
2017
GSE- Manager
for Energy
Service
4080 -
Total effect of planned policies
5359 1569

105
4.4.4 Transport
This section provides policies and measures for the transport sector to achieve energy savings, GHG
reductions and sustainable transport systems.
Transport sector consumes approximately one third of EU's total energy demand and this demand is
almost entirely met by oil. While the transition to low-emission alternative energy in transport has
already begun, spurred also by the proposal for the Renewable Energy Directive on the promotion of the
use of energy from renewable sources (COM/2016/0767 final), the sector is significantly lagging behind
other sectors for a number of reasons, including the lack of strong incentives to innovate in energies and
technologies needed for the long-term low carbon policies as well as infrastructure issues related to
electrification. The latter issue is currently addressed via the implementation of the Alternative Fuel
Directive (DAFI) and the provisions foreseen in the review of the Energy Performance of Building
Directive.
In detail, the directive DAFI 2014/94/UE establishes a common framework of measures for the
deployment of low carbon fuels infrastructure in the Union in order to minimize dependence on oil and to
mitigate the environmental impact of transport. This Directive sets out minimum requirements for the
building-up of recharging points for electric vehicles and refueling points for natural gas (LNG and CNG)
and hydrogen, to be implemented by means of Member States' national policy frameworks, as well as
common EU technical specifications for such recharging and refueling points.
Regarding implemented measures, in line with the aims identified by the National Strategic Framework
2007-2013, infrastructural measures (high capacity and high speed networks, and improvement of
regional networks for commuting) and management measures regarding the enhancement of the road
urban public transport network have been implemented.
Furthermore, the effect of EU Regulation (EC) No 443/2009 establishing CO2 emissions performance
requirements for new passenger cars has to be considered. The Regulation aims to achieve the overall
objective of the European Community of 120 g CO2/km as average emissions for the new car fleet (130
gCO2/km vehicle efficiency plus -10 gCO2/km from additional reduction tools as biofuel use).
In order to promote the mandatory use of biofuels, a minimum quota of biofuels was set to 5.75% of the
total sold from 2010 onwards, while Legislative Decree 28/2011 established a 10% objective of biofuel
use for transport by 2020. The effect of the existing measures for the post-2020 period is included in the
reference scenario.
Moreover the planned measures envisaged are the following ones:
- Promoting and supporting the development of charging infrastructure for electric vehicles;
- Intermodal measures regarding shifting from private road traffic to busses and railways
(Modal shift of about 10% in 2030 to public transport, car-pooling, bikes and walking) and
shifting goods transport from the road to the sea and railways; management measures
supporting efficiency in private road transport and improving road circulation in the urban
areas.
- It is planned a new EU Regulation, to be approved before 2020, that will set a more
ambitious target post 2020.

106
- National measures to promote and support the diffusion of low carbon fuels and electrical
vehicles;
- A further expansion of electrical vehicles car fleet, depending on the provisions to be included
in the upcoming EU Regulation on new cars.
- Increase in bio fuels use to over 10% of road fossil fuels consumption, including bio methane;
It is emphasized that in the transport sector national estimates include only domestic flights and
shipping; to reduce the emissions from national shipping it is planned to promote the use of LNG as a fuel
and the availability of electrical connection at ports for all ships. In the case of aviation, national
authorities have no control of the plane emissions that are subject to international licensing procedure.
Italy supports the EU policy within ICAO to promote all available technologies for fuel efficiency and other
operational practices so to stabilize GHG emissions from airplanes. Additionally the bio-refineries that are
planned to be operating in Italy, see section on energy industry, will have the technical capability to
produce also biofuels for airplanes.
Explanations on how Italy is addressing international transport emissions is provided in the paragraph
below, in accordance with the UNFCCC reporting guidelines on NCs.
4.4.4.1 Aviation and marine bunker fuels
According to Article 2.2 of the Kyoto Protocol on aviation and marine bunker fuels, each Annex I Party
shall identify the steps it has taken to promote and/or implement any decisions by the International Civil
Aviation Organisation (ICAO) and International Maritime Organisation (IMO) to limit and reduce
associated emissions.
As part of the European Union, Italy supported the European Commission's proposal to incorporate
aviation into the EU Emissions Trading System (ETS), which was approved in 2008 (Directive
2008/101/CE). In order to prevent negative effects on the EU's relationship with other countries, it urged
that implications in the area of international law, by ICAO, should be taken into account. Directive
2008/101/CE sets a cap for CO2 allowances and establishes that a certain quantity of allowances is
allocated through auctioning. In order to prevent double regulation and not prejudge the ICAO process,
the ETS directive is currently applied to flights leaving and departing in airports located in the European
Economic Area (EEA).
As regards the maritime sector, on 28 June 2013 the European Commission adopted a Communication47
setting out a strategy to progressively include GHG emissions from maritime transport into EU's policy for
reducing its overall emissions. The strategy consists of the following consecutive steps:
establishing a system for monitoring, reporting and verifying (MRV) of CO2 emissions;
setting reduction targets for the maritime transport sector;
applying further measures, including market-based instruments, in the medium to long term.
Relating to the first of these three steps, the Commission proposed a Regulation48 of the European
47 Communication from the Commission to the European Parliament, the Council, the European Economic and Social
Committee and the Committee of the Regions: Integrating maritime transport emissions in the EU’s greenhouse gas
reduction policies. COM (2013) 479 final. 48 Proposal for a Regulation of the European Parliament and of the Council on the monitoring, reporting and
verification of carbon dioxide emissions from maritime transport and amending Regulation (EU) No 525/2013. COM
(2013) 480 final.

107
Parliament and of the Council establishing an EU-wide MRV system for large ships.
This proposal addresses emissions released by ships above 5,000 gross tons during their voyages from
the last port of call to a port under the jurisdiction of a Member State, and from a port under the
jurisdiction of a Member State regardless of their flag. According to the proposed Regulation, ship owners
will have to monitor and report the verified amount of CO2 emitted by their ships on voyages to, from
and between EU ports. Owners will also have to provide certain other information, such as data to
determine the ships’ energy efficiency. These rules are designed to support a staged approach towards
setting global energy efficiency standards for existing ships, as supported by several members of the
International Maritime Organisation, and it is proposed that they start applying from 1 January 2018.
An impact assessment of the economic effects on third countries of this proposal concluded that based on
the pass-through of costs and savings in maritime transport and on the price building mechanisms in
different sectors, measurable increases of commodity prices (with transport costs being only an
insignificant element of the commodities' prices) are expected to have minor effects49. In the impact
assessment, several policy options – from an MRV system to levies and to emission trading schemes –
were assessed.
Given the large cost-effective abatement potential of the sector, the above-mentioned emission
reductions would lead to net cost savings for the maritime transport sector. Other expected impacts are
the creation of additional jobs in ship yards and the maritime supply industry as well as health benefits
due to reduced emissions of SOX, NOX and particulate matter.
49 Impact Assessment – Part 1 Accompanying the document Proposal for a Regulation of the European Parliament
and of the Council on the monitoring, reporting and verification of carbon dioxide emissions from maritime transport
and amending Regulation (EU) No 525/2013. Commission staff working document SWD (2013) 237 final/2.

108
Table 4.14 - Summary of implemented policies and measures in the transport sector
PaMs number
Name of PAM Target and/or activity affected
GHG affected
Type of instrument
Status and
start year of
implementation
Implementing entity or entities TOTAL GHG Reduction
(kt CO2 eq.)
2020* 2030
16
Infrastructural measures -
Increase of high capacity
and high speed rail
networks
High Capacity and High Speed
rail. Regional networks for
passengers CO2 Planning
Implemented 2008
Ministry of transport 5700
-
17
National Strategic
Framework 2007-2013 -
FESR - increase public
transportation in urban
area
Intermodal infrastructure
projects: expansion of
metropolitan railways/ subway CO2 Planning
Implemented
2007 Ministry of transport 1280 -
18
Emission standard for new
car (Regulation (EC) No
443/2009)
Fleet update at 120 g CO2/km
in 2015 and 95 g CO2/km in
2020 CO2 Regulatory
Implemented 2008
Ministry of Economic Development
10200 -
19
Legislative decree
128/05(transposition of
directive 2003/30/EC) -
mandatory use of biofuels
Mandatory use biofuels (target
4.5% to 2012) CO2 Regulatory Implemented 2008
Ministry of Economic Development
1490 -
20
Legislative Decree
28/2011 (transposition of
directive 2009/28/EC) -
Mandatory use of biofuels
Mandatory use biofuels (target
10% to 2020) CO2 Regulatory Implemented 2014
Ministry of Economic Development
1580 -
Total effect of implemented policies
20250

109
Table 4.15 - Summary of planned policies and measures in the transport sector
PaMs number
Name of PAM Target and/or activity affected
GHG affected
Type of instrument
Status and
start year of
implementation
Implementing entity or entities TOTAL GHG Reduction
(kt CO2 eq.)
2020* 2030
43
Measure of promoting and
supporting the
development of charging
infrastructure
Transposition of DAFI
2014/94/EU directive define
and implement the plan for
the development of alternative
fuels infrastructure: electric
car charging stations and
natural gas filling stations.
(The impact is included in the
measures related in the
alternatives fuels vehicles)
CO2 Regulatory Planned 2017
Industries association and
local authorities
(Companies)
- -
44
Modal shift from private
cars to public buses and
walking
Modal shift of about 10% of
car transportation demand in
2030 to public transport, car-
pooling, bikes and walking
CO2 Planning
Planned
2017 Ministry of Transport 1310 4248
45
Promoting and supporting
renewal of car fleet with
low carbon fuels
Speed up the replacement of
vehicle fleet with new vehicles,
including CNG cars (up to 1.7
million), LPG cars (up to 2.7
million), CNG vans (up to 1
million).
CO2 Economic
Planned
2017
Ministry of Economic
Development 1220 3180

110
PaMs number
Name of PAM Target and/or activity affected
GHG affected
Type of instrument
Status and
start year of
implementation
Implementing entity or entities TOTAL GHG Reduction
(kt CO2 eq.)
2020* 2030
46
Promoting and supporting
renewal of car fleet with
electrical vehicles
Speed up the replacement of
car vehicle fleet with electric
cars up to about 3 million
vehicles.
CO2 Economic
Planned
2018
Ministry of Economic
Development, Ministry of
Finance (Government);
Municipalities (Local)
460 2372
47
Promoting and supporting
renewal of car fleet:
further expansion of
electrical vehicles
Increase the electrical vehicles
to more than 10% of fleet by
2030, including cars (0.8
million) and electric vans (0.5
millions) (The assessment of
the impact of this measure has
not been finalized yet because
the implementation involves
public and private resources.
It has still to be decided the
type of instrument and the
extent of public support)
CO2 Economic
Planned
2025
Ministry of Finance,
Ministry of Environment IE IE
48
Expansion of use of
biofuel over 10% of road
fossil fuels consumption,
including bio-methane
Biofuels promotion:
consumption in the transport
sector of bio-methane and
about advanced biofuels
through the conversion of
refineries and / or traditional
biodiesel plants (The
assessment of the impact of
this measure has not been
finalized yet because the
CO2 Economic Planned
2021
Ministry of Economic
Development, Ministry of
Finance

111
PaMs number
Name of PAM Target and/or activity affected
GHG affected
Type of instrument
Status and
start year of
implementation
Implementing entity or entities TOTAL GHG Reduction
(kt CO2 eq.)
2020* 2030
implementation involves public
and private resources. It has
still to be decided the type of
instrument and the extent of
public support)
49
Promotion of LNG in
transport
Expansion of LNG heavy duty
trucks up to 30% of the fleet
and LNG ships up to 50% of
total national fuel consumption
CO2 Fiscal
Planned
2018
Ministry of Economic
Development, Ministry of
Finance
160 1800
Total effect of planned policies
3150 11600

112
4.5 Policies in non-Energy Sectors
4.5.1 Industrial Processes
For the industrial processes sector, the reduction of N2O emissions in plants due to the production of
nitric acid has been taken into account. This measure can result in significant reductions in process
emissions from the industrial sector, with a relatively small cost.
In the production of nitric acid, the most advanced technology is provided by SCR (Selective Catalytic
Reduction) systems for the treatment of process gases, which has been installed by the main production
plants in Italy. This activity has been included in the Emission Trading Scheme starting from 2012.
Therefore, this measure has been included in the WM scenario.
Table 4.16 – Summary of policies and measures in the industrial processes sector
PaMs number
Name of PAM
Target and/or activity affected
GHG affected
Type of instrument
Status
and start
year of
implementation
Implementing entity or
entities
TOTAL GHG Reduction
(kt CO2 eq.)
2020
10
Reduction of
emissions of
N2O from
nitric acid
production
Significant
reductions in
process emissions
from nitric acid
production plants
due to the
application of BAT
(Best Available
Technology)
N2O Voluntary Implemented 2010
Industrial plant
740
Source: ISPRA
It is important to underline that the 36.5% of emissions of the “Manufacturing industries and
construction” for Italy are related to ESD sector.
4.5.2 Agriculture
In the last years, the role of agriculture in climate change mitigation has been emphasised. In this
context, the reform of the Common Agricultural Policy (CAP) has a relevant role. In 2008, the CAP has
been reinforced by the Health Check, which strengthens the gradual shift from a financial support linked
to production towards decoupled direct aids, through a strengthening of the rural development policy and
the increasing integration of environmental considerations, including climate change.
Therefore, payments for farmers consider the respect of environmental laws and other types of
legislation. Thus, the incentives for intensive production have reduced. On the other hand, main emission
reduction activities are predominantly or exclusively supported by two rural development measures: farm
modernisation (code 121) and agri-environment (code 214). Some activities support the modernisation of
farms through energy efficient equipment and buildings, and promoting biogas production50. This picture
has been also assessed by ISPRA in the 21 regional Rural Development Plans (RDPs), where measure
50 European Commission (2009), Commission staff working document. The role of European agriculture in climate
change mitigation. SEC (2009) 1093 final (http://ec.europa.eu/agriculture/climate_change/sec2009_1093_en.pdf)

113
code 214 is most likely to contribute with N2O emission reductions. In 2008, a report51 prepared by the
Ministry of Agriculture (MIPAAF) in the framework of the Rural Development Network has assessed
qualitatively the contribution of Rural Development Plans (RDPs) in terms of their mitigation potential.
Moreover, in 2009, the CAP Health Check targets have been included in the RDPs52. In 2010, some
general information on the number of RDPs that have considered climate change targets (15 RDPs) or all
6 Health Check targets (3 RDPs), is available53.
The reduction measures, which are presented below, have also been considered in CAP reforms,
characterized by a progressive reinforcement for integrating environmental legislation. A special attention
is given for example to the Nitrates Directive (monitoring of water quality; designation of nitrate
vulnerable zones; and, establishment of codes of good agricultural practice).
In 2013, political agreement on the reform of the CAP 2014-202054 was reached. The agreement
provides for an amendment to the payment ecological (greening). Between 2014 and 2020, over EUR
100 billion will be invested to help farming meet the challenges of soil and water quality, biodiversity and
climate change:
30% of direct payments will be linked to three agricultural practices beneficial for the climate and
environment: crop diversification (there is no obligation for diversification of crops for arable land less
than 10 hectares), maintaining permanent grassland (there is no obligation for arable land less than
15 hectares and for permanent crops) and conserving 5%, and later 7%, of areas of ecological
interest as from 2018 or measures considered to have at least equivalent environmental benefits.
At least 30% of the rural developments programmes' budget will have to be allocated to agri-
environmental measures, support for organic farming or projects associated with environmentally
friendly investment or innovation measures.
Agri-environmental measures will become agri-environment-climate payments and will be stepped up
to complement greening practices. These programmes will have to set and meet higher
environmental protection targets (guarantee against double funding).
According to the European Commission55, in the period up to 2020, the new CAP is going to invest around
EUR 37.5 billion (as a sum of total allocation of Direct Payments and Rural Development for the period
2014-2020) in Italy's farming sector and rural areas. This amount will be distributed between rural
development programs and direct payments as follows. In the period 2014-2020, the EU budget for
measures benefiting agricultural producers and the economy of its rural areas will be a total of around
EUR 10.4 billion (plus co-financing from public and private funds), increasing Italy's rural development
envelope compared to the period 2007-2013. The total budget available for direct payments in Italy for
the period 2014-2020 amounts to more than EUR 27 billion.
Although there are, by definition, differences in the Rural Development Programs (RDPs) priorities from
one region to another, from an analysis of the information reported in the 21 regional RDPs for 2014-
2020, most of the Italian regional programs are looking to target public support at enhancing the
51 MIPAAF (2008), “Il contributo dei piani di sviluppo rurale e della condizionalità alla mitigazione dei cambiamenti
climatici e al loro adattamento. Rete Rurale Nazionale 2007-2013 Italia”, November 2008 52 See the publication “The Contribution of Rural Development Programmes in Mitigating Greenhouse Gas Emissions in
Italy” Climate Change and the Sustainable Use of Water Resources - Climate Change Management 2012, pp 367-387 53 MIPAAF (2010), “Le nuove sfide della PAC e le misure di rilancio dell’economia nei programmi di sviluppo rurale
2007-2013 – Aprile 2010. Rete Rurale Nazionale 2007-2013” (www.reterurale.it) 54 http://ec.europa.eu/agriculture/cap-post-2013/index_en.htm 55 European Commission, 2016. CAP in your country: ITALY (https://ec.europa.eu/agriculture/cap-in-your-country_en)

114
competitiveness of agricultural production systems and of agro-industry enterprises; support investments
in sustainable energy; promote climate change adaptation and protecting the environment and increasing
the quality of life and economic diversification in rural areas56. In particular, considering the measures
planned to achieve the objectives of “reducing greenhouse gas and ammonia emissions from agriculture”
and “fostering carbon conservation and sequestration in agriculture and forestry”, established by the
European Commission, 15 RDPs supported investments in knowledge transfer and information actions
(art. 14 of European Regulation N. 1305/2013), 13 RDPs have provided support to advisory services,
farm management and farm relief services (art 15 of European Regulation N. 1305/2013) and 3 RDPs
have explicitly indicated the objective of reducing greenhouse gas and ammonia gas emissions (measure
related to investments in physical assets – art 17 of European Regulation N. 1305/2013)57. Regarding the
measure on agro-climate-environmental payments (art. 28 of European Regulation N. 1305/2013), aimed
at preserving and promoting the necessary changes in agricultural practices that contribute favourably to
the environment and the climate, Emilia Romagna, Lombardy and Piedmont regions have planned
investments concerning the distribution of livestock effluents, aimed at reducing ammonia emissions;
while Lazio and Umbria have planned a measure to maintain/increase the organic matter of the soil
through the use of organic additives with valuable organic matter58.
Emissions of nitrous oxide from agricultural soil: emission reduction from the Agricultural soil
source is mainly related to the rationalisation in the use of fertilizers. RDPs 2007-2013 are contributing
with this emission reduction measure (code 214). In order to achieve the objective, it is essential to
consider ongoing efforts to raise awareness on the code of agricultural practice (such as fertiliser
application limits and spreading conditions, manure storage methods, livestock density limits and crop
rotation requirements), and the integrated production of agricultural property and organic farming.
However, when considering organic farming59 as an instrument for climate change mitigation, both the
amount of emission per hectare and per unit of production have to be considered60. RDPs 2014-2020 are
contributing through this emission reduction measure (Agri-environment-climate - art. 28 of European
Regulation N. 1305/2013).
Emissions of methane from manure management: electricity generation from animal waste has
increased in Italy up to 1067.2 GWh in 2015, marking an increase of 8% with respect to 2014 (almost 5
times the value of 2010), thanks to the support provided by the feed-in prices granted by Resolution no.
6/92 of the Inter-ministerial Price Committee (CIP 6/92) and the renewable quota obligation for
electricity producers/importers established by the Legislative Decree of March 16, 1999, No. 79, and
subsequent legislations.
56 See note 22 57 ISMEA/RRN (2017), “Analisi dei bandi regionali per gli interventi che concorrono alla realizzazione delle Focus Area 5D e 5E” (http://www.reterurale.it/flex/cm/pages/ServeBLOB.php/L/IT/IDPagina/16780) 58 See note 24 59 Some studies show contrasting results of emissions per unit of product in organic farming, particularly regarding
methane. A German study (referenced by PICCMAT final report) shows lower GHG emissions per unit of product in
organic farming than conventional methods for wheat, pig and milk production, while results for beef production are
more ambiguous due to the variety of production system. 60 European Commission (2009), Commission staff working document. The role of European agriculture in climate
change mitigation. SEC (2009) 1093 final (http://ec.europa.eu/agriculture/climate_change/sec2009_1093_en.pdf)

115
Moreover, as established by Ministerial Decree of 18 December 2008, the Ministry of Economic
Development has approved incentives for the production of electric power from renewable energy. A
special tariff (called “All-Inclusive Feed-In Tariff”) for small agro-energetic facilities (in operation after
31/12/2007) of less than 1 MW feed with biogas, biomass or vegetal oil, has been fixed. Instead, for
facilities of more than 1 MW a multiplying factor of 1.8 for estimating green certificates is contemplated,
specifically for facilities using agricultural biomass. In section 4.4 (renewable energy sources), the recent
legislation on these issues is described. In 2015, methane from biogas recovery has contributed to
reduce methane emissions from manure management by 18%. Further intervention may be required for
the coming years in order to sustain this trend, and to extend the covering of animal waste storage
systems, equipped with devices allowing collection and use of biogas, not only to new farms but also to
major existing ones.
Table 4.17 – Summary of policies and measures in the agriculture sector
PaMs number
Name of PAM
Target and/or activity affected
GHG affected
Type of instrument
Status and
start year of
implementation
Implementing entity or entities
TOTAL GHG Reduction (Mt CO2
eq.)
2020
21 Nitrogen fertilizer
Rationalization in the use of nitrogen fertilizer
N2O Regulatory Implemented 2007
Ministry of Agriculture
790
22 Animal storage
Recovery of biogas from animal storage system
CH4 Regulatory Implemented 2007
Ministry of Agriculture
400
Source: ISPRA
4.5.3 Waste sector
Emissions reduction in the waste sector is mainly related to the improvement of waste management
regarding the composition of waste disposed to landfills. In fact, the Landfill European Directive
1999/31/EC has been transposed at the national level by Legislative Decree 13 January 2003 n. 36 and
applied to Italian landfills since July 2005, although the effectiveness of the policies will be significant in
the future. This implies a continuous updating of the regulatory system. Consequently, in the following
years, the Ministry of the Environment has issued some decrees (Legislative Decree 30 December 2008,
n. 208 and Ministerial Decree 25 June 2015) on the waste acceptance criteria in landfills since the
composition of these waste is strongly changed and is still evolving.
For the waste sector two measures are proposed:
Compliance with separate collection targets and biodegradable waste disposed to landfills:
o fulfilment of the deadlines set for MSW separate collection;
o fulfilment of the deadlines set for biodegradable waste sent to landfill.
Only bio-stabilized waste disposed to landfills: a further measure regards the pre-treatment of all
the biodegradable wastes which will be disposed to landfills, encouraging the anaerobic digestion
of MSW also in co-digestion with other type of waste such as sludge from municipal waste water
treatment plants and animal waste. This practice will also increase the energy recovery from the
biogas production.

116
Table 4.18 - Summary of policies and measures in the waste sector
PaMs number
Name of PAM
Target and/or activity affected
GHG affected
Type of instrument
Status and
start year of
implementation
Implementing entity or
entities
TOTAL GHG Reduction (Mt CO2
eq.)
2020
23
Increase
separate
collection
of urban
waste
Compliance with
separate collection
targets and
reduction of
biodegradable waste
disposed of into
landfills
CH4 Regulatory Implemented
2008 Regions 3700
Source: ISPRA
4.5.4 Land use, land-use change and forestry (LULUCF)
The emissions and removals from LULUCF sector are excluded from Effort Sharing Decision n.
406/2009/EC.
Based on an agreement by the Council and the European Parliament, Decision n. 529/2013/EU sets out
accounting rules and information concerning actions applicable to GHG emissions and removals from the
LULUCF sector, with the aim of a future inclusion of the LULUCF sector in the Union’s emission reduction
commitment. Decision 529/2013/EU also requires Member States to draw up and transmit to the
Commission information on their current and future LULUCF actions to limit or reduce emissions and
maintain or increase removals resulting from the activities referred to in Article 3.1, 3.2 and 3.3 of
abovementioned Decision (Afforestation, Reforestation and Deforestation (ARD), Forest Management
(FM), Cropland Management (CM), Grazing Land Management (GM), Wetland Drainage and Rewetting
(WDR), and Revegetation (RV)). This Decision provides for accounting rules applicable on a mandatory
basis to the activities of afforestation, reforestation, deforestation and forest management, as well as to
the activities of grazing land management and cropland management, subject to specific provisions with
a view to improving Member States’ reporting and accounting systems during the first accounting period
(2013-2020). This Decision also provides for accounting rules applicable on a voluntary basis to
revegetation and wetland drainage and rewetting activities. National reports and other information
related to LULUCF actions submitted following the abovementioned Decision are publicly available on the
web-repository of the EU GHG Monitoring Mechanism Regulation (MMR)61.
In 2016, the European Parliament and the Council have released a proposal for the inclusion of emissions
and removals from LULUCF into the 2030 climate and energy framework. The objective of the
abovementioned proposal is to determine how the LULUCF sector will be included into the EU climate
policy framework, as of 2021; up to this date, constraints for the EU and each Member State on this
sector are provided by the Kyoto Protocol. The key point of the proposed LULULCF regulation is the “no-
debit rule”: for the period from 2021 to 2025 and from 2026 to 2030, each Member State shall ensure
that emissions do not exceed removals, calculated as the sum of total emissions and removals on their
61 http://cdr.eionet.europa.eu/it/eu/mmr/lulucf/

117
territory in the land accounting categories (i.e. afforested land, deforested land, managed cropland,
managed grassland, managed forest land). In addition, the proposed Effort Sharing Regulation includes a
new “flexibility” which allows for a limited use of net removals from certain LULUCF accounting
categories, while ensuring no debits occur in the LULUCF sectors, to account for Member State
compliance towards the targets in the non-ETS sectors if needed. The proposed cap, for Italy, is about 11
Mt for the entire period 2021-2030.
In the following paragraphs, a description of the LULUCF sector in Italy is given.
Definition of forest and national circumstances
Under the Kyoto Protocol reporting, forest is defined by Italy using the same definition applied by the
Food and Agriculture Organization of the United Nations for its Global Forest Resource assessment (FAO
FRA 2000). This definition is consistent with definition given in Decision 16/CMP.1. Forest is a land with
following threshold values for tree crown cover, land area and tree height:
a. a minimum area of land of 0.5 hectares;
b. tree crown cover of 10 per cent;
c. minimum tree height of 5 meters.
Forest roads, cleared tracts, firebreaks and other open areas within the forest as well as protected forest
areas are included in forest. Plantations, previously not included in areas subject to art. 3.3 and 3.4
activities of the Kyoto Protocol, have been classified as forest and reported under the appropriate KP-
LULUCF activities.
Total forest area, in 2015, was equal to 9,305 kha, equal to about 30% of the national territory.
A steady increase since the 70’s has to be noted: forest expansion rate was about 78 kha y-1 in 2000 and
it was 53.8 kha y-1 in 2010. Concerning ownership, the following table shows the amount of public and
private forest land.
Table 4.19 - Amount of public and private forest land
FRA 2015 Categories62
Forest area (1000 hectares)
1990 2000 2005 2010
Public ownership 2,549 2,811 2,942 3,032
Private ownership 5,041 5,558 5,817 5,996
...of which owned by individuals 4,442 4,898 5,126 5,284
...of which owned by private business entities and institutions
599 660 691 712
...of which owned by local communities 0 0 0 0
...of which owned by indigenous / tribal communities 0 0 0 0
Other types of ownership 0 0 0 0
TOTAL 7,590 8,369 8,759 9,028
62 FAO FRA 2015, Italy Country report: http://www.fao.org/3/a-az245e.pdf

118
Elected activities under Article 3.4 of the Kyoto Protocol
Italy has elected cropland management (CM) and grazing land management (GM) as additional activities
under Article 3.4. Following the Decision 2/CMP.7, forest management (FM) has to be compulsorily
accounted as an activity under Article 3.4, for the second Commitment Period of the Kyoto Protocol
(2013-2020).
According to the latest submission under the Kyoto Protocol, the annual average estimate of net
removals related to activities under art. 3.3 is equal to 6.29 MtCO2.
Afforestation and reforestation areas have been estimated on the basis of data from the Italian National
Forest Inventories (IFN1985, IFNC2005 and the on-going INFC2015). Deforestation data have been
detected by the surveys carried out in the framework of the NFIs (with reference to the years 2005 and
2012); administrative records at NUT2 level collected by the National Institute of Statistics related to
deforested area have been used for the period 1990-2005.
The definition of forest management is interpreted in using the broader approach as described in the
2013 Revised Supplementary Methods and Good Practice Guidance Arising from the Kyoto Protocol (2013
KP Supplement, IPCC, 2014). All forests fulfilling the definition of forest, as given above, are considered
as managed and are under forest management. The total Italian forest area is eligible under forest
management activity, since the entire Italian forest area has to be considered as managed forest lands.
Concerning deforestation activities, in Italy land use changes from forest to other land use categories are
allowed in very limited circumstances, as stated in art. 4.2 of the Law Decree n. 227 of 2001.
Lands subject to cropland management activity are consistent with the cropland lands in the UNFCCC
reporting. CM data have assessed on the basis of the inventory of land use (IUTI63) data. The same
activity data deduced for UNFCCC reporting (cropland category) were therefore used to report for
cropland management.
Land subject to grazing land management have been assessed on the basis of the definition included in
the Annex to the decision 16/CMP.164. Lands under GM in Italy are those predominantly covered by
herbaceous vegetation (introduced or indigenous) for a period longer than five years, used for grazing or
fodder harvesting and /or under practices to control the amount and type of vegetation. In the latest
national GHG inventory submission, only the area related to the ‘improved grazing land’ has been
reported; this area corresponds to lands subject to inspections and certifications procedures, in
accordance with the EU Regulations65 on organic production, as well as by the Rural Development
Regulations related to the organic farming measure. Data of grazing lands managed with organic
practices has been derived from the National System on Organic Farming (SINAB, http://www.sinab.it/)
of the Ministry of Agriculture, Food and Forest Policies (MIPAAF).
63 Detailed description of IUTI is included in the 2017 National Inventory Report, Annex 10: http://unfccc.int/national_reports/annex_i_ghg_inventories/national_inventories_submissions/items/10116.php 64 Grazing land management is the system of practices on land used for livestock production aimed at manipulating the amount and type of vegetation and livestock produced. 65 Commission Regulation (EC) n. 889/2008: http://eur-lex.europa.eu/legal-content/EN/TXT/PDF/?uri=CELEX:32008R0889&from=EN; Council Regulation (EC) n. 834/2007: http://eur-lex.europa.eu/legal-content/EN/TXT/HTML/?uri=URISERV:f86000&from=IT; Council Regulation (EEC) n. 2092/91: http://eur-lex.europa.eu/LexUriServ/LexUriServ.do?uri=CELEX:31991R2092:EN:HTML 65 Regulation (EEC) n. 2078/92: http://ec.europa.eu/agriculture/envir/programs/evalrep/text_en.pdf; Council Regulation (EC): n. 1257/1999 http://eur-lex.europa.eu/legal-
content/EN/TXT/PDF/?uri=CELEX:31999R1257&from=en; Council Regulation (EC) n. 1698/2005: http://eur-lex.europa.eu/legal-content/EN/TXT/PDF/?uri=CELEX:32005R1698&from=en; Regulation (EU) n. 1305/2013: http://eur-lex.europa.eu/LexUriServ/LexUriServ.do?uri=OJ:L:2013:347:0487:0548:EN:PDF

119
Article 3.3
Changes in forest area were detected on the basis of national forest inventories data.
The following afforestation/reforestation activities that occurred or could have occurred on or after 1990
are included in the reporting of these activities:
planted or seeded croplands;
planted or seeded grasslands;
abandoned arable lands which are naturally forested, through planting, seeding and/or the
human-induced promotion of natural seed sources.
In Italy, all land use categories (cropland, grazing land, forest) are to be considered as managed;
therefore, any land use change occurs between managed lands and, consequently, is direct human-
induced. Afforested/reforested areas are to be considered legally bound by national legislation. Extensive
forest disturbances have been rare in Italy, except for wildfires. Land-use changes after damage do not
occur; concerning wildfires, national legislation (Law n. 353 of 2000, art.10.1) doesn’t allow any land use
change after a fire event for 15 years. Harvesting is regulated through regional rules, which establish
procedures to follow in case of harvesting. Although different rules exist at regional level, a common
denominator is the requirement of an explicit written communication with the localization and the extent
of area to be harvested, existing forest typologies and forestry treatment. Concerning deforestation
activities, in Italy land use changes from forest to other land use categories (i.e. in construction of
railways the last years) are allowed in very limited circumstances, as stated in art. 4.2 of the Law Decree
n. 227 of 2001, and have to follow several administrative steps before being legally permitted. In
addition, the clear-cutting practice is not allowed (Law Decree n. 227 of 2001, art. 6.2).
Article 3.4
The whole forest area in 1 January 1990 was under forest management, since Italy considers all forest
land managed, and, therefore, human-induced.
Italian forest resources are totally legally bound; the two main constraints, provided by the laws n. 3267
of 1923 and n. 431 of 1985, compel private and public owners to strictly respect limitations concerning
use of their forest resources. As a matter of fact, each exploitation of forest resources must not
compromise their perpetuation and, therefore, any change of land use is forbidden, for hydro-geological,
landscape and environmental protection (the same limitations apply also to burnt areas, following the law
n. 353 on forest fires approved in 2000). Consequently, unplanned cuttings are always forbidden, and
local prescriptions fix strict rules to be observed for forestry.
For the second Commitment Period of the Kyoto Protocol, Italy has submitted information on Forest
Management Reference Level (FMRL66), as required by the Decision 2/CMP.6. The FMRL is the averages
of the projected forest management (FM) data series for the period 2013-2020, taking account of policies
implemented before mid-2009, with emissions/removals from harvested wood product (HWP) using the
66 Submission of information on forest management reference levels by Italy: http://unfccc.int/files/meetings/ad_hoc_working_groups/kp/application/pdf/awgkp_italy_2011.pdf Communication of 11 May 2011 regarding harvested wood products value by Italy: http://unfccc.int/files/meetings/ad_hoc_working_groups/kp/application/pdf/awgkp_italy_corr.pdf

120
first order decay functions (A), and assuming instant oxidation (B). When constructing the FMRL, for
Italy, the following elements were considered:
a. removals or emissions from forest management as shown in GHG inventories and relevant
historical data:
The historical data used for the calculation of the FMRL come from Italy’s 2011 national inventory report
submission. GHG emissions and removals from FM are provided from 1990 to 2008 for living biomass
(above- and below-ground), dead organic matter and GHG emission sources (i.e. forest wildfires). The
FMRL includes above- and below-ground biomass and dead organic matter, which is consistent with pools
reported in the GHG inventory.
b. age-class structure:
the used age structure is based on the latest national forest inventory (INFC 2005), which shows that
most even-aged forests in Italy are within the 21–80-year age classes, with the majority being between
21–40 years.
c. forest management activities already undertaken:
indirectly considered through the use of the latest available forest time series data (from national forest
inventory and other country statistics), and the estimation of the evolution of harvest demand by 2020
based on macroeconomic drivers and policies and legislative provisions adopted by April 2009. These
policies are those included in the baseline scenario of the EU model PRIMES, which is the starting point of
the projections for the FMRL. Policies adopted after 2009 are factored out.
d. projected forest management activities under business as usual:
through the estimation of the evolution of harvest demand by 2020 based on macroeconomic drivers and
the application of policies implemented by April 2009 and legislative provisions adopted by April 2009.
e. continuity with the treatment of forest management in the first commitment period:
Italy has elected forest management among the additional activities of art. 3.4 under the Kyoto Protocol
for the first CP, and FM is a mandatory reporting requirement for the second CP.
With regards to pools and gases included in the reference level, aboveground and belowground biomass,
dead organic matter and HWP are included in the FMRL. Non-CO2 GHGs from forest wildfires are also
included in the submission. Italy has decided not to account for the soil carbon stock changes from
activities under Article 3.4, providing transparent and verifiable information to demonstrate that soils
pool is not a source in Italy, as required by par. 21 of the annex to decision 16/CMP.1.
Italy is one of the member States of the EU for which the JRC of the European Commission developed
projections in collaboration with two EU modelling groups:
• G4M, from the International Institute for Applied Systems Analysis (IIASA)
• EFISCEN (European Forest Information Scenario Model) from the European Forest Institute (EFI)
The projection provided annual estimates of emissions and removals for forest management up to 2020
for the above- and below-ground biomass carbon pools. The G4M model relies on spatial data, provided
by Italy. The main forest and forest management parameters (e.g. age-class structure, increment and
historical harvest) were taken from NFIs. EFISCEN uses as data input the forest area data from NFIs
scaled to match the forest area reported in the national inventory report (the forest land remaining forest
land area, from which the deforested area is deducted, and the forest management area) and provides

121
projections on basic forest inventory data (stem wood volume, increment, age-class structure, as well as
carbon in forest biomass and soil.
To estimate the FMRL, the emissions and removals estimated by the models for the time series 2000 to
2020 were calibrated/adjusted using historical data from the Party for the period 2000–2008. In this
post-calibration, a constant offset is added to models’ results for 2000–2020 to match the average
historical data provided by each country for the period 2000–2008 to ensure consistency with national
historical data in terms of the absolute level of emissions and removals and coverage of pools and gases.
Future harvest demand under a ‘business as usual’ scenario was derived from macroeconomic drivers
(e.g. gross domestic product, population) and policies enacted in Italy. This information is used as data
input to the GLOBIOM (Global Biomass Optimization Model) model, which projects demand for timber.
Italy’s projected harvesting rate (for both timber and fuel wood) is 16,879,000 m3 by 2020.
Only biomass pools and emissions from biomass burning have been projected assuming a constant net
change, for the period 2009–2020, equivalent to the historical average change reported for the period
2000–2008. Policies and measures that were implemented before mid-2009 have been considered in
Italy’s FMRL. Continuation of current forest management regarding timber is assumed.
All energy policies implemented at the EU and national levels are taken by the PRIMES model as input
values for estimating wood fuel demand driven by these policies, combined with the expected global
market effects (for the GLOBIOM model). The future demand for wood for material use (i.e. timber not
bioenergy) is projected by GLOBIOM as compared to a base year (2000) based on GDP and population
growth, which drive demand for timber. Outputs of PRIMES and GLOBIOM are further used as input to
estimate emissions related to HWP pool. Although forest management policies are not used by models as
input parameters, the impact of these policies is integrated in the projection process through increment
and harvesting rates, and changes in age-class structure. Wood energy demand is derived from an
analysis of country-specific policies implemented by April 2009. The increase of harvesting rates for wood
for energy will result in more intensive forest management, moving toward the lower rotation lengths of
the ranges provided.
The FMRL has been subjected to a technical assessment (TA), carried out by UNFCCC expert, and the
FMRL value has been inscribed in the Appendix to Decision 2/CMP.7. The FMRL for Italy is equal to -
22,166Mt CO2 eq. per year applying a first-order decay function for harvested wood products (HWP) and
to –21,182 Mt CO2 eq. per year assuming instantaneous oxidation of HWP.
According to Decision 2/CMP.7, methodological consistency between the FMRL and reporting for forest
management during the second commitment period of the Kyoto Protocol has to be ensured, applying
technical correction if necessary. Therefore, to ensure methodological consistency between the FMRL and
reporting for Forest Management during the second commitment period, Italy is going to apply a
technical correction, consistently with the requirements of decision 2/CMP.7, annex, paragraph 14 and
guidance of the 2013 KP Supplement (IPCC, 2014, par. 2.7.6.3).
Methods for carbon stock change and GHG emission and removal estimates
Methods for estimating carbon stock changes in forests (for Article 3.3 afforestation/reforestation and
Article 3.4 forest management) are the same used for the UNFCCC GHG inventory: a growth model, For-
est67, is used to estimate the net change of carbon in the reporting pools: aboveground and belowground
67 Federici S, Vitullo M, Tulipano S, De Lauretis R, Seufert G, 2008. An approach to estimate carbon stocks change in

122
biomass, dead wood and litter, and soils as soil organic matter. Additional information on the
methodological aspects may be found in “Federici et al., 2008”; some specific parameters (i.e. biomass
expansion factors, wood basic densities for aboveground biomass estimate, root/shoot ratios) used in the
estimation process are the same reported in the above-mentioned article; in other cases (i.e. dead wood
or litter pools), different coefficients have been used to deduce the carbon stock changes in the pools, on
the basis of the results of the II National Forestry Inventory and according to the national definition of
forest. The model has been applied at regional scale (NUTS2) because of the availability of forest-related
statistical data: model input data for the forest area, per region and inventory typologies, were the
Italian forest inventories (NFI1985, NFI2005), while the results of the first phase of the NFI2015 were
used in forest area assessment. Following the main findings of 2011 UNFCCC review process, Italy has
decided not to account for the soil carbon stock changes from activities under Article 3.4, providing68
transparent and verifiable information to demonstrate that soils pool is not a source in Italy, as required
by par. 21 of the annex to decision 16/CMP.1. Concerning carbon stock changes resulting from
deforestation activities, due to a lack of detailed information on the land use of the deforested area, a
conservative approach was applied, assuming that the total deforested area is converted into
settlements. Carbon stock changes related to the forest land areas, before deforestation activities, have
been estimated, for each year and for each pool (living biomass, dead organic matter and soils), on the
basis of forest land carbon stocks deduced from the model For-est. In addition, it should be noted that
land use changes due to wildfires are not allowed by national legislation (Law Decree 21 November 2000,
n. 353, art.10, comma 1). The loss, in terms of carbon, due to deforested area is computed assuming
that the total amount of carbon, existing in the different pools before deforestation, is lost.
GHG emissions from biomass burning have been estimated for forest fires and for fires affecting cropland
and grassland areas. In particular, emissions from forest fires have been calculated on the basis of a
detailed database, collecting data related to any fire event occurred in Italian regions, reporting, for each
fire event, the burned area, the forest typology (27 classes in line with the NFI nomenclature), the scorch
height [m] and the fire’s type (crown, surface or ground fire).
Methods for estimating carbon stock changes for lands subject to cropland management activity are the
same as those used for the UNFCCC greenhouse gas inventory: details are given in the National
Inventory Report (ISPRA, 2017, par. 6.3.4). In line with the 2013 KP Supplement (IPCC, 2014) and 2006
IPCC Guidelines (IPCC, 2006), carbon stock changes have been estimated only for the living biomass of
perennial woody crops, on the basis of carbon gains and losses, computed applying a value of biomass C
stock at maturity. Tier 1 method has been followed for dead wood and litter, assuming that the
abovementioned pools are at equilibrium, and no carbon stock changes are occurring. Soils carbon stock
changes have been assessed to be not occurring, as no management changes can be documented. CO2
emissions from cultivated organic soils subject to CM activity have been estimated, based on activity data
FAOSTAT database69.
Carbon stock changes related to land subject to grazing land management have been estimated,
assuming no changes in carbon stocks in the living biomass pool, as well as for dead wood and litter
forest carbon pools under the UNFCCC: the Italian case. iForest 1: 86-95 URL: http://www.sisef.it/iforest/ 68 ISPRA, 2017. National Inventory Report 2017 – Italian greenhouse gas inventory 1990-2015. ISPRA 69 The area of cultivated organic soils have been assessed through the stratification of different global datasets: - the area covered by organic soils have been defined by extracting the Histosols classes from the Harmonized World Soil Database; - the cultivated area has been identified from the global land cover dataset, GLC2000, using the three “cropland” classes.

123
pools, further assuming that the above-mentioned pools are at equilibrium. Changes in carbon stocks in
mineral soils have been estimated on the basis of country specific SOCref70.
National Registry for forest carbon sinks
Several activities have been implemented and carried out in the framework of the national registry for
carbon sinks; the inventory of land use (IUTI) has been completed, resulting in land use classification, for
all national territory, for the years 1990, 2000, 2008 and 2012. Time series related to the areas to be
included into the different IPCC categories have been assembled using IUTI data, and the data assessed
by the national forest inventories (1985, 2005, 2012). Verification and validation activities have been
undertaken and the resulting time series have been discussed with the institutions involved in the data
providing (i.e. National Forest Service, Ministry of Agricultural, Food and Forestry Policies (MIPAAF),
Forest Monitoring and Planning Research Unit (CRA-MPF)).
Concerning deforestation activities, an ad hoc survey carried out in the framework of the NFIs (with
reference to the years 2005 and 2012) has allowed the assessment of the deforestation. Also, the
estimation of non-CO2 emissions from forest fires have been modified, taking into account the fire
intensity (assessed through the scorch height) and the forest typologies affected by fire.
4.6 Costs analysis
An ex-post assessment of the costs of implemented policies and measures is available in the “Progress
report under art. 22 of the 2009/28/EU directive” (see paragraph 4.1.7). In the tables below are reported
the main results for the Heating Account, White Certificaates and Tax deduction policies.
Table 4.20 Summary of overall results in the years 2013-2014 for the Thermal/Heat Account
Number of incentives 2013-2014
MEUR
Public administrations 4.3 Private parties
24.48
TOTAL 28.78
Source: GSE
70 The assessment of the country specific SOCref has been carried out using the following layers: Climatic Zone layer, Corine Land Cover 2006, italian soil map (Costantini et al., 2013). The country specific SOCref have been stratifies into three macroareas in Italy: north (78.5 t C ha-1), center (71.3 t C ha-1) and south (46.2 t C ha-1).

124
Table 4.21 Summary of overall results in the years 2009-2014 for the White Certificates
Average price
of EES (EUR/EES) 71
Total annual support (EUR)
Reference year Solar collectors
Electrical heat
pumps
Small cogeneration
systems for space heating and
cooling
District heating systems
Centralised heating and
cooling systems
2014 108.18 1 021 03 2 380 1 076 961 10 832 141 9 433 985
2013 101.41 2 034 082 1 521 1 781 46 19 894 005 7 166 340
2012 92.88 21 880 578 37 988 1 151 433 5 649 519 2 903 893
2011 95.49 4 141 497 25 687 2 026 011 20 252 570 1 023 366
2010 85.14 3 195 730 4 421 219 917 1 705 184 596 831
2009 74.46 2 257 627 0 0 0 0
Source: GSE
Table 4.22 Tax deductions of 55-65% by type of project (EUR)
2010 2011 2012 2013
Solar panels for hot water production (Article
1(346) of Law No 296/2006)
194.000.000
115.600.000
88.000.000
106.000.000
Replacement of space heating systems (estimate
limited to the use of RES systems)
(Article 1(347) of Law No 296/2006)41
91.659.480
55.890.710
62.684.639
92.800.265
Source: GSE
About planned measures a preliminary aggregate assessment is reported in the 2017 National Energy
Strategy:
Energy efficiency 110 billion euros;
Renewable energy 35 billion euros;
networks and infrastructures 30 billion euros.
4.7 Summary of policies and measures
A summary of implemented and planned measures are reported in the tables below.
71 White Certificates: Energy Efficiency Titles - EETs

125
Table 4.23- Summary of implemented policies and measures – CO2
PaMs
number Name of PAM
Target and/or activity
affected
GHG
affected
Type of
instrument
Status and
start year of
implementa
tion
Implementing
entity or
entities
TOTAL GHG
Reduction
(kt CO2 eq.)
2020 2030
8 Eco-design of energy-using
products - Legislative decree
201/07 (transposition of
directive 2005/32/EC- first
regulations)
Installation of highly efficient
electric motors and inverters
through minimum mandatory
standards
CO2 Regulatory Implemented 2008
Italian Regulatory
Authority for
Electricity Gas
and Water
1920 -
11 Building Regulation (Legislative
decree 192/05 as amended by
legislative decree 311/06)
Minimum mandatory standards
on new and existing buildings
(Energy Efficiency)
CO2 Regulatory Implemented 2006
Municipalities,
Ministry of
Economic
Development;
3610
-
12 Tax deduction for energy saving
in buildings - Budget law 2007,
Budget law 2008 and Budget
law 2009
Supporting energy savings in
existing buildings through tax
deduction of 55%
CO2 Fiscal Implemented 2008
Ministry of
Finance
1050
-
14 Legislative decree 201/07
(transposition of directive
2005/32/EC) - Increase
efficiency of appliances in
residential sector
First regulation on mandatory
energy efficiency standards for
energy-using products
CO2 Regulatory Implemented 2008
Ministry of
Economic
Development 2600
-
16 Infrastructural measures -
Increase of high capacity and
high speed rail networks
High Capacity and High Speed
rail. Regional networks for
passengers
CO2 Planning Implemented 2008
Ministry of transport
5700
-

126
PaMs
number Name of PAM
Target and/or activity
affected
GHG
affected
Type of
instrument
Status and
start year of
implementa
tion
Implementing
entity or
entities
TOTAL GHG
Reduction
(kt CO2 eq.)
2020 2030
18 Emission standard for new car
(Regulation (EC) No 443/2009)
Fleet update at 120 g CO2/km
in 2015 and 95 g CO2/km in
2020
CO2 Regulatory Implemented 2008
Ministry of Economic Development
10200
-
19 Legislative decree
128/05(transposition of
directive 2003/30/EC) -
mandatory use of biofuels
Mandatory use biofuels (target
4.5% to 2012)
CO2 Regulatory Implemented 2008
Ministry of Economic Development
1490
-
20 Legislative Decree 28/2011
(transposition of directive
2009/28/EC) - Mandatory use
of biofuels
Mandatory use biofuels (target
10% to 2020)
CO2 Regulatory Implemented 2014
Ministry of Economic Development
1580
-
24
Minimum requirements
for building (Inter-
ministerial decree June
26th, 2015)
Application of the minimum energy
performance requirements for
buildings. These requirements apply to
public and private buildings, whether
they are new buildings or existing
buildings subject to restructuring
CO2 Regulatory
Implemented
2015
Ministry of
Economic
Development
4000
Total effect of implemented
policies
28150 4000

127
Table 4.24- Summary of implemented policies and measures – N2O
PaMs number
Name of PAM
Target and/or activity affected
GHG affected Type of
instrument Status
Implementing entity or entities
TOTAL GHG Reduction (kt CO2 eq.)
2020
10
Reduction of emissions of N2O from nitric acid production
Significant reductions in process emissions from nitric acid production plants due to the application of BAT (Best Available Technology)
N2O Voluntary Implemented 2010
Industrial plant 740
21 Nitrogen fertilizer
Rationalization in the use of nitrogen fertilizer
N2O Regulatory Implemented 2007
Ministry of Agriculture 790
Total effect of implemented policies
1530
Table 4.25- Summary of implemented policies and measures – CH4
PaMs number
Name of PAM
Target and/or activity affected
GHG affected Type of
instrument Status
Implementing entity or entities
TOTAL GHG Reduction (kt CO2 eq.)
2020
22 Animal storage
Recovery of biogas from animal storage system
CH4 Regulatory Implemented 2007
Ministry of Agriculture 400
23
Increase separate collection of urban waste
Compliance with separate collection targets and reduction of biodegradable waste disposed of into landfills
CH4 Regulatory Implemented 2008
Regions 3700
Total effect of implemented policies
4100
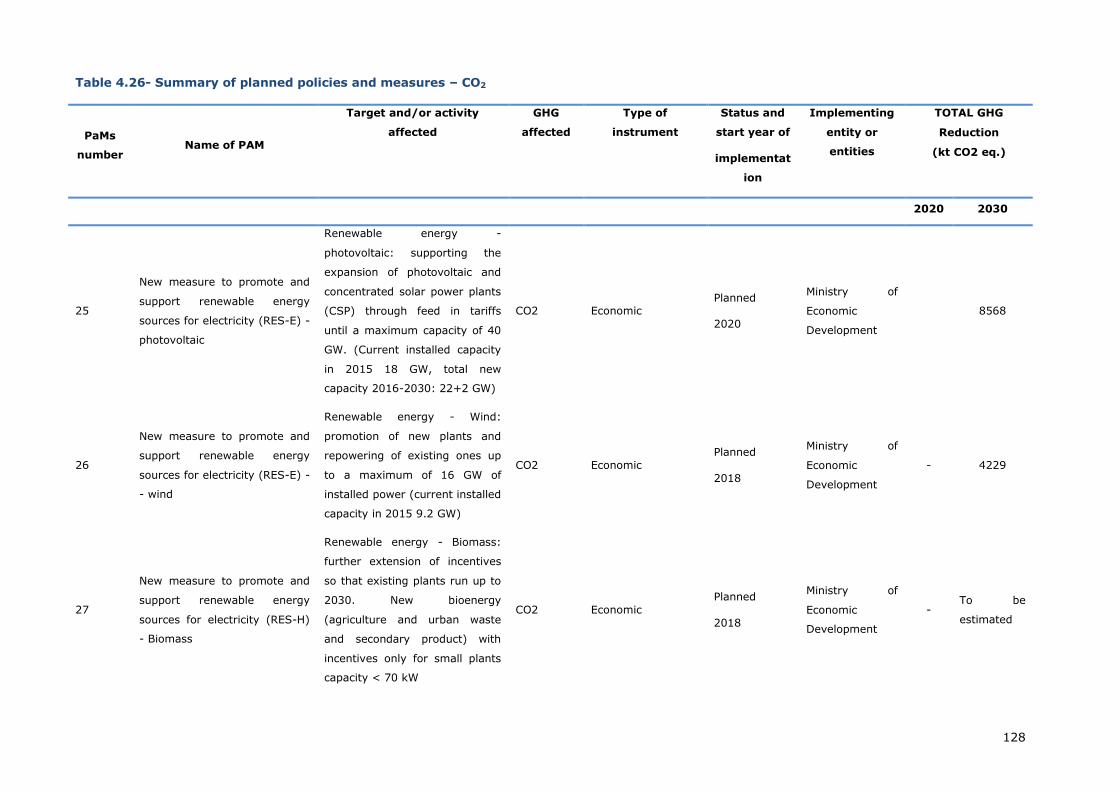
128
Table 4.26- Summary of planned policies and measures – CO2
PaMs
number Name of PAM
Target and/or activity
affected
GHG
affected
Type of
instrument
Status and
start year of
implementat
ion
Implementing
entity or
entities
TOTAL GHG
Reduction
(kt CO2 eq.)
2020 2030
25
New measure to promote and
support renewable energy
sources for electricity (RES-E) -
photovoltaic
Renewable energy -
photovoltaic: supporting the
expansion of photovoltaic and
concentrated solar power plants
(CSP) through feed in tariffs
until a maximum capacity of 40
GW. (Current installed capacity
in 2015 18 GW, total new
capacity 2016-2030: 22+2 GW)
CO2 Economic Planned
2020
Ministry of
Economic
Development
8568
26
New measure to promote and
support renewable energy
sources for electricity (RES-E) -
- wind
Renewable energy - Wind:
promotion of new plants and
repowering of existing ones up
to a maximum of 16 GW of
installed power (current installed
capacity in 2015 9.2 GW)
CO2 Economic
Planned
2018
Ministry of
Economic
Development
- 4229
27
New measure to promote and
support renewable energy
sources for electricity (RES-H)
- Biomass
Renewable energy - Biomass:
further extension of incentives
so that existing plants run up to
2030. New bioenergy
(agriculture and urban waste
and secondary product) with
incentives only for small plants
capacity < 70 kW
CO2 Economic
Planned
2018
Ministry of
Economic
Development
- To be
estimated

129
PaMs
number Name of PAM
Target and/or activity
affected
GHG
affected
Type of
instrument
Status and
start year of
implementat
ion
Implementing
entity or
entities
TOTAL GHG
Reduction
(kt CO2 eq.)
2020 2030
28
New measure to promote and
support renewable energy
sources for electricity (RES-H)
- Other renewables
Renewable energy - Other:
review of auction rules and
mechanisms for hydro,
geothermal energies and high
efficiency cogeneration
CO2 Economic
Planned
2018
Ministry of
Economic
Development
- To be
estimated
29 Coal phase out
Gradual phase-out of coal-fired
installations subject to system
adequacy (adequate replacement
capacity) and measures to
preserve employment (still
available 3280MW in 2030)
CO2 Regulatory
Planned
2020
Ministry of
Economic
Development - 7758
30 2017 National Grid Development Plan - Grid upgrade
Development of the national
electricity transmission and
distribution network to allow the
increase of the Distributed
Generation (DG) - the effect of
this measure is distributed in all
PAMs regarding electricity
consumption
CO2 Planning Planned
2020
TERNA -
Manager for the
electricity
transmission
grids
- IE
31 2017 National Grid Development Plan - Smart grid
Increasing flexibility of
electricity network for the
management of production from
RES - the effect of this measure
is included in measures 25 and
26
CO2 Planning
Planned
2020
TERNA -
Manager for the
electricity
transmission
grids
- IE

130
PaMs
number Name of PAM
Target and/or activity
affected
GHG
affected
Type of
instrument
Status and
start year of
implementat
ion
Implementing
entity or
entities
TOTAL GHG
Reduction
(kt CO2 eq.)
2020 2030
32 Development of district heating
network
30% development of the district
heating (renewable energy and
high efficiency cogeneration)
CO2 Planning Planned
2018
Municipalities - .
33 Installation of two news LNG
terminals
LNG terminals with a capacity of
4 bcm annual
CO2 Planning Planned
2018
Ministry of
Economic
Development
- -
34 Natural gas in Sardinia Development of terminals for
gas vessels, small coastal
storage area and a medium and
high pressure distribution
network
CO2 Planning Planned
2017
Ministry of
Economic
Development
- -
35 Reconversion of refinery
industry
Conversion of at least another 1
or 2 refineries (beyond Porto
Marghera) to bio-refineries
CO2 Planning Planned 2018
Ministry of
Economic
Development
- -
36 Further extend of energy saving
targets (White certificates
2020-2030)
Energy efficiency measures in
industry ETS and non-ETS up to
2.2 Mtoe saved
CO2 Economic Planned
2018
GSE- Manager
for Energy
Service 3700 4400

131
PaMs
number Name of PAM
Target and/or activity
affected
GHG
affected
Type of
instrument
Status and
start year of
implementat
ion
Implementing
entity or
entities
TOTAL GHG
Reduction
(kt CO2 eq.)
2020 2030
37 Energy efficiency in residential
building with tax deduction
Restructuring for thermal
insulation in residential
buildings, 0.5% annual
renovation rate, to be achieved
through an improved tax
deduction scheme (65-55-36%)
based on expected saving.
CO2 Fiscal Planned
2018
Ministry of
Finance, Ministry
of Economic
Development 385 1569
38 Energy efficiency in residential
building - upgrade entire
building - tax deduction
Restructuring for thermal
insulation in residential
buildings, 0.5% annual
renovation rate, focused on
"deep renovation" to be
achieved through the
remodelling of the tax deduction
(The assessment of the impact
of this measure has not been
finalized yet because the
implementation involves public
and private resources. It has
still to be decided the type of
instrument and the extent of
public support)
CO2 Fiscal Planned
2018
Ministry of
Finance, Ministry
of Economic
Development
- -
39 Energy efficiency in residential
building - measure for
supporting low income families
Introduce title portability or
structuring an incentive system
integrated with energy
CO2 Economic Planned
2020
Ministry of
Finance
- -

132
PaMs
number Name of PAM
Target and/or activity
affected
GHG
affected
Type of
instrument
Status and
start year of
implementat
ion
Implementing
entity or
entities
TOTAL GHG
Reduction
(kt CO2 eq.)
2020 2030
redevelopment
40 Energy efficiency in residential
building - provision to rebuild
housing including seismic
upgrade
Link the instrument with other
incentive mechanisms by
introducing measures for anti-
seismic building
CO2 Economic Planned
2020
Ministry of
Economic
Development
- -
41 Energy efficiency in tertiary
building
Restructuring for thermal
insulation in tertiary buildings,
including very low emission
building for central
administration (The assessment
of the impact of this measure
has not been finalized yet
because the implementation
involves public and private
resources. It has still to be
decided the type of instrument
and the extent of public
support)
CO2 Fiscal Planned
2017
Regions,
Ministry of
Economic
Development
894
-
42 Promoting energy saving in
building (public, domestic,
tertiary): insulation,
replacement windows and
boilers, installation of heat
pumps and solar thermal panels
Investments of air conditioning
systems (cooling and heating)
in the residential sector,
restructuring of the service
sector’s buildings. Installation of
gas and electric heating pumps,
CO2 Economic Planned
2017
GSE- Manager
for Energy
Service
4080 -

133
PaMs
number Name of PAM
Target and/or activity
affected
GHG
affected
Type of
instrument
Status and
start year of
implementat
ion
Implementing
entity or
entities
TOTAL GHG
Reduction
(kt CO2 eq.)
2020 2030
(Legislative decree 28/2011) high efficiency boilers and floor
heating system. Replacement of
appliances (The assessment of
the impact of this measure has
not been finalized for 2030
because the implementation
involves public and private
resources. It has still to be
decided the type of instrument
and the extent of public
support)
43 New measure to promote and
support the development of
charging infrastructure
Transposition of DAFI
2014/94/EU directive define and
implement the plan for the
development of alternative fuels
infrastructure: electric car
charging stations and natural
gas filling stations. (The impact
is included in the measures
related in the alternatives fuels
vehicles)
CO2 Regulatory Planned 2017
Industries
association and
local authorities
(Companies)
- -

134
PaMs
number Name of PAM
Target and/or activity
affected
GHG
affected
Type of
instrument
Status and
start year of
implementat
ion
Implementing
entity or
entities
TOTAL GHG
Reduction
(kt CO2 eq.)
2020 2030
44 Modal shift from private cars to
public buses and walking
Modal shift of about 10% of car
transportation demand in 2030
to public transport, car-pooling,
bikes and walking
CO2 Planning Planned
2017
Ministry of
Transport 1310 4248
45 Promoting and supporting
renewal of car fleet with low
carbon fuels
Speed up the replacement of
vehicle fleet with new vehicles,
including CNG cars (up to
1.7millions), LPG cars (up to 2.7
million), CNG vans (up to 1
million).
CO2 Economic Planned
2017
Ministry of
Economic
Development 1220 3180
46 Promoting and supporting
renewal of car fleet with
electrical vehicles
Speed up the replacement of
car vehicle fleet with electric
cars up to about 3 million
vehicles.
CO2 Economic Planned
2018
Ministry of
Economic
Development,
Ministry of
Finance
(Government);
Municipalities
(Local)
460 2372
47 Promoting and supporting
renewal of car fleet: further
expansion of electrical vehicles
Increase the electrical vehicles
to more than 10% of fleet by
2030, including cars (0.8
million) and electric vans (0.5
millions) (The assessment of
the impact of this measure has
not been finalized yet because
CO2 Economic Planned
2025
Ministry of
Finance, Ministry
of Environment
IE IE

135
PaMs
number Name of PAM
Target and/or activity
affected
GHG
affected
Type of
instrument
Status and
start year of
implementat
ion
Implementing
entity or
entities
TOTAL GHG
Reduction
(kt CO2 eq.)
2020 2030
the implementation involves
public and private resources. It
has still to be decided the type
of instrument and the extent of
public support)
48 Expansion of use of biofuel over
10% of road fossil fuels
consumption, including bio-
methane
Biofuels promotion:
consumption in the transport
sector of bio-methane and
about advanced biofuels
through the conversion of
refineries and / or traditional
biodiesel plants (The
assessment of the impact of this
measure has not been finalized
yet because the implementation
involves public and private
resources. It has still to be
decided the type of instrument
and the extent of public
support)
CO2 Economic Planned
2021
Ministry of
Economic
Development,
Ministry of
Finance
49 Promotion of LNG in transport Expansion of LNG heavy duty
trucks up to 30% of the fleet
and LNG ships up to 50% of
total national fuel consumption
CO2 Fiscal Planned
2018
Ministry of
Economic
Development,
Ministry of
Finance
160 1800

136
PaMs
number Name of PAM
Target and/or activity
affected
GHG
affected
Type of
instrument
Status and
start year of
implementat
ion
Implementing
entity or
entities
TOTAL GHG
Reduction
(kt CO2 eq.)
2020 2030
Total effect of planned policies
12209 38124

137
4.8 Summary of policies and measures no longer in place
In table 4.27 below, policies and measures that are no longer in place are reported.
Those measures have been reported in the sectorial table and considered in the WM scenario because
they still have a mitigation impacts at 2020.

138
Table 4.27 - policies and measures no longer in place
PaMs
number Name of PAM
Target and/or activity
affected
GHG
affected
Type of
instrument
Status and
start year of
implementati
on
Implementing
entity or
entities
TOTAL GHG
Reduction
(kt CO2 eq.)
2020 2030
1
Third "Conto Energia" (art.3
paragraph 1, decree 6 august
2010) and Fourth "Conto
Energia" (Decree 5 May 2011)
Supporting the expansion of
photovoltaic plants through feed
in tariffs until a maximum
capacity of 8000 MW
CO2 Economic Implemented
2010
Ministry of
economic
development
2300 -
2
Third "Conto Energia:
photovoltaic (art.3 paragraph 2,
decree 6 august 2010)
Supporting the expansion of
photovoltaic plants through feed
in tariffs until a maximum
capacity of 3000 MW
CO2 Economic
Implemented
2010
Ministry of
economic
development
900 -
3 Green Certificate - budget law
2008
Green Certificate increased
every year by 0,75% for 2007 -
2012 and establish an All-
Inclusive rate for plants <1 Mwe
CO2 Economic
Implemented
2009
Ministry of
economic
development
4000 -
4
European regional development
fund (ERDF), National Strategic
Framework 2008-2013 -
increase of renewable energy in
electricity production
Supporting system for RES with
Regional operative program
(POR) and Interregional
operative program (POIN)
CO2 Economic
Expired
2008
Ministry of
economic
development
1400
5 White certificates - decree
December 2007 - CHP
Supporting CHP and district
heating plants for 2008-2012 CO2 Economic
Expired
2008
Government,
GSE and
electricity and
gas distributors
970

139
PaMs
number Name of PAM
Target and/or activity
affected
GHG
affected
Type of
instrument
Status and
start year of
implementati
on
Implementing
entity or
entities
TOTAL GHG
Reduction
(kt CO2 eq.)
2020 2030
6
National Strategic Framework
2007-2013 - ERDF
Supporting CHP and energy
savings with POR (Operative
Regional Programs) and POIN
(Operative Regional Programs)
CO2 Economic Expired 2007
Regions 240 -
7 White certificates - decree
December 2007 - Industry
Supporting electric energy
saving for the period 2008-2012 CO2 Economic
Expired
2008
GSE- Manager
for Energy
Service
2020
9
European regional development
fund (ERDF), National Strategic
Framework 2008-2013 - Electric
energy saving in the energy
industry sector
Supporting electric energy
saving with POR (Operative
Regional Programs) and POIN
(Operative Interregional
Programs)
CO2 Economic Expired
2008
Regions 660
13 White certificates - decree
December 2007 - Commercial
Supporting energy savings
2008-2012 (Energy Efficiency)
CO2 Economic Implemented 2008
GSE- Manager for Energy Service 3120
-
15
National Strategic Frame-work
2007-2013 - ERDF - Residential
energy saving
Supporting electric energy
saving with POR (Operative
Regional Programs) and POIN
(Operative Interregional
Programs) in buildings
CO2 Economic Expired
2008
Regions 420
17 National Strategic Framework
2007-2013 - FESR - increase
public transportation in urban
Intermodal infrastructure
projects: expansion of
metropolitan railways/ subway
CO2 Planning Implemented 2007
Ministry of transport
1280 -

140
PaMs
number Name of PAM
Target and/or activity
affected
GHG
affected
Type of
instrument
Status and
start year of
implementati
on
Implementing
entity or
entities
TOTAL GHG
Reduction
(kt CO2 eq.)
2020 2030
area
Total effect of policies no longer in
place 17310

141
4.9 Minimization of adverse effects in accordance with art.2 paragraph 3 of the
Kyoto Protocol
Each Annex I Party shall also provide information on how it strives to implement policies and measures
under Article 2 of the Kyoto Protocol in such a way to minimize adverse effects, including adverse effects
of climate change, effects on international trade, and social environmental and economic impacts on
other Parties under Article 4, paragraphs 8 and 9, of the Convention, taking into account Article 3 of the
Convention.
The Kyoto Protocol was adopted in pursuit of the ultimate objective of the Convention, and hence its full
implementation is intended to contribute to preventing dangerous anthropogenic interference with the
climate system. Ambitious mitigation goals are necessary to ascertain a future for all countries.
Adverse impacts on developing countries are reduced if global temperature increase is limited below to 2
degrees Celsius, if dependence on fossil fuels decreases, and if Annex I Parties are able to develop low-
carbon energy systems and reduce fossil fuel consumption.
The European Union actively undertakes a large number of activities bringing positive impacts on third
countries and their ability to tackle climate change, specifically through capacity building and technology
transfer activities.
Climate policies in Italy are formulated and implemented in a way that minimise the potential adverse
impacts on specific sectors of economic activity, industrial sectors or other Parties to the Convention,
including the adverse effects on the international trade, social, environmental and economic impacts in
developing countries. As concerns domestic action, mitigation measures included in the national climate
change strategy do not focus exclusively on CO2 from fossil fuels, but cover all sectors of economic
activity which are related with GHG emissions or with carbon sinks.
Furthermore, Italy has ensured that measures implemented to increase the differentiation of energy
sources do not contradict the full liberalization of its energy markets. In particular, the promotion of
natural gas consumption improves the safety of energy supply of the country, while new commercial
relationships are developed with those countries from which natural gas is imported (e.g. Russia, Algeria,
etc.).
Other policies and measures might have potential positive impacts on third countries72. The flexible
mechanisms under the Kyoto Protocol, as tools incorporated into the Protocol to share efforts in reducing
greenhouse gases, ensure that investment is made where the money has optimal GHG-reducing effects,
thus ensuring minimal impact on the world economy and enhancing the development of new commercial
relationships between developed and developing countries. At European level, changes to subsidies under
the EC Common Agricultural Policy (CAP) now link payments to environmental, food safety and animal
welfare standards, not to agricultural production volume. This encourages responsible agricultural
practices. In addition, expectations are that the worldwide use of biomass in the energy supply will
increase considerably in the coming decades. Countries and producers will see opportunities for new
activities; at the same time, there is a growing concern that this must not be at the expense of other
72 For more information please see the chapter 13 Information on minimization of adverse impacts in accordance with
Article 3, paragraph 14 of the National Inventory Report 2017. http://unfccc.int/national_reports/annex_i_ghg_inventories/national_inventories_submissions/items/10116.php

142
important values for nature, environment and society. To accommodate these feelings, criteria will be
needed that indicate whether biomass has been produced in a responsible manner.
Updated information on the minimization of adverse impacts in accordance with art.3 paragraph 14 of the
Kyoto Protocol is reported in the National Inventory Report transmitted to the UNFCCC in the framework
of the 2017 annual inventory submission.

143
5 PROJECTIONS AND EFFECTS OF POLICIES AND MEASURES73
5.1 Introduction
During 2016, the Head of Government Office has started and coordinated a process to develop the
national reference scenario. This process involved:
- Ministry of Environment, Land and Sea; Ministry of Economic Development; Ministry of Economy and
Finance; Ministry of Agriculture; Ministry of Transport and Infrastructures;
- ISPRA – National Institute for Environmental Protection and Research (linked to the Ministry of
Environment); ENEA – National Agency for New Technologies, Energy and Sustainable Economic
Development (linked to the Ministry of Economic Development); ISTAT – National Institute of
Statistics; The Italian Regulatory Authority for Electricity, Gas and Water – the independent
regulatory body of the energy markets and the integrated water services;
- Public/private companies as
o GSE – a State-owned company which promotes and supports renewable energy sources and
energy efficiency. GSE is the parent company of:
Acquirente Unico (AU) – Supply to domestic sector and small enterprises;
Gestore dei Mercati Energetici (GME) – Manager of power and gas markets;
Ricerca sul Sistema Energetico (RSE) – Research on electrical energy production, distribution
and consumption;
o SNAM – responsible for the construction and management of natural gas infrastructure
(transportation, storage and regasification);
o TERNA – responsible for national electricity grid’s operation, maintenance and development.
The achievement of this inter-ministerial process has been the development of a National Reference
Scenario, reported here as With Measures (WM) scenario. The scenario takes into account the evolution
of the national energy system and it considers only policies in force on December 31st, 2014 and minimal
standards for building efficiency measure which was adopted in June 2015. The same assumptions used
by the European Commission for PRIMES 2016 Reference scenario are adopted in the WM scenario. The
base year for the projections is 2015, by the last emission inventory data submitted to UNFCCC.
The scenario has been produced with the partial equilibrium model TIMES (The Integrated MARKAL-
EFOM1 System / EFOM Energy Flow Optimization Model), a model generator for local, national or multi
regional economies finalized to the analysis of whole energy systems (electricity generation and
consumption, heat distribution, transports, industries, civil, etc.). The model belongs to the family of
MARKAL (Market Allocation, http://www.iea-etsap.org/web/Markal.asp) models, the so-called “3e
models” (energy, economy, environment), and was developed by the International Energy Agency (IEA)
under the program Energy Technology Systems Analysis Program (ETSAP). This model is recognized by
the International Panel on Climate Change (IPCC).
The energy system thus simulated is composed by a number of different sectors and subsectors (e.g.
electricity production, industrial activities, residential buildings, etc.), each one consisting of a set of
73 Lead authors: Antonio Caputo (ISPRA), Emanuele Peschi (ISPRA). Contributing authors (ISPRA): Mario Contaldi (ISPRA), Riccardo De Lauretis (ISPRA), Eleonora Di Cristofaro (ISPRA), Barbara Gonella (ISPRA), Monica Pantaleoni (ISPRA), Daniela Romano (ISPRA), Ernesto Taurino (ISPRA), Marina Vitullo (ISPRA).

144
technologies connected by input-output linear relationships. Inputs and outputs can be energy carriers,
materials, emissions or requests for services. TIMES is a bottom-up, demand-driven model in which each
technology is identified by technical and economic parameters and the production of a good is
conditioned to the effective demand by end-users.
The structure of energy scenarios is defined by variables and equations determined by input data
constituting the regional database. The database contains qualitative and quantitative data describing the
interaction between different components of the energy system.
TIMES identifies the optimal solution to provide energy services at the lowest cost, producing
simultaneously investments in new technologies or using more intensively the available technologies in
each region defined by the user. For example, an increase in electricity demand for residential use can be
satisfied with a more intensive use of available power plants or through the installation of new power
plants. Model choices are based on the analysis of technological characteristics of available alternatives,
the cost of of energy supply and environmental criteria and bounds.
CO2 emissions are directly calculated by the model implemented by ISPRA using IPCC “reference
approach” methodology and national Emission Factors. The modelling approach avoids, in principle, the
so called “double counting effect” for the implementation of policies, so the model evaluates the impacts
and interactions among measures as a package. The model outcomes indicate the mix of technologies
and primary emission sources fulfilling the commodity demands of the reference scenario at the lowest
possible cost.
The model considers the effect of the average temperature change taking into account the dynamic of
degree days as in PRIMES 2016.
The emissions from non-energy sources and other energy related GHGs different from CO2 have been
evaluated by the family of spreadsheet models used by ISPRA for the V and VI NCs to UNFCCC.
The overall GHGs emissions and the share between ETS and non-ETS sectors are the results of the
mentioned models implemented by ISPRA.
A “With Additional Measures” (WAM) scenario has not been carried out in this Communication, because
the new National Energy Strategy (“SEN 2017”)74, which includes new planned PaMs, has only been
adopted in November 2017: accordingly, the subsequent new scenario could not be reported in this
submission due to time constraints. Moreover, consistency had to be ensured with the National
Communication submitted in 2017 by the European Union, which relied on previous communications
made by Member States to the European Commission pursuant to Regulation No 525/2013/EC, Art. 13
and Art. 14.
A “Without Measures” (WOM) scenario, calculated with the same methodology of WM scenario, could not
be included either, as most data on PaMs are not available starting from 1990 and, especially, since
many structural changes occurred in the period 2000-2007 linked to technological changes and fuel
shifts, so that it is not possible to determine how the energy system would have evolved without those
changes. In this regard, fuel shifts toward low carbon fuels for electricity generation (since 1990 there
has been a steady increase of natural gas share and a corresponding decrease of oil products share, see
Figure 5.151) or the introduction of combined cycle plants (since 2000) are among the most important
factors that make it impossible to evaluate how the national emissions would have evolved without any
measure. Nevertheless, it is possible to perform emission projections without measures entered into force
74 http://www.sviluppoeconomico.gov.it/index.php/it/energia/strategia-energetica-nazionale

145
since 2007 by interpolating the estimated impact of PaMs up to 2030 and adding such impact to WM
projections. Moreover, the emission projections of WM scenarios reported in the previous National
Communications (mainly in the fourth one) could supply esteems of emissions without the measures
implemented after 2000 (see par 5.6).
5.2 WM scenario
5.2.1 Main assumptions
The WM scenario was elaborated in 2016 and projections include all PaMs implemented or adopted up to
the end of 2014 and minimal efficiency standards for buildings adopted in 2015. The base year for
projections is 2015. The projected years are 2020, 2025, 2030, and 2035. The main assumptions of the
scenario are:
- GDP: economic growth from 2015 to 2020 with average annual rate of +0.71%. For the period
2020-2025 the average annual rate is +1.18%, and for period 2025-2035 is +1.19%, in accordance
with PRIMES 2016;
- energy: reduction of energy consumption and increase of renewable sources toward EU 2030
targets;
- population: increase up to 2030 with an average annual rate of 0.37% since 2015 in accordance with
PRIMES 2016.
The scenario takes into account a recovery from the economic crisis that has hit all national activities,
and it also considers the development of low carbon technologies and efficiency improvement. The main
driving variables used for projections of demand for energy services in the end-use sectors, are:
- industry: gross value added (GVA) and, for some sub-sectors, physical productions;
- tertiary: GVA;
- residential: demographic trends (mainly population and number of households), increase in the
number of appliances per household and growing demand for summer cooling;
- electricity generation: continuation of the ongoing growth of renewable sources;
- transport: dynamics of active population (along with assumptions about mobility per capita) and
goods exchange, fleet renewal with low emissions engines.
5.2.1.1 General Economic Parameters
Table 5.1 shows actual and projected values for GDP and GVA.
As already mentioned, the GDP growth is assumed from 2015 with an average year rate of +0.71% up to
2020, following the recovery from the economic crisis. The GDP values for 2020 and following projected
years are those provided by PRIMES 2016 for the Reference Scenario. Among the factors that motivate
this "prudent" vision up to 2020, there is the slow recovery of gross value added in the industrial sector
that has incurred in the most relevant reduction of activity during the economic crisis period. This lower
rate is mainly due to the rigidity of the Italian industrial structure, characterized by a low average size of
companies and by a competitive disadvantage in the high-tech sectors75. In future years, tertiary sector
75 ENEA, L’Italia nella competizione tecnologica internazionale, Quinto rapporto, Sintesi e scenari generali, 2006;

146
will grow at a higher rate, further increasing its role in the Italian economy.
Table 5.2 shows the energy and carbon international prices which are all following increasing trends
according with the same assumption made in PRIMES2016 for the Reference Scenario.
The increase in carbon price is particularly steep during the period 2015-2035, while the foreseen growth
for energy prices is much slower.
Table 5.1 – Actual (up to 2015) and projected GDP, and GVA
billion € 2010 constant prices basis
2010 2015** 2020 2025 2030 2035
GDP 1,605 1,547 1,603 1,699 1,803 1,942
Average annual rate (%)
-0.72% 0.71% 1.18% 1.19% 1.50%
GVA – industry* 312 292 300 311 324 342
Average annual rate (%)
-1.31% 0.58% 0.69% 0.83% 1.11%
GVA – tertiary 1,063 1,033 1,110 1,186 1,264 1,370
Average annual rate (%)
-0.57% 1.46% 1.32% 1.29% 1.61%
GVA – agriculture 28 24 25 26 27 27
Average annual rate (%)
-2.99% 0.78% 0.55% 0.34% 0.44%
*including Constructions and excluding: Manufacture of coke and refined petroleum products; Electricity, gas, steam and air conditioning supply; Water supply; sewerage, waste management and remediation activities **2015 data are those made public by ISTAT in march 2016 and differ slightly by the most recent review, anyhow the difference is small enough not to influence the model results
Table 5.2 – Energy and carbon international prices
2010 2015 2020 2025 2030 2035
Coal prices € 2010 / toe 132 80 100 119 143 152
Oil prices € 2010 / toe 434 337 524 595 655 683
Gas prices € 2010 / toe 286 271 337 365 397 423
Carbon price € 2010 / t CO2 10 7 14 22 32 40
5.2.1.2 Population and transport
The population grew significantly from 2005 to 2015 with annual average rate of 0.46%. The annual
growth rate from 2015 to 2020 is 0.41%. The average annual rate for the following years is quite stable
around 0.34% up to 2035 (Table 5.3). For the period 2020-2030, the projected population is the same as
in PRIMES 2016.
Table 5.3 – Population
2005 2010 2015 2020 2025 2030 2035
2007 IV NC 58,462 58,531 58,471 58,123
2009 V NC 58,462 60,190 61,130 61,160
2013 VI NC (BR1) 58,462 60,340 61,138 61,634 61,986 62,129
2015 BR2 58,064 59,707 61,640 62,500 63,080 63,680 64,350
2017 VII NC (BR3) 57,875 59,190 60,800 62,065 63,118 64,229 65,333
Centro Europa Ricerche, Crisi delle esportazioni: quello che la lira ci aveva nascosto, Rapporto CER 4/2004; Confindustria, Tendenze dell’industria italiana, 2004, Editore SIPI Srl, Roma.

147
The change in past years’ population figures, with reference to previous submissions, is due to the last
decennial Census by National Statistical Institute, published at the end of 2012, that pointed out lower
population levels than those previously estimated for 2011 to about 59,365 thousand.
Table 5.4 shows data of transport demand for passengers and freights. The expected activity scenario for
transport shows a steady growth from 2015 to 2030 following the recovery from the economic crisis as
confirmed by data for 2015 and provisional data for recent years. The transport demand increases up to
2020 compared to 2015 with annual rate of 2.5% for passengers and 5.2% for goods. After 2020, up to
2035, the annual rate becomes more stable around 0.7% for passengers and 1.0% for goods.
Table 5.4 – Transport demand for passengers and freights
2010 2015 2020 2025 2030 2035
Passenger person kilometers
billion pass-km, excluding civil aviation
919 901 1,017 1,055 1,094 1,126
Freight ton kilometers
billion ton-km>50km, only national vectors
211 225 289 306 323 337
Source: ISPRA
The next table shows the number of person per household adopted for GHG projections in residential
sector. As for the average floor space, a constant value of 102.5 m2 has been used for the whole period
of projections.
Table 5.5 – Inhabitants per household
2010 2015 2020 2025 2030 2035
Inhabitants/Household 2.40 2.40 2.44 2.42 2.40 2.37
Source: ISPRA
5.2.2 The European context
Italy is a EU Member State and its 2015 GHGs emissions account for about 10.0% of European Union’s
(EU 28) actual emissions76. Many mitigation policies as well as monitoring commitments are coordinated
at EU level.
Under the overall commitment of 20% reduction of GHG compared to 1990 levels by 2020, concerning
non-ETS emissions, Italy is committed to reduce its emissions in the non-ETS sector of 13%77 by 2020
with respect to 2005 level under Decision n. 406/2009/EC (the so-called “Effort Sharing Decision” ESD).
The emissions and removals from LULUCF sector are excluded from Effort Sharing Decision n.
406/2009/EC. More details on 2020 targets are reported in the Chapter 4.
In October 2014, the European Commission has presented a Communication on the “Climate and Energy
Package 2030” to the European Council of the Head of States and Government. In the same meeting the
European Council has approved conclusions that include a quantified reduction target for the 2030
horizon. The main target set by those conclusions is the endorsement of a binding EU-wide GHG
76 Data from CRF, year 2015, of National Inventory Submission 2017 of European Union and Italy to the UNFCCC
Secretariat. 77 ETS sectors contribute for a collective reduction of 21% of emissions compared to 2005. As also explained in Chapter 4, the ETS cap is not attributed to Member States but it’s managed at EU level and declines in order to achieve the target

148
reduction of at least 40% of domestic emissions by 2030, with reference to 1990 level. To that aim, the
Council conclusions indicate that the target will be delivered collectively by the EU with the reduction in
ETS and non-ETS sectors amounting to 43% and 30% by 2030 compared to 2005, respectively. The
Council Conclusions also include an EU-wide target for renewable sources of 27% and an indicative target
of 27% for the energy efficiency (energy savings compared with the business-as-usual scenario). This
last target will be reviewed in 2020 having in mind a 30% target.
Following the above-mentioned Council conclusions, the European Parliament and the Council have
proposed a legislative package for the non-ETS sector, which would require Italy to reduce GHG
emissions by 33%, compared to 2005 levels within 2030; a proposal on the inclusion of emissions and
removals from LULUCF into the 2030 Climate and Energy Framework has been also presented. In
particular, the proposed legislative package includes a new flexibility which allows for a limited use of net
removals from certain LULUCF accounting categories, while ensuring no debits occur in the LULUCF
sectors, to account for Member State compliance towards the targets in the non-ETS sectors if needed.
The proposed cap, for Italy, is about 11 Mt CO2eq. for the entire 2021-2030 period.
As for the European monitoring and reporting mechanisms, Decision No. 525/2013/EC establishes the
following commitments:
- ensuring the timeliness, transparency, accuracy, consistency, comparability and completeness of
reporting by the Union and its Member States to the UNFCCC Secretariat;
- reporting and verifying information concerning commitments of the Union and its Member States
pursuant to the UNFCCC, Kyoto Protocol and related decisions adopted and evaluating progress
towards meeting those commitments;
- monitoring and reporting all anthropogenic emissions by sources and removals by sinks of
greenhouse gases not controlled by the Montreal Protocol on substances that deplete the ozone layer
in the Member States.
In particular, article 14 of Decision No. 525/2013/EC foresees, by 15 March 2015 and every two years
thereafter, that Member States shall report to the European Commission national projections of
anthropogenic greenhouse gas emissions by sources and removals by sinks, organized by gas or group of
gases (HFCs and PFCs) listed in Annex I and by sector. Those projections shall include quantitative
estimates for a sequence of four future years ending with 0 or 5 immediately following the reporting year.
National projections shall take into consideration any policies and measures adopted at Union level.
5.2.3 Consumption of primary and final energy
The total primary energy supply (TPES), estimated according to Eurostat methodology, will be about
150.4 in 2030 with an average yearly decrease rate of -0.2% since 2015.
TPES started to decrease since 2005, before the economic crisis, while in the period 1990-2005 it has
constantly increased with an annual average equal to +1.4%.
The share of natural gas increased constantly since 1990 counterbalancing the corresponding decrease of
oil share. In the last years, it is also evident the growing role of renewable energies.
Figure 5.2 shows the projections of gross inland consumption according to the present NC and previous
NCs and BRs. Relevant changes can be observed in the estimated total energy consumption between the
previous 6th NC (WM and WAM scenarios with base year 2010) and the updated one due to the extension
of the economic crisis and the adoption of new measures. Between the NC6 and NC7 scenarios, there

149
were those carried out for the 2nd Biennial Report (WM and WAM scenarios with base year 2013). As it
can be noted, the recent outlook on recovery from the economic crisis is reflected in projections reported
in the WM scenario.
Figure 5.1 – Fuel mix of TPES, historic data
Figure 5.2 – Actual and projected gross inland consumption, Mtoe
Note: energy consumption estimated according to Eurostat methodology
Source: ISPRA
It should also be noted that in 2014 ISTAT carried out a specific national survey on family energy
consumption that showed much higher biomass consumption levels for domestic heating compared to
previous estimates. For this reason, the whole time-series has been reviewed: for example, with regard
to year 2010, biomass consumption has increased by almost 4 Mtoe, while for more distant years the
increase is less than 2 Mtoe.
0%
10%
20%
30%
40%
50%
60%
70%
Solid fuels Total petroleum products
Natural Gas Renewable energies
Electrical energy Waste (non-renewable)
Shar
ein
gro
ss in
lan
d c
on
sum
pti
on
130
140
150
160
170
180
190
WM - BR1 / NC VI
WAM - BR1 / NC VI
WM - BR2
WAM - BR2
WM - BR3 / NC VII
Gro
ss in
lan
d c
on
sum
pti
on
(Mto
e)

150
5.2.4 GHG Emissions
Based on the above-mentioned parameters, the model jointly computes energy supply and CO2
emissions, while other GHGs and non-energy GHG emissions are calculated on the basis of the estimated
evolution of activity data and average emission factors. Emissions up to 2015 are inventory data as
submitted to UNFCCC in 2017.
As can be seen in Figure 5.3, final results show remarkable emission reductions in 2010 and 2015, and
then a further slight decrease. The reduction in emissions is due to many different factors, some of them
structural and other only temporary. The most important are:
- higher than expected share of renewable in TPES, due to anticipated development of photovoltaic
production and diffusion of biomass for heating;
- increased efficiency of electricity generation, with the entry into service of many combined cycle
plants;
- reduced fuel consumption in transportation due to high fuel prices and low activity levels;
- sharp reduction of energy consumption in industrial sector due to the economic crisis and structural
changes in production;
- increase in efficiency of final end-use devices.
Figure 5.3 – Actual and projected CO2 emissions from energy sector
Note: net emission are the physical emissions in the Italian territory excluding the emission reductions due to flexible mechanism.
Source: ISPRA
Table 5.6 shows the WM scenario projections up to 2035. Emissions are disaggregated by source of
emissions sector.
300
320
340
360
380
400
420
440
460
480
WM - BR1 / NC VI
WAM - BR1 / NC VI
WM - BR2
WAM - BR2
WM - BR3 / NC VII
CO
2 (M
t)
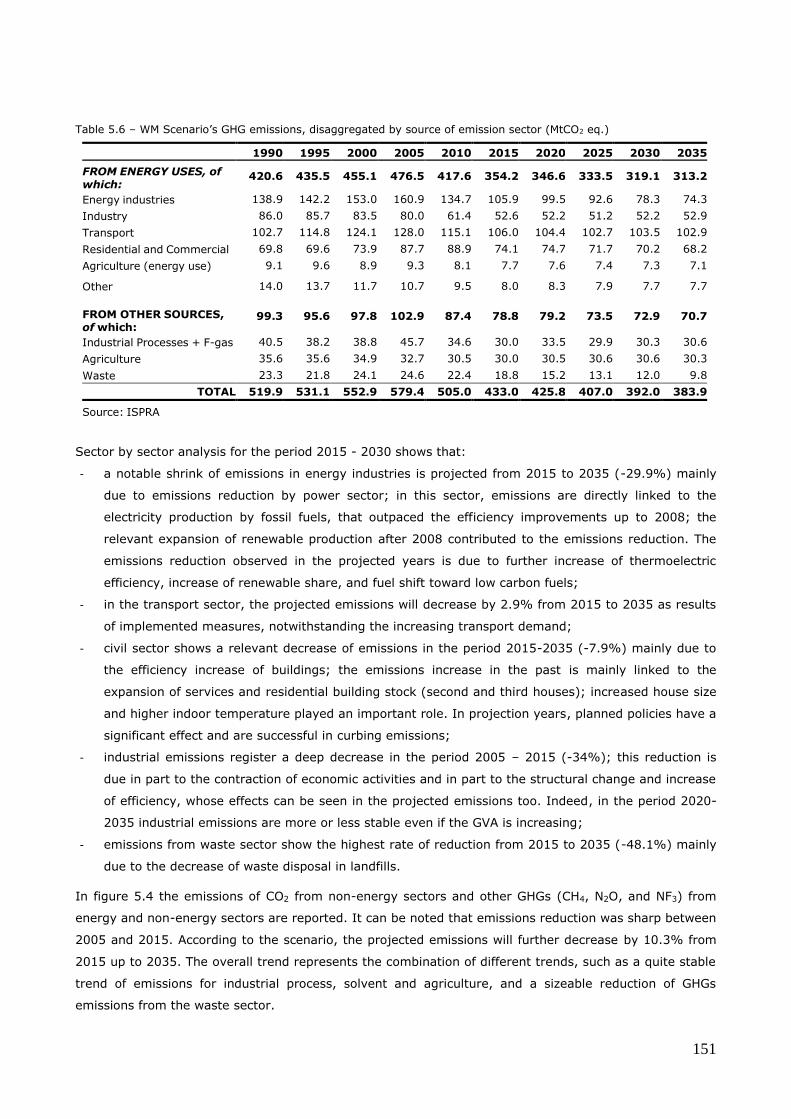
151
Table 5.6 – WM Scenario’s GHG emissions, disaggregated by source of emission sector (MtCO2 eq.)
1990 1995 2000 2005 2010 2015 2020 2025 2030 2035
FROM ENERGY USES, of which:
420.6 435.5 455.1 476.5 417.6 354.2 346.6 333.5 319.1 313.2
Energy industries 138.9 142.2 153.0 160.9 134.7 105.9 99.5 92.6 78.3 74.3
Industry 86.0 85.7 83.5 80.0 61.4 52.6 52.2 51.2 52.2 52.9
Transport 102.7 114.8 124.1 128.0 115.1 106.0 104.4 102.7 103.5 102.9
Residential and Commercial 69.8 69.6 73.9 87.7 88.9 74.1 74.7 71.7 70.2 68.2
Agriculture (energy use) 9.1 9.6 8.9 9.3 8.1 7.7 7.6 7.4 7.3 7.1
Other 14.0 13.7 11.7 10.7 9.5 8.0 8.3 7.9 7.7 7.7
FROM OTHER SOURCES, of which:
99.3 95.6 97.8 102.9 87.4 78.8 79.2 73.5 72.9 70.7
Industrial Processes + F-gas 40.5 38.2 38.8 45.7 34.6 30.0 33.5 29.9 30.3 30.6
Agriculture 35.6 35.6 34.9 32.7 30.5 30.0 30.5 30.6 30.6 30.3
Waste 23.3 21.8 24.1 24.6 22.4 18.8 15.2 13.1 12.0 9.8
TOTAL 519.9 531.1 552.9 579.4 505.0 433.0 425.8 407.0 392.0 383.9
Source: ISPRA
Sector by sector analysis for the period 2015 - 2030 shows that:
- a notable shrink of emissions in energy industries is projected from 2015 to 2035 (-29.9%) mainly
due to emissions reduction by power sector; in this sector, emissions are directly linked to the
electricity production by fossil fuels, that outpaced the efficiency improvements up to 2008; the
relevant expansion of renewable production after 2008 contributed to the emissions reduction. The
emissions reduction observed in the projected years is due to further increase of thermoelectric
efficiency, increase of renewable share, and fuel shift toward low carbon fuels;
- in the transport sector, the projected emissions will decrease by 2.9% from 2015 to 2035 as results
of implemented measures, notwithstanding the increasing transport demand;
- civil sector shows a relevant decrease of emissions in the period 2015-2035 (-7.9%) mainly due to
the efficiency increase of buildings; the emissions increase in the past is mainly linked to the
expansion of services and residential building stock (second and third houses); increased house size
and higher indoor temperature played an important role. In projection years, planned policies have a
significant effect and are successful in curbing emissions;
- industrial emissions register a deep decrease in the period 2005 – 2015 (-34%); this reduction is
due in part to the contraction of economic activities and in part to the structural change and increase
of efficiency, whose effects can be seen in the projected emissions too. Indeed, in the period 2020-
2035 industrial emissions are more or less stable even if the GVA is increasing;
- emissions from waste sector show the highest rate of reduction from 2015 to 2035 (-48.1%) mainly
due to the decrease of waste disposal in landfills.
In figure 5.4 the emissions of CO2 from non-energy sectors and other GHGs (CH4, N2O, and NF3) from
energy and non-energy sectors are reported. It can be noted that emissions reduction was sharp between
2005 and 2015. According to the scenario, the projected emissions will further decrease by 10.3% from
2015 up to 2035. The overall trend represents the combination of different trends, such as a quite stable
trend of emissions for industrial process, solvent and agriculture, and a sizeable reduction of GHGs
emissions from the waste sector.

152
Figure 5.4 – Actual and projected emissions of CO2 from non-energy sectors and other GHGs from energy and
non-energy sectors.
Source: ISPRA
The resulting trend in total GHGs emissions is reported in figure 5.5. The current WM scenario is
compared with the ones reported in previous NCs and Biennial Reports.
Figure 5.5 – Actual and projected GHG emissions (Mt CO2 eq.)
Source: ISPRA
Table 5.7 reports emissions by gas expressed as CO2 eq. CO2 emissions represent about 84% of total
emissions. It is worth to note the sharp reductions of methane, HFCs, and SF6 emissions in the period
2015-2035, amounting to 20.6%, 51.4% and 25.1% respectively. As previously noted, the emissions
contraction registered by methane is mainly due to the waste sector. The decreasing emissions of HFCs
and SF6 are mainly due to the implementation of the European Regulation n. 517/2014 on F-gases.
60
65
70
75
80
85
90
95
100
105
WM - BR1 / NC VI
WM - BR2
WM - BR3 / NC VII
GH
G(M
t C
O2e
q)
350
400
450
500
550
600
WM - BR1 / NC VI
WAM - BR1 / NC VI
WM - BR2
WAM - BR2
WM - BR3 / NC VII
GH
G(M
t C
O2e
q)
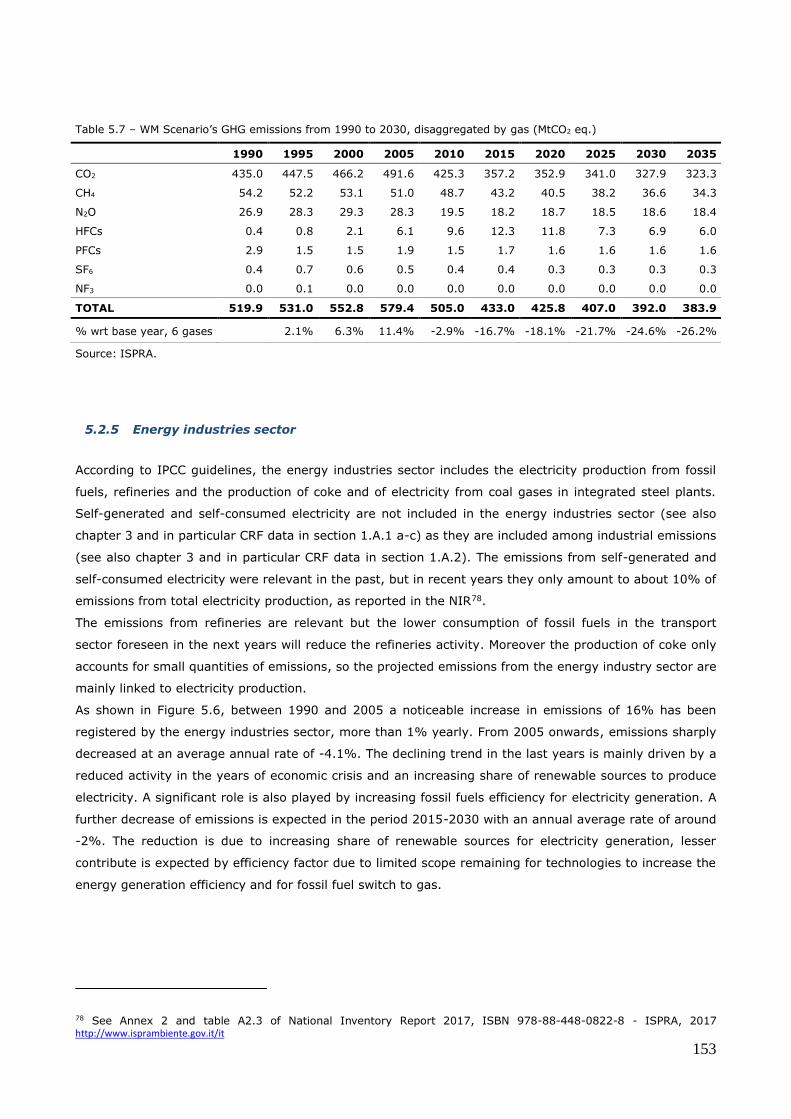
153
Table 5.7 – WM Scenario’s GHG emissions from 1990 to 2030, disaggregated by gas (MtCO2 eq.)
1990 1995 2000 2005 2010 2015 2020 2025 2030 2035
CO2 435.0 447.5 466.2 491.6 425.3 357.2 352.9 341.0 327.9 323.3
CH4 54.2 52.2 53.1 51.0 48.7 43.2 40.5 38.2 36.6 34.3
N2O 26.9 28.3 29.3 28.3 19.5 18.2 18.7 18.5 18.6 18.4
HFCs 0.4 0.8 2.1 6.1 9.6 12.3 11.8 7.3 6.9 6.0
PFCs 2.9 1.5 1.5 1.9 1.5 1.7 1.6 1.6 1.6 1.6
SF6 0.4 0.7 0.6 0.5 0.4 0.4 0.3 0.3 0.3 0.3
NF3 0.0 0.1 0.0 0.0 0.0 0.0 0.0 0.0 0.0 0.0
TOTAL 519.9 531.0 552.8 579.4 505.0 433.0 425.8 407.0 392.0 383.9
% wrt base year, 6 gases
2.1% 6.3% 11.4% -2.9% -16.7% -18.1% -21.7% -24.6% -26.2%
Source: ISPRA.
5.2.5 Energy industries sector
According to IPCC guidelines, the energy industries sector includes the electricity production from fossil
fuels, refineries and the production of coke and of electricity from coal gases in integrated steel plants.
Self-generated and self-consumed electricity are not included in the energy industries sector (see also
chapter 3 and in particular CRF data in section 1.A.1 a-c) as they are included among industrial emissions
(see also chapter 3 and in particular CRF data in section 1.A.2). The emissions from self-generated and
self-consumed electricity were relevant in the past, but in recent years they only amount to about 10% of
emissions from total electricity production, as reported in the NIR78.
The emissions from refineries are relevant but the lower consumption of fossil fuels in the transport
sector foreseen in the next years will reduce the refineries activity. Moreover the production of coke only
accounts for small quantities of emissions, so the projected emissions from the energy industry sector are
mainly linked to electricity production.
As shown in Figure 5.6, between 1990 and 2005 a noticeable increase in emissions of 16% has been
registered by the energy industries sector, more than 1% yearly. From 2005 onwards, emissions sharply
decreased at an average annual rate of -4.1%. The declining trend in the last years is mainly driven by a
reduced activity in the years of economic crisis and an increasing share of renewable sources to produce
electricity. A significant role is also played by increasing fossil fuels efficiency for electricity generation. A
further decrease of emissions is expected in the period 2015-2030 with an annual average rate of around
-2%. The reduction is due to increasing share of renewable sources for electricity generation, lesser
contribute is expected by efficiency factor due to limited scope remaining for technologies to increase the
energy generation efficiency and for fossil fuel switch to gas.
78 See Annex 2 and table A2.3 of National Inventory Report 2017, ISBN 978-88-448-0822-8 - ISPRA, 2017 http://www.isprambiente.gov.it/it

154
Figure 5.6 – Energy industries, actual and projected GHG emissions (Mt CO2 eq.)
Source: ISPRA
5.2.5.1 Electricity production
Data considered in this paragraph concern all electricity generation plants, including those plants usually
dedicated to the supply of electricity and heat to sectors different from 1.A.1.a (Public electricity and heat
production).
Historical data show a decoupling between CO2 emissions from power plants and electricity production
(Figure 5.7 and Figure 5.8). Since 1990, the electricity production increased constantly up to 2008 with
an average annual rate higher than CO2 emissions. The average growth rate of gross electricity
production amounted to 2.2% per year from 1990 to 2008, doubling the growth rate of CO2 emissions
(1.1% per year) and thus showing a relative decoupling for the two parameters. From 2008 to 2014, the
electricity production dropped down for the economic crisis (-2.0% per year for gross electricity
production and -6.8% per year for CO2 emissions). In the same period, it is evident how the decoupling
between electricity production and CO2 emissions becomes absolute as respective trends continue
diverging. Such effect is mainly due to the sharp development of renewable sources in the period. Data
for the last years (2015, 2016, and provisional data for 2017) show the increase of electricity production
as result of economy recovery from the long financial and economic crisis that hit the national system.

155
Figure 5.7 – Electricity production and CO2 emissions
Source: ISPRA
Figure 5.8 – Electricity production and CO2 emissions relative trends on 1990
Source: ISPRA
The decoupling between electricity generation and atmospheric emissions, particularly evident since
2004, is due to fuel shift toward lower carbon content fuels, and to a relevant increase in electricity
production efficiency. Since 2007, the increasing share of renewable sources was the most relevant factor
contributing to the decoupling trend (Figure 5.8).
According to WM scenario, the expected increase in electricity demand will be covered by a strong
increase in installed renewable sources power. The installed capacity in 2015 was 51.5 GW, with an
average growth rate of 5.2% per year from 2000 to 2010 and of 11.2% per year in the following years
up to 2015. From 1990 to 2008, hydropower was the most relevant renewable source; after 2008, other
sources have become more and more relevant. Since 2013, the annual rate of new installed capacity has
200
250
300
350
400
450
500
550
600
650
0
50
100
150
200
250
300
350
Gross electricity production CO2 emissions from power plants Emission factor
Em
ission
facto
r (g C
O2 /k
Wh
)G
ross
ele
ctri
city
pro
du
ctio
n (
TW
h)
Ca
rbo
n d
ioxi
de
(Mt)
-0.7%
-1.8%
+1.1%
-2.4%
-1.8%
+0.6%
60
70
80
90
100
110
120
130
140
150
160
Gross electricity production CO2 emissions from power plants
Ind
ex
19
90
=1
00

156
shown a slowdown, while the electricity production has registered a downturn mainly due to the sharp
reduction of hydropower share (Figure 5.9). The installed renewable capacity projected for 2030 is about
60 GW, mainly due to the increase of photovoltaic and wind.
Figure 5.9 – Renewable contribution to gross electricity production
Source: ISPRA
Total gross efficient power capacity, including renewables, increased from 102.3 GW in 2008 to 128.6 GW
in 2013, with a renewable share of 23.3% and 36.8%, respectively. Since 2008, renewable power
represents the main component of new installations (26.1 GW out of 26.3 GW). Starting from 2011, a
growing decommissioning of thermal capacity has been registered (about 20 GW). In 2016, the efficient
power capacity is 114.2 GW with 45.8% being from renewables.
The growth of renewable share has been mostly affected by photovoltaic and wind capacity. As concerns
the electricity generation from renewable sources, the 2020 target assigned to Italy under European
commitments is 26.4%, expressed as percentage of renewables on gross final consumption of electricity,
including the import share of electricity. Such target is overachieved since 2011, and the 2015 share of
renewables was 33.5% of gross final consumption of electricity79.
In calculating the contribution of hydropower and wind, the effects of climatic variation are smoothed
through the use of a normalization rule according to Directive 2009/28/EC. The increase of renewable
electricity production is foreseen to continue in the next years. Projections show that renewable electricity
production will amount to about 117.9 TWh in 2020 and 129.1 TWh in 2030, out of total generation
figures of 284.5 and 308.5, respectively.
5.2.5.2 Refinery sector
The level of activity of this sector is strictly linked to the activity of the transport sector (82% of final
energy consumption of total petroleum products in 2015) whose energy needs still rely mainly on oil
79 GSE, 2017 – Energia da fonti rinnovabili in Italia – Anno 2015.
+2.0%
+4.8%+7.0%
+11.1%
+14.2%+36.7%
+2.6%
14.4%
5.4%1.3% 1.8%
1.6% 1.6% 0.7%
0.7%
0
20
40
60
80
100
120
140
0
10
20
30
40
50
60
70
Gro
ss c
apac
ity
(GW
)
Hydro Wind Photovoltaic Geothermal Biomass Gross production
Gro
ss pro
du
ction
(TWh
)

157
products.
During the past decade, under the economic crisis, the transport sector has been heavily affected, thus
leading to a decrease of the activity of refineries too, which also led to a reduction of the number of
operating installations.
An upward trend in emission levels was observed from 1990 to 2010 explained by the increasing
quantities of crude oil processed and by the complexity of processes used to produce more environmental
friendly transportation fuels and to reduce the production of residual fuel oil. The increase in complexity
resulted in an increase of energy consumption with the installation of deep conversion units or integrated
gasification units, that can use heavy residuals to produce electricity, heat and hydrogen.
Liquid fuel consumptions have reached a plateau in 2010 and are now in a downward trend that is
expected to continue, due to the reduced quantities of crude oil processed and of electricity produced,
and to the gradual substitution of oil products with natural gas in the civil and industrial sectors, and with
gaseous fuels, biofuels and electricity in the transport sector.
In the period 2015-2035, the overall activity data is projected to continue its decreasing trend, with
corresponding reductions in emissions. A partial recovery of production is foreseen up to 2020, to become
stable in the following period.
Table 5.8 – Emissions from refineries for WM scenario (Mt CO2)
2005 2010 2015 2020 2025 2030 2035
Refineries 26.6 28.7 21.1 17.2 16.3 14.5 13.7
Source: ISPRA
5.2.6 Final uses of energy
The next table reports historical data and projections for final uses of energy according to Eurostat
methodology.
Table 5.9 – Final energy consumption (Mtoe)
2005 2010 2015 2020 2025 2030 2035
Total final uses 137.2 128.5 116.4 119.5 117.6 118.5 119.3
Source: ISPRA
The scenario shows a little increase of final energy consumption after 2015, following the recovery trend
from the economic crisis.
Comments to data are provided in the sector-by-sector analysis.
5.2.6.1 Industry sector
According to the IPCC guidelines and to data reported in section 1.A.2 of CRF, the industrial sector
considered herein excludes refineries and includes blast furnaces and emissions due to the electricity self-
production. Reference is made only to emissions connected to energy use, excluding process emissions
reported in section 2.A-C of CRF (see paragraph 5.6 “Projection of emissions from industrial processes”).
The next table reports the projections for final energy consumption in industry (Mtoe) for WM scenario,
while the emission trend is reported in Figure 5.11.
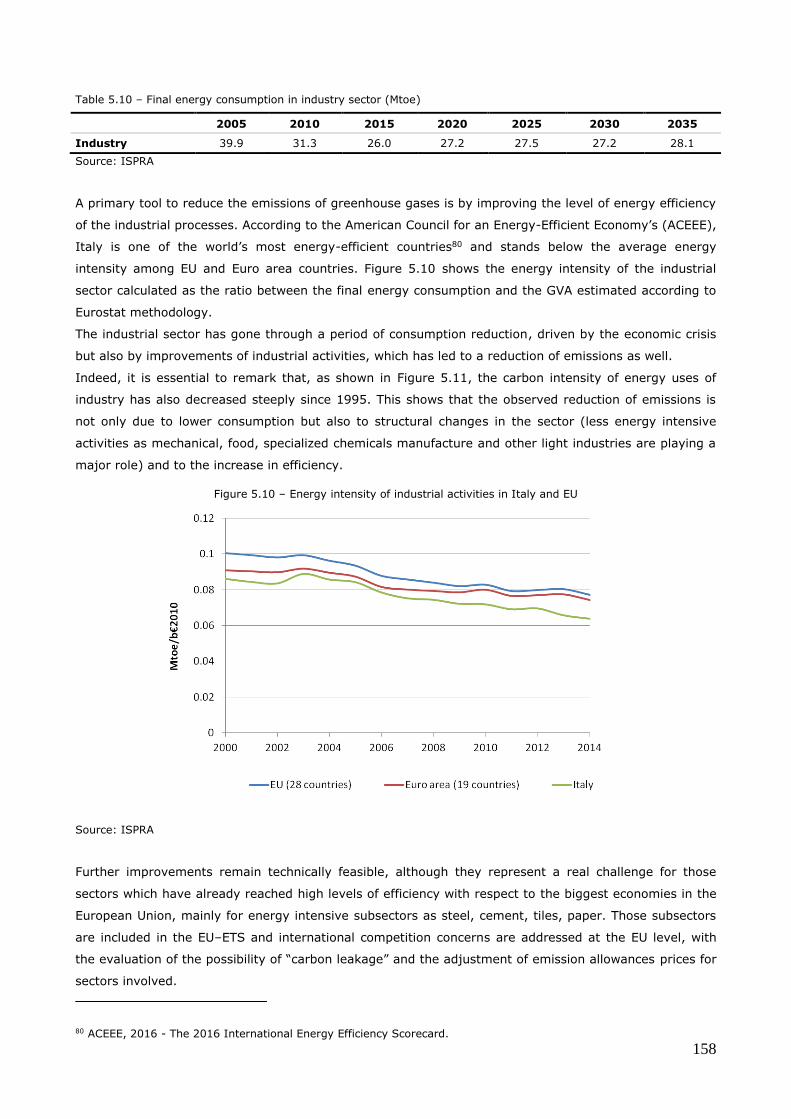
158
Table 5.10 – Final energy consumption in industry sector (Mtoe)
2005 2010 2015 2020 2025 2030 2035
Industry 39.9 31.3 26.0 27.2 27.5 27.2 28.1
Source: ISPRA
A primary tool to reduce the emissions of greenhouse gases is by improving the level of energy efficiency
of the industrial processes. According to the American Council for an Energy-Efficient Economy’s (ACEEE),
Italy is one of the world’s most energy-efficient countries80 and stands below the average energy
intensity among EU and Euro area countries. Figure 5.10 shows the energy intensity of the industrial
sector calculated as the ratio between the final energy consumption and the GVA estimated according to
Eurostat methodology.
The industrial sector has gone through a period of consumption reduction, driven by the economic crisis
but also by improvements of industrial activities, which has led to a reduction of emissions as well.
Indeed, it is essential to remark that, as shown in Figure 5.11, the carbon intensity of energy uses of
industry has also decreased steeply since 1995. This shows that the observed reduction of emissions is
not only due to lower consumption but also to structural changes in the sector (less energy intensive
activities as mechanical, food, specialized chemicals manufacture and other light industries are playing a
major role) and to the increase in efficiency.
Figure 5.10 – Energy intensity of industrial activities in Italy and EU
Source: ISPRA
Further improvements remain technically feasible, although they represent a real challenge for those
sectors which have already reached high levels of efficiency with respect to the biggest economies in the
European Union, mainly for energy intensive subsectors as steel, cement, tiles, paper. Those subsectors
are included in the EU–ETS and international competition concerns are addressed at the EU level, with
the evaluation of the possibility of “carbon leakage” and the adjustment of emission allowances prices for
sectors involved.
80 ACEEE, 2016 - The 2016 International Energy Efficiency Scorecard.

159
Figure 5.11 shows GHG emissions from energy consumption in industry and the carbon intensity of the
sector.
Compared to energy intensity, carbon intensity has decreased steeply due to the change in industrial
structure and fuel mix, where natural gas, electricity and derived heat have increased their shares. For
the projected years, further fuel switches from more carbon intensive fuels to natural gas are unlikely.
Future improvements are mainly expected from moderate increases in efficiency and electrification of
activities.
Figure 5.11 – Trends of GHG emissions and carbon intensity for industry sector
Source: ISPRA
5.2.6.2 Transport sector
In conformity with the IPCC Guidelines, the transport sector includes road and railway transportations,
domestic air traffic, the national amount of international air flights (landing and take-off) and coastal
navigation, as well as the consumptions in the harbour from ships travelling in international voyages.
The next table reports historical data and projections for final use of energy . Starting from 2015, energy
consumption will decrease up to 2025 with average annual rate of 0.56% per year.
Table 5.11 –Final energy consumption in transport sector (Mtoe)
2005 2010 2015 2020 2025 2030 2035
Transport 44.8 41.7 39.5 39.0 37.4 38.8 38.4
Source: ISPRA
GHGs emissions from this sector registered a strong historical growth from 1990 to 2007 (+25.8%).
Following the economic downturn, the trend has changed direction registering a reduction of 18% in the
period 2007-2015. Also, projected emissions are expected to slightly decline after 2015 up to 2025.
Following 2025, emissions are expected to remain stable up to 2035.
Road transport accounts for almost the totality of sector emissions (93.8% in 2015). Passenger transport
is responsible for 61.4% of emissions in 2015, while goods and other fuel-uses (Public administration,
fisheries) account for the balance. Notwithstanding the increase of transport demand, both for

160
passengers and for freights, the projected emissions will be quite stable. This outcome is due to the
effects of the following planned measures:
- efficiency gain and emissions targets, including the development of low consumption vehicles
(preliminary estimation of the impact on gCO2/km emissions of future regulation on new passenger
cars, with target of 95 gCO2/km for the years since 2020; average CO2 emissions for new light duty
vehicles, LDV, of 175 gCO2/km since 2017 and 147 gCO2/km since 2020);
- increase of electric vehicle fleet from near zero in 2015 to about 4-5 million in 2030;
- modal optimization: car sharing, car pooling and shared taxi initiatives for passenger transport;
- infrastructures: extension and modernization of the local railway network.
The modal split is foreseen to remain substantially unchanged up to 2020 for passengers, whereas a
significant increase in railway / ship goods transport is expected. From 2020 to 2030, an increase of
passenger-km in railway and public transport is foreseen.
Table 5.12 shows historical and projected emissions related to fuels sold to ships and aircrafts for
international transport. For international aviation, emissions are expected to decrease after 2015 up to
2020; then, a slight increase has been projected up to 2035, although it should not be large enough to
return to 2015 levels. In the period 2015-2035, a 12.2% reduction of aviation’s emissions is foreseen. As
for international maritime transport, projected emissions show a steady increase up to 2035 (+23.2%
since 2015).
Table 5.12 – Emissions from international bunkers (Mt CO2 eq.).
1990 2005 2010 2015 2020 2025 2030 2035
Aviation 4.2 8.9 9.1 9.8 7.9 8.4 8.5 8.6
Marine 4.3 6.9 7.0 5.6 5.7 6.0 6.3 6.9
Source: ISPRA
5.2.6.3 Civil and agricultural sectors
The next table reports historical data and projections for energy final consumption in civil and agriculture
sectors.
Table 5.13 – Final energy consumption in civil sector (Mtoe)
2005 2010 2015 2020 2025 2030 2035
Services 15.1 17.0 15.4 16.2 16.3 16.5 17.3
Residential 33.9 35.4 32.5 34.4 33.7 33.4 32.7
Civil sector (total) 49.0 52.4 47.9 50.6 50.0 49.9 50.0
Agriculture 3.5 3.1 3.0 2.7 2.7 2.7 2.7
Source: ISPRA
The sectors are characterized by the following features:
- agriculture: moderate penetration of gas in the agricultural sector results in slight decrease of CO2
emissions from energy uses (from 7.7 Mt in 2015 to 7.3 Mt in 2030);
- buildings (residential and tertiary): the main driver in the residential sector is the increase of
families, while for services the main driver is the value added. It is expected a slight yearly increase
of total square meters for buildings, both residential and services. The increase in heating demand

161
will be offset by the estimated natural gas expansion, by higher electricity penetration, and by the
expected efficiency gains according to the National Plan for Energy Efficiency and minimal standards
for buildings. As for building renovations, an annual average rate of 0.56% has been considered.
Such effects will result in CO2 emission reductions (from 74.1 Mt in 2015 to 70.2 Mt in 2030). The
scenario takes into account the dynamic of degree days as in PRIMES 2016.
The residential sector shows a slight increase of energy consumption from 2015 to 2035 (+0.5%), while
services consumption will increase over the same period (+12.5%). The share of energy consumption by
services in the civil sector is expected to grow from 32.1% in 2015 to 34.6% in 2035, with a higher
growth rate in the last five years of the projection period, according with higher GVA annual rate.
5.3 Emissions from other sectors
In Figure 5.4, GHG emissions from non-energy sectors are reported. As can be noted, a sharp emissions
reduction is registered between 2005 and 2015. This reduction is due to the effect of the following factors
(in order of importance):
- implementation on N2O emission control in the adipic acid and nitric acid production;
- reduction of emissions from landfills due to increased recovery of methane;
- reduction of other process emissions due to a reduction of related industrial production;
- increase of recovery of animal wastes for biogas production.
According to the scenario, projected emissions are to remain quite stable in the period 2015-2020 and to
show further slightly decreases from 2020 onward. The overall trend represents the combination of
different evolutions of the underlining sectors and gases, in particular a stable trend in emissions from
solvent, agriculture and industrial processes and a sizeable reduction of emissions from the waste sector.
5.3.1 Projections of emissions from industrial processes
Emission projections for most industrial processes have been calculated using the value added average
annual rates shown in Table 5.14 to estimate expected activity production levels. Information directly
communicated from industry has been used for aluminium production and for F-gases production and
consumption. For SF6 used in magnesium and aluminium foundries and for solvent and other product
use, future trends have been estimated extrapolating most recent data and considering the
implementation of the European Regulation n. 517/2014 on F-gases (F-gases Regulation), the European
Directive 2010/75/EC regarding the reduction of VOC emissions due to the use of solvent (Industrial
Emissions Directive) and the European Directive 2004/42/EC on the limitation of emissions of VOC due to
the use of organic solvents in certain paints and varnishes and vehicle refinishing products (Deco Paint
Directive).

162
Table 5.14 – VA average annual rates for the industrial processes 2015-2035
2016-2020 2021-2025 2026-2030 2031-2035
A. Mineral Products
1. Cement Production 1.74% 1.35% 1.59% 1.76%
2. Lime Production 1.17% 0.65% 0.52% 0.59%
3. Limestone and Dolomite Use 1.17% 0.65% 0.52% 0.59%
4. Soda Ash Production and Use 0.41% 0.04% 0.03% 0.42%
Glass Production (decarbonising) 0.65% 0.61% 0.62% 0.64%
B. Chemical Industry
1. Ammonia Production 0.14% -1.24% -1.34% -1.02%
2. Nitric Acid Production 0.14% -1.24% -1.34% -1.02%
3. Adipic Acid Production 0.14% -1.24% -1.34% -1.02%
4. Carbide Production 0.14% -1.24% -1.34% -1.02%
5. Other
Carbon Black 0.14% -1.24% -1.34% -1.02%
Ethylene 0.41% 0.04% 0.03% 0.42%
Styrene 0.41% 0.04% 0.03% 0.42%
Titanium dioxide 0.14% -1.24% -1.34% -1.02%
Propylene 0.41% 0.04% 0.03% 0.42%
C. Metal Production
1. Iron and Steel Production
Steel 0.43% 0.04% 0.04% 0.23%
Pig Iron 0.43% 0.04% 0.04% 0.23%
Sinter 0.43% 0.04% 0.04% 0.23%
2. Ferroalloys Production 1.13% 0.59% 0.30% 0.32%
Source: ISPRA
The scenario includes the reduction of N2O emissions from the nitric acid production obtained with the
adoption of the most advanced technologies to be applied to the main existing nitric acid production
plants by 2015 (installation of selective catalytic reduction systems for the treatment of process gases).
For the other categories, emission factors have been considered constant for the whole time series
assuming that no further additional measures will be implemented. Emission estimates consider the six
direct greenhouse gases under the Kyoto Protocol (CO2, CH4, N2O, HFCs, PFCs, SF6) plus nitrogen
trifluoride (NF3) which contribute directly to climate change owing to their positive radiative forcing effect.
The resulting GHGs emission scenarios by sector and by gas up to 2035 are reported in Table 5.15 and in
Table 5.16, respectively. The stability of industrial processes emissions is connected to the increase,
following the economic crisis, of industrial production in mineral industry, compensated by the decreasing
use of substitutes of ozone depleting substances, the other emissions being stable.
Table 5.15 – Emission scenario by sector from industrial processes and solvent use (MtCO2 eq.)
2005 2010 2015 2020 2025 2030 2035
Mineral products 23.3 17.4 11.1 14.7 15.6 16.5 17.8
Chemical industry 10.7 3.4 3.0 3.1 3.0 3.0 2.9
Metal production 2.8 2.0 1.6 1.5 1.5 1.5 1.5
Production of halocarbons and SF6 1.5 1.1 1.1 1.1 1.1 1.1 1.1
Consumption of halocarbons and SF6 6.0 9.6 12.2 11.7 7.3 7.0 6.0
Total Industrial Processes 44.3 33. 5 29.0 32.2 28.5 29.0 29.3
Solvent use 1.3 1.1 1.0 1.3 1.3 1.3 1.3
Total Industrial Processes and Solvent Use 45.7 34.6 30.1 33.5 29.9 30.4 30.6
Source: ISPRA

163
Table 5.16 – Emissions by gases from industrial processes and solvent use (MtCO2 eq.)
2005 2010 2015 2020 2025 2030 2035
CO2 28.8 21.8 15.0 19.0 19.8 20.7 21.9
CH4 0.1 0.1 0.0 0.1 0.1 0.1 0.1
N2O 8.3 1.2 0.6 0.7 0.7 0.7 0.7
HFCs 6.1 9.6 12.3 11.8 7.3 6.9 6.0
PFCs 2.0 1.5 1.7 1.6 1.6 1.6 1.6
SF6 0.6 0.4 0.4 0.3 0.3 0.3 0.3
NF3 0.0 0.0 0.0 0.0 0.0 0.0 0.0
Total GHGs 45.7 34.6 30.1 33.5 29.9 30.4 30.6
Source: ISPRA
5.3.2 Projections of emissions from the agriculture sector
GHG emissions figures from the agriculture sector are updated and improved thanks to different national
research studies81. Methodologies for the preparation of national inventories under the Convention on
Long-Range Transboundary Air Pollution and the United Nations Framework Convention on Climate
Change are kept consistent82.
Between 1990 and 2015, GHGs emissions from the agriculture sector have decreased by 16.0%.
Emission trends are due to the reduction in activity data such as the number of animals, the variation of
cultivated surface and crop production and use of nitrogen fertilizers, mainly linked to Common
Agricultural Policy (CAP) measures83. Historical activity data trends are described in Chapter 2. Emission
projections were estimated with the same model used for the preparation of the national emission
inventory submitted in 201784. Moreover, activity data for emission projections are consistent with those
communicated to the UNECE for the implementation of the Protocol to The 1979 Convention on Long-
Range Transboundary Air Pollution to Abate Acidification, Eutrophication and Ground-Level Ozone
(Gothenburg Protocol).
To estimate the number of different animal categories, a model has been developed by ENEA85 and
information is updated every year86. For the use of fertilizers, ENEA assumptions are based on the
European Fertilizer Manufacturers Association (EFMA) forecast. For the surface and agricultural
production, a trend has been estimated on the basis of the 1990-2015 time series.
In Table 5.17, the assumptions adopted for fertilizers consumption are shown. A decrease of 21.8%
of total consumption of nitrogen synthetic fertilizers has been estimated in 2020 with respect to
2005. From 2020 onwards, data are assumed to be constant since no other information is available.
In Table 5.18, assumptions for the main animal categories (cattle, swine and poultry) are shown. The CAP
81 NIR 2017, Chapter 5 - ISPRA, Report 261/2017 http://www.isprambiente.gov.it/it/pubblicazioni/rapporti/italian-
greenhouse-gas-inventory-1990-2015.-national-inventory-report-2017 82 ibidem 83 Rural Development Plans (RDPs) from Italy are available at URL: https://ec.europa.eu/agriculture/rural-development-2014-2020/country-files/it_en 84 NIR 2017, Chapter 5 - ISPRA, Report 261/2017 http://www.isprambiente.gov.it/it/pubblicazioni/rapporti/italian-
greenhouse-gas-inventory-1990-2015.-national-inventory-report-2017 85 ENEA, 2006. Valutazione del potenziale di riduzione delle emissioni di ammoniaca. Rapporto Finale. ENEA UTS-
PROT, Unità Inquinamento Atmosferico. Settembre 2006. 86 D’Elia et al., 2008. Nitrogen related research and policy activities in Italy: The Ammonia experience in Italy.
Presentation Task-force on Reactive Nitrogen, Wageningen, 21 – 23 Maggio 2008. Updated scenarios are available at
the link http://gains-it.bologna.enea.it/gains/IT/index.login.

164
2014-202087 agenda, such as the milk quota reform, will lead to revise these estimates in the next future.
Table 5.17 – Assumptions used for estimating GHG emission projections from fertilizers consumption
Fertilizers (kt nitrogen*) 2005 2010 2015 2020 2025 2030 2035
Consumption of urea 318 210 266 291 291 291 291
Consumption of other nitrogen
fertilizers 462 287 252 319 319 319 319
Total consumption of nitrogen
fertilizers 780 497 518 610 610 610 610
* Nitrogen content in synthetic fertilizers Source: ISPRA
Table 5.18 – Assumptions used for GHG emissions projections with respect to the number of animals
Animal category (kheads) 2005 2010 2015 2020 2025 2030 2035
Dairy cattle 1,842 1,746 1,826 1,653 1,642 1,631 1,610
Non-dairy cattle 4,410 4,086 3,9556 4,090 4,057 3,970 3,782
Swine 9,200 9,321 8,683 9,526 9,596 9,693 9,700
Poultry 188,595 198,347 196,387 201,310 204,378 205,590 204,740
Source: ISPRA
In Table 5.19, GHG emissions projections by source category are shown. After an initial decrease in the
period 2005-2010, emissions are estimated to remain constantly around 30.5 Mt. The main drivers for
GHG emissions reductions are given by agricultural soils (-13.8% in 2030), whose emissions mainly
decreased in the period 2005-2010. This source accounts for 32.3% of total agricultural emissions in
2005.
Table 5.19 – Emissions for the agriculture sector (MtCO2 eq.)
2005 2010 2015 2020 2025 2030 2035
Enteric Fermentation 13.8 13.6 13.8 13.8 13.9 13.9 13.8
Manure Management 6.1 5.9 5.1 5.2 5.3 5.3 5.2
Rice Cultivation 1.8 1.8 1.7 1.8 1.8 1.9 1.9
Agricultural Soils 10.6 8.8 9.0 9.2 9.1 9.1 9.0
Field Burning of agricultural residues 0.0 0.0 0.0 0.0 0.0 0.0 0.0
Liming and urea application 0.5 0.4 0.4 0.5 0.5 0.5 0.5
TOTAL GHGs 32.7 30.5 30.0 30.5 30.6 30.6 30.3
Source: ISPRA
5.3.3 Projections of emissions from the LULUCF sector
The driving forces for projections are the activity data linked to the LULUCF sector; in particular, those
related to forest land (and related activity Forest Management), cropland and grassland constitute the
key variables to project emissions by sources and removals by sinks.
As reported in chapter 4, Italy has submitted information on Forest Management Reference Level
(FMRL88), equal to -22,166Mt CO2 eq. per year applying a first-order decay function for harvested wood
products (HWP) and -21,182 Mt CO2 eq. per year assuming instantaneous oxidation of HWP.
87 On 26 June 2013 the Commission, the Council and the European Parliament reached a political agreement on the
reform of the CAP 2014-2020. 88 Submission of information on forest management reference levels by Italy: http://unfccc.int/files/meetings/ad_hoc_working_groups/kp/application/pdf/awgkp_italy_2011.pdf

165
According to Decision 2/CMP.7, methodological consistency between the FMRL and reporting for forest
management during the second commitment period of the Kyoto Protocol has to be ensured, applying
technical correction if necessary; the methodological elements triggering the need for a technical
correction have been analyzed, providing a description on the detected inconsistencies and a timing for
the addressing of the issue (Table 5.20).
Table 5.20 – Elements triggering a methodological inconsistency between the FMRL and FM reporting
Criteria Description Timing
The method used for GHG reporting
(for Forest land remaining forest
land or Forest Management)
changed after the adoption of FMRL
The FMRL has been calculated with the EU models G4M (IIASA)
and EFISCEN (EFI). Estimates of emissions and removals under
FM activities have been carried out with the growth model For-
est, used to estimate the net change of carbon in the five
reporting pools.
2017-2018
Forest characteristics and related
management89
Availability of new data resulting from the ongoing NFI and
consequent recalculations of the reported data under FM and
Forest Land Remaining Forest Land used to establish the
reference level.
2017-2018
Harvested wood products The estimates have been carried out on the basis of the 2013 KP
Supplement (IPCC 2014) methodology. 2017
Therefore, to ensure methodological consistency between the FMRL and reporting for Forest Management
during the second commitment period, Italy is going to apply a technical correction. Qualitative
information on TC and methodological consistency as well as a quantitative assessment will be reported,
consistently with the requirements of decision 2/CMP.7, annex, paragraph 14 and guidance of the 2013
KP Supplement (IPCC, 2014, par. 2.7.6.3). No further measures are planned for forestry.
In table 5.21, projections for LULUCF categories have been reported. These projections have been carried
out on the basis of 1990-2015 trend, subcategory by subcategory and have been officially reported under
Article 3(2) of the Monitoring Mechanism Decision (Commission Decision 280/2004/EC).
Table 5.21 – Projections for LULUCF categories (Gg CO2 eq.)
2005 2010 2015 2020 2025 2030 2035
Land Use, Land-Use Change and Forestry -28,385 -31,609 -36,218 -24,381 -39,699 -41,535 -43,375
Forest land -34,477 -36,541 -39,924 -27,564 -42,013 -43,091 -44,157
Cropland 1,459 1,335 2,160 1,777 1,392 1,008 623
Grassland -2,648 -4,172 -6,658 -7,309 -7,981 -8,655 -9,327
Wetlands 8 - - - - - -
Settlements 7,804 7,897 7,936 7,897 7,853 7,883 7,853
Other Land - - - - - - -
Harvested wood products -531 -128 267 819 1,050 1,321 1,633
Source: ISPRA
Communication of 11 May 2011 regarding harvested wood products value by Italy: http://unfccc.int/files/meetings/ad_hoc_working_groups/kp/application/pdf/awgkp_italy_corr.pdf 89 This includes, among others: age-class structure, increment, species composition, rotation lengths, management practices, etc.

166
Under the WM scenario, existing policies have been considered to remain in place until 2020: according
to the “Whereas” 22 of Regulation (UE) No 1305/2013 on Rural Development, Member States should
maintain the level of efforts made during the 2007-2013 programming period. Therefore, in this scenario
the future mix of agronomic and financial measures remains constant on the same total of hectares
provided to national and regional levels in the programming period 2007-2013. Regarding the use of
land, in line with historical trends but also considering the proposed legislation at the national level on the
containment of land consumption, a 2% reduction of cropland areas and a 2% increase of grassland
areas have been assumed in a ten-year period.
Future developments of emission and removal projections for subsectors under LULUCF are expected,
considering the new Regulations currently being discussed at the EU level. In this view and in the
framework of the reporting and accounting under EU Decision 529/2013, further activity scenarios were
developed for cropland and grassland for the 2014-2020 period, to assess the main changes while taking
into account the different management practices90.
The following policies are foreseen to have further impacts:
- enhancement of agricultural areas and containment of land consumption;
- implementation of CAP (first and second pillar) at national and regional levels.
The abovementioned policies are associated with three main hypotheses:
- the introduction of “Greening” in 2015 as stated in the Regulation (EU) No. 1307/2013 on direct
payments;
- an increase of 20% in 2020 (compared to 2012) of the areas where conservative agricultural
practices (organic, sustainable, set aside, etc.), in the context of RDP, are applied;
- the combined effect of the two previous measures (Greening and the enhancement of the area with
conservative agricultural practices).
Detailed information on the assumptions and the quantitative assessment of scenarios considering
different paths then those reported in the current WM scenario may be found in the Italian Progress
report on LULUCF action under the art. 10.2 of Decision 529/20191.
5.3.4 Projections of emissions from the waste sector
The following projections have been prepared in conformity with most recent inventories and evaluations
on the implementation of mitigation measures. The driving forces for projections estimations are
especially activity data linked to the whole waste sector and the reduction of biodegradable waste in
landfills. In particular, the municipal waste cycle has been studied, analysing its evolution through the
years on the basis of actions that have already been put into effect.
In the reference scenario, the total amount of annual waste production has been estimated on the basis
of official population forecasts provided by the National Institute of Statistics (ISTAT). Starting from the
90 The following management practices have been considered: organic farming, sustainable agriculture, conservation practices, set-aside, ordinary agriculture, ordinary grazing land, managed grazing land, improved grazing land. 91 Italian Progress report on LULUCF action under the art. 10.2 of Decision 529/2013: http://cdr.eionet.europa.eu/it/eu/mmr/lulucf/envwm_kbq/ITALY_Progress_report_on_LULUCF_Article_10_2__of_dec_529_update_2016.pdf/manage_document

167
production, waste fluxes have been analysed on the basis of the following waste management options:
recycling, landfilling, incineration, mechanical biological treatments and composting.
Focusing on recycling and other options, national circumstances turn out being very different from
northern to southern regions. Many northern cities have already reached and exceeded their fixed target,
whereas some southern regions are lagging behind in complying with national targets for separate
collection, although significant improvements have been made over the last few years allowing to reach
47.5% for separate collection in 2015 (against 37.7% in 2011). Governmental efforts aimed to the
improvement of waste management lead to an optimistic outlook for the fulfilment, by the deadlines, of
the commitments for reuse and recycling set up by the current legislation (50% by weight within 2020 -
Directive 2008/98/EC).
Table 5.22 – Emission for the waste sector (Gg)
2005 2010 2015 2020 2025 2030 2035
CO2
Waste incineration without energy recovery
226.5 162.3 111.2 107.1 94.7 82.3 69.8
Total waste sector 226.5 162.3 111.2 107.1 94.7 82.3 69.8
CH4
Landfills 787.1 700.6 564.5 406.8 321.4 273.3 184.8
Biological treatment 3.7 4.6 4.9 6.8 6.9 7.0 7.1
Waste incineration 2.5 2.3 2.3 2.3 2.2 2.3 2.2
Wastewater treatment 110.7 105.8 99.7 100.7 102.6 104.8 105.1
Total waste sector 903.9 813.4 671.4 516.6 433.1 387.4 299.2
N2O
Biological treatment 1.3 1.7 1.7 2.4 2.5 2.5 2.6
Waste incineration 0.1 0.1 0.1 0.1 0.1 0.1 0.1
Wastewater treatment 4.4 4.5 4.5 4.7 4.7 4.8 4.8
Total waste sector 5.9 6.3 6.3 7.2 7.3 7.4 7.4
CO2 reported in the energy sector
Waste incineration with energy recovery
2780.6 4253.8 4547.1 6018.9 7132.8 8246.9 9361.0
Source: ISPRA
Regarding landfills, the total amount of waste disposed into landfills will vary according to the actual
trend, whereas the composition of waste has varied as a consequence of the compliance with the
separate collection target. Notwithstanding, the amount of biodegradable waste disposed into landfills is
not totally complying with the target of landfill directive (D.lgs. 36/2003) resulting in 121
kgwaste/inh.*year rather than 115 kgwaste/inh.*year. The share of landfill gas collected will reach 60% in
2028.
Furthermore, from 2010, each municipal waste incinerator is equipped with an energy recovery system
and only industrial waste could still be treated without energy recovery. Emissions from incinerators with
energy recovery are reported in the energy sector, while emissions from incinerators without energy
recovery are reported in the waste sector. The total amount of waste incinerated will increase in line with
the current trend. Finally, the amount of waste treated in Mechanical biological treatment plants will
increase in line with the strategy to pre-treat waste in order to obtain a bio-stabilized product to dispose

168
to landfills and a dry-fraction to burn in waste-to-energy facilities. As a consequence of this waste cycle
projection, biological waste treated in composting and anaerobic digestion plants will also increase
following the trend up to 2035. According to these projections, a 48% reduction can be expected in 2035
with respect to 2015 in overall greenhouse gas emissions from the waste sector, expressed in terms of
CO2 equivalent, essentially as a result of a reduction in methane emissions from landfills.
5.4 Projection results and emissions targets
Table 5.23 summarizes the GHG emissions up to 2035, together with the EU targets, divided by ETS and
non–ETS sectors.
Emissions target for non-ETS sectors in year 2020 is 291.0 MtCO2 eq. (see par. 4.1.4 for detailed
methodology). Considering emissions levels according to the WM scenario (line “Non-ETS sector” and
“ESD/ESR targets” in the table) 2015 target has already been achieved and 2020 target is in line to be
achieved, while there is a sizeable distance from the proposed 2030 target.
The mitigation options identified to "fill" the gap are reported in tables 4.15-4.17 and 4.19; the overall
potential of the identified measures amounts to about 51.1 Mt CO2 in 2020, although some of those
effects are related to ETS sectors.
Table 5.23 – National GHGs emissions and European targets (Mt CO2 eq.)
1990 2005 2010 2015 2020 2025 2030 2035
National emissions 519.9 579.4 505.0 433.0 425.8 407.0 392.0 383.9
ETS sectors
247.5 199.5 156.2 161.0 152.7 140.1 132.2
Non-ETS sectors (ESD/ESR)
329.4 302.8 274.7 262.6 251.9 249.2 248.4
Civil Aviation
2.5 2.7 2.1 2.2 2.3 2.7 3.2
ESD/ESR targets*
304.2 291.0 220.7 -
Gap
-29.5 -28.4 +28.5 -
* Target has been set up to 2020 by the Effort Sharing Decisions (ESD) 406/2009/EC, while the 2030 target is still under negotiation
among EU Member States. The reported emissions target is provisional and set to -33%wrt 2005 level. The target for 2025 is not
reported because the starting point for 2021-2030 period is not yet defined. NF3 emissions are included into the ESD/ESR target for the
post-2020 period.
Source: ISPRA
5.5 Sensitivity analysis
Sensitivity analysis has been performed with values for macroeconomic parameters different from those
used to carry out the WM projections. The most recent national statistics of population, with a lower
growth rate compared to PRIMES2016 reference scenario, have been considered (Tab 5.24). Also,
starting from actual 2016 levels, a lower GDP growth rate up to 2020 has been used in accordance with
population growth rate. From 2020 to 2030, the same GDP rate used in the WM scenario has been
implemented. As for international carbon and fuels prices, lower costs have been applied to create worse
conditions for the optimization process in term of fossil fuels preference against renewable sources.

169
Table 5.24 – Parameters value for sensitivity and WM scenarios
Scenario Parameter Unit 2015 2020 2025 2030
WM scenario Population Thousand
60,800 62,065 63,118 64,229
Sensitivity scenario 60,800 60,719 61,918 62,290
WM scenario GDP Billion €2010
1,547 1,675 1,776 1,885
Sensitivity scenario 1,547 1,644 1,743 1,850
WM scenario Coal €2010/GJ
1.91 2.39 2.85 3.42
Sensitivity scenario 1.91 1.87 2.33 2.78
WM scenario Natural gas €2010/GJ
6.47 8.05 8.71 9.47
Sensitivity scenario 6.47 6.52 7.39 8.27
WM scenario Oil €2010/GJ
8.04 12.51 14.20 15.65
Sensitivity scenario 8.04 8.62 10.2 11.77
WM scenario Carbon €2010/tCO2
7.2 14.4 21.5 32.1
Sensitivity scenario 7.2 10.0 14.0 27.0
Source: ISPRA
In the following table the GHG emissions projections of Sensitivity scenario are compared to the results of
WM scenario projections.
Table 5.25 – GHG emission (Mt CO2 eq.)
2015 2020 2025 2030
WM scenario 433.0 425.8 407.0 392.0
Sensitivity scenario 433.0 435.3 408.5 380.2
Source: ISPRA
Higher projections for 2020 in the sensitivity scenario are related to lower fossil fuels and carbon prices,
while 2030 projections are driven by lower commodity demand due to lower GDP and population. In
particular, transport and civil sectors show lower emissions as compared to WM projections since they are
more sensitive to the demand reduction. Figure 5.12 shows the differences between WM and Sensitivity
scenarios for the considered parameters and GHG projections.
Figure 5.12 – Relative difference between sensitivity scenario and WM scenario
Source: ISPRA
-40% -35% -30% -25% -20% -15% -10% -5% 0% 5%
GHG Emissions
Carbon price
Coal price
NG price
Oil price
GDP
Population
2020 2025 2030

170
5.6 Comparisons with previous National Communications
An outline of the emission scenarios since the 3rd National Communication is reported (Table 5.26) in
order to compare projected emissions with different sets of measures. Projections from WM scenarios
have been considered. For the 6th National Communication, projections from WAM scenarios are also
reported. Similar approaches were used to perform scenario and emission projections in the various
National Communications, so the comparison between a projection trend and the previous ones gives
information about without measure (WOM) scenarios patterns. Emission projections of WM scenarios
reported in the 3rd National Communication could supply emissions esteems without the measures
implemented after 2000.
Projected GHG emissions for 2010, with a range of ±2%, had remained quite stable between the 3rd and
the 4th National Communications; instead, since the 5th National Communication the effects of the
economic crisis, started in 2008, became evident with a sizeable reduction of projected levels with
respect to the historical path. The registered reduction was also due to the effect of measures
implemented up to mid-2009.
In the projections reported in the 6th National Communication, emissions were further reduced due to the
depth of the economic crisis and to new measures implemented up to 2010 (WM scenario) or planned up
to 2012 (WAM scenario). For other sectors and gases, it has to be underlined that the methodology for
the emissions calculations (IPCC guidelines) has deeply changed between 1997 and 2004. Therefore,
projections have been developed with different methodology and assumptions. The effect of changes can
be seen in the changes in historical total GHGs emissions between the various NCs.
Figure 5.13 – GHG emissions of present and past NCs
Source: ISPRA
350
400
450
500
550
600
650
700
1990 1995 2000 2005 2010 2015 2020 2025 2030
GH
G (M
t C
O2e
q.)
III
IV
V VI (WM)
VI (WAM)
VII

171
Table 5.26 – Emissions from previous and current NCs (Mt CO2 eq.)
1990 2005 2010 2015 2020 2025 2030
GHGs energy, Mt, II NC 424.3 478.8 491.8
GHGs energy, Mt, III NC 424.9 456.0 484.1 513.1 553.9
GHGs energy, Mt, IV NC 419.4 480.1 490.8 510.4 524.1
GHGs energy, Mt, V NC 419.5 474.4 450.2 452.2 441.0
GHGs energy, Mt, VI NC 417.7 471.9 414.6 404.3 427.1 427.5 433.0
GHGs energy, Mt, VI NC (WAM) 417.7 471.9 414.6 396.1 366.0 349.5 340.1
GHGs energy, Mt, VII NC 420.6 476.5 417.6 354.2 346.6 333.5 319.1
GHGs no energy, Mt, II NC 118.7 109.0 123.2
GHGs no energy, Mt, III NC 96.1 92.4 95.6 101.2 106.3
GHGs no energy, Mt, IV NC 97.4 99.4 96.1 97.4 99.3
GHGs no energy, Mt, V NC 97.4 99.2 91.6 90.9 93.2
GHGs no energy, Mt, VI NC 101.2 102.5 85.7 85.8 89.0 89.3 90.9
GHGs no energy, Mt, VI NC (WAM) 101.2 102.5 85.7 85.8 89.0 89.3 90.9
GHGs no energy, Mt, VII NC 99.3 102.9 87.4 78.8 79.2 73.5 72.9
TOTAL GHGs, II NC 543.0 587.8 615.0
TOTAL GHGs, III NC 521.0 548.3 579.7 614.4 660.3
TOTAL GHGs, IV NC 516.8 579.5 587.0 607.8 623.4
TOTAL GHGs, V NC 516.9 573.6 541.8 543.1 534.2
TOTAL GHGs, VI NC 519.0 574.4 505.0 490.2 516.1 516.8 523.9
TOTAL GHGs, VI NC (WAM) 519.0 574.4 505.0 482.0 455.0 438.8 431.0
TOTAL GHGs, VII NC 519.9 579.4 505.0 433.0 425.8 407.0 392.0
Source: ISPRA
Further insights about a WOM scenario can be carried out by estimating the effect of the implemented
measures considered in the present NC. The impacts of implemented measures were estimated for 2015
(37.1 Mt CO2eq), 2020 (51.1 Mt CO2eq), and 2030 (55.1 Mt CO2eq) and are assumed to be equal to 0 in
2007. The linear interpolation of data between each pair of years allows to estimate the impact for each
year. The result is shown in Figure 5.14, where the WOM scenario, obtained by adding to WM scenario
the interpolated effect of measures, takes into account the effects of economic crisis. The 4th NC
projections can be considered as a WOM scenario before economic crisis with measures implemented up
to 2007.

172
Figure 5.14 – WOM scenario estimate with and without taking into account the economic crisis effects
Source: ISPRA
0
100
200
300
400
500
600
700
WOM scenario before economic crisis (IV NC up to 2007)
WOM scenario including economic crisis
WM VII NC
GH
G(M
t C
O2e
q)

173
6 VULNERABILITY ASSESSMENT, CLIMATE CHANGE IMPACTS AND
ADAPTATION MEASURES
6.1 Climate modelling, projections and scenarios
Italy is located in an area identified as particularly vulnerable to climate change92: as a matter of fact, the
Mediterranean region is considered to be a hotspot of climate change impacts93.
Considerable impacts are expected because of climate change in many sectors, such as agriculture,
tourism, water resources and geo-hydrological hazards. Climate observations already confirm an increase
of the average temperature in Italy in the past, with a rate in the order of 1°C in the last 100 years and 2
°C in the last 50 years; extreme temperature indicators confirm this observed upward trend. The season
featuring the highest trend are summer and spring, while mountain areas show a higher sensitivity with
respect to lowland. As regards precipitation, trend tendency and related statistical significance are
variable, depending on the period considered, the geographical area and the season. Nevertheless, a
slight decrease of the cumulated annual precipitation (about 1%) is observed 94 95. Providing climate
projection for this area is a challenging topic due to the complex orography, ranging from high mountain
chains (Alps and Apennine) to a very diverse coastline. Italy is surrounded by the Mediterranean Sea and
the climate is influenced by the arid climate of North Africa and by the temperate and rainy climate of
central Europe. Following the Koppen-Geigen classification96 , three main climate categories are found in
Italy: warm temperature climate, snow climate and polar climate. The Italian peninsula is therefore a
good example of the need of high-resolution climate analysis required to provide detailed climate change
projection to support climate change analysis on impacts and vulnerability. Two different categories of
tools are available for this goal: dynamical and statistical downscaling. The first class of methods, based
on Regional Climate Models (RCMs) is the only currently available to provide climate scenarios over the
whole country in a uniform way, with the advantage to provide a large number of atmospheric variables,
not only in terms of average values but also of extremes. Nevertheless, RCMs are still affected by
significant systematic bias, due to several reasons. In recent years in order to try to overcome these
limitations, the WCRP Coordinated Regional Downscaling Experiment (CORDEX) project97 has been
established, to provide a global coordination of regional climate downscaling for improved climate change
adaptation policy and impact assessment.
92 Giorgi F. (2006). Climate change Hot-spots. Geophysical Research Letters 33: L08707. doi: 10.1029/2006GL025734 93 IPCC (2014a). Climate Change 2014: Impacts, Adaptation, and Vulnerability. Part A: Global and Sectoral Aspects. Contribution of Working Group II to the Fifth Assessment Report of the Intergovernmental Panel on Climate Change. Cambridge Universitt Press, Cambridge, United Kingdom and New York, NY, USA, 1132 pp. 94 Brunetti et al. (2006). Temperature and precipitation variability in Italy in the last two Centuries from homogenized instrumental time series. Int. J. Climatol. 95 Nanni et al. (2009). La variabilità e le tendenze del clima in Italia nel corso degli ultimi secoli. In: I cambiamenti climatici in Italia: evidenze, vulnerabilità e impatti, a cura di Castellari S. e Artale V., Centro EuroMediterraneo per i Cambiamenti Climatici, Bononia University Press, ISBN: 978-88-7395-484-2, 11-45 96 Kottek et al. (2006). World Map of the Köppen-Geiger climate classification updated. Meteorologische Zeitschrift 15(3):259-263 97 Giorgi et al. (2004). Mean, interannual variability and trends in a regional climate change experiment over Europe. II: climate change scenarios (2071-2100), Clim. Dyn. 23, 839–858.

174
In particular, EURO-CORDEX is the European branch of the CORDEX initiative. An ensemble of historical
simulations and climate projections was performed at 0.11° resolution in a combined effort among
several research groups. Hindcast simulations driven by ERA-Interim Reanalysis were evaluated in terms
of their ability to represent the basic patterns of the European climate for the period 1989–200898 against
the E-OBS dataset99. EURO-CORDEX models over the Mediterranean area show non-negligible
temperature biases and a generally high precipitation overestimation, up to 120% in summer. More
specifically over Italy, most of the models underestimate winter temperature (especially at high altitudes)
while summer temperature is overestimated by some models and underestimated by others; a wet bias
characterizes both seasons over the whole Italian area with some exceptions. The ability of ensemble
models to simulate heat waves was also evaluated100: even though local-scale feedbacks are better
represented at high resolution, combinations of parameterizations have to be improved or adapted.
High-resolution simulations with COSMO-CLM over Italy (0.0715°) has been performed by Euro-
Mediterranean center on Climate Change Foundation (a national research center funded in 2005 by
IMELS, Italian Ministry of Education, University and Research, and of Economy and Finance) in order to
assess the effects of increasing resolution on the quality of results101 102. Given the complex orography of
Italy, results have shown that high-resolution simulations, along with an optimized model configuration,
could provide good earnings. The main features of the Italian climate were well represented, biases being
general equal or lower than values that affect “state-of-the-art” regional climate simulations (i.e., EURO-
CORDEX data at 0.11°) with a high detail level, not obtainable with coarser resolutions.
Climate projections were performed over the XXI century employing the IPCC RCP4.5 and RCP8.5
scenarios, driven by the GCM CMCC-CM. Analysis were performed in terms of average and extreme
values10. Climate projections highlight a general warming expected in Italy at the end of XXI century,
along with a general reduction in precipitation, especially according to the RCP8.5 scenario. In particular,
climate changes in terms of precipitation generally project a reduction in the case of mean values and
‘less extreme’ indices (e.g. number of days with precipitation ≥ 10 mm) and an increase in the case of
‘more extreme’ indices (e.g. maximum of daily precipitation, number of days with precipitation ≥ 20 mm
and percentiles). These findings are qualitatively in agreement with the increase in heavy precipitation
over Italy found literature work103. With regard to temperature extremes, the climate change signal is
much more evident than for precipitation, indicating an increase in temperature for several extreme
indices, such as Summer Days (number of days when the daily maximum temperature is above
98 Kotlarski et al. (2005). Regional climate model simulations as input for hydrological applications: evaluation of uncertainties. Advances in Geosciences 5: 119–125. doi:10.5194/adgeo-5-119-2005 99 Haylock et al. (2008). A European daily high-resolution gridded data set of surface temperature and precipitation for 1950–2006. J. Geophys. Res. 113: D20119, doi: 10.1029/2008JD010201. 100 Vautard et al. (2013). The simulation of European heat waves from an ensemble of regional climate models within the EURO-CORDEX project. Climate Dynamics 41: 2555–2575. doi: 10.1007/s00382-013-1714-z 101 Bucchignani et al. (2016). High-resolution climate simulations with COSMO-CLM over Italy: performance evaluation and climate projections for the 21st century. International Journal of Climatology, 36(2), 735-756. doi:10.1002/joc.4379 102 Zollo et al. (2016). Extreme temperature and precipitation events over Italy: assessment of high resolution simulations with COSMO-CLM and future scenarios. International Journal of Climatology, 36(2), 987-1004. doi:10.1002/joc.4401 103 Jacob et al. (2014). EURO-CORDEX: new high-resolution climate change projections for European impact research. Reg. Environ. Change 14: 563–578, doi: 10.1007/s10113-013-0499-2.

175
25°C),Tropical Nights (number of days when the daily minimum temperature is above 20°C) and
percentiles. Specifically, this increase is more accentuated for scenario RCP8.5 and affects both minimum
and maximum temperature. It is worth noting that temperature projections are statistically significant
and consistent with others obtained with both global and regional models, for different emission
scenarios, while projected precipitation changes are affected by larger uncertainties.
More specifically, considering the future period 2021-2050 (Figure 1), a general increase of temperature
is recorded with respect to 1981-2010, up to 2° C under RCP8.5. Concerning precipitation, RCP4.5
scenario projects a general reduction in spring and a more accentuated reduction of summer, especially
over south Italy and Sardinia (up to 60%). Winter is affected by a small precipitation reduction over Alps
and south Italy and by a small increase in Sardinia and Po Valley. Finally, in autumn a general slight
precipitation reduction is projected(the percentage positive values reported for Apulia are mainly due to
the low absolute values observed in the control period). Under RCP8.5, instead, an increase of winter and
autumn precipitation is recorded over north Italy and a small reduction over south Italy. Spring
precipitation will diminish over south Italy, while in summer a general reduction is observed (with
exception of Apulia where, however, autumn precipitation have low absolute values in the control period).
Considering the future period 2071-2100 (Figure 1), a general temperature increase is projected in all the
seasons, between 3 and 4°C under RCP4.5. Instead, under RCP8.5, a larger warming is projected,
characterized by a marked seasonality, with peaks up to 8°C in summer. In terms of precipitation,
RCP4.5 shows in winter a moderate increase over north Italy and a slight reduction over south Italy,
while autumn is characterized by a general tendency toward precipitation increases. In spring, Italy will
be affected by a general reduction, and in summer an even stronger reduction (up to -60%).

176
Figure 1: Climate projections for temperature and precipitation considering the future periods 2021-2050
and 2071-2100 with respect to 1981-2010, for the four seasons and two different scenarios RCP4.5 and
RCP8.5.
6.2 Assessment of risks and vulnerability and climate change impacts
Italy is notoriously prone to natural hazards and climate change is expected to increase the Italian
vulnerability to climate-related hazards over the next decades. This, combined with the economic, social
and environmental pressures, makes Italy one of the most vulnerable country in Europe. The key risks
for the European area are mainly related to:104
increased water restrictions due to reduction in water availability combined with increased water
demand (e.g. for irrigation, energy and industry, domestic use), and with increased evaporative
demand, particularly in southern Europe;
increased impacts related to extreme heat events on health and well-being, labor productivity,
crop production, air quality, and wildfires risks in southern Europe;
increased economic losses and people affected by flooding in river basins and coasts.
The Italian National Adaptation Strategy (NAS) to climate change, adopted in 2015, analyzed the state of
scientific knowledge on impacts and vulnerability to climate change for the major socio-economic and
environmental sectors. The approach used in the NAS was based on literature review and experts
104 IPCC (2014b). Summary for policymakers. In: Climate Change 2014: Impacts, Adaptation, and Vulnerability. Part A: Global and Sectoral Aspects. Contribution of Working Group II to the Fifth Assessment Report of the Intergovernmental Panel on Climate Change Cambridge University Press, Cambridge, United Kingdom and New York, NY, USA, pp. 1-32.

177
appraisal. The NAS does not include a quantitative risk analysis for these sectors, but discusses the main
findings related to the vulnerabilities, risks and impacts posed by climate change, mainly in a qualitative
way, with different levels of detail according to the state of knowledge available for each sector. Climate
change is likely to magnify the regional differences in terms of quality and availability of natural
resources and ecosystems in Europe and also in Italy.
Water resources (quality and quantity)
The situation of water resources in Italy is characterized by an unequal natural distribution combined with
a high anthropic pressure, as well as a non-homogeneous quality of infrastructure and water
management. Climate change is already affecting the hydrological cycle, with observed consequences on
soil moisture, runoff, groundwater recharge105.
Water resources (in terms of annual precipitation and river discharge) are projected to decrease over
Southern Europe, and this regional pattern could intensify in the last decades of this century.
The existing conditions of high stress on water resources and hydro-geologic disturbance in some Italian
regions could be exacerbated by projected climate change, with the following effects: reduced water
availability and quality and increases in frequency and intensity of droughts especially in summer;
increases in frequency and severity of river summer flows reductions and annual river flow decline and
limited groundwater recharge; increased seasonal water deficit due to significant pressure of summer
tourism peaks in small Italian islands106 107.
All these pressures will reduce the capability regenerate reservoirs, increasing, especially in summer and
in southern regions, the competition among the different water uses (civil, industrial and agricultural).
The systems that have the highest risks are those that use water resources from alluvial aquifers that are
characterized by a large storage capacity coupled with long recharging times. Moreover, systems
dependent on small-sized karst aquifers are particularly vulnerable to possible deficits108 109, requiring the
use of alternative resources (usually alluvial aquifers), with the consequent risk of overexploitation in
case of prolonged drought. Systems less exposed to the risk of deficit, due to a variation in the climatic
regime, are the interconnected ones that use different types of resources with different charging times
and storage capacities.
Desertification, land degradation and drought
Desertification is the combined result of anthropic pressure and climate change effects. Temperature and
precipitation variations during the period 1961-2000 have been responsible of the increase in the
105 Castellari et al (2014a). Rapporto sullo stato delle conoscenze scientifiche su impatti, vulnerabilità ed adattamento ai cambiamenti climatici in Italia. Ministero dell’Ambiente e della Tutela del Territorio e del Mare, Roma. 106 Portoghese I. et al. (2009). “Impatti sul ciclo idrologico e risorse idriche”. In Castellari S. and Artale V. (2009). Bononia University Press. 107 Funari E. et al. (2007). “3.1 Water”. In Menne B. and Wolf T., 2007. Rome, WHO-APAT. 108 Romano et al (2012a). Generating synthetic time series of springs discharge in relation to Standardized Precipitation Indices. Case study in Central Italy. Journal of Hydrology, 507, 86–99. doi: 10.1016/j.jhydrol.2013.10.020. Elsevier B.V. 109 Romano et al (2012b). Modeling karst spring discharge in relation to standardized precipitation indices: a new method for forecasting water scarcity conditions. Geophysical Research Abstracts, 14, EGU2012-9180. EGU General Assembly 2012.

178
extension of semi-arid and dry sub-humid areas in the southern regions and the islands, up to 20% of
the national territory110. Sensitive areas to desertification already affect Italian regions, even if with
different degrees and extensions. Regions with “higher sensitive areas” compared to the national average
(30%) are: Basilicata, Marche, Molise, Sicilia, Sardegna, Puglia e Emilia-Romagna111. Coastal areas of
Sardegna, Sicilia and Puglia, like almost all the Italian coastal regions, are already affected by saltwater
intrusion which is mainly due to a groundwater overexploitation112 and to the consequent decreasing
ground levels. Water erosion already affect arable hilly areas of central Italy and the calanchian areas of
Calabria and Basilicata that are likely to be also the most exposed to the climate change effects on soil
erosion113.
The gradual worsening of desertification trends, already observed in the whole country, can be
accelerated from climate change by increasing the actions of erosion, salinization, loss of organic matter
and drying up of soil114. Severe indirect socio-economic impacts of this desertification process may follow,
including: decline in agriculture and tourism productivity, growing unemployment in rural areas with
consequent migration, conflicts over water uses, harm to properties and people, due to increased
frequency of fires, overall biodiversity loss115 116.
Hydrogreological risk
Hydrogeological phenomena, such as flooding, landslide, debris flow, erosion, subsidence are already
occurring in Italy and show an increasing trend of the induced damages over the last 50 years up to more
than two billions per year. The areas most exposed to the hydro-geological risk include: the river basin of
the Po River, subject to increased flood risk, and the Alpine and Apennine areas, subject to increased
flash flood risk117.
An analysis of flood risk118 showed that around 4.0%, 8.1% and 10.6% of the Italian territory was prone
to high (return period 1: 20–50 years), medium (return period 1: 100–200 years) and low risk (return
period 1: 300–500 years), respectively.
110 Perini et al. (2008). “La desertificazione in Italia. Processi, indicatori, vulnerabilità del territorio”. Acireale – Roma: Bonanno Editore. ISBN 88-7796-422-7. 111 Castellari et al (2014a). Rapporto sullo stato delle conoscenze scientifiche su impatti, vulnerabilità ed adattamento ai cambiamenti climatici in Italia. Ministero dell’Ambiente e della Tutela del Territorio e del Mare, Roma. 112 INEA (2011). Valutazione del rischio di salinizzazione dei suoli e di intrusione marina nelle aree costiere delle regioni meridionali in relazione agli usi irrigui. 113 Di Leginio and Fumanti (2012). Il progetto SIAS, un approccio bottom-up per la costruzione di indicatori ambientali sul suolo (carbonio organico e erosione idrica) a scala nazionale. Atti del workshop: Sviluppo e conservazione dei servizi degli ecosistemi contro siccità e desertificazione, Roma, 14-15 giugno 2012. 114 Carraro C. and Sgobbi A. (2008). “Climate change impacts and adaptation strategies in Italy: an economic assessment”. FEEM Research Paper; CMCC Research Paper No. 14. Milan: FEEM; CMCC. 115 Perini L. et al. (2008). “La desertificazione in Italia. Processi, indicatori, vulnerabilità del territorio”. Acireale – Roma: Bonanno Editore. ISBN 88-7796-422-7. 116 Sciortino M. et al. (2009). “La desertificazione e il degrado del territorio”. In Castellari S. and Artale V. (2009). Bononia University Press. 117 UNFCCC (2013). VI National Communication. 118 Trigila et al. (2015). Dissesto idrogeologico in Italia: Pericolosità e indicatori di rischio, Report No 233/2015, ISPRA, Rome, Italy.

179
In Italy about 9,6% of the national territory (about 29.500 km2) and 82% of the Italian municipalities
(6631) is actually affected by a high hydrogeological risk. It is estimated that about 5,8 million people
(10% of the national population) is potentially exposed to this risk and buildings potentially involved are
about 1,3 million. This critical situation is likely to be exacerbated due to future climate trends119. Climate
change impacts on the Italian hydro-geological system include: (i) variations in the hydrologic regime;
(ii) higher risk of inland flooding, due to increased events of river flood heights in relation to heavy
precipitation events120; (iii) increased winter run-off by 90% and decreased summer run-off by 45% in
central Europe Alpine rivers121 with consequent greater risk of flooding and drought respectively; (iv)
significant changes in the hydrologic balance (and water quality) of some studied river basins (Rio
Mulargia in Sardegna and Alento river in Campania)122 with an estimated reduction in annual discharge as
well as nutrients and sediments transport in the next decades; (v) increased risk of flash mud/debris
flows, due to a potential increase of extreme weather events; (vi) increased risk of landslides in the Alps,
due to temperature warming and ice melting; risk of rock falls in the Apennines, because of possible
more frequent and sudden temperature changes, especially in winter; risk of flash floods in both areas,
due to severe precipitation events.
Biodiversity and ecosystems (terrestrial, marine, inland water and transition ecosystems)
Italy is characterized by one of the most significant natural heritages of animal and plant species in
Europe in terms of both the total number of specimens and the high rate of endemism. Furthermore, 50
Italian sites are recognized as internationally important wetlands in the Ramsar Convention’s list. Climate
change can threat Italian biodiversity at the level of species and habitats on terrestrial, marine and
freshwater and inland ecosystems123.
Terrestrial ecosystems
The effects of climate change on species and ecosystems can be summarized into the following main
categories124 125: (i) changes in life cycle (phenology), (ii) impacts on physiology and behavior, (iii)
impacts on geographical distribution, and (iv) impacts on composition and interactions of species in
ecological communities. A 20% loss of biodiversity for animal species is estimated by the end of the 21st
119 Castellari et al (2014a). Rapporto sullo stato delle conoscenze scientifiche su impatti, vulnerabilità ed adattamento ai cambiamenti climatici in Italia. Ministero dell’Ambiente e della Tutela del Territorio e del Mare, Roma. 120 EEA (2012b). “Climate change, impacts and vulnerability in Europe, An indicator-based report”. EEA Report No 12/2012. Copenhagen: EEA. 121 Beniston M. (2006). “Climatic change in the Alps: Perspectives and impacts”. Proceedings of the “Wengen 2006 Workshop − Adaptation to the Impacts of Climate Change in the European Alps”. Organisation for Economic Co-operation and Development (OECD). 122 Lo Porto A. et al. (2007). “Influenza dei cambiamenti climatici sul regime idrologico di due bacini idrografici in
ambiente mediterraneo”. In Carli B., Cavarretta G., Colacino M., Fuzzi S. (eds) “Clima e Cambiamenti Climatici: Le attività di ricerca del CNR”, 577-580. CNR. 123 UNFCCC (2013). VI National Communication; Castellari et al (2014a) Rapporto sullo stato delle conoscenze scientifiche su impatti, vulnerabilità ed adattamento ai cambiamenti climatici in Italia. Ministero dell’Ambiente e della Tutela del Territorio e del Mare, Roma. 124 Hughes, (2000). Biological consequences of global warming: Is the signal already apparent? Trends in Ecology and Evolution, 15, 56-61. 125 Walther et al. (2002). Ecological response to recent climate change. Nature, 416, 389-395.

180
century in Mediterranean environment.
The Mediterranean region is identified as one of the 25 biodiversity hot-spot at global level and is
undergoing relevant climate and anthropic changes. Terrestrial ecosystems are already affected by
climate change also in Italy. The impacts of recent climate change have been so far more evident mainly
in the Alpine region and in the Mediterranean area. Among the most significant impacts on species
distribution in the alpine region are: the upward migration of alpine species126, the upward migration of
shrubs species127, the rise of arboreal species128, the variation of floristic composition, extension and
pattern of spatial distribution of plant communities129 and finally the acceleration of the impacts of
climate change on dynamism and species colonization processes130.
Mediterranean-type terrestrial ecosystems are likely to be especially affected by climate change131 with
the following future effects: (i) advancing trends in plant phenology; (ii) changes in spatial distribution of
flora and fauna; (iii) increased risk of extinction for several terrestrial species, changes in the structure of
the biological community and biodiversity loss; (iv) loss of wetlands ecosystems; (v) reduction in forests
extension and biodiversity loss, especially in the South and in the mountains; (vi) shift of plant and
animal species towards higher elevations (with changes in the composition and structure of alpine and
nival communities)132, with consequent changes in the structure of mountain communities and high risk
of extinction for mountain flora and fauna.
Marine ecosystem
Biodiversity effects associated to the increasing sea surface temperature of the Mediterranean sea are
already occurring and are documented by the high number of tropical alien species that are now settled
in the basin. This phenomena, combined with the reduction of species with an affinity for cold-water
conditions, are producing change in the structure of marine ecosystems and consequently in their
functioning. In the Adriatic, over the last 20 years, significant changes have been observed in the
126 Cannone et al (2007). Unexpected impacts of climate change on alpine vegetation. Frontiers in Ecology, 5, 360-364.; Parolo and G., Rossi, G. (2008). Upward migration of vascular plants following a climate warming trend in the Alps. Basic and Applied Ecology, 9, 100-107.; Erschbamer et al (2006). Plant diversity along altitudinal gradients in the Southern and Central Alps of South Tyrol and Trentino (Italy). Gredleriana, 6, 47-68; Pauli et al (2012). Recent plant diversity changes on Europe’s mountain summits. Science, 336, 353-355. 127 Cannone et al., (2007). Unexpected impacts of climate change on alpine vegetation. Frontiers in Ecology, 5, 360-364. 128 Motta and Nola (2001) . Growth trends and dynamics in sub-alpine forest stands in the Varaita Valley (Piedmont,
Italy) and their relationships with human activities and global change. Journal of Vegetation Science, 12, 219-230; Gehrig-Fasel et al. (2007). Tree line shifts in the Swiss Alps: climate change or land abandonment?. Journal of Vegetation Science, 18, 571-582; Leonelli et al. (2011). Climate warming and the recent treeline shift in the European Alps: the role of geomorphological factors in high-altitude sites. Ambio, 40, 264-273. 129 Cannone et al. (2007). Unexpected impacts of climate change on alpine vegetation. Frontiers in Ecology, 5, 360-364.; Erschbamer et al. (2011). Changes in plant species diversity revealed by longterm monitoring on mountain summits in the Dolomites (northern Italy). Preslia, 83, 387-401. 130 Cannone et al. (2008). Accelerating climate change impacts on alpine glacier forefield ecosystems in the European Alps. Ecological Applications, 18, 637-648. 131 IPCC (2007). Climate Change 2007: Impacts, Adaptation and Vulnerability. Contribution of Working Group II to the Fourth Assessment Report of the Intergovernmental Panel on Climate Change, Cambridge University Press, Cambridge, UK, 982pp. 132 Cecchi L. et al. (2007). “3.3 Urban environments and socioeconomic sectors”. In Menne B. and Wolf T., 2007. Rome, WHO-APAT.

181
composition of the fish fauna: the number of thermophilous species has increased significantly and
several rare species are becoming abundant, while others have appeared for the first time in this sea133.
In the last decades the increasing development of marine mucilage in Italian waters indicates altered
environmental conditions for such aquatic system. This phenomenon might favor the spreading of
pathogenic bacteria134.
Mediterranean marine organisms, communities and ecosystems might be further altered by climate
change, including with spreading of invasive species driven by water warming, which would cause a
general threat and possible decline of marine biodiversity. Many biological processes are expected to be
negatively affected by climate change especially in summer (possible mass mortality of invertebrates);
simulations of these conditions indicate a biomass loss higher than 35%135.
Freshwater and transition ecosystems
Among the most vulnerable inland and transition water ecosystems are marginal environments and
groundwater dependent ecosystems, high altitude lakes, and the waterways of the Apennines and the
major islands on which significant pressures are already insisting such as land and water resources
exploitation136.
High vulnerability is projected also for lakes of central and southern Italy, due to a reduction of
precipitations and an increase in temperature that, combined with an increase in water consumption,
could accentuate the risk of deterioration of water quality.
Future scenarios for these ecosystems depict loss of habitats, as well as biotic components and
processes. Higher temperatures might increase the risk of excessive growth of algae and cyanobacteria in
the lakes and eventually of eutrophication processes in lake ecosystems, especially in late summer137.
The loss of wetlands would cause severe imbalances in the related biotic communities138.
Health
In addition to the direct effects of climate change due to heat and frost waves, with a consequent excess
of mortality and morbidity and further socio-economic impacts such as damages to infrastructure and
settlements, deaths, psychological and physical pathologies, resulting from increasingly frequent weather
events, indirect health risks are mediated by the impacts of meteoclimatic factors on ecosystems,
biodiversity, drinking and bathing water, soil, and outdoor and indoor air139. Vector-borne diseases are
already occurring in Italy, such as the Chikungunya virus, the West Nile Disease and the Dengue.
133 Castellari et al. (2014a). Rapporto sullo stato delle conoscenze scientifiche su impatti, vulnerabilità ed adattamento ai cambiamenti climatici in Italia. Ministero dell’Ambiente e della Tutela del Territorio e del Mare, Roma. 134 Danovaro R. et al. (2009). “Climate Change and the Potential Spreading of Marine Mucilage and Microbial Pathogens in the Mediterranean Sea”. PLoS ONE 4(9): e7006. PLOS. 135 Coma R. et al. (2009). “Global warming-enhanced stratification and mass mortality events in the Mediterranean”. PNAS 2009 106 (15) 6176-6181. National Academy of Sciences. 136 IMELS (2015). Strategia Nazionale di Adattamento ai Cambiamenti climatici. Roma: IMELS. 137 Menne B. et al. (2009). “6. Conclusions”. In Menne B. and Wolf T., 2007. Rome, WHO-APAT. 138 UNFCCC (2013). VI National Communication. 139 IMELS (2015). Strategia Nazionale di Adattamento ai Cambiamenti climatici. Roma: IMELS.

182
Furthermore, recent studies have also investigated the malariogenic potential in Italy140. Even tick-borne
infectious diseases have increased over the past decades in Italy. Furthermore, several scientific sources
estimates that the consequences of hydrogeological occurrences have caused between 2002 and 2012
direct damages to population (128 dead due to floodings and 165 due to landslide).
Expected impacts of climate change include141 142 143 144 145: (i) increased heat-related mortality and
morbidity, related to summer heat waves; (ii) slight reduction of cold-related mortality, linked to
expected milder winter temperatures; (iii) increased risk of injuries, morbidity (e.g. enteric infections,
post-traumatic stress disorder and vector-borne diseases) and deaths, from floods, heavy precipitation
and fires events; (iv) increased respiratory diseases and allergic disorders, as a result of the effects of
changes in air pollution concentrations that may be aggravated by climate change; (v) adverse
consequences of potentially more frequent and prolonged extreme ozone events and increasing toxicity
of pollutants particularly in summertime; (vi) possible increase of the cases of West Nile fever and
leishmania, of risks for malaria and dengue fever and of the spreading of vector borne diseases146.
Forestry
The effects of climate change on forest ecosystems are already significant so as to endanger the Italian
forestry heritage, thus compromising the functionality and the ecosystem services it offers and are
intended to increase as a consequences to future climate scenarios.
In particular, the impact of climate change is causing changes in growth rates and productivity, in
changes in the composition of existing species and altitudinal and latitudinal displacement of forest
habitats resulting in local biodiversity loss and increased risk of fire and damages from insects and
pathogens, as well as alteration of the water cycle and carbon147.
The actual possibilities for the forest ecosystems to shift are scarce, because climate change rate far
exceeds the rate of colonization of new areas and the potential corridors are often obstructed by
territorial fragmentation. Hence, a progressive disruption of forest ecosystems could be expected148.
140 Boccolini et al. (2009). Ulteriori indagini sulla presenza di specie del complesso Anopheles maculipennis nella maremma toscana. Atti XXII Congresso Nazionale di Entomologia, Ancona 15-18 giugno 2009: 239; Boccolini et al. (2012). Impact of environmental changes and human-related factors on the potential malaria vector, Anopheles labranchiae (Diptera: Culicidae), in Maremma, Central Italy. Journal of Medical. Entomology, 2012; 49 (3); Romi et al. (2012a). Assessment of the risk of malaria re-introduction in the Maremma Plain (Central Italy) using a multi-factorial approach. Malaria Journal 2012 (a), 11: (98); Romi et al. (2012b). Probable autochthonous introduced malaria cases in Italy in 2009-2011 and the risk of local vector-borne transmission. Eurosurveillance, Volume 17, Issue 48, 29 November 2012; Di Luca et al. (2009). Caratterizzazione della fauna culici dica (Diptera: Culicidae) della Maremma
laziale. In: 22. Congresso nazionale italiano di entomologia. Atti; 15-18 giugno 2009; Ancona. 2009a. p.256. 141 Michelozzi P. et al. (2007). “4.1 Heat and health”. In Menne B. and Wolf T., 2007. Rome, WHO-APAT. 142 Funari E. et al. (2007). “3.1 Water”. In Menne B. and Wolf T., 2007. Rome, WHO-APAT. 143 Forestiere F. (2007). “4.4 Air quality and health”. In Menne B. and Wolf T., 2007. Rome, WHO-APAT. 144 Menne B. et al. (2009). “6. Conclusions”. In Menne B. and Wolf T., 2007. Rome, WHO-APAT. 145 Majori G. (2007). “4.5 Vector-borne diseases”. In Menne B. and Wolf T., 2007. Rome, WHO-APAT. 146 UNFCCC (2013). VI National Communication. 147 IMELS (2015). Strategia Nazionale di Adattamento ai Cambiamenti climatici. Roma: IMELS. 148 Valentini R. et al. (2009). “Foreste e cambiamenti climatici”. In Castellari S. and Artale V. (2009). Bononia University Press.

183
Existing studies149 150 show that climate change could induce overall changes in the composition of
species and habitats of Italian forests, resulting in local losses of biodiversity. Potential impacts of climate
change include: (i) northwards and altitudinal shift of the range of climatic and environmental conditions
typical of the Mediterranean area; (ii) reduction of growth and productivity rates in central-Southern
Italy; (iii) changes in the distribution of main tree forest species in central Italy mostly located in the
central Apennines, over 1500 m, in 2080; (iv) higher risk of forest fires and droughts, with possible
extension of burned areas, more ignitions and longer fire seasons (in particular in the Alpine area and in
Calabria, Campania, Sicilia and Sardegna regions). Some possible positive impacts, such as an increase
in forest productivity in the Alps in relation to the expansion of the growing season could be expected151.
Agriculture
The productive capacity of agricultural crops in the Mediterranean region is strongly conditioned by the
amount of available water in the soil even more than by the temperatures.
In Italy water shortages during specific crop development stages may reduce the productivity of most
crops (e.g. corn, soybeans and wheat). The decline in agricultural productivity could especially concern
wheat yield and fruit and vegetables production, as a consequence of water scarcity, pathogens species
increasing and soil degradation. Conversely olive, citrus, wine and durum wheat cultivation could become
possible in the North of Italy. Wine production, an activity of particular economic relevance in Italy, could
undergo major changes too. The suitability of cultivation areas for specific crops might modify, which
could lead to displacements of agricultural productions.152 153. In addition, the future temperature increase
(+ 2 e 5°C)154 could reduce further the crop productivity155.
Climate change is expected to affect the livestock by increasing the risk of heat stress.
Moreover, climate change is expected to reduce the quality of agricultural products, especially for the
149 Valentini R. et al. (2009). “Foreste e cambiamenti climatici”. In Castellari S. and Artale V. (2009). Bononia University Press. 150 Petriccione B. et al. (2009). “Gli effetti dei cambiamenti climatici sugli ecosistemi forestali”. Atti del Terzo Congresso Nazionale di Selvicoltura. Taormina (ME), 16-19 ottobre 2008. Accademia Italiana di Scienze Forestali, Firenze, p. 570-574. 151 UNFCCC (2013). VI National Communication. 152 Cecchi L. et al. (2007). “3.3 Urban environments and socioeconomic sectors”. In Menne B. and Wolf T., 2007. Rome, WHO-APAT. 153 Miglietta F. et al. (2009). “Impatti dei cambiamenti climatici sull’agricoltura”. In Castellari S. and Artale V. (2009).
Bononia University Press. 154 Giorgi et al. (2004). Mean, interannual variability and trends in a regional climate change experiment over Europe. II: climate change scenarios (2071-2100), Clim. Dyn. 23, 839–858; Kjellstrom (2004). Recent and future signatures of climate change in Europe, Ambio, 33:193–298; Raisanen et al. (2004). European climate in the late 21st century: regional simulations with two driving global models and two forcing scenarios, Clim. Dyn. 22, 13–31; Good et al. (2006). Nonlinear regional relationships between climate extremes and annual mean temperatures in model projections for 1961-2099 over Europe, Clim. Res., 13, 19-34; Christensen e Christensen (2007). A summary of the PRUDENCE model projections of changes in European climate during this century, Climatic Change, 81, S7-S30. 155 Olesen and Bindi (2002). Consequences of climate change for European agricultural productivity, land use and policy, European Journal of Agronomy 16, 239-262; Maracchi et al. (2005). Impacts of present and future climate variability on agriculture and forestry in the temperate regions: Europe, Climatic Change 70, 117-135; Giannokopoulos et al. (2005). Climate Change Impacts in the Mediterranean Resulting from a 25). Climate Change Impacts in t report, Gland Switzerland; Audsley et al. (2006). What can scenario modelling tell us about future European scale agricultural land 462 use, and what not?, Environ Sci Policy 9(2):148–162; Olesen et al. (2007). Uncertainties in projected impacts of climate change on European agriculture and ecosystems based on scenarios from regional climate models, Clim. Change 81 (suppl. 1), 123-143.

184
most vulnerable regions, characterized by a widespread use of traditional cultivation methods for quality
food production.
A particular attention should be paid to the risk posed by temperature and precipitation change to the
different Protected Designation of Origin (PDO), the Protected Geographical Indication (PGI) and the
Typical Geographical Indication (TGI), which are a significant element of the Italian agriculture156.
Aquaculture
Changes in thermal regimes, rainfall and their effects on the concentration of dissolved oxygen and
salinity can have direct effects on reproduction, growth and survival of the species. The vulnerability of
aquaculture to climate change is influenced by the localization of infrastructures used for production that
cannot be moved in the case of exceptional climatic conditions.
Climate change could affect the ecosystems that are supporting aquaculture farming activities, the
production cycles, the infrastructures, the physiology of organisms produced in farms or harvested in
nature. In Italy despite the lack of knowledge and evidences about the climate change effects on
aquaculture, the increasing attention is focusing on the possible effects on the molluscs production157.
Specific ecosystems, and in particular coastal environments, the lagoons and the river delta are
considered to be the most vulnerable to the effects associated to the increase of surface temperatures,
the sea level rise, the water acidification, the increase in the extreme weather events and the water
stress. The most vulnerable areas in Italy are located in the North-East and along the Adriatic coast158.
Fishery
In recent years, a moderate rise in the Mediterranean mean surface temperature has been observed
together with changes in the geographical and bathymetric distribution of animal and plant species,
including the fish fauna. The expansion of the distribution area of thermophilic marine species has been
among the first significant signals of the Mediterranean warming159.
Expanding species come from the warmest Mediterranean sub-basins or tropical and sub-tropical areas of
the Red Sea or the Eastern Atlantic. For this reason, the whole community is going toward the so called
“meridionalization” and “tropicalization”160 depending on whether it is based on the native or not native
species expansion.
156 IMELS (2015). Strategia Nazionale di Adattamento ai Cambiamenti climatici. Roma: IMELS. 157 Viaroli et al., (2007). Analysis of clam farming scenarios in Sacca di Goro lagoon, Transitional Water Monographs, 1, 71-92. doi: 10.1285/i18252273v1n1p71; Melaku Canu et al. (2010). Effect of global change on bivalve rearing activity and the need for adaptive management. Climate Research, 42, 13-26. doi: 10.3354/cr00859. 158 IMELS (2015). Strategia Nazionale di Adattamento ai Cambiamenti climatici. Roma: IMELS. 159 Azzurro (2008). The advance of thermophilic fishes in the Mediterranean Sea: overview and methodological questions. In: CIESM Workshop Monographs, 35, 39-45; Lejeusne et al. (2009). Climate change effects on a miniature ocean: the highly diverse, highly impacted Mediterranean Sea, Trends Ecology Evolution, 25, 4, 250-260. doi:10.1016/j.tree.2009.10.009. Elsevier Ltd. 160 Bianchi (2007). Biodiversity issues for the forthcoming tropical Mediterranean Sea, Hydrobiologia, 580, 7-21. Doi 10.1007/s10750-006-0469-5; Lejeusne et al. (2009). Climate change effects on a miniature ocean: the highly diverse, highly impacted Mediterranean Sea, Trends Ecology Evolution, 25, 4, 250-260. doi:10.1016/j.tree.2009.10.009. Elsevier Ltd.

185
The influx of non-Mediterranean species has become progressively more rapid in recent times161.
The following adverse climate change effects can be expected: (i) fish stock movements, inducing
changes in the composition of biological communities in a given area also affecting the economic
activities related to fishery; (ii) reduction in the resilience of many water ecosystems due to
anthropogenic stress (e.g. from overfishing, pollution, tourism, fragmentation and loss of habitat); (iii)
possible general reduction in the productivity of the fished species162; (iv) increased risk for economic
activities based on the collection of bivalve and gastropod mollusks or shellfish due to their potential
problems linked to the reduction of sea water pH163.
Energy
The energy sector is particularly vulnerable to climate change, as a result mainly of the high sensitivity of
production and consumption to temperature and extreme weather events. In Italy, in the last three
decades the mean Heating Degree Day rate has decreased by 19%, with significant interannual
variations164. Furthermore, the hydropower production is already affected, and will be increasingly
affected in the future, by meteo-climatic variations, which are responsible of a reduction of water
availability and a more difficult water management165.
In Italy, as in other European countries, the increase in energy demand for cooling in summertime could
exceed the decreasing energy demand for heating in winter166. Summer cooling needs might increase up
to 50% Italy by 2080167.
Furthermore, the increase in the frequency and intensity of extreme weather phenomena will also affect
the energy production and supply, both from fossil fuel power plants and form plants based on renewable
sources168.
Coastal zones
Coastal ecosystems in the Mediterranean already show a high vulnerability to climate change, with rapid
coastal erosion phenomena.
161 Zenetos et al. (2012). Alien species in the Mediterranean Sea by 2012. A contribution to the application of European Union’s Marine Strategy Framework Directive (MSFD). Part 2. Introduction trends and pathways. Mediterranean Marine Science, 13, (2), 328-352. doi: 10.12681/mms.327. 162 Cheung W. W. L. et al. (2010). “Large-scale redistribution of maximum fisheries catch potential in the global ocean under climate change”. Global Change Biology, 16:24–35. Blackwell Publishing Ltd.; Cheung W.W.L. et al. (2012).
“Shrinking of fishes exacerbates impacts of global ocean changes on marine ecosystems”. Nature Climate Change. Nature Publishing Group (NPG). 163 UNFCCC (2013). VI National Communication. 164 Eurostat: http://appsso.eurostat.ec.europa.eu/nui/show.do?dataset=nrg_esdgr_a&lang=en 165 Gaudioso D. and Masullo A. (2009). “Impatti dei cambiamenti climatici sul settore energetico”. In Castellari S. and Artale V. (2009). Bononia University Press. 166 Mima S. et al. (2011). “Technical Policy Briefing Note 4: Energy - The Impacts and Economic Costs of Climate Change and Energy in the European Union. Summary of Sector Results from the ClimateCost project”. ClimateCost project. Funded by the European Community’s Seventh Framework Programme. 167 Cecchi L. et al. (2007). “3.3 Urban environments and socioeconomic sectors”. In Menne B. and Wolf T., 2007. Rome, WHO-APAT. 168 IMELS (2015). Strategia Nazionale di Adattamento ai Cambiamenti climatici. Roma: IMELS.

186
This phenomenon is related to sea level rise, due to the melting of glaciers, the subsidence and the
thermal expansion of the ocean masses because of climate change and the anthropogenic pressures that
make them particularly vulnerable, with increased flood risk, instability and saline intrusions into coastal
aquifers.
Over 7.500 km of Italian coasts, 47% is represented by high or rocky shores and 53% are beaches.
About 42% of the beaches is currently undergoing erosion processes169. The rate of coastal erosion varies
between 13% in Friuli Venezia Giulia and 91% in Molise170.
Saltwater intrusion in the coastal groundwater is already occurring in many coastal areas and will be
aggravated by the sea level rise and the precipitation reduction, causing new potential problems to water
supply171.
Future scenarios of climate change impacts on Italian coastal areas include172: (i) increase in coastal
erosion and instability; (ii) loss of coastal land and related economic activities, infrastructures, urban
settlements, recreational areas and natural heritage sites; (iii) reduction and loss of biodiversity and
ecosystems (especially wetlands), and decrease of marine life caused by the combined effect of climate
change and anthropogenic stress; (iv) damages to coastal rural economy, due to saltwater intrusion; (v)
negative impacts on tourism and possible displacement of tourist flows; (vi) possible threat to human
health posed by flood events.
Specifically, about 4500 km2 of Italian coastal areas are at risk of sea flooding from sea level rise (SLR)
by the next 100 years; most of them are located in the North Adriatic Sea, but some Tyrrhenian and
Ionian coasts may be at risk too173 . The Northern Adriatic coast, characterized by the Po river delta and
the Venice lagoon, is at high risk, as this area lies below sea level and hosts many residential
settlements, cultural heritage sites as well as industrial establishments174.
Tourism
Without adaptation measures, according to the estimates of the Hamburg Tourism Model, Italy by the
end of the century will lose significant market shares sliding from the current fifth to the thirteenth
among the most popular international destinations. Climate change will particularly affect coastal
summer, due to high temperatures and water scarcity, and winter mountain tourism, due to decreasing
169 IMELS (2015). Strategia Nazionale di Adattamento ai Cambiamenti climatici. Roma: IMELS. 170 Castellari et al (2014a). Rapporto sullo stato delle conoscenze scientifiche su impatti, vulnerabilità ed adattamento ai cambiamenti climatici in Italia. Ministero dell’Ambiente e della Tutela del Territorio e del Mare, Roma. 171 Castellari et al (2014a). Rapporto sullo stato delle conoscenze scientifiche su impatti, vulnerabilità ed adattamento ai cambiamenti climatici in Italia. Ministero dell’Ambiente e della Tutela del Territorio e del Mare, Roma. 172 IPCC (2007). Climate Change 2007: Impacts, Adaptation and Vulnerability. Contribution of Working Group II to the Fourth Assessment Report of the Intergovernmental Panel on Climate Change, Cambridge University Press, Cambridge, UK, 982pp. 173 Antonioli F. and Silenzi S. (2007). “Variazioni relative del livello del mare e vulnerabilità delle pianure costiere italiane”. In “Quaderni della Società Geologica Italiana (SGI) 2”. SGI. 174 Policy Research Corporation (in association with MRAG) (2009). “The economics of climate change adaptation in EU coastal areas”. (“Country overview and assessment”. Chapter 11. “Italy”). European Commission, Directorate-General for Maritime Affairs and Fisheries.

187
natural snow cover, and, to a lesser extent, tourism in art cities. On the other hand improved conditions
for spring and autumn tourism might occur175.
The most likely vulnerable regions are, in descending order, Sicily, Lazio, Tuscany and Umbria176.
The Tourism Climate Index approach shows a transformation by the end of the century from optimal
summer climate conditions in the Italian coastal areas to almost unacceptable conditions even in the
higher tourist vocation areas177. According to several studies, in the coming decades a snow cover
decrease and a rise of the snowfall limit will be observed. Winter tourism will be then strongly affected, in
particular in Friuli Venezia Giulia, Lombardia, Trentino Alto Adige and Piemonte. With an increase of 4°C
and the snow limit at 2.100 m of altitude, ski resorts above this altitude would be reduced at just 18% of
those currently used.
Urban settlements
The impacts that climate change may have on urban settlements are highly diverse and are mainly due
to extreme events like floods, storms, heatwaves, droughts178 179. These climate threats could affect for
example the health of citizens, the functioning of infrastructure and technology networks, the sudden
increase in energy demand, changes in the conditions of sociality, shortages in water supplies, decline in
the quality of life, increased risk of flooding, soil instability and fires, flooding in coastal settlements. In
large settlements, some impacts are exacerbated by the typically Urban Heat Island (UHI) phenomenon,
causing higher average temperature in the cities than in peripheral and suburban areas (up to 5-10
degrees of difference)180.
Critical infrastructures (cultural heritage, infrastructure and transport, industrial hazards)
Cultural heritage. The research on the effects of climate change on the cultural heritage has been limited
until now181. Water plays a predominant role as a possible damage factor of cultural heritage: extreme
events, floodings and stroms, could cause structural damages to the roofs and ornamental elements of
buildings. Humidity changes are responsible for the growth of microorganisms, especially on stone and
wood materials, and the formation of salts that degrade surfaces and accelerate corrosion phenomena.
The increase in atmospheric CO2 concentration, combined with rainfall, is expected to cause an increase
up to 30% of the chemical dissolution of carbonate stone materials, respect to the present. Data show
175 UNFCCC (2013). VI National Communication. 176 Castellari et al (2014a). Rapporto sullo stato delle conoscenze scientifiche su impatti, vulnerabilità ed adattamento ai cambiamenti climatici in Italia. Ministero dell’Ambiente e della Tutela del Territorio e del Mare, Roma. 177 IMELS (2015). Strategia Nazionale di Adattamento ai Cambiamenti climatici. Roma: IMELS. 178 EEA (2012a). “Urban adaptation to climate change in Europe - Challenges and opportunities for cities”. EEA Report No 2/2012. Copenhagen: EEA. 179 EEA (2016). “Urban adaptation to climate change in Europe 2016. Transforming cities in a changing climate”. EEA Report No 12/2016. Copenhagen: EEA. 180 IMELS (2015). Strategia Nazionale di Adattamento ai Cambiamenti climatici. Roma: IMELS. 181 Castellari et al (2014a). Rapporto sullo stato delle conoscenze scientifiche su impatti, vulnerabilità ed adattamento ai cambiamenti climatici in Italia. Ministero dell’Ambiente e della Tutela del Territorio e del Mare, Roma.

188
that Mediterranean regions including Sicily, particularly rich in monuments and archaeological sites in
stone, will continue to experience a high level of thermal stress risk, with values sometimes over 200
events per year at the end of the century182 183. However, the research on the impacts of climate change
on cultural heritage has been so far very limited, with studies mainly focused on construction materials,
while studies on impact assessment for complex systems, such as historical centers and archaeological
sites would be required.
Temperature rise is already transforming the landscape, with consequent upward shifts of vegetation and
desertification processes in the Mediterranean area184.
Infrastructure and transport.
Climate change will affect transport infrastructures through four main types of phenomena:
(i) the increase in temperatures, which increases the vulnerability of road and rail infrastructure
due to the increasing frequency of hot days and, on the other hand, reduces their
vulnerability as a consequence of the reduction in the frequency of days with low
temperatures;
(ii) the variation in precipitation, which adversely affects soil stability and consequently road and
railway infrastructures located in unstable environments and increases the risk of flooding of
underground infrastructures;
(iii) sea level variation, which poses risks for road and rail infrastructures located on coastal areas
and port infrastructures;
(iv) floods, which have impacts on transport infrastructures located near watercourses.
In Italy, there is no currently a unique, specific and complete framework for the assessment of climate
change impacts on transports. However, extreme weather events already cause damages to
infrastructure. Due to the future possible increase in extreme weather events, temperature rise, changing
precipitation patterns, increased risk of floods, landslides and rock falls, possible deterioration, disruption
or inaccessibility of the transport network will occur increasingly185.
Industrial hazards.
Over the last 20 years at least 20 NaTech events (events in which a natural disaster triggers on or more
technological disaster) have taken place, involving refineries, chemical and petrochemical industries and
gas pipelines. Due to the future increasing frequency and intensity of extreme weather events, the
impacts on infrastructure (i.e. gas pipelines, oil pipelines, pipelines carrying inflammable or toxic
substances) and hazardous industrial activities (i.e. plants at risk of major accident and other productive
activities using hazardous chemical substances) will be increasingly significant186.
182 Sabbioni et al (2008). Global climate change and archaeological heritage: prevision, impact an mapping. In: ARCHAIA Case Studies on Research Planning, Characterisation, Conservation and Management of Archaeological Sites. (Eds. Marchetti, N., Thuesen, I., Archaeopress), Oxford, 295-300. 183 Bonazza et al (2009). Climate change impact: mapping thermal stress on Carrara marble in Europe. Science of the Total Environment 407, 4506-4512.
184 IMELS (2015). Strategia Nazionale di Adattamento ai Cambiamenti climatici. Roma: IMELS. 185 Caserini S. and Pignatelli R. (2009). “Cambiamenti climatici e trasporti: il contesto e gli impatti”. In Castellari, S.
and Artale, V. (2009). Bononia University Press. 186 IMELS (2015). Strategia Nazionale di Adattamento ai Cambiamenti climatici. Roma: IMELS.

189
Mountain areas (Alps and Apennines)
The climate change impacts on mountain areas (Alps and Apennines) mainly concern glacial retreat and
glacial mass loss, snow cover reduction at low altitude, a progressive warming of permafrost.
It is very likely that in the coming decades the impacts of climate change so far observed in the mountain
systems will increase their magnitude. The decrease in summer rainfall and the increase in winter
precipitation - increasingly in terms of rain - together with the acceleration of the cryosphere melting, will
result in significant changes in the mountainous hydrological regime such as a decrease in summer run-
off and above all a considerable increase in winter run-off. Consequently, hydrogeological risk and
availability of water resources will be seriously affected.
An increase in glacial risk is also expected, as substantially stable areas will become more subject to
collapses and landslides187.
Po river basin
The river Po district is the most important in Italy in terms of geographical, economic, social and political
conditions, despite the abundance of water resources is extremely vulnerable to changes induced by
climate change.
Due to climate variations and to the reduction of the area and the volume of the alpine glaciers, large
variations of water outflows will likely occur and will be only partially compensated by the existing
artificial hydraulic works. Historical time series already in the basin confirms this tendency. Since 2003,
the Po basin has been characterized by frequent water scarcity conditions compared to the demand, as a
consequence of the more arid climate on one side and the variations in demand related to new factors on
the other side. In particular, summer energy needs have increased in addition to water irrigation needs
arising from agricultural drought.
Energy production, agriculture and water supply for civil use could be damaged by prolonged drought
conditions. Alterations in the hydrological regime could lead to increased risks for urban and productive
areas, as well as for essential transport and mobility infrastructure, electricity distribution,
telecommunications and water infrastructure188.
6.3 Domestic adaptation policies and strategies
In 2012 the Italian Ministry for the Environment, Land and Sea (IMELS), that is the institution in charge
of climate policy, started a process aiming to build the basis for adaptation planning at national level.
A Scientific Panel was established to collect background information on current and future climate
variability and on impacts and vulnerability in Italy. Also, an analysis of policy framework for adaptation
at National and European level was carried out.
In 2013, a public consultation on the perception of the risks of climate change and on the general
187 IMELS (2015). Strategia Nazionale di Adattamento ai Cambiamenti climatici. Roma: IMELS. 188 IMELS (2015). Strategia Nazionale di Adattamento ai Cambiamenti climatici. Roma: IMELS.
190
concept about adaptation, and an “ad hoc” public consultation for the involvement of citizens and
stakeholders, were launched by IMELS.
Some background documents were published in 2014:
An impact and vulnerability assessment: Report on the state of scientific knowledge on impacts,
vulnerability and adaptation to climate change in Italy189.
A strategic document: Elements for an Italian National Adaptation Strategy to climate change190.
A legal assessment: Analysis of Aquis Communitaire and National Legislation relevant for
impacts, vulnerability and adaptation to climate change191.
The main methods used to perform the assessment were the review of existing literature and experts
appraisal. The climate change, impacts and vulnerability assessment and the related NAS were presented
in many workshops and conferences at national and international level during the period between 2014
and 2016.
In order to lay the foundation of a multilevel governance on adaptation, an horizontal coordination took
place through an Institutional Panel, set up to support the elaboration of the National Adaptation
Strategy. Represented Ministries included the Ministry of Economic Development, the Ministry of
Agricultural and Forestry Policies, the Ministry of Infrastructures and Transport, the Ministry of Health;
the Ministry of Education, University and Research; the Ministry of Cultural and Environmental heritage;
the Ministry of Regional affairs and Tourism and Sport, and other institutions such as the Department of
Civil Protection, regional committees, the national association of Italian municipalities and the Union of
Italian Provinces.
The IMELS also established an Interregional Panel with the national State-Regions Commission for
climate change, with the aim to build the ground for adaptation, having in mind the needs and the
perspective of all actors involved in the process of tackle climate change and its impacts.
According to the International and European provisions192, and after approval by the "State-Regions
Unified Conference" on the 30th of October 2014 (14/136/CU6/C5), the National Adaptation Strategy to
Climate Change (NAS)193 was finally adopted on June 2015 with a Directorial Decree194 of the Climate and
Energy General Director (DG-CLE).
The main objective of the NAS was to develop a national view on the common path to be undertaken for
dealing with climate change and its impacts.
The NAS includes an analysis of current and future climate variability in Italy and describes the effects of
climate change in terms of induced process (e.g. desertification and hydrogeological risk), alteration of
natural resources (e.g. water resources and biodiversity), environmental compartments and socio-
189 Castellari et al (2014a). Rapporto sullo stato delle conoscenze scientifiche su impatti, vulnerabilità ed adattamento ai cambiamenti climatici in Italia. Ministero dell’Ambiente e della Tutela del Territorio e del Mare, Roma. 190 Castellari et al (2014b). Elementi per una Strategia Nazionale di Adattamento ai Cambiamenti climatici. Ministero dell’Ambiente e della Tutela del Territorio e del Mare, Roma. 191 Castellari et al (2014c). Analisi della normativa comunitaria e nazionale rilevante per gli impatti, la vulnerabilità e l’adattamento ai cambiamenti climatici. Ministero dell’Ambiente e della Tutela del Territorio e del Mare, Roma. 192 EC (2013). Communication from the Commission to the European Parliament, the Council, the European economic and social Committee and the Committee of the Regions. An EU Strategy on adaptation to climate change. COM(2013) 216 final. Brussels: EC. 193 IMELS (2015). Strategia Nazionale di Adattamento ai Cambiamenti climatici. Roma: IMELS. 194 http://www.minambiente.it/sites/default/files/archivio/normativa/dd_16_06_2015_86_snac.pdf

191
economic sectors.
The sectors of the Strategy were chosen based on their environmental and socio-economic relevance and
on their vulnerability to the impacts of climate change:
water resources (quantity and quality);
desertification, soil degradation and drought;
hydrogeological instability;
biodiversity and ecosystems;
forestry;
agriculture, aquaculture, marine fishery;
coastal zones;
tourism;
health;
urban settlements;
critical infrastructures (cultural heritage, transport and infrastructures, industry);
energy (production and consumption);
and 2 special cases: the mountain areas of the Alps and Apennines, and the Po river basin.
For each sector, impacts and vulnerability were summarize in the form of “key messages” and took into
account geographic specificities; also, the NAS proposed a portfolio of adaptation actions based on three
approaches: 'soft' (i.e. managerial, legal and policy approaches), 'green' (i.e. ecosystem based
approaches) and 'grey' (i.e. technological and engineering solutions) and two implementation terms:
short and medium term. The NAS is planned to be updated within five years.
The Decree of adoption of the NAS states that the Ministry for the Environment defines: specific roles for
the implementation of adaptation actions as well as coordination instruments between different level of
governance; adaptation options that are preferable considering opportunities and synergies; evaluation of
costs and human resources; specific indicators for monitoring and evaluation of adaptation actions.
Moreover, the above mentioned Decree provides for the institution of a “Permanent Forum” for the
promotion of information, training and decision making-capacity of citizens and stakeholders and also the
institution of a “National Observatory” composed of Regions and local authorities for identification of
territorial and sectorial priorities and for monitoring of adaptation actions.
As far as adaptation strategies at subnational level, a survey on the ongoing processes towards climate
change adaptation strategies and plans at regional level, carried out by the Institute for Environmental
Protection and Research (ISPRA) describes the following state of the art195:
Lombardia Region approved its Regional Adaptation Strategy
Other regions (Valle D’Aosta, Piemonte, Friuli Venezia Giulia, Emilia Romagna, Toscana, Abruzzo,
Sardegna, Calabria and the Province of Trento) have started procedures aiming to define planning
documents on adaptation (Strategies or Plans).
It is important to highlight that some regions (e.g. Sardegna, Calabria, Puglia) recognized the cross-
cutting nature of adaptation into their governance model; some other regions are reviewing their
195 ISPRA - Istituto Superiore per la Protezione e la Ricerca Ambientale. (2016). “Annuario dei dati ambientali –
edizione 2016”. ISPRA Report No 69/2016. Roma: ISPRA.

192
regulatory measures (e.g. EIA) and planning tools (e.g. EU Structural Funds) considering adaptation (e.g.
Abruzzo, Molise); some other regions are promoting adaptation at local level by facilitating the
implementation of the European Covenant of Mayors for Climate and Energy programs (e.g. Lazio,
Abruzzo).
Under the European cooperation for regional development programs (ERDF), for the regions Calabria,
Sicilia, Campania and Puglia, the IMELS coordinated a project to support the regional environmental
authorities for the implementation of the principles of the NAS in the future regional adaptation plans. A
report for each region on the state of the art of climate change consideration in planning activities was
released in October 2016.
6.4 Monitoring and evaluation framework
The National Adaptation Strategy does not include approaches to the monitoring and evaluation of
adaptation. However, the ongoing process toward a National Adaptation Plan, started in 2016, is
currently taking into consideration the need for a Monitoring, Reporting and Evaluation of adaptation,
which will be then defined within the NAP framework.
Furthermore, in 2016 the National System for Environmental Protection set up a national Working Group
on “Impacts, vulnerability and adaptation to climate change” with the main objective to define a set of
climate change impact indicators which is currently lacking in Italy. This activity will be coherently carried
out in synergy with the ongoing process toward the National Adaptation Plan and will provide useful
indicators to be included in the national Monitoring, Reporting and Evaluation system in order to monitor
the effectiveness of the adaptation measures in reducing the impacts of climate change.
6.5 Progress and outcomes of adaptation action
The IMELS, with the support of the Euro-Mediterranean Center on Climate Change (CMCC), is currently
working on the implementation of the NAS through the development of the National Adaptation Plan to
Climate Change (NAP).
The work for the elaboration of the NAP started in 2016. The main activities of the working plan
comprises:
a context analysis to describe current and future climate variability and an evaluation of impacts
and vulnerability of the main sectors identified;
the planning of adaptation actions (taking into account roles for the implementation, vertical
coordination, human and financial resources);
tools for institutional and stakeholders participation and for monitoring and evaluation of
adaptation actions.
The NAP will provide institutional guidance to national and local authorities, for the integration of
adaptation measures within policy processes and spatial planning. Finalization is tentatively planned for
the first half of 2018.

193

194
7 FINANCIAL RESOURCES AND TRANSFER OF TECHNOLOGY, INCLUDING
INFORMATION UNDER ART. 10-11 OF KYOTO PROTOCOL196
7.1 Provision of New and additional resources
Italy is undertaking continuous efforts to scale-up its international climate finance and will continue to do
so. Our public climate finance in the period 2015-2016 increased substantially compared to the levels of
previous years (2013-2014), while improving the quality and transparency of our reporting.
Total public climate specific support that is currently being reported amount, for the biennium 2015-
2016, to 729,75 million US dollars. This represents more than a 70% increase compared to the public
climate specific support reported for the biennium 2013-2014, amounting to 428,76 million US dollars.
The total public climate specific support for the period 2013-2016 amounts to 1.158,51 million US dollars.
In the provision of public financial resources, Italy aims to strike a fair balance between mitigation and
adaptation over time. Direct support for adaptation in the period 2015-2016 increased more than five
times compared to previous years. The adaptation component in 2015-2016 represents 53% of the total
public climate finance addressing mitigation and adaptation, without considering crosscutting activities.
Since 2015, Italian Development Cooperation has undergone an important legislative reform. The new
system is gradually being implemented, against the backdrop of our European and International goals
and partnerships. The reform of the Italian Development Cooperation has led to a new institutional
framework designed to make it more effective as well as cooperation policies more consistent. Under the
new system, the Ministry of Foreign Affairs and International Cooperation is seen to give guidance in the
definition of cooperation policies, while the Italian Development Cooperation Agency, established
following the reform, is in charge of implementing policies. The law also confirms the role of financial
institution in development cooperation given to the "Cassa Depositi e Prestiti Spa" (CDP), with new
innovative Public Private Partnership mechanisms. In addition, a permanent inter-ministerial “table” for
coordinating support in the field of climate change (priorities, actions, countries etc.) has been set up.
In this context, the Italian development cooperation aims at effectively mainstreaming environmental and
climate considerations into its activities. Starting from 2015, the Italian Government allocated additional
financial resources to the international development cooperation. On top of these resources, the
commitment of Italy to tackle climate change and related support to developing countries is strongly
expressed in Decree nr.30 (DLGS n.30 13/03/2013). In fact, this latter defines the criteria for the
allocation of the proceeds from auctioning of greenhouse gas emission allowances. In particular, it is
196 Lead authors: Samantha Sapienza (IMELS), Alessandro Negrin (IMELS), Swan Senesi (IMELS), Karima Oustadi (IMELS). Contributing authors: Paolo Angelini (IMELS), Felice Cappelluti (IMELS), Giorgia Caropreso (IMELS), Elisabetta Colaiacomo (IMELS), Gabriella Rossi Crespi (IMELS), Loredana Dall’Ora (IMELS), Roberta Ianna (IMELS), Bruna Kohan (IMELS), Vanessa Leonardi (IMELS), Silvia Massimi (IMELS), Cristiano Piacente (IMELS), Marco Strincone (CNR-IIA), Verusca Vegini (IMELS).

195
established that at least 50% of those proceeds should be used to reduce greenhouse gas emissions; to
adapt to the impacts of climate change; to fund research and development for reducing emissions and
promote adaptation; to develop renewable energies and increase energy efficiency; to contribute to the
Global Energy Efficiency and Renewable Energy Fund and to the Adaptation Fund; to provide for
measures to avoid deforestation and facilitate adaptation in developing countries. The proceeds from
auctioning of greenhouse gas emission allowances has been allocated by the Italian Ministry for the
Environment starting from 2015 and these resources represent additional public climate financial
resources to developing country Parties.
An integrative approach to environment and development has been adopted in development actions run
by the Ministry of Foreign Affairs and International Cooperation (MFA), housing the traditional
development cooperation originally focused on social and economic challenges. In this light, efforts have
been aimed at environmental compliance, integration, and mainstreaming in all sorts of programmes and
financing, resulting in adding a climate change component in more than 300 initiatives. The specific
approach by MFA cooperation is therefore characterized by the integration of climate change in the 2030
Development Agenda.
Taking into account also recent evidence of migratory implications, Italian MFA approach to targeted
concrete territories is growingly shaped – where appropriate – as integrated landscape management, i.e.
aiming at maximizing co-benefits in the framework of coupled and resonant environmental and societal
consolidation cycles. Target integration sectors are mainly: agriculture, food security, smart cities,
biodiversity conservation, water, energy, off grid power, reforestation and biodiversity in general, land
recovery and combating desertification, seas and fishing, disaster risk management, sustainable
marketing supply chains, wetlands, waste. Geographical distribution reflects not only mitigation and
adaptation, but also the need to address destabilization patterns in areas where environmental fragility
overlaps socio-economic and/or governance weakness.
Since 2015, the bilateral cooperation activities promoted by IMELS have been enlarged to new areas of
the world. The strategy underlying the priority countries is defined in agreement with the Ministry of
Foreign Affairs and International Cooperation. In particular, the objective is to support the countries that
are most vulnerable to the effects of climate change: the Small Island Developing States and the African
countries. The Italian Ministry for the Environment signed 31 new bilateral agreements with
developing countries including regional groups to support mitigation and adaptation actions, to facilitate
access to climate finance, to provide capacity building and technology transfer. Priority actions have been
focused on 8 areas: management of extreme events, promotion of renewable energy and energy
efficiency, water resources management, waste management, air quality, address forest degradation,
land rehabilitation and soil improvement, sustainable mobility. In this framework, the Ministry for the
Environment works closely with the Ministry of Foreign Affairs and International Cooperation, the Italian
Agency for Cooperation and Cassa Depositi and Prestiti.
IMELS Bilateral cooperation

196
In order to ensure the efficient and effective implementation of the activities foreseen by the bilateral
cooperation and to address the needs of developing countries and enhance country ownership, each
Memorandum of Understanding establishes a Joint Committee (JC). The JC, that is composed by
representatives of both Governments involved, provides general direction to the established
collaboration, approves work programs and budget, supervises and supports the cooperation activities by
taking stock and assessing the implementation and progress of approved projects and takes financial
decisions over such activities. To complement this approach and ensure that activities implemented are in
line with the expected results, periodical site visits of national experts to monitor and assess activities on
the ground are carried out.
All projects and programs financed in this context are proposed by developing countries and reflect
priorities and objectives included in the Nationally Determined Contributions (NDCs) and other relevant
climate change and development strategies.
The methodological approach for tracking and reporting on the provision of financial, technological and
capacity-building support to non-Annex I Parties considers:
• a combination of all the Rio Markers and the Aid to Environment marker for bilateral and
multi-bilateral figures, and imputes a climate relevant share to multilateral contributions;
• committed funds for bilateral flows and disbursed funds for multilateral flows, so that they do
not overlap with past year's figures, avoiding double counting across the years;
• climate specific and core/general amounts as mutually exclusive: the figure reported as
core/general is the result of the whole contribution to the multilateral institutions minus the
climate specific share, computed according to the imputed multilateral shares provided by the
DFIs themselves (or through the OECD calculations or the share of activities reported by
DFIs);
• most part of the Italian public development cooperation is in form of public grants through
official agencies. Thus, almost all contributions are classified as Official Development
Assistance;
• The sector assigned in the DAC CRS table is reported in the relevant column. As requested,
the notation “Not applicable” is reported in case of purely multilateral contributions.

197
The methodology has been developed and agreed among the Ministry for the Environment, Land and Sea
and the Ministry of Foreign Affairs and Development Cooperation - which coordinates development
cooperation activities at all levels, from the central public administration to local government and
universities.
Public financial support provided through multilateral channels includes both purely multilateral and
multi-bilateral flows. The first includes grants provided to multilateral development banks, contributions
towards climate related conventions and funds, contributions to UN specialized agencies. The second
includes finance that flows through multilateral organizations but earmarked towards specific country or
multi-country projects.
For multi-bilateral flows, the adaptation/mitigation/crosscutting categories are imputed according to
either the Rio Markers, or the sector indicated in the DAC CRS database. For purely multilateral flows, the
nature and the purpose of the fund is considered, even though they mostly fall into the crosscutting
category. For those multilateral flows whose figures fall into the core/general column only, and the
project description do not report a clear mitigation or adaptation purpose, or the nature of the fund is not
clearly relevant for both (crosscutting), the category is left blank.
Finally, contributions are reported as either disbursed or committed only if they are reflected in official
documents that proof the commitment or the financial transaction (decreto di impegno e/o di
pagamento).
Bilateral flows include contributions to development cooperation programmes from all the central public
administrations (Ministries) and the Italian Development Cooperation Agency (AICS), the Italian
Development Bank (Artigiancassa / Cassa Depositi e Prestiti), Local administrations (regions and
municipalities), considering all kind of implementing agencies (f.i. Universities, NGOs and religious
organizations).
For bilateral contributions, Rio Markers assess the climate specific share of the projects. In particular,
where the "significant" marker is reported, 40% of the total value of the project is reported as climate
specific; 100% when the "principal" marker is reported. Priority is given to climate markers for mitigation
and adaptation, but a combination of all the Rio Markers and Aid to Environment marker is considered. In
particular, where the project description and the sector are relevant, either 100% or 40% of the value of
the project is reported. This qualitative consideration has been jointly led by the two Ministries, also
referring to the OECD DAC Rio Markers for Climate Handbook.
Italy is not yet reporting at this stage private finance mobilized through public interventions. We are
implementing measures to increase the mobilization of private resources. Leveraging private finance is a
component of all our bilateral agreements and activities. Italy is in the process of undertaking a pilot
study for tracking mobilized private finance through public interventions, with the view of progressively
integrate these figures in the reporting and refine our capacity to gather data and apply more complex
methodologies. The study will be conducted in the context of the OECD Research Collaborative on
Tracking Private Climate Finance and its work. The Research Collaborative is an open network composed

198
by governments, research institutions and international finance institutions and coordinated and hosted
by the OECD. The goal is to share best available data, expertise and information to advance policy-
relevant research in a comprehensive and timely manner. The project is designed to serve as a
coordinating platform for identifying research priorities and gaps, sharing information, weaving a
coherent narrative across what would otherwise be disparate research outputs, as well as communicating
results to raise awareness in this area.
To sum up, Italy’s public financial resources to assist developing countries to develop and implement
actions in the field of climate change in the period 2013 - 2016 came from:
• the Italian Ministry for the Environment, Land and Sea funds according to law June 1, 2002,
n°120;
• the Italian Foreign Affairs Ministry funds for development cooperation;
• the Italian Ministry of Economy of Finance funds provided to multilateral institutions for
environmental activities targeted for climate change;
• the proceeds from auctioning of greenhouse gas emission allowances allocated starting from
2015. According to DIRECTIVE 2003/87/EC, the revenues generated from the auctioning of
allowances should be used to tackle climate change in the EU and third countries;
• the financial contribution to the Green Climate Fund (GCF).
Provided that there is no common understanding on what is to be considered “new and additional”,
only newly and additional committed or disbursed climate finance during the period 2013 - 2016
originating from these above channels are considered as such, in particular: budget increase for
development cooperation dedicated to climate change, revenues from auctioning of greenhouse gas
emission allowances, financial contribution to the Green Climate Fund.
7.2 Assistance to developing country Parties that are particularly vulnerable to
climate change
Multilateral Cooperation on climate change
Between 2013 and 2016, the Italian multilateral environmental activities were carried out in several
organizations or programmes, such as: the World Bank (WB), the Green Climate Fund (GCF), the Global
Environment Facility (GEF), the Least Developed Countries Fund (LDCF), the Adaptation Fund (AF), the
Food and Agriculture Organisation (FAO), the Capacity Building Initiative for Transparency (CBIT) and the
African Development Bank (ADB).
A substantial share of climate finance requirements are expected to be met by International Financial
Institutions (IFIs) and other multilateral initiatives. At COP21 in Paris, multilateral development banks
(African Development Bank, Asian Development Bank, European Bank for Reconstruction and
Development, European Investment Bank, Inter-American Development Bank and World Bank Group),
committed to substantially increase support for climate change mitigation and adaptation through
providing policy, advisory, financial, and technical support to countries where a transition towards a lower
carbon, more climate resilient future is taking place.

199
These six multilateral development banks (MDBs) have set specific and differentiated targets for
increasing climate finance and for leveraging finance from other sources. These pledges contribute to the
US$100 billion a year commitment by 2020 for climate action in developing countries.
In this respect, the Ministry of Economy and Finance (MEF) of Italy is the shareholder of the MDBs of
which Italy is a member. In this capacity, the MEF oversees progress towards these targets in the
governing bodies of the institutions.
Furthermore, the Italian Ministry for the Environment, Land and Sea (IMELS) has been participating in
various trust funds at the World Bank with the aim of promoting sustainable development in developing
countries, increasing renewable energy and improving awareness, globally, on environmental issues and
the fight against climate change.
In the years 2013 to 2016, as energy access continues to be a priority for our government, IMELS
continued its longstanding support to Global Lighting and Energy Access partnership (Global LEAP), the
voluntary forum bringing together Governments, Development Partners and private entities in order to
share knowledge and best practices and support the development of systems of access to energy, with
particular attention to the quality and prices of off-grid lighting systems.
With regard to the 2013-2014 workplan, IMELS decided to finance activities in Nigeria, Ethiopia,
Tanzania, Senegal, Democratic Republic of Congo, Bangladesh, Pakistan, Afghanistan, as well as to
support the launch of a pilot in Papua New Guinea. Resources were also devoted to the development of
end-of life product disposal systems and to extend the network of product verification laboratories and
their certification.
Building on the success that has been able to achieve through the Global Lighting and Energy Access
Partnership (Global LEAP), which has resulted in over 100 million people having benefitted from modern
energy services through affordable solar systems providing basic lighting and phone charging services,
and a new solar off-grid energy industry launched, in 2015 IMELS provided additional financial resources
with the aim of promoting opportunities for expanded energy services delivery. As a result, region-wide
market development has been promoted with a view to expand the sector’s development, piloting new
market opportunities for emerging solar-based energy technologies and acknowledging the importance to
enlarge country-specific market development programs, especially in Africa.
The Ministry for the Environment also continued its support to the Communication for Climate Change
Multi-Donor Trust Fund (MDTF), with the aim of promoting communication and awareness-raising
activities in favor of sustainable development.
Thanks to this support, the Connect4Climate network was launched in 2013 and a global platform was
created to promote climate change awareness raising activities involving more than 200 partners
worldwide (civil society groups, international organizations, Enterprises, media, universities, etc.).
The Green Climate Fund (GCF) is a new global fund created to support the efforts of developing
countries to respond to the challenge of climate change. It seeks to promote a paradigm shift to low-
emission and climate-resilient development, taking into account the needs of nations that are particularly
vulnerable to climate change impacts. By the end of 2017 the Fund’s portfolio consisted of 54 projects
and programmes amounting to USD 2.65 billion in GCF funding. The GCF approvals demonstrate how the
Fund aims to balance projects approvals between mitigation and adaptation as well as between different
regions at the same time taking into account the most vulnerable developing countries, including LDCs,

200
SIDS and African States. The GCF is dedicating significant resources to support country partners in
developing high quality country-owned programmes. In particular, the GCF Readiness Programme aims
to support five outcomes connected to the Programme objectives: strengthening country capacity,
engaging stakeholders in consultative processes, realizing direct access, providing access to finance, and
mobilizing the private sector. In addition, the GCF’s Project Preparation Facility will support accredited
entities, especially direct access entities, to develop high quality GCF funding proposals. The PPF will
provide support to help cover the costs of early design work, including feasibility studies and risk
assessments.
Italy is a strong supporter of the Green Climate Fund (GCF), as the key multilateral vehicle for helping
developing countries adapt to climate change and follow low-carbon development paths. In 2014, at the
GCF donor conference, Italy pledged to contribute to the first capitalization of the Fund with 250 million
euro. The Italian Ministry for the Environment provided 150 million euro for the period 2015-2017.
IMELS, in the context of its bilateral programmes, is supporting developing countries partners in
accessing the resources of the Green Climate Fund and developing projects through existing accredited
entities.
The Ministry of Economy and Finance (MEF) of Italy is the member of, and the financial contributor to,
the Global Environment Facility (GEF). The GEF was established in 1991 and provides funding to
developing countries and countries with economies in transition. The funding comes in the form of grants
and concessional funding and covers the incremental or additional costs associated with transforming a
project with national benefits into one with global environmental benefits (GEBs).
The GEF administers four trust funds : the GEF Trust Fund, the Least Developed Countries Fund (LDCF),
the Special Climate Change Fund (SCCF) and the Nagoya Protocol Implementation Fund.
Financial contributions to GEF are replenished every four years by donor countries (GEF Replenishment).
Italy, via the Ministry of Economy and Finance (MEF) is a donor of the GEF Trust Fund since its
establishment.
MEF contributed to the Fifth and Sixth Replenishment with the same amount of 92 million euros,
representing a share of around 3.3% of total pledges . GEF-5 covers the period July 2010 – June 2014,
GEF-6 covers the period July 2014 – June 2018. Negotiations for the Seventh Replenishment are
underway and will be completed by June 2018.
In 2015, IMELS has also strengthened its support to the Least Developed Countries Fund (LDCF),
managed by the GEF, to help the world’s most vulnerable countries in their efforts to adapt to the effects
of climate change. The Fund aims at supporting countries in preparing and implementing their National
Adaptation Programs of Action. Projects financed by the LDCF are addressed to several sectors including
water, agriculture, disaster risk management and prevention and health. LDCF projects support practical
community level adaptation actions to improve resilience.
Since 2015, Italy is a contributor to the Adaptation Fund (AF) through IMELS. The AF provides finance
to projects that help vulnerable communities in developing countries to adapt and build resilience to the

201
effects of climate change while providing an innovative direct access modality that allows accredited
national institutions in developing countries to access financing and manage projects directly. Since 2015,
Italy provided 7 million euro to the AF and announced, during COP23 (2017), additional 7 million euro.
These contributions helped the Fund to assist vulnerable communities’ efforts in developing countries to
adapt to climate change and surpassing its fundraising target of USD 80 million per year both in 2016
and 2017. Furthermore, IMELS is working in synergy with the Adaptation Fund Secretariat and National
Implementing Agencies in order to scale up AF’s projects through its bilateral cooperation programmes
and activities.
Italy joined the Climate & Clean Air Coalition (CCAC) in 2012 with the intention to support actions
and initiatives to reduce Short-Lived Climate Pollutants and to contribute to combat climate change,
improve air quality and protect human health in the short-medium term.
Areas of interest of Italy in the framework of the CCAC are international actions on production and
consumption of HFC under the Montreal Protocol and UNFCCC, biogas recovery and production from
agriculture, gas capture in landfill, reduction of black carbon emissions from the transport sector.
In December 2015 and December 2016, the Italian Ministry for the Environment contributed to the CCAC
Trust Fund to provide support the CCAC Initiatives and the Secretariat, indicating as main areas of
interest and specific Initiatives: HFC, Urban Health, addressing SLCPs from agriculture, Oil and Gas.
As member of the CCAC, the Italian Ministry for the Environment supported the work of the CCAC
participating to Working Groups and to the definition and adoption of the political Communiques at the
CCAC High Level Assembly meetings.
The Project IACSA (International Alliance on Climate-Smart Agriculture) was started in March 2014 by
the Italian Ministry for the Environment and the FAO with the general objective to support the
establishment and functioning of the Global Alliance on Climate Smart Agriculture (GACSA).
The GACSA was launched on September 23rd 2014 at the UN Climate Summit in New York. It is a
voluntary and inclusive platform facilitating dialogue, knowledge exchange and learning, partnerships
across and within diverse interest groups, including Governments, International Organizations, NGOs,
farmers associations, practitioners and other stakeholders to accelerate up-take and practicing of the
Climate Smart Agriculture (CSA). The Climate Smart Agriculture is an approach developed by FAO to
developing the technical, policy and investment conditions to achieve sustainable agricultural
development for food security under climate change. CSA integrates the three dimensions of sustainable
development (economic, social and environmental) by jointly addressing food security and climate
challenge in 3 main pillars: a) sustainably increasing agricultural productivity, incomes and livelihoods; b)
adapting and building resilience to climate change; c) reducing and/or removing greenhouse gas
emissions, where possible.
GACSA brings together more than 160 members, including 23 Governments. The Alliance is aimed to
generate knowledge and mobilize technical support and financing to allow countries to adopt and
implement CSA.
The IACSA Project contributes to the GACSA by supporting the governance of the GACSA and the
relevant Action Groups in providing policy support, fostering investment, mobilizing funds and developing

202
knowledge, tools and methodologies to support the identification of the appropriate farming systems,
practices, technologies that address food security and climate change, at the national and local level.
Project milestones also included the preparation of Prefeasibility Studies on CSA in 3 developing countries
(Ethiopia, Ecuador, Botswana) and the contribution to strengthen the focus on agriculture sectors in
COP22 (Morocco).
Since November 2015, Italy is party and donor of the Initiative Climate Action Transparency (ICAT).
This voluntary partnership, supported by four donors and four implementing partners, aims at enhancing
the ability of recipient countries for accountability and transparency in the implementation of their
commitments to mitigation and adaptation set at national level and for reporting of financial resources
utilization made available for this purpose.
The Initiative is designed as a fast start to complement the work under the UNFCCC-Paris Agreement,
single framework for greater transparency which requires countries to report on their progress in
implementing the commitments and achieving their mitigation plans, the adaptation and mobilization
efforts or use of financial resources and other means of implementation to mitigate and adapt. So its
added value lies in doing front running work before and during the first years of activities by the CBIT,
since it is designed by donors as a vehicle to bring in a short time a substantial contribution to enhancing
the transparency of beneficiaries’ countries efforts while keeping a close look at developments on
transparency and accountability under the Paris Agreement.
IMELS has contributed 5 million Euro to the ICAT trust fund to assist 10-15 beneficiary countries selected
on the basis of balanced geographical distribution and willingness and readiness to participate. ISPRA, the
technical branch of the Italian Ministry for the Environment, is involved as ICAT implementing partner
both in the definition of the methodological toolbox and in the in-country capacity building activities.
In the same spirit, Italy is actively engaged in supporting the Capacity Building Initiative for
Transparency (CBIT), established by the Paris Agreement, and is one of the donor countries which
contributed to the founding and launch of a voluntary GEF trust fund in order to operationalize CBIT and
allow the first set of projects to be selected and funded before GEF – 7 replenishment .
The Italian Ministry for the Environment, Land and Sea is also committed to ensure synergies between
CBIT and the Initiative for Climate Action on Transparency (ICAT) and welcomed with appreciation the
global coordination platform which will be established by UNEP, UNDP, UNEP DTU Partnership as
implementing agencies, to enhance the interactions among existing similar Initiatives to leverage each
other resources and impact and avoid duplication.
An enhanced transparency system for action and support with common modalities and procedures for all
parties is crucial to achieve the long-term goals of the Paris agreement .In this respect, CBIT, which Italy
sustained with a voluntary contribution of 4 Million Euro, is a key outcome stemming from the Paris
Agreement and will be fundamental to improve transparency and building capacity overtime by
strengthening national institutions in line with national priorities.
CBIT aims to assist developing countries in meeting the enhanced requirements for transparency of
action and support under the Paris Agreement and it supports national institutions to plan, coordinate,
implement and monitor policies, strategies and programs to enhance transparency and report on
progress made in implementing Nationally Determined Contributions (NDCs). Moreover, CBIT provides
access to tools and applications to facilitate the use of improved methodologies and guidelines, as well as

203
country-specific training. In addition, it facilitates activities such as peer exchange programs to help
share experiences and expertise between countries.
The Global Bioenergy Partnership(GBEP) was established to implement the commitments taken by
the G8 Gleneagles Plan of Action in 2005. Following a consultation process among developing and
developed countries, international agencies and the private sector, the Global Bioenergy Partnership
(GBEP)197 was launched at the 14th session of the Commission on Sustainable Development (CSD-14) in
New York on 11 May 2006, and in response to the 2005 G8 mandate (renewed in 2007, 2008 and 2009),
GBEP initiated an international discussion on the issues related to bioenergy. From 2006 to 2012, GBEP
received a renewed mandate by the G8, then, in 2013, a recognition and support by the G20. The
Partnership is a forum where voluntary cooperation works towards consensus in the areas of the
sustainability of bioenergy and its contribution to climate change mitigation. It brings together public,
private and civil society stakeholders and focuses its activities in three strategic areas: Sustainable
Development, Climate Change, Food and Energy Security.
Italy supports the functioning and activities of the GBEP since 2006 through a Memorandum of
Understanding with the FAO which was extended until the end of 2019. Furthermore, Italy was entrusted
by the GBEP Steering Committee at its 19th meeting in 2016 to continue its co-chairing function of the
GBEP together with Brazil. The GBEP Secretariat, hosted at FAO Headquarters in Rome with the support
of Italy, is the principal coordinator of the Partnership communications and activities. Since 2014, several
activities have been developed by the GBEP partnership also through its specific Working Groups and
Task Forces.
For instance, the Working Group on Capacity Building for Sustainable Bioenergy organized several
workshop and activities aimed at raising awareness and data on the implementation of the 24 voluntary
sustainability indicators for bioenergy developed by the GBEP since 2011, which represent a unique tool
to inform the development of national bioenergy policies and programmes, monitor the impact of these
policies and programmes, as well as interpret and respond to the environmental, social and economic
impacts of their bioenergy production and use. Until now, GBEP sustainability indicators for bioenergy
have been tested in 10 Countries, including Vietnam, Paraguay, Germany, Italy, Ukraine, India and
197 GBEP and its Partners comprise 23 countries and 14 international organizations and institutions: Argentina, Brazil, Canada, China, Colombia, Fiji Islands, France, Germany, Ghana, Italy, Japan, Mauritania, Mexico, Netherlands, Paraguay, Russian Federation, Spain, Sudan, Sweden, Switzerland, Tanzania, United Kingdom, United States of America, Economic Community of West African States (ECOWAS), European Commission, Food and Agriculture Organization of the United Nations (FAO), Inter-American Development Bank (IDB), International Energy Agency (IEA), International Renewable Energy Agency (IRENA), United Nations Conference on Trade and Development (UNCTAD), United Nations Department of Economic and Social Affairs (UN/DESA), United Nations Development Programme (UNDP), United Nations Environment Programme (UNEP), United Nations Industrial Development Organization (UNIDO), United Nations Foundation, World Council for Renewable Energy (WCRE) and European Biomass Industry Association (EUBIA). A further 28 countries and 12 International Organizations and institutions are participating as Observers: Angola, Australia, Austria, Cambodia, Chile, Denmark, Egypt, El Salvador, Ethiopia, Gambia, India, Indonesia, Kenya, Jamaica, Lao PDR, Madagascar, Malaysia, Morocco, Mozambique, Norway, Philippines, Peru, Rwanda, South Africa, Thailand, Tunisia, Viet Nam, Zimbabwe, African Development Bank (AfDB), Asian Development Bank (ADB), Economic Commission for Latin America and the Caribbean (ECLAC), European Environment Agency (EEA), Global Environment Facility (GEF), International Civil Aviation Organization (ICAO), International Fund for Agricultural Development (IFAD), Organization of American States (OAS), Union Economique et Monétaire Ouest Africaine (UEMOA), World Agroforestry Centre (ICRAF), World Bank and the World Business Council on Sustainable Development (WBCSD).

204
Nepal. Furthermore, with a view to promote mutual cooperation and continue dialogue between public
and private sectors’ stakeholders, “Bioenergy Weeks” were organized yearly in specific regions worldwide
to focus on the respective priorities and challenges:
- 2nd Bioenergy Week, Maputo, Mozambique, May 2014;
- 3rd Bioenergy Week, Medan City, Indonesia, May 2015;
- 4th Bioenergy Week, Budapest, Hungary, June 2016.
Furthermore, sustainable modern wood energy development was discussed in the framework of Working
Group on Capacity Building for Sustainable Bioenergy, to discuss sustainable production and use of wood
energy for household and productive local uses, mainly in developing countries. This was realized through
the development of an ad hoc report and the realization of specific workshop in Benin to share best
practices in the field of wood energy management in Africa.
Capacity building activities were also undertaken on bioenergy mapping, discussing its role to collect
relevant indicators for the measurement of the GBEP indicators and contributed to populate the IRENA
Global Bioenergy Atlas.
Finally, further work was done within the GBEP since 2014 to integrate bioenergy systems into agriculture
and forestry systems to improve sustainable management of water resources, and further discussions are
ongoing on the potential establishment of two new activity groups, respectively on biogas and advanced
biofuels.
In November 2016, IMELS signed a new agreement with UNIDO-ITPO Italy to finance a project to
support the Iranian Government in upgrading and strengthening the competitiveness of the industrial
SMEs in Iran by identifying and promoting sustainable investment and technology transfer opportunities
in selected environment and renewable energy sectors with the aim of supporting sustainable
development, local job creation and fostering international partnership.
To pursue this goal, it is foreseen the establishment and operability of a focal point in Iran that assists in
field UNIDO-ITPO Italy in scouting an “ad hoc” portfolio of sustainable investments opportunities in the
country and open up new international partnerships, working also in close cooperation with other local
institutions in supporting private sector.
Regional cooperation
African Development Bank (AFDB)
The outcomes of the 21nd Conference of the Parties to the United Nations Climate Change Convention
(COP21) exemplify the increasing global awareness on climate change and the need to accelerate the
transition to clean energy.
Following the signature of the Paris Agreement, the Government of Italy is working to fight climate
change by supporting the Sustainable Energy Fund for Africa (SEFA) and the African Climate
Change Fund (ACCF), hosted and managed by the African Development Bank.
In late December 2015, the Italian Ministry of Environment, Land and Sea joined the SEFA with a total
contribution of 7.4 million Euro to support small and medium-scale private sector projects in the
renewable energy and energy efficiency sectors in Africa. The Fund helps projects develop bankable

205
investment opportunities and thus enables sponsors to attract equity and debt financing for successful
implementation through the Africa Renewable Energy Fund (AREF). The Fund also provides enabling
environment grants to improve the regulatory and policy framework for investments in sustainable
energy.
During COP21 in Paris, the Italian Ministry for the Environment, Land and Sea made a commitment of 4.7
million Euro to support the Africa Climate Change Fund (ACCF). The Italian commitment has triggered the
conversion of the ACCF to a multi-donor trust fund.
The Fund provides small grants to support the African countries in their transition to climate resilient and
low carbon development, and to enable the Bank to scale up its climate change activities.
On 30th November 2015, IMELS signed with the International Finance Corporation (IFC) an
agreement in order to support the implementation of the “Middle East and North Africa-MENA Inclusive
Green Growth Program”. IMELS provided 7 Million USD to the trust fund to support activities in Egypt,
Lebanon, Morocco, Tunisia and Palestine. Main objectives of the trust fund are: i. support governments in
reforming energy efficiency and renewable energy regulatory frameworks, ii. Promote energy efficiency
best practices and private sector participation in the design and implementation of resource efficiency
infrastructure projects, iii. Assist financial institutions to extend access to finance SME’s for sustainable
energy investments, IV. Help industry groups individual firms to mitigate their resource constrains.
In Central Eastern Europe, multilateral activities continued to be implemented also through the
cooperation with the Regional Environmental Center for Central and Eastern Europe (REC),
located in Budapest, Hungary. From 2001 to 2014 the Italian Trust Fund (ITF), was established to finance
and co-finance cooperation projects.
The funded projects have raised awareness of far-reaching challenges related to the environment, climate
change and health, and have provided fundamental help in identifying solutions. Cooperation with the
REC has also promoted strong networks among the beneficiary countries for regional and global solutions
and has opened up new opportunities and channels for the involvement of Italian and other key
stakeholders.
With particular reference to climate change and energy issues, several programs were carried out on
training and capacity building, energy efficiency innovation, trans-boundary cooperation, promotion and
awareness-raising regarding climate change mitigation and adaptation policies, promotion of low-carbon
solutions.
From 2013 to 2016 the following specific projects have been developed within this framework:
• Sustainable Development Academy (SDA) (2010 – 2015) - The “Courses for Sustainability” run by
the Sustainable Development Academy of the REC (SDA) are the fruit of a hugely successful Italian
initiative spearheaded by the Italian Ministry for the Environment, Land and Sea. The changes in the
program reflects the adaptation to the needs of different constituents and to the shifts in priorities of
environmental policy. Under SDA, the following initiatives were developed:
- Course for Sustainability 2014 has been designed to respond to the ongoing challenge of
integrating sustainable development into policy making, planning and implementation in Albania,
Bosnia and Herzegovina, Kosovo, the former Yugoslav Republic of Macedonia, Montenegro and
Serbia by providing a theoretical framework for specific aspects of sustainable development and

206
water management. The Course was focused on information/dissemination activities of two
projects co-financed by IMELS: CRESSIDA Project and CEO Platform.
The CRESSIDA Project (Building Local Community RESilience for Sustainable Development in
International Watersheds such as the Drini DrinA River Watershed) is focused to assist Countries on
water management at local level. Examples of best practices and successfully implemented policies at
European and country level have been shared, equipping participants with appropriate tools to tackle
national and local challenges.
CEO Platform for Green Growth in MENA Region is an initiative to facilitate the creation business
leadership forum that brings together business leaders and champions of green growth to engage with
regional and global policy makers to support the introduction of policies to promote green, sustainable
growth in the region, while facilitating processes and stimulating the environment that business operate
in and creating future markets in the region to turn risks into new business opportunities.
- “Local resources and energy management in Ukraine” (2015): initiative focused on capacity
building of local communities in Ukraine to improve environmental planning, enhance
environmental investments and combat climate change.
• Europe-China Clean Energy Center (EC2) project (2010 – 2015) - The Europe-China Clean Energy
Centre is a cooperation project initiated in 2010 by the European Commission, the National Energy
Administration of China and the Ministry of Commerce of China, with the support of IMELS, which is
supporting the Chinese Government’s efforts to shape a more sustainable, environment-friendly and
efficient energy sector while tackling climate change challenges.
• SEARCH III project (School Environment and Respiratory Health of Children) (2014-2016)
The overall goal of “SEARCH III” is to increase visibility of results and recommendations of the first and
the second phases of the SEARCH project and to produce a toolkit for environmental education. The
overall objective of the SEARCH project is the indoor air quality and children respiratory health at school.
On the basis of the results of SEARCH I and II, a dedicated user-friendly product was developed,
(“AirPack”), an innovative educational online toolkit on indoor air quality in schools , climate change and
energy efficiency designed for teachers and students.
• Strategic Activities of IMELS at UNFCCC COP 22 (2016)
At COP 22 a side event on “Air Pack: A Tool for Environmental Education”, was organized by the IMELS in
partnership with the REC and the Italian National Institute for Environmental Protection and Research
(ISPRA). The side event was focused on 2 main issues: a) present the Air Pack as a best practice to raise
awareness among decision-makers, policy-makers, agencies and other stakeholders, as well as students,
on the impact of climate change on the vulnerability of children’s health, especially the enhancement of
climate related risks to hazards in outdoor and indoor air; b) create a launching pad for international
activities (regional/sub-regional workshop) on environmental education on climate change for a specific
region of interest, based on the commitments of the UNFCCC and Paris Agreement and the mandate of
the REC as regional focal point for Article 6 of the UNFCCC and art. 12 of the Paris Agreement.
• Project “Building bridges between regions - Interregional cooperation on the implementation of
Principle 10 of Rio Declaration and Article 6 of UN Framework Convention on Climate Change in the
Caribbean Region” (2016-ongoing)

207
The project aims at supporting the regional efforts to implement Principle 10 of the Rio Declaration in the
Latin America and Caribbean. It also aims at facilitating the inter-regional cooperation between UN ECE
and UN ECLAC regions and more specifically the Caribbean sub-region on Principle 10, the transfer of
lessons learned, sharing practical experience and approaches in ensuring access to information, public
participation in decision-making and access to justice in environmental matters.
The project focuses on the 7 countries from the Caribbean region, signatories of the Declaration on
Principle 10: Antigua and Barbuda, Jamaica, Dominican Republic, Saint Vincent and the Grenadines,
Trinidad and Tobago and Grenada. It will aim at further promotion of the P10 regional instrument and will
strive to involve other countries in the process. This Countries face unique challenges due to their
environmental fragility and vulnerability to the effects of climate change and natural disasters. Access
rights are instrumental for inclusive sustainable development and should set the baseline approach in
addressing the complex challenges of our times. The main activities are related to national consultation
and promotional activities and contribution to the preparation of the Negotiating Committee Meetings
(NCM) on Principle 10.
Bilateral cooperation with developing countries
Inspired by the objectives of the Paris Agreement and its long-term goals as well as the Sustainable
Development Goals, Italy is strongly engaged to continue the activities mentioned in the Sixth National
Communication. Taking into account the initiatives undertaken in the previous years and the new
commitments under the UNFCCC, the bilateral cooperation stretches across all continents and regions:
Africa, Mediterranean region, Small Islands Developing States, Asia, Central and Eastern European and
Central and Latin America. Since 2015, particular focus has been given to the countries that are most
vulnerable to the effects of climate change: the Small Islands Developing States and the African
countries.
The following sub-paragraphs provide the description of the most relevant initiatives.
Cooperation on climate change in the Asian region
IMELS started the Sino-Italian Cooperation Program for Environmental Protection (SICP) with the
People's Republic of China, more than sixteen years ago. In this way, it was possible to develop over
200 project lines, for the environmental monitoring and management, mostly contributing at
strengthening Chinese national and local institutions, protecting and conserving natural resources, water
management, waste-to-energy, developing renewable energy sources, energy efficiency, sustainable
urban planning and eco-building, environmental protection in the poorest regions, developing low-
emission transport systems and technologies, sustainable agriculture, biodiversity protection and forest
management. About 66 projects were strictly related to climate change activities and objectives of the
Paris Agreement and the United Nations Convention on Climate Change, while the rest were useful to
create an enabling environment for mitigation and adaptation measures.
Project formulation has been entrusted to a permanent Sino-Italian task force made up of experts from
IMELS, Chinese Ministries and Agencies, Scientific Institutions, Italian and Chinese Universities. This task
force constitutes the Program Management Offices (PMO) based in Beijing and Shanghai. In the
timeframe between 2013 and 2016, the following projects were undertaken in the field of climate

208
change:
Actions to Improve the Energy Efficiency Performance of the Yunchou Building: in the framework
of an agreement among IMELS, Ministry of Science and Technology (MOST) and Tongji
University, the project consisted in a series of actions to improve the Energy Efficiency
Performance of the Yunchou Building in Tongji University, that will host the Sino-Italian campus
for environmental sustainability (SICES) and is an example of eco-efficient building.
Under the agreement on Beijing Clean Air Action Cooperation between IMELS and the People's
Government of Beijing Municipality, signed in 2013, three projects were developed between 2014
and 2015, allocated on Sino-Italian Environmental Cooperation for Sustainable Beijing (SIEC-
SUB) fund:
o Vehicle emission control policy, including low emission zone study and planning, aimed at
developing a policy study for vehicle emissions control, and planning an air emission
inventory for Beijing.
o Capacity Building for Management and Control of Air Pollution Sources: the objective of
this project was to continue strengthening the capabilities of Beijing Environmental
Protection Bureau (EPB) in the management and control of air pollution sources by
sharing experience in emissions assessment and authorization procedures, pilot research
activities on emission sources, calculation of emissions and pilot case assessment;
regulatory and authorization procedures for polluting industries on the basis of European
experience.
o Beijing’s clean air action plan international communication program.
In 2010, in cooperation with the National Development and Reform Commission (NDRC), IMELS launched
the Sino-Italian Climate Change Cooperation Program (SICP), a specific cooperation program aiming at
implementing joint initiatives in the field of mitigation and adaptation to climate change, transfer and
promotion of low-carbon technologies, studies and researches as scientific support to decision-making. In
2014, under the Framework Agreement on Climate Change Cooperation between NDRC and IMELS, the
project “Contribution to the development of China’s Low Carbon Product Certification System” was
developed. This is a pilot project in cooperation with the climate change department of the Chinese
National Commission for the development of reforms (NDRC), where the Italian knowledge and
experience about carbon footprint is shared with the aim to: study a carbon evaluation methodology of a
specific product and develop technical standards for low carbon products, assist a pilot province for the
definition of provincial technical standards for low carbon products, select a local businesses to be
subjected to low carbon certification procedures to evaluate and improve the certification process.
Since 2003, IMELS has been promoting an Advanced Training Program on the various issues of
environmental management and sustainable development, targeted at technicians, academics, young
professionals and decision-makers in Chinese administrations, universities and enterprises; an important
aim of the training program was the capacity building about potential climate change mitigation and
adaption actions. Since 2003 more than 150 Italian companies were visited during about 600 study visits.
Over 350 public and private institutions were involved, with a total of about 1000 speakers.
Between 2013 and 2016, over 2,000 participants from all the provinces of China took part in the training
program, with a total of 45 courses (in Italy and China).

209
In the table below are summarized the recipient institutions of the trainings, the contents, the number of
trainees and the amount of resources allocated on each training.
IMELS started its bilateral cooperation with the Islamic Republic of Iran in November 2015, signing
with the Iranian Department of the Environment (DoE) the Memorandum of Understanding on
“Cooperation for Environmental Protection and Sustainable Development” including a specific Annex
aimed to “Cooperation in the area of energy and climate change and implementation of nationally
appropriate mitigation actions”.
In 2016 the Joint Committee established under the abovementioned MoU adopted a Financial Agreement
that established a total allocation of 3 million euros for implementation of the MoU and co-financing of
joint projects.
In November 2016 a two-days technical workshop on “Environmental governance and climate change”
was organized in Tehran and attended by several Italian and Iranian companies and officials from Iranian
Institutions. Following this activity, a number of project proposals were submitted to the DoE in order to
receive – through approval by JC – financing under the MoU.
South Pacific Small Islands Developing States
The Partnership with the Small Island Developing States has been launched ten years ago to implement a
cooperation programme for addressing the key global challenges related to mitigation and adaptation to
climate change, protection from vulnerability to extreme climate variability and mitigation of harmful
emissions generated by energy utilization.
The Memorandum of Understanding between the Italian Ministry for the Environment, Land and Sea
(IMELS) and the Governments of the Pacific Small Island Developing States participating to the project
"Co-operation on climate change and on the clean development mechanism under article 12 of the Kyoto
protocol", was signed in New York on 11 May 2007 and subsequently signed by all Parties and currently
includes among donors: the Italian Ministry for the Environment, Land and Sea (IMELS), the Ministry of
Recipient Institution Content of the training Number of trainees Cost of the training
Period
Department of Climate Change of the National Development and Reform Commission of P.R.C. (NDRC)
Climate change and sustainable development (including capacity building, Policy, Conventions and Statistical Systems)
106 members of central and provincial DRC and other organizations selected by NDRC
241 k€ 2013, 2015
Institute of Industrial Economics and the Chinese Academy of Social Science (CASS)
Eco-management strategies
and policies (including a module on Clean Energy and Climate Change)
492 officials, experts and senior business leaders
950 k€ 2013-2015
Beijing and Shanghai Municipal Environmental Protection Bureau
Environmental management and sustainable development (including low-carbon technologies, policies and mobility)
324 high level staff or technicians responsible for environmental management
243 k€ 2013-2014
Ministry of Science and Technology (MOST)
Environmental management and sustainable development (focus on industrial energy efficiency)
159 officials from central and local governments, experts from R&D institutions, managers from organizations and enterprises.
138 k€ 2013-2014

210
Foreign Affairs and International Cooperation of the Italian Republic, the Grand Duchy of Luxembourg,
the Ministry of Foreign Affairs and Cooperation of Spain, the Federal Ministry for Europe, Integration and
International Affairs of the Republic of Austria.
Pacific Small Island Developing States participating to the programme are: the Republic of the Fiji
Islands, the Republic of Kiribati, the Republic of the Marshall Islands, the Federated States of Micronesia,
the Republic of Nauru, the Republic of Palau, the Independent State of Papua New Guinea, the
Independent State of Samoa, the Solomon Islands, the Kingdom of Tonga, Tuvalu, and the Republic of
Vanuatu.
Activities
The main component of the mitigation activities of the programme, includes the development and
dissemination of the use of rural renewable energies sources and biofuels to meet the energy security of
the Pacific Small Island countries, reduction of greenhouse gases emission and promotion of sustainable
transport. Moreover, the programme intends to strengthen national capacities also through capacity-
building and technology transfer activities for the establishment of national energy policies and
strategies, as well as markets, develop specialized human resources and work closely with communities,
so as to ensure sustainability.
Further, the adaptation activities aimed to support the Disaster Risk Reduction efforts of the Pacific SIDS
as a means to decrease their vulnerability to the impact of severe weather occurrences and increase their
capacity to adapt to increasingly extreme situations caused by climate change, inter alia supporting the
protection and conservation of marine and terrestrial ecosystems and biodiversity as a means to increase
the resilience of the Pacific.
Project implementation 2013-2016
The projects agreed by the Joint Committee (JC) established under the MoU, both ongoing or concluded,
for the period January 2013 – December 2016 are the following:
FIJI
Project: ”Extension of the Fiji Fellow on Ocean and Seas“ approved in 2016 at JC10.
The main objective is to build on the successful implementation of the implemented project Tonga’
project “Capacity building for the follow-up to and implementation of major international agreements.
Fellowship on the Ocean and Seas - PSIDS FOS”, previously funded by IMELS, by ensuring that the skill-
set gained is maintained and disseminated in the Fiji team in New York and in capital including PSIDS
Missions in New York. It was the intention of the PSIDS FOS to enable the Fellows to take the acquired
knowledge and skills back to their home countries and further strengthen their respective political, legal,
and/or technical capacities attuned to the regional and international interests of the PSIDS.
KIRIBATI
Project: ”Outer Island Fish Center Solar Panel System” approved in 2016 at JC9.
The main objective is to install Solar off-grid System in ten fish centers of outer islands, to generate and
supply 24/7hrs electricity to the ice making machine, freezers to store fresh fish, also for maximizing the
benefits of small fisheries community, the local and sustainable use of marine resources and the largely
resilience.

211
MARSHALL ISLANDS
Project: “Building Infrastructure Resilience” approved in 2016 at JC9
The main objective is improve the national Planning and Zoning Act of Marshall Islands trough the
revision of building code and standards with the inclusion of climate change adaptation and disaster risks
management and the establishment of a resource center for information on DRM/CCA/GIS. The long-term
goal is to enhance the overall capacity of the Marshall Islands to reduce risk and vulnerability, especially
in the infrastructure sector.
NAURU
Project: ”Household Water Storage Project – Phase II and III ” approved in 2015
The main objective is to meet the ever increasing demand for potable water in Nauru, due to its changing
climatic variability and continuous population growth, within a larger local strategic approach to securing
Nauru’s National water supply. Following the National census of 2011, 260 of the 1652 household
dwellings on the island represented the most vulnerable of the requiring assistance.
SOLOMON
Project: ”Sustainable Program of a widespread rural electrification for water and energy
security” approved in 2016
The main objective is to reach out to rural communities in terms of provision of sustainable and reliable
electricity supply. It will combine electrification initiatives with technology transfer activities. The
installation of small off-grid plants for rural electrification and the creation of two Youth Micro-Enterprises
(YME) to provide a maintenance service for solar plants. The project installed 16 plants in two provinces
of the Solomon Islands involving almost 3.000 people who lived in absence of essential energy services.
In addition, 30 people, among teachers and students, were trained on selection and maintenance of a PV
system. For each village, a well pump was installed with a dispenser of drinking water, lighting computer
and projector, sterilizer and refrigerator for surgery and a satellite phone. All equipment were monitored
with a remote control both to detect malfunctions and to collect operating data.
Project: ”Planning for electricity network in Solomon Islands” approved in 2016 at JC10
The main objective were to enable finding, through a simulation model, the more efficient way to
connect, on the field, different nodes inside electricity grid or networks. In particular the simulation
software provided with: (i) electricity network constraint study to identify quickly areas of
reinforcements; (ii) reliability and network optimization with maintenance of key assets; (iii) load flow
analysis for network extensions, protection study and network loss study. Furthermore the project
produced a case study for 2 sites, including a business and feasibility study, that supported SP boards to
proceed with its plan to install additional 37 mini solar hybrid systems in Guadalcanal Province and in the
other Outer Islands.
PALAU

212
Project: ”Increasing Palau’s resilience to extreme drought events: taking action for long-term
adaptation to the impacts of climate change” approved in 2016
The main objective was to build Palau’s resilience to extreme drought events in particular to prolonged
period due to the exacerbated effects of the ENSO Oscillation as for example the recent severe drought
that led Palau to declare a State of Emergency in March 2016. The objectives of the work are: 1) To
identify and develop new ground water sources for rural areas of Palau; and 2) To prepare and launch an
educational program that promotes proper water conservation and management in communities,
business and schools throughout Palau.
Project: ”Establishment and operationalization of the first nationwide Marine National
Sanctuary in Palau” approved in 2014
The main objective was to increase socio-ecological resilience in Palau Challenge through an innovative
and first of its kind adaptation response strengthening fish stocks for traditional fishing and reforming
and modernizing Palau‘s domestic fishing industry for the development of Palau‘s Eco-tourism. The
marine sanctuary is motivated by the need to: (i) adapt to climate change; (ii) promote sustainable
livelihoods; (iii) foster regional integration; and (iv) produce globally significant benefits.
TONGA
Project: ”Tonga at the United Nations: A Capacity-Strengthening Project Aimed at the “De-
Silo-ing” the Whole-of-Government Approach to Sustainable Development and Connecting
Ocean Health with Climate Change Policies” approved in 2016
The main objective is to train fellows that will integrate with the Kingdom’s diplomatic mission at the UN
as Advisors and representing the interests of the country as directed from time to time by the Permanent
Representative as the proponent of this project. The project provides a means to not only support the
immediate needs of the Tongan Mission, but it will also help strengthen the civil servants’ negotiating
capacity so as to improve their engagement in international and regional fora. Providing these
professionals with useful skills will contribute to promoting and safeguarding Tonga’s national interests
through foreign policy pursuits
Project: ”Capacity building for the follow-up to and implementation of major international
agreements” approved in 2015
The main objective is to assist Small Island Developing States of the Pacific by building both individual
and institutional capacities. It provided a fellowship with training on relevant issues of ocean and law of
the sea, ocean policy, and marine science to build fundamental knowledge and understanding of the
various processes (biological, physical, and legal) related to oceans; negotiations and media training to
learn the skills necessary to carry information beyond policy-making circles to a broader international
audience
TUVALU
Project: ”Solar Home Standalone (SHS) Systems and PV Cooling Storage Facility
Niulakita/Funafala” approved in 2014
The main objective was to install a Solar Home System (SHS) to provide the user with a convenient
213
means of supplying power for small electrical loads like TV and radio, the v-sat to provide a more reliable
communication, for the electrification of church building and the community hall, the school and the
clinic.
VANUATU
Project: “Irrigation for a Resilient and Sustainable Agriculture” approved in 2016
The main objective is to realize a high efficiency drip irrigation system, powered by solar energy, in order
to promote local agriculture resilience to the impacts of climate change in particular during the dry
seasons prolonged by the extreme cycles (El Nino and La Nina) of the El Nino Southern Oscillation
(ENSO). Each system will consist of a well and pipes for irrigation, a submersible pump, a storage tank
for water supply and a PV modules with inverters for the electrification of the pump. System has been
planned to full cover the daily water demand during dry season (almost 10 m3/day/ha).
The six sites chosen for the installation of the irrigation systems are located on the islands of Tanna,
Efate and Santo, for a total area covered by the project of 10 hectares.
Maldives
In 2015, IMELS signed a Memorandum of Understanding on climate change, vulnerability, risk
assessment adaptation and mitigation, with the Ministry of the Environment and Energy of the Republic
of Maldives.
According to this programme, in the first year of activities three projects have been adopted, namely:
Project: “Installation of a water desalination plant on the island of Magoodhoo - Faafu Atoll”
It consists of a desalinating sea water plant through the reverse osmosis plant and a photovoltaic cell to
electrically power this latter. The water is forced through polymer membranes that allow water molecules
to pass, blocking, however, the salts and other inorganic impurities. The project will contribute to reduce
the dependence on the imported fossil fuels in terms of fuel storage capacity and vulnerability to price
fluctuations; indeed, it will contribute to promote awareness of the relationship between water resources
and environmental vulnerability. The project takes place in the Magoodhoo – Faafu Atoll – Maldives.
Project: “Enhancing weather and climate monitoring and data management capacity of Maldives
Meteorological Service for reducing vulnerabilities of climate change in the Maldives”
The project aims to strengthen the meteorological monitoring network, early warning and disaster
prevention systems. It consists of in the installation of 25 Automatic Weather Stations (AWSs), that will
measure the following parameters: air temperature, relative humidity, air pressure, wind direction and
speed, cumulative rain and rain intensity. The AWSs are powered by a solar panel system with battery
backup. The project will also improve the Strengthening Early Warning Communication by establishing a
Common Alerting Protocol at the Maldives Meteorological Service. Finally, the project contributes to
increase the capacity building of the Maldives Meteorological Service, in the following key areas: climate
modelling; short range weather forecasting; equipment maintenance including calibration.
Project: “Ocean Energy Resources Assessment for Maldives”
The main objective of the Project is to perform a detailed assessment of the energy potential residing in

214
the marine currents in the Maldivian archipelago, and to individuate technological solutions to exploit it.
Based on the analysis of the previous section, these main objectives can be achieved through the
following actions: development (for the first time) of high-resolution three-dimensional models of the
marine circulation in the Maldivian Archipelago and in some of the atolls to be selected; use of the
numerical models to characterize in detail the variability of the circulation in the area, and to individuate
the sites that are most interesting for energy extraction; deployment of instruments for measuring the
currents in the selected sites. The use of these instruments will also provide validation of the numerical
simulations; evaluation of the energy potential of the most interesting sites, and of the best devices to be
used for energy extraction.
Cooperation in the Mediterranean region
Egypt
IMELS signed on 8 December 2015 a MoU with the Egyptian Ministry of the Environment with the aim to
promote sustainable development and protecting the environment. The total amount committed by
IMELS for the development of joint projects is 4 Million Euro. The Work Plan approved in April 2016,
identifies the following sectors of intervention: management of protected areas, increase of energy
production from renewable energies, sustainable waste management, promotion of sustainable public
transport. Until now no project initiative has been approved due to political instability and some
constraints in bilateral cooperation.
Meanwhile, IMELS financed through UNEP the initiative named “Creating a Strategy and Paving the way
for the Deployment of Distributed Renewable Energy Technologies in Egypt” for a total amount of 2,18
Million euro. The initiative, which involves experts from Politecnico di Milano and technicians from New
and Renewable Energy Authority (NREA), aims to increase energy efficiency, guarantee the decrease of
fossil fuel and the diffusion of renewable energies, also through the implementation of financial
mechanisms (with the involvement of local banks) in order to mobilize 22 Million euros.
Lebanon
On 7 July 2016, IMELS signed a MoU with the Lebanese Center for Energy Conservation (LCEC) with the
aim to promote sustainable development. During the first Joint Committee established under the MoU a
Work Plan has been approved which identifies as main sectors of intervention the following: innovation on
energy policies, promotion of sustainable and low carbon emissions technologies, promotion of financial
policies to increase interventions in the field of renewable energies and energy saving.
Also a MoU has been signed between IMELS and the Central Bank of Lebanon for a value of 5 million
euros in order to promote a financial mechanism to facilitate, through the Lebanese trading banking
system, an easy financing line for projects in the field of renewable energies and energy saving which
could also attract Italian SME’s with competencies in such field, fostering the involvement of the private
sector in general.
Morocco
Through an agreement signed in 2012 with “Agence Marocaine pour l'Efficacité Energétique (AMEE)”
IMELS is supporting a project which aims to widespread energy efficiency initiatives within the
Casablanca University Hospital. The project will provide some buildings of the hospital with the

215
installation and disposal of solar heating plants guarantying easy access to hot water.
The 21st of April 2016 a MoU has been signed between IMELS and the Ministry delegate in charge of
Environment of the Kingdom of Morocco, with the aim to promote sustainable development initiatives
with an Italian contribution of 2 Million Euros. In June 2016, a first Joint Committee has been held
approving the Work Plan which identifies the following main sectors of intervention: enhancing the
process of implementation of Mitigation and Adaptation measures linked to the NDC’s, build capacity and
share experience and knowledge at the national and regional level on mitigation and adaptation to
climate change including through South-South and triangular cooperation, strengthen the national policy
on the Integrated Coastal zone Management at the local level, strengthen education on Environment and
Sustainable Development.
Palestine
The 23rd of February 2016, a MoU has been signed between IMELS and the Palestinian Quality Authority
(EQA) with the aim to encourage and develop cooperation in the field of environmental protection and
sustainable development.
During 2016 two Joint Committee have been held approving a Work Plan identifying sectors of
intervention in the field of: public awareness and environmental education, strengthen the legal and
institutional framework in accordance with the multilateral environmental agreements, enhance local
capacity in environmental monitoring and planning, and capacity in pollution prevention.
In this framework a project on “Land use” has been approved that aims at increasing local capacity in
assessing the status of the environment based on satellite image. In particular the project will strengthen
EQA capacity in dealing with territorial development and increase local know-how in monitoring the status
and the impact of climate change in Palestine. This activity will increase EQA capacity to comply with
Multilateral Environmental Agreements such as the CBD, UNFCCC and others.
Tunisia
IMELS supports a reform of the Mediterranean Renewable Energy Centre (MEDREC), established in 2004,
in Tunis, in collaboration with the Ministry for Industry of Tunisia and the Tunisian National Agency for
Energy Conservation. With this aim in December 2015 a new Statute of MEDREC has been approved also
by IMELS and relevant partners. In December 2016 a first Assembly of the MEDREC has been held in
order to boost the activities in tackling climate change in the country.
Qatar
The 28th of January 2016 IMELS and the Ministry of Municipality and Environment of Qatar singed an MoU
with the aim to promote cooperation in the field of sustainable development, climate change
vulnerability, risk assessment, adaptation and mitigation. Main areas of cooperation are linked to the
challenge of addressing drivers of land degradation, the promotion of economic diversification and
technological transformation towards low GHG development, particularly the deployment of renewable
energies. To date no concrete progress in terms of implementing activities have been made.
Cooperation on climate change in the Sub-Saharan African region
Africa has become a priority continent in the Italian development cooperation activities.
In this context, IMELS is committed to supporting national strategies that aim at:

216
- facing the high climate change vulnerability that often prevents African countries from
consolidating their economic growth, and to address its environmental consequences;
- promoting an effective and sustainable growth of the energy sector taking into account the
availability of renewable energy sources (sun, wind, rivers) in many Sub-Saharan African
countries.
On this line, IMELS is developing several bilateral agreements with many African developing countries in
order to strengthen and coordinate the efforts to combat global climate change, to support mechanisms
to reduce climate change vulnerability and enhance risk assessment, to promote secure, clean and
efficient energy, to stimulate the transition towards a sustainable low-carbon economy and to implement
adaptation actions and opportunities to protect the environment and natural resources.
On December 2015, The Italian Ministry of Environment, Land and Sea signed with the Ministry of
Environment, Natural Resources Conservation and Tourism of the Republic of Botswana the first African
Memorandum of Understanding (MoU) on cooperation in the field of climate change vulnerability, risk
assessment, adaptation and mitigation.
Subsequently, during 2016, environmental cooperation agreements have involved several countries in
the region. In particular, agreements with the Ministries of the Federal Democratic Republic of Ethiopia,
the Republic of the Djibouti, the Union of Comoros, the Kingdom of Lesotho, the Democratic Republic of
the Congo, the Republic of Rwanda, the Republic of South Africa, the Republic of Sudan, the Kingdom of
Swaziland have been signed, with a total budget of €18,5 Millions.
Furthermore several MoU with the United Republic of Tanzania, the Republic of Seychelles, the Republic
of Kenya, the Democratic Republic of Sao Tomé e Principe, the Republic of Namibia, the Republic of
Zambia, the Republic of Mozambique, the Republic of Mali and the Republic of Mauritius are still being
negotiated.
The cooperation activities planned under the MoU range:
realization of joint projects;
programs for capacity building, technology transfer and technical assistance;
exchange of information and documents related to environment, including programs,
publications, expertise and study results;
exchange of experts and trainers, organization of workshops, seminars and other meetings;
promotion of private sector participation and activities to implement Public Private Partnerships;
enhancement of cooperation with non-governmental organizations with regard to programs and
initiatives in the field of environment and sustainable development;
enhancement of public education and awareness campaigns on measures for adaptation to
climate change.
Generally the main topics of the cooperation activities concern areas of common interest, such as:
collection, analysis and dissemination of meteorological data relevant to the observation of
climate change and the measurement of its impact on the potentially vulnerable economic
sectors;
implementation, monitoring, reporting and communication of the Nationally Determined
Contributions (NDCs);

217
enhancement of capacities for the implementation of Mechanisms under the UNFCCC and its
related instruments;
stimulation and dissemination of economic and technological transformation towards low emission
development in ensuring energy security and creating adaptation actions and opportunities;
capacity building for monitoring, reporting on climate issues, such as mitigation and adaptation;
reduction of deforestation and forest degradation, enhancement of forest carbon stocks and
sustainable management of forests;
promotion of sustainable crop and livestock production practices for greater food security and
greenhouse gas emissions reduction, also through the application of the climate-smart agriculture
approach (CSA);
access to electric power generation from renewable energy sources and promotion of renewable
energies in order to achieve the target established by the country;
implementation of regulatory reforms enabling private investments in energy efficiency and small
scale renewable energies;
access to drinking water and sustainable integrated water management;
sustainable waste management;
promotion of measures to enhance vulnerable coast ecosystems preservation;
promotion of measure to preserve biodiversity;
mitigation of environmental impacts due to migratory flows of person, including the promotion of
the environmental sustainability of refugee camps.
Projects 2013-2016
During the period January 2013 – December 2016, the following project has been agreed by the Joint
Committee (JC) established under the MoU:
Botswana
Project: ”Technical assistance in supporting Botswana private sector and relevant institutions in
renewable energy through investment promotion and technology transfer” of UNIDO ITPO approved in 24
October 2016 at JC2.
The objective of the project is to support the Botswana Government in identifying and promoting new
investment and technology transfer opportunities, providing ad hoc capacity building activities in selected
renewable energy with the aim of supporting sustainable development, local job creation and fostering
international partnerships.
Cooperation on climate change in Central and Latin America
In Mexico, the activity proceeded under the Memorandum of Understanding on “Cooperation in the Field
of Climate Change “, signed with the Secretariat of the Environment of Federal District of Mexico City in
2009.
Three projects have been concluded:
“TRAINING PROGRAM ON SUSTAINABILITY AND CLIMATE CHANGE”, with the aim to foster
sustainable development and environmental protection through capacity building activities
focusing on sustainable energy and climate change, addressed to policy makers, officers, local
technicians and operators selected from the Federal District of Mexico City in order to promote a
sustainable approach in the management of environmental, economic and social concerns.

218
“WATER SUSTAINABLE MANAGEMENT AND GREEN TECHNOLOGY APPLICATION IN THE MUSEUM
OF NATURAL HISTORY AND ENVIRONMENTAL CULTURE OF MEXICO CITY”, aimed to identify and
design an integrated water recycle system through the adoption of “green” technologies creating
a water self-sustainable Museum while generating environmental benefits to the nearby Lago
Menor de Chapultepec. In parallel a pilot project of integration of green technologies for water
capture and depuration, thermal insulation and CO2 fixation has been implemented on small
scale to be utilized for demonstration and education purposes.
“Reuse of the Organic Waste Fraction”: the project was devoted to develop, test and demonstrate
a comprehensive integrated organic waste management, implemented with innovative measures
and technologies, which aim is to improve the environmental performance of the compost
recycling process and its final end-products and to foster a larger use of compost by agriculture
and in public and private urban gardening and nursery.
On September, 2015 IMELS participated to “Green Expo 2015” - Mexico City, promoting the dialogue with
the Italian companies involved in the energy sector. It gave also the opportunity to explore the possibility
of launching new cooperation activities with the Ministry of the Environment and Natural Resources of the
United Mexican States (SEMARNAT).
On July 20th, 2016, IMELS signed with SEMARNAT a new Memorandum of Understanding in the field of
“Climate change vulnerability, adaptation and mitigation”. The main areas of cooperation includes: early
warning system, sustainable agriculture, natural capital and protection of coastal marine areas. Activities
will be promoted through capacity building and training, sharing of resources and technology transfer.
Two main projects are currently on going: The organization of two Seminars based on “Environmental
Economics and Natural Capital” and the elaboration of the Proposal “Sustainable energy use of the agro-
forestry waste in Mexico”.
CARICOM
In 2015, the Ministry for the Environment, Land and Sea of Italy and the Governments of Antigua and
Barbuda, the Bahamas, Belize, Dominica, Grenada, Guyana, Haiti, Saint Kitts and Nevis, Saint Lucia, and
Saint Vincent and the Grenadines signed a Memorandum of Understanding on Climate Change
Vulnerability, Adaptation and Mitigation.
The main sectors of cooperation identified are:
Adaptation to climate change, and protection from the vulnerability to sea level rise and climate
variability, in the region.
Implementation, reporting and assessment of the Nationally Determined Contributions.
Development and dissemination of the use of renewable energies.
Transfer of scientific and technical knowledge and experience.
Transfer of technology.
Exchange of experts, scientists and researchers.
Enhancing capacities for the implementation of Mechanisms under the UNFCCC and its related
instruments.
Promotion of joint ventures between the private sectors of the Parties.
Indeed, two programmes of activities have been developed regrading:

219
Sustainable Energy Programme:
Assessment of energy requirements and strengthening of energy policies and action plans, which
refers to several actions, such as: technology assessment of energy requirements and
infrastructure in the mid-and long-term and of the most appropriate renewable energy mix
capable of meeting those needs; advice and technical assistance for the development of
sustainable transport technologies, including non-motorized solutions, in order to reduce
pollutants and GHG emissions; development of human resources specialized in the planning,
implementation and management of energy policies, strategies and plans; strengthening the
participation of all actors in the design and implementation of renewable energy policies and
practices, in particular of rural women; strengthening national capacities for the development of
national and regional energy markets, as well as of the appropriate financial instruments;
improving the policy measures and a sound regulatory framework; energy data collection and
analysis .
Rural Electrification, which refers to several actions, such as: installations and rehabilitation of
existing facilities with photovoltaic technology, or other renewable energy technologies – like: as
mini hydro and wind.
Development of renewable energy sources, which consists of investigating the renewable
potential, photovoltaic stand-alone electrification in urban areas, photovoltaic integration into the
national grid, wind energy data collection and resource assessment, biogas from household waste
and waste management, assessment of the geothermal, tidal and wave power generation
potential, small hydropower resource assessment.
Climate Change Adaptation:
Sub-Programme for Disaster Risk Reduction, which consists in development of measures to adapt
to sea level rise; in strengthening early warning systems through collection, analysis,
management and use of relevant data, including preparation of risk maps, on the evolution of
weather phenomena and their impact on ecosystems at the social and spatial scale;
Strengthening disaster risk governance and national capacities for disasters prevention,
mitigation, preparedness, response, recovery, and rehabilitation, and fostering collaboration and
partnership across mechanisms and institutions for the implementation of instruments relevant to
disaster risk reduction and sustainable development; in enhancing the resilience of national
health systems, including by integrating disaster risk management into health care systems,
especially at the local level; in development of contingency plans for risk management due to
natural disasters; development of adaptation measures for critical facilities, such as schools and
hospitals; development of new building codes, rehabilitation and reconstruction practices and
standardized building materials; increasing resilience of new and existing critical infrastructure,
including water and sanitation, transportation and telecommunications infrastructure.
Sub-Programme for the Protection and conservation of marine and terrestrial ecosystems and
biodiversity, which consists of development of conservation measures for coastal and marine
areas affected by the negative impacts of climate change, especially those that are particularly
significant for their biodiversity and for providing ecosystem services; strengthening the national
managerial and organizational capacity as well as governance in the areas of protection and

220
conservation of marine biodiversity; development of protected areas; development of
programmes and projects that enhance ecosystem resilience and increase the contribution of
biodiversity to carbon stocks through conservation and restoration measures; development of
measures to minimize and address the impacts of ocean acidification and invasive species.
In particular, in 2016, 7 projects have been approved, mainly related to the energy sector. These
projects are mostly significant as they contribute to achieve the Intended Nationally Determined
Contributions (INDCs) of the countries. They are:
For Antigua & Barbuda, we adopted a pilot project to achieve emission reductions in the
transportation sector, by providing the islands with electricity school buses.
For Bahamas, the project consists of retrofitting the Anatol Rodgers High School.
For Dominica, the project consists of creating a Solar Photo Voltaic system at the DOWASCO
Sewage Treatment Plant. The project seeks to reduce the energy cost associated with sewerage
treatment by replacement of approximately 59% percentage of the power obtained from the grid
with renewable energy via the installation of a solar PV system. The project will serve to reduce
DOWASCO’s carbon footprint and serve as a pilot for powering the remainder of DOWASCO’s
facilities island wide with renewable energy, particularly potable water and wastewater pumping
stations.
For Grenada, the project aims to create a reverse osmosis desalinization system with a
photovoltaic system, in the island of Carriacou.
For Guyana, the project is on developing pregame able to ensure Energy Security, in the
community of Bartica.
For St Lucia, the project points to identify several parking areas on island with potential for
development into solar car ports.
For St Vincent and the Grenadines, like for Grenada, the project consists of creating a reverse
osmosis desalinization system with a photovoltaic system.
Country Project Cost
Antigua and Barbuda Electric School Bus Pilot $ 625.000
Bahamas Retrofitting of the Anatol Rodgers High School $ 667.652
Dominica Solar Photo Voltaic system at the DOWASCO Sewage Treatment Plant
$ 491.050
Grenada Carriacou Photo Voltaic powered Salt Water Reverse Osmosis desalinization system
$ 500.000
Guyana Transitioning to National Energy Security: Bartica as a Model Green Town
$ 650.000
St. Lucia Solar Carport and Electric Vehicle Charging Station $ 486.675
St Vincent and the Grenadines
Salt Water Reverse Osmosis Desalinization powered by a Photo Voltaic Renewable Energy System
$ 1.250.000

221
Total $4.670.377
REDD+ in Ghana, Panama, Papua New Guinea
In 2015, a Memorandum of Understanding on cooperation to scale up private sector involvement in
support of mitigation and adaptation to climate change, including addressing drivers of deforestation and
forest degradation, and enhancement of low carbon sustainable development has been signed with
Ministry of Environment, Science, Technology and Innovation of the Republic of Ghana, Ministry of
Environment of Panama, and Ministry of Environment, Conservation and Climate Change of Papua New
Guinea.
According to this programme, IMELS has supported activities to enable the three countries to present
their National Forest Reference Level to the UNFCCC; as well as to evaluate the legal and policy
frameworks, including national legislation around carbon ownership and rights, necessary to scale up
private sector involvement in REDD+ activities.
Cooperation with Central and Eastern European countries on climate change
In Central and Eastern Europe, IMELS has been active since the beginning of the years 2002. Since
then, the cooperation program has expanded with several projects implemented in Albania, Bosnia,
Croatia, Bulgaria, Serbia, Montenegro, Macedonia, Poland, Romania, Turkey, Hungary, Kyrgyzstan and
Tajikistan, mainly dedicated to:
strengthen local and national capacities on environmental governance;
transfer know-how and technologies to prevent and control environmental pollution and water
management;
promote renewable energy and energy efficiency.
In the Republic of Albania IMELS signed a Memorandum of Understanding, on 31 May 2005, on
“Cooperation in the field of the Clean Development Mechanism under article 12 of the Kyoto Protocol”.
The agreement aimed at facilitating the implementation of the Kyoto Protocol, through legal support to
the national competent authority (DNA), and technical support for potential CDM project assessment, in
the field of renewable energy sources, energy efficiency, waste and forest management. One project
(Power plant from HydroEnergy) has been admitted as a CDM by UNFCCC.
In Montenegro, IMELS co-financed, in the framework of the Cooperation Agreement for Environmental
Protection signed in November 2012 in Podgorica, the construction of an “ecological building” that will
host the headquarters of the Montenegro Ministry of Sustainable Development and Tourism, for an initial
estimated value of 8.000.000 Euros.
In 2016 a renewed Cooperation Agreement foresees the provision by IMELS of additional 4.000.0000
Euros of technical assistance for the Ministry of Sustainable Development and Tourism.

222
Scientific cooperation
IMELS is also strongly committed to support programme on scientific research and technology transfer in
strategic areas, like China, in collaboration with noteworthy research centre. These projects are dedicated
to improve these regions capacity to tackle climate change by fostering research.
In the framework of the Sino-Italian Cooperation Program for Environmental Protection (SICP) several
scientific and technological research projects have been implemented, in collaboration with the National
Development and Reform Commission, the Chinese Ministry of Science and Technology, the main Chinese
scientific institutions, Chinese Municipalities, companies and prestigious universities, such as Tsinghua
University in Beijing, Tongji University in Shanghai and Jiaotong University in Shanghai.
Within the framework of Agreement on Scientific and Technological Cooperation between the Government
of the Italian Republic and the Government of the People's Republic of China, IMELS co-funded in 2016
the project “Remediation of Old Landfills for Environmental sustainability and final Sink (ROLES)”, which
is on-going at Tsinghua University and University of Padova.
The project is to advance scientific research and technology related to old landfill remediation by using
modern concepts such as environmental sustainability by keeping diffused, long-term, and greenhouse
gas emissions under control, stabilization and immobilization of long impacting hazardous substances,
final sink for elements, recovery of resources.
The cooperation with the Euro-Mediterranean Centre for Climate Change (CMCC) allows IMELS to
develop other projects as part of an integrated, multi-disciplinary and frontier research for understanding,
controlling and adapting to Climate Change.
CMCC is a national research centre, founded in 2005 by IMELS, the Italian Ministry of Education,
University and Research, and the Italian Ministry of Economy and Finance, represents the most ambitious
initiative undertaken in Italy, within the framework of the National Research Plan, and specifically the
National Research Plan on Climate. CMCC benefits from the extensive applied research experience of its
members and institutional partners: Istituto Nazionale di Geofisica e Vulcanologia (INGV); Università del
Salento; Centro Italiano di Ricerche Aerospaziali (CIRA S.c.p.a.); Università Ca’ Foscari Venezia;
Università di Sassari, Università della Tuscia, Politecnico di Milano.
CMCC research activities are distributed among eight research divisions that share different knowledge
and skills in the field of climate science: Advanced Scientific Computing (ASC) Division; Climate
Simulation and Prediction (CSP) Division; Economic analysis of Climate Impacts and Policy (ECIP)
Division; Impacts on Agriculture, Forests and Ecosystem Services (IAFES) Division; Ocean modeling and
Data Assimilation (ODA) Division; Ocean Predictions and Applications (OPA) Division; Risk Assessment
and Adaptation Strategies (RAAS) Division; Regional Models and geo-Hydrological Impacts (REHMI)
Division.
Among the activities carried out by CMCC, the main projects, programmes, and international multilateral
agreements directly financed by IMELS and coordinated by CMCC in the period 2013-2016 are:
GEMINA (2010-2015): the project aims to strengthen and further develop the research activities of
CMCC. The project has been cofounded by IMELS and MIUR, more specifically IMELS provided funding for

223
the consolidation and further development of the international scientific network of CMCC, being crucial to
ensure Italian research at the forefront within the international research community.
SNAC: as part of the strong cooperation with CMCC, the IMELS financed the project Elements for the
elaboration of the National Strategy of Adaptation to Climate Change (SNAC).
The specific SNAC objectives were:
• Identification of specific sectors for sectoral and inter-sectoral analysis
• Evaluation of the status of scientific knowledge on climate change impacts, availability of data and
information at different scales and sectors in the country
• Identification of sectoral vulnerabilities to those impacts and evaluation of related risks
• Support in identifying and analysing current adaptation measures carried out at different scales
(national, regional and local) and in various sectors
• Estimation of costs and benefits of possible adaptation measures/actions for various sectors for short
(2020-2030) and medium term (2040-2050).
• Support in identifying main national stakeholders and managing dialogue between institutions.
• Support in elaborating guidelines for sectoral adaptation action at different scales.
NAP: following the official adoption of the Strategy (decreto direttoriale 86/2015), in 2016 the IMELS
financed the Development of the National Adaptation Plan (NAP), currently available for public
consultation at http://www.minambiente.it/pagina/consultazione-su-piano-nazionale-adattamento-
cambiamenti-climatici.
Following the SNAC, the NAP offer robust, rigorous and updated national climate scenarios, with
territorial analysis and expected impacts and risks in each of the key sector already identified in the
National Adaptation Strategy. A focus on possible adaptive actions in response to these impact is at the
core of the document. Preferable actions for adaptation are selected according to specific criteria,
proposed in the international mainstream literature and will constitute a structured database.
Both documents have been developed under the coordination of CMCC, with the involvement of Italian
experts of several national universities, research institutions and national stakeholders.
The NAP will detail for each action the entitled authorities, the timeframe for implementation and the
indicators to monitor the progress and the effectiveness. Each action will be associated with a specific
sector and with the relevant climatic areas. The NAP will offer an informative nation-wide framework, but
the final selection of adaptive actions will require further strategical and political evaluation and also in-
depth analysis at local level, consistently with the local development goals. This process should be
conducted with the involvement of all local actors and stakeholders (authorities, businesses, civil
society).
The adaptation plan should be regarded as dynamic instrument that will go through a continuous and
timely update process.

224
IPCC Focal Point: since 2006, the Euro-Mediterranean Center on Climate Change hosts the IPCC Focal
Point for Italy. The National IPCC Focal Point participates in the plenary sessions and meetings of IPCC,
represents the IPCC in Italy, and carries out communication and education activities concerning IPCC
activities.
Land sector: CMCC is also providing scientific support to IMELS on matters related to land sector and
adaptation in international activities and negotiations.

225
7.3 Provision of financial resources
The tables below report information on financial support to developing countries provided through multilateral and bilateral channels in the period 2013-2016. For additional specific information, please refer to tables included in BR 2 (2013-2014) and BR3 (2015-2016).
Table 6. Provision of public financial support: summary information in 2013-16. a
Allocation channels
Domestic currency USD b
Climate-specific d, 2
Climate-specific d, 2
Core/general c,
1 Mitigation Adaptation
Cross-cutting e
Other f
Core/generalc,
1 Mitigation Adaptation Cross-cutting e Other f
2013
Total contributions through
multilateral channels 302.763.804,00 2.800.000,00 600.000,00 112.978.472,00 401.970.000,00 3.717.472,12 796.601,17 149.997.971,32
Multilateral climate change funds g 7.004.760,00 8.586.480,00 9.300.000,00 11.400.000,00
Other multilateral climate change funds h
Multilateral financial institutions,
including regional development
banks
295.759.044,00 93.441.992,00 392.670.000,00 124.060.000,00
Specialized United Nations bodies 2.800.000,00 600.000,00 10.950.000,00 3.717.472,12 796.601,17 14.537.971,32
Total contributions through bilateral, regional and other channels
6.870.000,00 13.400.000,00 26.080.000,00 9.120.000,00 17.790.000,00 34.630.000,00
Total 9.670.000,00 14.000.000,00 139.058.472,00 12.837.472,12 18.586.601,17 184.627.971,32
2014
Total contributions through
multilateral channels 312.820.000,00 200.000,00
134.570.000,00
415.050.000,00 265.357,57
178.554.980,76
Multilateral climate change funds g 24.120.000,00
13.640.000,00
32.000.000,00
18.100.000,00
Other multilateral climate change
funds h
Multilateral financial institutions,
including regional development
banks
288.700.000,00
88.070.000,00
383.050.000,00
116.870.000,00
Specialized United Nations bodies
200.000,00
32.850.000,00
265.357,57
43.584.980,76
Total contributions through bilateral,
regional and other channels 12.550.000,00 1.910.000,00 11.080.000,00
16.651.187,48 2.534.164,79 14.700.809,34
Total
12.750.000,00 1.910.000,00 145.640.000,00
16.916.545,04 2.534.164,79 193.255.790,10
2015

226
Total contributions through multilateral channels
323,287,917.06 32,944,533.30 19,807,968.41 165,108,750.86 358,611,111.54 36,544,130.14 21,972,233.41 183,148,919.42
Multilateral climate change funds g 6,588,000.00 11,259,157.00 2,000,000.00 67,076,385.18 7,307,820.30 12,489,358.85 2,218,524.68 74,405,308.03
Other multilateral climate change
funds h 11,259,157.00 1,704,385.18 12,489,358.85 1,890,610.30
Multilateral financial institutions,
including regional development banks
273,819,724.77 16,183,906.53 2,013,044.00 77,694,636.58 303,737,908.77 17,952,198.06 2,232,993.90 86,183,734.40
Specialized United Nations bodies 42,880,192.29 5,501,469.77 15,794,924.41 20,337,729.10 47,565,382.47 6,102,573.23 17,520,714.83 22,559,876.99
Total contributions through bilateral,
regional and other channels 30,048,884.50 25,631,040.34 122,154,489.84 33,332,095.99 28,431,547.77 135,501,375.41
Total 323,287,917.06 62,993,417.80 45,439,008.75 287,263,240.70 358,611,111.54 69,876,226.13 50,403,781.18 318,650,294.83
2016
Total contributions through
multilateral channels 461,851,541.55 15,565,927.89 17,612,347.36 106,449,529.62 510,728,233.48 17,213,234.43 19,476,221.78 117,714,839.77
Multilateral climate change funds g 14,848,000.00 4,700,000.00 1,793,078.72 25,011,657.40 16,419,329.87 5,197,390.25 1,982,836.14 27,658,583.88
Other multilateral climate change funds h
4,700,000.00 2,739,657.40 5,197,390.25 3,029,589.08
Multilateral financial institutions,
including regional development
banks
426,362,468.24 4,040,730.05 2,713,781.41 70,325,758.26 471,483,432.74 4,468,351.27 3,000,974.69 77,768,172.34
Specialized United Nations bodies 20,641,073.31 6,825,197.84 13,105,487.23 11,112,113.96 22,825,470.87 7,547,492.91 14,492,410.95 12,288,083.55
Total contributions through bilateral, regional and other channels
11,190,790.61 41,394,463.90 70,777,604.42 12,375,086.35 45,775,145.29 78,267,836.35
Total 461,851,541.55 26,756,718.50 59,006,811.26 177,227,134.04 510,728,233.48 29,588,320.78 65,251,367.07 195,982,676.12
Note: Explanation of numerical footnotes is provided in the documentation box after tables 7, 7(a) and 7(b).
Abbreviation: USD = United States dollars.
a Parties should fill in a separate table for each year, namely 2015 and 2016, where 2018 is the reporting year.
b Parties should provide an explanation of the methodology used for currency exchange for the information provided in tables 7, 7(a) and 7(b) in the documentation box.
c This refers to support to multilateral institutions that Parties cannot specify as being climate-specific.
d Parties should explain in their biennial reports how they define funds as being climate-specific.
e This refers to funding for activities that are cross-cutting across mitigation and adaptation.
f Please specify.
g Multilateral climate change funds listed in paragraph 17(a) of the “UNFCCC biennial reporting guidelines for developed country Parties” in decision 2/CP.17.
h Other multilateral climate change funds as referred to in paragraph 17(b) of the “UNFCCC biennial reporting guidelines for developed country Parties” in decision 2/CP.17.

227
Table 7: Provision of public financial support: contribution through multilateral channels in 2013-16 a
Donor funding
Total amount
Status Funding
source f,4
Financial
instrument f,5
Type of
support f,g,6
Sector c,f,7 Core/general d,1 Climate-specific e,2
Domestic
currency USD
Domestic
currency USD
2013
Total contributions through
multilateral channels 302.763.804,00 401.970.000,00 116.378.472,00 154.512.044,61
Multilateral climate change funds g
1. Global Environment Facility 7.004.760,00 9.300.000,00 8.586.480,00 11.400.000,00 Disbursed ODA Grant Cross-cutting Not applicable
2. Least Developed Countries Fund
3. Special Climate Change Fund
4. Adaptation Fund
5. Green Climate Fund
6. UNFCCC Trust Fund for
Supplementary Activities
7. Other multilateral climate change
funds
Multilateral financial institutions,
including regional development banks
1. World Bank
2. International Finance Corporation
3. African Development Fund 70.062.664,00 93.020.000,00 34.496.560,00 45.800.000,00 Disbursed ODA Grant Cross-cutting Not applicable
4. Asian Development Bank 29.977.360,00 39.800.000,00 10.017.560,00 13.300.000,00 Disbursed ODA Grant Cross-cutting Not applicable
5. European Bank for Reconstruction
and Development
6. Inter-American Development Bank
7. Other
International Development Association 195.719.020,00 259.850.000,00 48.927.872,00 64.960.000,00 Disbursed ODA Grant Cross-cutting Not applicable
Specialized United Nations bodies
1. United Nations Development Programme
UNDP 280.000,00 371.747,21 Disbursed ODA Grant Cross-cutting Agriculture
2. United Nations Environment Programme
UNEP 6.650.000,00 8.828.996,28 Disbursed ODA Grant Cross-cutting Not applicable

228
3. Other
UNDESA 2.000.000,00 2.655.337,23 Disbursed ODA Grant Mitigation
UNCCD 800.000,00 1.062.134,89 Disbursed ODA Grant Mitigation Not applicable
UNIDO 600.000,00 796.601,17 Disbursed ODA Grant Adaptation Not applicable
FAO 3.900.000,00 5.177.907,59 Disbursed ODA Grant Cross-cutting Not applicable
UNECE 120.000,00 159.320,23 Disbursed ODA Grant Cross-cutting Not applicable
2014
Total contributions through multilateral
channels 312.823.185,00 415.050.000,00 134.768.969,50 178.809.830,83
Multilateral climate change funds g
1. Global Environment Facility 24.118.400,00 32.000.000,00 13.265.120,00 17.600.000,00 Disbursed ODA Grant Cross-cutting Not applicable
2. Least Developed Countries Fund
3. Special Climate Change Fund
4. Adaptation Fund
5. Green Climate Fund
376.850,00 500.000,00 Disbursed ODA Grant Cross-cutting Not applicable
6. UNFCCC Trust Fund for Supplementary
Activities
7. Other multilateral climate change funds
Multilateral financial institutions, including
regional development banks
1. World Bank
2. International Finance Corporation
3. African Development Bank 39.388.362,00 52.260.000,00 19.400.238,00 25.740.000,00 Disbursed ODA Grant Cross-cutting Not applicable
4. Asian Development Bank 25.497.671,00 33.830.000,00 8.497.967,50 11.275.000,00 Disbursed ODA Grant Cross-cutting Not applicable
5. European Bank for Reconstruction and Development
6. Inter-American Development Bank
565.275,00 750.000,00 Disbursed ODA Grant Cross-cutting Not applicable
7. Other
International Bank for Reconstruction and
Development 3.655.445,00 4.850.000,00 Disbursed ODA Grant Cross-cutting Not applicable
International Development Association 223.818.752,00 296.960.000,00 55.954.688,00 74.240.000,00 Disbursed ODA Grant Cross-cutting Not applicable
Specialized United Nations bodies
1. United Nations Development Programme
UNDP
260.000,00 344.964,84 Disbursed ODA Grant Cross-cutting Not applicable
2. United Nations Environment Programme

229
UNEP
18.000.000,00 23.882.181,24 Disbursed ODA Grant Cross-cutting Not applicable
3. Other
International Fund for Agricultural Development
11.893.386,00 15.780.000,00 Disbursed ODA Grant Cross-cutting Not applicable
UNIDO
550.000,00 729.733,32 Disbursed ODA Grant Cross-cutting Not applicable
WFP
200.000,00 265.357,57 Disbursed ODA Grant Mitigation Energy
FAO
2.150.000,00 2.852.593,87 Disbursed ODA Grant Cross-cutting Not applicable
2015
Total contributions through multilateral channels 323,287,917.06 358,611,111.54 217,861,252.57 241,665,282.97
Multilateral climate change funds 6,588,000.00 7,307,820.30 80,335,542.18 89,113,191.56
1. Global Environment Facility 6,588,000.00 7,307,820.30 15,372,000.00 17,051,580.70 Disbursed ODA Grant Cross-
cutting Not applicable
2. Least Developed Countries Fund
3. Special Climate Change Fund
4. Adaptation Fund 2,000,000.00 2,218,524.68 Disbursed ODA Grant Adaptation Other (Biosphere Protection)
5. Green Climate Fund 50,000,000.00 55,463,117.03 Disbursed ODA Grant Cross-
cutting Not applicable
6. UNFCCC Trust Fund for Supplementary
Activities
7. Other multilateral climate change funds 12,963,542.18 14,379,969.15
African Climate Change Fund 4,700,000.00 5,213,533.00 Disbursed ODA Grant Mitigation Energy
UNFCCC Secretariat 1,205,264.18 1,336,954.17 Disbursed ODA Grant Cross-
cutting Not applicable
UNFCCC ITL 249,121.00 276,340.54 Disbursed ODA Grant Cross-
cutting Other (Biosphere Protection)
UNFCCC Executive Secretary 250,000.00 277,315.59 Disbursed ODA Grant Cross-
cutting Not applicable
Multilateral Fund for the Montreal Protocol 6,559,157.00 7,275,825.85 Disbursed ODA Grant Mitigation Other (Biosphere Protection)
Multilateral financial institutions, including
regional development banks 273,819,724.77 303,737,908.77 95,891,587.11 106,368,926.36
1. World Bank 187,048,465.05 207,485,818.13 44,720,318.96 49,606,565.68 Disbursed ODA Grant Cross-
cutting Not applicable
2. International Finance Corporation 7,511,031.83 8,331,704.75 Disbursed ODA Grant Mitigation Energy
3. African Development Bank 46,989,478.22 52,123,658.59 19,655,354.87 21,802,944.94 Disbursed ODA Grant Cross-
cutting Not applicable
4. Asian Development Bank 33,356,828.14 37,001,473.25 6,167,976.56 6,841,904.12 Disbursed ODA Grant Cross-
cutting Not applicable
5. European Bank for Reconstruction and

230
Development
6. Inter-American Development Bank 5,047,917.76 5,599,465.07 1,033,910.87 1,146,878.39 Disbursed ODA Grant Cross-
cutting Not applicable
7. Other 1,377,035.60 1,527,493.73 16,802,994.02 18,638,928.48
Caribbean Development Bank 1,323,300.80 1,467,887.74 846,044.77 938,485.60 Disbursed ODA Grant Cross-
cutting Not applicable
IRENA 468,697.02 519,907.95 Disbursed ODA Grant Mitigation Not applicable
International Energy Agency 6,000.00 6,655.57 60,413.00 67,013.87 Disbursed ODA Grant Mitigation Energy
International Energy Forum 44,734.80 49,622.63 29,823.20 33,081.75 Disbursed ODA Grant Cross-
cutting Energy
OECD - Growth Prospects of African Economies 3,000.00 3,327.79 2,000.00 2,218.52 Disbursed ODA Grant Cross-
cutting Cross-cutting
African Union Commission 80,000.00 88,740.99 Disbursed ODA Grant Mitigation Energy
Bioversity International 800,000.00 887,409.87 Disbursed ODA Grant Adaptation Agriculture
Caribbean Community Climate Change Centre 69,477.04 77,068.26 Disbursed ODA Grant Cross-
cutting Energy
CIHEAM Libya - Istituto Agronomico
Mediterraneo 213,044.00 236,321.69 Disbursed ODA Grant Adaptation Other (Fishing)
CIHEAM Myanmar - Istituto Agronomico Mediterraneo
136,000.00 150,859.68 Disbursed ODA Grant Mitigation Agriculture
CIHEAM Tunisia 400,000.00 443,704.94 Disbursed ODA Grant Cross-
cutting Agriculture
EBRD - CEI Fund 51,822.00 57,484.19 Disbursed ODA Grant Mitigation Energy
EBRD - CEI Fund Belarus 19,312.00 21,422.07 Disbursed ODA Grant Cross-cutting
Energy
EBRD - CEI Fund Serbia 2,952.00 3,274.54 Disbursed ODA Grant Cross-
cutting
Other (Education
unspecified)
EBRD - CEI Fund Serbia 2,314.40 2,567.28 Disbursed ODA Grant Mitigation Other (Banking and
Financial Services)
FAO Central African Rep. 500,000.00 554,631.17 Disbursed ODA Grant Adaptation Other (Developmental food
aid/Food security assistance)
FAO Lebanon 148,000.00 164,170.83 Disbursed ODA Grant Mitigation Agriculture
FAO Sudan 200,000.00 221,852.47 Disbursed ODA Grant Cross-
cutting Agriculture
FAO Sudan 240,000.00 266,222.96 Disbursed ODA Grant Mitigation Agriculture
FAO Syria 200,000.00 221,852.47 Disbursed ODA Grant Cross-
cutting
Other (Emergency
Response)
IBRD - WORLD BANK GLOBAL FACILITY FOR DISASTER REDUCTION AND
RECOVERY (GFDRR)
800,000.00 887,409.87 Disbursed ODA Grant Cross-
cutting
Other (Disaster prevention
and preparedness)

231
IBRD Myanmar 292,000.00 323,904.60 Disbursed ODA Grant Cross-
cutting Other (Rural Development)
IFC MENA Inclusive Green Growth 6,617,257.08 7,340,274.08 Disbursed ODA Grant Mitigation Forestry
IILA Istituto Italo latino Americano - Colombia 40,000.00 44,370.49 Disbursed ODA Grant Mitigation
Other (Conflict prevention
and resolution, peace and security)
IILA Istituto Italo latino Americano - Ecuador 100,000.00 110,926.23 Disbursed ODA Grant Adaptation Other (Health General)
IMF Somalia 360,000.00 399,334.44 Disbursed ODA Grant Cross-cutting
Other (Government and Civil Society, general)
International Institute for Sustainable Development 20,000.00 22,185.25 Disbursed ODA Grant Mitigation
Other (Environmental Policy
and Administrative
Management)
UNDP Albania 106,000.00 117,581.81 Disbursed ODA Grant Cross-cutting
Other (Government and Civil Society, general)
UNDP Egypt 960,000.00 1,064,891.85 Disbursed ODA Grant Cross-
cutting
Other (Environmental Policy and Administrative
Management)
UNDP Gaza 400,000.00 443,704.94 Disbursed ODA Grant Cross-
cutting
Other (Other infrastructure
and services)
UNDP LAC 379,371.20 420,822.19 Disbursed ODA Grant Mitigation Other (Tourism)
UNDP Tunisia 414,733.91 460,048.71 Disbursed ODA Grant Cross-
cutting
Other (Government and
Civil Society, general)
UNECE Western Balkans 48,000.00 53,244.59 Disbursed ODA Grant Cross-
cutting Water and sanitation
UNEP Serbia 229,000.00 254,021.08 Disbursed ODA Grant Mitigation Other (Biosphere Protection)
UNESCO Iraq 120,000.00 133,111.48 Disbursed ODA Grant Cross-
cutting Other (Site preservation)
UNESCO Jordan 200,000.00 221,852.47 Disbursed ODA Grant Mitigation Other (Environmental
education/training)
UNICEF Ethiopia 180,000.00 199,667.22 Disbursed ODA Grant Cross-cutting
Other (Emergency Response)
UNIDO Myanmar 320,000.00 354,963.95 Disbursed ODA Grant Cross-
cutting Industry
UNOPS Myanmar 54,884.80 60,881.64 Disbursed ODA Grant Cross-
cutting
Other (Government and
Civil Society, general)
UNRWA West Bank and Gaza 400,000.00 443,704.94 Disbursed ODA Grant Adaptation Other (Emergency
Response)
WFP El Salvador 291,847.60 323,735.55 Disbursed ODA Grant Cross-cutting
Agriculture
Specialized United Nations bodies 42,880,192.29 47,565,382.47 41,634,123.28 46,183,165.05
1. United Nations Development Programme 3,906,000.00 4,332,778.70 294,000.00 326,123.13

232
UNDP Voluntary Contribution 3,906,000.00 4,332,778.70 294,000.00 326,123.13 Disbursed ODA Grant Cross-
cutting Not applicable
2. United Nations Environment Programme 3,300,000.00 3,660,565.72
UNEP Voluntary Contribution 2,400,000.00 2,662,229.62 Disbursed ODA Grant Adaptation
Other (Environmental Policy
and Administrative Management)
UNEP CCAC 450,000.00 499,168.05 Disbursed ODA Grant Mitigation Cross-cutting
Climate and Clean Air Coalition Trust Fund 450,000.00 499,168.05 Disbursed ODA Grant Cross-cutting
Not applicable
3. Other 38,974,192.29 43,232,603.77 38,040,123.28 42,196,476.20
FAO 14,302,919.99 15,865,690.51 7,945,803.60 8,813,980.70 Disbursed ODA Grant Adaptation Not applicable
FAO Emergency Projects 200,000.00 221,852.47 Disbursed ODA Grant Adaptation Other (Emergency
Response)
FAO International Alliance on Climate Smart Agriculture
400,490.01 444,248.49 Disbursed ODA Grant Adaptation
Other (Environmental Policy
and Administrative
Management)
World Food Programme 6,324,168.00 7,015,161.40 4,216,112.00 4,676,774.27 Disbursed ODA Grant Adaptation Not applicable
IFAD 8,116,416.30 9,003,234.94 18,938,304.70 21,007,548.20 Disbursed ODA Grant Cross-
cutting Not applicable
UNECE Water Convention 100,000.00 110,926.23 Disbursed ODA Grant Adaptation Water and sanitation
UNCCD 118,318.00 131,245.70 Disbursed ODA Grant Cross-
cutting Not applicable
UNIDO 5,807,996.00 6,442,591.24 Disbursed ODA Grant
Not applicable
United Nations World Tourism Organization 137,106.40 152,086.97 Disbursed ODA Grant Cross-
cutting Other (Tourism)
UNOPS 5,051,469.77 5,603,405.18 Disbursed ODA Grant Mitigation
Other (Environmental Policy
and Administrative Management)
CERF 600,000.00 665,557.40 400,000.00 443,704.94 Disbursed ODA Grant Cross-
cutting Not applicable
IAEA TCF 2,622,692.00 2,909,253.47 Disbursed ODA Grant
Not applicable
UNESCO WWAP 532,518.80 590,703.05 Disbursed ODA Grant Adaptation Water and Sanitation
UNFPA 1,200,000.00 1,331,114.81 Disbursed ODA Grant Cross-cutting
Not applicable
2016
Total contributions through multilateral channels 461,851,541.55 510,728,233.48 139,627,804.87 154,404,295.98
Multilateral climate change funds 14,848,000.00 16,419,329.87 31,504,736.12 34,838,810.27
1. Global Environment Facility 14,848,000.00 16,419,329.87 22,272,000.00 24,628,994.80 Disbursed ODA Grant Cross-cutting
Not applicable

233
2. Least Developed Countries Fund 1,793,078.72 1,982,836.14 Disbursed ODA Grant Adaptation
Other (Environmental policy
and administrative management)
3. Special Climate Change Fund
4. Adaptation Fund
5. Green Climate Fund
6. UNFCCC Trust Fund for Supplementary
Activities
7. Other multilateral climate change funds 7,439,657.40 8,226,979.33
African Climate Change Fund 4,700,000.00 5,197,390.25 Disbursed ODA Grant Mitigation Energy
IPCC 250,000.00 276,456.93 Disbursed ODA Grant Cross-
cutting Not applicable
UNFCCC Contributions 2,489,657.40 2,753,132.15 Disbursed ODA Grant Cross-cutting
Not applicable
Multilateral financial institutions, including regional development banks
426,362,468.24 471,483,432.74 77,080,269.72 85,237,498.30
1. World Bank 170,988,563.40 189,083,891.85 35,043,296.60 38,751,848.50 Disbursed ODA Grant Cross-
cutting Not applicable
2. International Finance Corporation
3. African Development Bank 44,896,982.16 49,648,327.06 11,699,121.84 12,937,213.14 Disbursed ODA Grant Cross-
cutting Not applicable
4. Asian Development Bank 19,725,474.28 21,812,976.09 3,211,123.72 3,550,949.60 Disbursed ODA Grant Cross-
cutting Not applicable
5. European Bank for Reconstruction and
Development 4,299,900.00 4,754,948.58 2,215,100.00 2,449,518.96 Disbursed ODA Grant
Cross-
cutting Not applicable
6. Inter-American Development Bank 4,887,330.50 5,404,545.50 1,001,019.50 1,106,955.10 Disbursed ODA Grant Cross-
cutting Not applicable
7. Other 181,564,217.90 200,778,743.66 23,910,608.06 26,441,013.00
Caribbean Development Fund - Special
Development Fund 1,525,000.00 1,686,387.26 975,000.00 1,078,182.02 Disbursed ODA Grant
Cross-
cutting Not applicable
Caribbean Development Bank 1,128,609.80 1,248,047.99 721,570.20 797,932.32 Disbursed ODA Grant Cross-cutting
Not applicable
AIIB 158,416,531.00 175,181,390.03 Disbursed ODA Grant Cross-cutting
Not applicable
IRENA 1,230,260.58 1,360,456.24 Disbursed ODA Grant Mitigation Not applicable
UNIDO ITPO (Investment and Technology Promotion Office) - Iran
59,850.00 66,183.79 Disbursed ODA Grant Cross-cutting
Industry
Bioversity International 2,500,000.00 2,764,569.28 Disbursed ODA Grant Cross-
cutting Agriculture
UNFCCC - SIDS 250,000.00 276,456.93 Disbursed ODA Grant Mitigation Other (Environmental policy

234
and administrative
management)
REC - Building Bridges - Caribbean 40,000.00 44,233.11 Disbursed ODA Grant Cross-
cutting
Other (Environmental policy and administrative
management)
International Institute for Sustainable Development 200,000.00 221,165.54 Disbursed ODA Grant Cross-cutting
Other (Environmental policy
and administrative
management)
REC - CEE 100,585.00 111,229.68 Disbursed ODA Grant Cross-
cutting
Other (Environmental policy and administrative
management)
EBRD Montenegro Water Sector Reform 42,000.00 46,444.76 28,000.00 30,963.18 Disbursed ODA Grant Cross-
cutting Water and Sanitation
EBRD Former Yugoslav Republic of Macedonia /
Europe / public solar lamps donation 38,786.00 42,890.63 Disbursed ODA Grant Mitigation
Other (Government and civil
society general)
EBRD CEI Fund 25,590.00 28,298.13 17,060.00 18,865.42 Disbursed ODA Grant Mitigation Agriculture
EBRD Serbia 44,400.00 49,098.75 29,600.00 32,732.50 Disbursed ODA Grant Cross-
cutting Industry
EBRD Serbia 14,897.40 16,473.96 9,931.60 10,982.64 Disbursed ODA Grant Adaptation Other (Disaster prevention
and preparedness)
EBRD Serbia 18,444.60 20,396.55 12,296.40 13,597.70 Disbursed ODA Grant Cross-cutting
Other (Disaster prevention and preparedness)
EBRD Europe 9,078.00 10,038.70 6,052.00 6,692.47 Disbursed ODA Grant Cross-
cutting
Other (Disaster prevention
and preparedness)
IOM - International Organisation for Migration 465,312.50 514,555.46 Disbursed ODA Grant Adaptation Other (Population policies)
OSA Organization States of America 33,026.00 36,521.07 Disbursed ODA Grant Cross-
cutting Water and Sanitation
IILA Istituto Italo latino Americano 200,000.00 221,165.54 Disbursed ODA Grant Adaptation Other (Government and civil
society general)
IEA International Energy Agency - IGAD-
Intergovernamental Authority on Development 300,000.00 331,748.31 200,000.00 221,165.54 Disbursed ODA Grant
Cross-
cutting
Other (Government and civil
society general)
IEA International Energy Agency - Climate
Change Carribean Community Center 268,499.80 296,914.52 Disbursed ODA Grant
Cross-
cutting Energy
IEA International Energy Agency - UN Global
Compact Trust Fund 36,000.00 39,809.80 24,000.00 26,539.87 Disbursed ODA Grant
Cross-
cutting Cross-cutting
CIHEAM - Ethiopia 599,949.00 663,440.23 399,966.00 442,293.49 Disbursed ODA Grant Mitigation Agriculture
CIHEAM - Libya 660,000.00 729,846.29 440,000.00 486,564.19 Disbursed ODA Grant Mitigation Other (Fishing)
CEM - Clean Energy Ministerial Secretariat - CEAP
30,000.00 33,174.83 20,000.00 22,116.55 Disbursed ODA Grant Mitigation Energy
UNDP - Somalia 1,200,000.00 1,326,993.25 800,000.00 884,662.17 Disbursed ODA Grant Cross-cutting
Other (Education Unspecified)

235
UNDP - Albania 120,000.00 132,699.33 80,000.00 88,466.22 Disbursed ODA Grant Cross-
cutting
Other (Education post-
secondary)
UNDP - Somalia 600,000.00 663,496.63 400,000.00 442,331.08 Disbursed ODA Grant Cross-cutting
Energy
UNDP - Lebanon 50,100.00 55,401.97 33,400.00 36,934.65 Disbursed ODA Grant Cross-cutting
Industry
UNDP - Morocco 1,000,000.00 1,105,827.71 Disbursed ODA Grant Cross-cutting
Other (Environmental policy
and administrative
management)
UNEP United Nations Environment Programme -
DTIE Egypt 390,431.88 431,750.39 260,287.92 287,833.60 Disbursed ODA Grant Mitigation Energy
UNEP United Nations Environment Programme -
Serbia 66,600.00 73,648.13 44,400.00 49,098.75 Disbursed ODA Grant Adaptation Other (Biosphere protection)
UNEP United Nations Environment Programme -
Biodiversity for sustainable development in the
Caribbean
113,948.41 126,007.31 75,965.60 84,004.87 Disbursed ODA Grant Mitigation Other (Bio-diversity)
UNEP - Inquiry into the Design of a Sustainable
Financial System 762,606.05 843,310.90 508,403.95 562,207.18 Disbursed ODA Grant Mitigation
Other (Banking and
financial services)
UNICEF - Lebanon 1,440,000.00 1,592,391.91 960,000.00 1,061,594.60 Disbursed ODA Grant Cross-cutting
Other (Education Basic)
WMO - Climate Change Adaptation and Disaster Risk Reduction in Agriculture, South Sahara
493,705.96 545,953.73 329,137.31 363,969.16 Disbursed ODA Grant Adaptation Other (Education post-
secondary)
FAO - Mediterranean Region 180,000.00 199,048.99 120,000.00 132,699.33 Disbursed ODA Grant Cross-
cutting Other (Health Basic)
FAO - South Sahara 1,300,000.00 1,437,576.03 Disbursed ODA Grant Cross-
cutting Agriculture
FAO - Bolivia 483,606.00 534,784.92 322,404.00 356,523.28 Disbursed ODA Grant Cross-
cutting
Other (Developmental food
aid/Food security assistance)
FAO Bilateral Emergency Fund 1,200,000.00 1,326,993.25 800,000.00 884,662.17 Disbursed ODA Grant Adaptation Other (Emergency
Response)
UNECE - United Nations Economic Commission for Europe - Western Balkans
165,000.00 182,461.57 Disbursed ODA Grant Adaptation Water and Sanitation
UNHCR - U.N. Office of the United Nations High Commissioner for Refugees - Iraq
264,901.80 292,935.75 176,601.20 195,290.50 Disbursed ODA Grant Cross-cutting
Other (Recontruction relief and rehabilitation)
UNICEF - Ethiopia 1,200,000.00 1,326,993.25 800,000.00 884,662.17 Disbursed ODA Grant Mitigation Other (Emergency
Response)
UNHCR - U.N. Office of the United Nations High
Commissioner for Refugees 1,800,000.00 1,990,489.88 1,200,000.00 1,326,993.25 Disbursed ODA Grant
Cross-
cutting
Other (Emergency
Response)
UNICEF Bilateral Emergency Fund 1,800,000.00 1,990,489.88 1,200,000.00 1,326,993.25 Disbursed ODA Grant Cross-
cutting
Other (Emergency
Response)
UNOPS - Afghanistan 700,000.00 774,079.40 Disbursed ODA Grant Adaptation Transport

236
UNIDO - Ethiopia 590,538.00 653,033.29 393,692.00 435,355.52 Disbursed ODA Grant Cross-
cutting Agriculture
UNIDO - China and Cuba 35,280.00 39,013.60 23,520.00 26,009.07 Disbursed ODA Grant Cross-cutting
Industry
UNIDO - Ethiopia 870,000.00 962,070.11 580,000.00 641,380.07 Disbursed ODA Grant Cross-cutting
Industry
UNESCO - Myanmar 252,000.00 278,668.58 168,000.00 185,779.06 Disbursed ODA Grant Cross-
cutting Other (Site preservation)
United Nations Office of Co-ordination of
Humanitarian Affairs - Bilateral Emergency Fund 600,000.00 663,496.63 400,000.00 442,331.08 Disbursed ODA Grant
Cross-
cutting
Other (Emergency
Response)
WFP - Syria 600,000.00 663,496.63 400,000.00 442,331.08 Disbursed ODA Grant Cross-
cutting
Other (Developmental food
aid/Food security assistance)
WFP Somalia 600,000.00 663,496.63 400,000.00 442,331.08 Disbursed ODA Grant Cross-cutting
Other (Emergency Response)
WFP - Syria 1,200,000.00 1,326,993.25 800,000.00 884,662.17 Disbursed ODA Grant Cross-cutting
Other (Emergency Response)
WFP Bilateral Emergency Fund 1,800,000.00 1,990,489.88 1,200,000.00 1,326,993.25 Disbursed ODA Grant Cross-
cutting
Other (Emergency
Response)
Specialized United Nations bodies 20,641,073.31 22,825,470.87 31,042,799.03 34,327,987.41
1. United Nations Development Programme 4,650,000.00 5,142,098.86 350,000.00 387,039.70
UNDP 4,650,000.00 5,142,098.86 350,000.00 387,039.70 Disbursed ODA Grant Cross-cutting
Not applicable
2. United Nations Environment Programme 7,176,197.84 7,935,638.44
UNEP - CACC (Climate & Clean Air Coalition)
Trust Fund 61,000.00 67,455.49 Disbursed ODA Grant
Cross-
cutting
Other (Environmental policy and administrative
management)
UNEP - GEO 6 210,000.00 232,223.82 Disbursed ODA Grant Cross-
cutting
Other (Environmental policy
and administrative management)
UNEP - IRP 80,000.00 88,466.22 Disbursed ODA Grant Cross-
cutting
Other (Environmental policy and administrative
management)
UNEP- Global District Energy in Cities initiative
(DES) 102,311.84 113,139.27 Disbursed ODA Grant Mitigation Energy
UNEP Multilateral Fund for the Implementation of
the Montreal Protocol 6,722,886.00 7,434,353.64 Disbursed ODA Grant Mitigation Other (Biosphere Protection)
3. Other 15,991,073.31 17,683,372.01 23,516,601.19 26,005,309.27
UN PEACE OPERATION 470,411.14 520,193.67 Disbursed ODA Grant Cross-
cutting
Other (Environmental policy and administrative
management)
UNCCD 1,332,160.00 1,473,139.44 Disbursed ODA Grant Adaptation Other (Environmental policy

237
and administrative
management)
UNESCO - WWAP 991,800.00 1,096,759.92 Disbursed ODA Grant Adaptation Water and Sanitation
FAO 9,888,052.74 10,934,482.74 5,000,000.00 5,529,138.56 Disbursed ODA Grant Cross-
cutting Agriculture
FAO - International Alliance on Climate Smart
Agriculture 639,967.22 707,693.49 Disbursed ODA Grant Adaptation
Other (Environmental policy and administrative
management)
IFAD - International Fund for Agricultural
Development 2,117,444.06 2,341,528.32 4,940,702.82 5,463,566.09 Disbursed ODA Grant
Cross-
cutting Agriculture
CIHEAM - International Centre for Advanced
Mediterranean Agronomic Studies (UNFAO) 7,664,509.00 8,475,626.45 Disbursed ODA Grant Adaptation Agriculture
UNDESA - High Level Political Forum 270,000.00 298,573.48 Disbursed ODA Grant Cross-cutting
Not applicable
World Food Programme 3,715,576.51 4,108,787.47 2,477,051.01 2,739,191.65 Disbursed ODA Grant Adaptation Not applicable
Note: Explanation of numerical footnotes is provided in the documentation box after tables 7, 7(a) and 7(b).
Abbreviations: ODA = official development assistance, OOF = other official flows, USD = United States dollars.
a Parties should fill in a separate table for each year, namely 2015 and 2016, where 2018 is the reporting year.
b Parties should explain, in their biennial reports, the methodologies used to specify the funds as disbursed and committed. Parties will provide the information for as many
status categories as appropriate in the following order of priority: disbursed and committed.
c Parties may select several applicable sectors. Parties may report sectoral distribution, as applicable, under “Other”.
d This refers to support to multilateral institutions that Parties cannot specify as being climate-specific.
e Parties should explain in their biennial reports how they define funds as being climate-specific.
f Please specify.
g This refers to funding for activities that are cross-cutting across mitigation and adaptation.

238
Table 8 - Provision of public financial support: contribution through bilateral, regional and other channels in 2013-16
2013 Mitigation
Agriculture Environment Industry Water and sanitation Other
Domestic currency USD Domestic currency USD Domestic currency USD Domestic currency USD Domestic currency USD
Afghanistan
Africa 60.000 79.660
490.000 650.558
Angola
160.000 212.427
Brazil
50.000 66.383
China
20.000 26.553
Ethiopia 2.420.000 3.212.958
20.000 26.553
Guinea
10.000 13.277
Kenya
150.000 199.150
Mexico
100.000 132.767
Middle East
400.000 531.067
Mozambique
20.000 26.553
Pakistan
80.000 106.213
People's Republic of Korea
100.000 132.767
Philippines
30.000 39.830
South Africa
130.000 172.597
Sudan
10.000 13.277
Tunisia 530.000 703.664
2013 Adaptation
Agriculture Energy Environment Water and sanitation Other
Domestic currency USD Domestic currency USD Domestic currency USD Domestic currency USD Domestic currency USD
Afghanistan 730.000 969.198
Africa
20.000 26.553
Albania 2.000.000 2.655.337
180.000 238.980
Argentina
10.000 13.277
Cameroon 20.000 26.553
730.000 969.198
China
Cuba 1.770.000 2.349.973
Ecuador
60.000 79.660
El Salvador
540.000 716.941

239
Ethiopia 20.000 26.553
80.000 106.213
Ghana
710.000 942.645
Haiti
10.000 13.277
Lebanon
20.000 26.553
Mauritania 10.000 13.277
Middle East 770.000 1.022.305
Mozambique
1.390.000 1.845.459
Other (South Sudan)
1.240.000 1.646.309
Senegal
10.000 13.277
630.000 836.431
SIDS
380.000 504.514
Turkmenistan
50.000 66.383
Viet Nam
60.000 79.660
Zimbabwe
10.000 13.277
2013 Cross-cutting
Agriculture Energy Environment Forestry Water and sanitation Other
Domestic currency
USD Domestic currency
USD Domestic currency
USD Domestic currency
USD Domestic currency
USD Domestic currency
USD
Africa
40.000 53.107
30.000 39.830
Albania 1.200.000 1.593.202
Argentina
80.000 106.213 20.000 26.553
Benin
10.000 13.277
Bolivia
310.000 411.577 10.000 13.277
Brazil
3.020.000 4.009.559 20.000 26.553
Burundi 10.000 13.277
30.000 39.830
China
8.350.000 11.086.033 2.080.000 2.761.551
Democratic Republic of the Congo
40.000 53.107
Eastern Europe
2.880.000 3.823.686 180.000 238.980
Ecuador
60.000 79.660
Haiti
10.000 13.277
Iraq
2.070.000 2.748.274
Kenya 20.000 26.553
Mauritania 590.000 783.324
Mediterranean Area
360.000 477.961
Middle East 320.000 424.854
Montenegro
2.850.000 3.783.856
Mozambique
160.000 212.427
Nicaragua
40.000 53.107
Niger
20.000 26.553
Peru
10.000 13.277
Senegal 200.000 265.534
30.000 39.830
SIDS
900.000 1.194.902

240
Tanzania 30.000 39.830
Timor-Leste 20.000 26.553
Viet Nam
20.000 26.553
2014 Mitigation
Agriculture Energy Forestry Water and sanitation Other
Domestic currency USD Domestic currency USD Domestic currency USD Domestic currency USD Domestic currency USD
Albania 60.000 79.607
Benin
20.000 26.536
Bolivia
430.000 570.519
390.000 517.447
Bosnia and Herzegovina
1.200.000 1.592.145
Brazil 10.000 13.268
Guinea Bissau 130.000 172.482 200.000 265.358
Kenya
120.000 159.215
Lebanon
840.000 1.114.502
30.000 39.804
Mozambique
40.000 53.072
Niger 8.000.000 10.614.303
Peru
20.000 26.536 170.000 225.554
Senegal 10.000 13.268
20.000 26.536
South Africa
10.000 13.268
Sri Lanka 130.000 172.482
Tanzania
40.000 53.072
Togo
20.000 26.536
Uganda
40.000 53.072
Viet Nam 60.000 79.607
560.000 743.001
2014 Adaptation
Agriculture Energy Forestry Water and sanitation Other
Domestic currency USD Domestic currency USD Domestic currency USD Domestic currency USD Domestic currency USD
Afghanistan
10.000 13.268
Africa
200.000 265.358
Bolivia 10.000 13.268
Burkina Faso 190.000 252.090
Cameroon
50.000 66.339 Ethiopia
40.000 53.072 10.000 13.268
Guinea Bissau
20.000 26.536
Lebanon
180.000 238.822
Malawi
20.000 26.536
Middle East 10.000 13.268
Morocco 10.000 13.268 Mozambique 10.000 13.268
220.000 291.893 Myanmar
80.000 106.143

241
Nicaragua
20.000 26.536 Niger
10.000 13.268
Other (South Sudan)
400.000 530.715
SIDS
390.000 517.447
Sri Lanka 10.000 13.268
Tanzania
20.000 26.536
2014 Cross-cutting
Agriculture Energy Environment Forestry Industry Water and sanitation Other
Domestic
currency USD
Domestic
currency USD
Domestic
currency USD
Domestic
currency USD
Domestic
currency USD
Domestic
currency USD
Domestic
currency USD
Africa
450.000 597.055
Algeria
10.000 13.268
Angola
250.000 331.697
Bolivia 60.000 79.607
470.000 623.590
Brazil
650.000 862.412
Burkina Faso 60.000 79.607
China
670.000 888.948
160.000 212.286
Congo
30.000 39.804
Democratic Republic of the Congo
40.000 53.072
Eastern Europe
740.000 981.823
Ecuador 10.000 13.268
Egypt 400.000 530.715
Eritrea
30.000 39.804
Ethiopia 330.000 437.840
50.000 66.339
Guinea Bissau
Honduras 60.000 79.607
140.000 185.750
Kenya
430.000 570.519
Maldives
30.000 39.804
Mali
10.000 13.268
60.000 79.607
Mexico
10.000 13.268
Middle East 30.000 39.804
1.120.000 1.486.002
Montenegro
2.040.000 2.706.647
Morocco
30.000 39.804
30.000 39.804
Mozambique
10.000 13.268
Myanmar
190.000 252.090
Nepal 10.000 13.268
Nicaragua
40.000 53.072
Pakistan
40.000 53.072
Senegal 630.000 835.876 90.000 119.411
150.000 199.018
Serbia
320.000 424.572
Seychelles 10.000 13.268
10.000 13.268

242
SIDS
50.000 66.339
Tanzania 70.000 92.875
40.000 53.072
Tunisia
790.000 1.048.162
210.000 278.625
Zimbabwe
20.000 26.536
2015 Mitigation
Agriculture Energy Environment Forestry Industry Water and Sanitation Other
Domestic
Currency USD
Domestic
Currency USD
Domestic
Currency USD
Domestic
Currency USD
Domestic
Currency USD
Domestic
Currency USD
Domestic
Currency USD
Afghanistan
51.000 56.572
Africa
1.400 1.553
Africa
15.093.579 16.742.739
Albania 241 267
118 131
Algeria
20.000 22.185
Argentina 60.149 66.721
36.433 40.414
Asia Pacific
600.000 665.557
Belarus
Benin 5.554 6.160
53.513 59.360
38.000 42.152 12.060 13.378
Bolivia 17.808 19.753
806 894
355.711 394.577
Bosnia and Herzegovina 89 98
Brazil 147.863 164.019
45.000 49.917
34.217 37.955
Burkina Faso 188.399 208.984
9.474 10.510
27.920 30.971 3.418 3.792
Burundi
1.160 1.287
Cameroon 20.004 22.189 30.000 33.278
Chad 24.767 27.473
3.296 3.656
17.433 19.338
China
7.880 8.741
Colombia 10.020 11.115
8.000 8.874 5.730 6.356
Congo
20.000 22.185
Côte d'Ivoire
12.000 13.311
Cuba 154.695 171.597
Democratic People's
Republic of Korea 135.572 150.385
Democratic Republic of
the Congo 34.340 38.093
236.328 262.149
Ecuador 258.362 286.591
21.165 23.478
Egypt
30.000 33.278
El Salvador
424.000 470.327
10.000 11.093
Ethiopia 363.262 402.952
40.000 44.370 68.000 75.430 194.711 215.986 121.497 134.772
Ghana
3.754 4.164 20.000 22.185
2.640 2.928
Guatemala 1.600 1.775
1.500 1.664
Guinea 130.955 145.263
Guinea-Bissau 112.858 125.189
Haiti 8.050 8.930
4.511 5.004

243
Honduras 4.831 5.359
India 78.593 87.180
8.924 9.899
374.932 415.898
Indonesia
22.000 24.404
Kenya 548.019 607.897 755 837 76.750 85.136
218.815 242.723
Latin America and the
Caribbean 4.000 4.437
Lebanon
897.732 995.820 1.562.109 1.732.788
20.000 22.185
Lesotho
Madagascar
5.196 5.764
10.000 11.093 32.931 36.529
Mauritania 527.841 585.514
Mexico 16.174 17.941
8.000 8.874 4.000 4.437
Middle East and North
Africa 505.210 560.410
Morocco
9.320 10.338
Mozambique 542.407 601.672
641.461 711.549
105.281 116.784 280.051 310.650
Myanmar 377.432 418.671
248.924 276.122
42.226 46.840
Nepal 4.608 5.111
136.553 151.474
Nicaragua 4.867 5.399
Niger 179.312 198.904
11.835 13.128
Nigeria
5.540 6.146
Other (North and
Central America) 48.000 53.245
83.200 92.291
160.000 177.482
Other (South Sahara)
34.221 37.960
Other (West Bank and
Gaza) 737.292 817.850 11.964 13.271
264.506 293.406 2.000 2.219
Pakistan
11.440 12.690
46.309 51.369
Peru 26.075 28.924 20.000 22.185
8.721 9.674
9.803 10.874
Philippines 67.371 74.732
13.938 15.461
Republic of Moldova
9.600 10.649
Senegal 43.446 48.193 41.755 46.317 3.526 3.911
184.661 204.837 127.239 141.142
Serbia 5.761 6.391
Sierra 8.043 8.922
Somalia 174.815 193.916
56.192 62.331
Sri Lanka 146.229 162.206
Sudan
262.156 290.799
Tanzania 4.000 4.437 1.000 1.109
40.600 45.036 54.000 59.900
Togo
7.000 7.765
Tunisia 6.565 7.282
7.400 8.209
16.000 17.748 4.000 4.437
Uganda 28.822 31.971 4.200 4.659
11.722 13.003
Uruguay
13.320 14.775
1.360 1.509
Vietnam 62.342 69.154
187.840 208.364
Zambia
5.091 5.647 16.830 18.669
Developing countries 2.016 2.236 87.277 96.813
21.770 24.149

244
2015 Adaptation
Agriculture Environment Industry Transport Water and Sanitation Other
Domestic Currency USD Domestic Currency USD Domestic Currency USD Domestic Currency USD Domestic Currency USD Domestic Currency USD
Afghanistan 196.216 217.655
435.796 483.412
Africa 4.000.000 4.437.049
Algeria
123.000 136.439 90.000 99.834
Angola 20.667 22.925
Argentina
6.600 7.321
13.320 14.775
Bangladesh
260.207 288.638
Benin 62.419 69.239
64.965 72.063 Bolivia 20.000 22.185
15.000 16.639
6.340 7.033
Bosnia and Herzegovina
9.392 10.418 10.000 11.093 5.806 6.440
Brazil
10.000 11.093
Burkina Faso 318.717 353.541
2.334.903 2.590.019 20.527 22.769
Burundi 20.000 22.185
Cameroon 170.651 189.297
76.680 85.058 279.525 310.067
Cape Verde 46.936 52.064 Chad 103.916 115.270
9.238 10.248 2.000 2.219
China
1.500 1.664
Colombia
6.300 6.988
Côte d'Ivoire
8.000 8.874 6.708 7.441
Cuba
1.000 1.109
Democratic Republic of the Congo 83.408 92.521
97.840 108.530 113.779 126.211
Ecuador
13.600 15.086
6.386 7.084
Egypt 36.000 39.933
El Salvador
22.304 24.741
Eritrea 19.824 21.990
90 100
Ethiopia 51.260 56.861
10.098 11.201
83.968 93.143 1.309.553 1.452.638
Ghana
39.800 44.149
Guatemala
30.832 34.201 146.020 161.974
Guinea-Bissau 11.569 12.833
Haiti 64.964 72.062
4.672 5.182
Honduras
143.904 159.627
India 62.639 69.483
33.297 36.935 173.963 192.971
Indonesia
5.820 6.456 Iran (Islamic Republic of)
13.200 14.642
Iraq
389.124 431.641
84.160 93.356
Jordan
154 170
Kenya
146.290 162.273 400.730 444.515
Lebanon
90.234 100.093 10.430 11.570
Lesotho
5.000.000 5.546.312 Madagascar
18.750 20.799 9.356 10.379
Mali 16.166 17.932
20.016 22.203 1.695.000 1.880.200
Montenegro 34.000 37.715

245
Morocco 7.696 8.537 Mozambique 53.801 59.680
190.251 211.038 566.389 628.274
Myanmar
14.080 15.618 18.695 20.737
Nepal
7.441 8.254 41.694 46.250
Nicaragua
10.579 11.735
Niger 69.670 77.282 52.821 58.592
6.429 7.131
Nigeria
44.551 49.419 Other (Kosovo)
1.498 1.661
Other (South Sahara)
70.123 77.785
Other (South Sudan) 3.855 4.276
70.470 78.170
Other (West Bank and Gaza) 400 444
30.000 33.278
Palau
224.572 249.109
Paraguay 17.254 19.139
67.912 75.332
Peru 3.226 3.578
4.520 5.014 16.387 18.177
Philippines
1.200 1.331
Republic of Moldova
35.400 39.268
Rwanda
9.344 10.365
Sao Tome and Principe 88.884 98.596
Senegal 221.854 246.094
38.267 42.448 1.235.805 1.370.832
Sierra 7.600 8.430 Somalia
106.518 118.156 38.747 42.981
Sudan
515.000 571.270
Tanzania 5.200 5.768
66.926 74.238
Thailand
69.844 77.475
Togo 80.615 89.423
6.600 7.321 Tunisia 1.102.645 1.223.123
2.500 2.773
Turkmenistan
20.000 22.185 Uganda 80.457 89.248
Vanuatu
1.000.000 1.109.262
Vietnam
5.123 5.682
16.606 18.420
Developing countries
25.000 27.732
7.064 7.836
2015 Cross-cutting
Agriculture Energy Environment Forestry Industry Other Water and Sanitation
Domestic
Currency USD
Domestic
Currency USD
Domestic
Currency USD
Domestic
Currency USD
Domestic
Currency USD
Domestic
Currency USD
Domestic
Currency USD
Afghanistan
2.000.000 2.218.525
Africa 111.376
123.54
6 1.084.513 1.203.009
Albania 15.000 16.639
55.000 61.009
433.881 481.288
Algeria 17.800 19.745
Angola
211.601 234.721
Argentina
120.453 133.614

246
Armenia 96.333
106.859
Asia Pacific 6.000.000
6.655.5
74
Belarus
1.789 1.984
Benin 365.871
405.84
7 4.000 4.437
Bolivia 570.479
632.81
1 498.135
552.56
2 901.273 999.748
944 1.047 60.000 66.556
Bosnia and Herzegovina 15.123 16.775
105.455 116.978
Botswana 2.000.000
2.218.5
25
Brazil 496.728
551.00
2 18.000 19.967 99.035
109.8
56 3.416 3.790
Burkina Faso 1.359.518
1.508.0
62 24.000 26.622
8.220 9.118
Burundi 36.000 39.933
Cambodia 44.680 49.562
Cape Verde 16.057 17.811
Chad 361.953
401.50
1
China 29.827 33.086
600 666
416.358 461.851
Colombia 155.261
172.22
5 13.200 14.642
Comoros 1.352.250
1.500.0
00
Côte d'Ivoire 37.000 41.043
16.006 17.754
Cuba 503.011
557.97
1 41.000 45.480
5.455 6.051
Democratic People's Republic of Korea
36.324 40.292
Democratic Republic of the Congo
538.750 597.61
5 16.450 18.248 24.000 26.622
Eastern Europe
827 917
Ecuador 51.220 56.816
8.000 8.874
Egypt 4.000.000
4.437.049
3.606.000 4.000.0
00 11.267 12.498
El Salvador
3.241 3.595 150.026 166.418
Eritrea 108.183
120.003
34.400 38.159
Ethiopia 383.045
424.897
79.172 87.8
22 5.029.490 5.579.024 1.556.993 1.727.114
Gabon 208.866
231.68
7
Ghana 88.805 98.508
2.000.000
2.218.5
25 52.606 58.353 8.000 8.874
Guatemala 173.587 192.55
10.400 11.5 35.822 39.736

247
4 36
Guinea-Bissau 65.228 72.355
5.324
5.906
18.800 20.854
Haiti 5.455 6.051
5.600 6.212
Honduras 967 1.072
India 487.643
540.92
4 71.791 79.635
Indonesia 22.000 24.404
Iran (Islamic Republic of)
3.053.453 3.387.080
Iraq
1.400 1.553
Jordan
5.453 6.049
Kenya 583.248
646.97
6 120.933 134.147 18.918 20.985
Lebanon 333.325
369.74
5 32.841 36.429
814.453 903.442 36.412 40.390
Madagascar 49.575 54.992
340 377
9.920
11.0
04 70.645 78.363
Malawi 101.427
112.50
9
Maldives 4.000.000
4.437.049
Mali 38.733 42.965
4.671 5.182
Mauritania 25.000 27.732
573 636
Mexico 11.800 13.089
5.280 5.857
480 532
Middle East and North Africa 432 479
800 887
Montenegro
5.455 6.051
Morocco 41.500 46.034
2.000.000 2.218.525 16.112 17.873
Mozambique 404.584
448.79
0 45.000
49.91
7 177.362 196.741 41.235 45.740
Myanmar 763 846
8.255.131 9.157.106
Namibia
243 270
Nepal 66.874 74.181
Nicaragua 7.550.000
8.374.931
33.260 36.894
Niger 25.045 27.782
Other (Kosovo) 60.000 66.556
Other (North and Central
America) 1.464 1.624
Other (South Sahara)
146.782 162.819
Other (South Sudan) 1.426 1.582
1.256.508 1.393.797 28.000 31.059
Other (West Bank and Gaza) 40.355 44.764
50.658 56.193
6.000
6.65
6 11.812.390
13.103.03
9
Pakistan
15.627 17.334
Paraguay 20.000 22.185
Peru 557.735
618.67
4 30.515
33.84
9 90.588 100.486

248
Philippines 90.000 99.834
27.371 30.361
Republic of Moldova 18.111 20.090
Rwanda 94.200
104.49
3 36.000 39.933
Senegal 6.092.223
6.757.874
1.280 1.420
127.220 141.120
Serbia 8.628
9.570
12.173 13.503
Sierra 20.000 22.185
Somalia 24.041 26.668
58.934 65.373
14.897 16.524
South Africa
10.844 12.028
Sri Lanka 107.425
119.16
3 11.368 12.610
Sudan 305 338
296 328
Syrian Arab Republic
2.000 2.219
Tanzania 48.046 53.296
9.600 10.649 14.742 16.352
The former Yugoslav Republic of
Macedonia 2.236 2.481
Togo 58.914 65.351
11.452 12.703
Tonga
94.271 104.572
Tunisia 55.468 61.528
14.500.000
16.084.
304 246.528 273.464 1.411 1.565
Turkey
3.520 3.905
16.361 18.149
Uganda 66.866 74.172
52.422 58.149 16.000 17.748
Uruguay
13.320 14.775
Vietnam 14.012 15.543
46.819 51.934 560 621
Zambia 23.000 25.513
Developing countries 801.200
888.74
1 10.251.903
11.372.
050 8.342.921 9.254.488
2016 Mitigation
Agriculture Energy Environment Industry Transport Water and Sanitation Other
Domestic
Currency USD
Domestic
Currency USD
Domestic
Currency USD
Domestic
Currency USD
Domestic
Currency USD
Domestic
Currency USD
Domestic
Currency USD
Afghanistan
39.471 43.648
Africa
25.348 28.030
Angola
53.678 59.359
Asia Pacific
44.000 48.656
Belarus
860 951
Benin 16.000 17.693
13.416 14.835
21.137 23.374 37.610 41.591

249
Bolivia 29.060 32.135
16.309 18.035 11.200 12.385
Brazil 39.620 43.812
9.257 10.237 38.765 42.868
Burkina Faso 93.867 103.801
17.622 19.487
Cameroon 1.799 1.990 18.000 19.905
24.000 26.540
Cape Verde 208.884 230.989
Central African Republic
59.533 65.833
Chile 12.312 13.615
Colombia 93.976 103.921
17.410 19.253 12.000 13.270
Congo
30.000 33.175
Costa Rica
814 901
Cuba 317 350
Democratic Republic of the
Congo 33.299 36.823 154.409 170.750
Djibouti
7.794 8.618
Dominican Republic 5.264 5.821
Eastern Europe
3.200 3.539
Ecuador 21.666 23.959
El Salvador 7.599 8.403
11.000 12.164
Eritrea
32.000 35.386
Ethiopia 16.000 17.693 3.000 3.317
414.800 458.697
Gambia
10.404 11.505
Guatemala 38.124 42.159 22.771 25.181
Guinea-Bissau 78.267 86.550
12.052 13.327
Haiti 151.061 167.048 72.417 80.081
36.136 39.961
India 11.183 12.367
Indonesia
3.600 3.981
Iraq 95.800 105.938
Jordan
160.812 177.830
Kenya 108.165 119.611 12.857 14.217
15.581 17.230
Latin America and the Caribbean
155.418 171.865
140.000 154.816
Lebanon 247.200 273.361 5.053.143 5.587.906 470.276 520.045
18.000 19.905
Madagascar 5.632 6.228
92.469 102.254
49.862 55.139
Mali
14.262 15.772
600 663
Middle East and North Africa
248.605 274.914
Mozambique 90.773 100.379 18.000 19.905
6.000 6.635 268.415 296.820
Myanmar 191.930 212.241
45.378 50.180
Nepal 12.673 14.014 15.960 17.649 95.587 105.703
16.306 18.032
Nicaragua
20.000 22.117
Other (South Sahara) 14.509 16.044
30.264 33.467
Other (South Sudan) 12.554 13.883
35.926 39.728
Other (West Bank and Gaza) 15.808 17.481 32.860 36.337
9.612 10.630 54.968 60.786
Peru 138.278 152.912 4.590 5.076
16.166 17.877
12.565 13.895
Philippines 59.200 65.465

250
Rwanda 136.672 151.135
Senegal 28.241 31.230
67.239 74.355
Serbia 9.788 10.824
Sierra Leone 7.246 8.012
South Africa
12.280 13.580
Sri Lanka 29.166 32.253
Tanzania 16.000 17.693
13.474 14.899 15.519 17.162
Togo
792 876
Turkey
160.359 177.330
Uganda 7.684 8.497
900 995
Uruguay 139.176 153.905
Viet Nam 76.278 84.351
Developing countries
30.662 33.906 200.000 221.166
2016 Adaptation
Agriculture Environment Forestry Water and Sanitation Other
Domestic Currency USD Domestic Currency USD Domestic Currency USD Domestic Currency USD Domestic Currency USD
Afghanistan 893 987
1.806 1.997
Algeria
5.600 6.193
Benin
6.682 7.389
Bhutan
2.556 2.826
Bolivia
26.000 28.752
Bosnia and Herzegovina
65.039 71.922
Burkina Faso 40.800 45.118
105.916 117.125 54.770 60.566
Burundi 5.600 6.193
Cameroon
20.833 23.038
Central African Republic
2.000.000 2.211.655
China
117.134 129.530
Colombia
49.460 54.694
Côte d'Ivoire
23.000 25.434 32.308 35.727
Cuba
8.400 9.289
Djibouti
8.554 9.459
Dominican Republic
36.075 39.893
Ecuador
9.114 10.079 30.779 34.037
Egypt
80.000 88.466
Eritrea
32.000 35.386
Ethiopia 33.840 37.421
6.070.670 6.713.115 898.367 993.439
Gambia
33.182 36.694
Georgia
1.200 1.327
Guatemala
1.000 1.106
Guinea-Bissau
43.600 48.214 40.000 44.233

251
Haiti
12.598 13.931
India 5.600 6.193
152.710 168.871
Indonesia
12.000 13.270
11.200 12.385
Iraq
194.562 215.152
Kenya
12.000 13.270 30.000 33.175
Lebanon
10.598.043 11.719.610 43.400 47.993
Madagascar
5.600 6.193
Mali
4.488.780 4.963.817 400.000 442.331
Mexico 2.000 2.212
Middle East and North Africa 8.945 9.892
Nepal
72.709 80.403 32.894 36.376
Nicaragua
12.000 13.270 5.600 6.193
Niger 67.785 74.959
27.000 29.857 23.103 25.548
Other (Kosovo)
920 1.017
Other (South Sahara) 10.169.961 11.246.225
3.624.000 4.007.520
Other (South Sudan)
88.000 97.313 43.000 47.551
Other (West Bank and Gaza)
51.050 56.453
Pakistan
19.179 21.208 2.410 2.665
Peru
51.000 56.397
Philippines
4.000 4.423
Rwanda
128.991 142.642
Senegal 5.903 6.528 190.000 210.107
3.200 3.539 47.351 52.362
Serbia
50.000 55.291
Somalia
194.480 215.061
South Africa
25.080 27.734
Syrian Arab Republic
4.000 4.423 21.000 23.222
Tanzania
21.000 23.222
82.212 90.912 76.517 84.614
Thailand
58.000 64.138
Togo 11.964 13.230
26.667 29.489
Tunisia
36.141 39.966
Uganda 69.992 77.399
64.062 70.842
Uruguay
47.584 52.620
Venezuela
25.000 27.646
Viet Nam
1.400 1.548
Developing countries
46.692 51.634

252
2016 Cross-cutting
Agriculture Energy Environment Forestry Industry Transport Water and Sanitation Other
Domestic
Currency USD
Domestic
Currency USD
Domestic
Currency USD
Domestic
Currency USD
Domestic
Currency USD
Domestic
Currency USD
Domestic
Currency USD
Domestic
Currency USD
Afghanistan
2.230.447 2.466.490
Africa
40.614 44.913 871.158 963.351
Albania 17.308 19.140
Algeria
680 752
Angola
10.844 11.991
Argentina 53.622 59.296
36.000 39.810
16.974 18.770
Armenia 33.333 36.861
Asia Pacific
2.997.985 3.315.255
Bangladesh
4.664 5.157
Benin
3.600 3.981
29.363 32.470
Bolivia 187.543 207.391
8.000 8.847
60.532 66.938
Bosnia and Herzegovina
74.760 82.672
63.200 69.888
Brazil 60.039 66.393
41.274 45.642
Burkina Faso 104.488 115.546
10.160 11.235
22.729 25.135 150.983 166.961
Burundi
31.300 34.612
Cambodia 1.590 1.758
8.000 8.847
Cameroon 195.327 215.998 4.835 5.346
62.648 69.278
Central African
Republic 65.045 71.928
Chad 31.808 35.174
7.200 7.962
Chile 14.210 15.714
3.926 4.341 1.600 1.769
Colombia 278.257 307.704
8.972 9.921 19.533 21.600
Congo
25.371 28.056
14.450 15.979 1.800 1.990
Costa Rica 13.373 14.788
800 885
Côte d'Ivoire 115.113 127.295
3.600 3.981
6.000 6.635
Cuba 36.270 40.108
Democratic
Republic of the Congo
231.324 255.804
89.564 99.043 19.920 22.028
97.840 108.194 227.604 251.691
Djibouti 8.050 8.902
Dominican Republic
36.066 39.883
Eastern Europe
1.080 1.194
Ecuador 118.851 131.429
6.288 6.953
116.099 128.385
Egypt
79.803 88.248
El Salvador 66.008 72.993
5.280 5.839
9.111 10.075
Eritrea
Ethiopia 240.168 265.584
67.577 74.729
892 986 6.050.013 6.690.272

253
Gambia 44.745 49.480
1.999 2.211
Ghana
2.667 2.949 36.844 40.743
Guatemala 216.796 239.739
Guinea-Bissau
42.615 47.125
Haiti 209.313 231.464
96.674 106.905
17.130 18.942
Honduras
16.668 18.432
India 30.168 33.361
120.706 133.480
31.059 34.346
Indonesia 30.000 33.175
25.000 27.646
12.000 13.270
Iran (Islamic
Republic of) 5.812 6.427
Iraq
18.000 19.905
55.056 60.882
Jordan 239.841 265.223
480.000 530.797
Kenya 97.367 107.671
65.669 72.619 38.910 43.027
Lebanon 361.068 399.279
88.047 97.365 138.172 152.794
Libya
4.000 4.423
Madagascar
19.040 21.055 28.185 31.168
Malawi 9.820 10.859
5.647 6.244
Mali 11.277 12.470
84.000 92.890
Mauritania 100.412 111.038
100.000 110.583
Mexico 12.354 13.661
6.103 6.749
Middle East and
North Africa 44.030 48.690
201.760 223.112
Mongolia 50.000 55.291
Montenegro
5.812 6.427
Morocco
242 268
Mozambique 49.247 54.459
336.814 372.458
Myanmar 12.404 13.717
9.702 10.729
10.286 11.375
Namibia 10.000 11.058
Nepal 26.704 29.530
15.962 17.652
Nicaragua 15.910 17.594
27.356 30.251
7.318 8.093
Niger 8.689 9.609
20.000 22.117
Nigeria 33.600 37.156
6.773 7.490
Other (Kosovo)
4.000 4.423
Other (North and
Central America) 15.800 17.472
Other (South
Sahara) 1.953.645 2.160.395
Other (South Sudan)
62.554 69.174
2.167.800 2.397.213
Other (West Bank
and Gaza) 38.115 42.149 6.941.350 7.675.937
7.217.200 7.980.980
Pakistan
11.120 12.297 33.839 37.420
Paraguay
27.230 30.112
Peru 124.736 137.937 1.600.000 1.769.324 35.000 38.704
35.947 39.751
Philippines 48.661 53.811
7.352 8.130
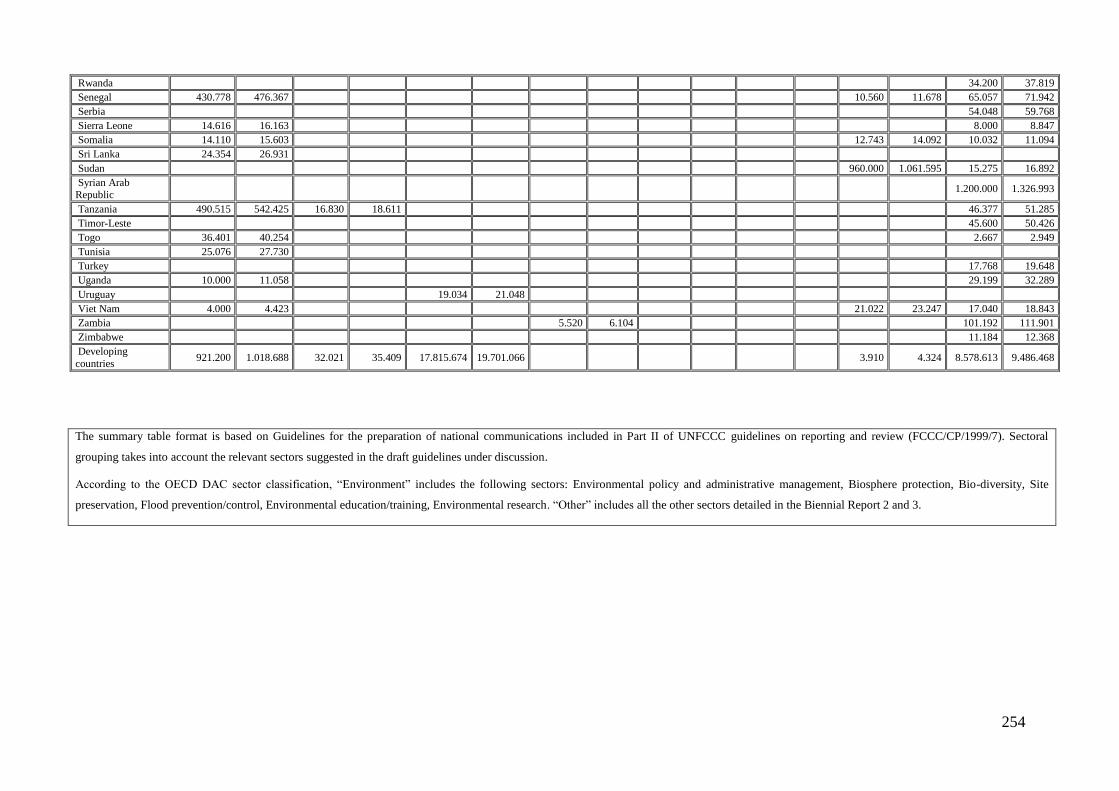
254
Rwanda
34.200 37.819
Senegal 430.778 476.367
10.560 11.678 65.057 71.942
Serbia
54.048 59.768
Sierra Leone 14.616 16.163
8.000 8.847
Somalia 14.110 15.603
12.743 14.092 10.032 11.094
Sri Lanka 24.354 26.931
Sudan
960.000 1.061.595 15.275 16.892
Syrian Arab Republic
1.200.000 1.326.993
Tanzania 490.515 542.425 16.830 18.611
46.377 51.285
Timor-Leste
45.600 50.426
Togo 36.401 40.254
2.667 2.949
Tunisia 25.076 27.730
Turkey
17.768 19.648
Uganda 10.000 11.058
29.199 32.289
Uruguay
19.034 21.048
Viet Nam 4.000 4.423
21.022 23.247 17.040 18.843
Zambia
5.520 6.104
101.192 111.901
Zimbabwe
11.184 12.368
Developing
countries 921.200 1.018.688 32.021 35.409 17.815.674 19.701.066
3.910 4.324 8.578.613 9.486.468
The summary table format is based on Guidelines for the preparation of national communications included in Part II of UNFCCC guidelines on reporting and review (FCCC/CP/1999/7). Sectoral
grouping takes into account the relevant sectors suggested in the draft guidelines under discussion.
According to the OECD DAC sector classification, “Environment” includes the following sectors: Environmental policy and administrative management, Biosphere protection, Bio-diversity, Site
preservation, Flood prevention/control, Environmental education/training, Environmental research. “Other” includes all the other sectors detailed in the Biennial Report 2 and 3.

255
7.4 Activities related to transfer of technology
Enhancing climate technology development and transfer to developing countries for adaptation and
mitigation actions and increase energy efficiency is crucial for addressing the global challenges of energy
security, climate change and economic development with the aim to improve resilience to climate change
and to reduce GHG emissions.
In order to contribute actively to this process, Italy is involved in several bilateral cooperation activities
mainly focused on the energy sector with many developing countries with a particular attention to African
Countries and Small Islands Developing States.
In recent years, Italy has significantly intensified the number of Memorandum of Understanding with
developing countries to implement projects related to mitigation and adaptation measures, which foresee
the transfer of technologies according to the needs and specific circumstances of the receiving countries.
All the projects implemented, under implementation or planned, consider knowledge transfer and
adequate and specific training courses for the installation and maintenance of the equipment (soft
technologies) in addition to the essential transfer of technologies (hard technologies).
Taking into account lessons learned and previous failures, during the implementation phase of each
relevant project, endogenous people are constantly involved in the installation and operation startup of
plants. Following this phase, tailored training programmes to local beneficiaries are organized to ensure
proper control, function and routine maintenance.
With regard to reporting and monitoring activities, the Guiding Principles for the bilateral cooperation
Mechanism foresee that each project shall be monitored, through the production of periodic reports and
technical evaluations approved by the Joint Committee, including, as appropriate, field missions and on-
site visits. The Parties annually prepare a report on the activities under the MoU and a third independent
party carries out a final audit within six months of termination or expiration of the MoU.
Such evaluation system, foreseen for each MoU, allows to verify both the status of technology transfer
and the realization of training courses including the results achieved in the various phases of the project
implementation.
Regarding the private sector involvement, as a general approach, when drafting bilateral cooperation
agreements, IMELS investigates the potential contribution of the private sector, mainly through provision
of technologies core and expertise, and shapes the collaboration with the partners to facilitate private
sector contribution to the technical and practical implementation of the projects. In particular, IMELS
uses two different ways of involving the private sector: the first consists in publishing calls for interest for
a specific sector, for a country or a region on the Ministry's website before organizing the technical
missions to define the needs with the beneficiary country; the second concerns the identification of
companies holding specific technologies to implement projects already established with the receiving
countries. Finally, IMELS organizes seminars, workshops and events to disseminate opportunities related
to bilateral cooperation and technology transfer activities, involving companies from the pertinent sectors
and organizing business-to-business meetings.

256
Table 4 Success and failure stories related to technology transfer
Project / Program title
Heat Pump Project – Phase 1 under the technical agreement on sustainable development cooperation
between the Italian Ministry for the Environment Land and Sea (IMELS) and the Lebanese Center for
Energy Conservation (LCEC)
Purpose
Support to the Lebanese Government in addressing the climate change mitigation challenges presented
in the NDC under the UNFCCC by introducing “heat pump” technologies in the heating, domestic hot
water production and cooling sectors (for residential and tertiary applications mainly) through knowhow
and technology transfer in line with the European legislation and the phasedown of the high global
warming potential refrigerant gases (hydrofluorocarbons HFCs) established under the Montreal Protocol.
Recipient Country Sector Total funding Years in operation
Lebanon Energy 1.976.766 € 2016ongoing
Description
The project aims to:
- Ensure the quality of products on the market, in line with the European legislation and Montreal
Protocol’s phasedown of the HFCs;
- Establish a capacity and infrastructure which can make Lebanon a landmark for Energy Efficiency
in Middle Eastern countries for Lebanese assemblers of components, for potential future local
manufacturers of heat pumps and air conditioners, for research institutes working on heating
and cooling technologies;
- Ensure the quality in design and installation of technologies for domestic hot water, heating and
cooling plants;
- Demonstrate the economic and environmental advantage of such systems through pilot
applications in Lebanese buildings (residential and tertiary sectors mainly).
Indicate factors which led to project’s success:
Collaboration among the Lebanese public administration, private sector and research institutes.
Technology transferred
Vapour compression technologies (e.g. air conditioners and heat pumps)
Impact on greenhouse gas emission/sinks (optional):

257
Project / Program title
Arrangement on sustainable development finance between the Italian Ministry for the Environment, Land
and Sea and the Bank of Lebanon
Purpose
Support energy saving and efficiency investments in Lebanon through a grant from Italian Ministry for
Environment, Land and Sea to the the Bank of Lebanon to support National Energy Efficiency and
Renewable Energy Action (NEEREA) in all economic sectors except the residential one.
Recipient Country Sector Total funding Years in operation
Lebanon / Bank of
Lebanon
Energy renewables 5.000.000,00 € 2016ongoing
Description
The Agreement signed in 2016 between the Ministry for the Environment and the Protection of the
Territory and Sea and the Bank of Lebanon aims to create a financial mechanism to facilitate, through
the Lebanese trading banking system, an eased financing line for projects in the field of renewable
energies and energy saving.
Indicate factors which led to project’s success:
Driving force behind the project is a substantial private sector involvement
Technology transferred
Soft and hard technologies for mitigation of and adaptation to climate change
Impact on greenhouse gas emission/sinks (optional):
The technology that will be promoted and deployed will contribute to reducing GHG emissions and
increasing energy efficiency.

258
Project / Program title
Sustainable Program of a widespread rural electrification for water and energy security
Purpose
The Pilot Project aims in: (1) promoting the sustainability of renewable energy technologies in rural
area, (2) deploying energy services, (3) creating awareness and (4) providing training and employment
opportunities at the community level in renewable energy sector.
Environmental objectives will be achieved ensuring renewable energies, contributing to reduce the use of
fossil fuels avoiding CO2 emissions. In addition, the installation of water, telecommunication and sanitary
facilities will provide the population with stronger adaptation measures to extreme weather events.
Recipient Country Sector Total funding Years in operation
Pacific region /
Solomon Islands
Energy renewable 956.129,00 € 2016 ongoing
Description
This project resulted from a Joint Declaration signed in 2016 in New York between Solomon Islands and Italy during the week of the Ceremony for the Paris Agreement, by which Italy renewed its commitment on climate cooperation within the PSDISItaly MoU and envisioned new activities on technology and capacities transfer supported also by Italian technical missions to the Pacific. Therefore, in June 2016, the Italian Ministry for Environment charged Italian National Agency for New Technologies, Energy and Sustainable Economic Development (ENEA) for carrying out a technical mission to the Solomon Islands.
The main addressed purposes comprised to monitor results of concluded projects, put together lessons learnt and pilot new activities directly evaluated onsite, in a followup process. Hence Italian technicians were firstly guided by the local Government representatives in the outer Islands on the sites of the rural electrification projects concluded almost six years before. In these places, technicians had the opportunity of talking with the rural people directly involved and to gather useful findings for the forthcoming activities requested by the local Governments.
The main outcome of the mission was the revealing of a widespread malfunction of the solar systems
installed between 2008 and in 2010, due to a shortage of maintenance for a lack of technical knowledge and capacities. Therefore a new project of rural electrification was planned during different steps of consultation among the stakeholders with the aim of establishing even more local and tailor made solutions for the small scale needs. The new project will install 16 plants in two provinces of the Solomon Islands (such as Malaita and Western) and, since it has been planned for small villages of an average size of 200
inhabitants, it has been estimated that it will involve almost 3.000 people who lives in absence of essential energy services. The local communities will be selected, informed and committed for the correct system maintenance. In addition, 30 people, among teachers and students, will be trained on topics as design, selection and maintenance of a PV system in order to obtain, at the end of the course, the availability of a local and skilled group able to operate a low cost and effective maintenance service for the installed plants.
Indicate factors which led to project’s success:
Robustness in the time of the solar systems installed is an important goal that will be achieved through
the technical economic optimized selection of reliable and high efficiency components, the creation of microenterprises for maintenance, a choice of beneficiary communities to commit themselves, at the end
of the project, to pay for the maintenance of the plant.
Technology transferred
A specific set of training activities in Technical Don Bosco Institute (TDBI) in Solomon Islands will be implemented consisting of a theoretical and practical course on design, selection, installation and maintenance of photovoltaic and pumping systems. Handbooks, presentations and ancillary software will be prepared; a didactic workshop will set up. A fulltime course for 30 people will be implemented: two
groups of about 10 young people will be selected also from those who are already training at the TDBI. Among participants 10 teachers of the TDBI will be included. The learning group will attend a theoretical course of 15 days including workshop activities. At the end the students will be involved in an internship during the installation of the 16 PV systems.

259
At the end of the training, the project will support the creation of two Youth MicroEnterprises (YME) in the two provinces to provide maintenance service to the 16 PV system installed and to operate as a local
Energy Service Company (ESCO). Each YME will be equipped with an operating office, working and measurement tools, stock of spare parts and all equipment to ensure prompt action in the plant maintenance. The YME will be assisted for the improvement of their market visibility (website, brochure, local events, spot radio, etc.). Assistance will be provide for the legal and financial aspects related to the possibility to operate as ESCO. The YME will be assisted by the possible formation of joint venture with
Italian companies in the sector.
Impact on greenhouse gas emission/sinks (optional):
The emission avoided by the operation of the 16 photovoltaic systems compared with the exercise of
diesel power generators is 64 t CO2/year.

260
Project / Program title
Donor agreement between the Italian Ministry for the Environment Land And Sea (IMELS) and United
Nations Environment Programme (UNEP)
Purpose
The aim of the project is promoting strategy and paving the way for the deployment renewable energy
technologies in Egypt, contributing to the Programme entitled “Mediterranean Investment Facility (MIF)”.
Recipient Country Sector Total funding Years in operation
Egypt / Africa (North
of Sahara)
Energy renewables 2.169.066,10 € 2016ongoing
Description
Contribution to the Programme to put in place financial mechanisms to support renewable energy and
energyefficiency systems, to ensure the sustainability of the market by strengthening the capacity of
local stakeholders. Implementation project and financing arrangements include:
- identification of the key stakeholders;
- proposed financial support mechanism, including identification of possible cofinancing sources
such as any ongoing of planned Government programs, other multi or bilateral support, private
sector financing;
- capacity building measures;
- policy measures to create an enabling environment to promote the identified technology.
Indicate factors which led to project’s success:
Strengthening the capacity of local stakeholders
Technology transferred
Renewable energy and energyefficiency systems, such as SWH systems, solar PV systems and compact
fluorescent lamps
Impact on greenhouse gas emission/sinks (optional):

261
Project / Program title
Installation of a water desalination plant on the island of Magoodhoo Faafu Atoll – Maldives
Purpose
Provide a production of about 350 litres per hour to island of Magoodhoo
Recipient Country Sector Total funding Years in operation
Maldives Water, energy 167.200 € 20162017
Description
The project aims at setting up a desalinating sea water plant through the reverse osmosis plant and a
photovoltaic cell to electrically power this latter. Notice is hereby given that the process is called reverse
osmosis and is the foundation of many desalination plants around the world. The water is forced through
polymer membranes that allow water molecules to pass, blocking the salts and other inorganic
impurities .
Indicate factors which led to project’s success:
o First desalinization system in the island.
o Reduction of the dependence from the imported bottled water
o Reduction of the dependence on the imported fossil fuels in terms of fuel storage capacity and
vulnerability to price fluctuations
o Awareness between the availability of drinking water and health of citizens.
o Promote the integration between the actions of various institutions at the local level (school,
Health Center, the Island Council).
Technology transferred
Photovoltaic cell
Impact on greenhouse gas emission/sinks (optional):

262
8 RESEARCH AND SYSTEMATIC OBSERVATION
8.1 Introduction
This chapter describes the relevant activities in climate change research and climate systematic
observations. It focuses on the national policy framework for research and in particular on climaterelated
programs. The chapter details also the main national achievements and projects in the field of climate
change research and systematic observation.
Italy has continued to participate in the overall effort to develop scientific results that will contribute to
the upcoming AR6 IPCC report. It is participating to the coordinated climate numerical experiments to
upgrade the scenarios data and it is also very active in the economic and social impacts with expertise
and numerical economic models.
8.2 General policy on research and systematic observation
8.2.1 Research
The policy framework on research in Italy changed significantly compared to the previous period. The
Italian Ministry of Education, University and Research (MIUR – Ministero dell’Istruzione, dell’Univerità e
della Ricerca) and the Ministry of Economic Development (MiSE – Ministero dello sviluppo economico)
made an effort to harmonize national policies with the European ones. The National Smart
Specialisation Strategy (SNSI – Strategia Nazionale di Specializzazione Intelligente198) represents the
cornerstone between the European Horizon 2020 program and the National Research Program. In fact,
the SNSI identifies the national priorities for research, in the frame of European strategies. The SNSI
selects five main areas of specialisation:
Smart and sustainable industry, energy and environment
Health, nutrition and quality of life
Digital agenda, smart communities and smart mobility
Turism, cultural heritage and creative industry
Aerospace and defence.
In the frame of these general thematic priorities, the SNSI identifies 12 areas for applied research which
are strategical for Italy and in particular for southern regions, which have to adopt them for their own
local development policies:
1. Aerospace
2. Agrifood;
3. Cultural Heritage;
4. Blue growth;
5. Green sustainable chemistry;
6. Design, creativity and Made in Italy;
7. Energy;
8. Smart Manufacturing
9. Sustainable Mobility
198http://www.agenziacoesione.gov.it/it/S3/S3_Nazionale/Strategia_nazionale_di_specializzazione_intelligente.html

263
10. Health
11. Smart, Secure and Inclusive Communities;
12. Technologies for life environments
The whole strategy is oriented to sustainability and, in particular, climate is a transversal theme,
embedded in several of the abovementioned fields such as aerospace, agrifood, blue growth, energy and
mobility.
The National Research Program 20152020 (PNR – Programma Nazionale della Ricerca199) is the main
national policy on research. It used to be a threeyears financial plan until 2013, but the actual program
evolved and it is quite innovative compared with the previous ones: it sets a longterm (six years) general
action to coordinate coherently several subprograms and funds with the European Horizon 2020 program,
and with other national and regional policy instruments. The main objectives of the new PNR are to
strengthen the Italian research system, to make it more competitive and at the same time to promote
international cooperation on research.
In addition to basic research, the PNR promotes applied research through publicprivate partnerships and
the technological transfer from research institute to market. The PNR foresees the institution of 12
innovative clusters (one for each area identified by the SNSI) involving research institutes, universities,
SMEs and large enterprises.
The PNR is financed through several funds for total investments of 2,5 Billion €:
Fund for Investments in Scientific Research and Technology (FIRST Fondo per gli
Investimenti nella Ricerca Scientifica e Tecnologica). It finances both basic research and industrial
research.
Financial Ordinary Fund (FFO – Fondo di finanziamento ordinario). The primary contribution of
the MIUR to finance all Italian universities.
Ordinary fund for research institutes and bodies (FOE Fondo ordinario per il finanziamento
degli enti e istituzioni di ricerca). The primary contribution of the MIUR to fund research activities
conducted by public research bodies and institutes acting under the supervision of the Ministry
Supplementary Special Fund for Research (FISR – Fondo integrativo speciale per la ricerca).
It finances specific strategical projects, as stated in the PNR.
Beside the PNR, the MiSE and the MIUR developed the National Operative Program “Research and
Innovation” 20142020 (PON RI 20142020 – Programma Operativo Nazionale “Ricerca e Innovazione”).
The program is financed through the European Regional Development Fund (ERDF) and Social European
Fund (SEF) and it focuses on the southern regions, with the aim of increase the research infrastructure of
the less developed areas of Italy. Coherently with the general policy architecture, the PON RI targets the
same research areas identified by the SNSI and it has the same objectives of PNR.
Outside the scheme described so far, the MIUR also financed the Relevant National Interest Projects
(PRIN Progetti di Rilevante Interesse Nazionale200), a threeyear program to fund specific research
199 http://www.miur.gov.it/web/guest/programma-nazionale-della-ricerca 200 http://prin.miur.it/

264
projects with 90M € of resources available. The last program, approved by the government in 2015,
focuses on Life science, Physical Science and Engineering and Social science and Humanities and the
beneficiaries are national partnerships composed by Italian universities.
Moreover, the MIUR supports also the National Research Program in Antarctica (PNRA – Programma
Nazionale di Ricerca in Antartide201). In 2014 the MIUR set a new strategy for the threeyears period
20142016 in continuity with the previous programming period. Scientific priorities of the PNRA cover a
wide range of climate specific or climate related topic:
Dynamics of atmosphere and climate processes
Dynamics of the polar cap
Dynamics of solid Earth
Dynamics of polar oceans
EarthSun relations and space weather
Universe over Antarctica
Evolution, adaptation and biodiversity
Man in extreme environments
Environmental contamination
Paleoclimatology
Environmental risks
Technology: experimentation and innovation
The PNRA accounts for 74M € funds, which are annually distributed through specific administrative
orders.
Also the Ministry of agricultural, food and forestry policies (MiPAAF – Ministero per le politiche agricole,
alimentary e forestali), contributes to shape the Italian landscape on climate research. In 2016 it
developed a strategy to drive different sectoral policies at different administrative levels concerning
agriculture, forestry and fisheries: the Strategical Plan for Research and Innovation in the
agricultural, food and forestry sectors 20142020 (Piano strategico per l’innovazione e la ricerca nel
settore agricolo, alimentare e forestale 20142020202). The plan identifies six research areas and climate
change is one of the priorities:
1. Sustainable increase of productivity, profitability and efficiency of resources in agroecosystems
2. Climate change, biodiversity, soil functionality and other social and ecosystem services in
agriculture
3. Coordination and integration of value chains and development of the role of agriculture
4. Quality, traditional products and food security for healthy lifestyles
5. Sustainable use of biological resources for energy and industrial purposes
6. Development and reorganisation of the research system for agriculture, food and forestry sectors
The plan is a soft law and does not foresee an action plan with financial provisions. Its aims is to
coordinate national agricultural laws, the PNR and the national and regional policies cofinanced through
201 http://www.miur.gov.it/web/guest/programma-nazionale-di-ricerca-in-antartide 202 https://www.politicheagricole.it/flex/cm/pages/ServeBLOB.php/L/IT/IDPagina/9065

265
European funds (ERDF, EMFF, SEF, etc.) in order to give to national research a coherent direction on this
topic in the programming period 20142020.
8.2.2 Observations
According to the PNR 20112013, the climate system observations and monitoring must overcome the
current dispersion and multiannual planning. A more efficient network for Earth observations would
facilitate the Italian contribution to the Copernicus Climate Change Services (former GMES Global
Monitoring for Environment and Security) and GEOSS (Global Earth Observation System of Systems) and
the increase of the competitiveness of research programs within the EU. Toward that direction, in 2016
GEOItaly was established as the national coordination of the Italian contribution to GEO
(www.geoitaly.org/). The main topics include: monitoring the Earth’s surface, changes in the composition
of the atmosphere, water cycle, impacts on land, emergency response, climate change, marine
monitoring and security; support for national infrastructure and ESFRI initiatives (ICOS, EUFARCOPAL,
SIOS, JERICO, EMSO, ACTRIS).
8.2.3 Major Italian research institutions and organisations working in the field of
Climate and Climate Change
A quite large number of national universities, public and private institutes and other organizations are
involved in climate research and climaterelated research and systematic observation. The major Italian
universities consortium, research institutions and organisations conducting climate and climate change
research are the following ones:
Abdus Salam International Centre for Theoretical Physics (ICTP), http://www.ictp.it/;
Agricultural Research Council (CRA Consiglio per la Ricerca e la sperimentazione in
Agricoltura), http://www.entecra.it/;
ENI Enrico Mattei Foundation (FEEM Fondazione ENI Enrico Mattei), http://www.feem.it/;
EuroMediterranean Centre on Climate Change (CMCC Centro EuroMediterraneo sui
Cambiamenti Climatici), http://www.cmcc.it/;
Institute for Environmental Protection and Research (ISPRA – Istituto Superiore per la
Protezione e la Ricerca Ambientale), http://www.isprambiente.it;
Institute of Agroenvironmental and Forest Biology of the National Research Council
(IBAF CNR Istituto di Biologia Agroambientale e Forestale del Consiglio Nazionale delle Ricerche),
http://www.ibaf.cnr.it/;
Institute of Atmospheric Sciences and Climate of the National Research Council (ISAC
CNR Istituto di Scienze dell’Atmosfera e del Clima del Consiglio Nazionale delle Ricerche),
www.isac.cnr.it;
Institute of Biometeorology of the National Research Council (IBIMET CNR Istituto di
Biometeorologia del Consiglio Nazionale delle Ricerche), http://www.clima.ibimet.cnr.it/;
Institute of Marine Sciences of the National Research Council (ISMAR CNR Istituto di
Scienze Marine del Consiglio Nazionale delle Ricerche), http://www.ismar.cnr.it/;
National Agency for New Technologies, Energy and Sustainable Economic Development
(ENEA – Agenzia nazionale per le nuove tecnologie, l’energia e lo sviluppo economico sostenibile),
www.enea.it;

266
Italian Air Force Met Service (Servizio Meteorologico dell’Aeronautica Militare),
http://www.meteoam.it/;
National Consortium of Universities for Atmospheric and Hydrospheric Physics (CINFAI
Consorzio Interuniversitario Nazionale per la Fisica delle Atmosfere e delle Idrosfere),
http://www.cinfai.it/;
National Institute of Experimental Oceanography and Geophysics (OGS Istituto Nazionale
di Oceanografia e di Geofisica Sperimentale), http://www.ogs.trieste.it/
National Institute of Geophysics and Volcanology (INGV Istituto Nazionale di Geofisica e
Vulcanologia), www.bo.ingv.it;
National Interuniversity Consortium for Marine Sciences, Local Research Unit: Department
of Geological Sciences and Geotechnologies MilanoBicocca (CoNISMa Consorzio Nazionale
Interuniversitario per le Scienze del Mare, Unità locale di ricerca: Dipartimento di Scienze
Geologiche e Geotecnologie, Università degli Studi di MilanoBicocca), http://www.conismamibi.it/;
Water Research Institute of the National Research Council (IRSA CNR Istituto di Ricerca
sulle Acque), http://www.irsa.cnr.it/;
Zoological Station Anton Dohrn of Naples (Stazione Zoologica Anton Dohrn di Napoli),
http://www.szn.it/.
In addition, several regional Agencies For Environment Protection (ARPAs) are actively conducting
research on climate data monitoring, regional climate modelling and regional impacts assessments.
8.2.4 Research
Italy fully contributes to the main international projects and programmes in climate prediction and
simulation activities. In particular, Centro Euro–Mediterraneo sui Cambiamenti Climatici (CMCC), with its
new Earth System Model (CMCCESM) is involved in the main research and operational activities in the
seasonal–to–decadal (S2D) forecast field.
For the operational seasonal prediction activity, the new CMCC model has been implemented and
extensively tested in the configuration with a ¼degree in the ocean coupled to a 1degree atmosphere.
The number of ensemble members has also been increased to 50. Starting from early 2016, this
configuration is used to produce the operational seasonal outlook on a monthly basis for the
1993topresent time frame. The full consistency between the oceanic component of the new CMCCESM
and the ocean model used at CMCC to produce ocean state reanalyses, has improved the initialization of
the seasonaltodecadal forecasts, leading, as a consequence, to higher quality climate predictions.
Furthermore, based on the outcomes of the explorative tests conducted on seaice and land surface
initialization, an improved strategy for the initialization of these components has also been routinely
introduced in the operational seasonal forecasting system. In particular, the status of vegetation, snow
cover, soil moisture and other land surface state variables are inferred from an offline run of the
standalone land surface scheme, driven by the best observational meteorological forcings.
Italy, through CMCC’s operational seasonal forecast activities, contributes to international programs of
multimodel ensemble predictions such as, for example, the preoperational Copernicus C3s Multi–model
Ensemble, the Asian Pacific Climate Center Multi–model Ensemble and WMO endorsed Climate Outlook
Forum MedCOF.
CMCC is also engaged in several scientific and coordination activities concerning model development,

267
design of new strategies and tools for evaluating global highresolution simulations at a process level. On
this regard, activities have been performed aimed at the provision of new highresolution protocols and
flagship simulations for the World Climate Research Programme (WCRP)’s Coupled Model
Intercomparison Project (CMIP6) project, to inform the Intergovernmental Panel on Climate Change
(IPCC) assessment report (AR6) and in support of emerging Climate Services.
The WRCP views regional downscaling as an opportunity to engage a broader community of climate
scientists in its activities. The CORDEX program has been established as a catalyst to achieve this goal.
More specifically, CORDEX aims to understand relevant regional/local climate phenomena through
dynamical downscaling of global data, producing coordinated sets of regional downscaled projections
worldwide, considering selected subdomains. Over Italy, data are available through EUROCORDEX,
MEDCORDEX and MENACORDEX subdomains. EUROCORDEX is the European branch of the program:
regional simulations have been performed by several modelling groups in different research centres
(some of them in Italy, operating for different proposes and aims). Selected spatial resolutions have been
employed (0.44°, 022° and 0.11°), both for the historical period (19712005) and for the future period
(20062100) according with the IPCC RCP2.6, RCP4.5 and RCP8.5 scenarios. Data from several Regional
Models (RCM) are available, driven by different Global Models (GCM); with an increasing number of
simulations available and institutions involved in the program. The output of climate simulations are data
sets of relevant atmospheric and surface variables. These data are freely available for research purposes
and can be downloaded through the ESGF portal. EUROCORDEX simulations over Italy show negative
temperature biases, especially in winter at high altitudes, and a generally high precipitation
overestimation, with some exceptions in Po Valley and Tuscany, in summer.
MedCORDEX has been proposed for the Mediterranean climate as a followup of previous and existing
initiatives. It represents a framework where research community make use of regional atmospheric, land
surface, river and oceanic climate models and coupled regional climate system models for increasing the
reliability of climate information. Twenty different modelling groups are involved, from nine different
countries, employing overall 12 Regional Climate System Models. Data are available at resolutions of
0.44° and 0.11°, according with RCP4.5 and RCP8.5 scenarios.
MENACORDEX is one of the last domain defined in CORDEX, driven by several needs, such as the
assessment of impacts on water resources in the Arab region, whose importance is confirmed by the
establishment of the RICCAR initiative. Seven modelling groups are involved in this activity. Most of the
Italian territory is enclosed in this domain (with the exception of northern Italy). Data are available at
resolutions of 0.44° and 0.22°, according with RCP4.5 and RCP8.5 scenarios.
At CMCC, results of regional simulations over Italy have been published using the COSMOCLM model at
spatial resolution of 0.0715° (about 8 km) over the period 19712100, driven by the GCM CMCCCM
employing the IPCC RCP4.5 and RCP 8.5 scenario. This higher resolution allowed the possibility to obtain
more detailed climate analysis and scenarios, which can be useful for several applications, especially as
input for impact models, for evaluation of climate change effects on different hydrogeological hazards
(drought, flooding and landslides). This makes it possible to help bridge the gap between climate and
impact models, creating a more realistic coupling especially in regions with complex topography. Results
have revealed a good capability of the model in reproducing the climate features of Italy, thanks to the
optimized model configuration and to the high resolution, which provides good improvements in complex

268
orography areas. Climate projections highlight a general warming expected in Italy (about 3.2°C per
century), along with a reduction of precipitation in summer, and an increase in winter over north Italy.
This information is relevant, since it is connected with flood risk in winter and with water resources
management in summer. These results represent a step forward with respect to previous projections
available over Italy, obtained at lower resolution in the frame of other European projects (e.g.
PRUDENCE, ENSEMBLES).

269
8.2.5 National Projects
Table 8.1 Relevant National Projects on climate process and climate system studies, including paleoclimate studies; modelling and prediction, including general circulation models; research on the impacts of climate change; socioeconomic analysis, including analysis of
both the impacts of climate change and response options; research and development on mitigation and adaptation technologies
Acronym Title and Web site Sponsor /
Recipient
Start date
End Date
Coordinator Involved Italian Partner(s) Budget (€)
ARGO ITALY Italian contribution to global ocean monitoring http://nettuno.ogs.trieste.it/jungo/argoitaly/
MIUR N.A. OGS OGS N.A.
BEOI Beyond EPICA Oldest Ice Miur through PNRA 20182019 CNRIDPA CNRIDPA, Univ. of Venezia, ENEA, Univ. of Bologna, INGV, Univ. Of Milano Bicocca, Univ. of Firenze
138.300
BioAPRoS Correlation between biogenic aerosol and
primary production in the Ross Sea
Miur through PNRA 20182019 University of
Firenze
University of Firenze, ENEA,
Univ. of Venezia, Univ. of Tuscia
106.60
0
Black Cat BLACK CArbon Tool Fondazione Cariplo 20152017 CNRISAC CNR N.A.
BSRNOBS Misure dei flussi di radiazione solare ed IR alla superficie sul Plateau Antartico presso DomeC
MIURPNRA N.A. CNRISAC CNR N.A.
CARBOTREES Climate change mitigation strategies in tree crops and forestry in Italy (Strategie nazionali per la mitigazione dei Cambiamenti Climatici in sistemi arborei agrari e forestali)
http://cercauniversita.cineca.it/php5/prin/cerca.php?codice=201049EXTW&testo=clima
MIUR PRIN 20102011
3 years (Period N.A.)
University of Tuscia
University of Tuscia, Molise University, Sassari University, Napoli University, Padova University, Palermo University, Firenze University, Basilicata
University, Perugia University
864.500
CATARSI Climaticallydriven changes of Antarctic sea ice and their role in the climate system
MIUR (PNRA) Jun. 2014 – Jun. 2016
CMCC 125.000
EEE Highenergy efficiency buildings (Edifici ad PNR (National 3 years Piattaforma Piattaforma Tecnologica italiana 20.000.000

270
alta efficienza energetica) Website N.A.203
Research Programme) 20112013 “Project of Interest”
(Period N.A.)
Tecnologica italiana delle Costruzioni, ANCE, Federcostruzioni
delle Costruzioni, ANCE, Federcostruzioni
(estimated)
GEISCA Insects and globalization sustainable control of exotic species in agroforest ecosystems (Insetti e globalizzazione:
controllo sostenibile di specie esotiche in ecosistemi agroforestali) http://cercauniversita.cineca.it/php5/prin/
cerca.php?codice=2010CXXHJE&testo=clima
MIUR PRIN 20102011
3 years (Period N.A.)
Bologna University
Bologna University, Milano University, Torino University, Catania University, Padova
University, Reggio Calabria “Mediterranea” University, CNR
661.500
GSLAISS Global Sea Level Rise & Antarctic Ice Sheet Stability predictions: guessing
future by learning from past
MAECI Dec. 2016 – Nov. 2017
OGS CMCC, CNRISMAR 90.000
IAMICA Infrastructure of High Technology for
Integrated Climate and Environmental Monitoring. http://www.iamica.it
MIURPON 2007
2013
Jan. 2012
Jul 2015
CNR ISAC CNR 12.047.000.
ICFAR Evaluation of the uncertainty associated with the projections of climate change
impact on Italian herbaceous cropping systems, through longterm observations and mathematical models of the farming
system, in support to adaptation strategies (Valutazione dell’incertezza associata alle previsioni di impatto dei cambiamenti climatici sui sistemi colturali erbacei italiani, attraverso osservazioni di lunga durata e modelli matematici di sistema colturale, a supporto di strategie
di adattamento)
http://cercauniversita.cineca.it/php5/prin/cerca.php?codice=2010FRE7J4&testo=clima
MIUR PRIN 20102011
3 years (Period
N.A.)
Sassari University
Sassari University, Bologna University, Basilicata University,
Padova University, Firenze University, Polytechnic Marche University, Torino University,
Udine, Pisa University, Perugia University, CNR
868.000
ICOS ETC ICOS Ecosystem Thematic Centre: CNR Nov. 2016 – CMCC University of Tuscia 160.000
203 Source: PNR (National Reasearch Programme) 2011-2013 (http://www.miur.it/Documenti/ricerca/pnr_2011_2013/PNR_2011-2013_23_MAR_2011_web.pdf).

271
gestione e coordinamento https://www.icosri.eu/icoscentralfacilities/icosetc
Dec. 2017
LO@DC Lidar Observatory @ Dome C MIURPNRA N.A. CNRISAC CNR N.A.
MALOX Mass lost in wind flux MIUR through PNRA
July 2014June 2016
ENEA ENEA, INAF, CNRISAC 267.000
METROPOLIS Metodologies and integrated sustainable technologies for the adaptation and safety
of urban system.
http://www.progettometropolis.it/
MIUR 2013 Stress District Consortium
CMCC n.d.
N.A. Bromine and mercury, cycles and
transport processes on the Antarctic plateau
Miur through PNRA 20182019 CNRIDPA CNRIDPA, ENEA, Univ. of
Venezia, CNR IIA
128.20
0
N.A. Climate change in the Mediterranean area: evolution scenarios, economic impacts, mitigation policies and technological innovation (I cambiamenti climatici nell’area del Mediterraneo:
scenari evolutivi, impatti economici,
politiche di mitigazione e innovazione tecnologica) http://cercauniversita.cineca.it/php5/prin/cerca.php?codice=2010S2LHSE&testo=clima
MIUR PRIN 20102011
3 years (Period N.A.)
Milano University Milano University, Ferrara University, Venezia University “Ca’ Foscari”, Roma University TRE, Padova University, Siena University, Catholic University
“Sacro Cuore”, Roma University
“Tor Vergata”, Roma University “La Sapienza”
496.824
N.A. CO2 excess in the geological past: responses of biota to global changes of
extreme heat and ocean acidification (Eccesso di CO2 nel passato geologico: risposte del biota a cambiamenti globali di caldo estremo e acidificazione degli
oceani) http://cercauniversita.cineca.it/php5/prin/cerca.php?codice=2010X3PP8J&testo=cli
ma
MIUR PRIN 20102011
3 years (Period
N.A.)
University of Milano
University of Milano, University of Modena and Reggio Emilia,
University of Padova, CNR, "Carlo BO"University of Urbino
421.887
N.A. Crisis and recovery of carbonate systems and the potential for the formation of reservoir: the roles of climate, tectonics
MIUR PRIN 20102011
3 years (Period N.A.)
University of Roma “La Sapienza”
University of Roma “La Sapienza”, University of Padova, University of Ferrara, University
279.226

272
and magmatism (Crisi e ripresa di sistemi carbonatici e potenziale per la formazione di reservoir: i ruoli di clima, tettonica e magmatismo) http://cercauniversita.cineca.it/php5/prin/cerca.php?codice=20107ESMX9&testo=clima
of Modena And Reggio Emilia, University of Milano
N.A. Dynamics of morphoclimatic systems in
response to global change and induced geomorphological hazards (Dinamica dei sistemi morfoclimatici in risposta ai
cambiamenti globali e rischi geomorfologici indotti) http://cercauniversita.cineca.it/php5/prin/
cerca.php?codice=2010AYKTAB
MIUR
PRIN 20102011
3 years
(Period N.A.)
Pisa University Pisa University, Bari University,
Modena and Reggio Emilia University, Torino University, Roma University “La Sapienza”,
Milano University, Padova University, INGV
488.690
N.A. Effects of climate on populations of species of fauna omeotermamodel: development of predictive models of climate change (Effetti del clima su popolazioni di speciemodello di fauna omeoterma: sviluppo di modelli predittivi legati ai cambiamenti climatici)
http://cercauniversita.cineca.it/php5/prin/cerca.php?codice=20108TZKHC&testo=clima
MIUR PRIN 20102011
3 years (Period N.A.)
Sassari University
Sassari University, Palermo University VareseComo “INSUBRIA” University, Pavia, CNR
672.187
N.A. Environmental variability, climatic changes and anthropic impacts: adaptive response in benthic species, communities and benthic systems https://www.researchitaly.it/en/understa
nding/projectandsuccessstories/mainprojects/adaptiveresponsestoenvironmentalvariabilityclimatechangesandanthropicimpacts
/
MIUR through PNRA
Jan. 2013 De. 2015
Stazione Zoologica Anton Dohrn (SZN)
SZN N.A.
N.A. Innovative methodologies for water resources management under scenarios of hydroclimatic uncertainty (Metodologie innovative per la gestione delle risorse
idriche in scenari di incertezza idroclimatica)
MIUR PRIN 20102011
3 years (Period N.A.)
Trento University Trento University; Modena and Reggio Emilia University, Padova University, Roma University "TRE” Milano University, Napoli
University “Federico II”, CNR
735.000

273
http://cercauniversita.cineca.it/php5/prin/cerca.php?codice=2010JHF437&testo=clima
N.A. Mechanisms that regulate biological processes and ecology of plankton https://www.researchitaly.it/en/understanding/projectandsuccessstories/mainprojects/mechanismsthatregulatebiologicalproc
essesandecologyofplankton/
MIUR through PNRA
Jan. 2013 De. 2015
Stazione Zoologica Anton Dohrn (SZN)
SZN N.A.
N.A. Italian Antarctic MeteoClimatological
Observatory at MZS and in the Victoria Land
MIUR through
PNRA
Feb. 2017
Feb. 2019
ENEA ENEA 70.300
N.A. Italian Antarctic MeteoClimatological Observatory at Concordia
MIUR through PNRA
Feb. 2017 Feb. 2019
ENEA ENEA 75.000
N.A. Influence of Antarctic ice sheet on Southern Hemisphere lowlatitude climate teleconnections across the PlioPleistocene transition (3,5Ma 2,5 Ma)
MIUR (PNRA) Jun. 2014 – Jun. 2016
CMCC INGV 80.000
NextData A national system for the retrieval, storage, access and diffusion of environmental and climate data from mountain and marine areas (Un sistema nazionale per la raccolta, conservazione, accessibilità e diffusione dei dati ambientali e climatici in aree montane e
marine) http://www.nextdataproject.it/?q=it
MIUR through PNR 20112013 “Project of Interest”
Jan. 2012 Dec. 2018
CNR CGI, CINECA, CNR, CMCC, ENEA, ICTP, INGV, Gran Paradiso National Park, Milano University Bicocca, Torino University
22.000.000
OASISYOPP Observations of the Arctic Stratosphere In Support of the Year Of Polar Prediction
MIUR through PNRA
July 2016Decem
ber 2018
INGV INGV, ENEA, Univ. of Rome Sapienza
113.000
OPLAM Open Lab per l’Atmosfera e il Mare Regione Lazio 20162018 CNRISAC CNR N.A.
PANACEA PANACEA – The role of frazil and PANcake ice in the mass and energy budgets of the AntarctiC sEA ice cover
MIUR Ministero dell'Istruzione, dell'Università e della Ricerca
20142016 CNRISAC CNR N.A.

274
PNACC Italian National Adaptation Plan MATTM May 2016 – May 2017
CMCC 430.000€
PNRA 2013/B3.01
Telerilevamento da satellite della tipologia di precipitazione sulla regione antartica
MIUR Ministero dell'Istruzione, dell'Università e della Ricerca
20142016 CNRISAC CNR N.A.
REACT IntegRated operational rEsponse forecasting system to mAjor offshore and
Coastal deepwater oil spill pollution
evenTs
Fondazione per il SUD
Oct. 2016 – Sep. 2020
CMCC 360.000
Ritmare Italian Research for the sea (Ricerca italiana per il mare) http://www.ritmare.it/en
MIUR through PNR 20112013 with cofinancing by Research Institutes “Flagship project”
Jan. 2012 Dec. 2017
CNR CNR, ENEA, CoNISMa, OGS, INGV, SZN, CINFAI
250 Million
SNAC Elements to develop a National
Adaptation Strategy to Climate Change http://www.cmcc.it/website/projects/snacelementstodevelopanationaladaptationstra
tegytoclimatechange
IMELS Jul. 2012
Jul. 2014
CMCC CMCC 180.000
SOLARICE Study of the Solar Forcing over the Holocene from a new Dome C Ice Core
MIUR through PNRA
20182019 University of MilanoBicocca
University of MilanoBicocca , ENEA, CNR, University of Parma
135.000
SOLAS Italy Surface Ocean Lower Atmosphere Study Future Earth 20152020 CNR http://www.isac.cnr.it/solas/participants
N.A.
START
SysTem of rApid mapping and monitoRing of coastal and marine environmenT The general objective of "START" project is to improve and consolidate the awareness and the knowledge of Apulian coastal environment integrating the observing systems with the operational and forecasting numerical modelling. The services will be integrated with technological platforms of dissemination
Apulia Region – Regional Technological Cluster
Dec. 2015 – May 2018
Links S.p.a. CMCC, University of Salento, ENSU
3.000.000

275
of information for the ‘Coastal Situational Awareness’.
STRAAPB Progetto di Ricerca 2013/AC3.06 Studio dei regimi radiativi sul plateau antartico
MIUR 20142016 CNRISAC CNR N.A.
SVAAP Study of the water vapour in the polar atmosphere
MIUR through PNRA
July 2014March 2017
ENEA ENEA, INGV, Univ. of Rome Sapienza
Total budget 81.000
TANGO TANGO –Tropospheric hAlogeNs from satellite Observations
MIUR Ministero dell'Istruzione, dell'Università e della Ricerca
20142016 CNRISAC CNR N.A.
TESSA Development of technologies for the “Situational Sea Awareness” http://www.seaconditions.com/web/tessa/home
MIUR through the National Operative Programme (PON) for Research and Competitiveness 20072013 and
cofunding by the
Research subsidy fund (FAR)
Jan. 2012 Dec. 2014
Links S.p.a. Links S.p.a., CMCC, CNRIAMC Total Budget: N.A.
CMCC: 6.665.754
TreeCity Designing the green city in the era of global change: functions of urban trees and their adaptability in future climate conditions (Progettare la città verde nell’era del cambiamento globale: funzioni
degli alberi urbani e loro adattabilità nelle future condizioni climatiche) http://cercauniversita.cineca.it/php5/prin/cerca.php?codice=20109E8F95&testo=cli
ma
MIUR PRIN 20102011
Next 3 years (Period N.A.)
Pisa University Pisa University, University of Tuscia, CNR, “Sacro Cuore” Catholic University, “La Sapienza” Rome University, Palermo University, Firenze
University, Trieste University
812.000
8.2.6 International Projects
Table 8.2 Relevant International Projects on climate process and climate system studies, including paleoclimate studies; modelling and prediction, including general circulation models; research on the impacts of climate change; socioeconomic analysis, including analysis of

276
both the impacts of climate change and response options; research and development on mitigation and adaptation technologies
Acronym Title and Web site Sponsor / Recipient Start date End Date
Coordinator Involved Italian Partner(s)
ACCENTPLUS Atmospheric Composition Change: the European NetworkPolicy Support and Science http://www.accentnetwork.org
EC, FP7 (ENVIRONMENT) Nov. 2010 Oct. 2014
CNRISAC CNRISAC, Urbino University “Carlo Bo”
ACLIMAS Climate Change Adaptation of the
Mediterranean Agricultural Systems http://www.aclimas.eu/
EC, Sustainable Water
Integrated Management – (SWIM) programme
Dec. 2011
Dec. 2014
Istituto
Agronomico Mediterraneo di
Bari (CIHEAMIAMB)
Mediterranean Agronomic
Institute of Bari (CIHEAMIAMB), CMCC, Institute for
Mediterranean Agriculture and Forest Systems (CNRISAFOM) of the National Research Council (CNRISAFOM)
ACTRISPPP Aerosol, Clouds and Trace gases Research
Infrastructure Network – Preparatory Phase Project
EC 20172019 CNRS France CNR
AFRICA – GHG The role of African tropical forests on the Greenhouse Gases balance of the atmosphere
http://www.cmcc.it/projects/africaghgtheroleofafricantropicalforestsonthegreenhousegasesbalanceoftheatmosphere2#anchor
partners
EC, FP7 (ERCIDEASERC) April 2010 March 2014
CMCC through UNITUS Università degli
Studi della Tuscia
AFRISCAT Technical Assistance for the Deployment of TowerBased Radar and Geophysical Measurements during the AfriScat Experiment
European Space Agency (ESA) Nov. 2014 – Apr. 2016
University of Paul Sabbatier
CMCC
AFV Arctic Fog Variability in a Warming Arctic and Its Impact on Maritime Human
Activities
Belmont Forum 2014 20152019 CNR CNR
AGRO ADAPT 2016
Service for local and economy wide assessment of adaptation actions in agriculture http://wateragora.eu/
ClimateKIC Oct. 2016 – Dec. 2017
CMCC CNRIBIMET, Fondazione Edmund Mach
AirSea Lab AirSea Lab: Climate air pollution CNR Joint Lab Project 20152017 CNRISAC CNR, ENEA

277
interaction in coastal environment
AMARE Actions for Marine Protected Areas https://amare.interregmed.eu/
Interreg MED 20142020 Nov. 2916 – Oct. 2019
CONISMA Consorzio Nazionale Interuniversitario per le Scienze del Mare
CMCC
AMPERE Assessment of Climate Change Mitigation Pathways and Evaluation of the
Robustness of Mitigation Cost Estimates http://ampereproject.eu
EC, FP7 (ENVIRONMENT) Feb. 2011 Jan. 2014
Potsdam Institut Fuer
Klimafolgenforschung (Germany)
FEEM
AtlantOS Optimizing and Enhancing the Integrated
Atlantic Ocean Observing System https://www.atlantosh2020.eu/
EC, Horizon 2020 Apr. 2015 –
Jun. 2019
GEOMAR
Helmholtz Centre for Ocean Research Kiel
CMCC
AVOID 2 The effects of incomplete and delayed participation on the cost of climate policy 2 http://www.avoid.uk.net/
UK Government Sep. 2014 – Jan. 2015
MET OFFICE CMCC
BACCHUS BACCHUS Impact of Biogenic versus Anthropogenic emissions on Clouds and
Climate: towards a Holistic UnderStanding
EC 20132018 ETHZurig ISACCNR
BASE Bottomup Climate Adaptation Strategies towards a Sustainable Europe http://www.baseadapt.eu/
EC, DG Research (CooperationEnvironment)
Oct. 2012 Sep. 2016
Aarhus Universitet (Denmark)
CMCC, ISPRA
BEOI Beyond EPICAOldest Ice http://www.beyondepica.eu
EC, H2020 Oct. 2016 Sep. 2019
AWI ENEA, University of Bologna
Blue Action Arctic Impact on Weather and Climate. http://www.blueaction.eu/index.php?id=3498
EC, H2020 Dec. 2016 –
Feb. 2021
DMI Danmarks
Meteorologiske Institut
CMCC
BLUEAP Bologna Local Urban Environment Adaptation Plan for Resilient City http://www.blueap.eu/site/en/
EC, LIFE+ Program Jan. 2014 – Jul. 2015
Municipality of Bologna
CMCC
BlueHealth Linking Up Environment, Health and EC, H2020 Jan. 2016 – Jun. 2020
University of Exeter
CMCC, Istituto Superiore di Sanità

278
Climate for Intersector Health Promotion and Disease Prevention in a Rapidly Changing Environment https://bluehealth2020.eu/
BOOSTER BLUE Economic instruments for sustainable water management and resilient growth
in water stressed areas
AXA Research Grant Oct. 2016 – Mar. 2018
CMCC
C3 ALPS C3Alps – Capitalising Climate Change Knowledge for Adaptation in the Alpine Space
http://www.c3alps.eu/index.php/it/
Interreg Alpine Space 20072013
Jan. 2012 Dec. 2014
Environment Agency Austria
Veneto Region, ARPA Piemonte, CMCC, European Academy of Bolzano
CASCADE Climate Change Impacts on WAter ReSources in the Coastal Zones of Small IslAnd Developing StatEs http://www2.sta.uwi.edu/cascade/
EC, EuropeAid (EuropeAid/130381/D/ACT/ACP)
Aug. 2012 Jul. 2014
UWI University of the West Indies
CMCC
CDLINKS Linking Climate and Development Policies Leveraging International Networks and Knowledge Sharing http://www.cdlinks.org/
EC, Horizon 2020 Sep. 2015 –
Aug. 2019 IIASA International Institute for Applied Systems Analysis
CMCC
CHAKE OU Strengthening of institutional and community preparedness and coordination capacities for disaster risk reduction in Paraguay
EC, DG ECHO Jul. 2016 – Feb. 2017
COOPI Cooperazione Internazionale
CMCC
CIRCLE2 Climate Impact Research and Response Coordination for a Larger Europe –
Science meets Policy http://www.circleera.net/
EC, FP7 (ENVIRONMENT) ERANet2009RTD
May 2010 Apr. 2014
Fundacao Da Faculdade De
Ciencias Da Universidade De Lisboa (Portugal)
CMCC
ClimAfrica Climate change predictions in SubSaharan Africa: impacts and adaptations http://www.climafrica.net/index_en.jsp
EC, FP7 (ENVIRONMENT) Oct. 2010 Sep. 2014
CMCC CMCC
CLIMATE FOR CULTURE
Damage risk assessment, economic impact and mitigation strategies for sustainable preservation of cultural
heritage in the times of climate change
EC, FP7 (ENVIRONMENT) Nov. 2009 Oct. 2014
FraunhoferGesellschaft Zur Foerderung Der
Angewandten
CNR, Fondazione Salvatore Maugeri Clinica Del Lavoro E Della Riabilitazione

279
http://www.climateforculture.eu/ Forschung E.V (Germany)
CLIMRUN Local Climate Informations to Respond to Users Needs http://www.climrun.eu
EC, FP7 (ENVIRONMENT) Mar. 2011 Feb. 2014
ENEA ENEA, CMCC, ICTP
CLIMTOUR Operational climateservice for European tourism operators
ECMWF Oct. 2017 Apr 2019
TOURISME TRANSPORT TERRITOIRES
ENVIRONNEMENT CONSEIL(TEC)
(France)
ENEA, CMCC
COBHAM The role of consumer behavior and heterogeneity in the integrated assessment of energy and climate policies http://www.cobhamerc.eu/"
EC, FP7 Aug. 2014 – Jul. 2019
POLIMI Politecnico di Milano
CMCC
COMPASS Concordia MultiProcess Atmospheric Studies
MIUR 2016 CNRISAC CNR
CONNECTinGEO Coordinating an Observation Network of
Networks EnCompassing saTellite and
INsitu to fill the Gaps in European Observations http://www.connectingeo.net/
EC, Horizon 2020 Feb. 2015 –
Jan. 2017
Centro de
Investigacion
Ecologica y Aplicaciones Forestales
CMCC
COP 21 RIPPLES COP21: Results and Implications for Pathways and Policies for Low Emissions European Societies https://www.cop21ripples.eu/
EC, Horizon 2020 Dec. 2016 – Nov. 2019
IDDRI Fondation Institut de Recherche pour le Developpement
Durable et les Relations Internationales
CMCC, ENEA
Copernicus Copernicus – ECMWF (Climate Toolbox) EC 20162019 CNRISAC CNR
Copernicus 23GLORAN
Copernicus Global Ocean Reanalysis http://marine.copernicus.eu/
Mercator Ocean Apr. 2016 – Dec. 2018
CMCC
CMEMS BS MFC Copernicus Black Sea Monitoring Forecasting Centre
http://marine.copernicus.eu/
Mercator Ocean Apr. 2016 – Apr. 2018
IOBAS Institute of Oceanology Bulgarian Academy of
CMCC

280
Sciences
CMEMS MED MFC Copernicus Mediterranean Monitoring Forecasting Centre
http://marine.copernicus.eu/
Mercator Ocean May 2015 – Apr. 2018
CMCC INGV, OGS
CORDEX4CDS CORDEX for the Copernicus Data Store C3S_34b Lot 1 Copernicus Climate Change Service
Jun2017Apr. 2021
ECMWF ENEA
COSTADAPT Adaptation service for regional assessment of climate risks
ClimateKIC Jul. 2015 – Dec. 2015
CMCC
CRESCENDO Coordinated Research in Earth Systems
and Climate: Experiments, kNowledge, Dissemination and Outreach https://www.crescendoproject.eu
EC, H2020 Nov. 2015
Oct. 2020
University of Leeds
(UK)
CMCC, ENEA, CNR
DEMOCLOCK Demonstration of a cost effective medium size Chemical Looping Combustion
through packed beds using solid hydrocarbons as fuel for power production with CO2 capture http://www.sintef.no/Projectweb/DemoClock/
EC, FP7(ENERGY) Jun. 2011 May 2015
Stiftelsen Sintef (Norway)
Milano Polytechnic, Foster Wheeler Italiana SRL
DYNAMIX DYNAmic policy MIXes for absolute decoupling of environmental impact of EU resource use from economic growth
http://dynamixproject.eu/
EC, FP7 (ENVIRONMENT) Sept 2012 Dec. 2015
Ecologic Institute (Germany)
CMCC (formally through FEEM)
EC2 The EuropeChina Clean Energy Center http://www.ec2.org.cn/
European Commission, National Energy Administration of China and the Ministry of Commerce of China, with the support of the IMELS.
Apr. 2010 Mar. 2015
POLITO Politecnico di Torino
POLITO Politecnico di Torino, UNICAL Università della Calabria, CMCC
ECEM European Climatic Energy Mixes
http://ecem.climate.copernicus.eu/
Copernicus Climate Change
Service (C3S) – Sectorial Information Systems (SIS)
Nov.
2016Jan 2018
University of East
Anglia (United Kingdom)
ENEA
ECLISE Enabling CLimate Information Services for
Europe http://www.ecliseproject.eu/
EC, FP7 (ENVIRONMENT) Feb. 2011
Jan. 2014
Koninklijk
Nederlands Meteorologisch Instituut KNMI (Nederland)
CNR

281
ECMWF C3S_433 Seasonal Forecasts
Seasonal Forecast ECMWF Jan. 2016 – Mar. 2018
CMCC
ECONADAPT Economics of climate change adaptation
in Europe http://www.bath.ac.uk/ipr/events/news0024.html
EC, FP7 (ENVIRONMENT) Oct. 2013
Sep. 2016
University of Bath
(United Kingdom)
CMCC
ECOPOTENTIAL Improving future ecosystem benefits through Earth Observations www.ecopotentialproject.eu
EC, H2020 June 2015 May 2019
CNR EURAC, University of Salento, Polytechnic of Milano
ENHANCE Enhancing risk management Partnerships for catastrophic natural disasters in Europe
http://enhanceproject.eu/
EC, FP7 (ENVIRONMENT) Dec. 2012 Nov. 2016
IVM (The Nerthlands)
CMCC (formally through FEEM), ARPA EmiliaRomagna
EP FWC Lot 2 Provision of external expertise on regulatory and policy issues in the field of Climate Change (Lot 2)
European Parliament Milieu CMCC
ERA4CS ERANET Cofund for Climate services http://www.jpiclimate.eu/ERA4CS
EU, H2020 (ERANET) Jan 2016 Dec 2020
ANR France CNR, CMCC
ERACLIM2 European Reanalysis of the Global Climate
System http://www.eraclim.eu/
EC, FP7 Jan. 2014 –
Dec. 2016 ECMWF CMCC
ESiWaCE Excellence in Simulation of Weather and Climate in Europe
https://www.esiwace.eu/
EC, Horizon 2020 Sep. 2015 – Aug. 2019
DKRZ Deutsches Klimarechenzentru
m
CMCC
ETCCCA 20142018 European Topic Centre on Climate Change impacts, vulnerability and adaptation 20142018 http://cca.eionet.europa.eu/
European Environment Agency Jan. 2014 – Dec. 2018
CMCC
ETCICM 20142018 European Topic Centre on Inland, coastal
and marine waters 20142018 http://icm.eionet.europa.eu/
European Environment Agency Jan. 2014 –
Dec. 2018 Helmholtz Zentrum für Umweltforschung (UFZ)
CMCC
EU CISE 2020 EUropean test bed for the maritime Common Information Sharing
EC, FP7 Dec. 2014 –
Mar. 2017 Agenzia Spaziale Italiana (ASI)
CMCC

282
Environment in the 2020 perspective http://www.eucise2020.eu/
EUBrazilCC EUBrazil Cloud Connect
http://www.eubrazilcloudconnect.eu/ (Further info: http://www.cmcc.it/projects/eubrazilcceubrazilcloudconnect )
Small or mediumscale focused
research project (STREP) partially funded by the European Commission under the Cooperation Programme, Framework Programme Seven (FP7)
Oct. 2013
Sep. 2015
Universidad
Politécnica de Valencia Centro Valenciano de Estudios del Riego (UPV)
CMCC
EUBRABIGSEA Europe Brazil collaboration of big data
scientific research through cloudcentric
applications http://www.eubrabigsea.eu/
EC, Horizon 2020 Jan. 2016 –
Dec. 2017
Universitat
Politecnica de
Valencia (UPV)
CMCC, Polytechnic of Milan
(POLIMI)
EUFAR European Facility for Airborne Research EC 20142018 UK Met Office CNR
EUMACS European Market for Climate Services http://eumacs.eu/#
EC, Horizon 2020 Nov. 2016 – Oct. 2018
FMI Finnish Meteorological Institute
CMCC, CNRIRSA
EUPORIAS European Provision Of Regional Impacts Assessments on Seasonal and Decadal Timescales
http://www.euporias.eu/
EC, FP7(ENVIRONMENT) Nov. 2012 Jan. 2017
UK Met Office ENEA, WORLD FOOD PROGRAMME Italy
EUROAGRIWAT Assessment of EUROpean AGRIculture
WATer use and trade under climate change http://www.costes1106.eu/
EU RTD Framework
Programme COST Action ES1106
Apr. 2012
Apr. 2016
University of
Firenze
University of Firenze, CRA, INEA
EUROCHAR Biochar for Carbon sequestration and largescale removal of greenhouse gases (GHG) from the atmosphere http://www.eurochar.org/
EC, FP7 (ENVIRONMENT) Jan. 2011 Jun. 2014
CNR CNR, A.G.T. Advanced Gasification Technology, Bolzano University
EUROFLEETS New operational steps towards an alliance of European research fleets
http://www.eurofleets.eu/np4/home.html
Research Infrastructures project under the EC FP7
(Combination of Collaborative project and Coordination and Support Actions for Integrating Activities)
Mar. 2013 Feb. 2017
Ifremer French Research Institute
for Exploitation of the Sea
OGS, CNR
FICC An analysis of indirect impacts of Climate SYKE Suomen Ymparistokeskus
May 2015 – Feb. 2016
CMCC

283
Change on the Finnish society
GEOC Geo Carbon and GHG Initiative
www.earthobservations.org/activity.php?id=113
GEO – Group on Earth
Observations
2016 CMCC CMCC
GEOCARBON Operational Global Carbon Observing
System http://www.geocarbon.net/
EC, FP7 (ENVIRONMENT) Oct. 2011
Sep. 2014
CMCC CMCC, Second University of
Napoli, University of Tuscia
GLOBAL IQ Impacts Quantification of global changes http://www.globaliq.eu/
EC, FP7(SSH ) Aug. 2011 Jul. 2014
Toulouse School of Economics TSE
CMCC (formally through FEEM), Institute of Studies for the
Integration of Systems (Istituto di Studi per l’Integrazione dei Sistemi – ISIS)
GNSS4SWEC Advanced Global Navigation Satellite Systems tropospheric products for
monitoring severe weather events and climate http://www.cost.eu/domains_actions/essem/Actions/ES1206?
EU RTD Framework Programme
COST Earth System Science and Environmental Management (ESSEM) Action ES1206
May 2013 May 2017
UK Met Office Centre for Space Geodesy / Italian Space Agency
GREENSEAS Development of global plankton database
and model system http://greenseas.nersc.no/home
EC, FP7 Jan. 2011
Jun. 2014
NERSC Stiftelsen
Nansen Senter for Fjernmaaling
CMCC
GROOM Gliders for Research, Ocean Observation
and Management http://www.groomfp7.eu
EC, FP7 Oct. 2011
Sep. 2014
Université
PierreetMarieCurie (UPMC)
NATO Undersea Research Center
(NURC), OGS
HAITI Technical assistance for the support programme to take climate change into account in the national development of Haiti
EC, EuropeAid Agriconsulting CMCC
HIMALAYAN BROWN CARBON
HimalayaBrownCarbon Quantification and source apportionment of brown carbon aerosols in the high Himalayas
EC European Commission 20142016 CNRISAC CNR ISAC
HiMetCom Exploiting HIghfrequency bands by
radioMETeorological modeling and Suntracking microwave radiometry for satellite COMmunications and site diversity optimization
Air Force Research Laboratory 23 Dec 2016
to 22 Dec 2017
CNRISAC CNR

284
HSAF Federated Activity H_SAF_FA15_01
Cooperation on the use of combined spaceborne active and passive MW observations for precipitation retrieval
EUMETSAT 20152017 CNRISAC CNRISAC
IBECA (Albania) Technical assistance for institution building of the Ministry of Environment in enforcing environmental and climate ‘acquis’ – Albania
EC, EuropeAid (IPA National Program 2013)
Jun. 2015 – Dec. 2017
Agrotec CMCC
ICARUS Integrated Climate forcing and Air pollution Reduction in Urban Systems http://icarus2020.eu/
EC, Horizon 2020 May 2016 –
Apr. 2018
Aristotelio Panepistimio Thessalonikis
CMCC, EUC (Centro Europeo di
Formazione e Ricerca in Ingegneria Sismica)
ICEARC Ice, Climate, and Economics Arctic Research on Change
EC 20142017 British Antarctic Survey
CNRISAC
ICOSESFRI Integrated Carbon Observing System
www.icosri.eu/
EC, ESFRI infrastructure 20152035 ICOSERIC
CNR, CMCC , CREA , ENEA, ARPA, FEEM, University of Tuscia , University of Sassari, University of Padua, University of Genoa, University of Sacro CuoreMilano, Autonomous Province of Bolzano,
University of Udine ,OGS
INDIGOData Cloud
INtegrating Distributed data Infrastructures for Global ExplOitation https://www.indigodatacloud.eu/
EC, Horizon 2020 Apr. 2015 – Sep. 2017
INFN CIRMMP, CMCC, CNR, ICCU, INAF, INGV
INDOMARECLIM IndoEuropean research facilities for studies on marine ecosystem and climate
in India http://www.indomareclimnerci.in/
EC, FP7 (EU INCO.20117.3 India Cooperation Programme)
Feb. 2012 Jan. 2015
NERCI Nansen Environmental
Research Centre India Ltd
CMCC
INNOPATHS Innovation pathways, strategies and policies for the LowCarbon Transition in Europe
http://www.innopaths.eu/
EC, Horizon 2020 Dec. 2016 – Nov. 2020
UCL University College London
CMCC, European University Institute
INTACT On the impact of extreme weather on critical infrastructues http://www.intactproject.eu/
EC, FP7 May 2014 – Apr. 2017
TNO Netherlands Organisation for Applied Scientific Research
CMCC
ISENES 2 Infrastructure for the European Network EC DG Research Apr. 2013 Centre National de CMCC
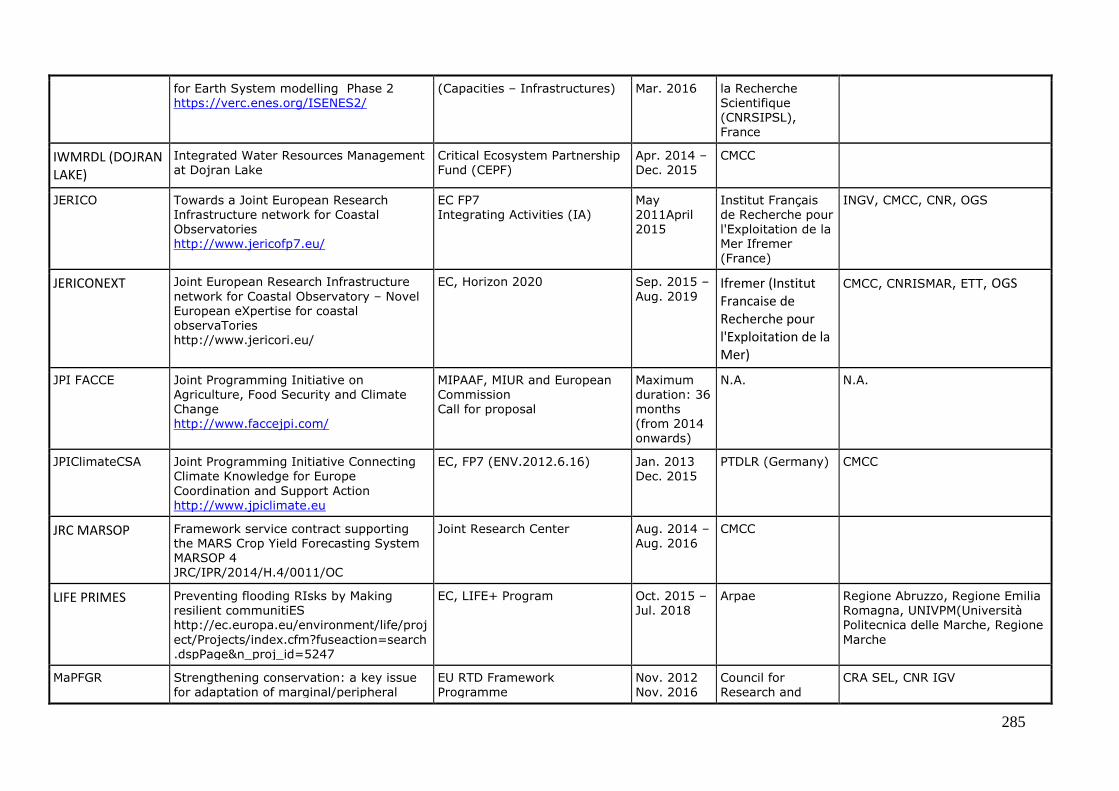
285
for Earth System modelling Phase 2 https://verc.enes.org/ISENES2/
(Capacities – Infrastructures) Mar. 2016 la Recherche Scientifique (CNRSIPSL), France
IWMRDL (DOJRAN LAKE)
Integrated Water Resources Management at Dojran Lake
Critical Ecosystem Partnership Fund (CEPF)
Apr. 2014 – Dec. 2015
CMCC
JERICO Towards a Joint European Research Infrastructure network for Coastal Observatories http://www.jericofp7.eu/
EC FP7 Integrating Activities (IA)
May 2011April 2015
Institut Français de Recherche pour l'Exploitation de la Mer Ifremer
(France)
INGV, CMCC, CNR, OGS
JERICONEXT Joint European Research Infrastructure
network for Coastal Observatory – Novel European eXpertise for coastal observaTories http://www.jericori.eu/
EC, Horizon 2020 Sep. 2015 –
Aug. 2019 Ifremer (Institut Francaise de Recherche pour l'Exploitation de la Mer)
CMCC, CNRISMAR, ETT, OGS
JPI FACCE Joint Programming Initiative on Agriculture, Food Security and Climate Change
http://www.faccejpi.com/
MIPAAF, MIUR and European Commission Call for proposal
Maximum duration: 36 months
(from 2014 onwards)
N.A. N.A.
JPIClimateCSA Joint Programming Initiative Connecting Climate Knowledge for Europe
Coordination and Support Action http://www.jpiclimate.eu
EC, FP7 (ENV.2012.6.16) Jan. 2013 Dec. 2015
PTDLR (Germany) CMCC
JRC MARSOP Framework service contract supporting the MARS Crop Yield Forecasting System MARSOP 4 JRC/IPR/2014/H.4/0011/OC
Joint Research Center Aug. 2014 – Aug. 2016
CMCC
LIFE PRIMES Preventing flooding RIsks by Making resilient communitiES http://ec.europa.eu/environment/life/proj
ect/Projects/index.cfm?fuseaction=search.dspPage&n_proj_id=5247
EC, LIFE+ Program Oct. 2015 – Jul. 2018
Arpae Regione Abruzzo, Regione Emilia Romagna, UNIVPM(Università Politecnica delle Marche, Regione
Marche
MaPFGR Strengthening conservation: a key issue for adaptation of marginal/peripheral
EU RTD Framework Programme
Nov. 2012 Nov. 2016
Council for Research and
CRA SEL, CNR IGV

286
populations of forest tree to climate change in Europe http://www.cost.eu/domains_actions/fps/Actions/FP1202?parties
COST Action FP1202 Experimentation on Agriculture, Research Centre fo Forestry (CRA SEL)
MED SEA CHECK POINT
Growth and innovation in ocean economy Gaps and priorities in sea basin
observation and data
EC, DG MARE Oct. 2015 – Dec. 2016
CMCC
MEDGOLD Turning climaterelated information into added value for traditional MEDiterranean
Grape, OLive and Durum wheat food systems
EC, Horizon 2020 (SC5012017) Dec. 2017 Dec. 2021
ENEA ENEA,CNR, Barilla, Beetobit, Horta srl, CREA (third party of
ENEA)
MEDNICE MED programme Networks for an Innovative Cooperation in Energy efficiency https://efficientbuildings.interregmed.eu/
Interreg MED 20142020 Nov. 2016 – Oct. 2019
Metropole Nice Cote d’Azur
CMCC
MEDSEA MEDiterranean Ocean Acidification in a changing climate http://medseaproject.eu/
EC, FP7 (ENVIRONMENT) Feb. 2011 Jan. 2014
Universitat Autonoma De Barcelona
CMCC, OGS, CoNiSMa
MEXICO Laguna Tabasco
Plan of Adaptation Measures to reduce Vulnerability of Lagoon System CarmenPajonalMachona, Tabasco, to Impacts created by Climate Change and
Human Activities
Government of Mexico Dec. 2014 – Oct. 2015
Thetis CMCC
MILES Improve modelling capacity to support low emission development strategies
EC, EuropeAid Sep. 2014 – Sep. 2017
IDDRI Fondation Institut de Recherche pour le Developpement Durable et les Relations
Internationales
CMCC
MYOCEAN 2 Prototype Operational Continuity for
GMES Ocean Monitoring and Forecasting System http://www.myocean.eu/
EC, FP7 (SPACE) Apr. 2012
Oct. 2014
Mercator Ocean
(France)
CMCC, CNR, ENEA, INGV, ISPRA,
OGS, Italian Air Force Met Service
OceanCOST Evaluation of Ocean Syntheses COST (European Cooperation in Science and Technology)
Jul 2014 – May 2018
University of Liege CMCC

287
ODISHA RMSI Non Lending Technical Assistance to Support Implementation of Odisha State Climate Action PlanUrban Resilience
World Bank Oct. 2014 – Sep. 2015
CMCC
ORIENTGATE A structured network for integration of climate knowledge into policy and territorial planning http://www.orientgateproject.org/
Interreg South East Europe 20072013
Jul. 2012 Dec. 2014
CMCC CMCC
PAST4FUTURE Climate change Learning from the past
climate http://www.past4future.eu/
EC, FP7 (ENVIRONMENT) Jan. 2010
Dec. 2014
Københavns
Universitet (Denmark)
CNR
PEGASOS PanEuropean GasAeroSolclimate interaction Study http://pegasos.iceht.forth.gr/
EC, FP7 (ENVIRONMENT) Jan. 2011 Dec. 2014
Foundation For Research And Technology Hellas (Greece)
CNR
PERSEUS Policy oriented marine Environmental Research in the Southern European Seas http://www.perseusnet.eu
EC, FP7 (ENVIRONMENT) Jan. 2012 Dec. 2015
Hellenic Center For Marine Research (Greece)
CMCC, CoNISMa, CNR, ENEA, OGS, SZN, CLU srl
PLACARD Platform for Climate Adaptation and Risk reduction http://www.placardnetwork.eu/
EC, Horizon 2020 May 2015 –
Apr. 2020 FFCUL Faculdade de Ciências da Universidade de Lisboa
CMCC
PRIMAVERA PRocessbased climate sIMulation: AdVances in highresolution modelling and European climate Risk Assessment https://www.primaverah2020.eu/"
EC, Horizon 2020 Nov. 2015 – Oct. 2019
Met Office CMCC
PROLINE Efficient Practices of Land Use Management Integrating Water Resources Protection and Nonstructural Flood Mitigation Experiences http://www.interregcentral.eu/Content.Node/PROLINECE.html
Interreg Central Europe 20142020
Jul. 2016 – Jun. 2019
Austrian Federal Ministry of Agriculture, Forestry, Environment and Water Management
CMCC, Arpae
PURGE Public health impacts in URban
environments of Greenhouse gas
EC, FP7 (ENVIRONMENT) Feb. 2011
Jul. 2014
London School Of
Hygiene And
FEEM

288
Emissions reduction strategies http://purge.lshtm.ac.uk/
Tropical Medicine (UK)
RISESAM Responses to coastal climate change: Innovative Strategies for high End Scenarios – Adaptation and Mitigation http://www.cmcc.it/it/projects/risesamresponsestocoastalclimatechangeinnovativest
rategiesforhighendscenariosadaptationandmitigation
EC, FP7 (ENVIRONMENT2013twostage)
Nov. 2013 Oct. 2016
UPC Universitat Politècnica de Catalunya
CMCC
S2S4E Subseasonal to Seasonal climate
forecasting for Energy
EC, Horizon 2020 (SC501 RIA) Dec 2017 –
Dec 2020
Barcelona
Supercomputing Center (BSC)
ENEA
SeaBasin checkpoints Lot 4. Black Sea
SeaBasin checkpoints Lot 4. Black Sea (MARE/2014/09)
EC, DG MARE Aug. 2015 – Jul. 2018
IOBAS Institute of Oceanology, Bulgarian
Academy of Sciences
CMCC
SECLIFIRM The Added Value of Seasonal Climate Forecasts for Integrated Risk Management Decisions
EC, Horizon 2020 Feb. 2018 Jan 2022
University Of East Anglia (United Kingdom)
ENEA, ENEL, Accademia Europea di Bolzano
SECTEUR (ECMWF C3S_52)
Secteur engagement for the Copernicus Climate Change service: translating European User Requirements http://climate.copernicus.eu/secteur
ECMWF May 2015 – Aug. 2017
IEA Institute for Environmental Analytics at the University of
Reading
CMCC
SIOS Svalbard Integrated Earth Observing System
EC 20152019 CNRISAC
SOCLIMPACT DownScaling CLImate imPACTs and decarbonisation pathways in EU islands, and enhancing socioeconomic and nonmarket evaluation of Climate Change for Europe, for 2050 and beyond
EC, Horizon 2020 Jan. 2018 – Dec. 2020
The University of Las Palmas de Gran Canaria
ENEA, CMCC
SPECS Seasonal to decadal climate prediction for the improvement of European Climate Services http://www.specsfp7.eu/SPECS/Home.ht
EC, FP7 20122017 Fundació Institut Català de Ciències del Clima (IC3), Spain
ENEA

289
ml
SQUARE4ECVs Scientific Quality Assessment and Reports for Essential Climate Variables
ECMWF C3S_511 Copernicus Climate Change Service
Nov.2017 Oct.2021
CNR CNR, ENEA ( as Subcontractor)
21MEDCMEMS StatisticalDynamical Observation Operator for SST Data Assimilation
Mercator Ocean Mar. 2016 – Feb. 2018
CMCC
StratoClim Stratospheric and upper tropospheric processes for better climate predictions
EC European Commission 20132018 AWI
HelmholtzZentrum für Polarund Meeresforschung
CNRISAC
STRATUS Environmental Strategies for Sustainable Tourism
20142020 INTERREG VA Italy – France (Maritime)
Feb. 2017 – Feb 2019
Università degli Studi di Cagliari CIREM Sez.CRENoS
ENEA, Area Marina Protetta “Capo Carbonara”, POLISTE S.r.l
TangoSAT Study of L and Pband SAR Tomography Synergies
European Space Agency (ESA) Nov. 2014 –
Mar. 2015
Polytechnic of
Milan (POLIMI)
CMCC
TOSCA Towards a more complete assessment of
the impact of solar variability on the Earth’s climate http://lpc2e.cnrsorleans.fr/~ddwit/TOSCA
/Home.html
EU RTD Framework
Programme COST Action ES1005
May 2011
May 2015
LPC2E CNRS
University of Orleans (France)
INAF Astronomical Observatory in
Rome, University of L’Aquila
UHI Urban Heat Island Development and application of mitigation and adaptation strategies and measures for counteracting the global Urban Heat Islands phenomenon http://www.euuhi.eu/
Interreg Central Europe 20072013
Oct. 2011 Apr. 2014
Regional Agency for Environment Protection in EmiliaRomagna (ARPA EmiliaRomagna)
ARPA EmiliaRomagna, Emilia Romagna Region, Veneto Region, Consortium for Coordination of Research Activities Concerning the Venice Lagoon System (CORILA)
UV4growth UVB radiation: A specific regulator of
plant growth and food quality in a changing climate http://www.ucc.ie/en/uv4growth/
EU RTD Framework
Programme COST Action FA0906
Apr. 2010
Apr. 2014
University Colege
Cork (Ireland)
Italy
VALUE Validating and Integrating Downscaling Methods for Climate Change Research http://www.valuecost.eu/
EU RTD Framework Programme COST Action ES1102
Dec. 2011 Dec. 2015
Agencia Estatal de Meteorología (Spain)
HydroMeteoClimatological Service of the Italian EmiliaRomagna Region

290
VECTORS Vectors of Change in Oceans and Seas Marine Life, Impact on Economic Sectors http://www.marinevectors.eu/
EC, FP7(OCEAN) Feb. 2011 Jan. 2015
Plymouth Marine Laboratory, Plymouth, UK.
CONISMA, CNRIAMC, CMCC (formally through FEEM), Pisa University, Pavia University, OGS
WatEnerCast Adapt, thorugh tailored weatherrelated forecast, the water and energy operations to the increased weather fluctuations and to climate change
http://www.climatekic.org/projects/watenercast/
ClimateKIC Jan. 2015 – Dec. 2017
ARIA Tecnologies CMCC

291
8.3 Systematic observation
A comprehensive observational network, used also for climate studies, covers the Italian territory.
Furthermore, Italy contributes significantly to international programmes involving land, ocean and
spacebased measurements by means of its very long instrumental temperature record. Italy also fully
participates to the GCOS Surface Network (GSN), the GCOS Upper Air Network (GUAN) and the GAW
(Global Atmospheric Watch). More, Italy is actively contributing to longterm observations of polar
regions, both in Antarctica in the frame of PNRA programme that in the Arctic thanks to the station
Dirigibile Italia and its observing platforms in Ny Alesund (Svalbard),all managed and supported by CNR,
and activities in Thule (Greenland) supported by PNRA (see below for more details). All national
observations and data sets that have been declared as contributions to GCOS or GAW are regularly
submitted to the appropriate Data Centres.
8.3.1 Atmospheric Climate Observing System, including those measuring atmospheric
constituents
The Italian observing network is managed by several institutions and agencies: the Agrarian Research
Council, the Italian Air Force Meteorological Service, ENEA, CNR, ISPRA, several Universities, the Civil
Protection and the Regional Environmental Agencies. All together they compose the national system and
they also contribute to the international network.
Agrarian Research Council
The Agrarian Research Council–Climatology and Meteorology applied to Agriculture (CRACMA,
http://cma.entecra.it/homePage.htm) manages a network of about 83 agrometeorological stations and
observatories, most of which include very long historical data of daily minimum and maximum
temperature and precipitation. Other meteorological data are collected by Regional EnvMetAgro Agencies
(see Table 8.3).
Italian Air Force Meteorological Service
The Italian Air Force Meteorological Service (http://www.meteoam.it) manages a network of 72 manned
surfacestations and of 58 automatic surfacestations (57 Data Collection Platforms + 1 SWS). Other
meteorological data are collected by the National Agency for Aviation Aids (ENAV, http://www.enav.it),
which operates a network of 35 stations. Most of these data is distributed through the GTS and ICAO
networks.
Table 8.3 The Italian meteorological observation networks
Administration Station type Number Network/Circuit Average
timelength of records
Air Force Met Service surfacemanned 72 WMOGTS, ICAOAFTN ~ 63 years
Air Force Met Service surfaceautomatic (DCP)
57 synoptic use ~ 11 years (not continuously)

292
Air Force Met Service surfaceautomatic
(SWS)
1 WMOGTS, ICAOAFTN More than 2
years
Air Force Met Service surface solar radiation
and sunshine
40 WMOGTS ~ 55 years
ENAV surfacemanned ~ 35 WMOGTS, ICAOAFTN ~ 63 years
CRACMA surfacemanned ~ 20 agromet
and climatological use
~ 60 years
CRACMA surfaceautomatic ~ 43 agromet
and climatological use
~ 15 years
CRACMA thermalrain ~ 20 agromet and climatological use
~ 60 years
Regional EnvMet Agencies surfaceautomatic ~ 50 per region
met/climaological local use
~ 20 years
Regional AgroMet Services surfaceautomatic ~ 50 per region
agromet and climatological local use
~ 20 years
Italy contributes to GCOS Surface Network (GSN) with five stations of the Air Force Met Service (see Table 8.4).
Table 8.4 The Italian GCOS Surface Network (GSN) stations
Station WMO Index
Station Name Latitude (°, ')
Longitude (°, ')
Elevation (m a.s.l.)
Measurements since
16022 PAGANELLA 46, 08 11, 02 2129 1951
16134 MONTE CIMONE 44, 12 10, 42 2173 1946
16224 VIGNA DI VALLE 42, 05 12, 13 266 1954
16258 MONTE SANT’ANGELO 41, 42 15, 57 847 1952
16550 CAPO BELLAVISTA 39, 56 9, 43 150 1951
The Italian Air Force Met Service has developed a new Standard Weather System (SWS), based on the
EUMETNET AWS (automatic weather station) Program requirements, in order to substitute gradually the
acquisition tool and sensors in each meteorological station. The system is able to operate both in manual
and fully automatic way, with possibility to interface, in a simple way, every digital sensor and to monitor
and regulate the functioning of its devices through a local or remote control. The implementation
program started on 1st April 2015 and it’s on its way on.
The Italian Air Force Meteorological Service collects atmospheric routine CO2 measurements on the top of
Mt. Cimone (2173 m a.s.l.) since March 1979, the longest in continuum record in Europe, and
stratospheric O3 in three stations: Sestola (1020 m a.s.l., close to Mt. Cimone), Vigna di Valle and
Messina by means of spectrophotometers Dobson and Brewer. Ozone data are regularly transmitted to
the Canadian WOUDC (World Ozone and Ultraviolet Radiation Data Centre,
http://www.woudc.org/index_e.html). A comprehensive overview concerning the special observations
carried out by the Air Force Meteorological Service is shown in Table 8.6.
The Italian upperair observation network is shortly summarized in Table 8.5. The Air Force Met Service
contributes to GCOS UpperAir Network (GUAN) with one station (see Table 8.6).
Table 8.5 The Italian upperair observation network

293
Administration Station
type
Number Network/Circuit Average timelength of
records
Air Force Met Service upperair 6 WMOGTS ~ 60 years
Regional EnvMet Services upperair 2 WMOGTS ~ 20 years
Table 8.6 The Italian GCOS Upperair Network (GUAN) station
Station WMO Index Station Name Latitude (°, ')
Longitude (°, ')
Elevation (m a.s.l.)
Measurements since
16245 PRATICA DI MARE 41, 39 12, 26 21 1986
Figure 8.1 The Italian Air Force Met Service solar radiation (a) and sunshine duration (b) networks
(a) (b)

294
Table 8.7 The Italian GAW stations on national territory
GAWID Station Name Station Type
Administration Elevation (m a.s.l.)
AST Aosta Contributing Arpa Valle d’Aosta 569
CEO CETEMPS/DSFC Università Degli Studi dell’Aquila
Contributing CETEMPS/DSFC Università Degli Studi dell'Aquila (http://cetemps.aquila.infn.it)
656
POT CNRIMAA Atmospheric Observatory (CIAO)
Contributing CNRIMAA Atmospheric Observatory (CIAO, http://www.ciao.imaa.cnr.it)
760
IPR Ispra Regional Joint Research Centre (JRC), located at Ispra (http://abcis.jrc.ec.europa.eu/index.php)
209
LMP Lampedusa Regional ENEA 45
LMT Lamezia Terme Regional National Research Council Institute for Atmospheric Science and Climate (CNRISAC)
6
ECO Lecce Regional National Research Council Institute for Atmospheric Science and Climate (CNRISAC)
36
CUR Monte Curcio Regional National Research Council Institute of Atmospheric Pollution Research (CNRIIA) (http://mtcurcio.iia.cnr.it)
1780
MES
Messina Regional Italian Air Force Met Service 54
CMN
Monte Cimone Global Italian Air Force Met Service 2165
CGR Capo Granitola Regional National Research Council Institute for
Atmospheric Science and Climate (CNRISAC)
5
MLI Montelibretti Contributing National Research Council Institute for
Atmospheric Pollution (CNRIIA)
http://www.iia.cnr.it)
48
PRS Plateau Rosa Italian Air Force Met Service 3480
ROM Rome University Regional Sapienza University of Rome 75
SML S.Maria di Leuca Regional Italian Air Force Met Service 104
SES Sestola Regional Italian Air Force Met Service 1030
TRP Trapani Regional Italian Air Force Met Service 7
VDV Vigna di Valle Regional Italian Air Force Met Service 262
VTB Viterbo Regional Italian Air Force Met Service 300
Paganella Italian Air Force Met Service 2129
Monte S.Angelo Italian Air Force Met Service 848
Capo Caccia Italian Air Force Met Service 204
Ustica Italian Air Force Met Service 243
Cooperation between the Department of Civil Protection (DPC), the Air Force Met Service and the Regions
allowed the Italian radar network project to start. The project regularly provides a realtime national SRI
(surface rainfall intensity) composite (http://www.protezionecivile.gov.it/jcms/it/mappa_radar.wp), used
to monitor cloud systems and to determine the structure of storms and their potential to cause severe
weather. The radar network provides a good coverage of the national territory and enables comparison

295
with groundtruth data from a network of landbased precipitation stations. The nominal number of
contributing radar systems is 23 Cband plus 2 Xband, but hardware and software failures reduce the
average number of efficient systems to about 19.
Table 8.8 The Italian Air Force Met Service Special observation network
Measurement or analysis
Instrument Frequency Number of Stations
Time length of records
Stratospheric Ozone and Surface UVB Radiation
Brewer and Dobson spectrophotometers
daily 3 (Sestola, Vigna di Valle, Messina)
Dobson data time series since 1947; Brewer data time sereis since 1987
Ozone Vertical Profile
Upperair sounding system equipped with an ozone sonde sensor (an electrochemical
concentration cell)
two times a month
1 (Vigna di Valle)
data time series since 2011
Global Solar
Radiation
Kipp & Zonen CM11 (21)
and IA/FMQ16 (7)
hourly and daily 28 data time series
since 1958 for most of historical stations
Sunshine Duration
CampbellStokes sunshine recorder
daily
33 (Eliofonografi)
data time series since 1958 for most of historical stations
Chemical Analysis of Precipitation
Precipitation sampler MTX Wet & Dry
weekly 10 (no more used since 2015)
data time series since 1975 for 5 stations, since
2012 for 4 stations
Solar Photometry (atmospheric
turbidity)
Kipp & Zonen sunsky photometers (Prede POM01)
hourly
4
data time series since 2013, only
for experimental purposes
UVA and UVB radiation
DeltaOHM pyranometer (LP_UVA02 and LP_UVB02)
hourly and daily
10 the operational phase of regular collection of data has not yet started
CO2
ULTRAMAT SIEMENS 6E – NonDispersive Infrared
Analyzer
1minute averages 1
since March 1979
CH4
PCF ELETTRONICA 529
FlD (Flame Ionization Detector) Gaschromatograph
instantaneous
measurements every 3 minutes
1
since December
2011 (currently in a experimental stage)
ISPRA
ISPRA is responsible for standardization, collection and delivery of environmental data, including those of
interest for climate monitoring and analysis. National environmental data and indicators are transmitted
to EEA (European Environmental Agency) and to other international bodies such as EMEP (European
Monitoring and Evaluation Programme). For over 10 years ISPRA has developed and manages, in
collaboration with the most important national and regional meteorological networks, the National
System for Climate Data Collection and Dissemination (SCIA, www.scia.isprambiente.it). In agreement

296
with the National Permanent Representative, climate data, indices and indicators, including those
representing variations and trends of mean and extreme climate variables, are transmitted to and made
available for the bulletins and publications of the World Meteorological Organisation.
ENEA
ENEA is responsible for climate observations at the station on the island of Lampedusa
(http://www.lampedusa.enea.it), in the central Mediterranean sea. The station is an integrated system
which comprises an atmospheric (35.52°N, 12.63°E) and an oceanographic observatory (35.49°N,
12.47°E). The atmospheric observatory has been operational since 1997, and is dedicated to the
monitoring of atmospheric composition, properties, and the radiative budget at the surface. Many
parameters are continuously measured such as: CO2 (weekly samples, since 1992; continuous, since
1998), several greenhouse gases (CH4, N2O, CFC11 and CFC12 weekly samples, since 1997; continuous,
since 2006) and total ozone measurements. Furthermore, aerosols (optical properties, chemical
composition), water vapour and clouds, meteorological parameters, CO, ultraviolet, solar, and infrared
radiation are routinely measured. Lampedusa station contributes to the GCOS through the Global
Atmosphere Watch program and participates in different global measurements networks (AERONET;
Carboeurope; NOAA/ESRL/GMD CCGG cooperative air sampling network; MWRnet). The oceanographic
observatory has been activated in 2015 and is dedicated to the investigation of airsea interactions,
surface energy budget, and measurements along the water column; in cooperation with CNR, the
observatory is also a site for validation of ocean colour measurements. In addition, several intensive
measurements campaigns were carried out at Lampedusa (e.g., Photosynthetic Actinic radiation
Modulation Experiment at LAmpedusa in 2017), also as a contribution to large international experiments
(Hydrological cycle Mediterranean experiment, Hymex in 2012; Chemistry and Aerosol Mediterranean
Experiment, Charmex in 2013). Activities at Lampedusa are supported by the MIUR, through the
NextData and Ritmare projects.
ENEA also participates, jointly with other Institutes (NCAR/USA; INGV, University of Roma and Firenze),
in an international effort aimed at the study of the Arctic climate through observations carried out at the
Thule High Arctic Atmospheric Observatory (76.5°N, 68.8°W), Greenland
(http://www.ndsc.ncep.noaa.gov/sites/stat_reps/thule/; http://www.thuleatmosit.it). The station is
dedicated to the observation of tropospheric and stratospheric composition and structure; the Italian
measurements at Thule started in 1990 and are part of a longterm program. Thule measurements
contribute to GCOS through the Network for the Detection of Atmospheric Composition Change
(http://www.ndsc.ncep.noaa.gov/). Italian activities are presently supported by the Italian Antarctic
Programme; they were supported also by the European Union, the MIUR and by the US National Science
Foundation.
Furthermore ENEA participates to the study of the Antarctic climate through observations carried out by
the Italian MeteoClimatological Antarctic Observatory (http://www.climantartide.it). Started in
1987, the Observatory currently operates 16 Automatic Weather Stations (AWS), active throughout the
year. The AWS's monitoring network covers all the Victoria Lands territory, from the Italian Base "Mario
Zucchelli" (MZS, 74° 41' S, 164° 05' E) to the innermost area of the Antarctic Plateau at the FrenchItalian
Base "Concordia" (DC, 75° S, 123° E), and towards the Wilkes Lands territory in the direction of the
French Scientific Base "Dumont D'Urville" (DDU, 66° 40' S, 140° 01' E). Seven of the AWSs have a WMO
identifier and their Synop messages are disseminated to the GTS network. Upper air weather information

297
is acquired by two radiosounding stations: one at MZS (since 1987, two launches per day, at 00 and 12
UTC) and one at DC (since 2005, one launch per day, at 12 UTC). Temperature messages automatically
generated from both stations are disseminated to the GTS network. The Italian MeteoClimatological
Antarctic Observatory is supported by the Italian Antarctic Programme.
CNR
CNRIDASC (National Research Council Institute of Acoustics and Sensors), together with the Dirección
Nacional Del Antártico (Argentina) and the International Center for Earth Sciences, manages the GAW
station installed in Jubany (Antarctic Peninsula) and collects CO2 data since 1994
(http://www.idasc.cnr.it). Trace gases measurements of all stations can be found at link
http://gaw.kishou.go.jp/wdcgg.html.
Since the early ‘90s of the last Century, continuous observations of atmospheric composition have been
carried out in Italy at Mt. Cimone (44°12' N, 10°42' E, 2165 m a.s.l.) at the “O. Vittori” atmospheric
observatory (www.isac.cnr.it/cimone) managed by the National Research Council of Italy (CNR) –
Institute for Atmospheric Science and Climate (ISAC) and hosted by Italian Air Force – Centro
Aeronautica Militare di Montagna. Nowadays, at this location, thanks to the collaboration with the
University of Urbino, several longterm scientific programmes covering a large suite of climate altering
species (including Montreal and Kyoto gases as well as shortlived climate forcers, chemical and physical
aerosol particle properties) are carried out in the framework of international measurement networks
(WMO/GAW, AGAGE, ACTRIS).
Observations Starting year
Lead institution
Surface O3 1996 CNRISAC
NO,NO2 2012 CNRISAC
SO2 2014 CNRISAC
CO 2008 CNRISAC/Uniurb
CH4 2008 Uniurb
N2O 2008 Uniurb
SF6 2008 Uniurb
CFCs, HCFCs 2002 Uniurb
HFCs 2002 Uniurb
Columnar NO2 1993 CNRISAC
Aerosol size distribution (10 – 500 nm) 2005 CNRISAC
Aerosol size distribution (300 nm – 10
m)
2000 CNRISAC
Aerosol scattering 2005 CNRISAC
Aerosol absorption 2005 CNRISAC
Equivalent BC 2005 CNRISAC
Aerosol chemistry (PM1 –PM10) 2005 CNRISAC
Solar photometry 2016 CNRISAC
Meteorological parameters and solar radiation
1996 CNRISAC
List observation programmes running at the “O. Vittori” observatory at Mt. Cimone (Uniurb: Urbino University; Unibo: Bologna University)
Even if carbon dioxide is the major anthropogenic contributor to radiative forcing, other gases such as

298
methane, nitrous oxide, SF6, and halogenated gases (CFCs, HCFCs, PFCs, HFCs), are extremely
relevant in climate issues because of their very high Global Warming Potential. Moreover, other
shortlived climate forcers –SLCF (e.g. tropospheric ozone and black carbon), further exacerbate
(especially at regional scale) the climate forcing by GHG. All these species are continuously observed at
the CNR “O. Vittori” Observatory at Mt. Cimone.
This research activity includes the observation of a wide range on compounds that are measured
continuously at the site, in most cases since more than a decade, representing the most important
dataset on nonCO2 GHGs and SLCFs over the Italian territory. The inclusion of CMN in important global
networks (e.g. https://agage.mit.edu/) makes these data comparable with those measured in other sites
across the globe and allows the inclusion of these highquality data in studies that are interested both at
the global and at the regional (European) scale. The analysis of these data using inverse modelling
approaches (e.g. Graziosi, F. et al., Emissions of carbon tetrachloride from Europe, Atmos. Chem. Phys.,
16, doi:10.5194/acp16128492016, 2016; Graziosi F, et al. 2017. European emissions of the powerful
greenhouse gases hydrofluorocarbons inferred from atmospheric measurements and their comparison
with annual national reports to UNFCCC. Atmospheric Environment. 158, 2017) has already allowed to
provide emission estimates (topdown) at the regional scale that constitute an important support to
improve bottomup emission data that each country is required to submit every year in the frame of the
most important international global protocols aimed at combatting climate change. Such activity is within
the scopes of the IG3IS (Integrated Global Greenhouse Gas Information System) of the World
Meteorological Organisation, a framework capable of accepting and promoting a range of advanced GHG
emission quantification capabilities in order to improve the quality of and confidence in GHG emission
inventories.
Time series of the ozone depleting radiatively active gases measured at Mt. Cimone by the University of Urbino and CNRISAC.
Time series of the nonCO2 Kyoto gases measured at Mt. Cimone by the University of Urbino and CNRISAC.

299
Moreover, thanks to the participation to the IAMICA Project (www.iamica.it), in 2015 CNRISAC
implemented in the Southern Italy three new permanent observatories (Capo Granitola, Lamezia
Terme and Lecce), and CNRIIA implemented Monte Curcio Observatory. At these observatories, part of
the WMO/GAW network (GAW ID: CGR, LMT, ECO, and CUR), continuous observations of GHG (CO2, CH4)
and SLCF (nearsurface O3, black carbon) are currently carried out and data are submitted yearly to the
World Data Centre for Greenhouse Gases (WDCGG), for Reactive Gases (WDCRG) and for Aerosol
(WDCA) managed by WMO/GAW. CNRISAC collects total ozone data in Antarctica at Belgrano II station
by Brewer spectrometer since 1992, thanks to a cooperation with the Dirección Nacional Del Antártico
(Argentina), and since 2006 manage the BSRN (Baseline Surface Radiation Network) site/observatory in
Concordia on the Antarctic Plateau. Measurements include downwelling and upwelling (at two levels)
solar and atmospheric radiation as well as Aerosol columna rcontent and UV spectral radiation thanks to
custom instrumentation developed at the Istitute (UVRAD).
Since 2016, always in Concordia and always by CNRISAC, a new observatory devoted to carry out
continuous lidar profiles have been implemented.
CNR together with ENEA contributetogether with french colleagues to the Concordia CRYONET site,
recently (spring 2017) officially established by WMO in the frame of the Global Criospheric Watch
programme (GCW). Together with observations of the cryosphere, Italian groups assure the relevant
meteo and radiation ancillary data.
All activities in Antarctica are supported by PNRA. (Programma Nazionale ricerche in Antartide)..
In the Arctic, the main Italian contributions to systematic observation are carried out at the Dirigibile
Italia station. The Italian Arctic Station Dirigibile Italia is a multidisciplinary research facility located
in NyÅlesund (78°55' N, 11°56' E) in the Norwegian Archipelago of Spitzbergen (Svalbard). The station
is managed by CNR and the activities are coordinated by the Earth and Enviromnment Department (DTA)
. The station was opened in 1997 and together with longterm observation activities, supports
interdisciplinary research programmes/projects covering all climate system spheres (atmosphere,
hystosphere, cryosphere, biosphere ad litosphere). At the station since 2009 several complex observing
platforms have been implemented and more and more instrumented. They include the AmundsenNobile
Climate Change Tower (CCT), the aerosol laboratory of Gruvebadet and a mooring installed in the inner

300
part of Kongsfjiorden. Since 2005, a deep borehole (50 m) and a CALM Grid have been realized near the
CCT together with system for automatic observations. Last implementation, planned for spring 2018,
include a sodar system and a minilidar improve observations of ABL and improvement of aerosol
samplings up to include all organics. Largest part of longterm activities are performed in the frame of the
Climate Change Tower Integrated Project (CCTIP). More information on activities, scientific targets and
collected data can be obtained at the CCTIP web site (www.isac.cnr.it/~radiclim/CCTower). In addition to
activities ivolving above indicated observing platforms, of relevance are auroral activities carried out by
INAF research groups, ionospheric measurements performed by INGV, and UV and ozone measurements
carried out by CNR thanks to custom as well standard instrumentation (brewer and UVRAD)
8.3.2 Ocean Climate Observing System
Italy contributes to the GOOS international initiative through the participation to EUROGOOS (CMCC,
OGS, CNR, ISPRA and ENEA are partners of EUROGOOS) and to MONGOOS (CMCC coordinates
MONGOOS, while CNR, OGS, ISPRA and ARPAE are partners). The development of operational
oceanography in Italy is coordinate within MONGOOS and has been developed in the last year through
several projects such as RITMARE, ARGOIT and CMEMS. Italian research agencies and institutions are
contributing to GOOS through the insitu and satellite ocean monitoring systems, the basinscale
Mediterranean forecast for hydrodynamics and marine biochemistry (CMEMS), Mediterranean and
globalscale reanalyses, and limitedarea forecasts for the Italian seas. The actual observing system is
composed of a specific implementation of VOSSOOP, ARGO, meteooceanographic buoys, gliders and
analysed satellite data that are both archived in real time. The insitu observations have been collected
since the early 2000s. The products derived from satellite observations have been improved and consist
of Sea Surface Temperature, Sea Level Anomaly and Chla concentration.
The Italian participation to CMEMS (Coordination of MEDMFC and Ocean Color TAC, contribution to the
BSMFC, contribution to the CMEMS insitu TAC) is fundamental for the EU Copernicus program for the
systematic monitoring of the Earth system (http://www.copernicus.eu/). Copernicus organises the access
to multiple sources of data, from Earth Observation satellites to insitu platforms and provides users with
reliable and uptodate information through a set of services related to environmental and security issues.
For the ocean and the climate Copernicus organises two services and CMCC has the responsibility of the
Mediterranean Monitoring and Forecasting Centre (with the partnership of INGV and OGS) and CNRISAC
the responsibility of the Ocean Color Thematic Assembly Centre. Moreover Italy contributes to the CMEMS
insitu TAC and CMCC contributes to the Global Ocean Reanalysis of CMEMS.
ARGOITALY is the Italian component of a worldwide in situ global observing system, based on
autonomous profiling floats, surface drifters, gliders and shipofopportunity measurements. It is primarily
focused on the Italian seas, the Mediterranean and Black seas, and includes observations of temperature,
salinity, currents and other water mass properties. ARGOITALY contributes to international programs
such as Argo and EuroArgo (global monitoring of water properties with profiling floats), GDP (Global
Drifter Program to measure nearsurface temperature and currents), EGO (gliding vehicles to measure
water properties) and SOOP (ShipOfOpportunity Program to temperature profiles), developed to monitor
the entire World Ocean on a long term basis.

301
Together with the Italian Air Force Met Service, INGV, CMCC, OGS and ISPRA participate to the
RECMMOMed (REgional Centre specialized for Marine Meteorology and Oceanography over Mediterranean
Sea), in order to build a specialized hub, according to WIS concept (DCPC), for marine meteorology and
oceanography. These above mentioned components are:
ISPRA, responsible for the national tide gauge network (RMN Rete Mareografica Nazionale, with
36 tide gauges http://www.mareografico.it) and for the national data buoy or wave
measurement network (RON Rete Ondametrica Nazionale, with 15 moored oceanographic buoys
http://www.telemisura.it);
OGS (http://www.ogs.trieste.it), responsible for the MedARGO program;
CMCC (http://www.cmcc.it) and INGV (http://www.ingv.it) responsible for the oceanographic
analyses and forecasts for the Mediterranean Sea (http://gnoo.bo.ingv.it/mfs/myocean); since
2012 INGV coordinates an international project called EMSO (European Multidisciplinatry Seafloor
Observatory http://www.emsoeu.org/management), a network of marine observatories devoted
to monitor and study climate change of natural origin or induced by human activity and the
evolution of marine ecosystems.
Furthermore, CNRISMAR operates several multiparametric observing systems (buoys, platforms,
moorings and other fixed sites http://www.ismar.cnr.it/infrastructures/observationalsites), most of them
are placed along the Italian coasts and transmit data in real time to the receiving stations at coast.
Finally, to be noticed is the activity of the Mareographic station of Trieste, operated by the University of
Trieste (http://www.meteo.units.it) and performing the monitoring every 10 minutes of the sea level and
temperature (surface and 2 m. below sea level) since 1995 (conventional meteorological and radiation
data are monitored since 1979 in the same station).
ENEA has developed, as part of the RITMARE project, and oceanographic observatory (35.49°N, 12.47°E)
South of the Sicily channel, close to the island of Lampedusa. The Lampedusa oceanographic
observatory is dedicated to the investigation of airsea interactions, surface energy budget, and
measurements along the water column; in cooperation with CNR, the observatory is also a site for
validation of ocean colour measurements.
8.3.3 Terrestrial Climate Observing System
In Italy the hydrological cycle monitoring, as well as that relating to land use, evapotranspiration and soil
conditions, is carried out by regional networks and functional centres since 2002; the analysis and
assessment of resulting data are performed both at regional (Regional Agencies for Environmental
Protection) and national level (ISPRA).
The State Forestry Corps (Corpo Forestale dello Stato, CFS) has been reformed by the Legislative Decree
177/2016 which reduced the police forces from 5 to 4 and redistributed the CFS personnel among the
remaining bodies. The Arma dei Carabinieri (Comando unità per la tutela forestale, ambientale e
agroalimentare, CUTFAA) takes on the forest inventorying and monitoring activities performed in the
framework of the CONECOFOR (Forest Ecosystems Controls) and the INFC (National Inventory of Forests
and forest Carbon pools, http://www.sian.it/inventarioforestale); the latest together with the scientific
patronage of the CREA (Centro di ricerca Foreste e Legno del Consiglio per la ricerca in agricoltura e
l'analisi dell'economia agraria) and the information technology support of Almaviva Spa.

302
The Arma dei Carabinieri has also an active role, in the ordinary statute Regions, in fire prevention,
intervention and repression activities (on a continuous basis throughout the year) and collection of all the
information accompanying each fire event (e.g. recording the hectares covered by fire and describing the
damaged vegetation). In the special statute Regions, other autonomous entities (such as the Corpo
Forestale e di Vigilanza ambientale in Sardinia or the Corpo forestale della Regione Siciliana in Sicily) are
appointed to these duties.
Monitoring and measurements of underground water resources (aquifers) are conducted by CNR IGG in
collaboration with private and public local water management institutions. Ecosystem monitoring is
performed by CNR in the framework of the national LongTerm Ecological Research Network and of
European projects and programmes (eLTER, ECOPOTENTIAL).
Italy (CMCC) is also the coordinator of the Ecosystem Thematic Center (ETC) of the European Integrated
Carbon Observation System (ICOS) for measuring carbon and greenhouse gas fluxes, as well as water
and energy and other parameters, over terrestrial ecosystems.
8.3.4 Space Climate and Polar Observing System
Climate changes and global warming are more and more evident. Their scientific understanding is
increasing thanks to the observations from Earthorbiting satellites, that have been a key component in
monitoring climate change on a global scale in the last decades. This type of technology has enabling
scientists to have an overall view collecting a huge amount of data about our planet. All these data,
collected over many years, confirm the signals of a changing climate proving as the human influence has
been the dominant cause of the observed warming since the mid20th century, as indicated in the Report
of the United Nations Intergovernmental Panel on Climate Change IPCC, 2014. The effects of global
warming have been felt most notably in the coldest regions on Earth. In the last two decades glaciers
were reduced on the whole globe and the melting of the permanent Arctic ice caps is increasingly rapid
revealing open ocean. It is wellknown that the polar regions are extremely important in terms of their
global impact on weather and climate and functioning of the Earth system. In addition to this, human
presence and related activities are increasing in these regions. The cryosphere is a component of the
Earth system that includes elements as solid precipitation, snow cover, sea ice, lake and river ice,
glaciers, ice caps, ice sheets, permafrost, seasonally frozen ground, etc.
In a changing climate scenario there is a need to monitor all of these changes and to model their
behaviour in order to develop adaptation responses to deal with the inevitable impacts and to support
political decisionmakers choices. In this context, the Italian Earth Observation System COSMOSkyMed,
based on a constellation of four LowEarthOrbit midsize satellites, each equipped with a multimode
highresolution SAR (Synthetic Aperture Radar) operating in Xband, is providing its contribution since
many years, for example through the Italian Space Agency’s (ASI) membership in the Polar Space Task
Group (PSTG). This is an international organization, established in 2011 under the auspice of the World
Meteorological Organization’s(WMO) and the Executive Council Panel of Experts on Polar Observations Research
and Services (ECPORS). The PSTG is a successor of the successful International Polar Year Space Task Group
(IPYSTG), with the mandate to provide coordination across Space Agencies to facilitate acquisition and
distribution of fundamental satellite datasets and to support research and applications in the cryosphere.
PSTG requirements concern with satellite information, particularly with SAR sensor, for the study of ice sheets,

303
permafrost, snow and floating ice. The PSTG activities are supported by the SAR Coordination Working Group
(CWG), a subgroup of the PSTG which has the aim to better harmonize the collection and utilization of different SAR
data sets. SAR instruments, represent a reliable tool for ice monitoring because they are able to provide a
synoptic view that complements the accurate but low coverage reports from ships and airborne sources.
SAR data are able to provide information on the ice coverage, the size and shape of ice floes. In
particular, SAR data provide the crucial advantage to be independent from weather and day–night
conditions and it is even more a key feature in the glacier environment where persistent clouds hamper
data acquisitions by mean of optical sensors and where the polar night imposes a prolonged period of
darkness. Timely and variable information on sea ice conditions are essential also for all the operations in
icecovered areas: the safety and efficiency of sea transportation, offshore operations, fisheries and other
activities in regions covered by sea ice require highresolution and ice forecasts.
With the aim to meet the objectives of the PSTG and to assure the data continuity through spaceborne
data collection over ice sheets, ASI implemented acquisitions of interferometry series over 53 glaciers in
Greenland and 33 glaciers in Antarctica and the complete and interferometric mapping of the Antarctic
coast starting from September 2014. These handbooks were activated in the framework of the
COSMOSkyMed Background Mission (CSK BCK Mission), a low priority acquisition plan which allows to
populate a substantial data archive for future applications, without undermining in any way other
acquisition opportunities, since it is subordinated to users acquisition requests. For each orbital cycle (16
days) around 1000 acquisitions are performed over Greenland and Antartica with a time resolution of 4 or
8 days for higher level priority glaciers. The data sets are available in the COSMOSkyMed mission
catalogue.
Table 8.8 – COSMOSkyMed acquisition plans in the context of the Background Mission: ASI’s
contribution to the Polar Space Task Group
Number of monitored Glaciers Number of acquisitions per
orbital cycle
Greenland 53 156
Antartica 33 244
Antartic Coast 496
Acquisition geometry:
- Stripmap mode (35 m resolution, 40 km swath;
- HH polarization, ASC/DESC direction, Right LooK Side;
- Incidence Angle in the range 25°45°
- Time resolution 48 days for highest priority glaciers (level 3), 16 days for glaciers of level 2 and 1
and Antartic Coast;
Details of the areas of interest systematically monitored using the COSMOSkyMed mission in
the context of the Italian contribution to the Polar Space Task Group

304
On arctic lands, SAR technology can provide monitoring of land instability due to permafrost thawing and
melting. Permafrost is acknowledged by WMO and UNFCCC (United Nations Framework Convention on
Climate Change) as Essential Climate Variable (ECV). Its monitoring as part of the cryosphere has been
identified as grand challenge by the World Climate Research Programme (WCRP) Joint Science
Committee and a draft white paper on this topic published in 2012 (Kattsov et al. 2012). A focused effort
on improving the representation of permafrost and high latitude land surface, including wetlands, in
climate models, with specific emphasis on their role in the global carbon cycle has been requested.
Permafrost, defined as subsurface earth materials that remains at or below 0˚C continuously for two or
more years, is widespread in the Arctic, subArctic. There is a need for improved and less expensive,
remote sensing based tool and method to asses permafrost stability risk, and to monitor existing
infrastructure integrity such us roads, rail beds, pipelines, and buildings. Studies regards the use of
shortrevisit sensor, as COSMOSkyMed, to increase the temporal resolution of deformation time series.
They are addressed to better capture permafrost seasonal dynamics and to separate seasonal from
longterm subsidence trends. In addition, studies are conducted to carry out a comparative analysis to
assess the suitability and complementarity of Cband and Xband.
Land surface changes resulting in modification of terrain are a further issue. Permafrost related terrain
changes, including geohazards in lowlands and mountain areas, are surface subsidence, landslides
(including active layer detachment slides, rock slides), thermoerosion as well as coastal erosion.
Implications for infrastructure, specifically related to exploitation of natural resources as well as
indigenous societies need to be addressed in this context. Indigenous residents are affected as
ecosystems and the hydrological systems are continuously modified by surface and subsurface
disturbances, which have an impact on resources traditionally available for humans.
In October 2017, following the requirements of the scientific community working in the PSTG framework,
ASI activated an additional acquisition plan for permafrost monitoring as Italian contribute to this
international working group.

305
About 60 sites over the polar region are systematically acquired with the following acquisition geometry:
- Stripmap mode (35 m resolution, 40 km swath;
- HH polarization, ASC/DESC direction, Right LooK Side;
- High Incidence Angle > 45°
- Time resolution in winter period: from 1 to 3 times a orbital cycle (16 days) depending on the
extension of the area of interest,
- Time resolution in summer period: once every 2 orbital cycles (32 d).
In addition to the systematic observations, different studies and projects carried out through the use of
COSMOSkyMed data are ongoing or have been activated in the framework of agreements or projects
activated with ASI by several public Authorities and Institutions (ministers, territorial authorities,
research centers, Universities, etc.). Some of these projects are directly managed by ASI, other are
activated in the framework of the Announcement of Opportunities issued by ASI, as the Joint CALL ASI
CSA (Italian Space Agency – Canadian Space Agency) issued in September 2013, or the last two Open
Calls published on the ASI web site in February 2015.
The significant investment in spacebased infrastructure made by Nations and Countries all over the world
has not yet been fully exploited. Realizing the full benefits requires a solid base of political support, laws
and regulations, institutional responsibility, and trained people. Of course, the international cooperation
represents a promising strategy to enhance the combined and complementary use of space technologies
for societal benefits. In this context, COSMOSkyMed represents a useful and strategic national asset,
considering that it has been designed to face international partnerships and integration of the system itself
into a multimission framework of cooperating multisensor systems.
The CEOS (Commettee on Earth Observations Satellite), which coordinates civil spacebased EO
programmes involving more than 30 agencies being collectively responsible for the operation of more than
100 current EO satellite missions, identified four main challenges for Climate Change:
effective institutional arrangements
ensuring continuity of future observations
adopting and reporting «climate indicators»
ensuring accuracy of climate observations
Ensuring continuity of future spacebased observations is one of the key element in understanding and
monitoring of climate change effects on a global scale.
8.4 Support to developing countries
8.4.1 Funding opportunities for free and open data exchange
Italy contributes to free and open data exchange through its participation to the Intergovernmental
Oceanographic Commission (IOC) of UNESCO. Since 1961, the country is involved in IOC’s program
"International Oceanographic Data and Information Exchange" (IODE) that aims at enhancing the free
and open international exchange of data among member 146 countries. Moreover Italy contribute to the
Copernicus free provision of remote sensed and in situ data (e.g. CMEMS). Italy participate to the Global
Ocean Observing System through the coordination of MONGOOS (Mediterranean Oceanography Network

306
for GOOS) and the participation to EUROGOOS which share the objective of promoting the free and open
data access to the marine observations. Italy has contributed to Seadatanet and currently to
Seadatacloud which coordinated the exchange of historical delayed mode observations. Italy contributes
to several EMODNET initiatives which represent the EU framework for data collection handling and free
and open data delivery.
8.4.2 Establishing and maintain observing systems, and related data and monitoring
systems
ISACCNR manages, since March 2006, three permanent automatic meteorological stations: Pyramid, Kala
Patthar and South Col (Nepal, http://evk2.isac.cnr.it/realtime.html) in Khumbu Valley, Mount Everest
National Park, at an altitude respectively of 5050 m asl, 5585 m asl and 7986 m asl. In the last site
above mentioned the insitu highest meteorological observations in the world take place. Monitoring
activities are carried out in close cooperation with Nepal Hidrology and Meteorology Department (DHM),
Regional Representative Office of WMO.
Many Italian Institutions, Universities and Agencies are active participants in international EU funded
projects on climate change related topics and in National projects funded by means of bilateral
agreements, with a special emphasis on research capacity building in developing countries such as:
CLIMRUN (Climate Local Information in the Mediterranean region Responding to User Needs,
www.climrun.eu);
CliMiP (Climate change Mitigation and Poverty reduction)
http://www.feem.it/getpage.aspx?id=5257&sez=research&padre=18&sub=70&idsub=86&pj=Ongo
ing);
IMPACT2C (Quantifying projected impacts under 2°C warming, http://www.hzg.de/mw/impact2c);
EUPORIAS (European Provision Of Regional Impacts Assessments on Seasonal and Decadal
Timescales, http://www.euporias.eu);
ClimAfrica (Climate change predictions in SubSaharan Africa: impacts and adaptations,
http://www.climafrica.net);
METEOMET (Metrology for Meteorology, http://www.meteomet.org);
SHARE (Station at High Altitude for Research on the Environment,
http://www.evk2cnr.org/cms/it/ricerca/programmi_integrati/share);
SPICE (WMO Solid Precipitation Intercomparison Experiment 20122014,
http://www.wmo.int/pages/prog/www/IMOP/intercomparisons/SPICE/SPICE.html);
SUSKAT (A SUStainable atmosphere for the KAThmandu Valley;
http://www.iasspotsdam.de/regionalfocussustainableatmospherekathmanduvalley);
Activities of the GEO (Group on Earth Observations) Ecosystems SBA
(http://www.earthobservations.org/index.shtml);
Education programmes implemented by means of several training workshops on ‘modelling of
regional climate, extreme events, air quality and human health’
(http://www.ictp.it/homepage.aspx);
Evaluation of the carbon sink potential of an ecosystem of the oasis in Algeria, Rainfall, fire,
elephant, and tree interactions in Southern African savannas and desertification (Italy – South
Africa Bilateral Agreement);

307
Landfill emissions reduction by waste stabilisation processes: an effective way of managing
renewable energy sources (Italy – South Africa Bilateral Agreement);
Monitoring system for CO2 captured in a used deposit of hydrocarbons (Italy – Algeria Bilateral
Agreement);
Optimization of water use by native plants in arid lands facing climate change and desertification
(Italy – Pakistan Bilateral Agreement).

308
9 EDUCATION, TRAINING AND PUBLIC AWARENESS204
9.1 Education and Public awareness
Italy has made progress in improving its education and training system over the last few years. Being
aware that education aims at recovering the relation with the environment, this progress reflected also
on environmental education, education to sustainability and on climate change and adaptation.
On 3 September 2014 the Italian government published ‘La Buona Scuola’, a set of guidelines for a
comprehensive reform of the school education system. The plan was subject to a public consultation from
15 September to 15 November 2014. On 13 March 2015, the Italian government presented the reform as
a draft law, which was approved by parliament on 9 July 2015 (Law 107/2015). With this reform the
Italian government has put at the core of its mission the education of young people.
Following this school reform in order to integrate and advance it, new ”Guidelines for Environmental
Education and Sustainable Development (Linee Guida per l’Educazione Ambientale e lo Sviluppo
Sostenibile) were issued by the Ministry of Environment, Land and Sea in collaboration with the Ministry
for Education, University and Research in 2015. As already mentioned in the 6NC, Guidelines for
Environmental Education and Sustainable Development were developed by MATTM and MIUR for the first
time in 2009 with the aim of providing innovative approaches for the development of curricula and the
management of educational and didactic activities.
The new guidelines contain guidance material for teachers, covering a number of thematic issues
(biodiversity, food, climate change, transport, water, cities..). A further step carried out with this new
guidelines is to articulate overriding environmental topics in differentiated educational paths for each
grade/level of school.
In the awareness that education aims to recover the relation with the environment and with the natural
and sociocultural resources and biodiversity of the territory, in November 2016 the Italian Ministry of the
Environment, Land and Sea and the Ministry of Education University and Research signed a new
Programme of commitments: the “Rome Charter”.
This Act on education and training is broken down in 12 points, from biodiversity and mobility, from
digital communication to climate change. The Rome Charter is mainly addressing students, as well as
teachers and trainers, and is also aimed at supporting the implementation of the renewed Italian
National Strategy on Sustainable Development as well as the 2030 Agenda Objectives.
In the framework of the Europe Strategy 2020 particular attention has been made to train adequate
competences correlated to the new jobs in the environmental field.
204 Lead author: Stefania Fusani (ISPRA); Sandra Moscone (ISPRA), Roberta Ianna (MATTM), Federica Rolle (MATTM).
Contributing authors: Daniela Antonietti (ISPRA), Stefania Calicchia (ISPRA), Fabrizio Ciocca (ISPRA), Antonietta
Licenziato (ISPRA), Federico Brocchieri (ISPRA), Vincenza Cipollone, Giulia Galluccio (CMCC).
Special Thanks to: the Regional Environmental Agencies (ARPAs) of Calabria, Liguria, Lombardia, Piemonte, Sicilia,
Valle d’Aosta, Veneto, the Provincial Environmental Agencies (APPAs) of Trento and Bolzano.

309
Schools are at the top for the dissemination and awareness raising initiatives on important issues such as
energy saving, sustainable consumption, CO2 emissions and climate change; in other words, schools are
the training ground of new generations to whom we will leave our Planet.
The collaboration of Regional and Provincial Administrations and Regional Environmental Agencies
(ARPAs), as well as Municipalities and other stakeholders, such as NGOs, Parks and Universities is
essential for the promotion and implementation of innovative methods for teaching and learning and
raising awareness on climate change in Italy. It was on a local scale, according to the different territorial
contexts and characteristics, that a strong effort has been made to educate, train and raise awareness in
order to increase resilience. The new Guidelines for Environmental Education and Sustainable
Development, beyond formal strategic aspects intend to be a connection tool with the territories where
we live, to stimulate and encourage operational activities for the sustainable development.
The initiatives on education and public awareness have been divided in two separate sections below.
Education
Italy benefits from a long and valuable tradition of initiatives and programmes on Environmental
Education (EE) and Education for Sustainable Development (ESD) at regional and local level, focusing
especially on nonformal education. Climate change is becoming increasingly a central theme of these
educational programmes and activities.
For several years, regional programmes/networks have been based on an institutional framework of
collaboration between the State (Ministry for the Environment) and the Regions, the so called National
Programme for Environmental Education, Information and Training (IN.F.E.A). Under the INFEA
system, the regional EE/ESD programmes/networks have been supported and facilitated by the Ministry
for the Environment, in the framework of a single national scheme.
The INFEA was structured as an open and dynamic integration of systems on regional scale, where the
regional administrations play a role of listening, proposal and coordination by fostering a constant
dialogue with the actors involved in the field of the environmental education.
The INFEA Programme has contributed, with financial support, to spread throughout Italy, structures and
tools to assist and strengthen the role of Regions (e.g. CEAs Centres for Environmental Education) and to
direct the actions towards the set up of a National System of Education, training and environmental
information.
Among these regional and local activities, there is still a significant variety of good and excellent practises
on ESD, especially in some advanced Regions, where climate change is tackled as the main issue or the
challenging context that affect other issues.
The “Rome Charter” on environmental education and education for sustainable development, signed by
the Ministry for the Environment and the Ministry for Education in 2016 calls for the revitalisation of this
national platform, mainly aiming at valorising and sharing good educational practices.
It’s worth to mention the Italian National Commission for UNESCO, which coordinates and collect the
implementation, at local level and by local actors (mainly schools, NGOs, local administrations, private
sector), of the UNESCO programmes on Education for Sustainable Development. In particular, every
year the “National Week of Education for Sustainable Development” develops a large number of
initiatives to raise awareness and education throughout the country. Climate change was the theme of
310
the UNESCO ESD Week both in 2016 (Climate change and Cities) and 2017 (Climate change and
migrations).
Within this framework, the National System for Environmental Protection (SNPA), composed by ISPRA
and the Regional and Provincial Environmental Agencies, plays an important role, promoting and
implementing educational programs, projects and initiatives on various environmental issues.
The Network of Focal Points of Education for Sustainability, recently instituted and coordinated by the
Regional Environmental Protection Agency of Emilia Romagna (ARPAE), is working to prepare the
Program of Activities for the coming years.
At National level, following the Law 107/2015205 “La Buona Scuola”, the new Guidelines for
Environmental Education and Sustainable Development (Linee Guida per l’Educazione Ambientale e
lo Sviluppo Sostenibile) were issued by the Ministry of Environment, Land and Sea and the Ministry for
Education, University and Research in 2015. They contain guidance material for teachers, covering a
number of thematic issues (biodiversity, food, climate change, transport, water, cities..), and
differentiated for each grade/level of school.
The goal of these Guidelines is to provide students with holistic knowledge rather than specific technical
skills: in this regard, they represent the starting point to build on new educational profiles in an
integrated manner with the local territory. The Guidelines are structured in 8 educational profiles:
1. “Protection of water and sea” (Preschool Education, Primary Education)
2. “Protection of biodiversity: Flora and Fauna” (Preschool Education, Primary Education)
3. “Sustainable nutrition” (Preschool Education, Primary Education, Lower and Upper Secondary
Education)
4. “Waste management” (Preschool Education, Primary Education, Lower Secondary Education)
5. “Protection of biodiversity: ecosystemic services” (Lower and Upper Secondary Education)
6. “Green economy: green jobs & green talent” (Upper Secondary Education)
7. “Sustainable city: pollution, soil sealing and waste” (Upper Secondary Education)
8. “Climate change adaptation: hydrogeological instability” (Upper Secondary Education)
On the basis of the Guidelines, and following an agreement signed in 2016 by the Ministries for
Environment and Education, teachers’ training activities on EE/ESD (Education for Sustainable
Development) have been shaped and are in course of being launched, covering the whole national
territory. This teachers’ training program falls under the “National Operational Program” on School
Education 20142020, funded by the EU.
20 million euro have been dedicated to this activity.
The National Charter on ESD, the “Rome Charter” , signed in November 2016 by the two Ministers
(Environment and Education), aims to integrate and advance the Guidelines. For each topic (mobility,
biodiversity, sustainable development, climate change, water, health), the Charter identifies Education
principles and specific actions to be implemented in order to introduce ESD in school education and/or to
205 LEGGE 13 luglio 2015, n. 107 Riforma del sistema nazionale di istruzione e formazione e delega per il riordino delle disposizioni legislative vigenti. http://www.gazzettaufficiale.it/eli/id/2015/07/15/15G00122/sg

311
advance ESD policy. The Charter has been elaborated during the national Conference on ESD (Nov. 2016)
with the active contribution of more than a hundred of ESD experts, from various actors (civil society,
private sector, institutions, academia).
In the framework of the above mentioned National Operational Programme on School Education (“PON
Scuola” 20142020), funded by the EU trough the European Structural Funds, a call has been launched by
the Ministry for Education in 2017, aiming at granting financial contribution to projects presented by
schools (also in partnership with NGOs or other local actors) on “global citizenship education”.
120 million euros are invested for this initiative, covering the whole national territory.
The projects must aim at developing students’ competencies in one or more of the following thematic
areas:
1. Food and local land resources;
2. Wellbeing, correct lifestyles and sport;
3. Environmental Education;
4. Economic citizenship ;
5. Civic engagement and respect for diversities.
Climate change is a central issue in most of the five above mentioned areas.
The European days of environmental education , promoted by the WEEC (World Environmental Education
Congress) Network, were held in Bergamo on 25 and 26 September 2014 at the end of which it took
finally start a process of building a "European concertation" and a European network for environmental
education. To educate citizens aware of their rights, it is also useful to remember the three pillars of the
Aahrus Convention, as a necessary tool for the protection of the right to live in an environment adequate
for their health and wellbeing: ensure that citizens have access to environmental information; encourage
the participation of citizens in decisionmaking that may affect the environment; extending the conditions
of access to justice.
During Milan EXPO 2015 the vision and values of the school environment, from nursery schools to
universities, were fundamental in spreading the Event’s contents and guaranteeing its legacy. For this
reason, teachers and students were invited to study Expo’s Theme in depth through specific training and
educational paths launched in the classroom over the past years, and especially through educational
visits and school trips to the Site. Thanks to the latter, students had the possibility to enhance their
experience through ad hoc itineraries and global discussions about food with their peers, also from other
nations.
More than 170 Italian Universities joined the project “Le Università in Expo” and over one million students
visited Milan EXPO 2015.
The new National Strategy on Sustainable Development, approved by the Council of the Ministries in
October 2017 and proposed by the Minister for the Environment in order to align the Italian policies to
the Sustainable Development Goals of the UN Agenda 2030, includes some objectives in the field of
environmental education and education for sustainable development, with special attention to climate
change. The strategy refers to the need to shape interdisciplinary and participatory educational

312
programmes on SD, to reinforce the training of teachers and to orient school management toward
sustainability practices.
EDUCATION: List of initiatives and projects carried out since 2014
Organisation/ Promoter/
Name of the activity Short Description Indicators/Number
Rai Radio2
(Italian Public Broadcasting
Service)
M’illumino di meno “I am enlightened less” Energy Saving Day campaign (2014/2015/2016/2017 Editions) Caterpillar Edition 2017: Let’s switch off the lights to switch on the stars”
#MilluminoDiMeno http://caterpillar.blog.rai.it/milluminodimeno/# https://www.facebook.com/caterpillar.radio2 https://twitter.com/caterpillarrai
As part of the yearly energy saving campaign "M'illumino di meno" Rai Radio2 has organized the largest radio campaign dedicated to the reduction of energy consumption to raise awareness on energy consumption through Caterpillar. It’s the most important energy efficiency awareness campaign ever launched by a national public radio. The 16th of February 2005 is the day when the Kyoto Protocol came into force; that day
Caterpillar, a popular current radio show on Italian Public Broadcasting Service, has announced the First National Day of Energy Saving. Every year the campaign has been launched with growing success. The day’s philosophy is to convince more people as possible to back saving, the biggest energy deposit available in a free way and in a short time. At its thirteen edition the campaign involves a great variety of Subjects: thousands of listeners, hundreds of associations and the most
important institutional actors Italian and foreigners. The initiative is under the high patronage of the President of the Republic, the European Parliament, the Senate of the Republic , the Chamber of Deputies, the Ministry of the Environment, Land and Sea, the Ministry of Education University and Research, the Ministry of infrastructures and Transport as well as the participation of hundreds of municipalities. http://caterpillar.blog.rai.it/files/2009/09/milluminoenglish.pdf
451 thoughts on “M’illumino di Meno”
13100 Tweets
2613 Following
44000 Followers
4131 I like
Rai News
Italian State Broadcaster
“Mercalli Pills”
Lessons of Sustainability
A blog active
An innovative voice of environmental communication. Luca Mercalli is a climatologist and he chairs the Italian Meteorological Society. He founded and directs Ximumx the Nimbus meteorology magazine, he is the author of 1993 scientific publications and over 85 dissemination articles appear mainly on the newspaper. He deals with research on climate and alpine glaciers, he teaches sustainability in schools and universiities in Italy, Switzerland and France.
Videos on rai news page have got more than
2,4 Thousand visualizations
Italian Ministry for the
Environment, Land and Sea
"Environmental Classroom 2.0" Milan, EXPO 2015
The goal of this experimental project was to go beyond solitary learning, by constructing an instructive game context where individuals interact with a group, as well as to consolidate the use of 2.0 technology, new languages and digital supports in schools, including interactive whiteboards and tablets, not for substituting
books with digital devices but in order to encourage learners to connect with each other.
University of
Bologna
Climate Days Bologna 21 April, 2017
On April 21st, 2017 professors from the University of Bologna met with highschool students to provide them with information around climate change as well as the tools to deal with this challenge. Among the related topics, were solar

313
https://site.unibo.it/termoref/it/agenda/giornataclima
and electric mobility, urban and innovative solutions, green technologies etc.
Italian Ministry for the
Environment, Land and Sea
Environmental Education Festival Rome April 2017
On the occasion of the celebrations around the Earth Day, 2 days were dedicated to follow up on the Estates General on Environmental Education and 140 students gathered to write an appeal to Environment Ministers from major world countries to ask for real policies both in the field of environmental protection and education
140 students
Italian Ministry for the
Environment, Land and Sea
Schoolwork alternation project Ongoing
A pilot project involving two schools of Rome municipality were students choosing an environmental theme will work, with the experts involved and the teachers, to the definition of a Shared project of short, medium and long term actions that the school can put in action to pursue a "sustainable school" model.
2 schools
Ministry for the Environment, Land and Sea
SIOI Mater
Scholarships – 2016/2018 The Italian Ministry for the Environment, Land and Sea funded 8 scholarships for a mater degree on Sustainable development, geopolicy of resources
and arctic studies” to the Italian Society for International organization (SIOI)
8 scholarships
Ministry for the Environment, Land and Sea
“Rondine” association
Scholarships – 2016/2017 The Italian Ministry for the Environment, Land and Sea funded a Master degree on Climate Change and 4 scholarships to students from Developing Countries
4 scholarships
ISPRA (Italian Institute for
Environmental Protection and
Research)
VADDI (italian acronym of “Vallo A Dire ai DInosauri” “Tell it to dinosaurs!”)
Game simulation kit on climate change http://www.isprambiente.gov.it/it/formeducambiente/educazioneambientale/progettiediniziative1/kitva.d.di/index
The educational kit "Tell it to the dinosaurs', aimed at students aged between 13 and 18 years, was launched in 2011. The simulation game aims at stimulating the active participation of the players, with a problemsolving approach. The communication campaign to promote and spread the game has continued also in the years 2014 – 2017, through presentations in public events, as well as training workshops for environmental educators and teachers, including one in Trento Province (2015), and through the environmental education pages on ISPRA website:
N. 20 environmental educators of Trento Province trained (2015)
N. 30 boxes delivered to Trento Province (2015)
N. 15 requests of information received via email (2014 – 2017)
ISPRA
(Italian Institute for the Protection of the Environment)
“Adaptation to climate
change” (Environmental education initiative for schools) School year: 2017 2018
The initiative “Adaptation to climate change”
(“Let’s adapt but not too much to climate changes”) addresses the issue of climate change by the impacts and adaptation point of view. The aim is to provide some key concepts about the problem of climate change, their impacts on natural resources, and to suggest, through a playful activity, some behaviours to save resources and reduce risks. The target of the initiative are primary and middle school students.
The initiative is part of the Environmental Education Initiatives’ Plan of ISPRA addressed to schools for the year 2017 – 18.
Centro Epson
Meteo
Progetto Scuole Italy http://www.meteo.expert/news/nasceprogettoscuolecentroepsonmeteo/
The Project is dedicated to students of all ages, from preschool education to upper secondary education, and it aims at explaining young students the basics of meteorology and the importance of weather forecasts to predict atmospheric events that may impact people’s life.
EuroMediterranean Center on Climate Change Foundation
LINKS
Che mare farà – Mare, Istruzioni per l’uso: Bollettino Multimediale
20142015 Regione Puglia Living Labs
The project aims to incentivize the users’ training process, through the provision of innovative forecasting systems. The project envisages the creation of a technology platform for the provision of weather forecast services for the Mediterranean

314
Management & Technology
SpA
Smart Pulia 2020 Apulian ICT Living Lab http://livinglabs.regione.puglia.it/
Sea and specifically for the Puglia Coasts. The services, from forecasting systems, to daily and weekly bulletins, and warning signals, will be delivered in multidirectional and multichannel mode, including television and web format, multimedia material (video and animation) and documentary material.
The project has been presented at the European Space Expo (Milano September 27 / 28, 2015) a touring exhibition showcasing the flagship European Space programmes: Copernicus, Galileo and EGNOS, and their benefits and applications.
Within the Eu Space Expo several short courses for students (from elementary to high school levels) have been given, presenting and interacting with the students on sea conditions, forecasting tools, sea bulletins and dictionary of the sea.
Arpa Piemonte (Dip.to Sistemi Previsionali; Museum A come Ambiente (Torino); University of Torino (Dip.to Scienze della Vita e Biologia dei Sistemi)
Exhibition : “C3 Alps” C3 Alps ( EU Project Capitalising Climate Change Knowledge for Adaptation in the Alpine Space 2014
It is an itinerary and multimedia Exhibition across
VerbanoCusioOssola Parks addressed to schools
and citizens on the topic of adaptation to climate
changes of alpine biodiversity. The project started
in 2012 and ended in 2014. The exhibition
consists in a guided path through proactive
interaction between flora and fauna of the alpine
natural habitat and phenomena related to climate
changes. Adult visitors can deal with a series of
guided phenological surveys on local flora and
fauna while children are involved in recreational
activities aimed at building awareness . In
particular ARPA Piemonte has organized the
activity “ Searching for the “Biotresure”
Arpa Piemonte; Scientific Lyceum Gobetti of Turin
School path on climate changes and hydrogeological risk
School Year 2016 2017
This project has involved highschool students : it consisted of a classroom debate with interventions and sharing of ideas, one day at ARPA Piemonte premises and a field lesson. The key topics addressed were permafrost, nivology and landslide monitoring.
Valle d’Aosta Region
Centre de Recherches sur les Ecosystemes d'Altitude, (CREAFR), Parco Nazionale del Gran Paradiso (PNGPIT), Parco Naturale del Mont Avic (PNMAIT) et Parc National des Ecrins (PNEFR).
“ePHENO” Project 20132015
www.phenoalp.eu/index.php/it/edupheno
www.phenoalp.eu/index.php/it/epheno
Environmental Education activity addressed to children, in the framework of the european project ePheno (20132015). The main objectives are to
improve understanding of phenological variations caused by climate changes in the Alps and to involve new territorial actors, both in the observation of phenomena and in awareness raising.
Fondazione Montagna Sicura (FMS) – University of Savoye – Municipality of Valtournenche – ARPA Valle
“PrévRiskHauteMontagne”
Project
20162017
http://www.fondazionemonta
gnasicura.org/fr/projetsencou
rs/prevriskhautemontagne
The project aims at educating and raising
awareness among local people and tourists about
the high mountain characteristics and related
risks, also with reference to the impacts of global
warming on glaciers and permafrost.
The web page has got : 8992 "I like" 30 information and communication experts

315
d’Aosta – ARPA Piemonte
Regional Environmental Agency of Valle d’Aosta (ARPA Valle d’Aosta)
“From the environment to the Territory: environmental analyses and innovative research (Arpa VdA experience)” 20162017
It is a collaboration among High school Institutes to promote the project “Climate changes and effects on mountain territory “ . This project aims at making children think about climate change in its broadest sense. https://prezi.com/jjrnnd5bgvzr/stagescuoleclimat
echange/
Thematic hashtag #climatechange 213 tweets
Provincial Environmental
Agency of
Trento (APPA Trento)
Learning paths in the schools on: AIRclimate, energy, alternative energy
sources and energy saving. Anni scolastici 2014/2015, 2015/2016, 2016/2017
http://www.appa.provincia.tn.it/educazioneambientale/guidascuola/ Results and material are available on the following website: http://www.educazioneambientale.tn.it/
APPA carries out freely in Trentino schools of all levels in different environmental education activities and collected in the catalogue “ At school
of environment and at school of lifestyles” addressing several topics such as air pollution , climate changes and renewable energies. Type of activities: educational paths ( classroom meetings and exits); environmental sustainability pills (single class meeting); interactive exhibitions : “A window on climate , “Energy transformer” Game show: “Ecoquiz: On mission for the planet ”
School Year 2014/2015 School Activities
EDUCATIONAL PATHS about 90 classrooms for 1800 students GUIDED VISITS TO EXHIBITION : about 30 classrooms
School Year 2015/2016 School Activities: about 150 classrooms for 2800 students) GUIDED VISITS TO EXHIBITION: about 15 classrooms
School Year 2016/2017 School Activities EDUCATIONAL PATHS and PILLS: about 160 classrooms for 3200 students GUIDED VISITS TO EXHIBITIONS: about 24 classrooms (about 450 students) ECOQUIZ: 300 students III e IV classroom – High School 2° degree
Regional Environmental
Agency of Veneto (Arpav), IN.F.E.A.
Centre of the Province of
Treviso, IN.F.E.A Regional network
Project “Let’s tell us stories… Collection of stories on the environment ” 2014; 201718 http://www.arpa.veneto.it/serviziambientali/educazioneperlasostenibilita/educazioneambientale/diffusionedi201craccontiamocilefavole...raccoltadifavolesull2019ambiente201d2014
The project involves nursery and primary schools of the regional territory with the aim of involving children in the environmental topics described in the publication “Let’s tell us stories…” through the development and implementation of several interactive educational activites (readings, games miseenscene, exits). Among the topics addressed, air and meteorology. http://www.arpa.veneto.it/serviziambientali/educazioneperlasostenibilita/educazioneambientale/raccontiamocilefavole
Year 2014: 21 schools 57 teachers 720 children involved 4000 DVD produced. Year 2017 – 18: 7 provinces 32 schools 32 laboratories 192 hours of activity 800 pupils involved
Arpav, IN.F.E.A
Cineforum Environment
Realization of four cineforum in the provinces of
Vicenza, Treviso, Padova and Rovigo with open

316
Centres. Province of
Padova, Belluno, Vicenza
Treviso, INFEA Regional Network
2014 http://www.arpa.veneto.it/serviziambientali/educazioneperlasostenibilita/educazioneambientale/cineforumambiente/cineforumambiente
showings and documentaries, at schools in the
morning and at cinemas in the evening for citizens
with the participation of guests and experts of
environmental communication about climate
change, energy saving, food waste, landscape
protection , urban gardens, waste, legality and
water resources.
Arpav, Regional School
Office of Veneto Region
– MIUR, Veneto Region Regional Group “Health in every Policy”
Competition QUALe idEA! School Year 2017/2018
This competition aims at promoting the
realization of environmental education projects in
the schools at all levels on environmental hot
topics in accordance with ARPAV Guidelines “
School and Environmental Education: planning
according to quality”. The best projects will be
awarded with prizes aimed at activities or
purchase of school material dedicated to
environmental education and will be published on
ARPAV website and Regional School Office of
Veneto Region website. For School Year 2017 –
18, the following topics are proposed:
1. Circular Economy: reuse and recovery
2. Climate Change: I reduce CO2 and my
ecological footprint
3. Take care: I adopt an environment , a school ,
a square a garden
Underway, Data not yet available
Arpav, Aqua srl di Taglio di Po
(RO) Belluno
Municipality Verona
Municipality, Venezia
Municipality, Padova
Municipality La Fenice
Foundation of Padova
Venice National History Museum
Ideas of sustainability 2016 http://www.arpa.veneto.it/serviziambientali/educazioneperlasostenibilita/educazioneambientale/ideedisostenibilita
Laboratories and meetings to promote the environmental culture and the sharing of ecological behavior which make the difference and reduce the impacts of daily actions on the environment. The activities involved children and focused on climate change, air, water, soil, waste, electromagnetic fields and noise.
4 provinces 34 days 149 laboratories 1350 children (312 years old)
EOS Service ARPACAL – Hospitality Training
Institutes of Calabria Region
European Week for waste Reduction Competition “We do not throw away nothing…we cook everything ” Year 2014 http://www.arpacal.it/index.php/arpacal/attivita/gruppoeos/iniziativeeos
A competition of ideas, addressed to students attending Calabria Region Hospitality Training Institutes . The theme of the competition is the realization of receipts with the use of food waste with the aim of encouraging students to identify strategies to reduce waste strengthen the relation between territory and environmental culture and reduce waste production and the release of emissions in the atmosphere.
Environmental Protection Agency of
Calabria (EOS Service
ARPACAL) –ARARE
Association (Education and
Agrarian Training Network)
“ARARE”Project Anno 2014
The project aims at the realization of an integrated territorial model among Agrarian Institutes of the province of Reggio Calabria from the implementation of shared objectives related to the study of the impacts of production and commercialization systems on the environment and on climate
EOS Service ARPACAL –
“Europe Celebration“ European Year of Green
Educational Interactive Laboratories carried out by the Personnel of the Agency at “Ecolandia”

317
Recreational –TechnologicalEnvironmental
Park “Ecolandia” RC
Economy
Year 2014
Environmental Park on environmental topics, renewable sources and reuse of electric vehicles for sustainable mobility.
EOS Service ARPACAL –
I.I.S.T. “Ettore Maiorana” di
Roccella Jonica RC
Educational Meeting Training /Information“ Environmental protection ”
Year 2015
Theoretical/Practical activity at the Laboratory of the Agency. Focus on the topic” how to spend from the waste of resources , from the culture of use and throw product consumption to the civilization of reuse and recycle , to the conservation of raw materials , especially no renewable ones , to the waste reduction”. The importance of recycle to reduce the impact on environment and climate.
Arpa Sicily (Regional
Environmental protection Agency)
Meeting: “The role of urban trees in reducing greenhouse gas effect ” 2015
Trapani territorial structure of ARPA Sicily has organized a meeting with the students of the Nautical Technical Institute on the theme of urban trees and the relation with greenhouse gas effect reduction. During the event the main contents of “Paris World Conference” on combating climate changes have been discussed.
Arpa Sicily (Regional
Environmental protection Agency), School
Institutions
Exhibition on Environmental Sustainability 2015
Itinerary Exhibition across the Sicilian territory to reach the Schools: 14 panels divided by 7 sections, the themes proposed starting points to analyze and study the main themes on the main values of sustainability with the aim of raising awareness, among the collectivity on the theme of sustainable development (water, waste, renewable energies, climate changes ) and to contribute to build active and informed of communities to the environmental issues.
Rete Clima®
Network (Information and action for sustainability and the fight
against climate change)
Environmental training on climate. 2014 ongoing http://www.reteclima.it/educazioneeformazioneambientaleclimatica/
https://www.reteclima.it/portfolio/outletbarberinomugellocarbonneutral/
Rete Clima ® is a nonprofit organization, founded in 2011 as a technical network for the promotion of sustainability through educational and training paths with particular awareness to the climate change issue at the local scale. It provides a concrete support to Enterprises and Public Administrations towards an improvement of their ecoefficiency performance . It develops a series of projects concerning carbon assessment, carbon management, carbon neutrality in partnership with them providing support to activities and actions. In 2015 Rete Clima ® in cooperation with McArthurGlen Barberino Designer Outlet (FI) developed a project for the annual carbon neutral exercise of the Designer Outlet, with the aim of evaluating and managing the carbon footprint , that is CO2 and greenhouse gas emission related to their commercial activities with the aim to combat climate changes. After the first phase of quantification of the annual carbon footprint ( 2016) several actions of energy efficiency, have been implemented with the aim of reducing energy consumptions and therefore related CO2
emissions .The action of environmental responsibility has concluded at the beginning of 2017 with the complete carbon offset of the retailer, until Barberino Design Outlet carbon neutrality. The carbon offset has been operated through support to an international carbon offset project ( according to project criteria expressed by UNFCCC) for the installment of a series of wind farms in Tamil Nadu in India. The project participated to technological transfer versus Developing Countries and participated to combat climate change.
In one year a series of energy efficiency actions have caused for the retailer the carbon Neutrality
Italian Climate
“Progetto Scuola” Italian Climate Network’s School Project is mainly
1,400 students across 9 regions.

318
Network Onlus (“School Project”) 2013 – ongoing http://www.italiaclima.org/attivita/conlescuole/
offered to secondary schools (students aged 14 – 19) and it is focused on the climate change issue, although an analysis of the context it fits in is also provided. The Project highlights the strong relations that connect the climate to sustainable development, energy, economics, international relations, health, agriculture and so on. A basic presentation on climate science, consequences and solutions is offered, with the chance of adding one or more thematic curses among “climate and energy”, “climate negotiations”, “climate and human rights”, “climate and health”, “climate and waste management”. In 20162017, the Project reached over 1,400 students across 9 regions.
World Environmental Education Congress (WEEC)
The European days of environmental education Bergamo 25 26 September 2014
www.europe.environmentaleducation.org
http://www.assiseseedd.org/journeeeuropeenne)
They took place in Bergamo on the 25th and 26th of September 2014, the PanEuropean days of environmental education and sustainability.
The first edition was held in Lyon (France) on the 4th March 2013. Participation was free and opened to all public and private actors that work for formal education, nonformal and informal learning. The days were preceded, on the 24th, by a national Italian meeting in conclusion of the first phase of construction of an Italian network for environmental education.
Istituto Oikos
SAME World Youth 4 Environmental Justice 20162017
http://youth4ej.sameworld.eu/
The Observatory against Environmental Injustice,
collects, monitors, and disseminates cases of environmental injustice and environmental migrants’ issues through social networks. The Observatory is an integral part of the S.A.M.E. WORLD project (Sustainability / Awareness / Mobilization / Environment in the global education for EYD 2015). It aims at increasing knowledge, raising awareness and mobilizing action regarding the issues of Environmental Injustice and Environmental Migration by collecting and monitoring relevant cases and material to be disseminated on the web, via the use of forums and social networks. The Observatory is designed to be used mainly by secondary school pupils, university students, and young people in general who are welcome to post, share, and comment on informational material about social injustice and/or environmental migrants’ issues.
Istituto Oikos
Un Clima che si può cambiare 20162017 http://www.istitutooikos.org/cosafacciamo/risorsenaturali/78/unclimachesipuocambiare
The campaign has underlined the strict connection between climate and food security. On the one hand, global warming can halve agriculture production in many countries by the end of this century; on the other hand, agriculture plays a relevant role in GHG emissions. To respond to this challenge, a number of actions must be implemented on both sides.
The project was active in Italy, Brazil and Tanzania. Italian students were virtually connected with their foreign counterparts to learn their circumstances and conditions.
The project was active in 3 Countries: Italy, Brazil and Tanzania
ICCG International Center of Climate Governance
Intiatives with schools Ongoing
http://www.iccgov.org/categoriesevents/perlescuole/
The International Center of Climate Governance offers lessons and visits for schools interested in deepening their knowledge on climate change and how the activity research on the topic is conducted.

319
Public awareness
At national level, the Ministry for the Environment, Land and Sea organised several communication
campaigns aimed at spreading environmental education and information at large and disseminating
European environmental policies.
On an annual base the Ministry of the Environment has adhered to the “European Mobility Week, the EU
campaign which has become over the years an international event that aims to encourage people to use
alternative means of transport to private cars. Its focal theme for 2017 "Clean, shared and intelligent
mobility”, with the slogan 'Sharing gets you further', invites local politicians and the public to experience
the benefits of shared mobility206.
With specific reference to Climate Change, and in view of the UN COP21 in Paris, in December 2015, the
central Government held, in Spring 2015, the States General on Climate Change.
The event was hosted at the New Hall of the Palace of the parliamentary groups in Rome and the
Government presented an overview of the risks, actions and opportunities related to climate change, and
invited the “Italian system” to put climate change at the heart of national policy.
A unique event of extraordinary importance at national and local level from educational, cultural and
scientific viewpoints, was the Global event Expo Milano 2015 hosted by the city of Milan from 1 May to
31 October 2015 involving all of Italy’s institutions. During the six months of the Exposition, the Theme
chosen, “Feeding the Planet, Energy for Life”, was analysed through indepth talks on food and the
sustainable use of resources, on the right to healthy, safe and sufficient food for the whole planet, and on
the search for and sharing of production and consumption models that are more respectful to the
environment and social equality.
The innovative aspects of Expo Milano 2015 were many: the pervading Theme "Feeding the Planet,
Energy for Life," the engagement with Visitors, the involvement of Countries in thematic Clusters, the
contribution of Enterprises and Civil Society, as well as many initiatives for schools and research
environments aimed at analysing the Theme indepth. In addition, Expo Milano 2015 paid close attention
to the sustainability of the Event, communicating in a transparent way and to all Stakeholders the
commitments undertaken and the results achieved in organising the Universal Exposition from social,
economic and environmental viewpoints. The involvement and active participation of all players and of
the whole world community contributed to ensure the kind of knowledgesharing which has always been a
feature of Universal Expositions ever since they began, and which made Expo Milano 2015 a place where
experience meets understanding.
EXPO 2015 experience was illustrated at the 4th Dialogue on Action for Climate Empowerment held at the
United Nations Climate Change Conference in Bonn, Germany on 18 and 19 May 2016. The Dialogue is an
annual forum for Parties and stakeholders to share their experiences, exchange ideas, good practices and
lessons learned regarding the implementation of Article 6 of the Convention, which relates to climate
change education and public awareness.
206 https://ec.europa.eu/info/events/cities-events/european-mobility-week-2017-2017-sep-16_it http://www.minambiente.it/pagina/campagne-ed-iniziative

320
In order to stimulate the debate on ESD (Education for Sustainable Development) among students and
mobilise youth, an event, called “States General of Youth on Environment” has been organised in
Rome, in the framework of the Earth Day celebrations (2122 April 2017). More than one hundred of
highschool students gathered in Villa Borghese (Major Park of Rome), in order to elaborate a youth
Declaration on EE/ESD. The declaration was presented to the World Political Leaders during the G7
Environment, to be held in Bologna in June 2017, as well as in other highlevel international events.
Recognizing that communication for sustainable development undoubtedly have a key role to play in
raising awareness and in building coalitions that amplify advocacy efforts among policymakers, the
private sector and local communities, the Ministry for the Environment, Land and Sea of the Government
of Italy supported the establishment the Communication for Climate Change MultiDonor Trust Fund (CCC
MDTF) at the World Bank in January 2009. In 2014, the CCC MDTF was honored to announce the addition
of a new donor to the Trust Fund program: the Federal Ministry for Economic Cooperation and
Development (BMZ) of Germany, and since then, with more than 400 partners from civil society, media
networks, international organizations, academic institutions, youth groups and private sector
representatives, the Communication Program Connect4Climate grew as the flagship global partnership
program.
The main objectives fulfilled by Connect 4 Climate are not only to raise awareness about climate change
and its impacts at various levels: public at large, private sector, and policy and decisionmakers, but also
to promote commitment among the public, private sector and policymakers to take action and build
coalitions for further advocacy efforts.
Connect 4 Climate increased its reach and impact over the past years. Many successful activities were
completed under each of the three components of the MDTF: Support to Operations, Research and
Capacity Building and Advocacy and Fund Leveraging.
From having launched with a photo and video competition targeting African youth in 2011, to running
global youth competitions, to building a knowledge network of more than 400 partners, to supporting
World Bank operations across the African continent, to organizing highprofile and mass public outreach
events that reached a potential audience of 4.4 billion during the UNFCCC COP21 in 2015, to presenting a
successful and innovative video competition at the UNFCCC COP22 in 2016 in Marrakech, C4C has grown
to be an influential program advocating for climate action to end poverty and promoting climate solutions
through diverse and creative means to help promote shared prosperity.
C4C complements the World Bank Group (WBG) Strategy to achieve its twin goals to end extreme
poverty and promote shared prosperity by researching on the theory and practice of climate change
communication, as well as designing and delivering capacity building activities and building effective and
strategic partnerships with the private sector, civil society and foundations focused on climate change,
and more.
In June 2017, to raise awareness among the civil society, IMELS organized, in collaboration with
“Connect4Climate”, “All4theGreen” , a set of initiatives aimed at various types of public and organized in
collaboration with civic, cultural, university, environmentalist, consortiums and associations, and dozens
of companies that have decided to support the appeal for an economy that highlights efficiency saving
and reusing resources.

321
A "container" of 70 events open to the utmost participation of the public in preparing, introducing and
"sensitizing" the G7 Environment 2017, the intergovernmental meeting between the most industrialized
countries of the Earth that took place in Bologna on June 11 and 12, 2017. National institutions and local
authorities, universities, associations companies have been involved in the organization of this dense
program of initiatives focusing on environmental protection, climate change and the circular economy.
In October 2017 the Italian Ministry for the Environment has organised the International Summit “Water
and Climate – Meeting of the Great Rivers of the World”. Awareness raising initiatives on the impact of
climate change on water have been organised in various squares of Rome during the three days of the
Summit .
Besides these National initiatives, that have involved many Italian cities, also Municipalities, Regional and
Provincial Administrations and Regional Environmental Agencies (ARPAs) have realized important
initiatives aimed at raising the awareness of citizens (young or adults) to climate change issues through
specific Communication Campaigns.
PUBLIC AWARENESS: List of some initiatives carried out since 2014
Organisation/
Promoter
Name of the activity Short Description Indicators/Num
bers
Ministry of the Environment and Protection of Land
and Sea and by Expo
2015 S.p.A.
“Towards a Sustainable Expo” Programme
Milan EXPO 2015
Created by the Ministry of the Environment and Protection of Land and Sea and by Expo 2015 S.p.A., together with all the Participants in the Universal Exposition of Milan, this programme aimed to stimulate and encourage closer attention to sustainability and enhancing voluntary initiatives capable of making the Exposition of Milan a more sustainable Event.
Expo Milano 2015 strongly encouraged the commitment to limit the environmental impact caused by its own participation, highlighting the most relevant solutions (best practices, innovative technologies, original ideas and projects) and disseminating them, also as a legacy for the future.
The Participants at “Towards a Sustainable Expo”, (called “Players”), present their solutions regarding four categories:
sustainable architecture with reference to the projects for the Pavilions and Exhibition areas;
sustainability of the food offered by the refreshment or catering services;
application of green procurement criteria for furniture, packaging and merchandising;
other initiatives or particular projects on environmental and sustainability themes.
Ministry of the Environment and Protection of Land and Sea and RSE
“Smartainability”
Milan EXPO 2015
Through the project, RSE – (Ricerca Sistema Energetico of the GSE Group), assessed the
level of sustainability (in terms of environmental, economic, energy and social benefits) of the innovative technologies implemented by the Partners on the Exhibition Site compared to conventional

322
ones. Savings estimated and presented to the public in order to raise awareness on sustainability challenges were:
90 thousand MWh of primary energy from fossil sources,
21,000 t of CO2, 36 t of nitrogen oxide, 62 t of sulphur dioxide, more than 5,000 kg of particulate, of which more than 4,000 kg was fine;
€6 million of minor costs for materials and maintenance.
Ministry of the Environment and Protection of Land
and Sea
Kyoto Club
Campaign “Sostenibilmente”
2017
A series of webinar were organized by the Kyoto Club and funded by the Ministry for the Environment, Land and Sea, in order to disseminate and sensitize the civil society on the goals of the Paris Agreement
Ministry of the Environment and Protection of Land
and Sea and UNFCCC secretariat
“The EXPO 2015 experience”
1819 May
4th ACE Dialogue in Bonn
Ms. Fiona May, permanent representative at the Italian National Olympic Committee, spoke about raising public awareness on climate change at the World Expo Milano 2015
Università delle Tre Età (Unitre Susa);
Arpa Piemonte
Meeting – Workshop on climate changes
2017
A meeting on climate change and most relevant aspects at local and regional level addressed to citizens (march 2017).
Municipality of Bolzano
KlimaenergyAward 2015 (Seventh edition)
26 Marzo 2015 , Bolzano Fair
http://www.klimaenergyaward.it/142/
Klimaenergy Award is a competition that rewards the most virtuous Italian public entities in the energy field. It consists of a review of good environmental practices planned and implemented by the Italian municipalities and provinces to contribute to the improvement of Italy’s ranking with respect to the objectives to be achieved by 2020 in terms of energy efficiency, renewable energy production and pollution abatement. Promoted by Bolzano Fair and Bolzano Savings Bank Foundation, the award builds on tangible results and on replicability of projects in other public administrations.The winners of the seventh edition of Klimaenergy Award are: Tavagnacco (less than 10,000 inhabitants) Forlì (inhabitants between 20.000 and 150,000) and Bologna (more than 150,000).
28 Municipalities have participated
(From 19 in 2010 to 28 in 2015)
Autonomous Province of Trento
Department for Civil Protection Risk
Prevention Service Trentino Climate
Observatory
1. Edmund Mach
Foundation
2. Provincial Agency
for the protection
of the
environment
(APPA)
3. University of
Trento
4. Museum
Trentino Observatory on climate
The Trentino Observatory on climate has
been established by the provincial junta in
2010 and carries out the technical and
scientific coordination of Trentino territory
commitment on research and monitoring
activities of climate variables, and scientific
dissemination activities, information and
education campaigns.
http://www.climatrentino.it/

323
tridentino of
natural sciences
5. Bruno Kessler
Foundation
6. Trentino
glaciology
committee
Natural Park Adamello Brenta
Autonomous Province of Trento
Climatesaving menus 2010, ongoing http://www.pnab.it/vivereilparco/dovemangiare.html
An information campaign to raise awareness on the climate impact of food, carried out by the Natural Park of Adamello Brenta, in collaboration with the EcoInstitute of Bolzano and with a number of restaurants located in the municipalities within the Park. Climatesaving menus have been designed taking into account sustainability criteria and revealing the climate impact in kilograms of CO2 emissions of each dish.
ARPA EmiliaRomagna
Regional Environmental
Agency of
EmiliaRomagna
UHI Project (Urban Heat Island) “Development and application of mitigation and adaptation strategies
and measures for counteracting the global Urban Heat Islands phenomenon”. 20122014 http://www.euuhi.eu/
UHI Project aims at developing mitigation, risk prevention and management strategies concerning the urban heat island (UHI) phenomenon. The UHI is a microclimatic phenomenon that
occurs in the metropolitan areas. It consists in a significant increasing of the temperature in the urban area respect to the surrounding periurban and rural neighbourhoods. In particular, the project intends to provide a deeper knowledge on the manmade risk of the UHI and its interactions with global climate change and set up suitable strategies for the mitigation of and the adaptation to UHI. For these purposes a communication campaign was realized by UHI Project is developed in 8 of the most relevant metropolitan areas in Central Europe, in Italy are the metropolitan cluster of Bologna – Modena and the urban corridor of Venice – Padua.
Connect 4 Climate and the Ministry of
the Environment and Protection of Land
and Sea
“All4theGreen”
Bologna 512 June 2017
https://connect4climate.com/initiative/millionsconnectedall4thegreenweeksupportingambitiousg7environmentoutcome
The All4TheGreen week in Bologna featured more than 80 events under the auspice of the Italian G7 Presidency that connected the G7 Environment Meetings to a global audience from June 5 to 12. Coordinated by the Connect4Climate program of the World Bank Group, a coalition of businesses, NGOs, academia and local and regional authorities called for greater awareness of climate and environmental issues, declaring that they are all in support of the green transition to a lowcarbon, resilient, and sustainable future.
EuroMediterranean Center on Climate Change Foundation
Smart Agriculture in a Climate Changing World
EXPO 2015 Padiglione della Società Civile Cascina Triulza,
Milano – 07 September 2015
http://cascina.fondazionetriulza.org/en/initiative/smartagricultureinaclimatechangingworld/5535/
The event organized by CMCC was part of EXPO 2015 and offered a view about interlinks between food and climate change.
Agriculture, food security, food production, and even food culture: all these sectors interact with the climate system, all of them contribute in some way to the changing climate and each of them is affected by climate change impacts.
While the scientific community plays a crucial role in increasing knowledge related to climate change, it is a multidimensional topic which requires the collaboration of

324
several and different skills: policy makers, economists, experts in landuse, agriculture, water management, food, ecosystems, energy and sustainability.
The event highlighted in which way climate change is interacting with agriculture and food related sectors and cultures, giving some clue on future scenarios for the forthcoming years and on the Planet we are going to leave to the youngest generations.
Arpav,
University of Padova,
Botanical garden
Pills of sustainability
2014
http://www.arpa.veneto.it/serviziambientali/educazioneperlasostenibilita/fileeallegati/ortobotanico2014/Programma%20ARPAV_La%20Scienza%20in%20Orto.pdf
Some focus on environmental education by ARPAV experts on climate change, waste , metereology, within the Project “ “The science in the garden” organized by the Unibersity of Padova at the botanical garden. The main objective is to promote a dialogue with families and citizens to let them play an active role with the institutions in order to safeguard the environment.
14 focus (7 on waste and 7 on meteorology and climate change)
200 citizens involved
Arpav,
Aqua srl di Taglio di Po (RO)
Municipalities of Belluno, Verona, Venezia, Padova
La Fenice Foundation of Padova
Venice National History Museum
Ideas of sustainability
2016
http://www.arpa.veneto.it/serviziambientali/educazioneperlasostenibilita/educazio
neambientale/ideedisostenibilita
Meetings to promote the environmental culture and the sharing of ecological behavior which make the difference and reduce the impacts of daily actions on the environment. The meetings have been addressed to families and citizens on the
following topics:
climate change, air, water, soil, waste, electromagnetic fields and noise.
4 provinces 34 days 450 adults
University of Genova Faculty of
Architecture
International Forum MED.NET RESILI(G)ENCE
2538 October 2016 – Faculty of Architecture)
Within the Forum aimed at developing a new strategic and perspective approach to urban landscape, ARPAL made an intervention on Ligurian and climate change also focused on climate resilience urban environment .
Conference Public: 500600 people
Doria Natural History Museum of Genova
ARPAL Regional Environmental
Agency of Liguria
Tuesday Pro Nature at Doria Museum
Meteo climatic events on Mediterranean area looked through photography
28 march and 12 December 2017
“METEOCLIMATIC EVENTS WITHIN 2016 AND 2017”, looked also through photography: a conversation with the showing of digital images on a big screen. Through a series of photographs have been represented different meteorological situations characterized by extreme events, hot weather persistence and drought, in the context of a Mediterranean climate extremisation linked to an almost annual change of air circulation which have recently interested most of Italian territory, Liguria included.
Conference Public : 4060 people

325
Arpa Sicilia
(Regional Agency for the Protection of the
Environment)
M’illumino di meno
“I am enlightened less”
2014 / 2017
http://www.arpa.sicilia.it/news/11899/
Dissemination and promotion of M’illumino di meno Campaign. Arpa Sicilia as In.F.E.A. Regional Laboratory, participated to this initiative by organizing a dissemination event for citizens, schools and institutions During 2017 edition in addition to switch off public lightening they proposed also gestures of sharing against waste of resources in all fields: food waste , mobility, communication…) for the benefit of “sociality
Arpa Sicily
(Regional Agency for the Protection of the
Environment)
World Environment Day
“Seven billion dreams. One Planet. Let’s consume with moderation".
2015
http://www.arpa.sicilia.it/educazione/6520/
On the occasion of the World Environment Day 2015” , ARPA Sicily has organized an awareness raising event at “Uditore a Palermo” urban Park to disseminate environmental sustainability values among users of the Park also: an exhibition area with an information booth of ARPA and its moving laboratory on air quality. The event has been disseminated through In.F.E.A Network and local organizations. Several schools participated also to the event.
Arpa Sicily
(Regional Agency for the Protection of the
Environment)
Action Plan for Sustainable Energy (PAES)
Information and Training activities addressed to citizens for the adoption of sustainable behaviors for the reduction of energy consumptions and CO2 emissions.
Kyoto Club
Kyoto Club Web Portal
http://www.kyotoclub.org/
Kyoto Club is a nonprofit organization which promotes awarenessraising initiatives, information and training to foster energy efficiency, renewable energy sources and sustainable mobility. Its members are all engaged in reaching the greenhouse gases reduction targets set by Kyoto Protocol.
Kyoto Club
“Sustainably” Project
“Sustainably” is the Kyoto Club new project with the support of the Italian Ministry of the Environment, Land and Sea aimed at the dissemination of the Paris Agreement, of the National Strategy for Sustainable Development, of the results of Cop Conferences and of the latest EU decisions with regard to adaptation and mitigation of climate change effects, energy and energyefficiency, efficient resource management, bioeconomy and circular economy . The project activates students and Local Authorities against climate change, contributing to awareness raising on this subject.
Kyoto Club
Workshop”Organic Agriculture as a response to climate change”
20 September 2016
The workshop focused on organic agriculture as a mitigation tool for climate change. Scenarios , outlooks and commitments for each european country following Paris Agreement (COP 21)
https://www.kyotoclub.org/documentazione/video/2016set20/lagricolturabiologicacomerispostaalcambiamentoclimatico/docId=5782
Kyoto Club
Report “105 best practices of energy –efficiency in Italy”
Book: In 2016 Kyoto Club has published 105 best practices of energyefficiency in Italy. The book presents more than one hundred of concrete examples to replicate varying from industry to public administrations to
105 best practices of energy –efficiency in Italy”

326
tertiary, communication and didactics. These best practices are replicable
Kyoto Club
“10.000 Trees for Pantelleria” Civic Crowdfunding campaign for improving the environment https://www.kyotoclub.org/chisiamo/iniziative
10.000 Trees for Pantelleria” is an extraordinary fundraising campaign launched in cooperation with the Municipality of Pantelleria, the University of Palermo and Marevivo Association to contribute to the reconstruction of part of the forest heritage of the Island of Pantelleria partially destroyed from a fire in May 2016. This crowdfunding campaign which counts 131 supporters has collected € 35.030 on € 300.000 (12% of the total amount).
The Civic Crowdfunding campaign has got 131 supporters
9.2 Public access to information
Starting from the assumption that new technologies have substantially changed the way information is
disseminated public access to information has necessarily changed too and transformed. In the last few
years thanks to this rapid transformation new channels and methodologies have ensured citizens an
always more rapid access to information.
As a consequence several innovative and practical initiatives have been implemented at national and
local level to improve citizen information on climate change issues. New web tools have been developed
like observatories, platforms, webinars and social web pages together with usual newsletters, electronic
information systems, web sites, information desks, conferences and workshops, most of them organized
and promoted by Italian Ministry of Environment and ISPRA.
A recent example of punctual and integrated access to environmental information at national level is the
Newsletter “AmbienteInforma”. This is the informative product of the New National System for
Environmental Protection (SNPA), established by Law 132/16 constituted by 19 Regional and 2 Province’s
Environmental Protection Agencies and coordinated by ISPRA. The first edition of “AmbienteInforma
Newsletter was issued on May 2016. On a weekly base environmental information is provided to citizens
at local and national level even focusing specifically on climate change issues.

327
List of some initiatives carried out since 2014
Organisation/ Promoter/
Name of the activity Short Description Indicators/Numbers
SNPA
Newsletter AmbienteInforma
1st issue : May 2016
http://ambienteinformasnpa.it/ilcambiamentoclimaticonelsnpa/
Weekly Bulletin collecting all the information of SNPA, edited by a Working Group on Communication composed by representatives of ISPRA and all the 21 ARPA and APPA. The Working Group is coordinated by ARPA Tuscany.
The edition n. 41 of March 2017 includes a Focus on Climate changes and its environmental risks and a video on impacts, adaptation and vulnerability of climate changes prepared for the Italian Focal Point of Ipcc.
From May 2016 until Sept. 2017:
69.000 visitors
209.000 visits
About 80.000 recipients
The edition n. 41 had 22.000 visitors and 5.200 visits
ISPRA
ISPRA web site
Ongoing and past events and news
http://www.isprambiente.gov.it/it
The Communication Unit of ISPRA manage the web site of the Institute in which numbers of events, conferences, with ISPRA experts participating, and news were spread on climate change and related activities and which publication can be downloaded.
No. of News: 60
No. of Events: 10
No. of Publications: 33
ISPRA
Environmental Data Yearbook
Edition 2013
20142015
Edition 2016
Edition 2017 (in publication)
http://www.isprambiente.gov.it/en/publications/stateoftheenvironment/environmentaldatayearbook2016edition?set_language=en
The Environmental Data Yearbook is the most extensive and complete collection of official environmental statistics published in Italy, prepared by ISPRA through a consolidated collaboration with the regional environmental agencies and provincial agencies, now SNPA System, the National System of Environmental Agencies, that combines direct knowledge of the territory and local environmental issues with national policies for prevention and environmental protection so that has become an institutional and technicalscientific reference point for the whole Country.
The Report includes a chapter on “The perception of European and Italian citizens on the environment, climate change, waste management and resource”.
Each year ISPRA organizes a public event for the presentation of the new edition of Databook.
No. of downloads: more than 1300
No. of participants to the Conferences: around 900 participants to the 3 events
ISPRA
Report on Urban Environment Quality 2017 edition
2016 edition
2015 edition
2014 edition
http://www.isprambiente.gov.it/en/ispraevents/xiiireportonurbanenvironmentquality2017edition1?set_language=en
The report is published by the National System for Environmental Protection SNPA, and it has become over the years a reference for professionals and for users, thanks also to analyzes and assessments provided by the SNPA experts on the numerous data presented, which help the reader to understand the phenomena. The 2017 edition of the report provides the updates for all the 119 ( 116 Italian provincial capitals plus the 3 cities most populated) of a set of core indicators for the analysis of the urban environmental quality and urban quality of life in the Italian cities.
The 2014 edition includes a focus on “Cities and the Challenge of climate change”
The report is issued each year and it has
Participants (2 conferences): 375
Downloads: 5671 at 30/09/2017 (edition 2015)

328
came to the 13th edition. ISPRA organizes a
public event for the presentation of the new edition. Since 2007 the Report is completed with a Focus on a specific topic, and for 2017 will face the Sustainable Urban mobility.
ISPRA
Sapienza University of Rome
The major urban challenges: climate change and environmental quality,
Congress in Rome, March 31, 2015
http://www.isprambiente.gov.it/en/archive/ispraevents/year2015/march/themajorurbanchallengesclimatechangeandenvironmentalquality?set_language=en
Based on the work done by the National System for Environmental Protection (ISPRA / ARPA / APPA) the 2014 Report on Urban Environment Quality 2014 and the Focus dedicated to climate change ISPRA and Sapienza University of Rome / DICEA organize a congress addressing the ability to assess the environmental quality of the Italian cities in relation to broad environmental mitigation and adaptation to climate change.
Participants: 225
(Researchers and the professionals operating in the field, public administrations and environmental associations)
ISPRA
Coastal Erosion and climate change: adaption strategies, management and environment al sustainability, Workshop in Rome, 3 November 2015
http://www.isprambiente.gov.it/en/archive/ispraevents/year2015/nove
mber/coastalerosionandclimatechangeadaptationstrategiesm?set_language=en
The Workshop aimed to spread and share national and international scientifictechnical results of the Project INTERCOAST, POR FESR 20072013 Lazio relating to "Policies of Adaptation and Sustainable Protection of Coastal Zone considering to erosion and changes Climate", Objective Competitiveness and Employment Axis II Interregional Cooperation, in partnership with Generalitat of Valencia with Agency
FEPORTS

329
ARPA Emilia Romagna
Regional Environmental Agency
of EmiliaRomagna
BLUE AP Project Bologna Local Urban Environment Adaptation Plan for a Resilient City. http://www.blueap.eu/site/ 20122015
BLUE AP is a LIFE+ project for the implementation of an Adaptation Plan to Climate Change for the Municipality of Bologna, providing for some concrete local measures to test, in order to make the city more resilient and able to meet the climate change challenges. The BLUE AP planning and testing actions developed in the city of Bologna will lead to the creation of guidelines useful for the definition of similar adaptation plans, that can be adopted by other mediumsize Italian cities. Bologna will be the pilotcity that, first in Italy, will face climate changes with the appropriate and creative tools. The City of Bologna, as a joint effort with the project partners (ARPA EmiliaRomagna, Kyoto Club and Ambiente Italia), will implement a Local Adaptation Plan that will make the city more resilient and prepared to handle the consequences of climate change. This also occurs through the creation of a Local Climate Profile and the involvement of stakeholders and citizens on the territory.
The web site and platform is still ongoing and acting as ain information portal on initiatives carried out in the city of Bologna related to resilient cities and climate change.
University of Ferrara
Centre for Research on Territorial Resilience,
MultiHazard Risk Assessment and
Mitigation (TeRRA)
IUAV University of Venice
Resilience an Agenda for the Government for climate change adaptation, Ferrara, 1920 February 2016
http://www.alternativasostenibile.it/articolo/resilienteunagendadigovernoperladattamentoalcambiamentoclimatico.html
The research center TeRRA of the University of Ferrara, in collaboration with the Department of Design and Planning of University IUAV of Venice, organized a symposium on the territorial resilience and the adaptation of cities to climate change, a round table among some of the most important Italian experts in various disciplines and institutions with a large number of directors and policy makers at different levels of government: national, regional and local.
Municipality of Assisi
UNESCO DESS
The role of LGMAs in climate actions on adaptation and mitigation: Italian case studies, Side event during CoP 22 UNFCCC in Marrakech, 15 November 2016
http://www.isprambiente.gov.it/files/notizieispra/notizie2016/COP22_City_of_Assisi_Programme_draft.pdf
In the framework of the UNESCO Week for Education to Sustainable Development (DESS) 2016, the event was organize as side event during CP22 of the UNFCCC in Marrakech and aimed to describe the role of Local Government and Municipal Authorities (LGMAs) in carrying out mitigation and adaptation actions, within
the framework of sustainable development (environmental, economic and social) and in line with the Sustainable Development Goals (11. Sustainable Cities and communities; 13. Climate Action).

330
Italian Ministry of the Environment, Land and
Sea
The new challenge of the climate and energy policies integration: the Italian perspective
Side event during CoP 22 UNFCCC in Marrakech
17 November 2016
The sideevent " The new challenge of the climate and energy policies integration: the Italian perspective" was presented in Marrakech, organized by the Presidency of the Council of Ministers, in which the activities of the Working Group on a low carbon were presented by ISPRA, ENEA and Politecnico of Milano. http://www.isprambiente.gov.it/files/notizieispra/notizie2016/SideEventITALIANPRECIDENCYOFTHECOUNCIL.pdf
Kyoto Club
Italian Ministry of the Environment, Land and
Sea
Municipality of Rome
Italy, the climate challenge and the circular economy. After Paris and towards the EU 2030 objectives,
Conference in Rome,
16 February 2016
The Conference was held in Rome on February 16, on the day of the entry into force of the Kyoto Protocol.
https://www.kyotoclub.org/prossimieventi/2016feb16/litaliaelasfidadelclimaedelleconomiacircolaredopoparigieversogliobiettiviueal2030/docId=5117
Fiera delle Utopie Concrete 2016
Alleanza per il Clima Onlus
Climate change. What adaptation for agriculture?
Workshop in Città di Castello (Perugia), 36 November 2016
One year after EXPO Milano and the Paris Agreement on climate change, the event debated the ecological conversion in Italy in 3 different key actions : agriculture, food and climate.
http://www.isprambiente.gov.it/it/archivio/notizieenovitanormative/notizieispra/2016/11/ilclimacambia.qualeadattamentoperlagricoltura
ICCG International Center for Climate
Governance
(an initiative of Eni Enrico Mattei
Foundation and Giorgio Cini Foundation)
Building resilience to climate disaster risk: innovation and best practices
Best Climate Practices 2017 Award Webinar
In conjunction with the first week of COP23, ICCG organizes the “ICCG Climate Week”, a series of webinar lectures and dissemination activities on climate change sciences and governance, mostly linked to its observatories’ activities and awards. This webinar, which is dedicated to the Best Climate Practice Award, is the occasion to showcase the most innovative and compelling projects that have participated in the 2017 edition of the contest, and to explore the landscape and challenges of climate resilience and disaster risk reduction strategies.
http://www.iccgov.org/event/svilupparelaresilienzalocaleaidisastriclimaticiinnovazionemiglioripratichebestclimatepracticesawardwebinar/
9.3 Public participation
A strong encouragement to public participation on climate change policies and related measures has been
promoted by environmental NGOs and nonprofit organizations. Their commitment proves to be always
more relevant in raising public awareness and fostering public participation especially among young

331
people by promoting simple actions accessible to all, able to give a small contribution to the protection of
our planet.
Such actions include the testing of active citizenship practices in order to give young people spaces and
tools to express their critical viewpoint and their proposals on key environmental issues and climate
change, but also with regard to the cultural, social and economic context in which they live and in which
their personality is taking shape.
The initiatives launched by NGOs and Youths are often welcomed and willingly supported and sponsored
by Italian Ministry of the Environment, as for the very important initiative “ Italian Youth Think Tank on
Intergenerational Equity” aimed at drafting a policy proposal for the implementation of the
intergenerational equity principle to be included within the global climate change agreement, which was
later signed as Paris Agreement. Under the supervision of a scientific committee, a number of young
representatives from Italian youth organizations contributed to the final document, named “Italian Youth
Declaration on Intergenerational Equity”.
New technologies demonstrated to be an important tool to actively involve citizens in themes related to
climate change, particularly about “Adaptation”. The Smartphone applications the so called “App” for
example make citizens actively participate by giving immediate information on localisation of extreme
events , meteorological events or environmental phenomena. The development and implementation of
this new tool is part of the communication plans of several projects and National campaigns. The citizen
science shows to be the new participatory process to increase resilience of citizens to climate change.
Concerning bottomup approaches in Italy there is a significant experience in the field of “River’s
Contracts”, local processes of participatory governance for the protection and sustainable management of
river basins (but also lakes and other aquifers), with the active involvement of all relevant private and
public actors . Several of these contracts originate from the need to fight the effect of climate change in
the basin, mainly in terms of flooding.
A national board of Rivers contract, gathering all the major local experiences is in place since 2008 with
the active participation of the Ministry for the Environment. A national observatory is on course of being
launched, within the Ministry for the Environment, to monitor and promote these instruments, and to
trigger their potential contribution to the implementation of the measures identified at the basin level.
It’s worth to mention also two conferences organized last years by the Italian Council of Ministers and the
Ministry of the Environment, the States General on Climate Change and on Environmental Education,
opened to NGOs and civil society.
The following table provides some examples of actions for promoting and facilitating public participation
on climate change policies and related measures.
List of some initiatives carried out since 2014
Organisation/
Promoter Name of the activity Short Description Indicators/Number
s
Presidency of the Council of Ministers
StatesGeneral on Climate Change and Hydrogeological
Instability, Rome, 22 June 2015 http://www.minambiente.it/comunicati/climagallettii
Presidency of the Council of Ministers organized the StatesGeneral on climate
change and hydrogeological instability with the aim of receiving the opinions and contributions from various stakeholders as well as to present the strategies adopted by the Italian Government to

332
l22giugnostatigeneralisuicambiamenticlimatici
contribute to climate change mitigation and adaptation in view of COP21.
Italian Ministry of the Environment, Land and
Sea
Italian Ministry for Education, University
and Research
StatesGeneral on Environmental Education,
Rome, 2223 November 2016
http://www.minambiente.it/comunicati/educazioneambientale2223novembreglistatigenerali
The second National Conference on Environmental Education was a twoday event with the participation of ministers, national and international institutions, academic, research, NGOs and civil society representatives.
On the first day, twelve roundtables were organized to discuss specific topics and drafting recommendations. Conclusive proposals from roundtables were merged into a final document setting a program of commitments in the medium and long term.
On the second day, a public conference with the presence of the Minister of Environment and the Minister of Education was convened.
Ministry of Economic Development
Ministry of the Environment, Land and
Sea
Italy’s National Energy
Strategy (Sen 2017)
Public consultation on the New National Energy Strategy
The National Energy Strategy is the result of a one year wellstructured and shared process which has involved since the preliminary phase, the public entities operating in the energy context, in the transport of electricity and gas as well as
relevant experts of the energy sector. After this phase the proposal has been submitted to a public consultation during a period of three months.
Results: a wide participation, comments and observations from associations, enterprises, public organisms, citizens and representatives from Universities.
251 complete contributions
838 thematic contributions
40 one to one meetings
5 workshops
9700 visualizations of the dedicated web page of the Ministry of Economic Development
Department of Civil Protection, INGV –National Institute of
Geophysics and Volcanology, Anpas
National Association of Public Assistance and ReLUIS Laboratories University Network of seismic engineering.
National Communication Campaign “I don’t take risks: are you ready?”
Subcampaigns:
I don’t take risks Flood
I don’t take risks Tsunami
I don’t take risks Earthquake
Year 2017
http://iononrischio.protezionecivile.it/en/homepage/
Io non rischio (I don’t take risks) is a national communication campaign on best practices of civil protection. Italy is a country exposed to many natural risks, and this is a fact, but it is also true that the individual exposition to such risks can be considerably reduced through the knowledge of the problem, the awareness of the possible consequences and the adoption of a few simple expedients. And through knowledge, awareness and best practices being able to say, exactly: “I don’t take risks” . It is about training volunteers of civil protection on risk knowledge and communication and then make them go on the streets of their cities and towns to meet citizens and inform them. The voluntary work associations of civil protection are everywhere in Italy. Volunteers live and operate on their own territory, they get to know it and are, in turn known by local institutions and citizens. Every risk is illustrated and communicated to the citizens along with the best practices to reduce the impact on people and things. Participate to the campaign local sections of national organizations, regional associations and local groups.
103 cities where the
campaign is carried
out
751 organisations
participate to the
campaign

333
Municipality of Bologna PlayBlueAp,
Created in 2015
http://playblueap.herokuapp.com/
PlayBlueAp is the first Smart online device which aims to actively involve the citizens in themes related to climate change, particularly about the Adaptation Plan of the Municipality of Bologna has arranged as a part of the project LIFE+ (LIFE11 ENV/IT/119) BLUE AP.
The APP is intended to be used as a tool to spread the scientific knowledge derived from the Blue AP project, under the supervision of the Municipality of Bologna and to gather the adaptation abilities of the inhabitants.
The Bologna residents are called upon to make something concrete for their town through a certain number of suggested activities divided online into the following categories: agriculture, buildings, resilience, green spaces, water, mobility.
Municipality of Rome “Rome Towards COP21” Rome, October 2015
https://www.comune.roma.it/pcr/it/newsview.page?contentId=NEW954524
Awareness campaign on climate change ahead of COP21. The initiatives aimed at involving students, stakeholder and institutions to promote and discuss local measures to tackle climate change and improve life quality in cities.
Italian Climate Network
in cooperation with
WWF Italy
Italian Think Tank on
Intergenerational Equity 20142015
http://www.italiaclima.org/attivita/equitaintergenerazionaleilthinktank/
The Italian Youth Think Tank on
Intergenerational Equity was an initiative aimed at drafting a policy proposal for the implementation of the intergenerational equity principle within the new global climate change agreement. Under the supervision of a scientific committee, a number of young representatives from Italian youth organizations contributed to the final document, named Italian Youth Declaration on Intergenerational Equity.
The Declaration was finalized ahead of Lima COP20 and submitted to the Italian Minister of the Environment.
At COP21 in 2015, also thanks to the support of the Italian Minister of the Environment, the principle of the Intergenerational Equity was included into the preamble of the Paris Agreement.
Link to the Declaration.
Italian Climate Network
in cooperation with
WWF Italy
RAI Radio 2
“Caterpillar” radio broadcast
M’illumino di meno “Let’s brighten less” Energy Saving Day campaign 1 week each year, during the month of February http://caterpillar.blog.rai.it/milluminodimeno/ Edition 2017: Let’s switch off the lights to switch on the stars”
Energy Saving Day is a national communication campaign dedicated to energy saving policies. This annual campaign was launched for the first time on February 16th, 2005, sponsored by the Ministry of the Environment, Protection of Land and Sea and also supported by the EU. Everybody is asked to reduce to the minimum their own private energy use during the show's airtime from 6:007:30pm. By doing this the maximum visibility in the media and the largest participation by common people are concentrated on Energy Saving Day.
451 thoughts on “M’illumino di Meno”
13100 Tweets
2613 Following
44000 Followers
4131 I like

334
High Adriatic River Basin Authorities
supported by the European Commission, the Italian Ministry of
the Environment, Land and Sea, the Italian
Civil Protection
#COWM16: in Venice the citizen Observatory
for water risk
International Workshop COWM (Citizen Observatories for Water Management).
7 10 June 2016 Venice
Citizen Science theory applied to water risk to enhance resilience. Resilience is the capacity of reaction and adaptation of people to climate change to save human lives and reduce economic losses. A continuous feedback between the civic network and the operating Centre of the Civil Protection. Experts of hydrogeological management from all over the world met at this meeting to share ideas and to present initiatives aiming at optimizing decisionmaking by authorities in case of catastrophic events. It was showcased an experimental project, an app for smartphone as a useful tool directly in the hands of the citizens for monitoring Po river banks in case of floods. In Italy the pilot city to implement the project was the city of Vicenza who involved more than 130 volunteers who through the use of smartphones cooperated to reduce floods damages. https://ec.europa.eu/futurium/en/content/citizenobservatorieswatermanagementconferencepalazzolabiavenice79june2016
Italian Climate Network Onlus
Legambiente
Kyoto Club
Rome’s Climate March Rome, Via dei Fori Imperiali
21 September 2014
http://www.italiaclima.org/newyorkchiamaroma21settembrevieniinpiazzaconn
oi/
Climate march convened in occasion of the UN Climate Summit held in New York in September 2014. The initiative was promoted by Power Shift Italy coordination, Italian Climate Network, Legambiente, Kyoto Club and other organizations. The event registered the
attendance of a few thousands of participants as well as the presence of the President of the Chamber of Deputies and of Rome’s Deputy Mayor for the Environment.
WWF Italia
with the patronage of the Municipality of
Bologna
Climate change: resilient cities’ challenge
18 November 2017
https://www.wwf.it/news/appuntamenti_wwf/?35160%2FIl18novembreaBolognacittaresilienti
The workshop is aimed at addressing the challenge of urban areas. These ones at the center of the challenge that institutions and populations, with the support of the world of research and science, have to face in setting up local action plans and identifying effective and immediate action priorities for adapting to change climate and to tackle a global and national situation characterized by the alternation of extreme drought and floods
Coalizione Clima
Marcia per il Clima (Climate March)
Rome, Via dei Fori Imperiali
29 November 2015
http://www.ansa.it/canale_ambiente/notizie/clima/2015/11/25/climadaromaatokyocittadiniinmarciapersummitparigi_fb418a94ee1c43cca21fbeca3e6574d6.html
Climate march and concert organized ahead of the beginning of COP21. The initiative was promoted by the Coalizione Clima, an Italian coalition of over 100 members including NGOs, movements, youth organizations, trade unions and other entities.
Over 10,000 people attended the event
350.org “One Earth, One People of faith, civil society groups, and

335
FOCSIV
OurVoices
Human Family: climate march in Rome”
Rome, St. Peter’s Square
28 June, 2015
https://350.org/oneearthonehumanfamilyclimatemarchinrome/
communities impacted by climate change marched together in Rome to express gratitude to Pope Francis for the release of his encyclical on the environment, Laudato Si’.
Legambiente
“Get in the way for climate”
Awareness campaign 2015
https://www.legambiente.it/inmarciaperilclima/iniziative
The campaign aims at raising awareness
among citizens, national administration,
small and medium enterprises towards
different sustainable development
patterns, taking into account territories
and communities .
9.4 Training
The training offer in Italy is nowadays very diversified and spread throughout the Italian territory from
North to South of the peninsula: longdistance training, Graduate Programs, Summer and Winter Schools,
PhD programmes, Master Degrees are active in many Italian Universities as Venice, Padua, Milan, Rome,
Bologna, Turin, Genoa and Calabria.
The EuroMediterranean Center on Climate Change Foundation inaugurated in 2008 its Graduate
Programs, in collaboration with three Italian universities (Ca’ Foscari University of Venice, the University
of Salento and the University of Sassari) with the objective of promoting and coordinating advanced
studies on the impacts of climate change and climate policies. The programs offer advanced courses and
research activity, with special focus on themes concerning innovative management strategies, both from
a physical and a socioeconomic perspective, for phenomena related to climate and its changes.
In the table below are listed many of the Master Degrees and PhD Programmes organized by Italian
Universities as well as some relevant training events promoted in Italy by the Regions, ARPAs or other
national institutions.
List of some initiatives carried out since 2014
Organisation/
Promoter/
Name of the activity and duration
Short Description
Indicators/Numbers
ICCG International Center of Climate Governance
Climate Change Governance
Webinars
2017
http://www.iccgov.org/categoriesevents/webinar
/
The ICCG webinars on Climate Change aim at promoting longdistance training. They
are targeted to the public at large and the world of policy making, in particular from developing countries where these issues are often underaddressed. The lectures are delivered by internationally renowned experts coming from both the academic and policy fields. The main research and policy institutions which work on the governance of the climate change are represented within our experts, e.g.; International Energy Agency, IPCC, European Commission, Fondazione Eni Enrico Mattei, UNEP.

336
Organisation/
Promoter/
Name of the activity and duration
Short Description
Indicators/Numbers
EuroMediterranean Centre on Climate Change
Foundation
CMCC Graduate Programs, Summer and Winter Schools
2008ongoing
https://www.cmcc.it/school_type/cmccgraduateprograms
https://www.cmcc.it/school_type/schools
CMCC Graduate Programs were inaugurated in 2008, in collaboration with three Italian universities: Ca’ Foscari University of Venice, the University of Salento and the University of Sassari. The objective is to promote and coordinate advanced studies on the impacts of climate change and climate policies.
The three universities contribute to the Graduate Programs through four distinct doctorate programmes: Science and Management of Climate Change (Ca’ Foscari University of Venice), Agrometereology and Ecophysiology of Agricultural and Forestry EcoSystems (University of Sassari), Energy Systems and Environment and Climate Change Sciences (University of Salento).
The Programs offer advanced courses and research activity, with special focus on themes concerning innovative management strategies, both from a physical and a socioeconomic perspective, for phenomena related to climate and its changes.
The synergy with CMCC has allowed the interested universities to expand their training offer, namely in the field of sea science, oceanographic ecology, High Perfomance computing, economics related to the impacts of climate change on the economy, the legal sciences linked to
European legislation on mitigation and adaptation of climate change, in the assessment of the social impacts of climate change, migratory effects etc
Furthermore, it is also noted the chance for the doctoral students of the University of Salento, to access the CMCC’s technological equipment and tools available in Lecce (Supercomputing Center, OceanLab).
Finally, in the framework of its doctoral courses, Fondazione CMCC organizes and manages a programme of summer and winter schools also open to students from other international Ph.D. programmes on climate change.
Centro EuroMediterraneo sui Cambiamenti Climatici (CMCC),
CIP – Climate Impacts and Policy Division and
International Center for Climate Governance (ICCG)
Summer School on Adaptation Policies and Practices in the Mediterranean Basin (MedAdapt), May 2014
Study programme for doctoral and postdoctoral students from all over the world
http://www.cmcc.it/it/trainingprograms/cmcciccgsummerschoolonadaptationpoliciesandpracticesinthemediterraneanbasinmedadapt
The aim of the Summer School is to offer an indepth view of the impacts of climate change in the Mediterranean Basin and to pursue a thorough investigation of key adaptation policies and best practices, whether not yet implemented or already implemented across the region. The Summer School programme will combine physical, economic, and sociopolitical aspects of the Mediterranean in an interdisciplinary approach for the purpose of educating the public about the impacts of climate change. Students will also benefit from an overview of the technical instruments that enable a better understanding of the statistical models for impact and adaptation analysis.
The Summer School topics will include:

337
Organisation/
Promoter/
Name of the activity and duration
Short Description
Indicators/Numbers
climate systems and impacts in the Mediterranean basin, integrated assessment of climate change impacts, and adaptation strategies in the Mediterranean region: case studies, options and best adaptation practices
Ca’ Foscari University of Venice Department of
Economics
CMCC
EuroMediterranean Centre for Climate Change
The PhD programme in Science and Management of Climate Change
Monthly workshops in English
20162017
http://www.unive.it/nqcontent.cfm?a_id=124319
The Doctoral Programme aims to train experts equipped with wide and indepth scientific and economic education and a proven original research activity related to climate change dynamics and techniques for its assessment and management. The educational activities included in this programme are held in English. The programme may be broken down into two different curricula: one is called Dynamic Climatology” and the other “Impact and Management of Climate Change”.
They include common educational activities aimed to create a sound scientific and economic background for the general understanding of climate change, together with specific educational activities related to the particular curriculum chosen by the doctoral student.
University of Padua Centro Studi Qualità Ambiente (CESQA)
Master in Strategic Environmental Management GAS 20142017 http://cesqa.eu/
The Master aims to train people who have multipurpose skills, knowledge and expertise in strategic environmental management (EMS), in the field of environmental management systems, in sustainable energy, in the life cycle management and climate change.
Politecnico di Milano
University
Master Degree in Environmental and Land Planning Engineering Milan, A.Y. 20162017 http://www.polinternational.polimi.it/educationaloffer/laureamagistraleequivalenttomasterofscienceprogrammes/environmentalandlandplanningengineering/
The Master in Environmental and Land Planning Engineering provides an education focused on the broad range of professional capabilities and expertise required to deal with and address adequate engineering frameworks for the sustainable utilization of natural resources and manmade infrastructures. Among the fields of interest are: planning and design of strategies and infrastructures for land protection and prevention from natural risks damage and related anthropogenic forcing management of complex environmental systems and of information systems for land management and resource planning. Climate change mitigation is specifically dealt by an ad hoc course.
Roma Tre University
Master Degree in Environment and Development Economics Rome, A.Y. 20162017
The Master of Science in Environment and Development Economics is intended for those students with a primary interest in the relationships between environmental issues and development pathways. It provides students with a rigorous training

338
Organisation/
Promoter/
Name of the activity and duration
Short Description
Indicators/Numbers
http://dipeco.uniroma3.it/default.asp?contenuto=academicyear20172018
in different disciplines from the economics, social and managerial perspectives. The MSc Programme has four distinguished specializations: Environmental Economics, Development Economics, Sustainable Firms, Global Economic Governance.
Alma Mater University of
Bologna
Master Degree in Resource Economics and Sustainable Development (RESD)
Rimini, A.Y. 20162017 http://corsi.unibo.it/2cycle/ResourceEconomicsSustainableDevelopment/Pages/default.aspx
The RESD course offers a solid preparation in environmental economics, a critical understanding of the issues involved in sustainable development both from a theoretical and practical perspective and of the complex interactions between economic decisions, market forces, governmental policies and the environment. Among the subjects are climate change, energy economics and policy, food and agricultural economics, environmental innovation.
University of Turin
Master Degree in Economics of the Environment, Culture and Territory Turin, A.Y. 20162017 https://en.unito.it/degree/courses/economicsenvironmentcultureandterritory
The course is aimed at developing specific expertise on global changes, including climate and biodiversity, urban pollution, energy, water, demography, natural resources management etc.
ISPRA Particulate emissions
in Italy: evolution of
sources and role of
biomass
January 29, 2014
Presentation in the workshop on Air Quality
Modeling organized by ENEA
ISPRA Climate change and
coastline variation.
April 26, 2016
Presentations in the workshop "Climate
Change and Coastal Sustainable
Development" The use of spontaneous
herbaceous vegetation to increase
biodiversity in ecosystems and increase the
resilience of coastal areas to climate
change
ISPRA Mobility Management
as a strategy for
adapting to climate
change, 2015
Training unit within the ISPRA elearning
course "Soft actions and measures for
sustainable mobility: mobility management
in the public institutions.
41 trainees
ISPRA Climate Change and
Indoor Air Quality
(IAQ), 2016
Training unit within the ISPRA elearning
course "Indoor Air Quality in Schools,
Health and Prevention Risks"
63 trainees
Fondazione Montagna Sicura (FMS) – University of Savoye – Municipality of Valtournenche – ARPA
Valle d’Aosta – ARPA Piemonte
“PrévRiskHauteMontagne” Project
20162017
http://www.fondazionemontagnasicura.org/fr/p
rojetsencours/prevriskhautemontagne
The project aims to educate and raise awareness among local people and tourists about the high mountain characteristics and related risks, also with reference to the impacts of global warming on glaciers and permafrost.
Training courses on information and
communication methodologies addressed to journalists, experts on glaciers, permafrost, snow and avalanches and alpine guides. The event took place in the Mont Blanc
30 information and communication
experts

339
Organisation/
Promoter/
Name of the activity and duration
Short Description
Indicators/Numbers
area between Chamonix (France) and Courmayeur (AO) with indoor workshops and glacier excursions to reach the high altitude environment.
Fondazione Montagna Sicura (FMS) – University of Savoye – Municipality of Valtournenche – ARPA
Valle d’Aosta – ARPA Piemonte
“PrévRiskHauteMontagne” Project
June July 2017
http://www.fondazionemontagnasicura.org/fr/projetsencours/prevriskhautemontagne
The project aims to educate and raise awareness among local people and tourists about the high mountain characteristics and related risks, also with reference to the impacts of global warming on glaciers and permafrost.
Training days for geologists and engineers dedicated to permafrost and related issues
UNICEF – University of Genoa – ARPA Liguria
UNICEF Course “Environment and climate changes”
Genoa, April 27th 2016
A lesson to the students of Social Sciences, containing an introduction to the general context and scientific assessments, a focus
on the local (Mediterranean and regional) data and evidences, as well as meteorological issues and impacts. Discussion has been stimulated on strategies and behaviors to be adopted by a resilient community.
Number of students: nearly 20.
LUMSA University of Rome MSDG Annual MSc in
Management of Sustainable Development Goals
“Economic Growth, Demography and Climate Change”
http://www.lumsa.it/corsi_master_primo_livello_msdg
http://www.lumsa.it/sites/default/files/didattica/master/1718/call_for_application_MSDG.pdf
The Master “Science in Sustainable Development Goals (MSDG)” by LUMSA is an international master (english language). “Economic Growth, Demography and Climate Change” is one of the main contents of the master.
It is a high training path of excellence for students coming from all continents aiming at acquiring knowledge and competences in the management of integrated projects on economic sustainability and in management and financial knowledge in line with the new vision of the United Nations Sustainable development Agenda 2030.
The main objective of MSDG is to create new professional profiles “ the sustainability manager” able to develop, manage and disseminate innovative projects of international relevance on sustainable development, in several sectors and with relevant consequences both in the development production chain of new sustainable products and services and in the management of development programmes based on a new vision of sustainability from one side on Pope Francis’ encyclical “Laudato si” and from the other side on the United Nations Sustainable development Agenda 2030 , The master intends to promote a new vision of sustainable development that thanks to an holistic and crosscutting
approach intends to support the solution of problems concerning the conservation of the planet in the longterm
This new approach oriented to improve quality of life and of the world and to create the good terrain for a sustainable and inclusive growth and a shared prosperity

340
Organisation/
Promoter/
Name of the activity and duration
Short Description
Indicators/Numbers
Unitrè Susa
Arpa Piemonte
Seminar on Climate Change, March 2017
Meeting with citizens on climate change and also at regional and local level
ARPA Veneto Climate and Cultivation of Life, June 17, 2015
Training course for journalists in the agricultural sector
ARPA Veneto Science in Orto, 1314 December 2014
Training Days for Citizens and Teens at the Botanical Garden of Pavia on Climate and Climate Change in Veneto
ARPA Veneto The climate and the
recent evolution of the Marmolada glaciers, July 8, 2016
Course for geography teachers
ARPA Veneto The Dolomitic deglaciation: how glacier retreat changes the landscape and perceptions of mountains, June 23,2006
Student lesson under the Boston University Summer Course on Climate Change
ARPA Veneto Winter 201314, extraordinary weather events consequences on the territories, May 9, 2014
Training course for forest agronomists of Belluno province
ARPA Veneto What's happening to our climate?, April 7 2017
Seminar for students within the initiative "Schools on the Net"
ARPA Veneto Climate and climatic change, April 7 2016
9 and 22 March 2017
Seminar for students of the scientific high school and of the University “Tempo libero” in Padua and Pordenone
ARPA Veneto Climate changes and avalanche: effects on the mountainous region of Veneto
May 6, 2016, May 11, 2017
Seminar for students at the University of Padua “TESAF”
ARPA Veneto Climate change: evidence and local and global consequences on cryosphere
March 24, 2017
Seminars addressed to citizens and students within the initiative "Schools on the Net"
ARPA Veneto Weather and climatic conditions and
activity planning
February 9, 2016
Seminar for military on mission abroad
ARPA Veneto The effects of climate change: the evolution of the glaciers of the Dolomites over the last
Seminar for students in the Summer school at Venice University “Cà Foscari”

341
Organisation/
Promoter/
Name of the activity and duration
Short Description
Indicators/Numbers
100 years, July 17, 2015
Emilia Romagna Region
ASTER Consortium for Innovation and
Technology Transfer in EmiliaRomagna
ClimateKIC – Italy
(2017) ClimateKIC Italy has 12 national partners: ASTER, AESS, ARPA, CCPB, CMCC, CNRIBIMET, Comune di Bologna, MEEO, PROAMBIENTE, SINERGIS, UNIVERSITÀ DI BOLOGNA Alma Mater Studiorum, URBAN CENTER BOLOGNA.
ClimateKIC is an Initiative of EIT European Institute of Innovation & Technology with the aim to develop knowledge and foster innovation in four areas relevant for climate change. ClimateKIC Italy is based at the National Research Council (CNR) in Bologna. Its aim is to contribute to the definition of new national strategies on climate change.
CNR ISAC
(Institute for Atmospheric and Climate Science)
ARPA Calabria
Regional Environmental Agency of Calabria
IAmica
Infrastructure of High Technology for Climate and Environmental Integrated Monitoring 2012 – 2015
http://www.iamica.it/iamica
One of the goals of the project is the organization of the Higher education Course involving technicians of the Multirisk Center of ARPA Calabria and it is based on the strengthening of the network of observation for climateenvironmental monitoring. The objective of the training course is to provide regional and local governments with some tools for the management of environmental issues and train professionals who are able to use the observation network of climate and environmental satellites of international infrastructure.
EOS Unit (Education Oriented to Sustainability)
of ARPA CALABRIA
Multirischi Functional Center – Schools –
Mediterranean University of Reggio Calabria
University of Calabria
Project: "Resilient cities to combat the waves of climate instability"
November 2016 June 2017
http://www.arpacal.it/index.php/arpacal/attivita/comunicazione/eventieconvegni/938unescosettimanadesseventiarpacalnelprogrammanazionale
The project was realized in the framework of the UNESCO Week for Education to Sustainable Development (DESS) 2016, titled "Earth as a Space Shuttle in the Climate Waves: what can our cities do?"
The project involved students that participated during the academic year 2016/2017 to Alternanza ScuolaLavoro (Work related learning) courses at the Arpacal Departments as well as students from the Mediterranean University of Reggio Calabria and the University of Calabria.
The activities carried by the project addressed in particular the topic of resilience of the territory as preparedness and response to the phenomenon of climate change. At the Multirischi Functional Center, students were able to know the methodologies and tools used to systematically detect, the magnitudes related to the Earth's climate, on the regional territory.
Experts from the Agency's Air Theme carried out a set of initiatives to learn about the methodologies used to carry out
climate monitoring and controls .
ARPA Sicilia, Reg. Sicily Regional Administration,
Schools,
Associations ad
Project “Climaticamente”
(funded by MATTM)
In the framework of the project, two training courses have been organized for high Schools teachers, each of 2 days in full immersion, on topics related to climate

342
Organisation/
Promoter/
Name of the activity and duration
Short Description
Indicators/Numbers
Educational Farms
2016
http://www.arpa.sicilia.it/educazione/climaticamenteeorientamentoallebuonepratiche/
change and desertification using biodiversity, education, sustainability, forestry, intensive and ecosustainable farming. The courses were carried out in Palermo and in Messina Province.
Teaching materials and a video camera were provided to the schools that joined the project. Bilingual flyers on desertification were printed.
APPA Bolzano
Department of Land Development, Environment and Energy, Energy Savings Office
“Incentives in the energy efficiency and use of renewable energy”, 6 October 2017
The Energy Savings Office collaborated to develop a vocational training addressed to architects and engineers on energy optimization and in particular on energysaving buildings. http://arch.bz.it/it/archacademy/programma/.it
Number of participants: 200
APPA Trento “prepAir there is air
for you "
Life Project
April 2017 to September 2020
http://www.appa.provincia.tn.it/Prepair/
http://www.lifeprepair.eu/
The LIFE PREPAIR project has the goal to
carry out coordinated and integrated actions to improve air quality in the territory that includes the entire Padana Basin (from the Alpine Arc to the Padana Plain ) and Slovenia. The efforts to reduce atmospheric pollutants emissions concern agriculture, biomass wood combustion, energy efficiency and freight and passenger transport. The project includes capacity building actions, also those aimed to design, test and implement training courses to raise awareness and strengthen knowledge of the school system teachers and students on the issues of air quality.
Lombardy School Office – Arpa Lombardia
Time and climate
2016
Training course on the topic of Lombardy Alpine Climatology and Meteorology, addressed to Secondary School Teachers
3 schools involved
Arpa Piemonte
Scientific high school
Didactic path to climate change and hydrogeological risk
January May 2017
Training activities at scientific high school “Gobetti” in Turin: classroom and field training were held on the topics of permafrost, snow science, landslides monitoring
3 classes involved
Rete Clima®
Clima Network
(Information and action for sustainability and the
fight against climate change)
Environmental
education and Environmental training on climate.
2011 ongoing
http://www.reteclima.it/educazioneeformazioneambientaleclimatica/
Climate Network (Rete Clima ®) is a
nonprofit organization, founded in 2011 as a technical network for the promotion of sustainability and climate change awareness at the local scale. The network organized a series of training courses for adult (in the Company or for citizenship) including: motivational activities for the "corporate
green behaviour" and the "green team building";
training on practices and actions for energy saving in the Company;
specific training on working behaviour climate and environmental friendly;
design and delivery of "green days" and environmental events for businesses, municipalities, associations with zero emissions;
information and awareness evenings for citizenship
training on practices and actions for energy efficiency at home, in the Company, in the City.

343
Organisation/
Promoter/
Name of the activity and duration
Short Description
Indicators/Numbers
Italian Climate Network
in cooperation with
WWF Italy
Italian Think Tank on Intergenerational Equity 20142015
http://www.italiaclima.org/attivita/equitaintergenerazionaleilthinktank/
The Italian Youth Think Tank on Intergenerational Equity was an initiative aimed at drafting a policy proposal for the implementation of the intergenerational equity principle within the new global climate change agreement. Under the supervision of a scientific committee, a number of young representatives from Italian youth organizations contributed to the final document, named “Italian Youth Declaration on Intergenerational Equity”.
The Declaration was finalized ahead of Lima COP20 and submitted to the Italian Minister of the Environment.
At COP21 in 2015, also thanks to the support of the Italian Minister of the Environment, the principle of the Intergenerational Equity was included into the preamble of the Paris Agreement.
Link to the Declaration.
EuroMediterranean Center on Climate Change Foundation
OTTIMA – Operational oceanography and
information technologies for maritime security
Project funded by PON – Programma Operativo Nazionale “Ricerca e Competitività” 20072013 (EU – Fondo europeo di sviluppo regionale / MIUR – Ministero Italiano dell’Università e della Ricerca / MSE – Ministero dello Sviluppo Economico).
20122015
http://www.cmcc.it/ottima/content/benvenutiottima
OTTIMA (Operational oceanography and information technologies for maritime security) is a training project that, in range
of the technological innovation TESSA project, has the purpose to predispose and supply a training course that allows students to learn competences of the methodologicaloperative aspects of the basic sciences, the operational oceanography, the technology and the engineering applied to oceans and seas. These skills, that are not acquirable through the present training courses available in Italy, are interesting for many industrial sectors (maritime transport, tourism, maritime security, etc.) that are going to have, in the next future, a high development potential. OTTIMA includes two training courses: Objective 1 – Course of “Operational oceanography and security” The students acquire knowledge of the methods, techniques and devices of the operative systems and the fundamental infrastructures for the operational oceanographic and coastal research, the monitoring, the protection and the exploitation of the sea resources and the maritime security. Objective 2 – Course of “Information technologies and security” The students deepen knowledge and acquire competences of the information techniques in the field of the data analysis of marine environments, operational oceanography, both from observable systems and models and of the support systems for the decisions of maritime security, maritime environment protection and sustainable exploitation of its resources.

344
9.5 International cooperation
As described in previous chapters, namely in chapter 7 related to Financial resources and transfer of
technology, Italy is undertaking continuous efforts to scaleup its international climate finance and the
Italian Development Cooperation has undergone an important legislative reform leading to a new
institutional framework designed to make it more effective as well as cooperation policies more
consistent. Being capacity building and training in general considered by Italy as a priority to enhance
institutional capacity in developing countries partners, these activities are mainly already integrated in
every bilateral and multilateral cooperation projects and thus described, when relevant, under chapter 7.
With specific reference to international cooperation activities strictly related to Education, Training and
Public Awareness there are nevertheless some bilateral projects worth highlighting.
Among those, to support the implementation of Morocco's commitments on Climate Change as expressed
in its National Determined Contribution (NDC) published in September 2016 and the National Strategy for
Sustainable Development, adopted on 25 June 2017 by the Council of Ministers, the Italian Ministry for
the Environment, land and Sea, is collaborating to an integrated program of education on the
environment and sustainable development in schools in partnership with the local Ministry of National
Education, in order to reinforce the students awareness. Specific objectives of this project include:
establishing model schools for sustainable development integrating the concepts and bases of sustainable
development; promote environmental education and sustainable development; building capacity in
environmental education for environmental club leaders in schools and developing partnerships at
national or international level (Mediterranean Basin, for example) to strengthen the exchange of
experiences and knowhow in environmental education and sustainable development
In Asia, in the framework of the longstanding cooperation between IMELS and the numerous Chinese
institutions, is taking shape a new knowledge approach on the base of the previous experience and in the
light of the new political and economic role of China within the international community. The signing of a
Joint Declaration on the relaunch of the Sustainable Development and Environmental
Partnership with the Chinese Ministry of Environmental Protection is the result of a strengthened
cooperation on a new basis, with the contribution of private investments and greater involvement of
companies, in particular in the development and exchange of experiences and best practices in the field
of innovative and lowcarbon technologies.
In the timeframe between 2013 and 2016, a wide training program, described below, was strictly related
to climate change activities and has been identified in terms of the objectives and programs established
in the United Nations Convention on Climate Change; other projects developed under the Sino Italian
Cooperation Program for Environmental Protection (SICP) can also be considered useful to create
enabling environment for mitigation and adaptation measures, but will not be detailed in this document.
The “Advanced training program on environmental management and sustainable development” was
carried out since 2003. IMELS has been promoting an Advanced Training Program on the various issues
of environmental management and sustainable development, targeted at technicians, academics, young
professionals and decisionmakers in Chinese administrations, universities and enterprises; an important
aim of the training program was the capacity building about potential climate change mitigation and
adaption actions. Since 2003 more than 150 Italian companies were visited during about 600 study
visits. Over 350 public and private institutions were involved, with a total of about 1000 speakers.

345
Under the agreement on Beijing Clean Air Action Cooperation between IMELS and the People's
Government of Beijing Municipality, signed in 2013, an important capacity building project was developed
between 2014 and 2015, allocated on SIEC_SUB fund. It is the “Capacity Building for Management and
Control of Air Pollution Sources”. The objective of this project was to continue to strengthen the
capabilities of Beijing EPB in the management and control of air pollution sources by sharing experience
in emissions assessment and authorization procedures, pilot research activity on emission sources,
calculation of emissions and pilot case assessment; regulatory and authorization procedures for polluting
industries on the basis of European experience.
Organisation/
Promoter Name of the activity Short Description Indicators/Numbers
Italian Ministry for the Environment,
Land and Sea
People's Republic of China
SinoItalian Cooperation Program for Environmental Protection (SICP) (2011ongoing)
The cooperation Program between China and Italy, especially dedicated to Climate Change, has been launched on March 2011 with the aims to start a joint program of activities addressing mitigation and adaptation to climate change, transfer and promotion of lowcarbon technologies, studies and researches as scientific support to decisionmaking. The cooperation program includes activities for
training and capacity building Program on Climate Change and Sustainable Development. The training aims at providing Chinese participants with theoretical instruments and practical cases on Italian and European experiences in the field of environmental protection and climate change. The Chinese Institutions involved are: Ministry of Science and Technology (MoST), Chinese Academy of Social Sciences (CASS), Ministry for Environmental Protection (MEP), Beijing Metropolitan Environmental Protection Bureau (BMEPB), Shanghai Environmental Protection Bureau (SEPB), Tianjin Science & Technology Commission (TSTC) e la National Development and Reform commission (NDRC), and from 2013 the Ministry for Industry and Information Technology (MIIT).
Agriconsulting SpA
CMCC
EuroMediterranean Center on Climate Change Foundation
Centre for Advanced Mediterranean
Agronomic Studies
Clima South: support to climate change mitigation and adaptation in the ENPI South region
20132018
EuropeAid
http://www.climasouth.eu/
The project seeks to enhance regional cooperation between the EU and its southern Mediterranean neighbours and among the partner countries themselves (South–South) on climate change mitigation and adaptation, mainly through capacity development and information sharing. The overarching goal is to support the
transition of ENP South countries towards low carbon development and climate resilience.
Activities include:

346
(CIHEAM) of Bari. Organisation of regional trainings and meetings on mitigation (e.g. monitoring, reporting and verification (MRV) at national and sector level, including the establishment of national greenhouse gas inventories) and about adaptation (data management, vulnerability assessments, national adaptation strategies and plans);
Fostering EUSouth and SouthSouth peertopeer cooperation by bringing together experts, including academia and civil society, on climate change mitigation and adaptation issues;
Organisation of workshops, trainings and study visits involving the main stakeholders in climate change policy development and implementation;
Creation of a website in Arabic, English and French, as a platform for accessing and sharing information;
Production of targeted climate change material in Arabic, English and French;
Setting up of a flexible expert facility to respond to information and training needs expressed by partner countries' authorities.
The project is implemented by Agriconsulting SpA, an Italian Private Consulting Company, as leader of a Consortium of 7 Institutions, five Italian, one Belgian and one Spanish, among which the CMCC and the Centre for Advanced Mediterranean Agronomic
Studies (CIHEAM) of Bari.
CMCC
EuroMediterranean Centre on Climate Change Foundation
Puglia Region
Serbian Hydrometeorological
Service
OrientGate
A network for the integration of climate knowledge into policy and planning
SEE (South Eastern
Europe Program)
2012 2014
www.orientgateproject.org
The OrientGate project aimed to implement concerted and coordinated climate adaptation actions across South Eastern Europe (SEE). The partnership comprised 19 financing partners, 11 associates and three observers, covering 13 countries, and the role of the partners can be grouped into three main categories:
National hydrometeorological services, responsible for monitoring climate variability and risk.
Territorial development policy organisations, responsible for translating climate variability and climate risk assessment information into territorial development planning instruments.
Scientific institutions.

347
The core output to be developed by OrientGate is a set of web tools, designed to provide access to data and metadata from climate observations and simulations that will be available through a data platform connected to the European Climate Adaptation Platform.
Other project outputs will include six pilot studies of specific climate adaptation exercises developed by the project’s three thematic centres (Forest and Agriculture, Drought, Water and Coasts, and Urban Adaptation and Health); capacitybuilding seminars and workshops; and a working partnership among the hydrometeorological services of SEE countries.
Italian Ministry for the Environment,
Land and Sea
Variuos Chinese Institutions
(China)
Advanced training program on environmental management and sustainable development
(China)
From 2003 and ongoing
Since 2003 more than 150 Italian companies were visited during about 600 study visits. Over 350 public and private institutions were involved, with a total of about 1000 speakers.
Between 2013 and 2016, over 2,000 participants from all the provinces of China took part in the training program, with a total of 45 courses (in Italy and China).
over 2,000 participants between 2013 and 2016 to training programs
45 courses held in Italy and China
Italian Ministry for the Environment,
Land and Sea
People's Government of Beijing Municipality
(China)
“Capacity Building for Management and Control of Air Pollution Sources”
(China)
2014 2015
The objective of this project was to continue to strengthen the capabilities of Beijing EPB in the management and control of air pollution sources by sharing experience in emissions assessment and authorization procedures, pilot research activity on emission sources, calculation of emissions and pilot case assessment; regulatory and authorization procedures for polluting industries on the basis of European experience.
Italian Development Cooperation of the Ministry of Foreign
Affairs,
Climate Change and Mountain Forests The Mountain Partnership and the Global Island Partnership join hands in Latin America and the Pacific”
(20142017)
The project builds upon the outcomes of a side event organized in 2012 in Brazil by the Mountain Partnership (MP) at the UN Conference on Sustainable Development (Rio+20) in collaboration with the Global Island Partnership and with the financial support of the Italian Development Cooperation of the Ministry of Foreign Affairs, a core founder and active partner of both alliances.
The project aims to promote sustainable management of mountain ecosystems in key tropical mountain regions by supporting the implementation of the Mountain Products Programme
(MPP) of the Mountain Partnership Secretariat, as well as FAO’s

348
activities aimed at Reducing Emissions from Deforestation and forest Degradation (REDD+).
The actions undertaken in the context of REDD+ and MPP programs focus on the development of technical and institutional capacity, support the creation of instruments of forest monitoring and support to local communities regarding sustainable business activities in the agroforestry.
Italian Development Cooperation of the Ministry of Foreign
Affairs
(Italian Provinces of Agrigento,
Caltanissetta, Ragusa, Siracusa, Trapani in Sicily)
Tunisian Regions of Ariana, Beja, Ben
Arous,Bizerte, Jendouba and
Nabeul)
ItalyTunisia SeaCrossing Programme CrossBorder Cooperation(CBC)
European Neighborhood Instrument (ENI)
20142020
Under the ENI, support for CBC on the EU’s external border continue to draw on funds from both the external and internal headings of the EU budget, for the pursuit of CBC activities serving both sides of the EU’s external border. The ItalyTunisia SeaCrossing Programme is part of the ENICBC EU Programme and one of the 3 Thematic Objectives is the OT3 “Environmental protection and adaptation to climate change" within which there are two types of Priority Actions :
1. Joint actions for environmental protection
2. Conservation and sustainable use of natural resources
Italian Ministry for the Environment,
Land and Sea (IMELS)
Tunisian Ministry of Energy, Mines and Renewable Energy
Technical Agreement on Climate Change cooperation,
Starting date : 9 February 2017
Amount of founding: 2 MEURO
http://www.minambiente.it/pagina/tunisia
The Work Plan of activities among Parties signed on February 2017 includes:
the promotion of renewable energy and energy efficiency;
the implementation, monitoring and communication of NDC (Nationally Determined Contributions);
integrated coastal zone management;
Sustainable waste management
Bilateral activities in Tunisia are supported by MEDREC (the Mediterranean Renewable Energy Center), established in 2004 in Tunis by IMELS.
Italian Ministry for the Environment,
Land and Sea (IMELS)
Tunisian Ministry of Energy, Mines and Renewable Energy
MED DESIRE (MEDiterranean DEvelopment of Support schemes for solar Initiatives and Renewable Energies) (20132015)
MEDDESIRE main priority is to remove barriers related to the legal, regulatory, economic and organizational framework of distributed solar energy technologies. Cofunded by the European Union through the ENPI CBC MED Programme 20072013 for an amount of 4.192.000 Euro, the project aims at spreading energy efficiency, and in particular, solar energy across the Mediterranean area through the definition of innovative financial schemes and
market stimulation tools. The

349
project will facilitate the take up of distributed solar energy and energy efficiency in the target regions, by achieving an effective crossborder cooperation and by raising public awareness on the related benefits for the environment and for sustainable local development.
MEDDESIRE is implemented by a consortium of nine partners from five countries (Egypt, Italy, Lebanon, Spain and Tunisia), leaded by Puglia Region – Economic Development Regional Ministry Industrial Research and Innovation Department.
Italian Ministry for the Environment,
Land and Sea
MEDREC Mediterranean Renewable Energy Centre
Established in 2004
The MEDREC, based in Tunis, was launched in 2004 by the Italian Ministry of Environment and Territory (IMELS) in collaboration with the National Agency of Energy Conservation (ANME) . It involves international and governmental Institutions of Algeria, Egypt, Libya, Morocco, and Tunisia. MEDREC is a regional centre and a donorfunded project within the ANME, through funding from the IMELS. In 2014 the Centre in collaboration with UNEP promoted initiatives of capacity building, training and information as well as programs to support renewable technologies markets:
PROSOL Industrial: Solar Water Heating for Industrial Processes: in order to promote the development of solar thermal systems in the industrial sector. In this framework, a workshop was held during the Energy Solutions World Sustainable Energies Forum (Enersol WSEF) gathering the global sustainable energy community in Tunis during which two studies were presented as proposal for a new support scheme for solar thermal technology in industrial sector in Tunisia, and a demonstration project to reduce greenhouse gases emissions, developed with the financial support of IMELS and BENETTON Group.
EuroMediterranean Center on Climate Change Foundation
Italian Ministry of Education University and Research (MIUR)
National Council of Researches Dept. Earth system science and environmental technologies
ERA4CS – European Research Area for Climate Services
(H2020)
20162020
http://www.jpiclimate.eu/ERA4CS
http://www.jpiclimate.eu/nl/25223454DustClim.html
The ERANET Consortium “European Research Area for Climate Services”, socalled ERA4CS, has been designed to boost the development of efficient Climate Services in Europe, by supporting research for developing better tools, methods and standards on how to produce, transfer, communicate and use reliable climate information to cope with current and future climate variability.
ERA4CS will complement other funding programmes and activities

350
(CNRDTA)
Agence Nationale de la Recherche (ANR) France
on climate services research at European level (such as e.g. H2020, Copernicus and KIC Climate) and at the international level (such as GFCS, Future Earth and Belmont Forum). It will focus its efforts on planning, implementing and monitoring a joint transnational call between Members States and Associated Countries, increasing their scope through topup funding from the EC.
The ERA4CS Joint Call in 2016 funded the project with CNR DTA as partner:
Dust Storms Assessment for the development of useroriented Climate Services in Northern Africa, Middle East and Europe
P.A.N.G.E.A. Cooperative Company (IT)
In consortium with ISPRA (IT)
GHGMI —Greenhouse GasManagement Institute Luxembourg (LU)
INEA — National Institute of Agricultural Economics (IT)
LDK Consultants,
Engineers and Planners S.A. (GR)
and Escarus — Sürdürülebilir Danışmanlık A.Ş. (TR).
Turkey Ankara: IPA — Technical assistance for support to mechanism for monitoring Turkey's greenhouse gas emissions
20152017
The purpose of the project is to provide the essential elements for the establishment of a fully functioning monitoring mechanism of greenhouse gas emissions in Turkey, in line with the EU Monitoring Mechanism Decision 280/2004/EC, while taking into account relevant and likely aspects of the expected revision of the Decision. Technical assistance activities was provided on:
i) assessment and improvement of the legal and institutional situation
and the identification of the steps needed;
ii) capacity building aimed at improving the quality of the national inventory reports;
iii) improvement of the technical capacity for preparing the elements of the national communications.
9.6 Monitoring, review and evaluation of the implementation of Article 6 of the
Convention
Since COP 20, in Lima, in December 2014, adopted the ‘Lima Ministerial Declaration on Education and
Awarenessraising’, reaffirming the importance of Article 6 of the UNFCCC in meeting its ultimate
objective and in promoting climate resilient sustainable development, and in 2015 at COP 21 (Paris)
governments agreed to cooperate in taking measures, as appropriate, to enhance climate changerelated
education, training, public awareness, public participation and public access to information, recognizing
the importance of these steps to enhance actions under the Paris Agreement, the Italian Ministry for
the Environment, Land and Sea, appointed its national focal points on Action for Climate
Empowerment (ACE) activities and renewed its efforts to enhance the development and
implementation of educational and public awareness programs, as well as to train scientific, technical
and managerial personnel, foster access to information, and promote public participation in addressing

351
climate change and its effects, exchanging good practices and lessons learned, and strengthening
national institutions. This wide scope of activities is guided by specific objectives that, together, are
seen as crucial for effectively implementing climate adaptation and mitigation actions, and for achieving
the ultimate objective of the UNFCCC.
The ACE national focal points are active within the climate change negotiation activities and attended
all the meetings and seminars organized in the last years on Action for Climate Empowerment by the
UNFCCC secretariat.
A permanent section was created on the Italian Ministry for the Environment, Land and Sea’s web site,
dedicated to environmental education and sustainable development, in order to provide a platform for
sharing and disseminating initiatives and best practices. The guidelines on environmental education and
the “Chart on Environmental education and sustainable Development” produced in collaboration with
the Ministry of Education have also been uploaded to the web site and are available for consultation and
download.
To advance enhancing the implementation of the Doha Work program and toward the definition of a
national strategy on Action for Climate Empowerment, the collaboration between the Ministry for the
Environment, Land and Sea and the Ministry of Education was strengthened in 2016, with the signing of
a Memorandum of Understanding on environmental education and sustainable development in schools
under the PON (National Operative Plan) School 20142020.
Organisation/ Promoter
Name of the activity Short Description
Italian Ministry for the Environment,
Land and Sea
Action for Climate Empowerment (ACE)
Appointment of Italian National Focal Points
2016
2 national focal points on ACE activities were appointed by the Italian ministry for the Environment; Land and Sea in order to ensure participation to the negotiation process on these matters and identification of areas for possible international cooperation and opportunities for strengthening synergies with other conventions
Italian Ministry for the Environment,
Land and Sea
Web page dedicated to environmental education within the Ministry’s official web site
2016
http://www.minambiente.it/pagina/educazioneambientaleeallosvilupposostenibile
A permanent section was created by the Italian Ministry for the Environment, Land and Sea’s web site, dedicated to environmental education and sustainable development, in order to provide a platform for sharing and disseminating initiatives and best practices.
P.A.N.G.E.A. Cooperative Company (IT)
In consortium with ISPRA (IT)
GHGMI (LU)
INEA (IT)
LDK (GR)
Turkey Ankara: IPA — Technical assistance for support to mechanism for monitoring Turkey's greenhouse gas emissions
20152017
The purpose of the project is to provide the essential elements for the establishment of a fully functioning monitoring mechanism of greenhouse gas emissions in Turkey.
Technical assistance activities provided included also capacity building aimed at improving the quality of the national inventory reports; and the technical capacity for preparing the elements of the national communications.

352
Escarus (TR).