
Seventh Grade Math Curriculum Map -...
12
Hickory Public Schools 7th Grade Math Curriculum Map Course Description: This course includes a variety of mathematical concepts including data analysis, geometry, proportional reasoning, and algebraic concepts. This course follows the seventh grade North Carolina Standard Course of Study. Students will take the North Carolina End-of- Grade test. EOG Teacher-made exam Hickory Public Schools Seventh Grade Math Power Standards Students taking seventh grade math in Hickory Public Schools will… 1. Demonstrate an understanding of proportional reasoning to solve problems. 2. Evaluate, create, and model algebraic equations and inequalities. 3. Use rational numbers to find solutions to problems. 4. Display and analyze data sets using different types of graphs and measures of central tendency. 5. Demonstrate an understanding of geometric terms and measurements for 2-D and 3-D figures.
Transcript of Seventh Grade Math Curriculum Map -...
Hickory Public Schools 7th Grade Math Curriculum Map
Course Description: This course includes a variety of mathematical concepts including data analysis, geometry, proportional reasoning, and algebraic concepts. This course follows the seventh grade North Carolina Standard Course of Study. Students will take the North Carolina End-of-Grade test.
EOG
Teacher-made exam
Hickory Public Schools Seventh Grade Math Power Standards
Students taking seventh grade math in Hickory Public Schools will…
1. Demonstrate an understanding of proportional reasoning to solve problems.
2. Evaluate, create, and model algebraic equations and
inequalities.
3. Use rational numbers to find solutions to problems.
4. Display and analyze data sets using different types of graphs and measures of central tendency.
5. Demonstrate an understanding of geometric terms and
measurements for 2-D and 3-D figures.
Hickory Public Schools 7th Grade Math Curriculum Map
7th Grade Mathematics Vocabulary and Key Terms 1. Scale 2. plot 3. linear 4. cylinder 5. unit rate 6. unit price 7. view 8. expression 9. absolute value 10. additive inverse 11. function 12. sum 13. difference 14. product 15. quotient 16. commutative
property 17. associative
property 18. distributive
property 19. prime 20. composite 21. cubed 22. squared 23. perimeter 24. area 25. congruent 26. equation 27. estimate 28. evaluate 29. coordinate
plane 30. probability 31. inequalities 32. percent 33. volume
34. surface area 35. measurement 36. metric system 37. algebraic
equations 38. exponential
notation 39. circumference 40. graphs 41. mean 42. central
tendency 43. median 44. mode 45. analyze 46. formulas 47. cross product 48. equivalence 49. commission 50. discount 51. interest 52. wholesale 53. retail 54. similar 55. integers 56. rational
numbers 57. irrational
numbers 58. inverse
operations 59. reciprocal 60. factor 61. multiples 62. prime
factorization 63. markup
64. extraneous information
65. percent 66. proportion 67. ratio 68. equivalence 69. dilation 70. projection point 71. polyhedron 72. lateral face 73. prism 74. pyramid 75. density 76. space figure 77. isometric view 78. corresponding
parts 79. indirect
measurement 80. transformation 81. scale 82. quartile 83. interquartile
range 84. interval 85. outlier 86. histogram 87. variable 88. independent 89. dependent 90. evaluate 91. simplify 92. domain 93. input 94. output 95. coefficient 96. substitution
Hickory Public Schools 7th Grade Math Curriculum Map
Hickory Public Schools Grades 6-12
Mathematics Shared Agreements
Teachers of Secondary Mathematics in Hickory Public Schools agree that all students will...
1. Connect mathematics to the real world weekly. 2. Utilize 21st century technology to model and/or solve
mathematical concepts weekly.
3. Interpret text and apply proper problem-solving techniques weekly.
4. Use writing to demonstrate understanding of mathematical
concepts at least once per unit.
Hickory Public Schools 7th Grade Math Curriculum Map
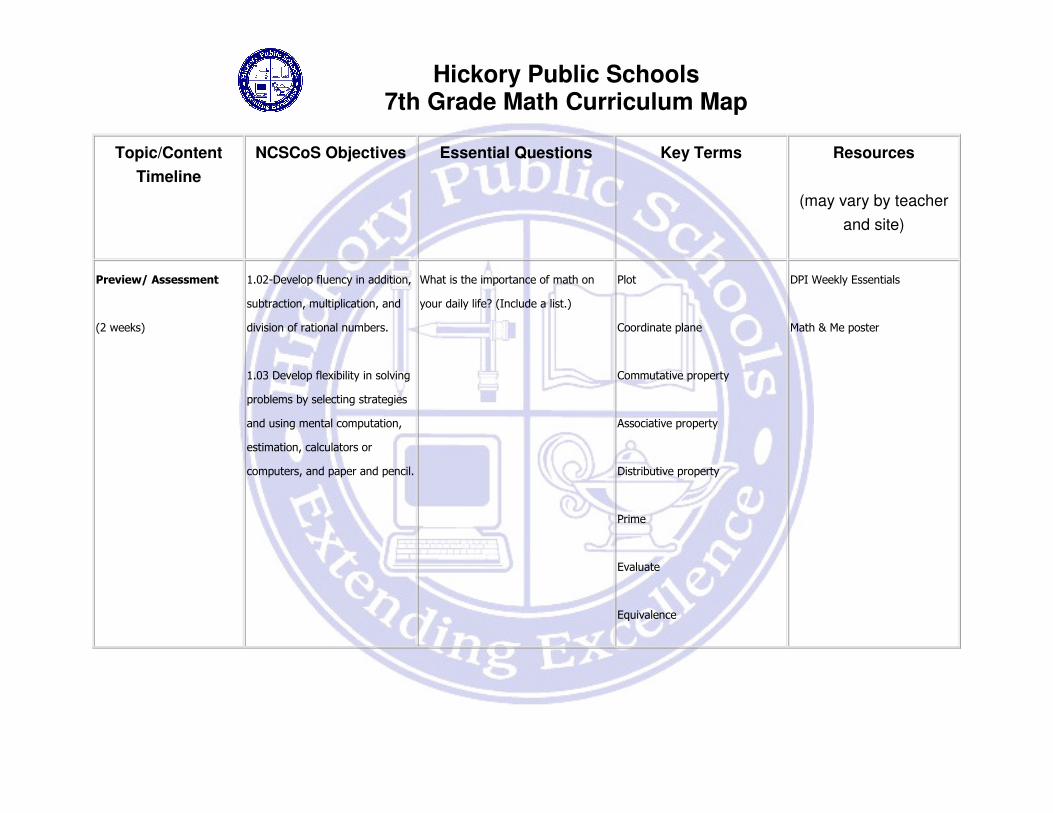
Topic/Content
Timeline
NCSCoS Objectives Essential Questions Key Terms Resources
(may vary by teacher
and site)
Preview/ Assessment
(2 weeks)
1.02-Develop fluency in addition,
subtraction, multiplication, and
division of rational numbers.
1.03 Develop flexibility in solving
problems by selecting strategies
and using mental computation,
estimation, calculators or
computers, and paper and pencil.
What is the importance of math on
your daily life? (Include a list.)
Plot
Coordinate plane
Commutative property
Associative property
Distributive property
Prime
Evaluate
Equivalence
DPI Weekly Essentials
Math & Me poster
Hickory Public Schools 7th Grade Math Curriculum Map
Integers
Factor
Multiples
Prime factorization
Simplify
Exponential notation
Geometry
(8 weeks)
• Review basic
terminology and
geometric rules
• Angle
measurements in
polygons
2.02 Solve problems involving
volume and surface area of
cylinders, prisms, and composite
shapes.
3.01 Using three-dimensional
figures:
How are geometric figures
distinguished from each other?
What are the similarities and
differences in perimeter and
circumference?
What are the similarities and
Review Terms:
Cylinder
Cubed
Squared
Perimeter
DPI Weekly Essentials
TI-73
Competitive Edge
Blocks to study views, volume,
and surface area.
Hickory Public Schools 7th Grade Math Curriculum Map
• Congruent figures
• Transformations
• Symmetry
• Perimeter and
Circumference
• Area of polygons
and circles
• Area/Perimeter of
Irregular Figures
• 3-D figures
• Volume of Prisms
and Cylinders
• Volume of
Pyramids, Cones,
Spheres
• Surface Area of
Prisms, Cylinders,
Spheres
• Changing
Dimensions
• Identify, describe,
and draw from various
views.
• Build from various
views.
• Describe cross-
sectional views.
differences in area, volume and
surface area?
What happens to area, volume, and
surface area when one or more
dimensions of a figure are changed?
Area
Volume
Prism
New Terms:
Surface area
Dilation
Polygons
Lateral face
Isometric view
Corresponding angles
Corresponding sides
Geo-Solids (volume)
Power Point Presentations
white boards
Versatiles
A variety of solids to find volume
and surface area.
Children's books
Hickory Public Schools 7th Grade Math Curriculum Map
Indirect measurement
Transformation
Data Analysis
(3 weeks)
• Populations and
Samples
• Measures of
Central Tendency
• Frequency Tables
• Stem-and-Leaf
Plots
• Histograms/Bar
Graphs
• Circle Graphs
• Box-and-Whisker
Plots
• Line Graphs
• Scatter Plots
4.01 Collect, organize, analyze,
and display data to solve
problems.
4.02 Calculate, use, and
interpret the mean, median,
mode, range, frequency
distribution, and inter-quartile
range for a set of data.
4.03 Describe how the mean,
median, mode, range, frequency
distribution, and inter-quartile
range of a set of data affect its
graph.
4.04 Identify outliers and
determine their effect on the
How can advertisers try to mislead
consumers with data?
What kind of information can you
discover from a box-and-whisker plot?
What are the different ways to
compare and contrast the different
types of graphs?
Which measure of central tendency is
the best to use in a given situation?
Explain.
Review Terms:
Mean
Median
Mode
New Terms:
Measure of central tendency
Quartile
Interquartile range
Interval
DPI Essential Questions
Competitive Edge
Power point Presentations
Textbooks from other subjects,
newspapers, and
magazines to find/study graphs.
white boards

Hickory Public Schools 7th Grade Math Curriculum Map
• Misleading Graphs mean, median, mode, and range
of a set of data.
4.05 Solve problems involving
two or more sets of data using
appropriate statistical measures.
Outlier
Histogram
Algebra
(9 weeks)
• Exponents and
Powers of Ten
• Scientific Notation
• Order of
Operations
• Prime
Factorization/GCF/L
CM
• Variables and
Algebraic
Expressions
5.01 Identify, analyze, and
create linear relations,
sequences, and functions using
symbols, graphs,
tables, diagrams, and written
descriptions.
5.02 Translate among different
representations of algebraic
expressions, equations and
inequalities.
5.03 Use and evaluate algebraic
expressions, linear equations or
How do the steps for solving
inequalities compare/contrast to the
steps for solving equations?
How are the rate of change and y
intercept expressed in an equation?
Explain the use of order of operations
in solving equations.
How can you adapt the distributive
property to solve one or two step
equations?
Linear
Expression
Absolute value
Function
Inequalities
Algebraic equations
Algebraic expressions
DPI Essential Questions
Competitive Edge
Power Point Presentations
Scholastic Math
Versa tiles
Children’s Books
Students will use manipulatives
to make patterns and
then create function tables and
Hickory Public Schools 7th Grade Math Curriculum Map
• Combining Like
Terms
• Substitution
• Integer Operations
• Solving One-Step
Equations
• Solving Multi-step
Equations
• Inequalities
• Solving One-Step
Inequalities
• Solving Two-Step
Inequalities
• Introduction to
Functions
• Matching Graphs to
Equations
inequalities to solve problems.
5.04 Develop fluency in the use
of formulas to solve problems.
Inverse operations
Reciprocal
Variable
Domain
Input
Output
Coefficient
Substitution
equations from these patterns.
Proportional Reasoning
(8 weeks)
• Ratios and Rates
1.01 Develop and use ratios,
proportions, and percents to
solve problems.
2.01 Draw objects to scale and
How does one find an actual distance
on a map, given the scale?
Analyze the connection between
Review Terms:
Unit Rate
DPI Essential Questions
Modeling real life situations using
magazines, newspapers, and

Hickory Public Schools 7th Grade Math Curriculum Map
• Writing and Solving
Proportions
• Similar Figures
• Scale
Drawings/Models
• Fractions/Decimals/
Percents
• Percent of a
Number
• Percent of Change
• Simple Interest
use scale drawings to solve
problems.
3.02 Identify, define, and
describe similar and congruent
polygons with respect to angle
measures, length of sides, and
proportionality of sides.
3.03 Use scaling and
proportional reasoning to solve
problems related to similar and
congruent polygons.
fractions, decimals, and percents.
How do we use proportions to solve
percent problems? Be able to
demonstrate through working
problems.
How does a wise consumer use their
knowledge of percents?
What is the connection between
percent of change and simple
interest?
Probability
Proportion
Ratio
New Terms:
Scale
Unit price
Cross product
Commission
Discount
Interest
Wholesale
menus for percents, sales, etc.
Matchbook cars will be used
to study ratios, scale and
proportion.
M&M activity to study ratios and
proportions.
Indirect measurement
simulation.

Hickory Public Schools 7th Grade Math Curriculum Map
Retail
Mark up
Reciprocal
Assessments/Review/Te
sting
(6 weeks)
Explain the importance
of assessments.
Give several examples of the use of
math in the real world.
Coach
Competitive Edge
Holt EOG preparation book
Study Island
Classworks
Optional Extension
Topics
• Probability
5.01Identify, analyze, and create
linear relations, sequences, and
functions using symbols, graphs,
tables, diagrams, and written
How can you apply your knowledge of
rations to determining probability?
How do you use linear function tables
TI-73 Probability/Simulation
Application
Hickory Public Schools 7th Grade Math Curriculum Map
• Linear
Functions/Slope
• Rates of Change
descriptions.
5.02 Translate among different
representations of algebraic
expressions, equations and
inequalities.
5.03Use and evaluate algebraic
expressions, linear equations or
inequalities to solve problems.
5.04 Develop fluency in the use
of formulas to solve problems.
to determine rate of change/slope? dice, spinners, marbles, beans
TI manuals
Real world situations using wind
chill factors, floors in buildings,
hourly pay, etc.


