
Seventh Grade Math Book Teacher Edition Teacher: Saple Sample Books/7th Math Practi… · Step Up...
67
Step Up to the TEKS by GF Educators, Inc. Seventh Grade Math Book Teacher Edition Copyright © 2014 www.StepUpTEKS.com Teacher: Sample Do Not Duplicate
Transcript of Seventh Grade Math Book Teacher Edition Teacher: Saple Sample Books/7th Math Practi… · Step Up...
Step Up to the TEKS by GF Educators, Inc.
Seventh Grade Math Book
Teacher Edition
Copyright © 2014
www.StepUpTEKS.com
Teacher:
Sam
ple
Do Not
Dup
licat
e
Step Up to the TEKS
Seventh Grade Math Book
by GF Educators, Inc.
Table of ContentsProbability and Numerical Representations Rational Number Sets (7.2A) . . . . . . . . . . . . . . . . . . . . . . . . . . . . . . . . . . . . . . . . . . . . . . . . . . . . . . . . . . . . .1 Sample Spaces (7.6A) . . . . . . . . . . . . . . . . . . . . . . . . . . . . . . . . . . . . . . . . . . . . . . . . . . . . . . . . . . . . . . . . . . .5 Experimental Probability (7.6C) . . . . . . . . . . . . . . . . . . . . . . . . . . . . . . . . . . . . . . . . . . . . . . . . . . . . . . . . . .10 Theoretical Probability (7.6D) . . . . . . . . . . . . . . . . . . . . . . . . . . . . . . . . . . . . . . . . . . . . . . . . . . . . . . . . . . .15 Probabilities and Complements (7.6E) . . . . . . . . . . . . . . . . . . . . . . . . . . . . . . . . . . . . . . . . . . . . . . . . . . . . .19 Qualitative and Quantitative Predictions (7.6H) . . . . . . . . . . . . . . . . . . . . . . . . . . . . . . . . . . . . . . . . . . . . .23 Experimental and Theoretical Probability (7.6I) . . . . . . . . . . . . . . . . . . . . . . . . . . . . . . . . . . . . . . . . . . . . . .27 Category 1 Answer Key . . . . . . . . . . . . . . . . . . . . . . . . . . . . . . . . . . . . . . . . . . . . . . . . . . . . . . . . . . . . . . . .31
Computations and Algebraic Relationships Operations with Rational Numbers (7.3A) . . . . . . . . . . . . . . . . . . . . . . . . . . . . . . . . . . . . . . . . . . . . . . . . .33 Operations (7.3B) . . . . . . . . . . . . . . . . . . . . . . . . . . . . . . . . . . . . . . . . . . . . . . . . . . . . . . . . . . . . . . . . . . . . .38 Representing Rates of Change (7.4A) . . . . . . . . . . . . . . . . . . . . . . . . . . . . . . . . . . . . . . . . . . . . . . . . . . . . .43 Calculate Unit Rates (7.4B) . . . . . . . . . . . . . . . . . . . . . . . . . . . . . . . . . . . . . . . . . . . . . . . . . . . . . . . . . . . . .47 Constant of Proportionality (7.4C) . . . . . . . . . . . . . . . . . . . . . . . . . . . . . . . . . . . . . . . . . . . . . . . . . . . . . . .51 Rates, Ratios, Percents (7.4D). . . . . . . . . . . . . . . . . . . . . . . . . . . . . . . . . . . . . . . . . . . . . . . . . . . . . . . . . . . .55 Multiple Representations (7.7A). . . . . . . . . . . . . . . . . . . . . . . . . . . . . . . . . . . . . . . . . . . . . . . . . . . . . . . . . .59 Write One-Variable Equations (7.10A) . . . . . . . . . . . . . . . . . . . . . . . . . . . . . . . . . . . . . . . . . . . . . . . . . . . .63 Number Line Solutions (7.10B) . . . . . . . . . . . . . . . . . . . . . . . . . . . . . . . . . . . . . . . . . . . . . . . . . . . . . . . . . .67 Interpret Equations and Inequalities (7.10C) . . . . . . . . . . . . . . . . . . . . . . . . . . . . . . . . . . . . . . . . . . . . . . . .71 Solve Equations and Inequalities (7.11A) . . . . . . . . . . . . . . . . . . . . . . . . . . . . . . . . . . . . . . . . . . . . . . . . . . .75 Check Solutions (7.11B) . . . . . . . . . . . . . . . . . . . . . . . . . . . . . . . . . . . . . . . . . . . . . . . . . . . . . . . . . . . . . . . .79 Category 2 Answer Key . . . . . . . . . . . . . . . . . . . . . . . . . . . . . . . . . . . . . . . . . . . . . . . . . . . . . . . . . . . . . . . .83
Geometry and Measurement Conversion (7.4E) . . . . . . . . . . . . . . . . . . . . . . . . . . . . . . . . . . . . . . . . . . . . . . . . . . . . . . . . . . . . . . . . . . . . .86 Similarity (7.5A). . . . . . . . . . . . . . . . . . . . . . . . . . . . . . . . . . . . . . . . . . . . . . . . . . . . . . . . . . . . . . . . . . . . . . .90 Understanding π (7.5B). . . . . . . . . . . . . . . . . . . . . . . . . . . . . . . . . . . . . . . . . . . . . . . . . . . . . . . . . . . . . . . . .94 Applied Similarity (7.5C). . . . . . . . . . . . . . . . . . . . . . . . . . . . . . . . . . . . . . . . . . . . . . . . . . . . . . . . . . . . . . . .98 Volume (7.9A) . . . . . . . . . . . . . . . . . . . . . . . . . . . . . . . . . . . . . . . . . . . . . . . . . . . . . . . . . . . . . . . . . . . . . . .102 Circumference and Area of Circles (7.9B) . . . . . . . . . . . . . . . . . . . . . . . . . . . . . . . . . . . . . . . . . . . . . . . . .106 Composite Figures (7.9C). . . . . . . . . . . . . . . . . . . . . . . . . . . . . . . . . . . . . . . . . . . . . . . . . . . . . . . . . . . . . .110 Lateral and Total Surface Area (7.9D). . . . . . . . . . . . . . . . . . . . . . . . . . . . . . . . . . . . . . . . . . . . . . . . . . . . .114 Equations from Geometry (7.11C) . . . . . . . . . . . . . . . . . . . . . . . . . . . . . . . . . . . . . . . . . . . . . . . . . . . . . .118 Category 3 Answer Key . . . . . . . . . . . . . . . . . . . . . . . . . . . . . . . . . . . . . . . . . . . . . . . . . . . . . . . . . . . . . . .122
Data Analysis and Personal Financial Literacy Representations of Data (7.6G) . . . . . . . . . . . . . . . . . . . . . . . . . . . . . . . . . . . . . . . . . . . . . . . . . . . . . . . . .124 Comparing Data (7.12A) . . . . . . . . . . . . . . . . . . . . . . . . . . . . . . . . . . . . . . . . . . . . . . . . . . . . . . . . . . . . . .128 Population Inferences (7.12B). . . . . . . . . . . . . . . . . . . . . . . . . . . . . . . . . . . . . . . . . . . . . . . . . . . . . . . . . . .133 Comparing Populations (7.12C) . . . . . . . . . . . . . . . . . . . . . . . . . . . . . . . . . . . . . . . . . . . . . . . . . . . . . . . . .137 Sales and Income Tax (7.13A) . . . . . . . . . . . . . . . . . . . . . . . . . . . . . . . . . . . . . . . . . . . . . . . . . . . . . . . . . . .142 Components of a Personal Budget (7.13B) . . . . . . . . . . . . . . . . . . . . . . . . . . . . . . . . . . . . . . . . . . . . . . . .146 Financial Assets and Liabilities (7.13C) . . . . . . . . . . . . . . . . . . . . . . . . . . . . . . . . . . . . . . . . . . . . . . . . . . . .150 Family Budget (7.13D) . . . . . . . . . . . . . . . . . . . . . . . . . . . . . . . . . . . . . . . . . . . . . . . . . . . . . . . . . . . . . . . .154 Simple and Compound Interest (7.13E) . . . . . . . . . . . . . . . . . . . . . . . . . . . . . . . . . . . . . . . . . . . . . . . . . . .158 Monetary Incentives (7.13F) . . . . . . . . . . . . . . . . . . . . . . . . . . . . . . . . . . . . . . . . . . . . . . . . . . . . . . . . . . . .162 Category 4 Answer Key . . . . . . . . . . . . . . . . . . . . . . . . . . . . . . . . . . . . . . . . . . . . . . . . . . . . . . . . . . . . . . .166
Vocabulary Cards . . . . . . . . . . . . . . . . . . . . . . . . . . . . . . . . . . . . . . . . . . . . . . . . . . . . . . . . . . . . . . . . . . . . . . . . . . . . .169
Sam
ple
Do Not
Dup
licat
e

Sam
ple
Do Not
Dup
licat
e
17th Grade Mathematics © 2014
BackgroundInformation
BI
Student Expectations -
Category
TEKS
Ver
tica
l Alig
nm
ent
Vocabulary
Understanding the TEKS
Essential Question(s)
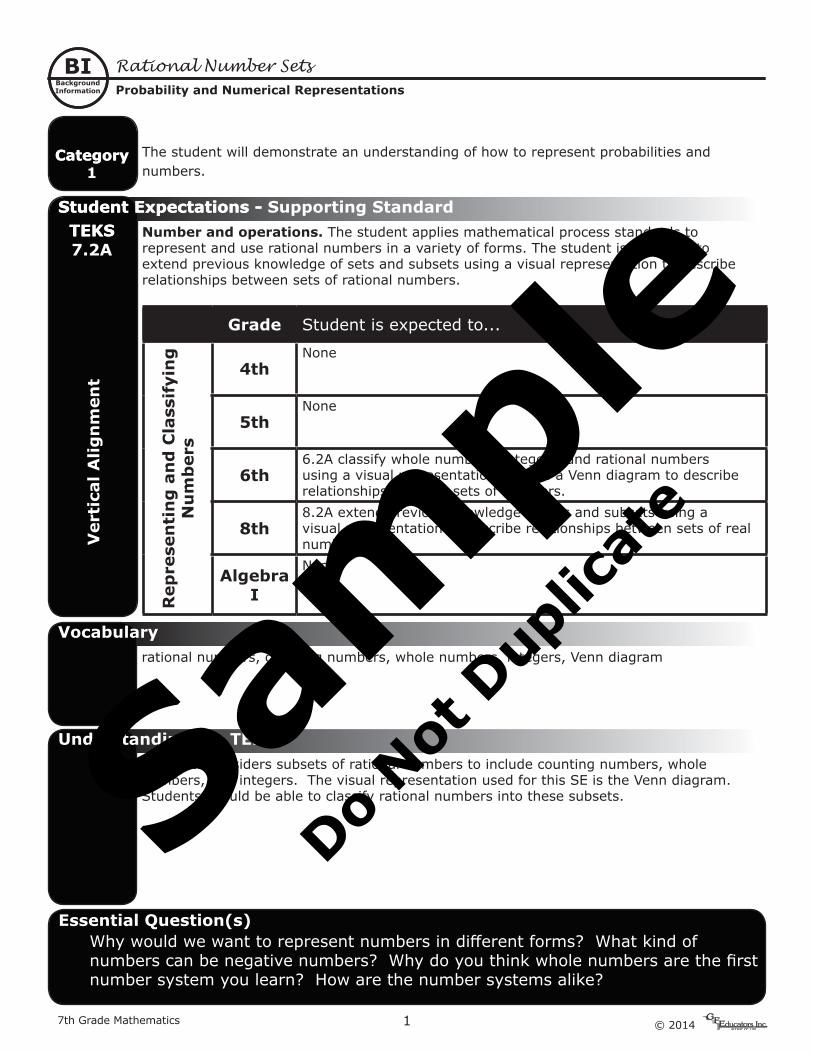
The state considers subsets of rational numbers to include counting numbers, whole numbers, and integers. The visual representation used for this SE is the Venn diagram. Students should be able to classify rational numbers into these subsets.
rational numbers, counting numbers, whole numbers, integers, Venn diagram
Why would we want to represent numbers in different forms? What kind of numbers can be negative numbers? Why do you think whole numbers are the first number system you learn? How are the number systems alike?
Grade Student is expected to...
Rep
rese
nti
ng
an
d C
lass
ifyi
ng
N
um
ber
s
4thNone
5thNone
6th6.2A classify whole numbers, integers, and rational numbers using a visual representation such as a Venn diagram to describe relationships between sets of numbers.
8th8.2A extend previous knowledge of sets and subsets using a visual representation to describe relationships between sets of real numbers.
Algebra I
None
Student Expectations - Supporting StandardTEKS 7.2A
Category1
Rational Number SetsProbability and Numerical Representations
The student will demonstrate an understanding of how to represent probabilities and numbers.
Number and operations. The student applies mathematical process standards to represent and use rational numbers in a variety of forms. The student is expected to extend previous knowledge of sets and subsets using a visual representation to describe relationships between sets of rational numbers.
Sam
ple
Do Not
Dup
licat
e
© 2014 2 7th Grade Mathematics
Name:
EngagingActivity
A
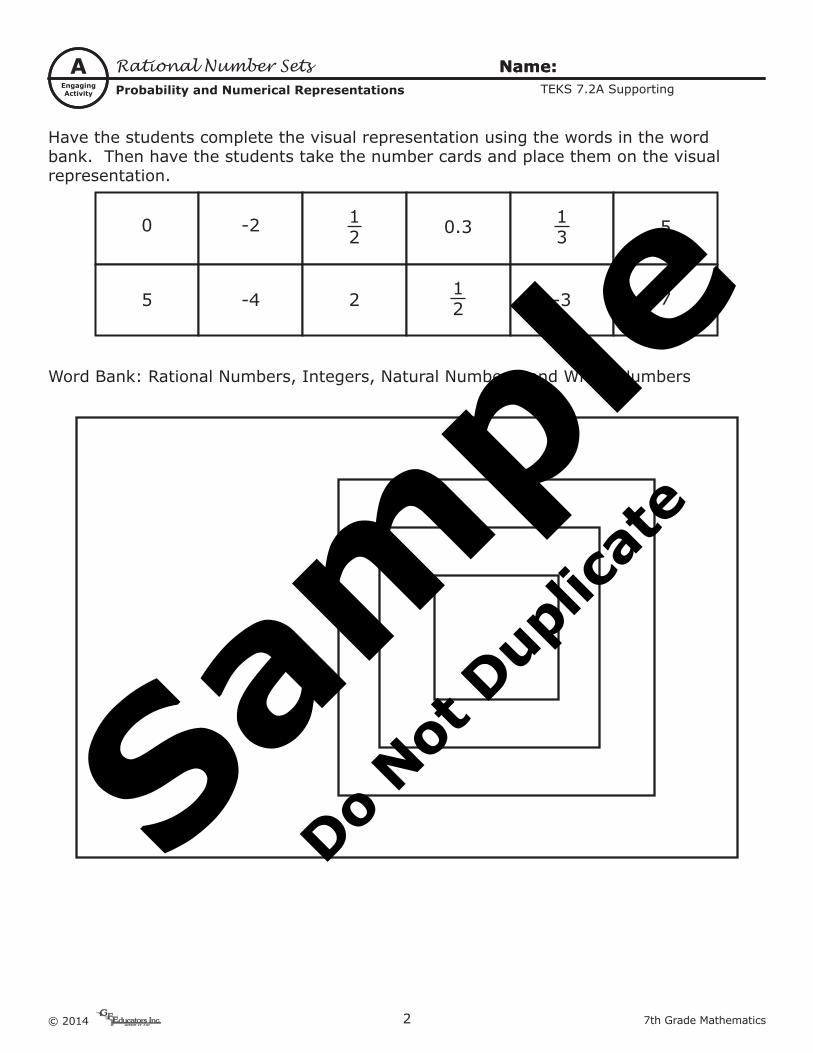
Have the students complete the visual representation using the words in the word bank. Then have the students take the number cards and place them on the visual representation.
0
5
5
72
0.3-2
-4 -3
12
12
13
Word Bank: Rational Numbers, Integers, Natural Numbers, and Whole Numbers
Rational Number SetsProbability and Numerical Representations
Name:TEKS 7.2A Supporting
Sam
ple
Do Not
Dup
licat
e
37th Grade Mathematics © 2014
Name:
TeachingModel
TM
Thinking Mathematically
Putting the Pieces Together
Have students make lists of the subsets of rational numbers. Make sure the students understand the hierarchy of the set structure. Use Venn diagrams to show the relationships between sets.
Why would we want to represent numbers in different forms? Depending on the situation, you need equivalent forms of numbers.What kind of numbers can be negative numbers? All numbers can be negative.Why do you think whole numbers are the first number system you learn? Whole numbers are a subset of counting numbers.How are the number systems alike? Number systems are all subsets of real or imaginary numbers.
Rational Number SetsProbability and Numerical Representations
Name:
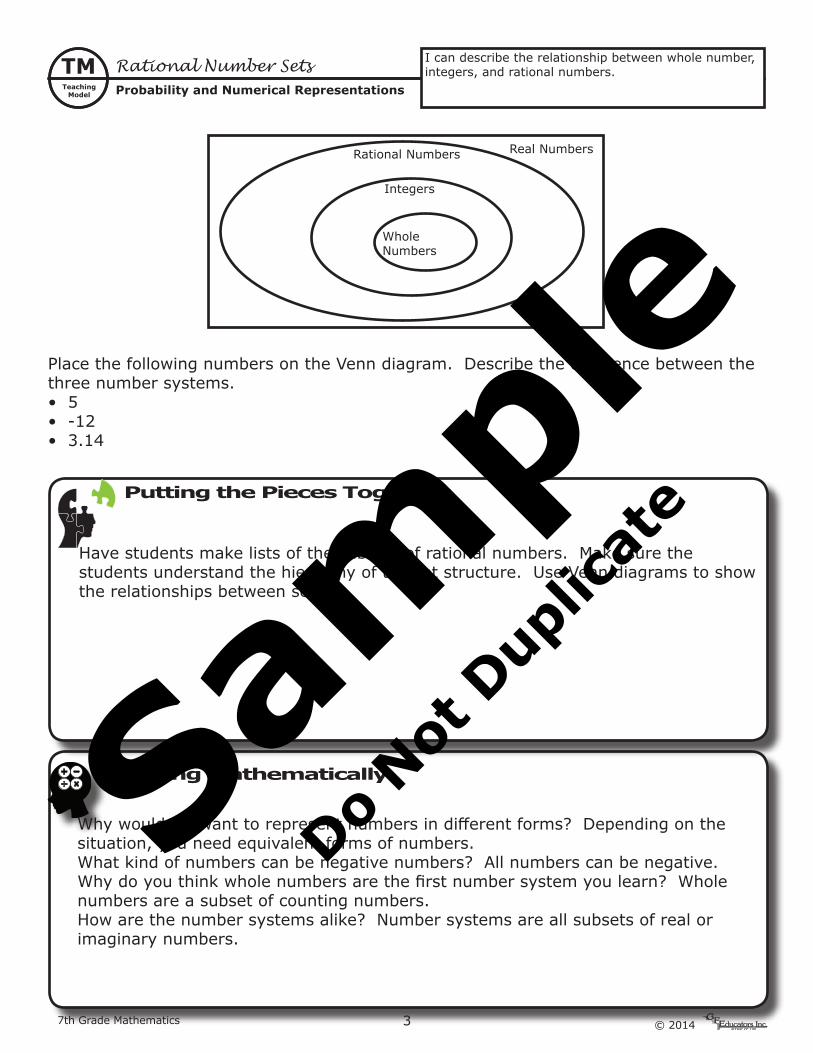
I can describe the relationship between whole number, integers, and rational numbers.
Rational Numbers
Integers
WholeNumbers
Real Numbers
Place the following numbers on the Venn diagram. Describe the difference between the three number systems.• 5• -12• 3.14
Sam
ple
Do Not
Dup
licat
e
© 2014 4 7th Grade Mathematics
Name:
GuidedPractice
GP Rational Number SetsProbability and Numerical Representations
Name:TEKS 7.2A Supporting
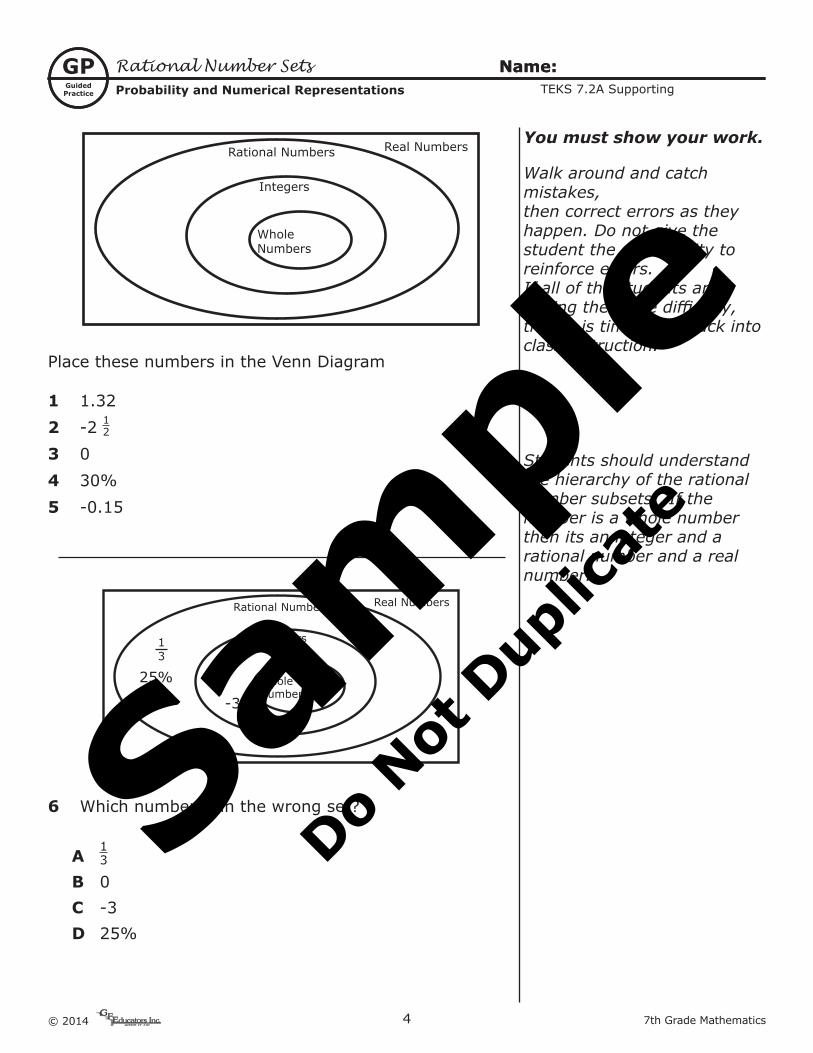
Rational Numbers
Integers
WholeNumbers
Real Numbers
Place these numbers in the Venn Diagram
1 1.322 -2 123 04 30%5 -0.15
Rational Numbers
Integers
WholeNumbers
Real Numbers
13
25%-5 0
-3-35
6 Which number is in the wrong set?
A 13
B 0C -3D 25%
You must show your work.
Walk around and catch mistakes,then correct errors as theyhappen. Do not give thestudent the opportunity toreinforce errors.If all of the students arehaving the same difficulty,then it is time to go back intoclass instruction.
Students should understand the hierarchy of the rational number subsets. If the number is a whole number then its an integer and a rational number and a real number.
Sam
ple
Do Not
Dup
licat
e

57th Grade Mathematics © 2014
BackgroundInformation
BIV
erti
cal A
lign
men
t
Vocabulary
Understanding the TEKS
Essential Question(s)
Students will make both lists and tree diagrams to represent all of the possibilities of simple and compound events.
simple events, compound events, independent event, dependent event, tree diagram
Why would I want to represent sample space? How does the sample space represent the total possible outcomes? Why is it important to organize outcomes to determine the total outcomes? How are making lists and tree diagrams similar?
Student Expectations - Supporting Standard
Grade Student is expected to...
Con
nec
tin
g P
rop
orti
onal
ity
and
Pro
bab
ility
an
d
Sta
tist
ics
4thNone
5thNone
6thNone
8thNone
Algebra I
None
TEKS 7.6A
Category 1
Sample SpacesProbability and Numerical Representations
The student will demonstrate an understanding of how to represent probabilities and numbers.
Proportionality. The student applies mathematical process standards to use probability and statistics to describe or solve problems involving proportional relationships. The student is expected to represent sample spaces for simple and compound events using lists and tree diagrams.
Sam
ple
Do Not
Dup
licat
e

© 2014 6 7th Grade Mathematics
Name:
EngagingActivity
A
The set of all possible outcomes of a probability experiment is called the sample space. The sample space may be quite small, as it is when you toss a coin (sample space: heads or tails).
A number cube is numbered from 1 to 6. A spinner has 5 equal sections lettered from A through E. You can use an organized list to find the sample space for an experiment.
23 6
A B
C
D
E
1 Work with a partner. Decide on a logical system you can use to list all the possible outcomes when you roll the number cube and spin the spinner. Describe the method you will use.
__________________________________________________________________
__________________________________________________________________
__________________________________________________________________
2 Write the sample space. Use a number and a letter to write each possible outcome. For example, 3B means “Roll a 3, spin a B.”
__________________________________________________________________
__________________________________________________________________
3 How many outcomes are there in the sample space? _________________________
Sample SpacesProbability and Numerical Representations
Name:TEKS 7.6A Supporting
Sam
ple
Do Not
Dup
licat
e
77th Grade Mathematics © 2014
Name:
TeachingModel
TM I can ...
Thinking Mathematically
Putting the Pieces Together
When looking at sample space, you can start off by asking the students to just think of all the possible combinations for which they can think. Once you get several listed and start listing repeated possibilities, you ask if there might be a more organized way of listing the possibilities. This then leads to a discussion about either an organized list or a tree diagram.
Why would I want to represent sample space? Sample space lists all the possible outcomes of an event.How does the sample space represent the total possible outcomes? You can use an organized list or tree diagram to show the total outcomes of an event.Why is it important to organize outcomes to determine the total outcomes? With organization, I know that all outcomes have been determined.How are making lists and tree diagrams similar? Both lists and tree diagrams provide an organized method of determining all possible outcomes.
Sample SpacesProbability and Numerical Representations
Name:
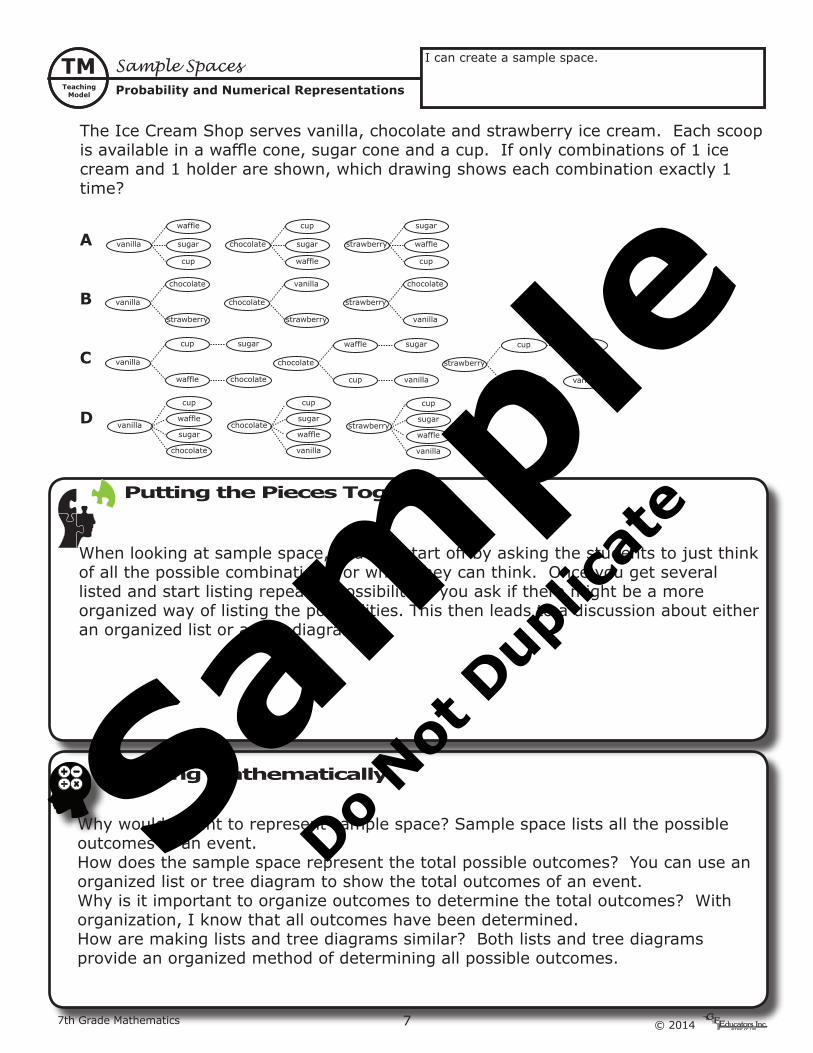
I can create a sample space.
The Ice Cream Shop serves vanilla, chocolate and strawberry ice cream. Each scoop is available in a waffle cone, sugar cone and a cup. If only combinations of 1 ice cream and 1 holder are shown, which drawing shows each combination exactly 1 time?
A
vanilla
waffle
sugar
cup
chocolate
cup
sugar
waffle
strawberry
sugar
waffle
cup
B
vanilla
chocolate
strawberry
chocolate
vanilla
strawberry
strawberry
chocolate
vanilla
C
vanilla
cup
waffle
sugar
chocolate
chocolate
waffle
cup
sugar
vanilla
strawberry
cup
waffle
sugar
vanilla
D
vanilla
cup
waffle
sugar
chocolate
chocolate
cup
sugar
waffle
vanilla
strawberry
cup
sugar
waffle
vanilla
Sam
ple
Do Not
Dup
licat
e
© 2014 8 7th Grade Mathematics
Name:
GuidedPractice
GP Sample SpacesProbability and Numerical Representations
Name:TEKS 7.6A Supporting
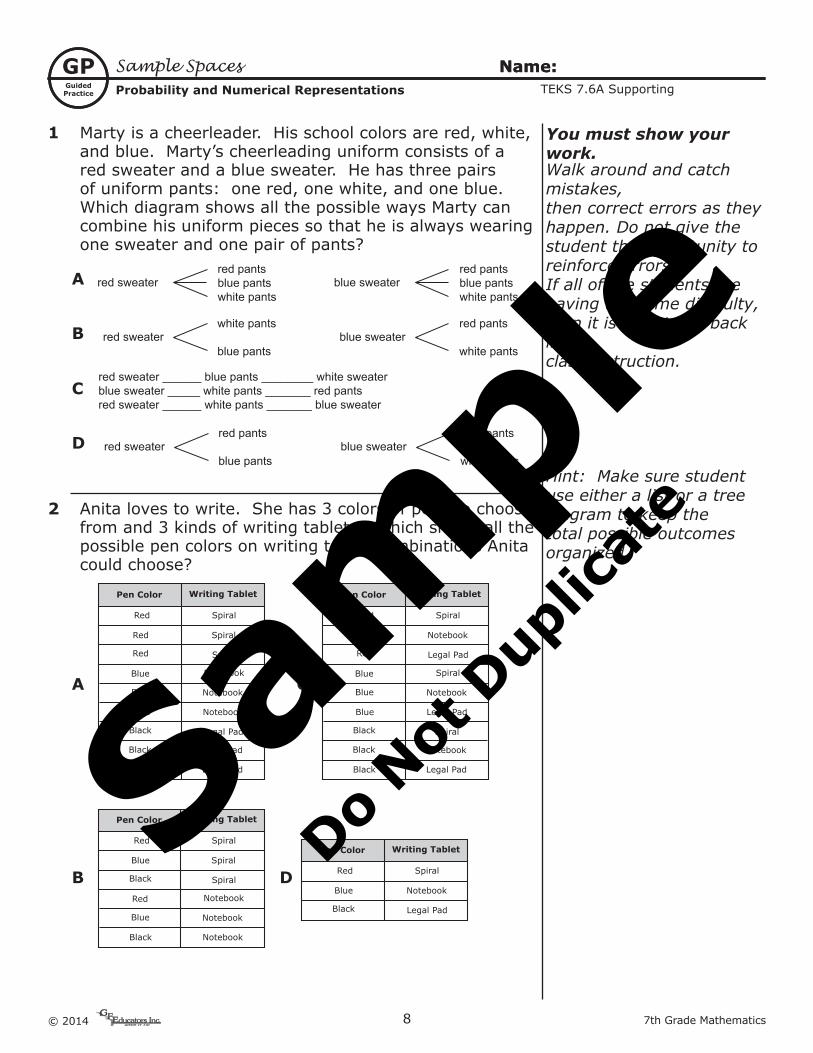
1 Marty is a cheerleader. His school colors are red, white, and blue. Marty’s cheerleading uniform consists of a red sweater and a blue sweater. He has three pairs of uniform pants: one red, one white, and one blue. Which diagram shows all the possible ways Marty can combine his uniform pieces so that he is always wearing one sweater and one pair of pants?
A
red sweater blue sweaterred pantsblue pantswhite pants
red pantsblue pantswhite pants
B
red sweater blue sweaterwhite pants
blue pants
red pants
white pants
C
red sweater ______ blue pants ________ white sweaterblue sweater _____ white pants _______ red pantsred sweater ______ white pants _______ blue sweater
D
red sweater blue sweaterred pants
blue pants
blue pants
white pants
2 Anita loves to write. She has 3 colors of pens to choose from and 3 kinds of writing tablets. Which shows all the possible pen colors on writing tablet combinations Anita could choose?
A
Pen Color Writing Tablet
Red Spiral
Spiral
Spiral
Red
Red
Notebook
Notebook
Blue
Blue
Notebook
Legal Pad
Blue
Black
Legal PadBlack
Legal PadBlack
C
Pen Color Writing Tablet
Red Spiral
Notebook
Legal Pad
Red
Red
Spiral
Notebook
Blue
Blue
Legal Pad
Spiral
Blue
Black
NotebookBlack
Legal PadBlack
B
Pen Color Writing Tablet
Red Spiral
Spiral
Spiral
Blue
Black
Notebook
Notebook
Red
Blue
NotebookBlack
D
Pen Color Writing Tablet
Red Spiral
Notebook
Legal Pad
Blue
Black
You must show your work.Walk around and catch mistakes,then correct errors as theyhappen. Do not give thestudent the opportunity toreinforce errors.If all of the students arehaving the same difficulty,then it is time to go back intoclass instruction.
Hint: Make sure student use either a list or a tree diagram to keep the total possible outcomes organized.
Sam
ple
Do Not
Dup
licat
e
97th Grade Mathematics © 2014
Name:
GuidedPractice
GP Sample SpacesProbability and Numerical Representations
Name:TEKS 7.6A Supporting
You must show your work.Walk around and catch mistakes,then correct errors as theyhappen. Do not give thestudent the opportunity toreinforce errors.If all of the students arehaving the same difficulty,then it is time to go back intoclass instruction.
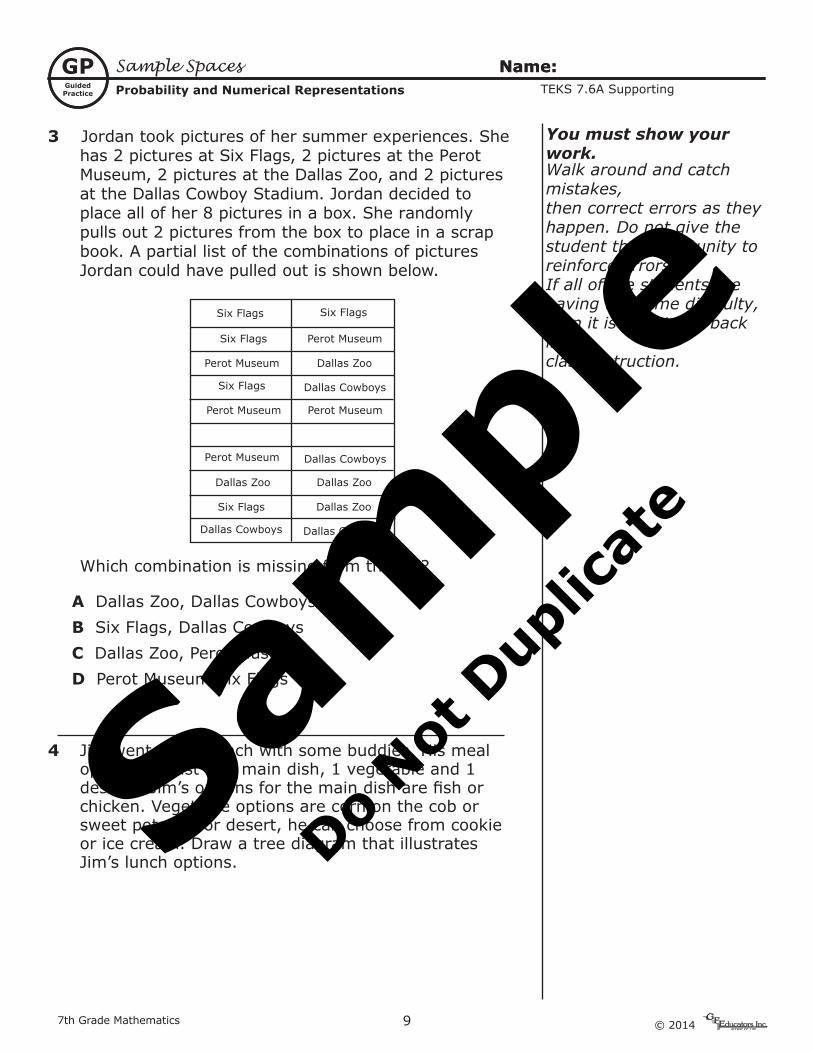
3 Jordan took pictures of her summer experiences. She has 2 pictures at Six Flags, 2 pictures at the Perot Museum, 2 pictures at the Dallas Zoo, and 2 pictures at the Dallas Cowboy Stadium. Jordan decided to place all of her 8 pictures in a box. She randomly pulls out 2 pictures from the box to place in a scrap book. A partial list of the combinations of pictures Jordan could have pulled out is shown below.
Six Flags Six Flags
Six Flags Perot Museum
Dallas Zoo
Dallas Cowboys
Perot Museum
Six Flags
Perot Museum Perot Museum
Dallas Zoo Dallas Zoo
Dallas Zoo
Dallas Cowboys
Six Flags
Dallas Cowboys
Dallas CowboysPerot Museum
Which combination is missing from the list?
A Dallas Zoo, Dallas CowboysB Six Flags, Dallas CowboysC Dallas Zoo, Perot MuseumD Perot Museum,Six Flags
4 Jim went out to lunch with some buddies. His meal options consist of 1 main dish, 1 vegetable and 1 dessert. Jim’s options for the main dish are fish or chicken. Vegetable options are corn on the cob or sweet potato. For desert, he can choose from cookie or ice cream. Draw a tree diagram that illustrates Jim’s lunch options.Sa
mpl
e
Do Not
Dup
licat
e
© 2014 10 7th Grade Mathematics
BackgroundInformation
BIV
erti
cal A
lign
men
t
Vocabulary
Understanding the TEKS
Essential Question(s)
This SE involves using only experimental data. The students will predict and solve problems that involve data from surveys and polls for both simple and compound events.
experimental data, simple event, compound event
How do you make a reasonable prediction of future events from experimental data?What is the difference between making predictions between using experimental data for compound and simple events? How do you make decisions from experimental data?
Student Expectations - Supporting Standard
Grade Student is expected to...
Con
nec
tin
g P
rop
orti
onal
ity
and
Pro
bab
ility
an
d
Sta
tist
ics
4thNone
5thNone
6thNone
8thNone
Algebra I
None
TEKS 7.6C
Category1
Experimental Probability
Probability and Numerical Representations
The student will demonstrate an understanding of how to represent probabilities and numbers.
Proportionality. The student applies mathematical process standards to use probability and statistics to describe or solve problems involving proportional relationships. The student is expected to make predictions and determine solutions using experimental data for simple and compound events.
Sam
ple
Do Not
Dup
licat
e
117th Grade Mathematics © 2014
Name:
EngagingActivity
A
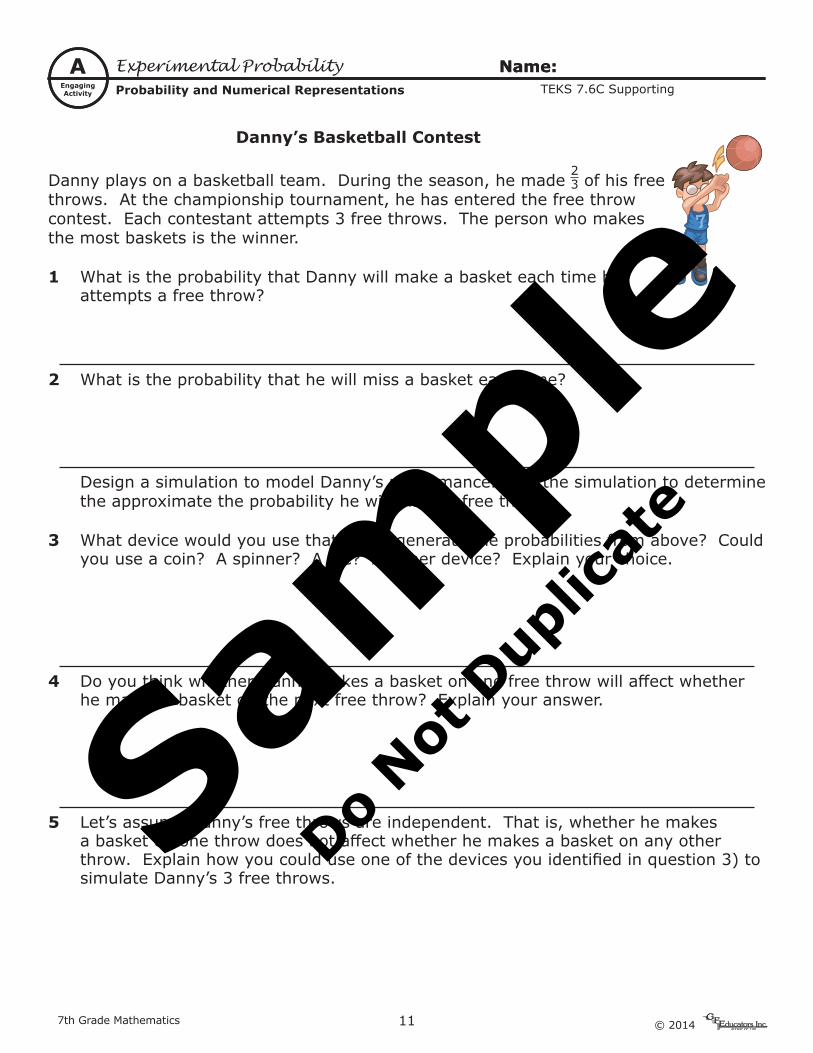
Danny’s Basketball Contest
Danny plays on a basketball team. During the season, he made 23 of his free
throws. At the championship tournament, he has entered the free throw contest. Each contestant attempts 3 free throws. The person who makes the most baskets is the winner.
1 What is the probability that Danny will make a basket each time he attempts a free throw?
2 What is the probability that he will miss a basket each time?
Design a simulation to model Danny’s performance. Use the simulation to determine the approximate the probability he will make 3 free throws.
3 What device would you use that would generate the probabilities from above? Could you use a coin? A spinner? A die? Another device? Explain your choice.
4 Do you think whether Danny makes a basket on one free throw will affect whether he makes a basket on the next free throw? Explain your answer.
5 Let’s assume Danny’s free throws are independent. That is, whether he makes a basket on one throw does not affect whether he makes a basket on any other throw. Explain how you could use one of the devices you identified in question 3) to simulate Danny’s 3 free throws.
Experimental ProbabilityProbability and Numerical Representations
Name:TEKS 7.6C Supporting
Sam
ple
Do Not
Dup
licat
e
© 2014 12 7th Grade Mathematics
EngagingActivity
A
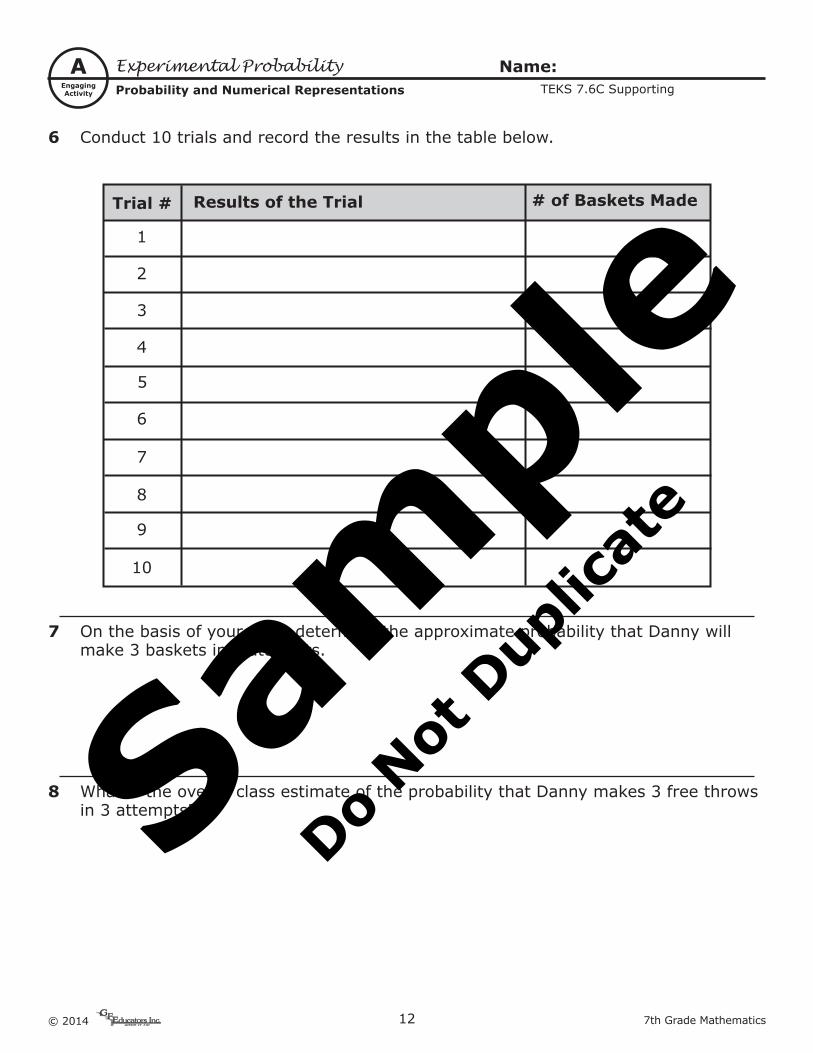
6 Conduct 10 trials and record the results in the table below.
Trial # Results of the Trial
1
# of Baskets Made
2
3
4
5
6
7
8
9
10
7 On the basis of your data, determine the approximate probability that Danny will make 3 baskets in 3 attempts.
8 What is the overall class estimate of the probability that Danny makes 3 free throws in 3 attempts?
Experimental ProbabilityProbability and Numerical Representations
Name:TEKS 7.6C Supporting
Sam
ple
Do Not
Dup
licat
e
137th Grade Mathematics © 2014
TeachingModel
TM
Thinking Mathematically
Putting the Pieces Together
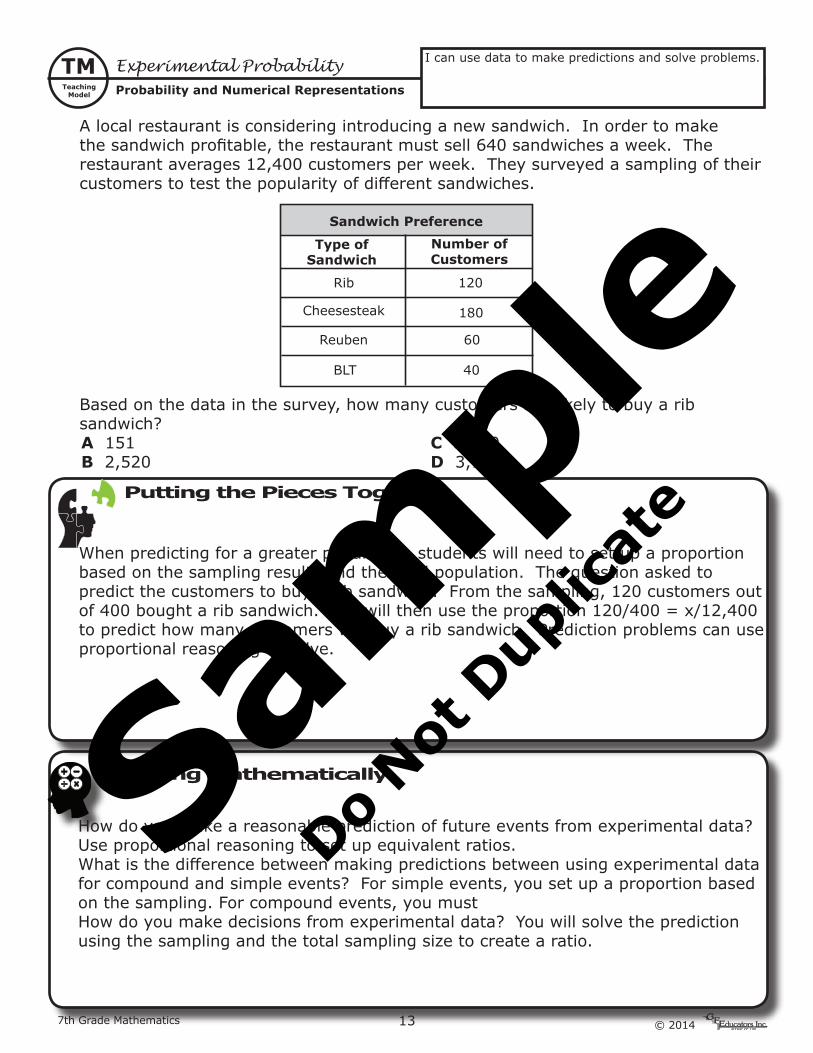
When predicting for a greater population, students will need to set up a proportion based on the sampling results and the total population. The question asked to predict the customers to buy a rib sandwich. From the sampling, 120 customers out of 400 bought a rib sandwich. You will then use the proportion 120/400 = x/12,400 to predict how many customers will buy a rib sandwich. Prediction problems can use proportional reasoning to solve.
How do you make a reasonable prediction of future events from experimental data? Use proportional reasoning to set up equivalent ratios.What is the difference between making predictions between using experimental data for compound and simple events? For simple events, you set up a proportion based on the sampling. For compound events, you mustHow do you make decisions from experimental data? You will solve the prediction using the sampling and the total sampling size to create a ratio.
Experimental ProbabilityProbability and Numerical Representations
Name:
I can use data to make predictions and solve problems.
A local restaurant is considering introducing a new sandwich. In order to make the sandwich profitable, the restaurant must sell 640 sandwiches a week. The restaurant averages 12,400 customers per week. They surveyed a sampling of their customers to test the popularity of different sandwiches.
Type of Sandwich
Sandwich Preference
Number of Customers
120
180
Rib
Cheesesteak
Reuben 60
40BLT
Based on the data in the survey, how many customers are likely to buy a rib sandwich?
A 151 C 3,600 B 2,520 D 3,720
Sam
ple
Do Not
Dup
licat
e
© 2014 14 7th Grade Mathematics
GuidedPractice
GP Experimental ProbabilityProbability and Numerical Representations
Name:TEKS 7.6C Supporting
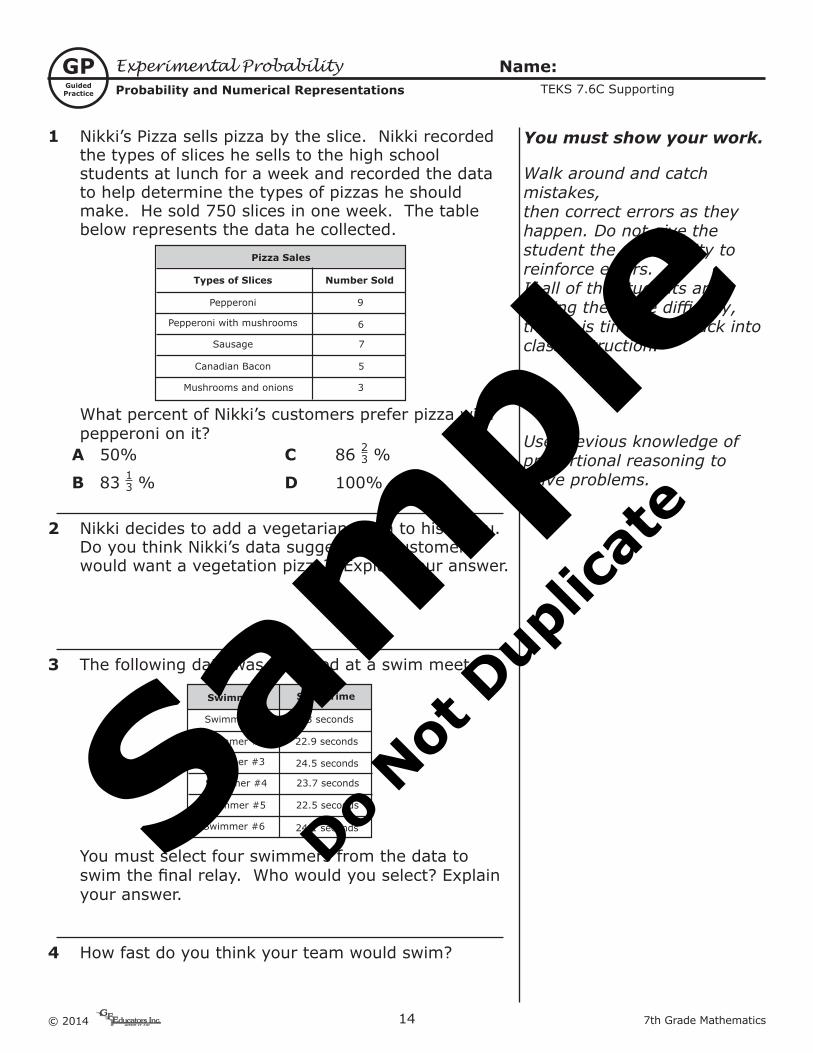
1 Nikki’s Pizza sells pizza by the slice. Nikki recorded the types of slices he sells to the high school students at lunch for a week and recorded the data to help determine the types of pizzas he should make. He sold 750 slices in one week. The table below represents the data he collected.
Types of Slices
Pizza Sales
Number Sold
9
6
Pepperoni
Pepperoni with mushrooms
Sausage 7
Mushrooms and onions 3
5Canadian Bacon
What percent of Nikki’s customers prefer pizza with pepperoni on it?
A 50% C 86 23 %
B 83 13 % D 100%
2 Nikki decides to add a vegetarian pizza to his menu. Do you think Nikki’s data suggests his customers would want a vegetation pizza? Explain your answer.
3 The following data was collected at a swim meet.
Swimmer Swim Time
Swimmer #1 23 seconds
22.9 seconds
24.5 seconds
Swimmer #2
Swimmer #4 23.7 seconds
22.5 secondsSwimmer #5
Swimmer #3
24.1 secondsSwimmer #6
You must select four swimmers from the data to swim the final relay. Who would you select? Explain your answer.
4 How fast do you think your team would swim?
You must show your work.
Walk around and catch mistakes,then correct errors as theyhappen. Do not give thestudent the opportunity toreinforce errors.If all of the students arehaving the same difficulty,then it is time to go back intoclass instruction.
Use previous knowledge of proportional reasoning to solve problems.
Sam
ple
Do Not
Dup
licat
e

157th Grade Mathematics © 2014
BackgroundInformation
BIV
erti
cal A
lign
men
t
Vocabulary
Understanding the TEKS
Essential Question(s)
This SE involves using only theoretical data. The students will predict and solve problems that involve data from known probabilities for both simple and compound events.
theoretical probability, sample space
How do you make a reasonable prediction of future events from theoretical data?How is theoretical data different from experimental data? How can theoretical data help make predictions? How does the outcome you are looking for compare to the total outcomes?
Student Expectations - Supporting Standard
Grade Student is expected to...
Con
nec
tin
g P
rop
orti
onal
ity
and
Pro
bab
ility
an
d
Sta
tist
ics
4thNone
5thNone
6thNone
8thNone
Algebra I
None
TEKS 7.6D
Category1
Theoretical ProbabilityProbability and Numerical Representations
The student will demonstrate an understanding of how to represent probabilities and numbers.
Proportionality. The student applies mathematical process standards to use probability and statistics to describe or solve problems involving proportional relationships. The student is expected to make predictions and determine solutions using theoretical probability for simple and compound events.
Sam
ple
Do Not
Dup
licat
e
© 2014 16 7th Grade Mathematics
EngagingActivity
A Theoretical ProbabilityProbability and Numerical Representations
Name:TEKS 7.6D Supporting
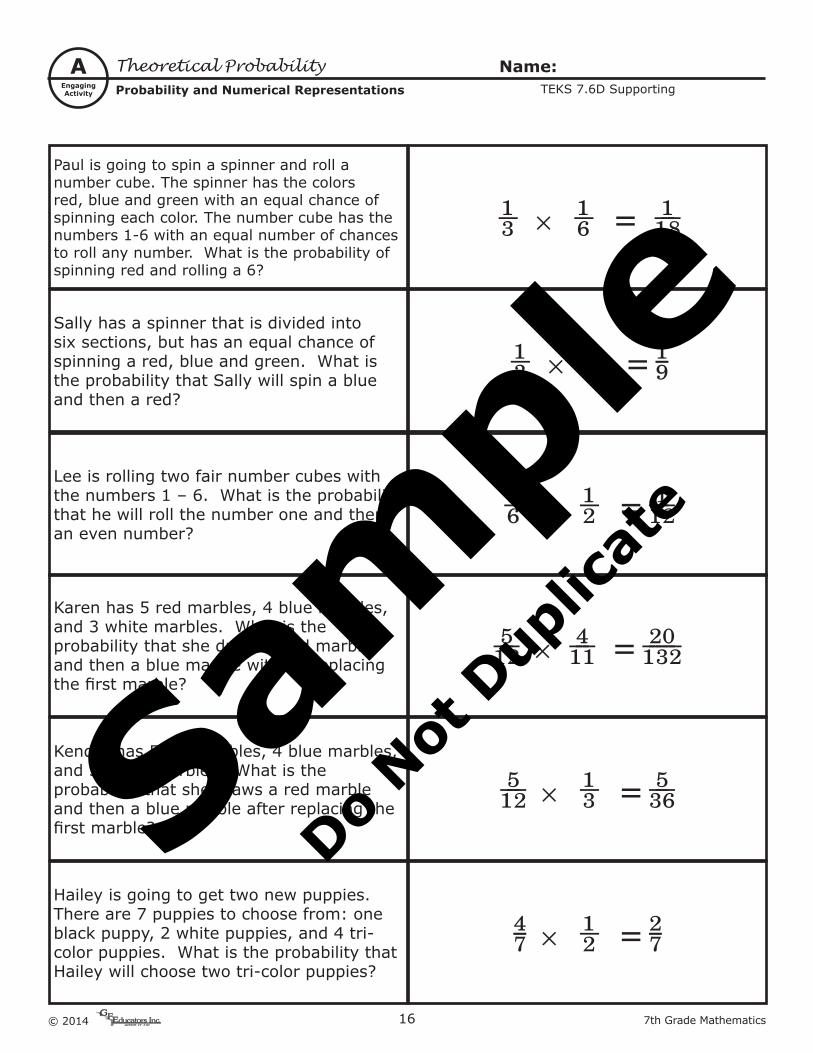
Paul is going to spin a spinner and roll a number cube. The spinner has the colors red, blue and green with an equal chance of spinning each color. The number cube has the numbers 1-6 with an equal number of chances to roll any number. What is the probability of spinning red and rolling a 6?
⅓ × ⅙ = 118
Sally has a spinner that is divided into six sections, but has an equal chance of spinning a red, blue and green. What is the probability that Sally will spin a blue and then a red?
⅓ × ⅓ = 91
Lee is rolling two fair number cubes with the numbers 1 – 6. What is the probability that he will roll the number one and then an even number?
⅙ × ½ = 112
Karen has 5 red marbles, 4 blue marbles, and 3 white marbles. What is the probability that she draws a red marble and then a blue marble without replacing the first marble?
152 × 141 = 12302
Kendra has 5 red marbles, 4 blue marbles, and 3 white marbles. What is the probability that she draws a red marble and then a blue marble after replacing the first marble?
152 × ⅓ = 356
Hailey is going to get two new puppies. There are 7 puppies to choose from: one black puppy, 2 white puppies, and 4 tri-color puppies. What is the probability that Hailey will choose two tri-color puppies?
74 × ½ = 72
Sam
ple
Do Not
Dup
licat
e
177th Grade Mathematics © 2014
TeachingModel
TM I can ...
Thinking Mathematically
Putting the Pieces Together
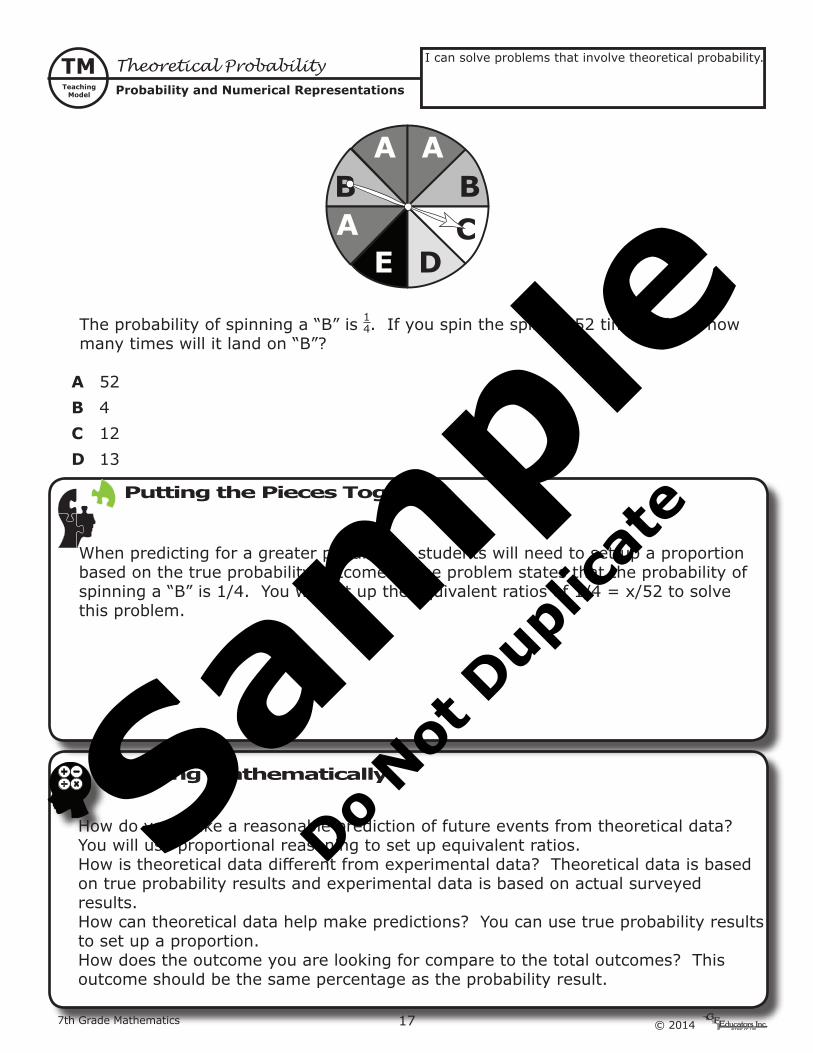
When predicting for a greater population, students will need to set up a proportion based on the true probability outcomes. The problem states that the probability of spinning a “B” is 1/4. You will set up the equivalent ratios of 1/4 = x/52 to solve this problem.
How do you make a reasonable prediction of future events from theoretical data? You will use proportional reasoning to set up equivalent ratios.How is theoretical data different from experimental data? Theoretical data is based on true probability results and experimental data is based on actual surveyed results.How can theoretical data help make predictions? You can use true probability results to set up a proportion.How does the outcome you are looking for compare to the total outcomes? This outcome should be the same percentage as the probability result.
Theoretical ProbabilityProbability and Numerical Representations
Name:
I can solve problems that involve theoretical probability.
A
AB B
CDE
A
The probability of spinning a “B” is 14. If you spin the spinner 52 times, about how many times will it land on “B”?
A 52B 4C 12D 13
Sam
ple
Do Not
Dup
licat
e
© 2014 18 7th Grade Mathematics
GuidedPractice
GP Theoretical ProbabilityProbability and Numerical Representations
Name:TEKS 7.6D Supporting
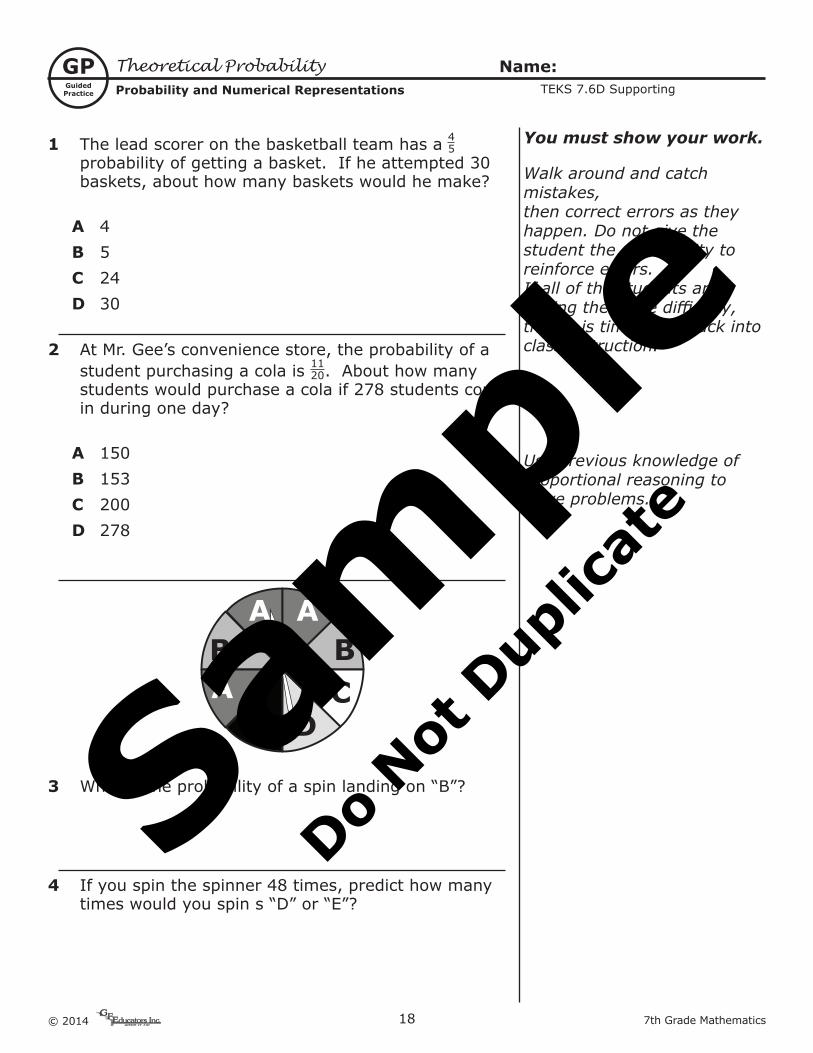
1 The lead scorer on the basketball team has a 45 probability of getting a basket. If he attempted 30 baskets, about how many baskets would he make?
A 4B 5C 24D 30
2 At Mr. Gee’s convenience store, the probability of a student purchasing a cola is 11
20. About how many students would purchase a cola if 278 students come in during one day?
A 150B 153C 200D 278
A
AB B
CDE
A
3 What is the probability of a spin landing on “B”?
4 If you spin the spinner 48 times, predict how many times would you spin s “D” or “E”?
You must show your work.
Walk around and catch mistakes,then correct errors as theyhappen. Do not give thestudent the opportunity toreinforce errors.If all of the students arehaving the same difficulty,then it is time to go back intoclass instruction.
Use previous knowledge of proportional reasoning to solve problems.
Sam
ple
Do Not
Dup
licat
e
197th Grade Mathematics © 2014
BackgroundInformation
BI
Student Expectations -
Category
TEKS
Ver
tica
l Alig
nm
ent
Vocabulary
Understanding the TEKS
Essential Question(s)
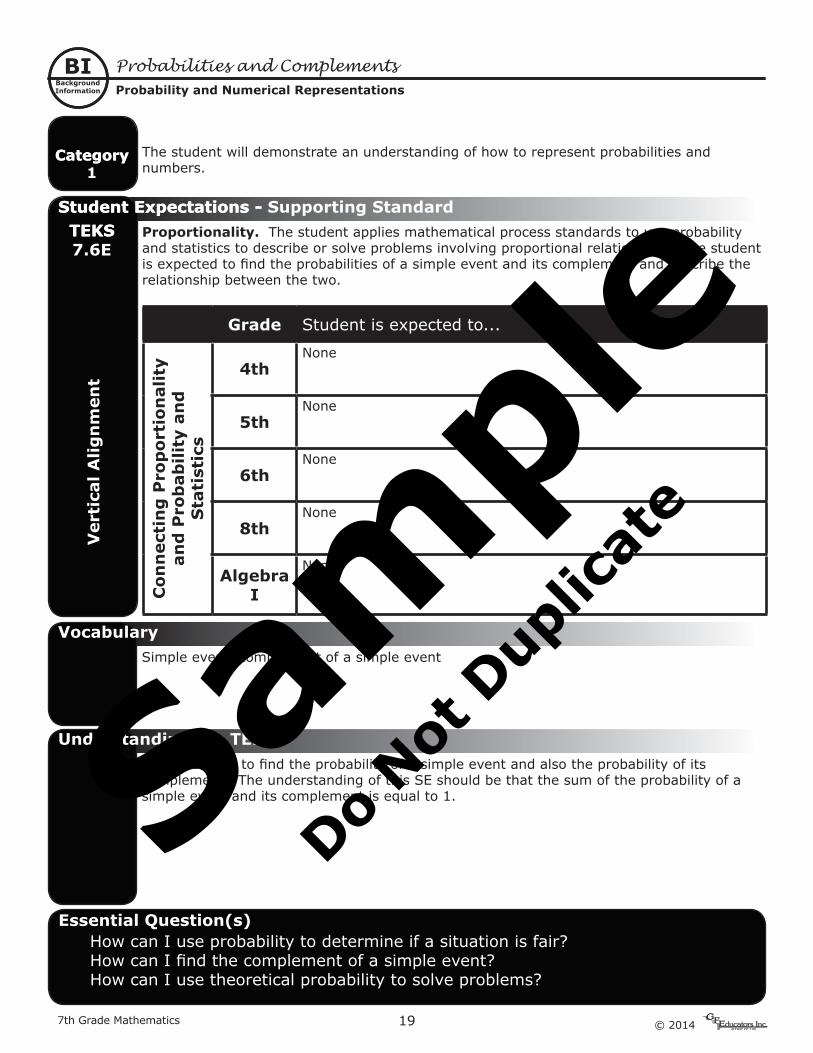
The student is to find the probability of a simple event and also the probability of its complement. The understanding of this SE should be that the sum of the probability of a simple event and its complement is equal to 1.
Simple event, complement of a simple event
How can I use probability to determine if a situation is fair?How can I find the complement of a simple event?How can I use theoretical probability to solve problems?
Grade Student is expected to...
Con
nec
tin
g P
rop
orti
onal
ity
and
Pro
bab
ility
an
d
Sta
tist
ics
4thNone
5thNone
6thNone
8thNone
Algebra I
None
Student Expectations - Supporting Standard
Category1
TEKS 7.6E
Probabilities and ComplementsProbability and Numerical Representations
The student will demonstrate an understanding of how to represent probabilities and numbers.
Proportionality. The student applies mathematical process standards to use probability and statistics to describe or solve problems involving proportional relationships. The student is expected to find the probabilities of a simple event and its complement and describe the relationship between the two.
Sam
ple
Do Not
Dup
licat
e
© 2014 20 7th Grade Mathematics
EngagingActivity
A
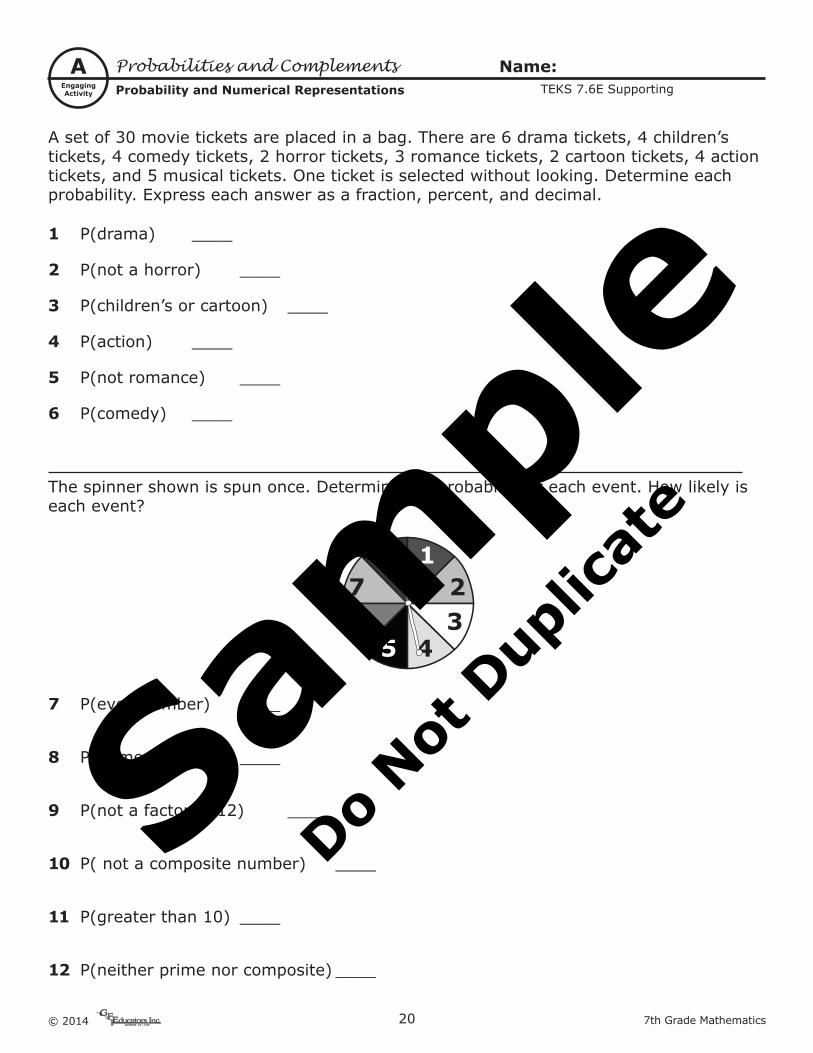
A set of 30 movie tickets are placed in a bag. There are 6 drama tickets, 4 children’s tickets, 4 comedy tickets, 2 horror tickets, 3 romance tickets, 2 cartoon tickets, 4 action tickets, and 5 musical tickets. One ticket is selected without looking. Determine each probability. Express each answer as a fraction, percent, and decimal.
1 P(drama) ____
2 P(not a horror) ____
3 P(children’s or cartoon) ____
4 P(action) ____
5 P(not romance) ____
6 P(comedy) ____
The spinner shown is spun once. Determine the probability of each event. How likely is each event?
8
67 2
345
1
7 P(even number) ____
8 P(prime number) ____
9 P(not a factor of 12) ____
10 P( not a composite number) ____
11 P(greater than 10) ____
12 P(neither prime nor composite) ____
Probabilities and ComplementsProbability and Numerical Representations
Name:TEKS 7.6E Supporting
Sam
ple
Do Not
Dup
licat
e
217th Grade Mathematics © 2014
TeachingModel
TM
Thinking Mathematically
Putting the Pieces Together
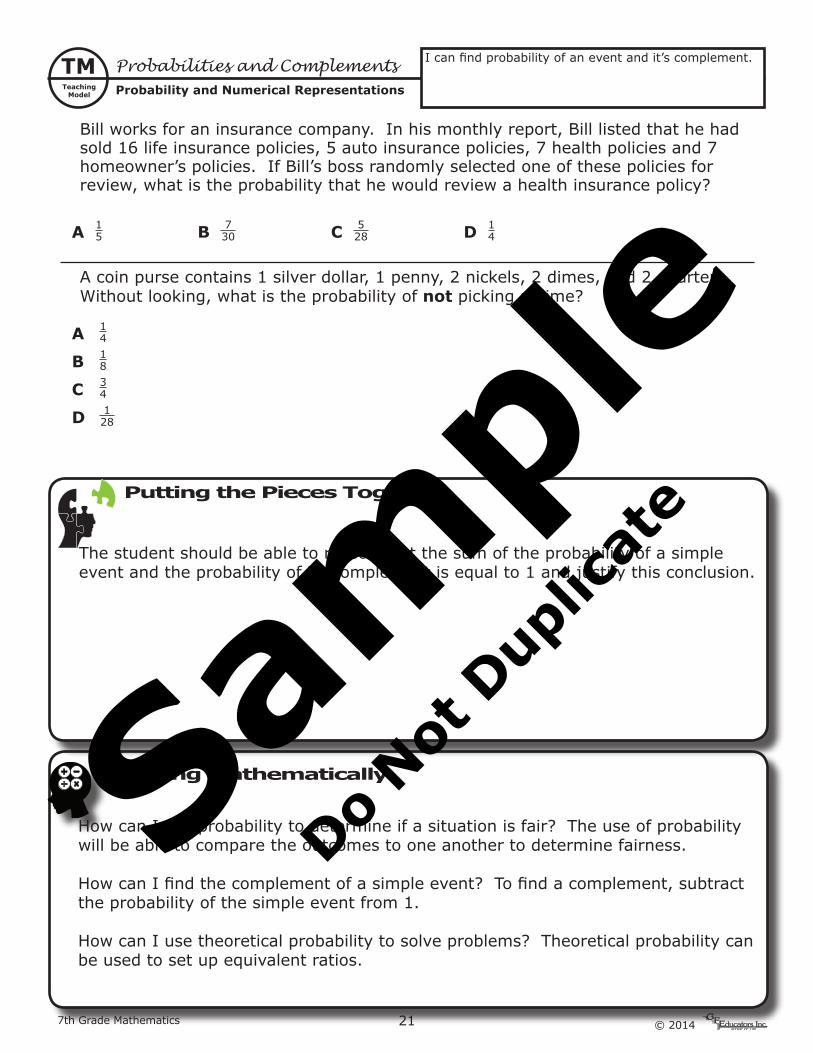
The student should be able to reason that the sum of the probability of a simple event and the probability of its complement is equal to 1 and justify this conclusion.
How can I use probability to determine if a situation is fair? The use of probability will be able to compare the outcomes to one another to determine fairness.
How can I find the complement of a simple event? To find a complement, subtract the probability of the simple event from 1.
How can I use theoretical probability to solve problems? Theoretical probability can be used to set up equivalent ratios.
Probabilities and ComplementsProbability and Numerical Representations
Name:
I can find probability of an event and it’s complement.
Bill works for an insurance company. In his monthly report, Bill listed that he had sold 16 life insurance policies, 5 auto insurance policies, 7 health policies and 7 homeowner’s policies. If Bill’s boss randomly selected one of these policies for review, what is the probability that he would review a health insurance policy?
A 15 B 730 C 5
28 D 14
A coin purse contains 1 silver dollar, 1 penny, 2 nickels, 2 dimes, and 2 quarters. Without looking, what is the probability of not picking a dime?
A 14
B 18
C 34
D 128
Sam
ple
Do Not
Dup
licat
e
© 2014 22 7th Grade Mathematics
GuidedPractice
GP Probabilities and ComplementsProbability and Numerical Representations
Name:TEKS 7.6E Supporting
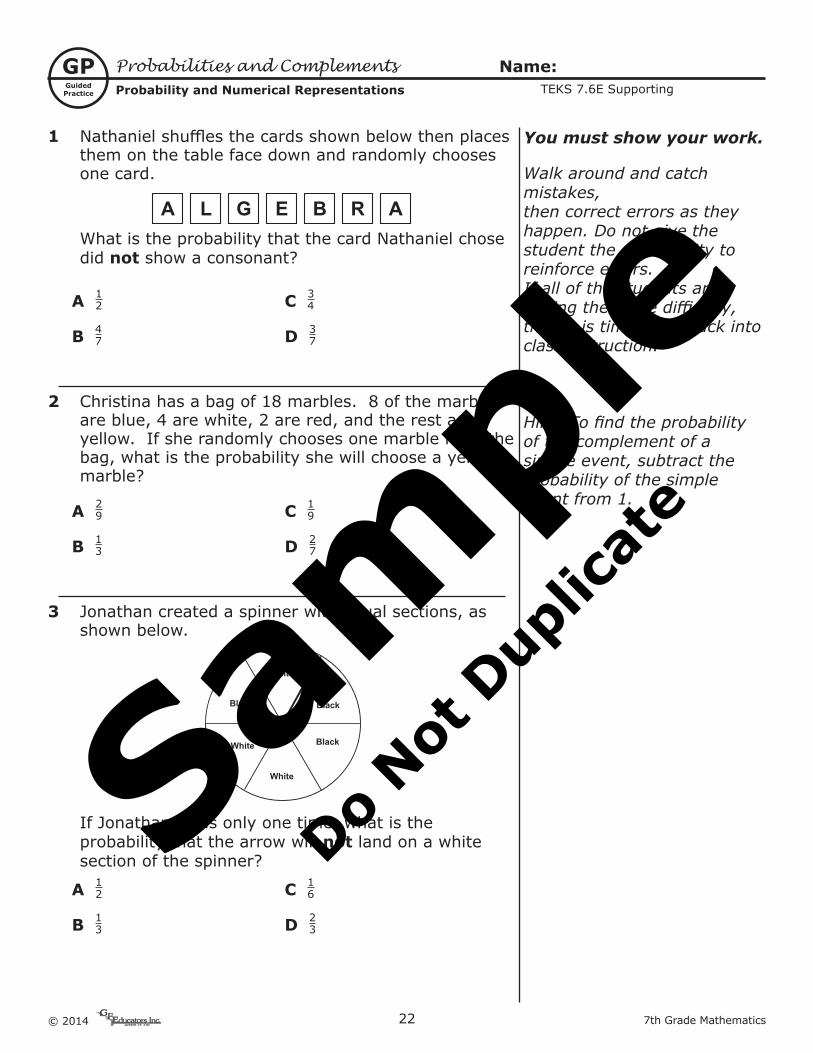
1 Nathaniel shuffles the cards shown below then places them on the table face down and randomly chooses one card.
A L G E B R AWhat is the probability that the card Nathaniel chose did not show a consonant?
A 12 C 34
B 47 D 37
2 Christina has a bag of 18 marbles. 8 of the marbles are blue, 4 are white, 2 are red, and the rest are yellow. If she randomly chooses one marble from the bag, what is the probability she will choose a yellow marble?
A 29 C 19
B 13 D 27
3 Jonathan created a spinner with equal sections, as shown below.
White
White
White
Black Black
Black
If Jonathan spins only one time, what is the probability that the arrow will not land on a white section of the spinner?
A 12 C 16
B 13 D 23
You must show your work.
Walk around and catch mistakes,then correct errors as theyhappen. Do not give thestudent the opportunity toreinforce errors.If all of the students arehaving the same difficulty,then it is time to go back intoclass instruction.
Hint: To find the probability of the complement of a simple event, subtract the probability of the simple event from 1.
Sam
ple
Do Not
Dup
licat
e

237th Grade Mathematics © 2014
BackgroundInformation
BIV
erti
cal A
lign
men
t
Vocabulary
Understanding the TEKS
Essential Question(s)
This SE includes qualitative comparisons such as “more likely” or “less likely” in addition to quantitative comparisons such as “twice as likely to roll a 6 on a 6-sided random number generator as to roll a 6 on a 12-sided random number generator.” It also includes qualitativepredictions such as “more likely,” “less likely,” or “equally likely” in addition to quantitativepredictions such as the experimental results of rolling a 6 if rolling 10 times or 100 times.
qualitative predictions, quantitative predictions
Why is experimental probability more reliable with a greater number of trials? What is the difference between qualitative and quantitative data? How can I use qualitative data to make prediction? How can I use quantitative data to make prediction?
Grade Student is expected to...
Con
nec
tin
g P
rop
orti
onal
ity
and
Pro
bab
ility
an
d
Sta
tist
ics
4thNone
5thNone
6thNone
8thNone
Algebra I
None
Student Expectations - Readiness StandardTEKS 7.6H
Category 1
Qualitative and Quantitative Predictions
Probability and Numerical Representations
The student will demonstrate an understanding of how to represent probabilities and numbers.
Proportionality. The student applies mathematical process standards to use probability and statistics to describe or solve problems involving proportional relationships. The student is expected to solve problems using qualitative and quantitative predictions and comparisons from simple experiments.
Sam
ple
Do Not
Dup
licat
e
© 2014 24 7th Grade Mathematics
EngagingActivity
A
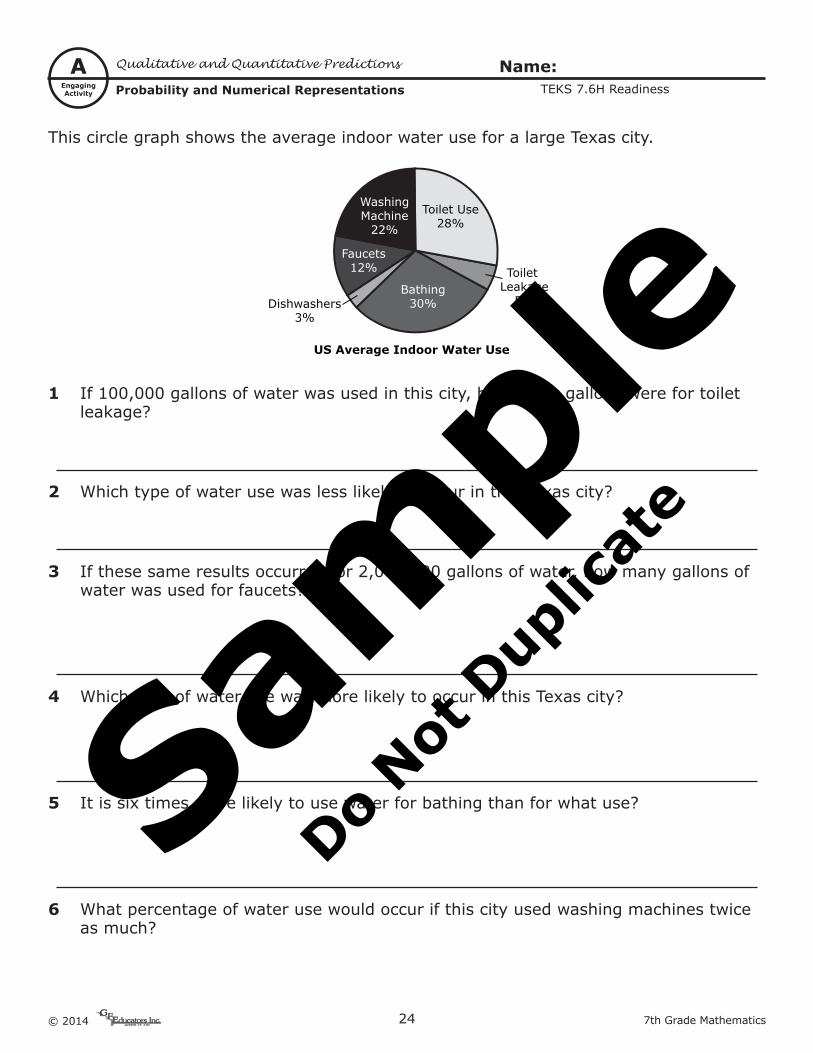
This circle graph shows the average indoor water use for a large Texas city.
WashingMachine
22%
Faucets12%
Bathing30%
Toilet Use28%
Dishwashers3%
US Average Indoor Water Use
Toilet Leakage
5%
1 If 100,000 gallons of water was used in this city, how many gallons were for toilet leakage?
2 Which type of water use was less likely to occur in this Texas city?
3 If these same results occurred for 2,000,000 gallons of water, how many gallons of water was used for faucets?
4 Which type of water use was more likely to occur in this Texas city?
5 It is six times more likely to use water for bathing than for what use?
6 What percentage of water use would occur if this city used washing machines twice as much?
Qualitative and Quantitative Predictions
Probability and Numerical Representations
Name:TEKS 7.6H Readiness
Sam
ple
Do Not
Dup
licat
e
257th Grade Mathematics © 2014
TeachingModel
TM I can ...
Thinking Mathematically
Putting the Pieces Together
Students will need to be able to use numerical(qualitative) and verbal (quantitative) data to compare probabilities. Phrases like “more likely” or “less likely” or “impossible” will be used. Predictions of a “number of times” more likely or less likely can be added to the analysis of the probability.
Why is experimental probability more reliable with a greater number of trials? The more trials that occur, the more likely you are to reach the true theoretical probability.What is the difference between qualitative and quantitative data? Qualitative data is numerical and quantitative data is verbal.How can I use qualitative data to make prediction? I use a ratio to make comparisons with the true theoretical probability.How can I use quantitative data to make prediction? I use a verbal description to compare a prediction to the true theoretical probability.
Qualitative and Quantitative Predictions
Probability and Numerical Representations
Name:
I can solve problems with qualitative and quantitative data.
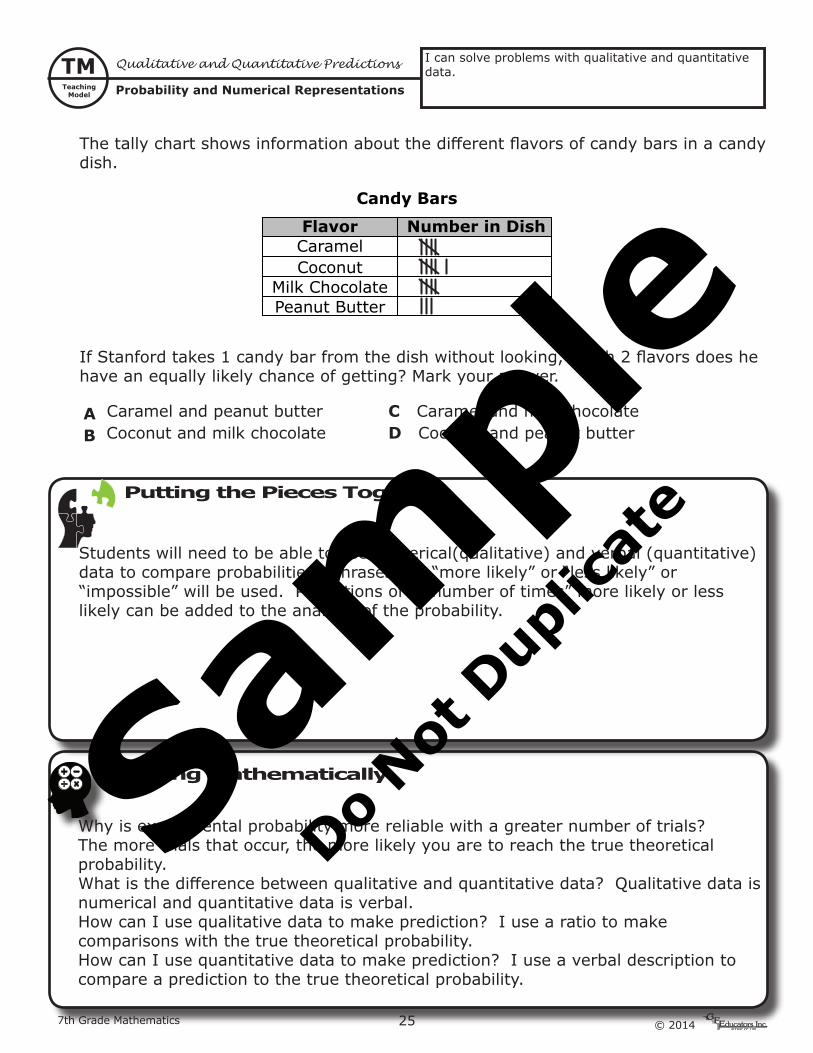
The tally chart shows information about the different flavors of candy bars in a candy dish.
Flavor
Candy Bars
CaramelCoconut
Milk ChocolatePeanut Butter
Number in Dish
If Stanford takes 1 candy bar from the dish without looking, which 2 flavors does he have an equally likely chance of getting? Mark your answer.
A Caramel and peanut butter C Caramel and milk chocolateB Coconut and milk chocolate D Coconut and peanut butter
Sam
ple
Do Not
Dup
licat
e
© 2014 26 7th Grade Mathematics
GuidedPractice
GP Qualitative and Quantitative Predictions
Probability and Numerical Representations
Name:TEKS 7.6H Readiness
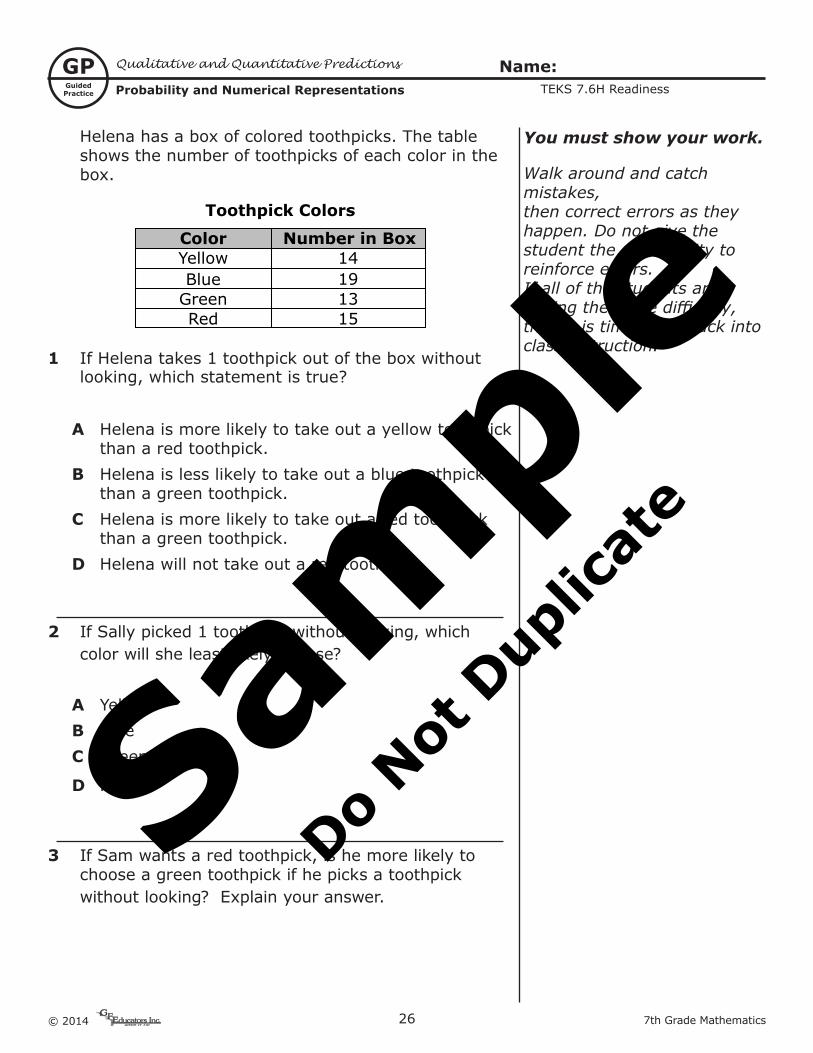
Helena has a box of colored toothpicks. The table shows the number of toothpicks of each color in the box.
Color
Toothpick Colors
Yellow 14191315
BlueGreenRed
Number in Box
1 If Helena takes 1 toothpick out of the box without looking, which statement is true?
A Helena is more likely to take out a yellow toothpick than a red toothpick.
B Helena is less likely to take out a blue toothpick than a green toothpick.
C Helena is more likely to take out a red toothpick than a green toothpick.
D Helena will not take out a red toothpick.
2 If Sally picked 1 toothpick without looking, which color will she least likely choose?
A YellowB BlueC Green
D Red
3 If Sam wants a red toothpick, is he more likely to choose a green toothpick if he picks a toothpick without looking? Explain your answer.
You must show your work.
Walk around and catch mistakes,then correct errors as theyhappen. Do not give thestudent the opportunity toreinforce errors.If all of the students arehaving the same difficulty,then it is time to go back intoclass instruction.
Sam
ple
Do Not
Dup
licat
e

277th Grade Mathematics © 2014
BackgroundInformation
BI
Student Expectations -
Category
TEKS
Ver
tica
l Alig
nm
ent
Vocabulary
Understanding the TEKS
Essential Question(s)
This SE gives a hint as to strategy used to determine the probabilities.Data should be used for experimental probabilities and sample spaces should be used for theoretical probabilities.
independent events, dependent events, experimental probability, theoretical probability
How does data help to determine probability? What is the difference between theoretical and experimental probability? When is it appropriate to use theoretical probability to make predictions? When is it appropriate to use experimental probability to make predictions?
Grade Student is expected to...
Con
nec
tin
g P
rop
orti
onal
ity
and
Pro
bab
ility
an
d
Sta
tist
ics
4thNone
5thNone
6thNone
8thNone
Algebra I
None
Student Expectations - Readiness StandardTEKS 7.6I
Category1
Experimental and Theoretical Probability
Probability and Numerical Representations
The student will demonstrate an understanding of how to represent probabilities and numbers.
Proportionality. The student applies mathematical process standards to use probability and statistics to describe or solve problems involving proportional relationships. The student is expected to determine experimental and theoretical probabilities related to simple and compound events using data and sample spaces.
Sam
ple
Do Not
Dup
licat
e
© 2014 28 7th Grade Mathematics
EngagingActivity
A Experimental and Theoretical Probability
Probability and Numerical Representations
Name:TEKS 7.6I Readiness
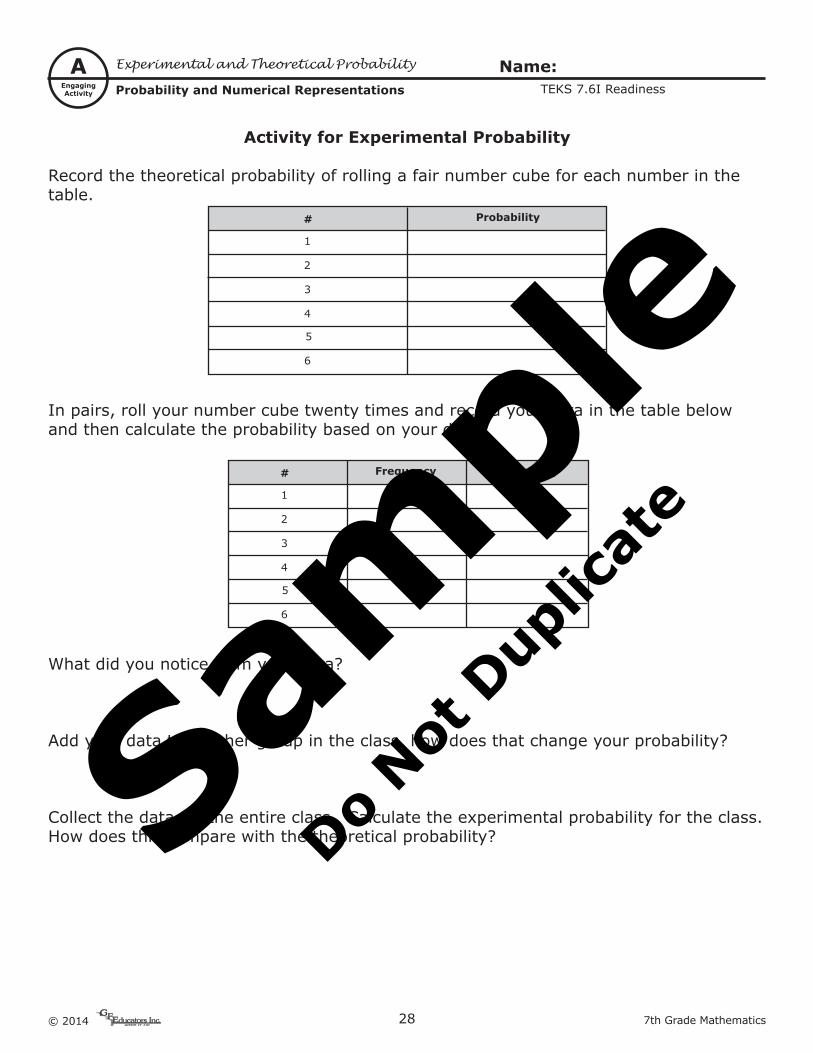
Activity for Experimental Probability
Record the theoretical probability of rolling a fair number cube for each number in the table.
#
1
Probability
2
3
4
5
6
In pairs, roll your number cube twenty times and record your data in the table below and then calculate the probability based on your data.
#
1
Frequency Probability
2
3
4
5
6
What did you notice from your data?
Add your data to another group in the class, how does that change your probability?
Collect the data for the entire class. Calculate the experimental probability for the class. How does this compare with the theoretical probability?Sa
mpl
e
Do Not
Dup
licat
e
297th Grade Mathematics © 2014
TeachingModel
TM
Thinking Mathematically
Putting the Pieces Together
Make sure the students understand the difference between theoretical probability and experimental probability. Simple events occur as a independent probability. Compound events are dependent on other events.
How does data help to determine probability? Data gives you a reference point to compare to the theoretical probability.What is the difference between theoretical and experimental probability? Theoretical probability is how likely an event should happen and experimental probability is the actual outcome of an event.When is it appropriate to use theoretical probability to make predictions? You use theoretical probability when given a sample space.When is it appropriate to use experimental probability to make predictions? You use experimental probability when given data.
Experimental and Theoretical Probability
Probability and Numerical Representations
Name:
I can use data to solve problems.
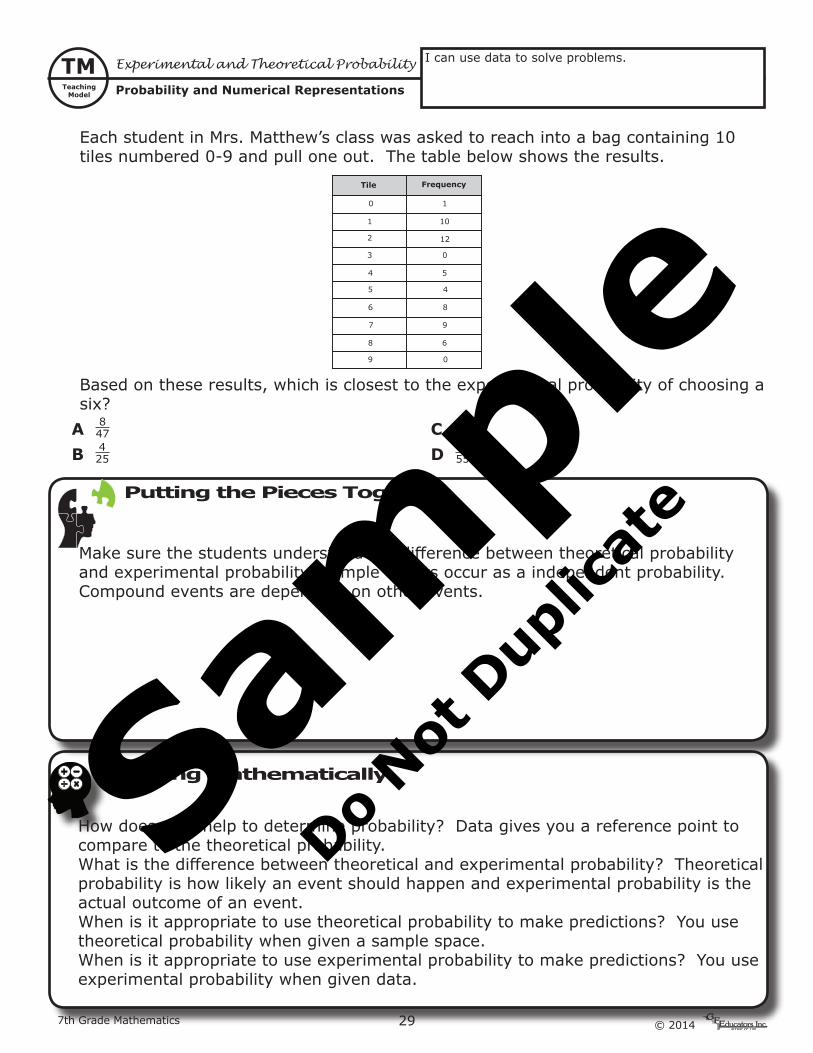
Each student in Mrs. Matthew’s class was asked to reach into a bag containing 10 tiles numbered 0-9 and pull one out. The table below shows the results.
Tile Frequency
0 1
10
12
1
3 0
54
5 4
7 9
68
9 0
86
2
Based on these results, which is closest to the experimental probability of choosing a six?
A 847 C 6
55
B 425 D 8
55
Sam
ple
Do Not
Dup
licat
e
© 2014 30 7th Grade Mathematics
GuidedPractice
GP Experimental and Theoretical Probability
Probability and Numerical Representations
Name:TEKS 7.6I Readiness
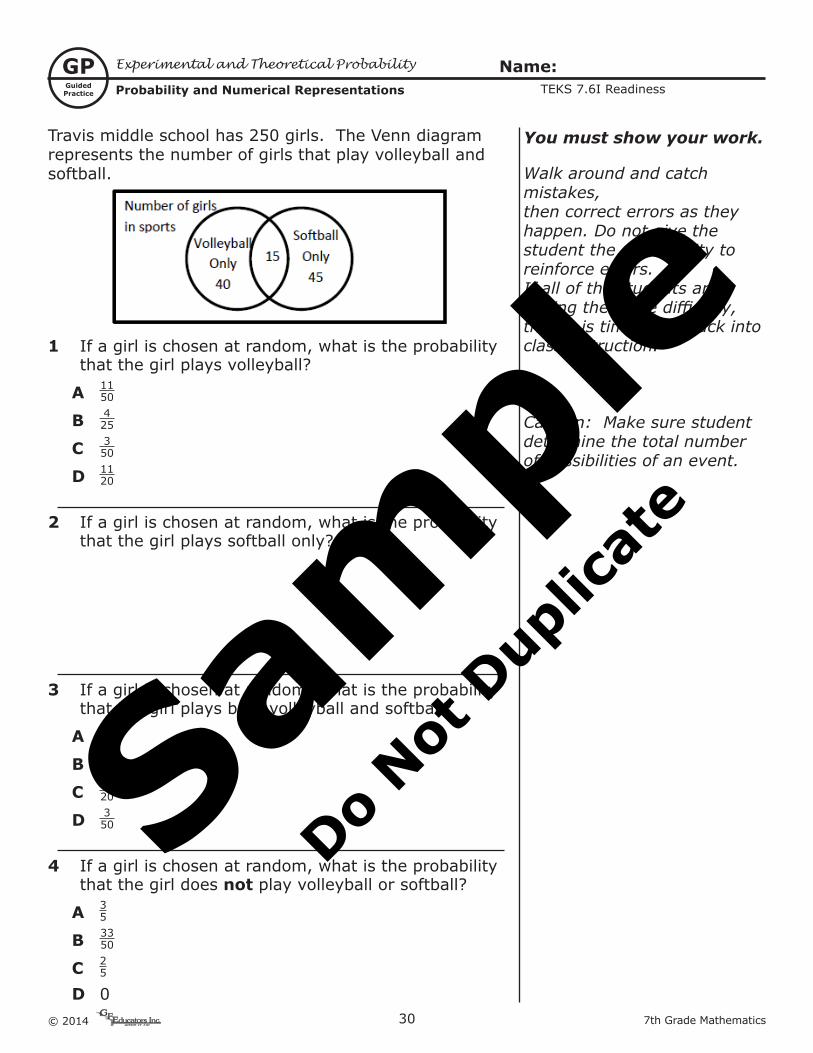
Travis middle school has 250 girls. The Venn diagram represents the number of girls that play volleyball and softball.
1 If a girl is chosen at random, what is the probability that the girl plays volleyball?
A 1150
B 425
C 350
D 1120
2 If a girl is chosen at random, what is the probability that the girl plays softball only?
3 If a girl is chosen at random, what is the probability that the girl plays both volleyball and softball?
A 25
B 317
C 320
D 350
4 If a girl is chosen at random, what is the probability that the girl does not play volleyball or softball?
A 35
B 3350
C 25
D 0
You must show your work.
Walk around and catch mistakes,then correct errors as theyhappen. Do not give thestudent the opportunity toreinforce errors.If all of the students arehaving the same difficulty,then it is time to go back intoclass instruction.
Caution: Make sure student determine the total number of possibilities of an event.
Sam
ple
Do Not
Dup
licat
e
317th Grade Mathematics © 2014
Name:
Answer Key
AK
Category 1 Answer Key
Probability and Numerical Representations
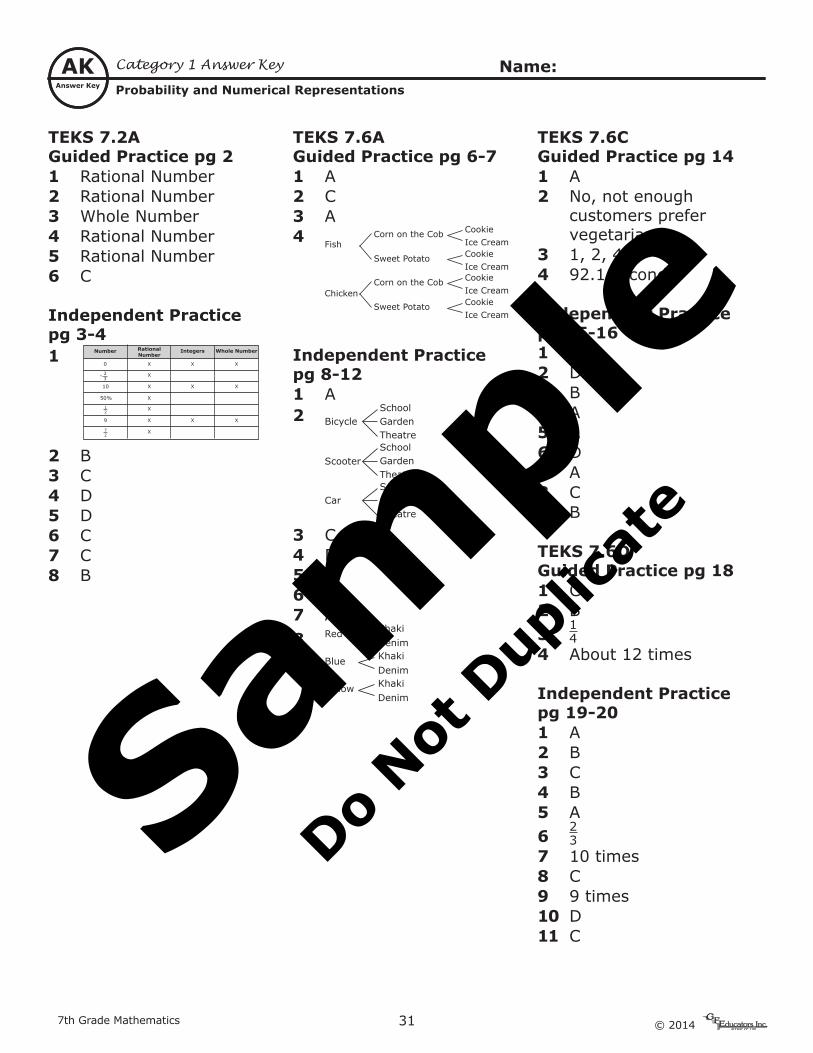
TEKS 7.2AGuided Practice pg 21 Rational Number 2 Rational Number3 Whole Number4 Rational Number5 Rational Number6 C
Independent Practice pg 3-41
Integers Whole NumberNumber Rational Number
0
9
10
50%
23-
12
72
X
X
X
XX
XX
XX
X
X
X
X
2 B3 C4 D5 D6 C7 C8 B
TEKS 7.6AGuided Practice pg 6-71 A2 C3 A4
Fish
Chicken
Corn on the Cob CookieIce Cream
Sweet Potato CookieIce Cream
Corn on the Cob CookieIce Cream
Sweet Potato CookieIce Cream
Independent Practice pg 8-121 A2
Bicycle
Scooter
Car
SchoolGardenTheatreSchoolGardenTheatreSchoolGardenTheatre
3 C4 D5 D6 B7 A8
Yellow Khaki
Denim
Blue KhakiDenim
Red KhakiDenim
TEKS 7.6CGuided Practice pg 141 A2 No, not enough
customers prefer vegetarian
3 1, 2, 4, 54 92.1 seconds
Independent Practice pg 15-161 B2 D3 B4 A5 A6 D7 A8 C9 B
TEKS 7.6DGuided Practice pg 181 C2 B3
14
4 About 12 times
Independent Practice pg 19-201 A2 B3 C4 B5 A6
23
7 10 times8 C9 9 times10 D11 C
Sam
ple
Do Not
Dup
licat
e
© 2014 32 7th Grade Mathematics
Name:
Answer Key
AK
Category 1 Answer Key
Probability and Numerical Representations
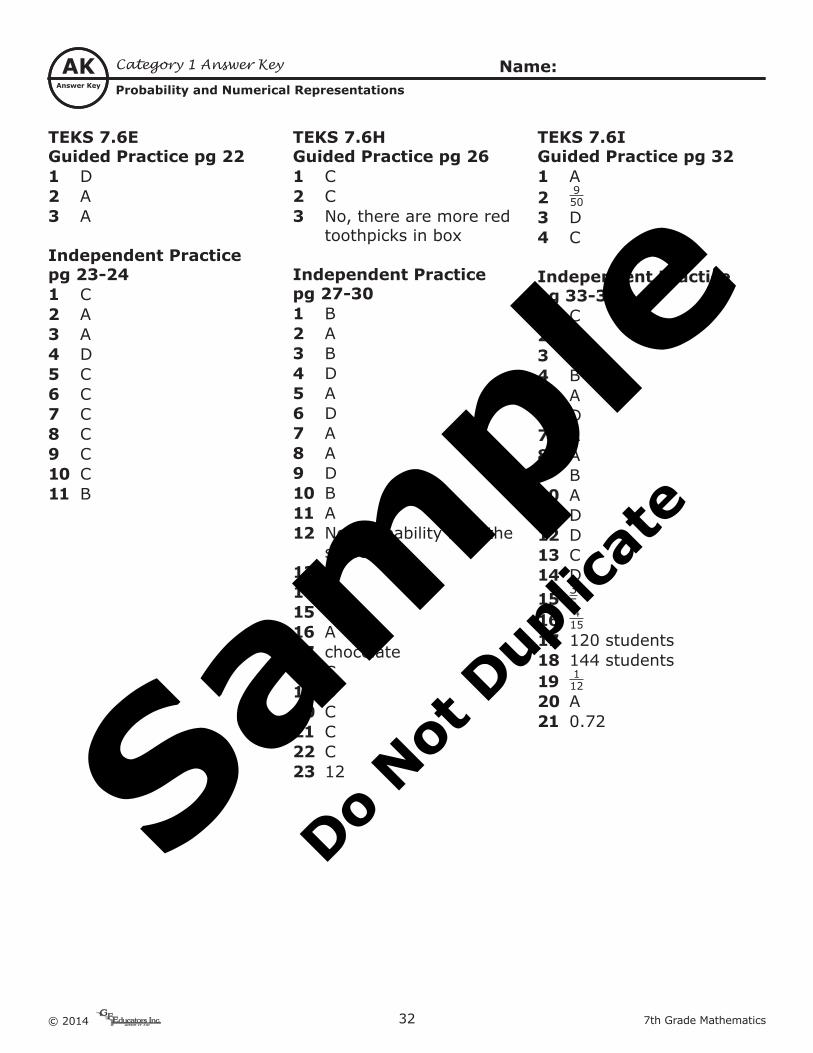
TEKS 7.6EGuided Practice pg 221 D2 A3 A
Independent Practice pg 23-241 C2 A3 A4 D5 C6 C7 C8 C9 C10 C11 B
TEKS 7.6HGuided Practice pg 261 C2 C3 No, there are more red
toothpicks in box
Independent Practice pg 27-301 B2 A3 B4 D5 A6 D7 A8 A9 D10 B11 A12 No, probability isn’t the
same13 D14 C15 B16 A17 chocolate18 C19 D20 C21 C22 C23 12
TEKS 7.6IGuided Practice pg 321 A2 9
503 D4 C
Independent Practice pg 33-361 C2 A3 B4 B5 A6 D7 A8 A9 B10 A11 D12 D13 C14 D15
35
16 415
17 120 students18 144 students19 1
1220 A21 0.72
Sam
ple
Do Not
Dup
licat
e

337th Grade Mathematics © 2014
BackgroundInformation
BIV
erti
cal A
lign
men
t
Vocabulary
Understanding the TEKS
Essential Question(s)
rational numbers
What does fluency mean? What strategies do you use to add numbers fluently? What strategies do you use to subtract numbers fluently? What strategies do you use to multiply numbers fluently? What strategies do you use to divide numbers fluently?
Vertical Alignment Categories: Adding and Subtracting Whole Numbers, Decimals, and Rational Numbers, Adding and Subtracting Fractions and Rational Numbers, Multiplying Whole Numbers, Decimals, Fractions, and Rational Numbers, Dividing Whole Numbers, Decimals, Fractions, and Rational Numbers, Applying Operations with Integers and Rational Numbers
Grade Student is expected to...
*Fi
ts in
mu
ltip
le c
ateg
orie
s.
See
bel
ow.
4th4.4A, 4.3K, 4.4B, 4.4C, 4.4K
5th5.3A, 5.3K, 5.3B, 5.3C, 5.3J
6th6.3C, 6.3D, 6.3E
8thNone
Algebra I
None
Student Expectations - Supporting StandardTEKS 7.3A
Category2
The student will demonstrate an understanding of how to perform operations and represent algebraic relationships.
Operations with Rational NumbersComputations and Algebraic Relationships
Number and operations. The student applies mathematical process standards to add, subtract, multiply, and divide while solving problems and justifying solutions. The student is expected to add, subtract, multiply, and divide rational numbers fluently.
Sam
ple
Do Not
Dup
licat
e
© 2014 34 7th Grade Mathematics
EngagingActivity
A
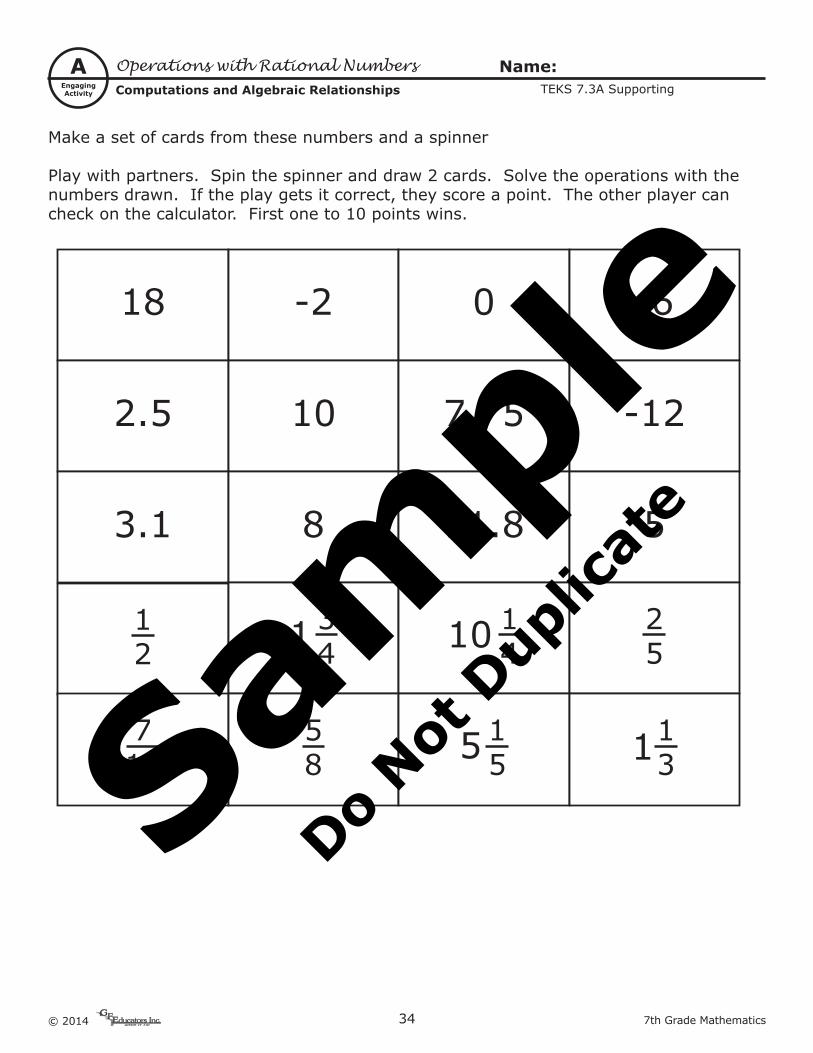
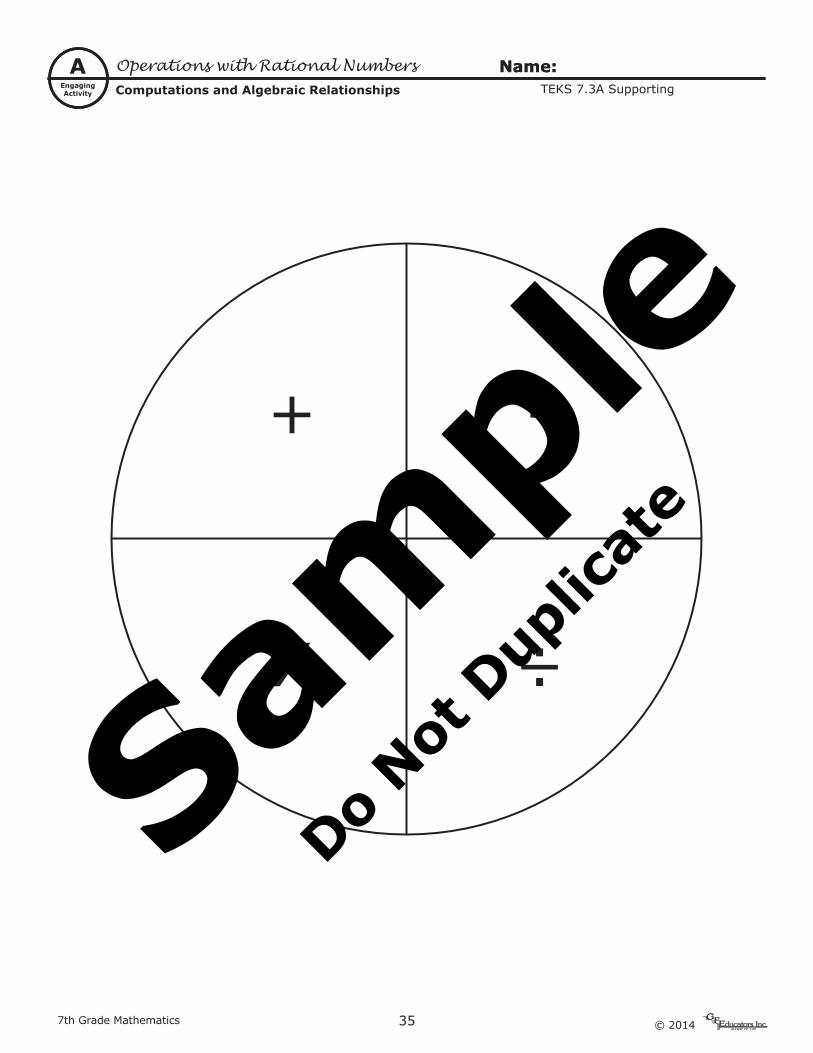
Make a set of cards from these numbers and a spinner
Play with partners. Spin the spinner and draw 2 cards. Solve the operations with thenumbers drawn. If the play gets it correct, they score a point. The other player can check on the calculator. First one to 10 points wins.
18 -2 0 -6
2.5 10 7.75 -12
3.1 8 11.8 5
12
58 11
35 15
710
2513
4 10 14
Operations with Rational NumbersComputations and Algebraic Relationships
Name:TEKS 7.3A Supporting
Sam
ple
Do Not
Dup
licat
e
357th Grade Mathematics © 2014
Name:
EngagingActivity
A Operations with Rational NumbersComputations and Algebraic Relationships
Name:TEKS 7.3A Supporting
+ -
X ÷
Sam
ple
Do Not
Dup
licat
e

© 2014 36 7th Grade Mathematics
Name:
TeachingModel
TM
Thinking Mathematically
Putting the Pieces Together
Students will need to be able to perform all 4 operations using integers, fractions, decimals and all other rational numbers. The understanding is that these operations will be using mathematical problems.
What does fluency mean? Fluency means working operations with speed and accuracy.What strategies do you use to add numbers fluently? Adding numbers fluently includes knowing your basic addition facts.What strategies do you use to subtract numbers fluently? Subtracting numbers fluently includes knowing your fact families.What strategies do you use to multiply numbers fluently? Multiplying numbers fluently including know your multiplication facts.
Operations with Rational NumbersComputations and Algebraic Relationships
Name:
I can solve problems with all four operations.
1 3.94 + 12.7
2 45 ÷ 3 34
3 -5 x 12.3
4 3 34 - 1 18
Sam
ple
Do Not
Dup
licat
e
377th Grade Mathematics © 2014
Name:
GuidedPractice
GP Operations with Rational NumbersComputations and Algebraic Relationships
Name:TEKS 7.3A Supporting
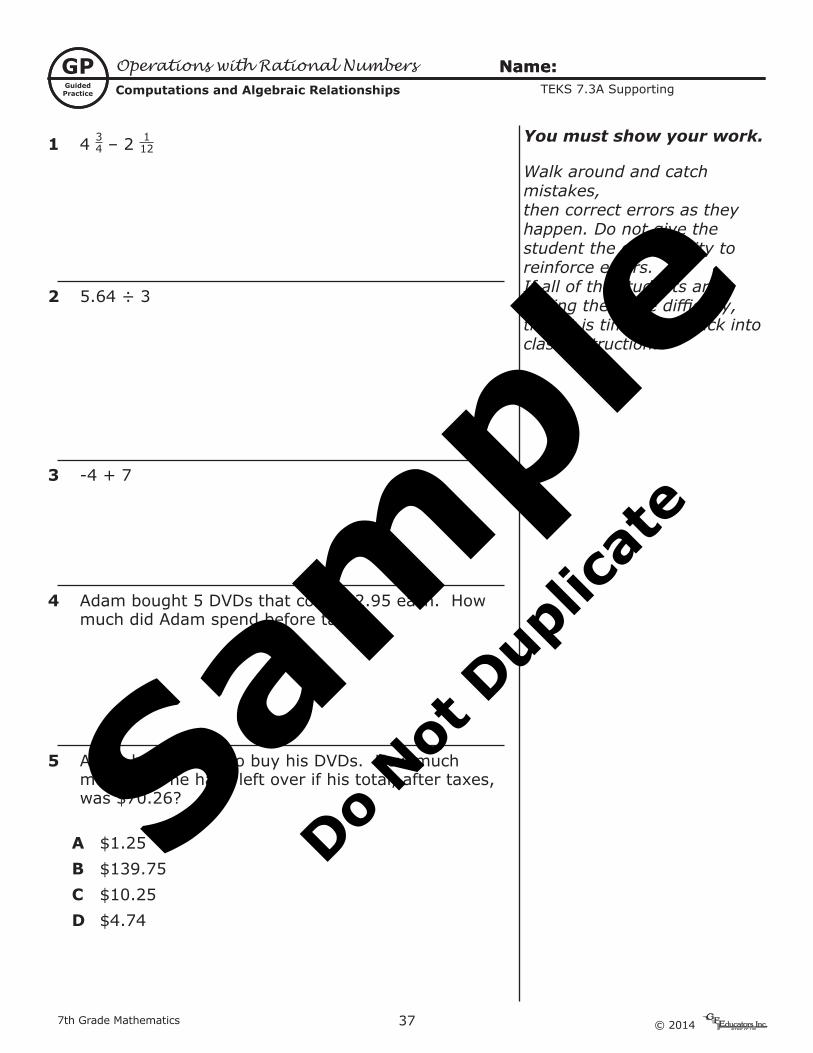
1 4 34 – 2 112
2 5.64 ÷ 3
3 -4 + 7
4 Adam bought 5 DVDs that cost $12.95 each. How much did Adam spend before taxes?
5 Adam had $75.00 to buy his DVDs. How much money did he have left over if his total, after taxes, was $70.26?
A $1.25B $139.75C $10.25D $4.74
You must show your work.
Walk around and catch mistakes,then correct errors as theyhappen. Do not give thestudent the opportunity toreinforce errors.If all of the students arehaving the same difficulty,then it is time to go back intoclass instruction.
Sam
ple
Do Not
Dup
licat
e
© 2014 38 7th Grade Mathematics
BackgroundInformation
BIV
erti
cal A
lign
men
t
Vocabulary
Understanding the TEKS
Essential Question(s)
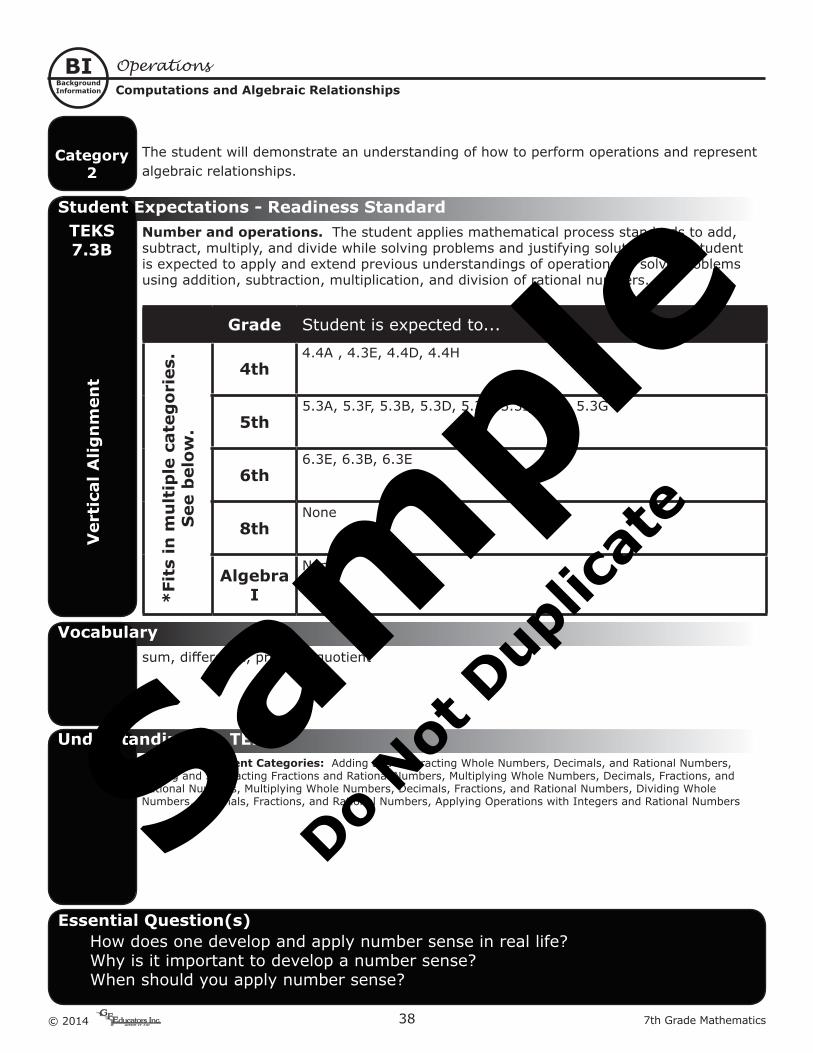
sum, difference, product, quotient
How does one develop and apply number sense in real life?Why is it important to develop a number sense?When should you apply number sense?
Vertical Alignment Categories: Adding and Subtracting Whole Numbers, Decimals, and Rational Numbers, Adding and Subtracting Fractions and Rational Numbers, Multiplying Whole Numbers, Decimals, Fractions, and Rational Numbers, Multiplying Whole Numbers, Decimals, Fractions, and Rational Numbers, Dividing Whole Numbers, Decimals, Fractions, and Rational Numbers, Applying Operations with Integers and Rational Numbers
Grade Student is expected to...
*Fi
ts in
mu
ltip
le c
ateg
orie
s.
See
bel
ow.
4th4.4A , 4.3E, 4.4D, 4.4H
5th5.3A, 5.3F, 5.3B, 5.3D, 5.3E, 5.3I, 5.3L, 5.3G
6th6.3E, 6.3B, 6.3E
8thNone
Algebra I
None
Student Expectations - Readiness StandardTEKS 7.3B
Category2
OperationsComputations and Algebraic Relationships
The student will demonstrate an understanding of how to perform operations and represent algebraic relationships.
Number and operations. The student applies mathematical process standards to add, subtract, multiply, and divide while solving problems and justifying solutions. The student is expected to apply and extend previous understandings of operations to solve problems using addition, subtraction, multiplication, and division of rational numbers.
Sam
ple
Do Not
Dup
licat
e
397th Grade Mathematics © 2014
Name:
EngagingActivity
A OperationsComputations and Algebraic Relationships
Name:TEKS 7.3B Readiness
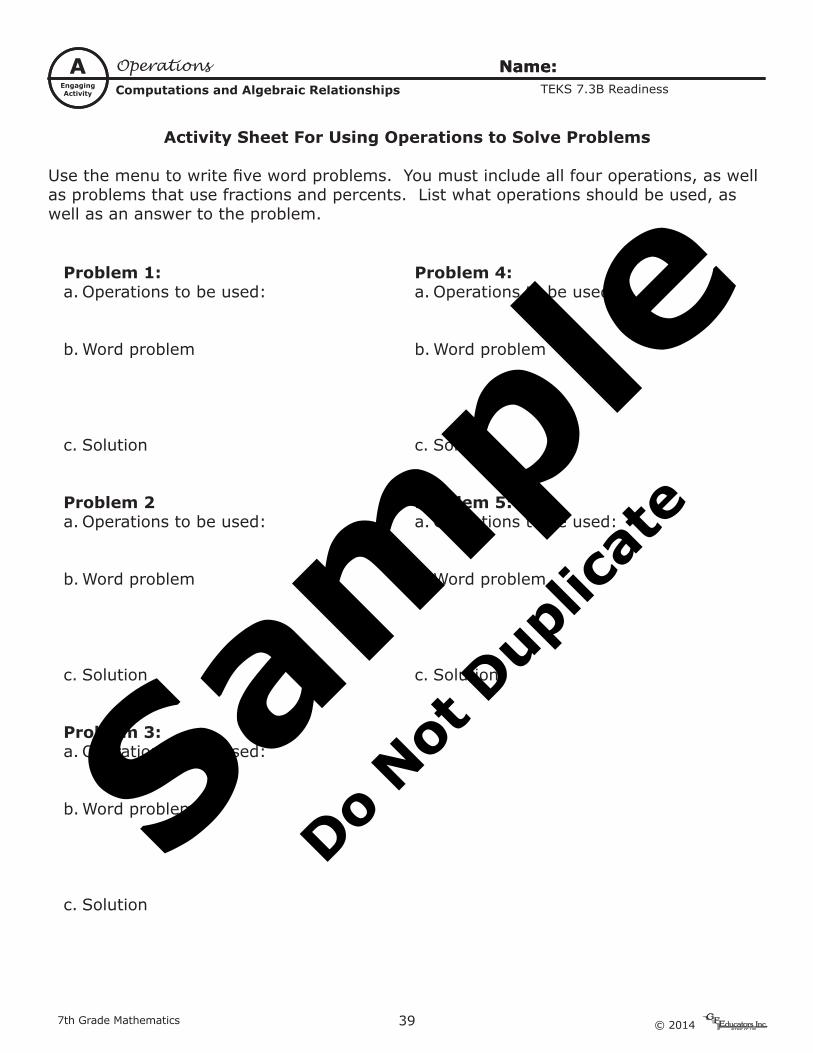
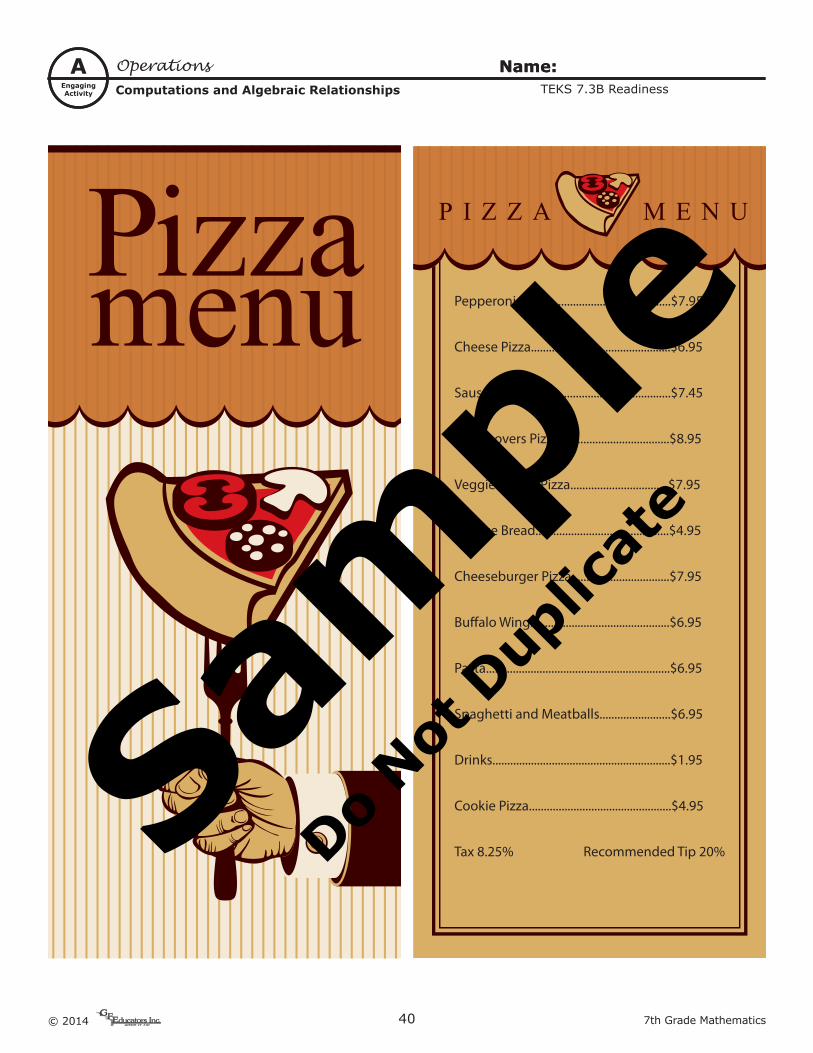
Activity Sheet For Using Operations to Solve Problems
Use the menu to write five word problems. You must include all four operations, as well as problems that use fractions and percents. List what operations should be used, as well as an answer to the problem.
Problem 1:a. Operations to be used:
b. Word problem
c. Solution
Problem 2a. Operations to be used:
b. Word problem
c. Solution
Problem 3:a. Operations to be used:
b. Word problem
c. Solution
Problem 4:a. Operations to be used:
b. Word problem
c. Solution
Problem 5:a. Operations to be used:
b. Word problem
c. Solution
Sam
ple
Do Not
Dup
licat
e
© 2014 40 7th Grade Mathematics
Name:
EngagingActivity
A OperationsComputations and Algebraic Relationships
Name:TEKS 7.3B Readiness
Pepperoni Pizza.........................................$7.95
Cheese Pizza...............................................$6.95
Sausage Pizza.............................................$7.45
Meat Lovers Pizza.....................................$8.95
Veggie Lovers Pizza.................................$7.95
Cheese Bread.............................................$4.95
Cheeseburger Pizza.................................$7.95
Bu�alo Wings.............................................$6.95
Pasta..............................................................$6.95
Spaghetti and Meatballs........................$6.95
Drinks............................................................$1.95
Cookie Pizza................................................$4.95
Tax 8.25% Recommended Tip 20%Sam
ple
Do Not
Dup
licat
e

417th Grade Mathematics © 2014
Name:
TeachingModel
TM I can ...
Thinking Mathematically
Putting the Pieces Together
From a given word problems, students will need to be able to determine which operation to perform, work the problem, and check the solution within the given problem. Making a list of all of the words that could possibly represent an operation is helpful for students.
How does one develop and apply number sense in real life?Understanding and using mathematical vocabulary helps to develop number sense.Why is it important to develop a number sense?Number sense helps to make problem solving logical.When should you apply number sense?When solving real world problems, number sense is needed.
OperationsComputations and Algebraic Relationships
Name:
I can solve rational number problems in real world situations
Jimmy played a trivia game. He answered seven questions and received the following scores: 200, –600, 800, 400, –300, –500 and 100. What was Jimmy’s score at the end of the seven questions?
A –2900B 100C 1200D 2900
Sam
ple
Do Not
Dup
licat
e
© 2014 42 7th Grade Mathematics
Name:
GuidedPractice
GP OperationsComputations and Algebraic Relationships
Name:TEKS 7.3B Readiness
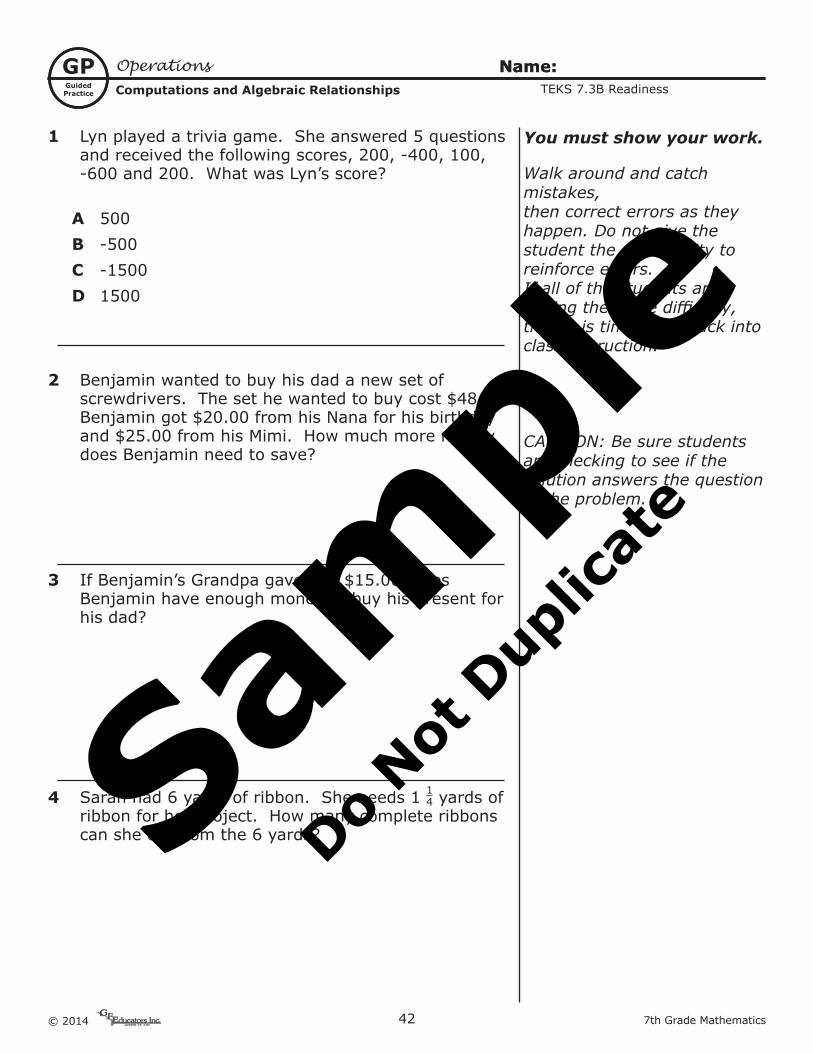
1 Lyn played a trivia game. She answered 5 questions and received the following scores, 200, -400, 100, -600 and 200. What was Lyn’s score?
A 500B -500C -1500D 1500
2 Benjamin wanted to buy his dad a new set of screwdrivers. The set he wanted to buy cost $48.50. Benjamin got $20.00 from his Nana for his birthday and $25.00 from his Mimi. How much more money does Benjamin need to save?
3 If Benjamin’s Grandpa gave him $15.00, does Benjamin have enough money to buy his present for his dad?
4 Sarah had 6 yards of ribbon. She needs 1 14 yards of ribbon for her project. How many complete ribbons can she cut from the 6 yards?
You must show your work.
Walk around and catch mistakes,then correct errors as theyhappen. Do not give thestudent the opportunity toreinforce errors.If all of the students arehaving the same difficulty,then it is time to go back intoclass instruction.
CAUTION: Be sure students are checking to see if the solution answers the question in the problem.
Sam
ple
Do Not
Dup
licat
e

437th Grade Mathematics © 2014
BackgroundInformation
BI
Student Expectations -
Category
TEKS
Ver
tica
l Alig
nm
ent
Vocabulary
Understanding the TEKS
Essential Question(s)
This SE focuses on using pictures, tables, verbal descriptions, equations, and graphs to represent constant rate of change. This should include both real-world problems and mathematical representations.
constant rate of change, domain, range, independent value, dependent value
How does comparing quantities describe the relationship between them? How does distance relate to time and speed? How is constant rate of change represented pictorially? How is constant rate of change represented in a table?
Grade Student is expected to...
Ap
ply
ing
Mu
ltip
le R
epre
sen
tati
ons
for
Fou
nd
atio
ns
of F
un
ctio
ns
and
D
evel
opin
g C
once
pts
Rel
ated
to
Pro
por
tion
alit
y
4th4.5B represent problems using an input-output table and numerical expressions to generate a number pattern that follows a given rule representing the relationship of the values in the resulting sequence and their position in the sequence.
5th 5.4C generate a numerical pattern when given a rule in the form y = ax or y = x + a and graph.
6th
6.4A compare two rules verbally, numerically, graphically, and symbolically in the form of y = ax or y = x + a in order to differentiate between additive and multiplicative relationships.6.4D give examples of rates as the comparison by division of two quantities having different attributes, including rates as quotients.6.5A represent mathematical and real-world problems involving ratios and rates using scale factors, tables, graphs, and proportions.
8th 8.5A represent linear proportional situations with tables, graphs, and equations in the form of y = kx.
Algebra I
A.2D write and solve equations involving direct variation.
Student Expectations - Readiness StandardTEKS 7.4A
Category2
Representing Rates of ChangeComputations and Algebraic Relationships
The student will demonstrate an understanding of how to perform operations and represent algebraic relationships.
Proportionality. The student applies mathematical process standards to represent and solve problems involving proportional relationships. The student is expected to represent constant rates of change in mathematical and real-world problems given pictorial, tabular, verbal, numeric, graphical, and algebraic representations, including d = rt.
Sam
ple
Do Not
Dup
licat
e
© 2014 44 7th Grade Mathematics
Name:
EngagingActivity
A
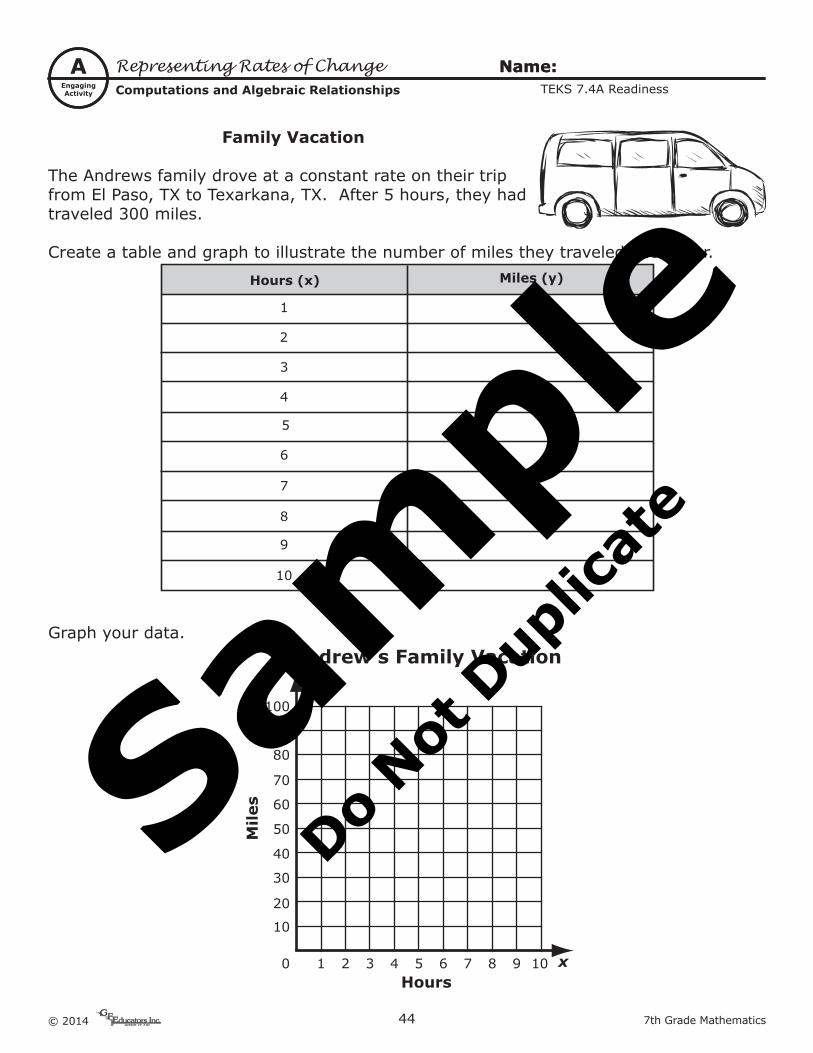
Family Vacation
The Andrews family drove at a constant rate on their trip from El Paso, TX to Texarkana, TX. After 5 hours, they had traveled 300 miles.
Create a table and graph to illustrate the number of miles they traveled each hour.
Hours (x)
1
Miles (y)
2
3
4
5
6
7
8
9
10
Graph your data.
20
10
1 2 3 4 5 6 7 8 9 100
40
30
60
50
80
70
100
90
Mile
s
Hours
Andrew’s Family Vacationy
x
Representing Rates of ChangeComputations and Algebraic Relationships
Name:TEKS 7.4A Readiness
Sam
ple
Do Not
Dup
licat
e
457th Grade Mathematics © 2014
Name:
TeachingModel
TM
Thinking Mathematically
Putting the Pieces Together
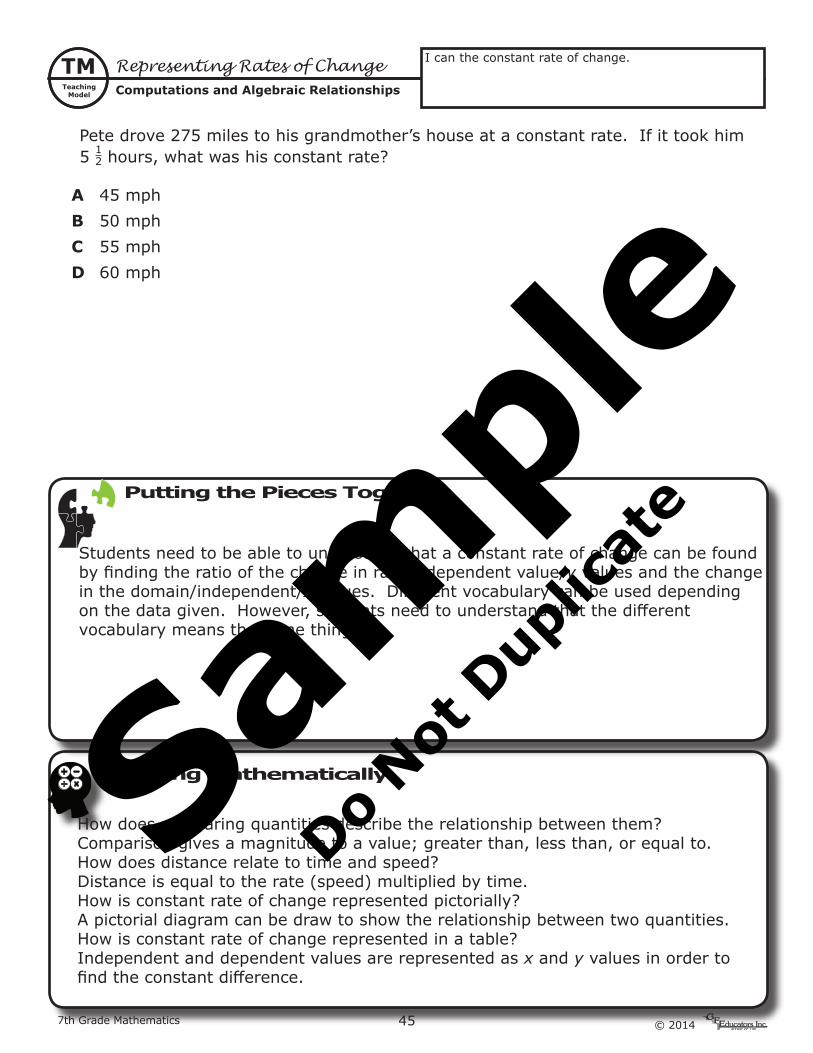
Students need to be able to understand that a constant rate of change can be found by finding the ratio of the change in range/dependent value/y values and the change in the domain/independent/x values. Different vocabulary can be used depending on the data given. However, students need to understand that the different vocabulary means the same thing.
How does comparing quantities describe the relationship between them?Comparison gives a magnitude to a value; greater than, less than, or equal to.How does distance relate to time and speed?Distance is equal to the rate (speed) multiplied by time.How is constant rate of change represented pictorially?A pictorial diagram can be draw to show the relationship between two quantities.How is constant rate of change represented in a table?Independent and dependent values are represented as x and y values in order to find the constant difference.
Representing Rates of ChangeComputations and Algebraic Relationships
Name:
I can the constant rate of change.
Pete drove 275 miles to his grandmother’s house at a constant rate. If it took him 5 12 hours, what was his constant rate?
A 45 mphB 50 mphC 55 mphD 60 mph
Sam
ple
Do Not
Dup
licat
e

© 2014 46 7th Grade Mathematics
Name:
GuidedPractice
GP Representing Rates of ChangeComputations and Algebraic Relationships
Name:TEKS 7.4A Readiness
1 Use the data in the table below. Does this data represent a constant rate of change?
x y
1 5
2 10
3 15
5 25
6 30
X
Y
21
3456789
10
1 2 3 4 5 6 7 8 9 10
2 According to this graph, what is the constant rate of change?
A -54 C 5
4
B -45 D 4
5
3 What is the constant rate of change in the function y = 3x?
4 Use the data in the table, what is the constant rate of change?
x y
-4 16
-2 8
0 0
2 -8
4 -16
A 14 C -1
4
B 4 D -4
You must show your work.
Walk around and catch mistakes,then correct errors as theyhappen. Do not give thestudent the opportunity toreinforce errors.If all of the students arehaving the same difficulty,then it is time to go back intoclass instruction.
Hint: Students should compare the values in the table to the coordinates of the graph.
Hint: Students should create a table of values to find the constant rate of change.
Sam
ple
Do Not
Dup
licat
e

477th Grade Mathematics © 2014
BackgroundInformation
BIV
erti
cal A
lign
men
t
Vocabulary
Understanding the TEKS
Essential Question(s)
This SE focuses only on calculating a unit rate. Examples of unit rates in mathematical andreal-world problems include those involving speed, density, price, measurements in recipes,and student-teacher ratios considering this ratio as a rate of students to teachers.
unit rate
How does unit rates help to reason in the real world?What does it mean to calculate a unit rate?How do you calculate a unit rate?
Grade Student is expected to...
Dev
elop
ing
Con
cep
ts R
elat
ed
to P
rop
orti
onal
ity
4thNone
5thNone
6thNone
8thNone
Algebra I
None
Student Expectations - Supporting StandardTEKS 7.4B
Category 2
Calculate Unit RatesComputations and Algebraic Relationships
The student will demonstrate an understanding of how to perform operations and represent algebraic relationships.
Proportionality. The student applies mathematical process standards to represent and solve problems involving proportional relationships. The student is expected to calculate unit rates from rates in mathematical and real-world problems.
Sam
ple
Do Not
Dup
licat
e
© 2014 48 7th Grade Mathematics
Name:
EngagingActivity
A
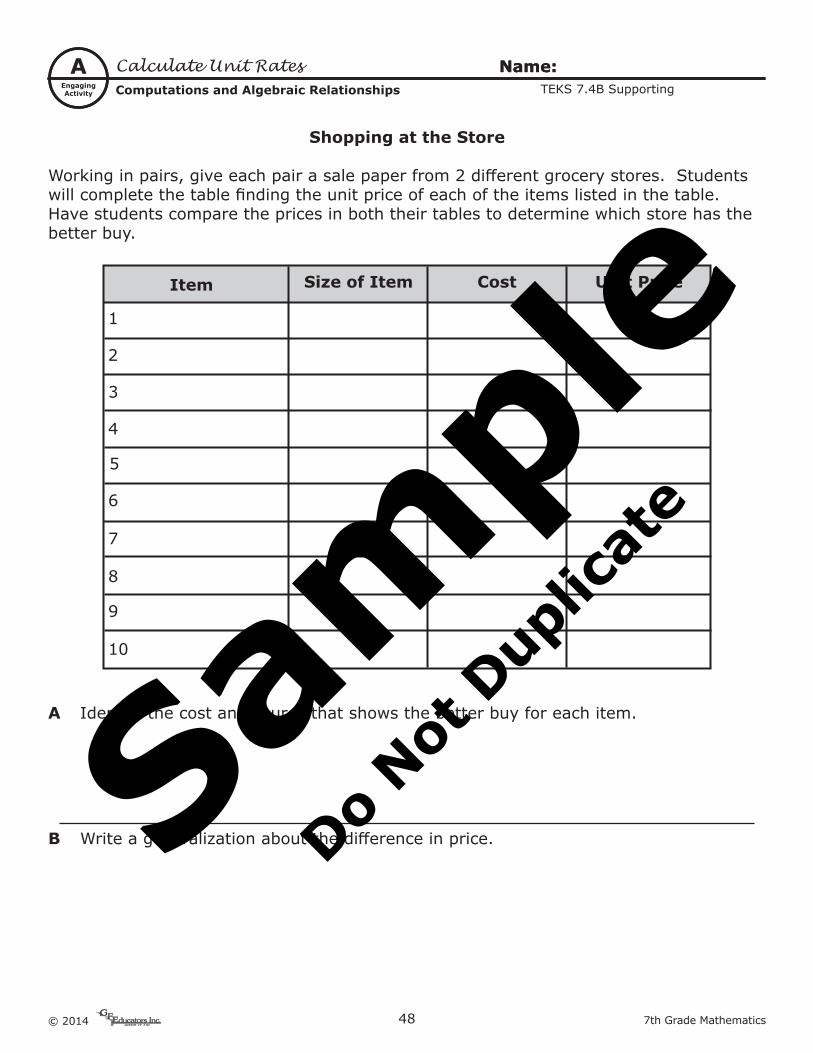
Shopping at the Store
Working in pairs, give each pair a sale paper from 2 different grocery stores. Students will complete the table finding the unit price of each of the items listed in the table. Have students compare the prices in both their tables to determine which store has the better buy.
Item
1
Size of Item Cost Unit Price
2
3
4
5
6
7
8
9
10
A Identify the cost and source that shows the better buy for each item.
B Write a generalization about the difference in price.
Calculate Unit RatesComputations and Algebraic Relationships
Name:TEKS 7.4B Supporting
Sam
ple
Do Not
Dup
licat
e
497th Grade Mathematics © 2014
Name:
TeachingModel
TM I can ...
Thinking Mathematically
Putting the Pieces Together
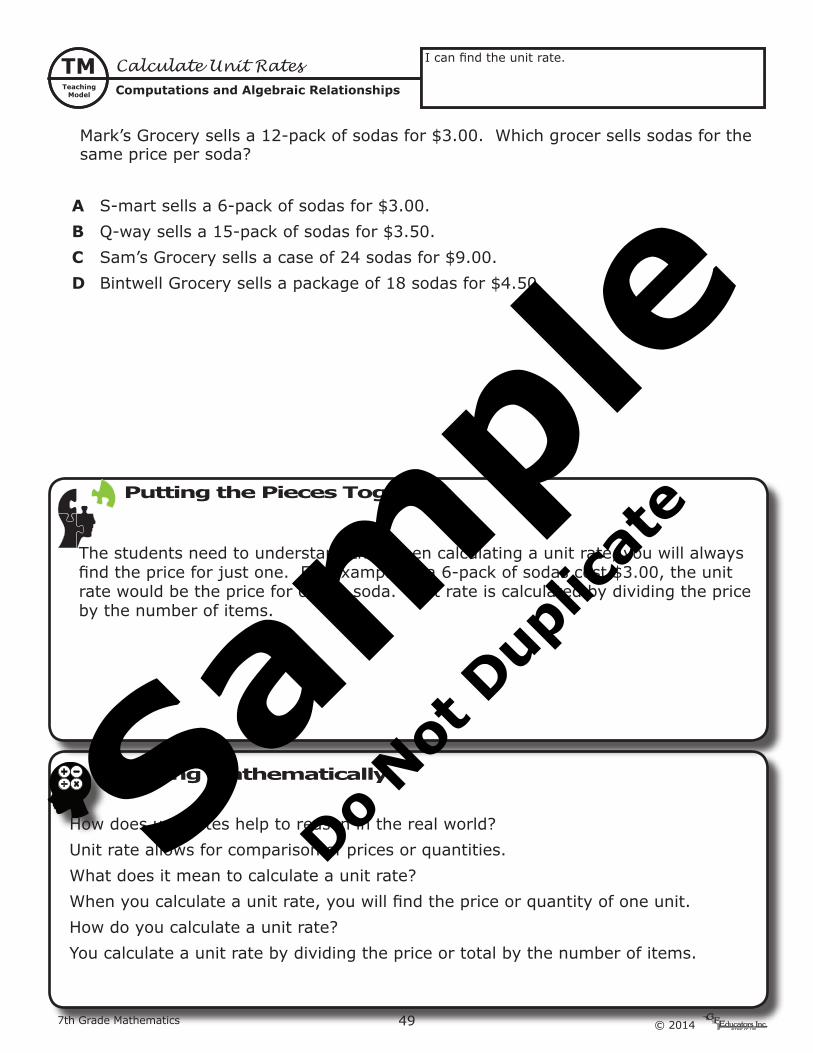
The students need to understand that when calculating a unit rate, you will always find the price for just one. For example, if a 6-pack of sodas cost $3.00, the unit rate would be the price for only 1 soda. Unit rate is calculated by dividing the price by the number of items.
How does unit rates help to reason in the real world?Unit rate allows for comparison of prices or quantities.What does it mean to calculate a unit rate?When you calculate a unit rate, you will find the price or quantity of one unit.How do you calculate a unit rate?You calculate a unit rate by dividing the price or total by the number of items.
Calculate Unit RatesComputations and Algebraic Relationships
Name:
I can find the unit rate.
Mark’s Grocery sells a 12-pack of sodas for $3.00. Which grocer sells sodas for the same price per soda?
A S-mart sells a 6-pack of sodas for $3.00.B Q-way sells a 15-pack of sodas for $3.50.C Sam’s Grocery sells a case of 24 sodas for $9.00.D Bintwell Grocery sells a package of 18 sodas for $4.50.
Sam
ple
Do Not
Dup
licat
e
© 2014 50 7th Grade Mathematics
Name:
GuidedPractice
GP Calculate Unit RatesComputations and Algebraic Relationships
Name:TEKS 7.4B Supporting
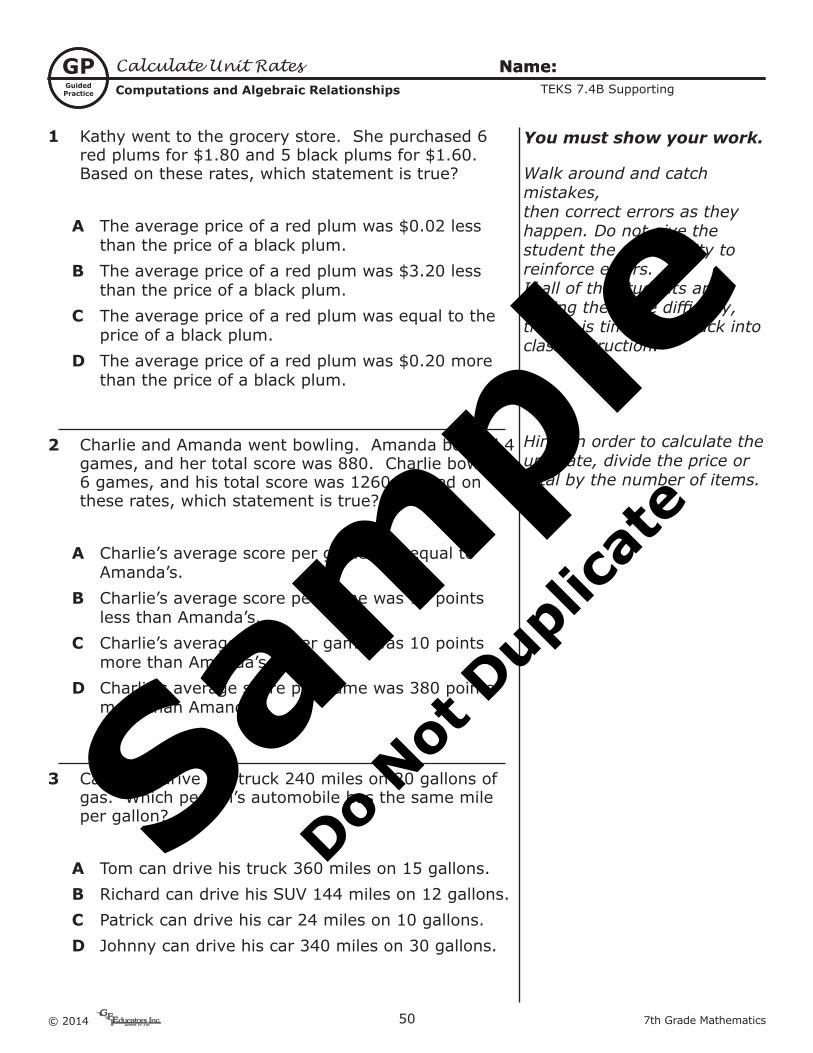
1 Kathy went to the grocery store. She purchased 6 red plums for $1.80 and 5 black plums for $1.60. Based on these rates, which statement is true?
A The average price of a red plum was $0.02 less than the price of a black plum.
B The average price of a red plum was $3.20 less than the price of a black plum.
C The average price of a red plum was equal to the price of a black plum.
D The average price of a red plum was $0.20 more than the price of a black plum.
2 Charlie and Amanda went bowling. Amanda bowled 4 games, and her total score was 880. Charlie bowled 6 games, and his total score was 1260. Based on these rates, which statement is true?
A Charlie’s average score per game was equal to Amanda’s.
B Charlie’s average score per game was 10 points less than Amanda’s.
C Charlie’s average score per game was 10 points more than Amanda’s.
D Charlie’s average score per game was 380 points more than Amanda’s.
3 Carla can drive her truck 240 miles on 20 gallons of gas. Which person’s automobile has the same mile per gallon?
A Tom can drive his truck 360 miles on 15 gallons.B Richard can drive his SUV 144 miles on 12 gallons.C Patrick can drive his car 24 miles on 10 gallons.D Johnny can drive his car 340 miles on 30 gallons.
You must show your work.
Walk around and catch mistakes,then correct errors as theyhappen. Do not give thestudent the opportunity toreinforce errors.If all of the students arehaving the same difficulty,then it is time to go back intoclass instruction.
Hint: In order to calculate the unit rate, divide the price or total by the number of items.
Sam
ple
Do Not
Dup
licat
e
517th Grade Mathematics © 2014
BackgroundInformation
BI
Student Expectations -
Category
TEKS
Ver
tica
l Alig
nm
ent
Vocabulary
Understanding the TEKS
Essential Question(s)
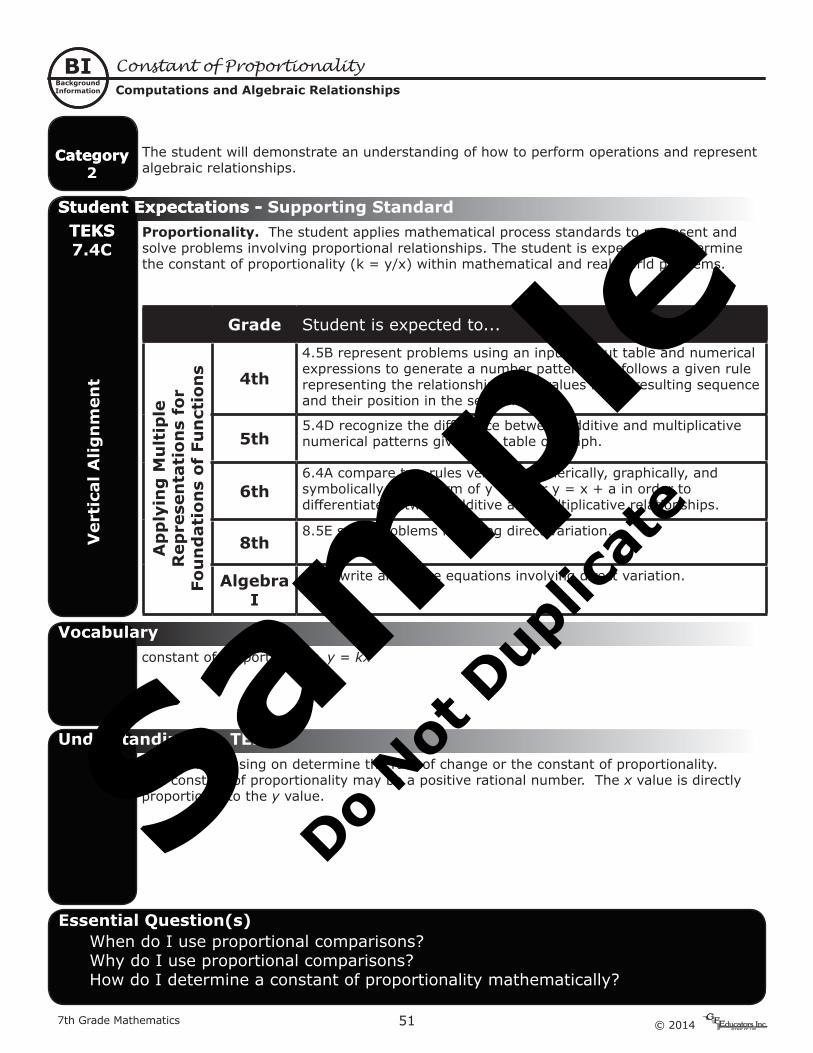
This SE is focusing on determine the rate of change or the constant of proportionality. The constant of proportionality may be a positive rational number. The x value is directly proportional to the y value.
constant of proportionality, y = kx
When do I use proportional comparisons?Why do I use proportional comparisons?How do I determine a constant of proportionality mathematically?
Grade Student is expected to...
Ap
ply
ing
Mu
ltip
le
Rep
rese
nta
tion
s fo
r Fo
un
dat
ion
s of
Fu
nct
ion
s 4th4.5B represent problems using an input-output table and numerical expressions to generate a number pattern that follows a given rule representing the relationship of the values in the resulting sequence and their position in the sequence.
5th5.4D recognize the difference between additive and multiplicative numerical patterns given in a table or graph.
6th6.4A compare two rules verbally, numerically, graphically, and symbolically in the form of y = ax or y = x + a in order to differentiate between additive and multiplicative relationships.
8th8.5E solve problems involving direct variation.
Algebra I
A.2D write and solve equations involving direct variation.
Student Expectations - Supporting StandardTEKS 7.4C
Category2
Constant of ProportionalityComputations and Algebraic Relationships
The student will demonstrate an understanding of how to perform operations and represent algebraic relationships.
Proportionality. The student applies mathematical process standards to represent and solve problems involving proportional relationships. The student is expected to determine the constant of proportionality (k = y/x) within mathematical and real-world problems.
Sam
ple
Do Not
Dup
licat
e
© 2014 52 7th Grade Mathematics
Name:
EngagingActivity
A
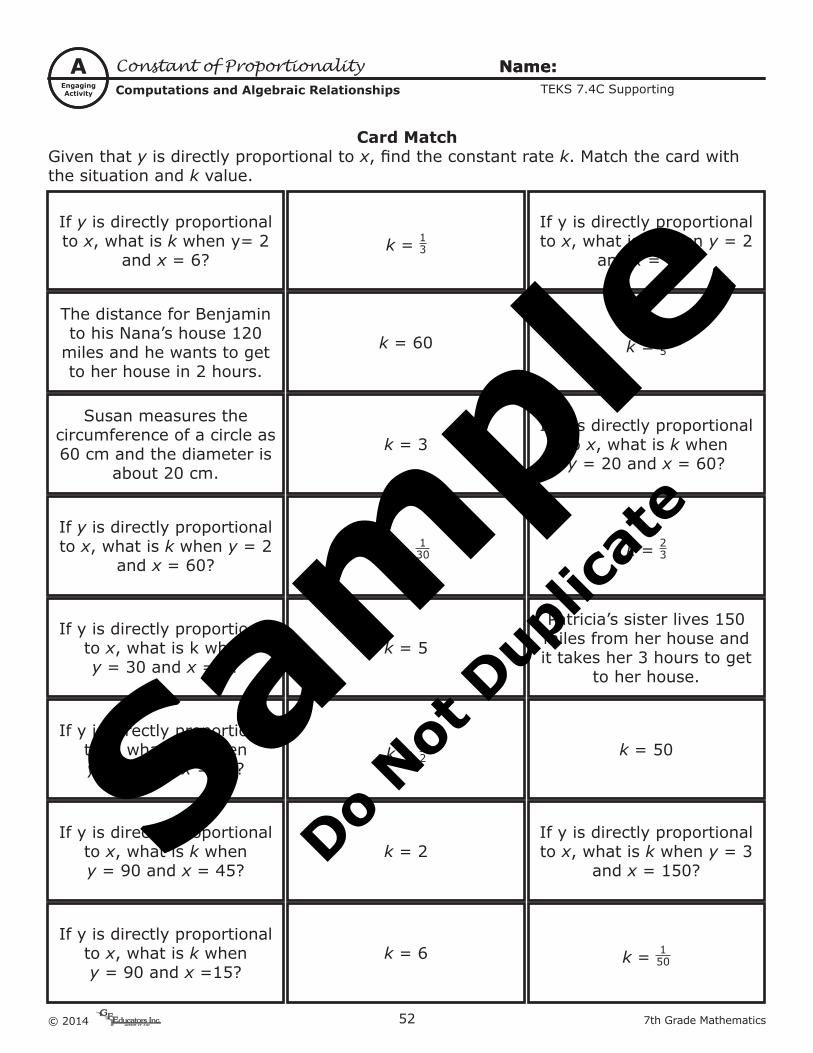
Card MatchGiven that y is directly proportional to x, find the constant rate k. Match the card with the situation and k value.
Constant of ProportionalityComputations and Algebraic Relationships
Name:TEKS 7.4C Supporting
If y is directly proportional to x, what is k when y= 2
and x = 6?k = 13
If y is directly proportional to x, what is k when y = 2
and x = 10?
The distance for Benjamin to his Nana’s house 120
miles and he wants to get to her house in 2 hours.
k = 60 k = 15
Susan measures the circumference of a circle as 60 cm and the diameter is
about 20 cm.
k = 3If y is directly proportional
to x, what is k when y = 20 and x = 60?
If y is directly proportional to x, what is k when y = 2
and x = 60?k = 1
30 k = 23
If y is directly proportional to x, what is k when y = 30 and x = 6?
k = 5
Patricia’s sister lives 150 miles from her house and it takes her 3 hours to get
to her house.
If y is directly proportional to x, what is k when y = 45 and x = 90?
k = 12 k = 50
If y is directly proportional to x, what is k when y = 90 and x = 45?
k = 2If y is directly proportional to x, what is k when y = 3
and x = 150?
If y is directly proportional to x, what is k when y = 90 and x =15?
k = 6 k = 150
Sam
ple
Do Not
Dup
licat
e
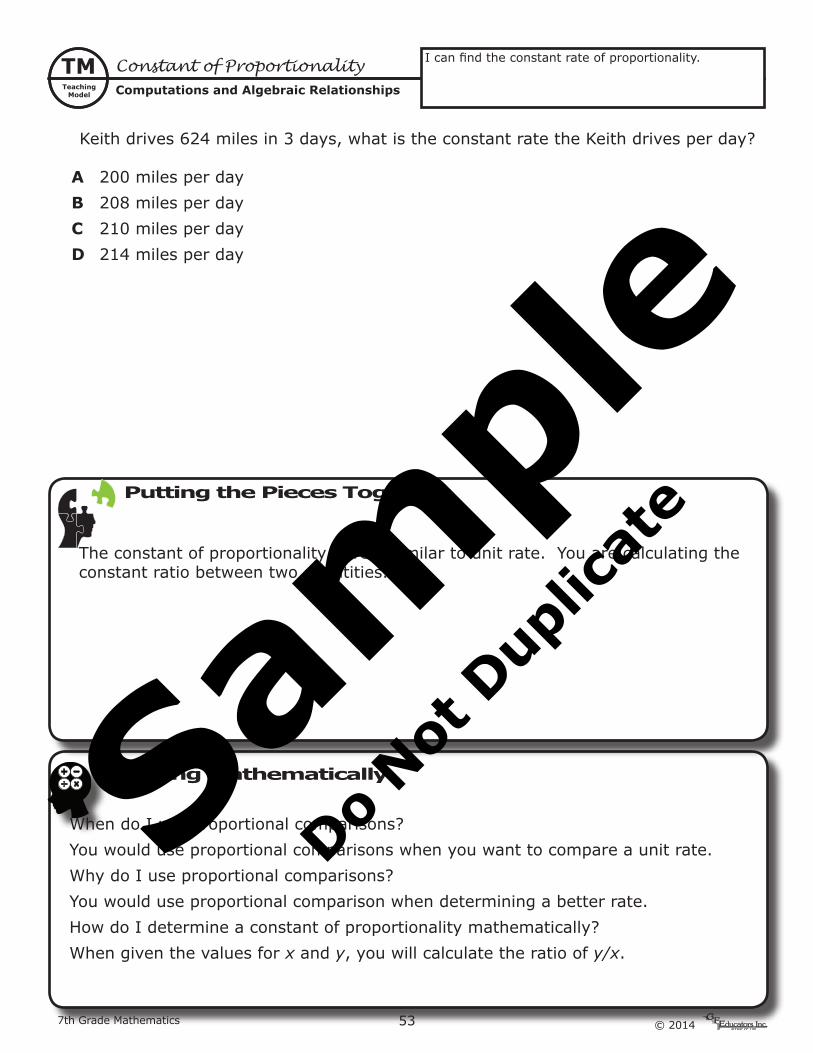
537th Grade Mathematics © 2014
Name:
TeachingModel
TM
Thinking Mathematically
Putting the Pieces Together
The constant of proportionality is very similar to unit rate. You are calculating the constant ratio between two quantities.
When do I use proportional comparisons?You would use proportional comparisons when you want to compare a unit rate.Why do I use proportional comparisons?You would use proportional comparison when determining a better rate.How do I determine a constant of proportionality mathematically? When given the values for x and y, you will calculate the ratio of y/x.
Constant of ProportionalityComputations and Algebraic Relationships
Name:
I can find the constant rate of proportionality.
Keith drives 624 miles in 3 days, what is the constant rate the Keith drives per day?
A 200 miles per dayB 208 miles per dayC 210 miles per dayD 214 miles per day
Sam
ple
Do Not
Dup
licat
e
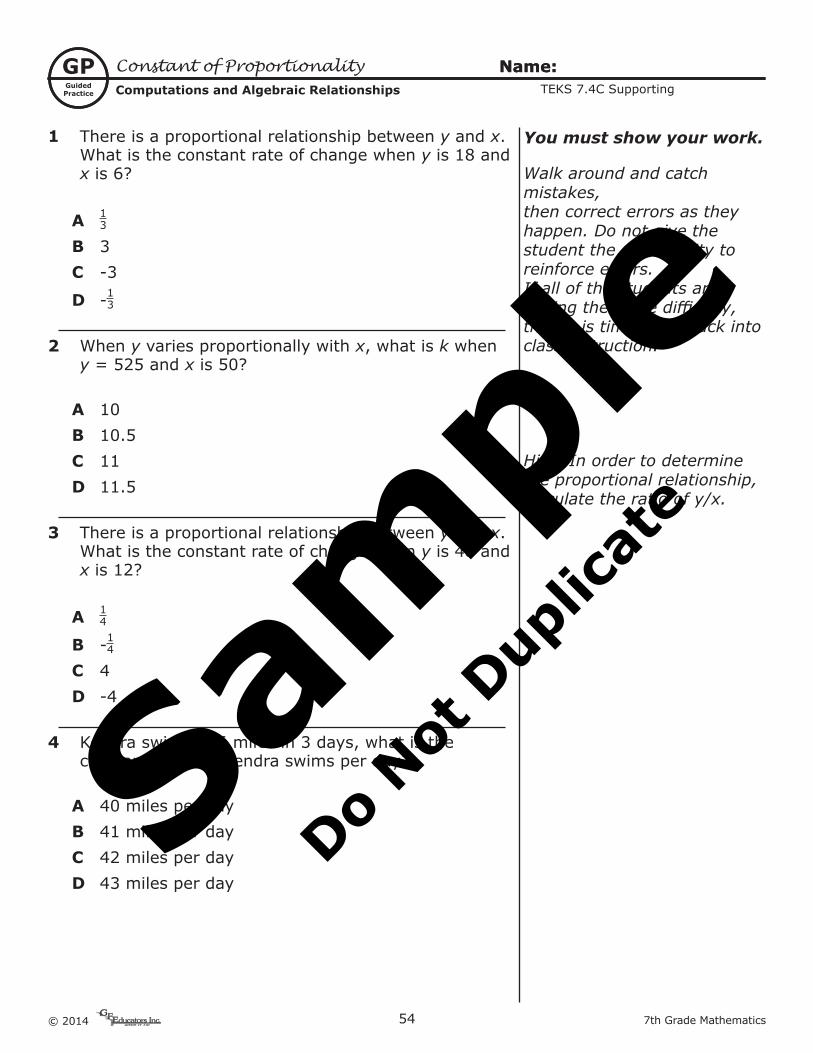
© 2014 54 7th Grade Mathematics
Name:
GuidedPractice
GP Constant of ProportionalityComputations and Algebraic Relationships
Name:TEKS 7.4C Supporting
1 There is a proportional relationship between y and x. What is the constant rate of change when y is 18 and x is 6?
A 13
B 3C -3
D -13
2 When y varies proportionally with x, what is k when y = 525 and x is 50?
A 10B 10.5C 11D 11.5
3 There is a proportional relationship between y and x. What is the constant rate of change when y is 48 and x is 12?
A 14
B -14
C 4D -4
4 Kendra swims 126 miles in 3 days, what is the constant rate the Kendra swims per day?
A 40 miles per dayB 41 miles per dayC 42 miles per dayD 43 miles per day
You must show your work.
Walk around and catch mistakes,then correct errors as theyhappen. Do not give thestudent the opportunity toreinforce errors.If all of the students arehaving the same difficulty,then it is time to go back intoclass instruction.
Hint: In order to determine the proportional relationship, calculate the ratio of y/x.
Sam
ple
Do Not
Dup
licat
e
2037th Grade Mathematics © 2014
Word Description
Illustration ExampleV
Vocabulary
Word Description
Illustration ExampleV
Vocabulary
Word Description
Illustration ExampleV
Vocabulary
Prism
Base
PyramidSam
ple
Do Not
Dup
licat
e
© 2014 204 7th Grade Mathematics
Word Description
Illustration ExampleV
Vocabulary
Word Description
Illustration ExampleV
Vocabulary
Word Description
Illustration ExampleV
Vocabulary
Congruent
Volume
Surface AreaSam
ple
Do Not
Dup
licat
e

2057th Grade Mathematics © 2014
Word Description
Illustration ExampleV
Vocabulary
Word Description
Illustration ExampleV
Vocabulary
Word Description
Illustration ExampleV
Vocabulary
Total Surface Area
Lateral Surface Area
NetSam
ple
Do Not
Dup
licat
e
© 2014 206 7th Grade Mathematics
Word Description
Illustration ExampleV
Vocabulary
Word Description
Illustration ExampleV
Vocabulary
Word Description
Illustration ExampleV
Vocabulary
Numerical Data
Categorical Data
Bar GraphSam
ple
Do Not
Dup
licat
e
2077th Grade Mathematics © 2014
Word Description
Illustration ExampleV
Vocabulary
Word Description
Illustration ExampleV
Vocabulary
Word Description
Illustration ExampleV
Vocabulary
Circle Graph
Dot Plot
Box PlotSam
ple
Do Not
Dup
licat
e
© 2014 208 7th Grade Mathematics
Word Description
Illustration ExampleV
Vocabulary
Word Description
Illustration ExampleV
Vocabulary
Word Description
Illustration ExampleV
Vocabulary
Minimum Quartile 1
Interquartile Range
Median Quartile 3Sam
ple
Do Not
Dup
licat
e
2097th Grade Mathematics © 2014
Word Description
Illustration ExampleV
Vocabulary
Word Description
Illustration ExampleV
Vocabulary
Word Description
Illustration ExampleV
Vocabulary
Spread of Data
Sam
ple
Do Not
Dup
licat
e

© 2014 210 7th Grade Mathematics
Word Description
Illustration ExampleV
Vocabulary
Word Description
Illustration ExampleV
Vocabulary
Word Description
Illustration ExampleV
Vocabulary
Sam
ple
Do Not
Dup
licat
e

2117th Grade Mathematics © 2014
Word Description
Illustration ExampleV
Vocabulary
Word Description
Illustration ExampleV
Vocabulary
Word Description
Illustration ExampleV
Vocabulary
Sam
ple
Do Not
Dup
licat
e
© 2014 212 7th Grade Mathematics
Word Description
Illustration ExampleV
Vocabulary
Word Description
Illustration ExampleV
Vocabulary
Word Description
Illustration ExampleV
Vocabulary
Sam
ple
Do Not
Dup
licat
e


