SEVENTH FRAMEWORK PROGRAMME THEME 2: FOOD, …
72
1 ANIMALCHANGE SEVENTH FRAMEWORK PROGRAMME THEME 2: FOOD, AGRICULTURE AND FISHERIES, AND BIOTECHNOLOGIES Grant agreement number: FP7- 266018 DELIVERABLE D10.5 Deliverable title: Report on adaptation and mitigation options in the showcase farms Subtitle: Report on non-European studies Abstract: This deliverable collates the information on simulated effects of mitigation and adaptation options at the farm scale in the non-European study regions from AnimalChange, primarily using the FarmAC model for the mitigation options, and applying semi quantitative modelling for the adaptation options. Due date of deliverable: M45 Actual submission date: M48 Start date of the project: March 1 st , 2011 Duration: 48 months Organisation name of lead contractor: DLO Authors: Marcia Stienezen (DLO), Ib Sillebak Kristensen (AU), Jørgen E. Olesen (AU), Nick Hutchings (AU), Lisbeth Mogensen (AU), Luís Barioni (Embrapa), Rui Veloso (Embrapa), Amaury Burlamaqui (Embrapa), Olivier Bonnet (UFRGS), Paulo de Faccio Carvalho (UFRGS), Eyob Tesfamariam (UP), Abubeker Hassen (UP), Jonathan Vayssières (CIRAD) and Philippe Lecomte (CIRAD). Revision: V1 Dissemination level: PU
Transcript of SEVENTH FRAMEWORK PROGRAMME THEME 2: FOOD, …

1
ANIMALCHANGE SEVENTH FRAMEWORK PROGRAMME
THEME 2: FOOD, AGRICULTURE AND FISHERIES, AND BIOTECHNOLOGIES
Grant agreement number: FP7- 266018
DELIVERABLE D10.5 Deliverable title: Report on adaptation and mitigation options in the showcase farms Subtitle: Report on non-European studies
Abstract: This deliverable collates the information on simulated effects of mitigation and adaptation options at the farm scale in the non-European study regions from AnimalChange, primarily using the FarmAC model for the mitigation options, and applying semi quantitative modelling for the adaptation options.
Due date of deliverable: M45 Actual submission date: M48
Start date of the project: March 1st, 2011 Duration: 48 months
Organisation name of lead contractor: DLO Authors: Marcia Stienezen (DLO), Ib Sillebak Kristensen (AU), Jørgen E. Olesen (AU), Nick Hutchings (AU), Lisbeth Mogensen (AU), Luís Barioni (Embrapa), Rui Veloso (Embrapa), Amaury Burlamaqui (Embrapa), Olivier Bonnet (UFRGS), Paulo de Faccio Carvalho (UFRGS), Eyob Tesfamariam (UP), Abubeker Hassen (UP), Jonathan Vayssières (CIRAD) and Philippe Lecomte (CIRAD).
Revision: V1
Dissemination level: PU

2
Table of Contents
1. INTRODUCTION 5
2. FARMS INCLUDED IN STUDY 7
3. ON FARM AND PRE-CHAIN GREENHOUSE GAS EMISSIONS 8
3.1. LCA STUDY (INCLUDING GHG EMISSIONS IN THE PRE-CHAIN) 8
3.1.1. Pre-chain GHG emissions 8
3.1.2 Functional unit (FU) and allocation 8
3.1.3 Feed import 9
3.1.4. Fertilizer (N, P, K) 10
3.1.5. Diesel – including that used by machine pool 10
3.1.6. Electricity 10
3.2. ON FARM AND PRE/CHAIN GHG FROM HUMID EQUATORIAL BEEF (AMAZONIA) 11
3.3. SUB-HUMID MIXED DAIRY 16
3.4 CONCLUSIONS LCA CALCULATIONS 21
4. MITIGATION OPTIONS EVALUATED ACROSS FARMS, ONLY ON
FARM EMISSION 25
4.1. HUMID EQUATORIAL BEEF (AMAZONIA) 25
4.1.1. General introduction 25
4.1.2. Mitigation options 26
4.1.3 Results 28
4.1.4 Conclusion 31

3
4.2. SUB-HUMID MIXED DAIRY 32
4.2.1. General description 32
4.2.2 Mitigation options 33
4.2.3 Results 35
4.2.4 Conclusion 37
4.3 SEMI-ARID MIXED LIVESTOCK FARMING 41
4.3.1 General description 41
4.3.2 The two systems compared 41
4.3.3 Results 43
4.4. SEMI-ARID GRASS LAND BASED LIVESTOCK FARMING 44
4.4.1 General description 44
4.4.2 Mitigation options 44
4.4.3 Results 45
4.4.4 Conclusions mitigation options 46
5. CONCLUSIONS MITIGATION OPTIONS 47
6. ADAPTATION 49
6.1 INTRODUCTION 49
6.2 ANALYSIS 50
6.3 CONCLUSIONS 52
7. REFERENCES 56
ANNEX 1. ADDITIONAL INFORMATION FARM S-AF-002 61
ANNEX 2. FARMS INITIALLY IDENTIFIED FOR USE IN FARMAC 63

4
ANNEX 3. FIVE BEST MITIGATION OPTIONS INITIALLY IDENTIFIED
FARMS 65
ANNEX 4. FOUR BEST ADAPTATION OPTIONS INITIALLY IDENTIFIED
FARMS 66
ANNEX 5. FARM TYPE DEFINITIONS 67
ANNEX 6. REASON WHY ADAPTATION MEASURE IS CHOSEN AND HOW
IT IS IMPLEMENTED 68
ANNEX 7. ESTIMATED IMPACT FROM CLIMATE CHANGE UPON FARM 72
5
1. Introduction
The EU-project AnimalChange will provide scientific guidance on the integration of
adaptation and mitigation objectives and on sustainable development pathways for livestock
production in Europe, in Northern and Sub-Saharan Africa and Latin America.
An important part of AnimalChange focuses on the farm level (WP9, WP10 and WP11,
together Component 3). Figure 1 provides an overview of information flows within
Component 3.
Figure 1. Structure and information flows regarding Component 3 of AnimalChange
The current deliverable (D10.5) is part of WP10. The aim of WP10 of AnimalChange was to
investigate, test and demonstrate the effect of single and combined mitigation and adaptation
options at farm level using both model farms and real farms (show-case farms). The
objective of WP10 was to describe livestock systems, identify and use case study farms,
integrate adaptation and mitigation at farm scale and extend the spatial scale to include
further issues (e.g. animal mobility) that are relevant for the regional scale.
Initially it was the intention to use existing models to calculate on-farm greenhouse gas
(GHG) emissions to estimate the effect of mitigation options on the farm scale. However it
was not feasible to use the existing farm-scale models since the data required for input in the
existing models were very detailed but not available for the farms in the study regions within
AnimalChange. To be able to asses on farm GHG emissions from livestock farming a
simplified carbon and nitrogen flow-based model was developed (build and tested) within
CP3; FarmAC (Hutchings, 2013). From January 2015 onwards testing results with FarmAC
were such that FarmAC could be used for on farm calculations of GHG emissions. This
meant that from that moment onwards for a limited number of farms, the on farm GHG
WP 10 Integrate mitigation and
adaptation at farm scale
Leader: CIRAD (Philippe Lecomte)
CP 3 Farm scale mitigationand adaptation
Leader: AU-DJF (Jørgen Olesen)
WP 9 Farm scale modeling
methodologies for mitigation and
adaptation
Leader: AU-DJF (Nicholas Hutchings)
WP 11 Filtering out options
Leader: SAC (Dominic Moran)
CP 1 Livestock systems under business-as-usual
scenarios: GHG emissions and climate change impacts
Leader: DLO (Peter Kuikman)
CP 4 Regional scale and
support to sustainable policy
development
Leader: FAO (Pierre Gerber)
CP 2 Breakthrough
mitigation and adaptation
options
Leader: Teagasc (Frank O’Mara)

6
emissions could be calculated using FarmAC. To be able to compare between farms, despite
the limited number of farms, it was decided to focus deliverable D10.3 on the study regions
from Europe and deliverable D10.5 on the study regions from Africa and Latin America
instead of focussing on model farms and showcase farms, respectively.
On farm GHG emissions were compared between farms. The effect of mitigation options was
evaluated across mitigation option (same farm). Off-farm GHG emissions and changes in
carbon storage were taken into account for by adding a Life Cycle Analysis (LCA) of pre-
chain emissions.
Since FarmAC cannot simulate adaptation, an alternative methodology had to be found. The
adaptation options were therefore compared using a semi quantitative assessment.
Chapter 2 provides an overview of the available farms, Chapter 3 provides an overview of
on-farm and pre-chain GHG emissions, Chapter 4 provides detailed farm descriptions and
information on the effect of mitigation measures upon the on-farm GHG emissions, Chapter 5
provides conclusions regarding mitigation options and Chapter 6 provides insight in the
factors determining the choices of adaptation measures.
7
2. Farms included in study
For modelling GHG emissions with FarmAC, partners within AnimalChange identified 5
African farms, of which 3 model farms and 2 showcase farms, and 13 Latin American farms,
of which 5 model and 8 showcase farms (Annex 2).
Model farms are representative, virtual farms for a livestock system in a region type whereas
showcase farms are real farms, having typical characteristics of the livestock system.
For use in AnimalChange a farm typology was created by which farms were classified
(Stienezen, 2012; Annex 5).
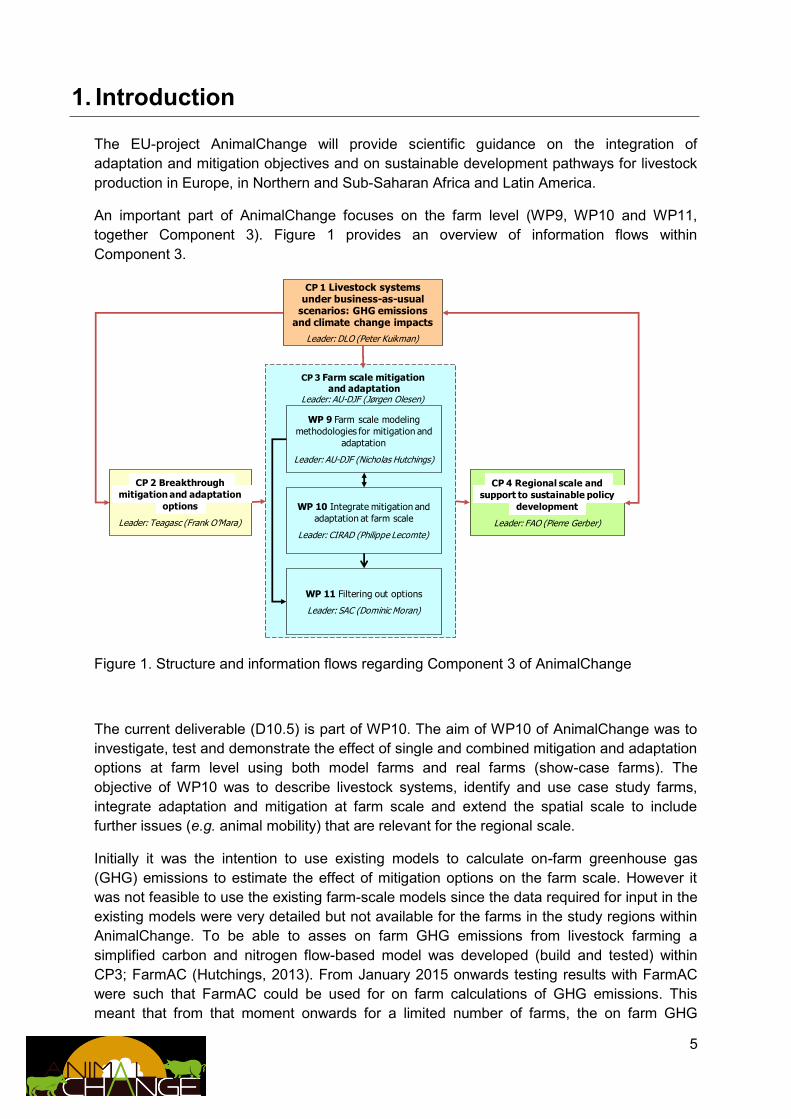
For this report, FarmAC results are available for 2 African farms and 2 farms from Latin America (Table 2.1). The farms originate from Senegal, South Africa and Brazil.
Table 2.1 Farms used for modelling with FarmAC
Region Agro-Ecological Zone Farm type Farm Code
Senegal-Peanut bassin Semi-Arid
Semi-arid Mixed Peanut-milet-livestock
system Model farm M-AF-001
South Africa-Kalahari Semi-Arid Semi-arid Grass land based beef Deon Hoon S-AF-002
Brazil-Western (Roraima)
Brasilian AmazonHumid
Humid Grassland based soya bean-trees-
beef system
Farm with
AgroforestryS-LA-005
Brazil-Campos Sub-Humid
Sub-humid Dairy cattle on sown pasture
relatively intensive integrated systems Model farm
M-LA-003

8
3. On farm and pre-chain Greenhouse Gas emissions
3.1. LCA study (including GHG emissions in the pre-chain)
For D10.5, the model results of GHG emissions at farm level calculated by the simple farm
model (FarmAC, WP9) was extended to take into account the whole life cycle of the
agricultural products until farm gate, i.e. GHG emission related to pre-chain was included.
These emissions will be included by using typical Life Cycle Assessment (LCA) values.
Furthermore, the simple farm model, FarmAC estimates GHG emission as a total number per
farm. In task 10.2 the GHG emission from on-farm production inclusive pre-chain is
expressed per product unit.
3.1.1. Pre-chain GHG emissions
Some GHG emissions are caused by the on-farm activities, for example CH4 from enteric
fermentation, N2O related to application of manure to fields etc. These on-farm GHG
emissions were calculated by the simple farm model, FarmAC. Whereas, other GHG
emissions are related to the pre-chain, e.g. production and transport of inputs like fertilizer
(N), feed, diesel, electricity. To calculate the GHG emissions related to these inputs (pre-
chain) we need to know the amount of different inputs and the LCA value for the GHG
emission per unit of input.
3.1.2 Functional unit (FU) and allocation
In the simple farm model used in WP9, the functional unit (FU) is ‘total GHG emissions per
farm from one year of production’ i.e. the results are given as for example a total GHG
emission of 2.3 million kg CO2-eq. from a North European dairy farm with 192 cows. In
contrast this study also uses the GHG emission per products as the functional unit, e.g. kg
CO2-eq./kg milk, kg CO2-eq./kg meat, kg CO2-eq./kg barley etc. To estimate these carbon
footprints, the total GHG emissions (from on-farm production and from the pre-chain) need to
be allocated between the different products from the farm.
The animal products, meat and milk are the main products from the types of livestock farms
involved in WP10 in the AnimalChange project, whereas crops for sale and manure for sale
are seen as by-products. When total GHG emissions per farm per year has been calculated,
the emissions related to amount of manure and crops produced are deducted from this total
GHG emission by using standard LCA values for GHG emission per kg N in the manure and
crops sold. The remaining GHG emission is then divided between the amount of meat
produced or allocated between meat and milk, if both products exist. According to

9
(Kristensen, Mogensen et al. 2011), the choice of method used to divide total farm GHG
emissions into meat and milk has significant impact on the estimated emission per kg
product.
In D10.5 this allocation follow the method suggested by IDF (2010): a Biological allocation
based on a standard marginal net energy requirement to produce the actual amount of milk
and meat in the shape of kg live weight gain.
Allocation factor for milk = 1 – 5,771 *(kg LW gain/kg ECM) = 1 – 5,771 *((274 + 40)/9486) = 0,808
Manure for sale
Recently, the view on manure has changed from being a waste product to be considered as
a co-product from the livestock production (Dalgaard and Halberg, 2007; (EU 2013)). The
saved amount of N fertilizer can be calculated as the total N content in the manure after
losses multiplied the percentage of N that is supposed to be available for crops
(NaturErhvervstyrelsen 2014). Extra emissions related to transport of manure compared to
that of fertilizer need to be taken into account.
The amount of manure for sale was defined as amount of collected manure (slurry, deep
litter, etc.) not used on own fields.
Table 1. Saved GHG emission from 100 kg N ex-animal for sale/import
Manure system Deposited at
pasture Slurry Deep litter
Fertilizer value of manure N, kg 1)
70 70 45
GHG from avoid fertilizer prod., kg CO2-eq N 2)
298 298 191
1) (NaturErhvervstyrelsen 2014) 2) 4,25 kg CO2/kg N (Elsgaard, Olesen et al. 2010) (Elsgaard, 2010)
3.1.3 Feed import
The ‘FarmAC model’ provides data on amount of feed import per farm per year. In the sheet
‘Balance’ the total amount of purchased and sold feed ingredients are calculated per feed
item as kg dry matter. In the LCA calculations, we need to take into account the GHG
contribution from transport of imported feed ingredients, therefore data on place/country of
origin needed to be known. These data are not given. This information would also make it
possible (at least theoretically) to take into account the actual productivity in the place of
production.

10
Table 2. Factors for CF of feed import, g CO2/kg DM, (Mogensen, Kristensen et al. 2014)
Growing Processing Transport (Origin)
Total
Spring barley 484 11 18 (national) 512
Wheat 406 11 18 (national) 434
Rape seed cake
390 28 75
(national/import) 494
Rape seed 963 0 122
(national/import) 1085
Soybean meal 161 29 325 (import) 515
3.1.4. Fertilizer (N, P, K)
The ‘FarmAC model’ gives in the sheet ‘Manure’ data on the amount of (kg) N fertilizer used
per crop per year as well as types of N fertilizer imported. The ‘FarmAC model’ does not give
any information about amount of P and K fertilizer used and thereby imported. This
contribution was not included in the calculation.
In the present calculation all import of N-fertilizer was assumed to be based on calcium
ammonium nitrate and the applied CF was 4,25 kg CO2/kg N (Elsgaard, 2010).
3.1.5. Diesel – including that used by machine pool
In ‘FarmAC model’ no information is given on the amount of diesel used.
In the LCAs calculations the following standard level of diesel was assumed for different
crops:
Table 3. Diesel, l/ha (3,309 kg CO2/l diesel, (Nielsen, Nielsen et al. 2003)
l/ha
Maize whole crop silage 130
Cereal Wheat 102,
Spring barley 83 Cereals 93
Grass silage 80
Grass grazed 6
Rape seed and pea 168
3.1.6. Electricity
Electricity can be used in the livestock housing, for example heating, cooling, housing,
milking and in the fields for example for irrigation and drying of cereals at harvest. Neither the
‘FarmAC model’ nor financial data provide data of on farm use of electricity. Therefore, the

11
LCA calculations used standard values according to the different farming systems in different
regions for the used amount of electricity.
Table 4. Energy use in stable
Kwh North Europe
(Denmark) Brazil
Per cow per year
700 100
Per young stock per year
18 2
CF for electricity: 0,655 kg CO2/kwh (based on natural gas)(Nielsen, Nielsen et al. 2003)
In order to evaluate the total GHG emissions –direct, indirect and pre-chain- from agricultural
systems in relation to management this chapter include systematically characteristics (table
1), N-balances (table 2) and GHG emissions (on farm emissions in table 3 and pre-chain
emissions in table 4). Corresponding information is shown in chapter 5, with corresponding
mitigation numbers.
3.2. On farm and pre/chain GHG from Humid Equatorial
Beef (Amazonia)
Table 1, Table 2, Table 3 and Table 4 respectively present farm characteristics, N balances,
on-farm GHG emissions and total GHG emissions (pre-chain GHG emissions included) from
a humid equatorial beef farm in Amazonia.

12
Table 1. Characteristicks of farm: Soil; Management; Herd; Crops and yields
Country Brasil, Amazonia rain forrest, Roraima
person data responsible Amaury/Luis
Agro Ecological Zone Brazil Amazone (Sub-humid)
Farm type Beef cattle
System 9iskWor
k. 1Luis.
Soil
(baseline
=10.
potential
grassyiel
7
Agrofor
estry.
Crop_Li
v_Rot_T
ek
3Crop_
Liv_tra
d (b
aseline
=1)
2Rota
tion
0N (b
aselin
e=1)
6Rota
tion_7
0N (b
aselin
e=1)
Baseline Mit_1 Mit2 Mit3 Mit_4Farm number of baseline 709358-10 7 3 2 6
Crop rotation All grazing
Ha plouging possible [ha] 488 488 488 488 488
Ha, permanent grassland, low productive [ha]
Soil type, FAO (2015) Clay
Soil organic material in root zone [tonnes C/ha] 105 90 97 96 119
Change in C stored in the soil kg C/ha/yr -984 -940 -747 -795 -57
Clay in root zone [% clay] 0.26 0.26 0.26 0.26 0.26
Precipitation [mm/year] 2028 2028 2028 2028 2028
Potential evapotranspiration [mm/year] 419 421 436 419 419
Manure type Unit None
Breed of animal Zebus
Milk for sucklers (liter/cow/year) [liter/cow/year] 2553 2553 2553 2553 2510
Meat (kg LW/animal/year] 141 141 146 145 148
Herd size (cows)h [cows] 20 20 20 20 25
Herd size (heifers)h [heifers] 70 70 70 70 86
Herd size (bulls)h [bulls] 420 400 798 757 1413
LU/animal 0.63 0.63 0.61 0.61 0.60
LU (ha-1)b [LU (ha-1)]b 0.66 0.66 0.66 0.66 0.66
Livestock manure(kg excreted N LU-1 /year)c[kg N LU-1 /year)]c 57 55 95 91 162
Livestock manure applied (kg deposit-N ha-1 /year)c[kg N ha-1 /year)]c 37 36 63 59 106
Grazing [% of herd DM-uptake] 100 100 100 100 100
Grazing area [% of ha] 100 80 80 100 100
Conserved rouhage [% of ha] 0 80 80 0 0
Soya [% of ha] 20 20 0 0
Plant yield. Gross i) (t DM/year) 8.1 11.9 14.2 13.0 19.0
Total net yield (sold, grazed and conserved) (t DM/year) 2.7 3.3 5.1 4.3 7.6
Grass net yield (t DM/year) 2.7 3.4 5.7 6.2
Soya (t DM/year) 2.8 2.8
Teak (t DM/year) 5.2
a FYM is the separate system with both solid and liquid manure.
b Livestock units is defines as in Eu 500 kg liveweight. In DK one dairy cow is 1.33 LU=142 kg N excretion/animal/y and 1 heifer is 0.41 LU= 43.3 kg N excretion/animal/y
c Including manure deposited by cattle on grazed areas.
d DN is day and night time grazing, D is daytime grazing, (–) indicates no grazing.
e Grazing or fresh feed inside.
f Crop area in percent of farm area.
g Grass, clover and grain crops for silage; alfalfa for hay.
h. Year-animals = feedingdays/365
i) Yield to be harwested or grazed in fields

13
Table 2. N-balances, [kg N/ha/year]System 9iskWor
k. 1Luis.
Soil
(baseline
=10.
potential
grassyiel
7
Agrofor
estry.
Crop_Li
v_Rot_T
ek
3Crop_
Liv_tra
d (b
aseline
=1)
2Rota
tion
0N (b
aselin
e=1)
6Rota
tion_7
0N (b
aselin
e=1)
Farm Inputs N in fertiliser 0 0 0 0 70
N fixation 0 21 19 0 0
N deposited from atmosphere 15 15 15 15 15
N in imported crop products 0 0 0 0 0
Total inputs 15 36 34 15 85
Outputs N sold in crop products, incl rouhage export 0 38 38 0 0
N sold in milk 1 1 1 1 1
N exported in meat 5 4 8 8 14
Total outputs 5 43 46 9 15
Farm gate balance 10 -7 -13 7 70
Losses Total amm-N loss 2 2 3 3 20
Total denitrification 17 19 22 21 29
Nitrate leaching 76 52 27 50 25
Change in mineral N in soil 4 3 1 2 2
Change in organic N in soil -89 -82 -65 -69 -5
Herd Inputs Rouhage storage N-balance after storage loss0 0 0 0 0
Grazed 42 41 71 68 121
Total inputs 42 41 71 68 121
Outputs N sold in milk 1 1 1 1 1
N exported in meat 5 4 8 8 14
Total outputs 5 5 9 9 15
Herd balance 37 36 63 60 106
Efficiency of N use by livestock 12% 12% 12% 13% 13%
Field balance
Inputs N in fertiliser 0 0 0 0 70
Manure applied 0 0 0 0 0
Deposited in field 37 36 63 59 106
N fixation 0 21 19 0 0
N deposited from atmosphere 15 15 15 15 15
Total inputs 52 72 96 74 191
Outputs Harvested mechanically 0 38 38 0 0
Grazed 42 41 71 68 121
N sold in crop products, incl rouhage export 0 38 38 0 0
Total outputs 42 79 109 68 122
Field balance 10 -7 -13 6 70
NEffField 81% 109% 113% 91% 64%
Feed storage Harvested mechanically 0 38 38 0 0
N in imported crop products 0 0 0 0 0
Imported rouhage 0 0 0 0 0
Imported cash crops (grain, rape) 0 0 0 0 0
N sold in crop products, incl rouhage export 0 38 38 0 0
N lost from processing/stored crop products 0 0 0 0 0
% loss of input 0% 0% 0% 0% 0%

14
Table 3. The basic-farm: On-farm GHG emission System 9iskWor
k. 1Luis.
Soil
(baseline
=10.
potential
7
Agroforest
ry.
Crop_Liv_
Rot_Tek
3Crop_Li
v_trad (b
aseline=1
)
2Rotation
0N (b
aseline=1)
6Rotatio
n_70N (b
aseline=
1)
GHG results per farm, kg CO2-eq/yr 1)
CH4 enteric [kg CO2-eq/y] 641578 616694 1080140 1028401 1834709
CH4 manure [kg CO2-eq/y] 0 0 0 0 0
N2O manure [kg CO2-eq/y] 0 0 0 0 0
N2O field [kg CO2-eq/y] 551046 634897 709815 696242 931630
Soil C changes [kg CO2-eq/y] 1760649 1682732 1336566 1423020 102625
Total direct GHG [kg CO2-eq/y] 2953273 2934323 3126521 3147663 2868964
Indirect from NH3-emission [kg CO2-eq/y] 0 0 0 0 33594
N2O-indirect leaching [kg CO2-eq/y] 129900 88922 46544 86036 42852
Total indirect GHG [kg CO2-eq/y] 129900 88922 46544 86036 76446
GHG, direct + indirect [kg CO2-eq/y] 3083173 3023245 3173065 3233699 2945410
On farm land, ha [ha] 488 488 488 488 488
GHG results per ha, kg CO2-eq/yr 1)
CH4 enteric [kg CO2-eq/ha/y] 1315 1264 2213 2107 3760
CH4 manure [kg CO2-eq/ha/y] 0 0 0 0 0
N2O manure [kg CO2-eq/ha/y] 0 0 0 0 0
N2O field [kg CO2-eq/ha/y] 1129 1301 1455 1427 1909
Soil C changes [kg CO2-eq/ha/y] 3608 3448 2739 2916 210
Total GHG per ha [kg CO2-eq/ha/y] 6052 6013 6407 6450 5879
Indirect from NH3-emission [kg CO2-eq/ha/y] 0 0 0 0 69
N2O-indirect leaching [kg CO2-eq/ha/y] 266 182 95 176 88
Total indirect GHG [kg CO2-eq/ha/y] 266 182 95 176 157
GHG, direct + indirect [kg CO2-eq/ha/y] 6318 6195 6502 6626 6036
Adjustment of home-produced feed 2 -12 -32 2 -6
Output of products
Milk, kg for calves [kg/y] 51069 51069 51069 51069 62742
Meat, ton LW [ton LW/y] 72 69 129 123 225
Crop product [ton DM] 0 390599 306515 0 5705
Input
Fertlizer, kg N 2) [N/ha] 0 0 0 0 70
Fixation [N/ha] 0 21 19 0 0
Feed 3)
- Soya grain export, kg DM [kg DM/ha] 0 -560 0 0 0
Diesel, l/ha estimate [l/ha] 6 6 6 6 6
Electricity, stable estimate [kwh/ha] 2 0 0 3 0

15
Table 4. The basic-farm: Total GHG emission – including pre-chain.
Presented as total per ha and per kg product
Amazon
e_Beef
Agroforest
ry.
Integrati
on crop-
livestock
Rotational
grazing
Rotational
graz. + N-
fertilization
GHG results per farm, kg CO2-eq/yr 1)
On-farm total direct GHG [kg CO2-eq/ha/y] 6052 6013 6407 6450 5879
On-farm total indirect GHG [kg CO2-eq/ha/y] 266 182 95 176 157
On farm GHG, direct + indirect [kg CO2-eq/ha/y] 6318 6195 6502 6626 6036
Reduction (%) -2% 3% 5% -4%
On farm emissions (kg CO2-eq/kg LW gain)
Total GHG 42.81 43.88 24.51 26.29 13.08
Reduction (%) 3% -43% -39% -69%
Pre-chain GHG from
- Net Feed import [kg CO2-eq/ha/y] 2 -300 -32 2 -6
- Fertilizer (N) [kg CO2-eq/ha/y] 0 0 0 0 298
- Manure (N) [kg CO2-eq/ha/y] 0 0 0 0 0
- Diesel [kg CO2-eq/ha/y] 20 20 20 20 20
- Electricity [kg CO2-eq/ha/y] 1 0 0 2 0
Total pre-chain GHG emission [kg CO2-eq/ha/y] 23 -280 -11 24 312
0-check [kg CO2-eq/ha/y] 0 0 5558 -11602 -151802
Total GHG before allocation [kg CO2-eq/ha/y] 6341 5916 6491 6650 6347
Output of products
Meat, ton LW [ton LW/y] 72 69 129 123 225
Meat, kg LW [Kg LW/ha/y] 148 141 265 252 461
Reduction (%) -4% 80% 71% 213%
GHG per kg product
G CO2/kg meat LW-gain (sold from farm) [G CO2/kg meat LW-gain] 42962 41897 24468 26381 13758
Reduction (%) -2% -43% -39% -68%
[Kg meat LW-gain/kg CO2] 23 24 41 38 73
Reduction (%) 3% 76% 63% 212%
GHG from Humid Equatorial Beef (Amazonia)

16
3.3. Sub-humid mixed dairy
Table 1, Table 2, Table 3 and Table 4 respectively present farm characteristics, N balances,
on-farm GHG emissions and total GHG emissions (pre-chain GHG emissions included) from
a sub-humid mixed dairy farm from the Campos region (Brazil).

17
Table 1. Characteristicks of farm: Soil; Management; Herd; Crops and yields
Country Brasil, Campos, Permanent grass before 1970, South Brasil
Person data responsible Olivier BONNET
Agro Ecological Zone Humid grassland based dairy, Brasil, Campos
Farm type Holstein dairy on sub-tropical grassland
System Conventio
nal
No-
tillage
No-
tillage &
red. N
No
tillage,
low N &
top
grazing
No
tillage,
low N &
2 years
rotation
No tillage,
low N,
top graz.
& 2 years
rotation
Baseline in
2 crop rot
Mit1 Mit2 Mit3 Mit4 Mit5
Farm number of baseline 116829-1 3 12 4 16 13
Crop rotation
Ha plouging possible [ha] 14 14 14 14 14 14
Soil type, FAO (2015)
Soil organic material in root zone [tonnes C/ha] 81 83 83 95 84 52
Change in C stored in the soil kg C/ha/yr 118 202 198 603 223 591
Clay in root zone [% clay] 0.30 0.30 0.30 0.30 0.30 0.30
Precipitation [mm/year] 1911 1911 1911 1911 1906 1906
Potential evapotranspiration [mm/year] 492 499 499 500 497 498
Manure type Unit
Manure storage None None None None None None
Breed of animal Holstein dairy cows
Milk (liter/cow/year) [liter/cow/year] 6792 6792 6792 7410 6785 7410
Milk, fat content, %
Milk, protein content, %
Milk per kg feed-DM [liter milk/kg DM] 1.43 1.43 1.43 1.41 1.43 1.41
Meat (kg Year-animal-1/year) Kg LW meat/LSU/year 10 10 10 10 10 10
Herd size (cows/young stock)h [No cows/young stock] 35 35 35 45 40 45
[No young stock etc.] 0 0 0 0 0 0
LU/animal 1.05 1.05 1.05 1.05 1.05 1.05
LU/ha b) [LU/ha)]b 2.63 2.63 2.63 3.38 3.00 3.38
Livestock manure [kg N /LU /year)]c 64 64 64 76 64 76
Livestock manure applied [kg N /ha /year)]c 169 169 169 256 192 256
DM feed uptake [kg DM/cow] 4745 4745 4745 5272 4745 5272
[kg DM/LU] 4519 4519 4519 5021 4519 5021
N feed uptake [kg N/cow] 106 106 106 121 105 121
[kg N/LU] 100 100 100 115 100 115
Feed % protein/DM 14% 14% 14% 14% 14% 14%
Grazingd 365 365 365 365 365 365
Grazing [% of herd DM-uptake] 31 31 31 58 31 58
Forage crops (%)g,f [% of herd DM-uptake] 31 31 31 14 31 14
Concentrate feed [% of herd DM-uptake] 38 38 38 28 38 28
Grazing area [% of ha] 100 100 100 100 100 100
Conserved rouhage [% of ha] 100 100 43 100 100 100
Plant yield. Gross i) (t DM/ha/year) 13.2 14.3 14.2 18.6 14.9 18.4
Total net yield (sold, grazed and conserved)(t DM/ha/year) 7.9 8.0 7.9 12.6 9.0 12.6
a FYM is the separate system with both solid and liquid manure.
b Livestock units is defines as in Eu 500 kg liveweight. In DK one dairy cow is 1.33 LU=142 kg N excretion/animal/y and 1 heifer is 0.41 LU= 43.3 kg N excretion/animal/y
c Including manure deposited by cattle on grazed areas.
d DN is day and night time grazing, D is daytime grazing, (–) indicates no grazing.
e Grazing or fresh feed inside.
f Crop area in percent of farm area.
g Grass, clover and grain crops for silage; alfalfa for hay.
h. Year-animals = feedingdays/365
i Yield to be harwested or grazed in fields
18
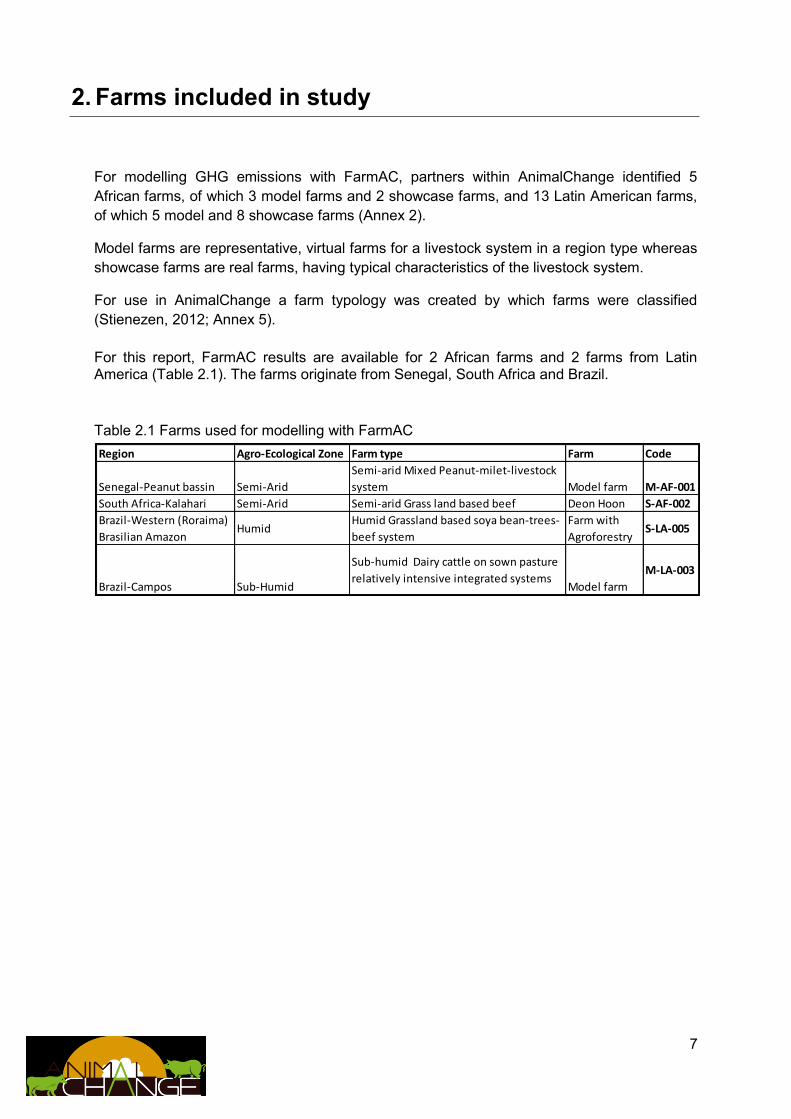
Comment: The N-efficiency in dairy herd is too high. This is due to low crude protein (CP) in
grazed sorghum (12 % CP/DM) and ryegrass (15% CP/DM). Grazing animals will select high
quality leafy material during grazing, and if CP is fixed to 20 % CP then the NEffHerd will
decrease by 17%. If also heifer is included in the dairy herd then NEffHerd will decrease
Table 2. N-balances, [kg N/ha/year]System Conventio
nal
No-
tillage
No-
tillage &
low N
No
tillage,
low N &
top
grazing
No
tillage,
low N &
2 years
rotation
No tillage,
low N,
top graz.
& 2 years
rotation
Farm
Inputs
N in fertiliser 130 130 92 93 94 83
N deposited from atmosphere 22 22 22 22 22 22
N in imported crop products 147 146 147 152 167 152
Total inputs 298 298 261 267 283 257
Outputs
N sold in crop products, incl rouhage export 0 1 0 1 0 2
N sold in milk 94 94 94 132 108 132
N exported in meat 1 1 1 1 1 1
Total outputs 95 96 95 135 109 135
Farm gate balance 203 202 165 132 174 121
NEffFarm 32% 32% 37% 50% 38% 53%
Losses
Total amm-N loss 35 36 28 28 29 26
Total denitrification 44 46 44 52 45 51
Nitrate leaching 113 100 75 16 77 17
Change in mineral N in soil 1 2 2 0 2 1
Change in organic N in soil 10 19 18 55 21 55
Herd Inputs
Rouhage storage N-balance after storage loss 37 37 37 23 42 23
Imported livestock feed, incl rouhage import) 147 146 147 152 167 152
Grazed 80 80 80 215 91 215
Total inputs 264 264 264 390 301 390
Outputs
N sold in milk 94 94 94 132 108 132
N exported in meat 1 1 1 1 1 1
Total outputs 95 95 95 133 109 133
Herd balance 169 169 169 256 192 256
NEffHerd Efficiency of N use by livestock 36% 36% 36% 34% 36% 34%
Field balanceInputs
N in fertiliser 130 130 92 93 94 83
Deposited in field 169 169 169 256 192 256
N deposited from atmosphere 22 22 22 22 22 22
Total inputs 320 320 283 371 308 361
Outputs
Harvested mechanically 44 45 44 28 50 29
Grazed 80 80 80 215 91 215
N sold in crop products, incl rouhage export 0 1 0 1 0 2
Total outputs 124 125 124 243 141 244
Field balance 196 195 159 128 167 117
NEffField 39% 39% 44% 66% 46% 68%
Feed storage
Harvested mechanically 44 45 44 28 50 29
N in imported crop products 147 146 147 152 167 152
N sold in crop products, incl rouhage export 0 1 0 1 0 2
N lost from processing/stored crop products 7 7 7 4 8 4
% loss of input 15% 15% 15% 15% 15% 14%

19
further by 8%. With assumed 20 % CP and heifers the NEffHerd will be as expected 27 %.
Which is still a bit high for grazing herds?
Table 3. The basic-farm: On-farm GHG emission Conventi
onal
No-
tillage
No-
tillage
& low N
No
tillage,
low N &
top
grazing
No
tillage,
low N &
2 years
rotation
No
tillage,
low N,
top graz.
& 2
years
rotationGHG results per farm, kg CO2-eq/yr
1)
CH4 enteric 74953 74953 74953 107076 85661 107076
CH4 manure 0 0 0 0 0 0
N2O manure 0 0 0 0 0 0
N2O field 72398 75718 71632 84985 74531 83319
Soil C changes -6062 -10394 -10163 -30968 -11474 -30364
Total direct GHG 141290 140277 136421 161092 148718 160031
Indirect from NH3-emission 1538 1538 1021 1024 1025 886
N2O-indirect leaching 5554 4906 3674 788 3792 829
Total indirect GHG 7091 6444 4696 1812 4817 1715
GHG, direct + indirect 148381 146721 141117 162904 153535 161746
On farm land, ha 14 14 14 14 14 14
GHG results per ha, kg CO2-eq/yr 1)
CH4 enteric 5354 5354 5354 7648 6119 7648
CH4 manure 0 0 0 0 0 0
N2O manure 0 0 0 0 0 0
N2O field 5171 5408 5117 6070 5324 5951
Soil C changes -433 -742 -726 -2212 -820 -2169
Total GHG per ha 10092 10020 9744 11507 10623 11431
Indirect from NH3-emission 110 110 73 73 73 63
N2O-indirect leaching 397 350 262 56 271 59
Total indirect GHG 507 460 335 129 344 123
GHG, direct + indirect 10599 10480 10080 11636 10967 11553
Adjustment of home-produced feed 27 -38 12 27 25 -3
Output of products
Milk, kg delivered 237707 237707 237707 333432 271386 333432
Meat, ton LW 0 0 0 0 0 0
Crop product 193 1280 193 771 77 1157
Input
Fertlizer, kg N 2) 130 130 92 93 94 83
Fixation 0 0 0 0 0 0
Manure, kg N and type 0 0 0 0 0 0
Feed 3)
- Cereals, kg DM 0 0 0 0 0 0
- Rape seed cake, kg DM 0 0 0 0 0 0
- Rapeseed, kg DM 0 0 0 0 0 0
- Soy bean meal, kg DM 0 0 0 0 0 0
- Other 4563 4563 4563 4693 5214 4693
Diesel, l/ha estimate 0 0 0 0 0 0
Electricity, stable estimate 250 250 250 321 286 321
20
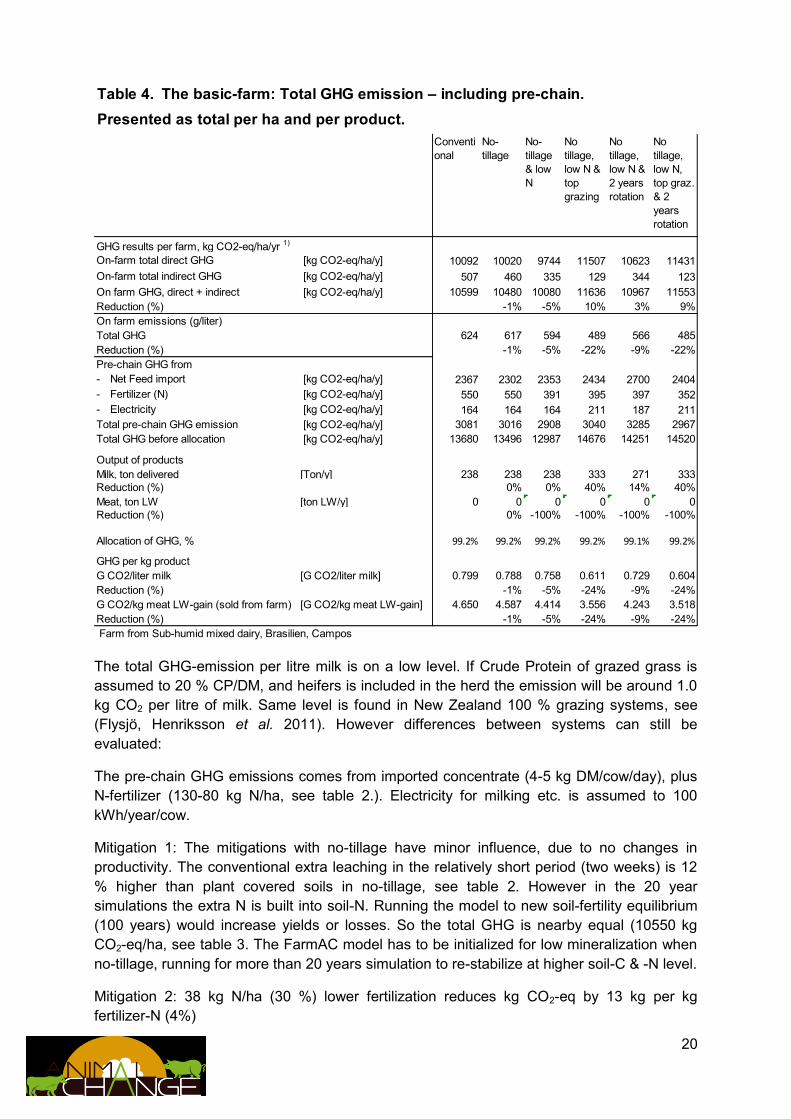
The total GHG-emission per litre milk is on a low level. If Crude Protein of grazed grass is
assumed to 20 % CP/DM, and heifers is included in the herd the emission will be around 1.0
kg CO2 per litre of milk. Same level is found in New Zealand 100 % grazing systems, see
(Flysjö, Henriksson et al. 2011). However differences between systems can still be
evaluated:
The pre-chain GHG emissions comes from imported concentrate (4-5 kg DM/cow/day), plus
N-fertilizer (130-80 kg N/ha, see table 2.). Electricity for milking etc. is assumed to 100
kWh/year/cow.
Mitigation 1: The mitigations with no-tillage have minor influence, due to no changes in
productivity. The conventional extra leaching in the relatively short period (two weeks) is 12
% higher than plant covered soils in no-tillage, see table 2. However in the 20 year
simulations the extra N is built into soil-N. Running the model to new soil-fertility equilibrium
(100 years) would increase yields or losses. So the total GHG is nearby equal (10550 kg
CO2-eq/ha, see table 3. The FarmAC model has to be initialized for low mineralization when
no-tillage, running for more than 20 years simulation to re-stabilize at higher soil-C & -N level.
Mitigation 2: 38 kg N/ha (30 %) lower fertilization reduces kg CO2-eq by 13 kg per kg
fertilizer-N (4%)
Table 4. The basic-farm: Total GHG emission – including pre-chain.
Presented as total per ha and per product.
Conventi
onal
No-
tillage
No-
tillage
& low
N
No
tillage,
low N &
top
grazing
No
tillage,
low N &
2 years
rotation
No
tillage,
low N,
top graz.
& 2
years
rotation
GHG results per farm, kg CO2-eq/ha/yr 1)
On-farm total direct GHG [kg CO2-eq/ha/y] 10092 10020 9744 11507 10623 11431
On-farm total indirect GHG [kg CO2-eq/ha/y] 507 460 335 129 344 123
On farm GHG, direct + indirect [kg CO2-eq/ha/y] 10599 10480 10080 11636 10967 11553
Reduction (%) -1% -5% 10% 3% 9%
On farm emissions (g/liter)
Total GHG 624 617 594 489 566 485
Reduction (%) -1% -5% -22% -9% -22%
Pre-chain GHG from
- Net Feed import [kg CO2-eq/ha/y] 2367 2302 2353 2434 2700 2404
- Fertilizer (N) [kg CO2-eq/ha/y] 550 550 391 395 397 352
- Electricity [kg CO2-eq/ha/y] 164 164 164 211 187 211
Total pre-chain GHG emission [kg CO2-eq/ha/y] 3081 3016 2908 3040 3285 2967
Total GHG before allocation [kg CO2-eq/ha/y] 13680 13496 12987 14676 14251 14520
Output of products
Milk, ton delivered [Ton/y] 238 238 238 333 271 333
Reduction (%) 0% 0% 40% 14% 40%
Meat, ton LW [ton LW/y] 0 0 0 0 0 0
Reduction (%) 0% -100% -100% -100% -100%
Allocation of GHG, % 99.2% 99.2% 99.2% 99.2% 99.1% 99.2%
GHG per kg product
G CO2/liter milk [G CO2/liter milk] 0.799 0.788 0.758 0.611 0.729 0.604
Reduction (%) -1% -5% -24% -9% -24%
G CO2/kg meat LW-gain (sold from farm) [G CO2/kg meat LW-gain] 4.650 4.587 4.414 3.556 4.243 3.518
Reduction (%) -1% -5% -24% -9% -24%
Farm from Sub-humid mixed dairy, Brasilien, Campos

21
Mitigation 3: Top grazing increasing the stocking rate from 2.63 LU/ha to 3 (14%, table 1)
and thereby the direct enteric CH4 production, so GHG-emission per ha was increased by
10%.
3.4 Conclusions LCA calculations
In Table 3.4.1, the effect of different mitigation options on whole chain GHG emissions, pre-chain included, was analyzed on a Brazilian dairy and beef farm, and this total GHG emission was allocated between milk and meat following the allocation method from IDF (2010).
In milk production the most efficient mitigation option was top grazing in combination with No-
tillage, low N (and +/- 2 year rotation) resulting in a 24% reduction per kg milk. This reduction
was also promoted by a 40% increased milk production. No-tillage gave only a 1% reduction,
5% reduction if combined with low N and 9% reduction if no-tillage, low N and 2 year rotation
all were combined.
In beef production, agroforestry only cause a 2% reduction. Whereas, ‘integration of crop and
livestock’ and ‘rotational grazing’ cause 43% and 39% reduction, respectively. This was also
promoted by a 21 and 29% increase in amount of beef produced on the farm. Finally, the
most efficient mitigation option was ‘rotational grazing in combination with N fertilization’,
which cause 68% reduction on total GHG per kg beef and 3,13 times higher production.
Table 3.4.1. Effect of different mitigation options on GHG emissions (relative to basic farm without any mitigation option) – only including on-farm emission
Farm Brazil Brazil
Mixed
Dairy
Beef
Campos Amazone
On farm GHG emission from milk & meat
Mitigation
option
Basic Basic 100 100
M1 No-tillage 99
M2 No-tillage-low N 95
M3 No-tillage-low N-top grazing 110
M4 No-tillage-low N-2 year rotation 103
M5 No-tillage-low N-top grazing-2 year rotation 109
M6 Agroforestry 98
M7 Integration crop-livestock 103
M8 Rotational grazing 105
M9 Rotation grazing + N fertilization 96
Rel. kg CO2/ha
22
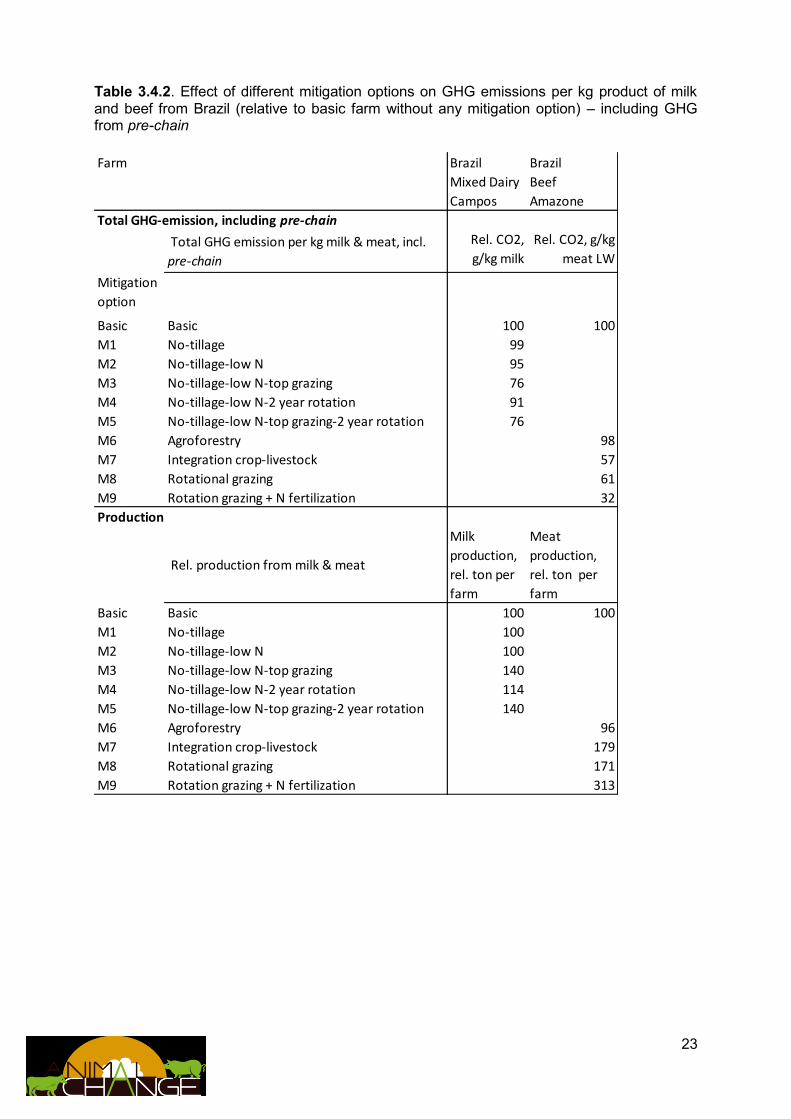
In Table 3.4.2, the effect of the different mitigation options was analyzed when only on-farm
emissions were included and the total on-farm emission was not allocated to the different
products.
In milk production, the small mitigation effect of no-tillage and no-tillage + low N was the
same at farm gate. With these mitigation effects no changes was seen on amount of milk
produced. Whereas, the most efficient mitigation per kg milk produced; ‘Top grazing in
combination with No-tillage, low N and +/- 2 year rotation’ was not a mitigation option looking
at total farm emissions as the 40% increased milk production was not taken into account.
Similar picture was seen for beef production, the small mitigation effect of agroforestry was
the same at farm gate. Whereas, the most efficient mitigation per kg beef produced;
‘integration of crop and livestock’, ‘rotational grazing’ and ‘rotational grazing in combination
with N fertilization’ was not a mitigation option looking at total farm emissions as the huge
increase in beef production caused by these mitigation options was not taken into account.
23
Table 3.4.2. Effect of different mitigation options on GHG emissions per kg product of milk and beef from Brazil (relative to basic farm without any mitigation option) – including GHG from pre-chain
Farm Brazil Brazil
Mixed Dairy Beef
Campos Amazone
Total GHG-emission, including pre-chain
Total GHG emission per kg milk & meat, incl.
pre-chain
Rel. CO2,
g/kg milk
Rel. CO2, g/kg
meat LW
Mitigation
option
Basic Basic 100 100
M1 No-tillage 99
M2 No-tillage-low N 95
M3 No-tillage-low N-top grazing 76
M4 No-tillage-low N-2 year rotation 91
M5 No-tillage-low N-top grazing-2 year rotation 76
M6 Agroforestry 98
M7 Integration crop-livestock 57
M8 Rotational grazing 61
M9 Rotation grazing + N fertilization 32
Production
Rel. production from milk & meat
Milk
production,
rel. ton per
farm
Meat
production,
rel. ton per
farm
Basic Basic 100 100
M1 No-tillage 100
M2 No-tillage-low N 100
M3 No-tillage-low N-top grazing 140
M4 No-tillage-low N-2 year rotation 114
M5 No-tillage-low N-top grazing-2 year rotation 140
M6 Agroforestry 96
M7 Integration crop-livestock 179
M8 Rotational grazing 171
M9 Rotation grazing + N fertilization 313

24
Table 3.4.3. Effect of different mitigation options on total GHG emissions per kg product of
milk and beef from Brazil – including GHG from pre-chain. And the production per ha.
Farm Brazil Brazil
Mixed Dairy Beef
Campos Amazone
Total GHG-emission, including pre-chain
Total GHG emission per kg milk & meat,
incl. pre-chain
CO2, g/kg
milk
CO2, g/kg
meat LW
Mitigatio
n option
Basic Basic 799 42962
M1 No-tillage 788
M2 No-tillage-low N 758
M3 No-tillage-low N-top grazing 611
M4 No-tillage-low N-2 year rotation 729
M5 No-tillage-low N-top grazing-2 year rotation 604
M6 Agroforestry 41897
M7 Integration crop-livestock 24468
M8 Rotational grazing 26381
M9 Rotation grazing + N fertilization 13758
Production
Production per ha from milk & meat
Milk
production,
liter per ha
Meat
production,
kg LW/ha
Basic Basic 16979 148
M1 No-tillage 16979
M2 No-tillage-low N 16979
M3 No-tillage-low N-top grazing 23817
M4 No-tillage-low N-2 year rotation 19385
M5 No-tillage-low N-top grazing-2 year rotation 23817
M6 Agroforestry 141
M7 Integration crop-livestock 265
M8 Rotational grazing 252
M9 Rotation grazing + N fertilization 461

25
4. Mitigation options evaluated across farms, only on
farm emission
A gross list of mitigation and adaptation options was created within AnimalChange (Van den
Pol – van Dasselaar, 2012). From the options on this list the local expert of each farm
selected the five best mitigation options for his farm (Annex 3).
Some of these mitigation options turned out to be so complex that it was not feasible to
calculate the effect of these options on farm GHG emissions with FarmAC. Therefore the
mitigation options chosen and the mitigation options modelled with FarmAC might not match.
The implementation of the mitigation options on the farms depends on the local situation (site
specific). This means that a specific mitigation option can be implemented differently on the
various farms. The mitigation option “fertilisation rate” for example can be implemented as an
increase of N-fertilisation on farm A and as a decrease of N-fertilisation on farm B, or it can
be implemented as a change of N application strategy during the growing season.
By using a generic approach (e.g. reducing N fertilisation by 50 kg) the effect of the
mitigation option “fertilisation rate” could be compared over farms; however, the generic
approach would not have been effective in reducing on farm GHG emissions on all farms.
Therefore we chose to implement the mitigation options for each farm individually.
From four farms a general farm description, an overview of the selected mitigation measures
and the results of the modelling with FarmAC is given in this chapter. These farms are
respectively Humid Equatorial Beef, Sub-humid mixed dairy, Semi-arid mixed livestock
farming and Semi-arid land based livestock farming.
4.1. Humid Equatorial Beef (Amazonia)
4.1.1. General introduction
The showcase Humid Equatorial grass-based Amazonian farm (Fazenda São Paulo; S-LA-
005-Amazon_beef_pasture_after_deforestation) is a representative commercial beef
production farm in the Brazilian Amazon region. The farm is located at coordinates
2o17’40.16” N, 61o14’52.95” W, in areas of colonization of State of Roraima, in northerly part
of the Brazilian Amazon. The São Paulo farm has an area of 488 ha of non-fertilized
Brachiaria brizantha cv Marandu permanent pastures, established after deforestation
occurred around 20 year ago.
Pasture utilization rate was considered to be 1/3 of the forage produced for all the
simulations. This figure is within the range expected for commercial grazing only systems on
tropical pastures in Brazil (Barioni et al., 2005). Forage not grazed was regarded as
incorporated to the soil. No synthetic N fertilizer is applied in the baseline.
The soil is classified as an Argisol with 30% clay and poor natural fertility with pH = 4.2
(water) and P = 1.48 mg/dm3 (Mehlich). Climate is hot and humid. Rainfall is well distributed

26
along the year, totaling slightly above 2000 mm. Annual maximum, minimum and mean
temperatures are, respectively, 32.5, 22.2 and 27.4 °C.
The animals are Zebu (Bos indicus) Nellore breed. Cows produce part of the animals to be
raised. Weaned and 1 yr old males are purchased in the market. Males are castrated at
about 350 kg LW. The steers are slaughtered at about 30 months of age with an average of
500 kg of liveweight. Average male liveweight daily gain is 0.44 kg/day. Average cow milk
production was considered to be 850 kg/lactation (Albertini, 2010) and the average
intercalving interval was 14 months, so average daily milk production was calculated as 2
kg/day. Parameter files were altered accordingly to the lower maintenance requirement of the
zebu animals, according to the Australian Standards (CSIRO, 2007). For the simulation on
FarmAC, the herd was divided into 6 categories with parameters presented in Table 1.
All livestock categories graze along the whole year. Stocking rates were adjusted following
locally observed data. The diet of the animals is composed exclusively by grazed grass and
mineral supplement for all the categories. Feed intake was calibrated so that animal
performance matches observed data. Average year-round composition of feed and
incorporated material is given in Table 2.
Table 1. Number of animals (baseline scenario) and model parameters (for all scenarios).
Category1 # of
animals DM Intake (kg/day)
Avg LW (kg)
Avg LWG (kg/day)
Growth ME Req (MJ/kg)
Weaned calves (1) 142 4.2 160 361 12
1-2 yr old steers (2) 155 6.4 282.5 442 15.5
2-3 yr old steers (3) 139 8.7 440 447 21
1-2 yr old heifers (4) 20 5.6 260 340 15.5
2-3 yr old heifers (5) 20 7.4 390 335 21
3+ yr mature cows (6) 70 7.0 450 27 23
1 The actual FarmAC categories are described in portuguese. The original category names are: (1) Zebus Bezerro desmamado;
(2) Zebu macho 1-2 anos; (3) Zebu macho 2-3 anos; (4) Zebu novilha 1-2 anos; (5) Zebu novilha 2-3 anos; (6) Zebu fêmea
adulta +3 anos
Table 2. Feed and incorporated material composition for all scenarios
Category (portuguese) Diet Incorporated
DM Digestibility 57 -
Digestible Energy 10.5 -
Crude Protein 10 4.7
Fibre (kg/kg DM) 33 41.9
NFE 51 51
Fat 1.5 1.4
Ash 7.5 7.2
4.1.2. Mitigation options
Following a review of mitigation options for Brazil (Neves et al., 2004; Carvalho et al., 2010;
Muniz et al., 2011; Salton et al., 2011; Mora-Calvo, 2012; Torres et al., 2014) and local
knowledge, four mitigation options were tested on the showcase grass-based using FarmAC

27
at the farm level as specified below. Table 3 summarises key data used to run each of the
scenarios in FarmAC.
M1. Agroforestry
M2. Integration crop-livestock
M3. Improved grazing management – rotational grazing
M4. N Fertilisation.
Mitigation 1 (M1): Agroforestry
Well managed agroforestry can be an efficient carbon sink (Neves et al., 2004; Vergutz et al.,
2010; Ramos, 2013; Figueroa, 2014; Loss et al., 2014) and improve animal performance due
to shading (Ainsworth et al., 2012).
This mitigation scenario was built in FarmAC by including 20 ha of Teak (Tectona grandis)
trees besides 97.6 ha a crop-livestock sequence of soybean and Brachiaria. The remaining
370.7 were kept as in the baseline scenario.
Table 3. Selected Inputs for the Baseline and Mitigation Scenarios
Item Baseline M1 M2 M3 M4
Scenario in FarmAC=709357 1 7 3 2 6
Farm size 488 488 488 488 488 Number of animals (excluding suckling calves) 546 526 546 883 1569 Steer slaughter weight, kg/animal 500 500 500 500 500 Steer age at slaughter, months 30 30 30 30 30 Potential grass yield, kg DM/ha 9000 13200 13500 14430 21100 Grass yield, kg DM/ha 8110 11870 12130 12960 18900 N fertiliser, kg N/ha 0 0 0 0 100 Brachiaria area, ha 488 370.4 370.4 488 488 Soybean area, ha 97.6 97.6 Teak area, ha 20 Soybean production kg/ha 0 2800 2800 0 0 Teak production kg/ha 0 5600 0 0 0 M1 = Agroforestry M2 = Integration crop-livestock M3 = Changing the grazing management – grazing rotated M4 = Fertilisation rate
Mitigation 2 (M2): Integration crop-livestock
Studies have shown that well managed integrated crop-livestock systems can increase soil
carbon stocks (Carvalho et al., 2010; Muniz et al., 2011; Salton et al., 2011; Tirloni et al.,
2012; Assad et al., 2013).
This scenario was simulated in FarmAC by including 97.6 ha sequence soybean and
Brachiaria. The remaining 390.7 ha of pastures had the same treatment as the baseline
scenario. Productivity data were collected on the farm in experimental plots.

28
Mitigation 3 (M3): Improved grazing management – Rotational Grazing
Improving grazing management can result in higher pasture productivity and quality and
consequently increase animal performance (Gomide and Gomide, 2001; Andrade, 2003;
Crosson et al., 2006; Barbosa et al., 2007) and higher soil C stocks (Maia et al., 2009;
Carvalho et al., 2010).
In this scenario, the alternate grazing management was replaced by a rotational system. So
higher herbage production and higher stocking rates were input in FarmAC.
Mitigation 4 (M4): Applying N fertiliser
As FarmAC simulations indicated exhaustion of available nitrogen to sustain long-term
productivity of Brachiaria pasture, we have tested the addition of urea fertilization at a rate of
70 kg N/ha in two applications, in the scenario Mitigation 3, as described above.
4.1.3 Results
Tables 4 to 6 show the estimated baseline N fluxes, C fluxes and GHG emissions of the
Amazonian farms for the baseline and mitigation options tested.
Soil carbon is an important source of GHG flows for all the scenarios, representing about 40
to 60 % of the CO2-e emissions for all scenarios except for the fertilized pasture (14 % of the
emissions). It is important to note that the system is not at steady-state for most of the
scenarios. In order to make enough nitrogen available for the informed grass production
enough mineralization of soil organic matter (SOM) is necessary, as N concentration in SOM
is fairly constant as documented in many countries, Taghizadeh-Toosi et al. (2014).
Therefore, grass only pastures without N fertilizer deplete soil N and C after deforestation.
Although soil C loss has been observed in some studies, rates are usually much lower and
several other studies report increase rather than depletion of soil C stocks when native
vegetation is converted to pasture (Guo &Gifford, 2002; Cerri et al., 2003).
Further studies are necessary to elucidate of the mismatch of the FarmAC results in relation
to the literature. Such studies may test one of the following hypothesis: (1) The difference in
soil depth considered for the FarmAC simulations in relation to the literature studies (usually
top 20 or 30 cm; (2) Time span and changes in the soil organic matter degradation rates
along the pasture lifespan; (3) Presence of non-symbiotic N fixation. Except if hypothesis (3)
is true and N fixation is substantial, the unfertilized pastures will degrade in long-term. This is
in accordance to the reports that pasture degradation has been reported as one of the major
problems in livestock production in the Brazilian Amazon and nitrogen fertilization has been
pointed out as one of the main options to recover pasture productivity (Cerri et al. 2005;
Gouvello et al., 2010; Souza Braz et al. 2013). Interestingly, ca. 20 yrs of continuous pasture
management of Brachiaria, legumes are reported to increase in abundance in the vegetation
cover and this coincides with a rapid build-up of soil carbon (Blanfort et al., see
AnimalChange D3.3).
As the diet remained the same, enteric methane was proportional to production for all the
scenarios. Beef productivity was higher in the improved pasture management scenarios, but
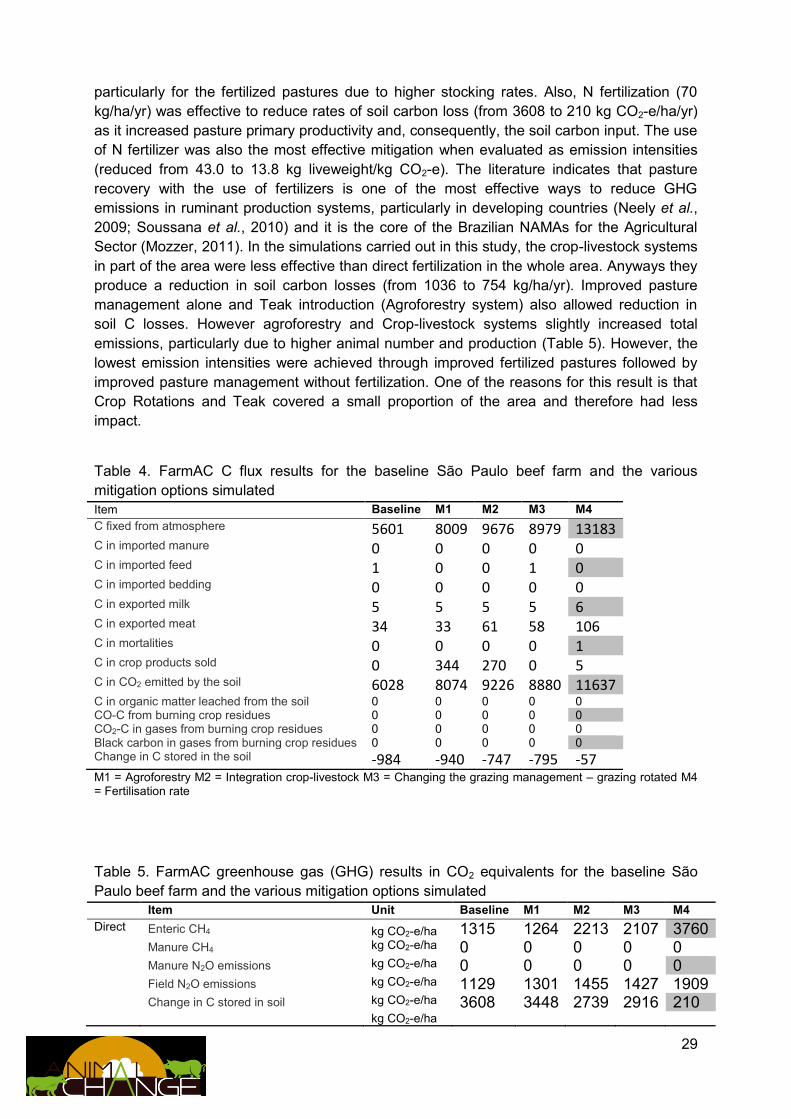
29
particularly for the fertilized pastures due to higher stocking rates. Also, N fertilization (70
kg/ha/yr) was effective to reduce rates of soil carbon loss (from 3608 to 210 kg CO2-e/ha/yr)
as it increased pasture primary productivity and, consequently, the soil carbon input. The use
of N fertilizer was also the most effective mitigation when evaluated as emission intensities
(reduced from 43.0 to 13.8 kg liveweight/kg CO2-e). The literature indicates that pasture
recovery with the use of fertilizers is one of the most effective ways to reduce GHG
emissions in ruminant production systems, particularly in developing countries (Neely et al.,
2009; Soussana et al., 2010) and it is the core of the Brazilian NAMAs for the Agricultural
Sector (Mozzer, 2011). In the simulations carried out in this study, the crop-livestock systems
in part of the area were less effective than direct fertilization in the whole area. Anyways they
produce a reduction in soil carbon losses (from 1036 to 754 kg/ha/yr). Improved pasture
management alone and Teak introduction (Agroforestry system) also allowed reduction in
soil C losses. However agroforestry and Crop-livestock systems slightly increased total
emissions, particularly due to higher animal number and production (Table 5). However, the
lowest emission intensities were achieved through improved fertilized pastures followed by
improved pasture management without fertilization. One of the reasons for this result is that
Crop Rotations and Teak covered a small proportion of the area and therefore had less
impact.
Table 4. FarmAC C flux results for the baseline São Paulo beef farm and the various
mitigation options simulated
Item Baseline M1 M2 M3 M4
C fixed from atmosphere 5601 8009 9676 8979 13183
C in imported manure 0 0 0 0 0
C in imported feed 1 0 0 1 0
C in imported bedding 0 0 0 0 0
C in exported milk 5 5 5 5 6
C in exported meat 34 33 61 58 106
C in mortalities 0 0 0 0 1
C in crop products sold 0 344 270 0 5
C in CO2 emitted by the soil 6028 8074 9226 8880 11637
C in organic matter leached from the soil 0 0 0 0 0 CO-C from burning crop residues 0 0 0 0 0 CO2-C in gases from burning crop residues 0 0 0 0 0 Black carbon in gases from burning crop residues 0 0 0 0 0 Change in C stored in the soil -984 -940 -747 -795 -57
M1 = Agroforestry M2 = Integration crop-livestock M3 = Changing the grazing management – grazing rotated M4 = Fertilisation rate
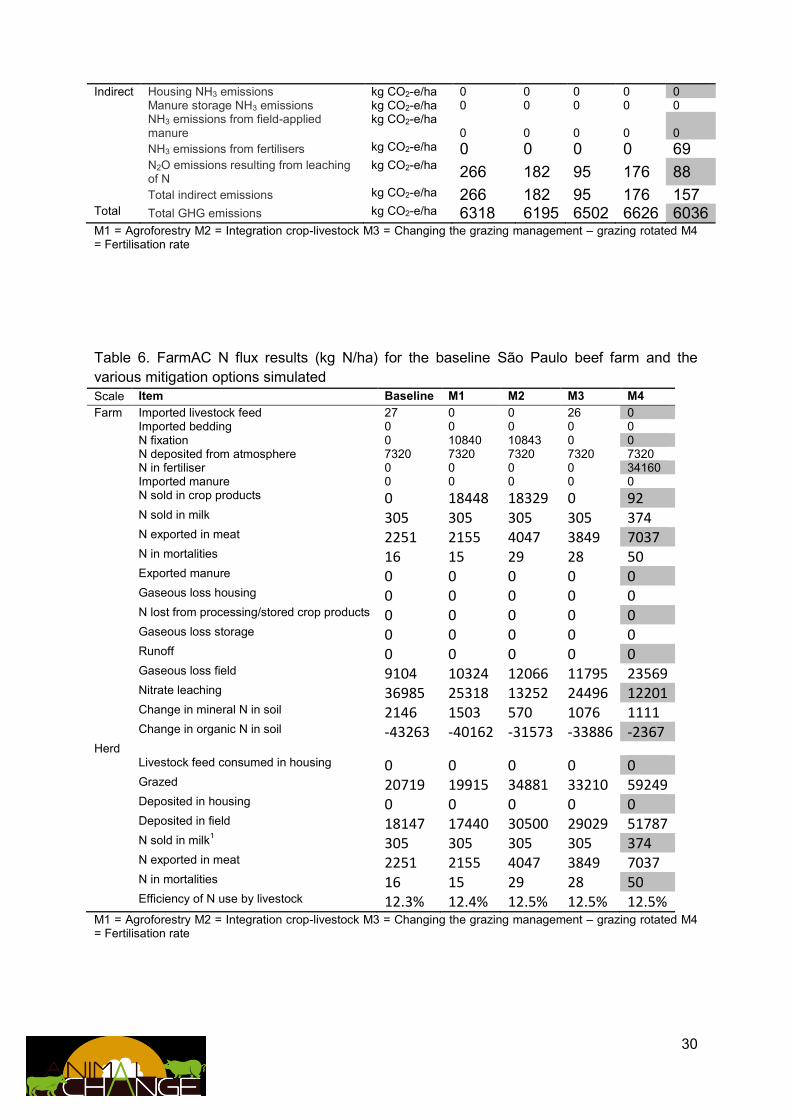
Table 5. FarmAC greenhouse gas (GHG) results in CO2 equivalents for the baseline São
Paulo beef farm and the various mitigation options simulated
Item Unit Baseline M1 M2 M3 M4
Direct Enteric CH4 kg CO2-e/ha 1315 1264 2213 2107 3760
Manure CH4 kg CO2-e/ha 0 0 0 0 0
Manure N2O emissions kg CO2-e/ha 0 0 0 0 0
Field N2O emissions kg CO2-e/ha 1129 1301 1455 1427 1909
Change in C stored in soil kg CO2-e/ha 3608 3448 2739 2916 210
kg CO2-e/ha
30
Indirect Housing NH3 emissions kg CO2-e/ha 0 0 0 0 0 Manure storage NH3 emissions kg CO2-e/ha 0 0 0 0 0 NH3 emissions from field-applied
manure kg CO2-e/ha
0 0 0 0 0 NH3 emissions from fertilisers kg CO2-e/ha 0 0 0 0 69
N2O emissions resulting from leaching of N
kg CO2-e/ha 266 182 95 176 88
Total indirect emissions kg CO2-e/ha 266 182 95 176 157
Total Total GHG emissions kg CO2-e/ha 6318 6195 6502 6626 6036
M1 = Agroforestry M2 = Integration crop-livestock M3 = Changing the grazing management – grazing rotated M4 = Fertilisation rate
Table 6. FarmAC N flux results (kg N/ha) for the baseline São Paulo beef farm and the
various mitigation options simulated
Scale Item Baseline M1 M2 M3 M4
Farm Imported livestock feed 27 0 0 26 0 Imported bedding 0 0 0 0 0 N fixation 0 10840 10843 0 0 N deposited from atmosphere 7320 7320 7320 7320 7320 N in fertiliser 0 0 0 0 34160 Imported manure 0 0 0 0 0 N sold in crop products 0 18448 18329 0 92
N sold in milk 305 305 305 305 374
N exported in meat 2251 2155 4047 3849 7037
N in mortalities 16 15 29 28 50
Exported manure 0 0 0 0 0
Gaseous loss housing 0 0 0 0 0
N lost from processing/stored crop products 0 0 0 0 0
Gaseous loss storage 0 0 0 0 0
Runoff 0 0 0 0 0
Gaseous loss field 9104 10324 12066 11795 23569
Nitrate leaching 36985 25318 13252 24496 12201
Change in mineral N in soil 2146 1503 570 1076 1111
Change in organic N in soil -43263 -40162 -31573 -33886 -2367
Herd Livestock feed consumed in housing 0 0 0 0 0
Grazed 20719 19915 34881 33210 59249
Deposited in housing 0 0 0 0 0
Deposited in field 18147 17440 30500 29029 51787
N sold in milk1 305 305 305 305 374
N exported in meat 2251 2155 4047 3849 7037
N in mortalities 16 15 29 28 50
Efficiency of N use by livestock 12.3% 12.4% 12.5% 12.5% 12.5%
M1 = Agroforestry M2 = Integration crop-livestock M3 = Changing the grazing management – grazing rotated M4 = Fertilisation rate

31
4.1.4 Conclusion
Simulations of the Amazonian farms after deforestation with FarmAC indicate that all the
mitigation options tested were effective in reducing emission intensities. Intensities rank
Baseline > Agroforestry > Improved pasture management > Crop-Livestock > Improved
pasture management and N application. The rank reflects the area covered by agroforestry
as only 20 and 98 out of 488 ha were covered by trees and soybean, respectively.
Emissions per unit of area were similar to baseline within a ± 10% range, indicating
sustainable intensification will reduce emission intensities but may not reduce emissions per
unit of area. Soil carbon was a major component of the mitigation for the mitigation options
tested, usually accounting for over 50% of the emissions, except for the mitigation option
where nitrogen was added.
We conclude that recovering or improving pasture productivity in the whole area would be
more effective than using crop rotation or agroforestry in a small proportion of the area and
that nitrogen input would be essential for long-term sustainability of those systems, allowing
for higher soil carbon stocks than baseline levels.

32
4.2. Sub-humid mixed dairy
4.2.1. General description
This model farm simulate a typical mixed dairy farm from the South part of Brazil, in the state
of Rio Grande do Sul, on the Campos biome (M-LA-003 SubHumid Mixed Dairy – Dairy farm
from South Brazil, Campos). The farm is a typical small family farm (14 ha) as the ones
attended by the Universidade Federal do Rrio Grande do Sul for technical help where native
vegetation have been replaced by cultivated crop and forages around 30 years ago for milk
production. Cows are Holstein type. Position is assumed to be 28°09’00’’ S, 55°10’33’’ O.
Soil has a clay fraction around 0.3 and a sand fraction around 0.3, and no more than 1 m of
root depth. Soil organic C is estimated between 60 and 80 t/ha. Original vegetation was
native permanent grassland with domination of grass and no or very few trees. We simulated
these conditions over 500 years to stabilise soil parameters of the model. We consider
grassland with a maximum potential aboveground production of 20 t/ha/year of DM with a
proportion of belowground production equal to 1.1 of the aboveground total production, no
irrigation and no fertilisation. Atmospheric N deposition is considered around 22 kg
N/ha/year.
Baseline scenario for the farm represents typical farm management in the area. The total
area is divided in two areas of 7 ha each. The subtropical region allows growing two cultures
in rotation per year, one based on C4 species during spring and summer (summer crop or
forage) and one based on C3 species during autumn and winter (winter forages). In the first
7 ha area, the farm grow forage sorghum (Sorgo bicolor, variety for forage: sudangrass)
during summer, a C4 summer grass and a mixed pasture of cultivated Italian ryegrass
(Lolium multiflorum, 50% soil cover) and forage Black oat (Avena strigosa, 50% soil cover)
during winter. Both forages are managed under rotational stocking, with 5-6 grazing rotations
per ½ year for both sorghum and ryegrass/oat. In the second 7 ha area, the farm grow
sorghum for silage (Sorgo bicolor, variety for silage: grain sorghum) during summer with one
cut per year, and the same mixed pasture of ryegrass/oat as in the first area during winter. N
mineral fertilizer is applied at the beginning of spring (october-november, 57 kg N/ha on
forage sorghum and 92 kg N/ha on silage sorghum) and beginning of autumn (march-april,
55 kg N/ha on mixed pasture of ryegrass/oat). Over the one year period, produced yield is
3.1 T/ha for forage sorghum, 7.3 T/ha for sorghum silage and 2.1 T/ha for mixed pasture
ryegrass/oat. Real production for both pastures is higher, but aboveground residual material
is integrated to the soil. There is neither housing nor real manure management.
This system produce 237 707 kg of milk per year with 35 Holstein cows, (i.e. around 6791
kg/cow/year). Cows are highly suplemented with 5 kg DM/animal/day concentrates (bought
externaly) and 4 kg DM/animal/day silage, 100% produced on the farm. Daily intake of forage
was estimated as 4 kg DM/animal/day. See table 1 for nutritional information of the different
feed items. There is no reproduction activity on the farm so heifers are bought externaly.
Mean live weight is 525 kg and mean age 4 years old. This represent a quite simple situation
that was chose as baseline to explore better the mitigation effect of changes in the crop an
grazing management.
33
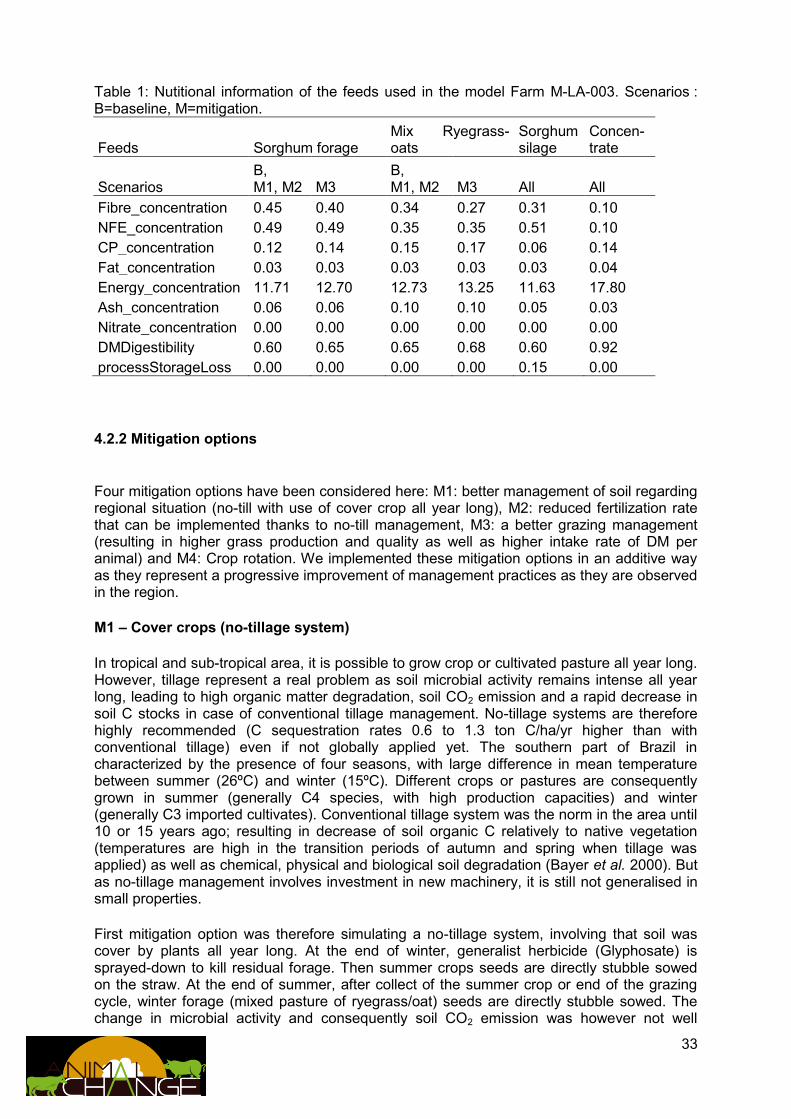
Table 1: Nutitional information of the feeds used in the model Farm M-LA-003. Scenarios : B=baseline, M=mitigation.
Feeds Sorghum forage Mix Ryegrass-oats
Sorghum silage
Concen-trate
Scenarios B, M1, M2 M3
B, M1, M2 M3 All All
Fibre_concentration 0.45 0.40 0.34 0.27 0.31 0.10
NFE_concentration 0.49 0.49 0.35 0.35 0.51 0.10
CP_concentration 0.12 0.14 0.15 0.17 0.06 0.14
Fat_concentration 0.03 0.03 0.03 0.03 0.03 0.04
Energy_concentration 11.71 12.70 12.73 13.25 11.63 17.80
Ash_concentration 0.06 0.06 0.10 0.10 0.05 0.03
Nitrate_concentration 0.00 0.00 0.00 0.00 0.00 0.00
DMDigestibility 0.60 0.65 0.65 0.68 0.60 0.92
processStorageLoss 0.00 0.00 0.00 0.00 0.15 0.00
4.2.2 Mitigation options
Four mitigation options have been considered here: M1: better management of soil regarding regional situation (no-till with use of cover crop all year long), M2: reduced fertilization rate that can be implemented thanks to no-till management, M3: a better grazing management (resulting in higher grass production and quality as well as higher intake rate of DM per animal) and M4: Crop rotation. We implemented these mitigation options in an additive way as they represent a progressive improvement of management practices as they are observed in the region.
M1 – Cover crops (no-tillage system)
In tropical and sub-tropical area, it is possible to grow crop or cultivated pasture all year long. However, tillage represent a real problem as soil microbial activity remains intense all year long, leading to high organic matter degradation, soil CO2 emission and a rapid decrease in soil C stocks in case of conventional tillage management. No-tillage systems are therefore highly recommended (C sequestration rates 0.6 to 1.3 ton C/ha/yr higher than with conventional tillage) even if not globally applied yet. The southern part of Brazil in characterized by the presence of four seasons, with large difference in mean temperature between summer (26ºC) and winter (15ºC). Different crops or pastures are consequently grown in summer (generally C4 species, with high production capacities) and winter (generally C3 imported cultivates). Conventional tillage system was the norm in the area until 10 or 15 years ago; resulting in decrease of soil organic C relatively to native vegetation (temperatures are high in the transition periods of autumn and spring when tillage was applied) as well as chemical, physical and biological soil degradation (Bayer et al. 2000). But as no-tillage management involves investment in new machinery, it is still not generalised in small properties.
First mitigation option was therefore simulating a no-tillage system, involving that soil was cover by plants all year long. At the end of winter, generalist herbicide (Glyphosate) is sprayed-down to kill residual forage. Then summer crops seeds are directly stubble sowed on the straw. At the end of summer, after collect of the summer crop or end of the grazing cycle, winter forage (mixed pasture of ryegrass/oat) seeds are directly stubble sowed. The change in microbial activity and consequently soil CO2 emission was however not well
34
simulated in the present version of the model and would need further work. Primary production of the different cultivates was maintained equal to the baseline scenario, as well as the constitution of the animal daily diet.
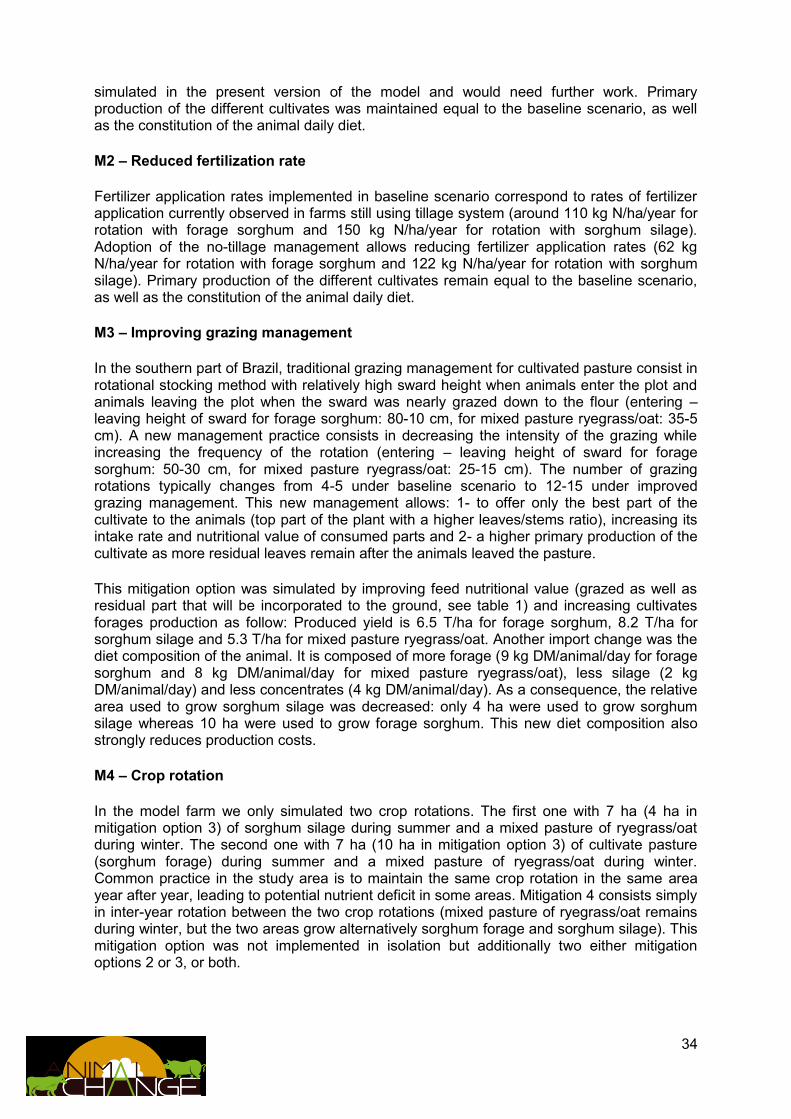
M2 – Reduced fertilization rate
Fertilizer application rates implemented in baseline scenario correspond to rates of fertilizer application currently observed in farms still using tillage system (around 110 kg N/ha/year for rotation with forage sorghum and 150 kg N/ha/year for rotation with sorghum silage). Adoption of the no-tillage management allows reducing fertilizer application rates (62 kg N/ha/year for rotation with forage sorghum and 122 kg N/ha/year for rotation with sorghum silage). Primary production of the different cultivates remain equal to the baseline scenario, as well as the constitution of the animal daily diet.
M3 – Improving grazing management
In the southern part of Brazil, traditional grazing management for cultivated pasture consist in rotational stocking method with relatively high sward height when animals enter the plot and animals leaving the plot when the sward was nearly grazed down to the flour (entering – leaving height of sward for forage sorghum: 80-10 cm, for mixed pasture ryegrass/oat: 35-5 cm). A new management practice consists in decreasing the intensity of the grazing while increasing the frequency of the rotation (entering – leaving height of sward for forage sorghum: 50-30 cm, for mixed pasture ryegrass/oat: 25-15 cm). The number of grazing rotations typically changes from 4-5 under baseline scenario to 12-15 under improved grazing management. This new management allows: 1- to offer only the best part of the cultivate to the animals (top part of the plant with a higher leaves/stems ratio), increasing its intake rate and nutritional value of consumed parts and 2- a higher primary production of the cultivate as more residual leaves remain after the animals leaved the pasture.
This mitigation option was simulated by improving feed nutritional value (grazed as well as residual part that will be incorporated to the ground, see table 1) and increasing cultivates forages production as follow: Produced yield is 6.5 T/ha for forage sorghum, 8.2 T/ha for sorghum silage and 5.3 T/ha for mixed pasture ryegrass/oat. Another import change was the diet composition of the animal. It is composed of more forage (9 kg DM/animal/day for forage sorghum and 8 kg DM/animal/day for mixed pasture ryegrass/oat), less silage (2 kg DM/animal/day) and less concentrates (4 kg DM/animal/day). As a consequence, the relative area used to grow sorghum silage was decreased: only 4 ha were used to grow sorghum silage whereas 10 ha were used to grow forage sorghum. This new diet composition also strongly reduces production costs.
M4 – Crop rotation
In the model farm we only simulated two crop rotations. The first one with 7 ha (4 ha in mitigation option 3) of sorghum silage during summer and a mixed pasture of ryegrass/oat during winter. The second one with 7 ha (10 ha in mitigation option 3) of cultivate pasture (sorghum forage) during summer and a mixed pasture of ryegrass/oat during winter. Common practice in the study area is to maintain the same crop rotation in the same area year after year, leading to potential nutrient deficit in some areas. Mitigation 4 consists simply in inter-year rotation between the two crop rotations (mixed pasture of ryegrass/oat remains during winter, but the two areas grow alternatively sorghum forage and sorghum silage). This mitigation option was not implemented in isolation but additionally two either mitigation options 2 or 3, or both.
35
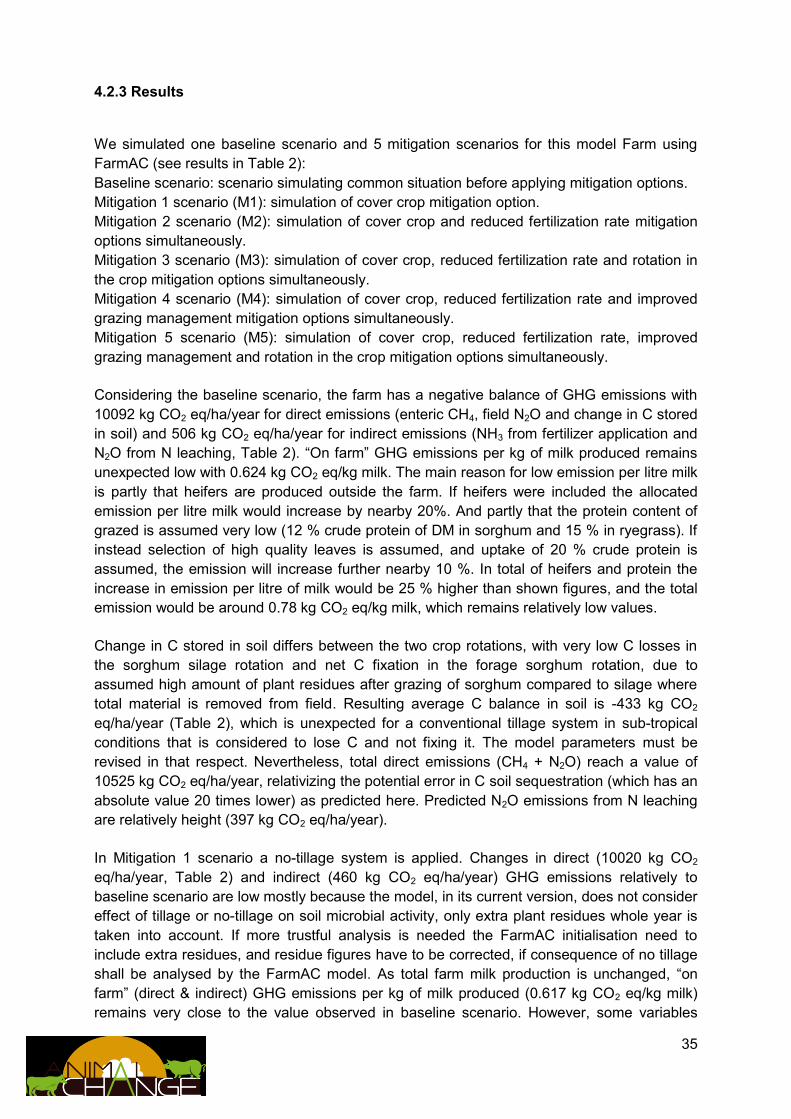
4.2.3 Results
We simulated one baseline scenario and 5 mitigation scenarios for this model Farm using
FarmAC (see results in Table 2):
Baseline scenario: scenario simulating common situation before applying mitigation options.
Mitigation 1 scenario (M1): simulation of cover crop mitigation option.
Mitigation 2 scenario (M2): simulation of cover crop and reduced fertilization rate mitigation
options simultaneously.
Mitigation 3 scenario (M3): simulation of cover crop, reduced fertilization rate and rotation in
the crop mitigation options simultaneously.
Mitigation 4 scenario (M4): simulation of cover crop, reduced fertilization rate and improved
grazing management mitigation options simultaneously.
Mitigation 5 scenario (M5): simulation of cover crop, reduced fertilization rate, improved
grazing management and rotation in the crop mitigation options simultaneously.
Considering the baseline scenario, the farm has a negative balance of GHG emissions with
10092 kg CO2 eq/ha/year for direct emissions (enteric CH4, field N2O and change in C stored
in soil) and 506 kg CO2 eq/ha/year for indirect emissions (NH3 from fertilizer application and
N2O from N leaching, Table 2). “On farm” GHG emissions per kg of milk produced remains
unexpected low with 0.624 kg CO2 eq/kg milk. The main reason for low emission per litre milk
is partly that heifers are produced outside the farm. If heifers were included the allocated
emission per litre milk would increase by nearby 20%. And partly that the protein content of
grazed is assumed very low (12 % crude protein of DM in sorghum and 15 % in ryegrass). If
instead selection of high quality leaves is assumed, and uptake of 20 % crude protein is
assumed, the emission will increase further nearby 10 %. In total of heifers and protein the
increase in emission per litre of milk would be 25 % higher than shown figures, and the total
emission would be around 0.78 kg CO2 eq/kg milk, which remains relatively low values.
Change in C stored in soil differs between the two crop rotations, with very low C losses in
the sorghum silage rotation and net C fixation in the forage sorghum rotation, due to
assumed high amount of plant residues after grazing of sorghum compared to silage where
total material is removed from field. Resulting average C balance in soil is -433 kg CO2
eq/ha/year (Table 2), which is unexpected for a conventional tillage system in sub-tropical
conditions that is considered to lose C and not fixing it. The model parameters must be
revised in that respect. Nevertheless, total direct emissions (CH4 + N2O) reach a value of
10525 kg CO2 eq/ha/year, relativizing the potential error in C soil sequestration (which has an
absolute value 20 times lower) as predicted here. Predicted N2O emissions from N leaching
are relatively height (397 kg CO2 eq/ha/year).
In Mitigation 1 scenario a no-tillage system is applied. Changes in direct (10020 kg CO2
eq/ha/year, Table 2) and indirect (460 kg CO2 eq/ha/year) GHG emissions relatively to
baseline scenario are low mostly because the model, in its current version, does not consider
effect of tillage or no-tillage on soil microbial activity, only extra plant residues whole year is
taken into account. If more trustful analysis is needed the FarmAC initialisation need to
include extra residues, and residue figures have to be corrected, if consequence of no tillage
shall be analysed by the FarmAC model. As total farm milk production is unchanged, “on
farm” (direct & indirect) GHG emissions per kg of milk produced (0.617 kg CO2 eq/kg milk)
remains very close to the value observed in baseline scenario. However, some variables
36
change significantly relatively to the baseline scenarios, mostly because of the longer time
with cover crop in Mitigation 1 scenario. Soil C sequestration increases from -433 to -742 kg
CO2 eq/ha/year, due to extra input of plant residues (Table 2, “change in C stored in soil”) as
does field N2O emissions (from 5171 to 5408 kg CO2 eq/ha/year), whereas N2O emissions
from leaching of N decrease decreases a little (from 397 to 350 kg CO2 eq/ha/year).
In Mitigation 2 scenario we reduced fertilization rate as well as applying a no-till system,
without affecting production yield used for animal feeding (small changes in primary
production reflected in changes in incorporated residual material). For the present FarmAC
initialisation, this situation is close to critical N-deficiencies (mineralization is too low for the
assumed yields). Total farm milk production was not affected (23707.5 kg milk/year), nor was
total enteric CH4 emissions (5353.8 kg CO2 eq/ha/year, Table 2) relatively to baseline and
mitigation 1 scenarios. On the other hand, field N2O emissions came back close to their
value of baseline scenario (5116 kg CO2 eq/ha/year), average soil C sequestration remains
around its value from mitigation 1 scenario (-726 kg CO2 eq/ha/year, mostly due to forage
sorghum crop rotation as soil C remained nearly constant in the sorghum silage rotation) and
NH3 emissions from fertilizers (73 kg CO2 eq/ha/year) and N2O emissions from leaching of N
(262 kg CO2 eq/ha/year) decreased relatively to baseline and mitigation 1 scenarios, due to
reduced N-fertilization. The result was a reduction of both direct (9744 kg CO2 eq/ha/year,
Table 2) and indirect (335 kg CO2 eq/ha/year) GHG emissions relatively to baseline scenario
(a reduction of 5% in total GHG emissions), as well as in “on farm” (direct & indirect) GHG
emissions per kg of milk produced (0.593 kg CO2 eq/kg milk).
Mitigation 3 scenario repeated the parameters of mitigation 2 scenario adding an inter-year
rotation between the two crop rotations (the two areas grow alternatively sorghum forage and
sorghum silage during summer). This resulted in better efficiency in the use of nutrients (from
fertilizer and from plant residuals integrated to the soil) allowing higher assumed yield in
forages (3.7 T/ha for forage sorghum and 2.3 T/ha for mixed pasture ryegrass/oat) and silage
(8.2 T/ha) and so the capacity for the farm to increase the number of dairy cows (from 35 to
40 animals). First consequence was an increase in enteric methane emission (6118 kg CO2
eq/ha/year, Table 2) and total milk production (271386 kg/year, a 14% increase), both in
direct proportion to the number of animals. This time, changes in C stored in soil were equal
between the two crop rotations (as expected) with total soil C stored values higher than in
baseline and mitigation 2 scenarios (-820 kg CO2 eq/ha/year). Field N2O emissions increased
(5324 kg CO2 eq/ha/year) relatively to baseline scenario because of higher quantities of plant
residues, whereas NH3 emissions from fertilizers and N2O emissions from leaching of N
remained very similar to the value predicted in mitigation 2 scenario (lower than in baseline
scenario). Resulting balance for total GHG emissions (direct and indirect) was 10967 kg CO2
eq/ha/year, an increase of 3.5% relatively to baseline scenario. But as milk production
increased at the same time, “on farm” GHG emissions per kg of milk produced decreased
from 0.624 to 0.566 kg CO2 eq/kg milk.
Mitigation 4 scenario involved a strong change in grazing management resulting in significant
increases of primary production and nutritional value of the forages consumed by the
animals. As a result, it was possible to increase the number of dairy cows (from 35 to 45
animals) as well as milk production per head (from 6791 to 7409 kg/cow/year, Table 2).
Other results were an increase in enteric methane emission (7648 kg CO2 eq/ha/year) and
field N2O emissions (6558 kg CO2 eq/ha/year) relatively to baseline scenario because of,
respectively, a higher number of animals and higher quantities of plant residues. On the

37
other hand, NH3 emissions from fertilizers (73 kg CO2 eq/ha/year) and N2O emissions from
leaching of N (53 kg CO2 eq/ha/year) where strongly reduced, when the higher plant protein
yield was used by animals, and not incorporated in soil and then leached. Resulting balance
for total GHG emissions (direct and indirect) was 12159 kg CO2 eq/ha/year, an increase of
15% relatively to baseline scenario, mostly due to higher enteric methane and field N2O
emissions. But “on farm” GHG emissions per kg of milk produced were reduced to 0.510 kg
CO2 eq/kg milk (18% reduction), primarily due to 10 % higher milk production and higher
protein in feed uptake.
Mitigation 5 scenario was very similar to mitigation 4 scenario. Inter-year rotation between
the two crop rotations did not result in large changes in GHG emissions, mostly because the
system in mitigation 4 scenario was already well efficient. Changes in C stored in soil
(fixation) were equal between the two crop rotations, which can be view as a positive result.
Total methane emission and total farm milk production were equal to mitigation 4 scenario.
Field N2O emissions and NH3 emissions from fertilizers were only marginally reduced (Table
2). “On farm” GHG emissions per kg of milk produced were 0.506 kg CO2 eq/kg milk.
4.3.2 Conclusion
Simulation of South Brazilian (Campos) small family farms with FarmAC gave good results
regarding GHG balance even if different processes as soil emissions in sub-tropical area,
incorporation of residual material or no-tillage systems will have to be better estimated. Two
different families of mitigation options were simulated: first, mitigation options that consist in
improving soil conservation and nutrient use in the system (cover crop, reduced fertilization
rate and rotation of the crop). Such mitigation options result in direct reduction of GHG
emissions (however not higher than 5% reduction) in the farm system, mostly through
reducing N leaching and increasing soil C sequestration. Secondly, mitigation options that
consist in improving pasture and grazing management and so milk production per ha
(increase of 40%). Such mitigation option increased direct emissions such as enteric CH4
emissions and soil N2O emissions (increase of nearly 35%), but these increases are partially
balanced by higher soil C sequestration (up to 5 times more C sequestration, due to higher
plant residues) and reduced N emissions from fertilizers application and leaching (up to 75%
reduction). At the end, combining the different mitigation options resulted in an increase of
14% of total “on farm” GHG emission but a reduction of 19% in production efficiency (kg CO2
eq emission per kg milk produced).
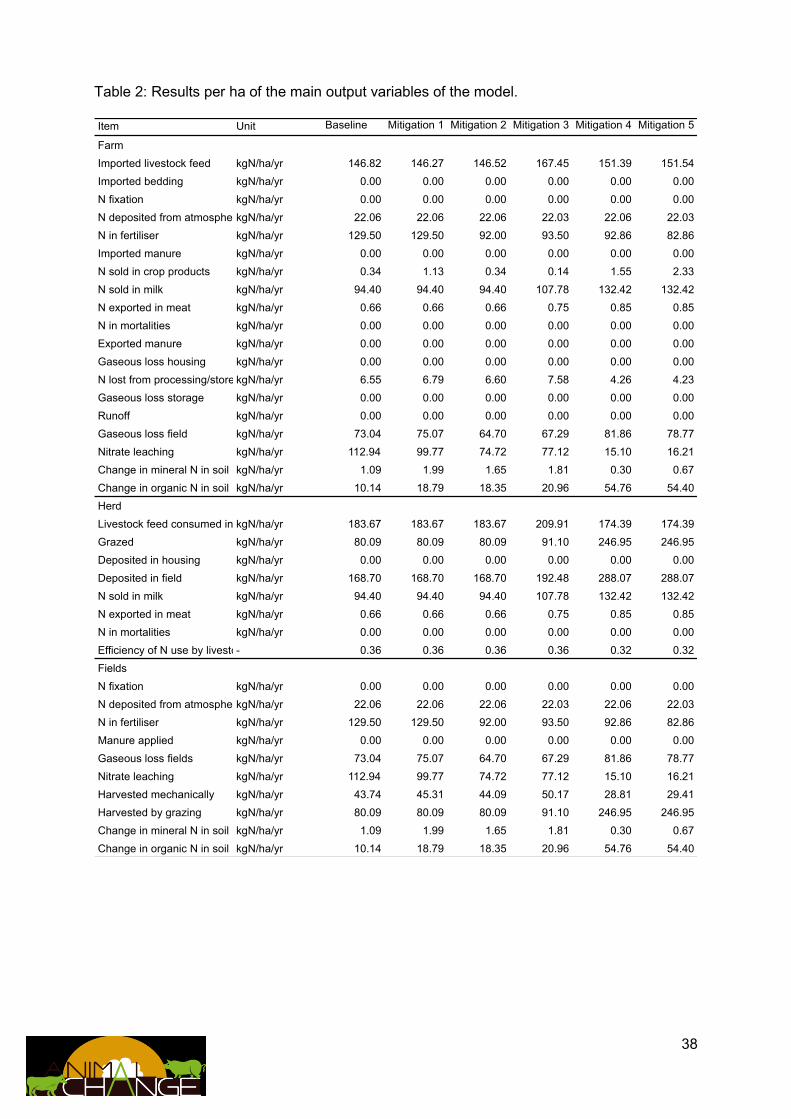
38
Table 2: Results per ha of the main output variables of the model.
Item Unit Baseline Mitigation 1 Mitigation 2 Mitigation 3 Mitigation 4 Mitigation 5
Farm
Imported livestock feed kgN/ha/yr 146.82 146.27 146.52 167.45 151.39 151.54
Imported bedding kgN/ha/yr 0.00 0.00 0.00 0.00 0.00 0.00
N fixation kgN/ha/yr 0.00 0.00 0.00 0.00 0.00 0.00
N deposited from atmospherekgN/ha/yr 22.06 22.06 22.06 22.03 22.06 22.03
N in fertiliser kgN/ha/yr 129.50 129.50 92.00 93.50 92.86 82.86
Imported manure kgN/ha/yr 0.00 0.00 0.00 0.00 0.00 0.00
N sold in crop products kgN/ha/yr 0.34 1.13 0.34 0.14 1.55 2.33
N sold in milk kgN/ha/yr 94.40 94.40 94.40 107.78 132.42 132.42
N exported in meat kgN/ha/yr 0.66 0.66 0.66 0.75 0.85 0.85
N in mortalities kgN/ha/yr 0.00 0.00 0.00 0.00 0.00 0.00
Exported manure kgN/ha/yr 0.00 0.00 0.00 0.00 0.00 0.00
Gaseous loss housing kgN/ha/yr 0.00 0.00 0.00 0.00 0.00 0.00
N lost from processing/stored crop productskgN/ha/yr 6.55 6.79 6.60 7.58 4.26 4.23
Gaseous loss storage kgN/ha/yr 0.00 0.00 0.00 0.00 0.00 0.00
Runoff kgN/ha/yr 0.00 0.00 0.00 0.00 0.00 0.00
Gaseous loss field kgN/ha/yr 73.04 75.07 64.70 67.29 81.86 78.77
Nitrate leaching kgN/ha/yr 112.94 99.77 74.72 77.12 15.10 16.21
Change in mineral N in soil kgN/ha/yr 1.09 1.99 1.65 1.81 0.30 0.67
Change in organic N in soil kgN/ha/yr 10.14 18.79 18.35 20.96 54.76 54.40
Herd
Livestock feed consumed in housingkgN/ha/yr 183.67 183.67 183.67 209.91 174.39 174.39
Grazed kgN/ha/yr 80.09 80.09 80.09 91.10 246.95 246.95
Deposited in housing kgN/ha/yr 0.00 0.00 0.00 0.00 0.00 0.00
Deposited in field kgN/ha/yr 168.70 168.70 168.70 192.48 288.07 288.07
N sold in milk kgN/ha/yr 94.40 94.40 94.40 107.78 132.42 132.42
N exported in meat kgN/ha/yr 0.66 0.66 0.66 0.75 0.85 0.85
N in mortalities kgN/ha/yr 0.00 0.00 0.00 0.00 0.00 0.00
Efficiency of N use by livestock- 0.36 0.36 0.36 0.36 0.32 0.32
Fields
N fixation kgN/ha/yr 0.00 0.00 0.00 0.00 0.00 0.00
N deposited from atmospherekgN/ha/yr 22.06 22.06 22.06 22.03 22.06 22.03
N in fertiliser kgN/ha/yr 129.50 129.50 92.00 93.50 92.86 82.86
Manure applied kgN/ha/yr 0.00 0.00 0.00 0.00 0.00 0.00
Gaseous loss fields kgN/ha/yr 73.04 75.07 64.70 67.29 81.86 78.77
Nitrate leaching kgN/ha/yr 112.94 99.77 74.72 77.12 15.10 16.21
Harvested mechanically kgN/ha/yr 43.74 45.31 44.09 50.17 28.81 29.41
Harvested by grazing kgN/ha/yr 80.09 80.09 80.09 91.10 246.95 246.95
Change in mineral N in soil kgN/ha/yr 1.09 1.99 1.65 1.81 0.30 0.67
Change in organic N in soil kgN/ha/yr 10.14 18.79 18.35 20.96 54.76 54.40

39
Table 2 continued.
Item Unit Baseline Mitigation 1 Mitigation 2 Mitigation 3 Mitigation 4 Mitigation 5
C Balance
C fixed from atmosphere kg C/ha/yr 10782.78 11670.68 11577.09 12083.83 15359.54 15181.97
C in imported manure kg C/ha/yr 0.00 0.00 0.00 0.00 0.00 0.00
C in imported feed kg C/ha/yr 2065.06 2041.96 2052.57 2341.57 2119.70 2125.90
C in bedding kg C/ha/yr 0.00 0.00 0.00 0.00 0.00 0.00
C in exported milk kg C/ha/yr 848.96 848.96 848.96 969.24 1190.83 1190.83
C in exported meat kg C/ha/yr 5.80 5.80 5.80 6.63 7.46 7.46
C in mortalities kg C/ha/yr 0.00 0.00 0.00 0.00 0.00 0.00
C in crop products sold kg C/ha/yr 5.92 39.31 5.92 2.37 23.68 35.52
C in CO2 emitted by the soil kg C/ha/yr 8944.84 9681.92 9644.57 9877.11 12389.50 12393.67
C in organic matter leached from the soilkg C/ha/yr 0.00 0.00 0.00 0.00 0.00 0.00
CO-C from burning crop residueskg C/ha/yr 0.00 0.00 0.00 0.00 0.00 0.00
CO2-C in gases from burning crop residueskg C/ha/yr 0.00 0.00 0.00 0.00 0.00 0.00
Black carbon in gases from burning crop residueskg C/ha/yr 0.00 0.00 0.00 0.00 0.00 0.00
Change in C stored in the soilkg C/ha/yr 118.07 202.46 197.97 223.49 592.86 584.95
Net C balance (should be about zero)kg C/ha/yr 0.00 0.00 0.00 0.00 -415.23 -593.60
N Balance
N in imported manure kg N/ha/yr 0.00 0.00 0.00 0.00 0.00 0.00
N fixation kg N/ha/yr 0.00 0.00 0.00 0.00 0.00 0.00
N deposited from atmospherekg N/ha/yr 22.06 22.06 22.06 22.03 22.06 22.03
N in fertiliser kg N/ha/yr 129.50 129.50 92.00 93.50 92.86 82.86
N in bedding kg N/ha/yr 0.00 0.00 0.00 0.00 0.00 0.00
N in imported crop products kg N/ha/yr 146.82 146.27 146.52 167.45 151.39 151.54
N lost from processing/stored crop productskg N/ha/yr 6.55 6.79 6.60 7.58 4.26 4.23
N sold in crop products kg N/ha/yr 0.34 1.13 0.34 0.14 1.55 2.33
N sold in milk kg N/ha/yr 94.40 94.40 94.40 107.78 132.42 132.42
N exported in meat kg N/ha/yr 0.66 0.66 0.66 0.75 0.85 0.85
N in mortalities kg N/ha/yr 0.00 0.00 0.00 0.00 0.00 0.00
N in exported manure kg N/ha/yr 0.00 0.00 0.00 0.00 0.00 0.00
Total amount of N exported kg N/ha/yr 95.41 96.20 95.41 108.67 134.82 135.60
N lost in NH3 emission from housingkg N/ha/yr 0.00 0.00 0.00 0.00 0.00 0.00
N lost in N2 emission from manure storagekg N/ha/yr 0.00 0.00 0.00 0.00 0.00 0.00
N lost in N2O emission from manure storagekg N/ha/yr 0.00 0.00 0.00 0.00 0.00 0.00
N lost in NH3 emission from manure storagekg N/ha/yr 0.00 0.00 0.00 0.00 0.00 0.00
N lost in runoff from manure storagekg N/ha/yr 0.00 0.00 0.00 0.00 0.00 0.00
Emission of N2 from the fieldkg N/ha/yr 33.13 34.65 32.78 34.10 42.01 41.27
Emission of N2O from the fieldkg N/ha/yr 11.04 11.55 10.93 11.37 14.00 13.76
N lost via NH3 emission from fertiliserskg N/ha/yr 23.46 23.46 15.58 15.64 15.61 13.51
N lost as NH3 from field-applied manurekg N/ha/yr 0.00 0.00 0.00 0.00 0.00 0.00
N lost in NH3 emission from urine deposited in fieldkg N/ha/yr 5.42 5.42 5.42 6.18 10.22 10.22
N lost via NO3 leaching from soilkg N/ha/yr 112.94 99.77 74.72 77.12 15.10 16.21
N lost via leaching of organic N from soilkg N/ha/yr 0.00 0.00 0.00 0.00 0.00 0.00
N2O in gases from burning crop residueskg N/ha/yr 0.00 0.00 0.00 0.00 0.00 0.00
NH3 in gases from burning crop residueskg N/ha/yr 0.00 0.00 0.00 0.00 0.00 0.00
NOx in gases from burning crop residueskg N/ha/yr 0.00 0.00 0.00 0.00 0.00 0.00
N in other gases from burning crop residueskg N/ha/yr 0.00 0.00 0.00 0.00 0.00 0.00

40
Table 2 continued.
Item Unit Baseline Mitigation 1 Mitigation 2 Mitigation 3 Mitigation 4 Mitigation 5
Change in N stored in soil kg N/ha/yr 10.14 18.79 18.35 20.96 54.76 54.40
Change in N stored in mineral form in soilkg N/ha/yr 1.09 1.99 1.65 1.81 0.30 0.67
N surplus kg N/ha/yr 202.97 201.64 165.18 174.31 131.48 120.82
N excreted in housing kg N/ha/yr 0.00 0.00 0.00 0.00 0.00 0.00
N excreted in field kg N/ha/yr 168.70 168.70 168.70 192.48 288.07 288.07
N in grazed feed kg N/ha/yr 80.09 80.09 80.09 91.10 246.95 246.95
DM in grazed feed kg N/ha/yr 3650.00 3650.00 3650.00 4171.43 9907.14 9907.14
N fed in housing kg N/ha/yr 183.67 183.67 183.67 209.91 174.39 174.39
Total N losses from product storage, housing and manure storagekg N/ha/yr 6.55 6.79 6.60 7.58 4.26 4.23
Total N losses from fields kg N/ha/yr 192.54 181.62 146.03 151.99 101.21 99.21
Change in N stored in organic and mineral form in soilkg N/ha/yr 11.23 20.78 19.99 22.77 55.06 55.07
N balance (should be about zero)kg N/ha/yr -0.79 -0.76 -0.84 -0.45 -24.78 -33.46
FarmDirectGHG
Enteric methane emissions kg CO2 eq/ha/yr 5353.79 5353.79 5353.79 6118.62 7648.27 7648.27
Manure methane emissions kg CO2 eq/ha/yr 0.00 0.00 0.00 0.00 0.00 0.00
Manure N2O emissions kg CO2 eq/ha/yr 0.00 0.00 0.00 0.00 0.00 0.00
Field N2O emissions kg CO2 eq/ha/yr 5171.31 5408.40 5116.56 5323.61 6558.29 6442.92
Change in C stored in soil kg CO2 eq/ha/yr -432.98 -742.40 -725.96 -819.54 -2174.03 -2145.00
Total GHG emissions kg CO2 eq/ha/yr 10092.12 10019.79 9744.39 10622.70 12032.53 11946.20
FarmIndirectGHG
Housing NH3 emissions kg CO2 eq/ha/yr 0.00 0.00 0.00 0.00 0.00 0.00
Manure storage NH3 emissionskg CO2 eq/ha/yr 0.00 0.00 0.00 0.00 0.00 0.00
NH3 emissions from field-applied manurekg CO2 eq/ha/yr 0.00 0.00 0.00 0.00 0.00 0.00
NH3 emissions from fertiliserskg CO2 eq/ha/yr 109.84 109.84 72.96 73.24 73.12 63.29
N2O emissions resulting from leaching of Nkg CO2 eq/ha/yr 396.68 350.41 262.44 270.85 53.02 56.94
Total indirect emissions kg CO2 eq/ha/yr 506.52 460.25 335.40 344.10 126.14 120.22
Indicators
Total farm milk production kg/yr 237707.5 237707.5 237707.5 271386.2 333432.0 333432.0
Total farm meat production T liveweight/yr 0.35 0.35 0.35 0.40 0.45 0.45
Farm milk production per headkg/yr 6791.64 6791.64 6791.64 6784.65 7409.60 7409.60
Milk production per unit areakg/ha/yr 16979.10 16979.10 16979.10 19384.73 23816.57 23816.57
Meat production per unit areakg/yr 0.03 0.03 0.03 0.03 0.03 0.03
LivestockDMintake kg DM/yr 166.08 166.08 166.08 189.80 237.25 237.25
farmConcentrateDM tonnes DM/yr 0.00 0.00 0.00 0.00 0.00 0.00
farmGrazedDM tonnes/yr 51.10 51.10 51.10 58.40 138.70 138.70
farmUnutilisedGrazableDM tonnes DM/yr 17.94 25.33 25.30 18.56 0.49 0.18
farmUnutilisedGrazableDMPercentPercent 25.99 33.14 33.11 24.11 0.36 0.13
farmDMproduction tonnes DM/yr 184.78 200.34 198.62 207.96 258.66 256.53
farmUtilisedDM tonnes/yr 110.35 112.48 110.82 126.68 177.29 177.46
FarmHarvestedDM tonnes/yr 110347.3 112476.0 110818.0 126684.7 177291.5 177457.8
roughageDMimported tonnes/yr 0.00 0.00 0.00 0.00 0.00 0.00
roughageDMExported tonnes/yr 0.00 0.00 0.00 0.00 0.00 0.00
41
4.3 Semi-arid mixed livestock farming
4.3.1 General description
This model is a typical mixed millet-groundnut-beef cattle system of the groundnut Bassin
of Senegal. Its position is assumed to be 14°35’28,20”N -16°30’25.27”O. The Groundnut
Basin is located in the Sudano-Sahelian zone of Senegal with an average precipitation of
600 mm per year which falls exclusively during the months of June through October (ANSD,
2011). The area is densely populated (i.e. 200 people.km-2) and has doubled in the past 40
years (Delaunay et al., 2013). Due to population pressure soil fertility problems appeared and
intensification stays a major stake. Dior (local name) is the dominant soil type of the area
(Khouma, 2000) and is classified as part of the oxic subgroups of Alfisols (USDA system) or
also known to be part of the tropical ferruginous soils, weakly leached according to the
French soil classification system (Jalloh et al., 2011). They are inherently low in OM content.
The main staple crop is millet and groundnut as a cash crop. Cattle (Zebu Gobra breed) is
traditionally the main livestock activity. Although cropping practices are similar throughout the
farms, the main animal husbandry practices for cattle differ depending farming systems. The
traditional agro-pastoral system of the region is based on a bundle of practices that ensured
access to various fodder ressources throughout the year. Livestock are given access to crop
residues and to grass (fallow fields) that are essential to the functioning of this system
(Lericollais and Faye, 1994). Demographic and climatic pressures among others have driven
farmers to adopt livestock fattening (Pélissier, 1966; Lericollais and Milleville, 1993;
Lericollais and Faye, 1994). Animals are kept in stall and fed rations made up agro-industrial
residues, concentrates and on-farm crop residues and by consequence the fallow is no
longer in practice (Lericollais and Faye, 1994; Sow et al., 2004).
4.3.3 The two systems compared
With the objective to evaluate if intensification in a mitigation option, two typical farms
were compared on the basis of FarmAc simulations. The farms simulated are simplified
systems that correspond to observed systems encountered in the Groundnut Basin
(Audouin, 2013; Odru, 2013): a Traditional farm (farm1) and an Intensive farm (Farm 2).
Farm 2 can be considered as the farm with mitigation options: i) Increasing housing (grass
constant) and ii) Improving roughage quality (more groundnut hay and feed concentrate in
the feed ration).
As indicated in table 2, to faciliate comparison, herd composition was the same on all farms:
ten tropical livestock units (TLU) of Zebu Gobra. The field area was five hectares which
corresponds to a livestock stocking rate of 2 TLU/ha (1 TLU = 250 kg live weight). We
considered two types of fields in all farms. The hut field was under continuous cultivation of
millet is located in the immediate vicinity of the habitations/compound. The more distant bush
fields were under different rotation patterns depending on the farm (Table 1).

42
Table 1. The main characteristics of the two farms simulated
Traditional (Farm 1) Intensive (Farm 2)
Livestock housing Wandering Stable (bare soil)
Feed ration
Grazing fallow/crop residues on
crop fields (no concentrate feed)
Trough/stall feeding
Forage/roughage
Concentrate feed
Manure
management
(no manure collection and storage)
Manure Heap
Soil-Crop
fertilization
Direct deposition during grazing
and, Night park/penning
Broadcast
(burnt residues)
Crop rotation Millet-groundnut-fallow (3 years) Millet-groundnut
(2 years)
Table 2. Structure and main inputs of the two simulated farms
Units Farm 1 Farm 2
Farm
structure
Millet hut field ha 1 1
Millet bush field ha 1.33 2
Groundnut ha 1.33 2
Fallow ha 1.33 0
Calves heads 2 2
Young bulls heads 2 2
Heifers heads 2 2
Suckler cows heads 3 3
Bull heads 1 1
Stocking rate TLU.ha-1
2 2
Farm
inputs
Crop residues kgN.year-1
0 1.4
Concentrate feeds kgN.year
-1 16.8 190.1
Mineral fertilizer b kgDN.year-1
0 0
On Farm 1, there was no animal housing. The animals were kept on the fallow field during
the rainy season and on the crop fields after the harvest to graze on residues. Faeces and
urine are deposited directly onto the fields. It was a three years rotation of millet, groundnut
and fallow grass.
On Farm 2, animals were kept in rudimentary housing structures on bare soil and were fed
by trough a mixture of imported by-products, concentrate feeds and farm crop residues.
Manure was collected and pilled up a heap until it was broadcasted in the fields prior to millet
cultivation. A typical millet-groundnut rotation was conducted on the bush fields that had
been previously been cleared of residues by fire.

43
4.3.3 Results
Table 3 presents the GHG balance resulting from the simulations of the two farms. Methane
from enteric fermentation is the largest source of GHG emissions in all two farms ranging
accounting for 50 to 85 % of total GHG emissions (kg eq. CO2.year-1). On Farm 1, nitrous
oxide emissions from fileds were the second highest source of emissions (16% of total GHG
emissions). There are no emissions from housing and manure management on Farm 1
because manure is directly deposited on fields. However nitrous oxide emissions from
manure management were the second highest source of emissions on Farm 2 (27% of total
GHG emissions). Indirect emissions is significantly increased for the intensive system (8% of
total GHG emissions). It mainly corresponds to NH3 volatilization.
Table 3. GHG balance of the two simulated farms
Unit Farm 1 Farm 2
Direct
GHG
emissions
Enteric methane
emissions kg eq. CO2.year
-1 14103 13007
Manure methane
emissions kg eq. CO2.year
-1 0 1791
Manure N2O
emissions kg eq. CO2.year
-1 0 7000
Field N2O emissions kg eq. CO2.year-1
2661 1863
Change in C stored in
soil kg eq. CO2.year
-1 -318 99
Indirect
GHG
emissions
Housing NH3
emissions kg eq. CO2.year
-1 0 493
Manure storage NH3
emissions kg eq. CO2.year
-1 0 1701
NH3 emissions from
field-applied manure kg eq. CO2.year
-1 0 4
NH3 emissions from
fertilizers kg eq. CO2.year
-1 0 0
N2O emissions
resulting from leaching
of N
kg eq. CO2.year-1
99 3
Production Meat Tons LW.year-1
0.99 4.89
GHG
balance
Total GHG/ha kg eq. CO2.ha-1
3309 5192
Total GHG/kg meat kg eq. CO2.kg LW-1
16.64 5.31
In table 3, the GHG emission balances are presented according to two different functional
units: per unit of production area (ha) and per unit of live weight animal product (kg LW). The
farm area is the same on all two farms. Considering emissions on the basis of unit area,
emissions are increased by 57% in the intensive system (Farm 2) with reference to the
traditional system (Farm 1). However considering emissions on the basis of animal
production, total GHG emissions are decreased by 68% in the intensive farms; i.e. emissions
per animal product are cut by 3, where animal productivity is increased by 5.

44
4.4. Semi-arid grass land based livestock farming
4.4.1 General description
The farm selected for this study is located in the arid region of South Africa with very low
rainfall (Semi-arid grass land based livestock farming, Kalahari region, South Africa).
Therefore neither agronomic crops nor planted pasture are grown. The animals feed on
natural grasses, forbs, and shrubs. The farmer has adopted a four paddock grazing system
and the model simulation (C and N balance) was conducted only for a third of the total farm,
which is available for grazing by the animals during a specific period. The selected mitigation
measure was the addition of leaks with ammonium or nitrate as sources of N (additives) (650
g per head).
The model grassland based livestock farming is typical commercial farm representing farms
around the dry Kalahari region of South Africa. The farm was a 9147 ha rangeland beef
system located in a sandy soil, which is typical soil in the Kalahari region. Long-term annual
mean precipitation of the area is 250 – 300 mm and the mean annual temperature is about
24 oC. The area is dry and consequently it has low carrying capacity of 13 LU per hectare.
The herd used for this study consisted of 345 beef bred cows, 210 calves, 10 weaner, 24
heifers (1-3 heifers), and 12 bulls of Bonsmara breed. The mean daily weight gain by bulls
and beef heifers was 0.9 kg. Overall the quantity of live weight produced per ha was 142 kg.
The livestock farming system was free grazing and no synthetic fertilizer was applied. The
field had multispecies grasses, forbs, shrubs, and trees. Some of the shrubs and trees were
legumes. Leaves from trees located below 1.5 m were considered available for consumption
by livestock. Organic nitrogen was mainly excreted by cattle on grass in situ throughout the
year.
The simulation of the herd in FarmAC was firstly divided into five animal herds: calves (<12
months old), heifers (1-2 years old), weaner, heifers (> 2 years), and bulls (>2 years). The
baseline scenario of Table 4.2.4.1 summarizes the key input data used to run FarmAC
model.
4.4.2 Mitigation options
As described, the mitigation options tested in this study were including additives to the food
ration of the animals under baseline The additive were a) a mixture of 10% molasses + 40%
salt + 24% Bran + 5% cotton oilcake + 6% NH4PO4 + 1% CaPO4+ 6.5% lime (650 g per
head) only during winter (M1), b) . a mixture of 10% molasses + 40% salt + 24% Bran + 6%
CaNO3 + 5% cotton oilcake + 1% CaPO4+ 6.5% lime (650 g per head) only during winter
(M2), c) similar additive as “b” but given to the animals throughout the year (M3), d) similar
additive as “c” but given to the animals throughout the year (M4).

45
4.4.3 Results
Table 4.4.3.1 shows the results from FarmAC. Baseline Carbon and N balance are shown in
Annex 1.
Table 4.4.3.1. Key farm data used to model the extensive livestock production system in Kalahari
South Africa and two mitigation options using FarmAc.
Item Baseline M1 M2 M3 M4
Farm size (ha) 3800 3800 3800 3800 3800
Number of animals
Bulls (> 2 years 12 12 12 12 12
Heifers (>2 years) 355 355 355 355 355
Heifers (1-2 years) 14 14 14 14 14
Weaner 10 10 10 10 10
Calves (<12 months) 210 210 210 210 210
Livestock units (LU)
Bulls (> 2 years 10 10 10 10 10
Heifers (>2 years) 291 291 291 291 291
Heifers (1-2 years) 12 12 12 12 12
Weaner 8 8 8 8 8
Calves (<12 months) 172 172 172 172 172
Total farm meat production
(tonnes live weight per year)
142.9 143.9 143.9 144.3 144.3
GHG (ton CO2 equivalents/yr) 3983 4026 4009 4099 4049
GHG emission per unit meat
produced (kg/kg)
27.9 28.0 27.9 28.4 28.1
Net C sequestration (ton C/yr)
64.5 66.0 66.0 67.4 67.5
Net N sequestration (ton C/yr ) 8.34 8.99 9.04 10.39 10.63
It was apparent that annual meat production increased with the introduction of feed additives.
The replacement of ammonium based by nitrate based N source feed additives did not result
in annual meat production differences both when additive was introduced only during winter
and throughout the year. Annual live weight gain by animals fed with additives throughout the
year was higher than those fed only during winter. Nonetheless, the provision of both
ammonium and nitrate based additives resulted in an increase in farm scale greenhouse gas
emission. Greenhouse gas emission from nitrate based additives was lower than ammonium
based despite the similarity in the total amount of N applied. Farm scale greenhouse gas
emission per unit meat produced was slightly higher for animals fed with ammonium based N
additives throughout the year. Nonetheless, farm scale greenhouse gas emission per unit
meat produced remained more or less similar between baseline and mitigation measures.
Greenhouse gas emission values from this study were slightly higher than reported values
from organic beef production in Sweden (22.3 kg of CO2 equivalent GHG emission per kg
beef) (Koneswaran and Nierenberg, 2008) but lower than the resource intensive Kobe beef
production in Japan (36.4 kg of CO2 equivalent GHG emission per kg beef) (Cederberg and
Stadig, 2003; Ogino et al., 2007).
Model simulations using FarmAC also showed that the inclusion of nitrogen based additives
increased net carbon and nitrogen storage in the soil. Computer model simulations also
46
showed that inclusion of additives in the diet of the animals throughout the year resulted in
relatively higher carbon and nitrogen storage in the soil. The positive net carbon and nitrogen
sequestration observed was expected considering the presence of inedible trees and shrubs
contributing to the soil carbon. In addition, the mass balance used in this simulation
represents only a third of the farm while the other third was left to rest (no grazing) and the
other third used for goats and sheep. Therefore this farm system, which represents most of
the extensive commercial farm systems in the area have a net positive carbon sequestration.
4.4.4 Conclusions mitigation options
Extensive beef production system in the Kalahari region of South Africa is characterised by
low carrying capacity due to low rainfall and net positive soil carbon sequestration due to the
presence of shrubs and trees, which contribute to the soil carbon. Model simulation results
using FarmAC model showed that the addition of additives can improve beef production as
well as carbon sequestration. The addition of ammonium and nitrate based additives resulted
in a slight increase of greenhouse gas emission. The amount of greenhouse gas emitted per
unit weight of meat produced, however, remained similar.

47
5. Conclusions mitigation options
The results of the FarmAC simulations are in accordance with results reported in literature,
and the simulated results for both Africa and Brazil may therefore be considered to reflect the
best estimates of mitigation at farm scale.
Values FarmAC parameters were not always available. Therefore the simulated results
presented in this study should be interpreted with some caution, and further studies would be
needed to validate the results.
Implementation of mitigation measures is site specific. In this study it was not possible to
evaluate if the used implementation was the best option.
Simulations of the Amazonian farms after deforestation with FarmAC indicate that all the
mitigation options tested were effective in reducing emission intensities. Intensities rank
Baseline > Agroforestry > Improved pasture management > Crop-Livestock > Improved
pasture management and N application. The rank reflects the area covered by agroforestry
as only 20 ha and 98 ha out of 488 ha were covered by trees and soybean, respectively.
Emissions per unit of area were similar to baseline within a ± 10% range, indicating
sustainable intensification will reduce emission intensities, but may not reduce emissions per
unit of area. Soil carbon was a major component of the mitigation for the mitigation options
tested, usually accounting for over 50% of the emissions, except for the mitigation option
where nitrogen was added. Recovering or improving pasture productivity in the whole area
would be more effective than using crop rotation or agroforestry in a small proportion of the
area and that nitrogen input would be essential for long-term sustainability of those systems,
allowing for higher soil carbon stocks than baseline levels.
Simulation of South Brazilian (Campos) small family farms with FarmAC gave good results
regarding GHG balance even if different processes as soil emissions in sub-tropical area,
incorporation of residual material or no-tillage systems will have to be better estimated.
Mitigation options that consist in improving soil conservation and nutrient use in the system
(cover crop, reduced fertilization rate and rotation of the crop) result in direct reduction of
GHG emissions (however not higher than 5% reduction) in the farm system, mostly through
reducing N leaching and increasing soil C sequestration. Mitigation options that consist in
improving pasture and grazing management and so milk production per ha (increase of 40%)
increased direct emissions such as enteric CH4 emissions and soil N2O emissions (increase
of nearly 35%), but these increases are partially balanced by higher soil C sequestration (up
to 5 times more C sequestration, due to higher plant residues) and reduced N emissions
from fertilizers application and leaching (up to 75% reduction). At the end, combining the
different mitigation options resulted in an increase of 14% of total “on farm” GHG emission
but a reduction of 19% in emission intensity (kg CO2 eq emission per kg milk produced).
For the semi-arid beef cattle farm in Senegal measures were included to improve livestock
productivity by using feed additives. Considering emissions on the basis of unit area,
emissions are increased by 57% in the intensive system with reference to the traditional
system. However, considering emissions on the basis of animal production, total GHG
emissions are decreased by 68% in the intensive farms.
48
Regarding the cattle farm in the Kalahari region of South Africa model simulation results
using FarmAC showed that the addition of additives can improve beef production as well as
carbon sequestration.
Regarding the Kalahari region of South Africa model simulation results using FarmAC
showed that the addition of ammonium and nitrate based additives resulted in a slight
increase of greenhouse gas emission. The amount of greenhouse gas emitted per unit
weight of meat produced, however, remained similar.
In general can be concluded that intensification of African farming systems increases GHG
emission per unit of area but on the other hand GHG emission per unit of animal product is
reduced and animal productivity is increased.
Levels of changes in GHG emissions are site specific and depending on mitigation measure
or combination of mitigation measures.
Results indicate that there is high potential for reducing GHG emissions in Africa through
improving livestock productivity, whereas the potential for reducing GHG emissions in Latin
America is less, although there seems to be scope for enhancing soil carbon storage in
grasslands.
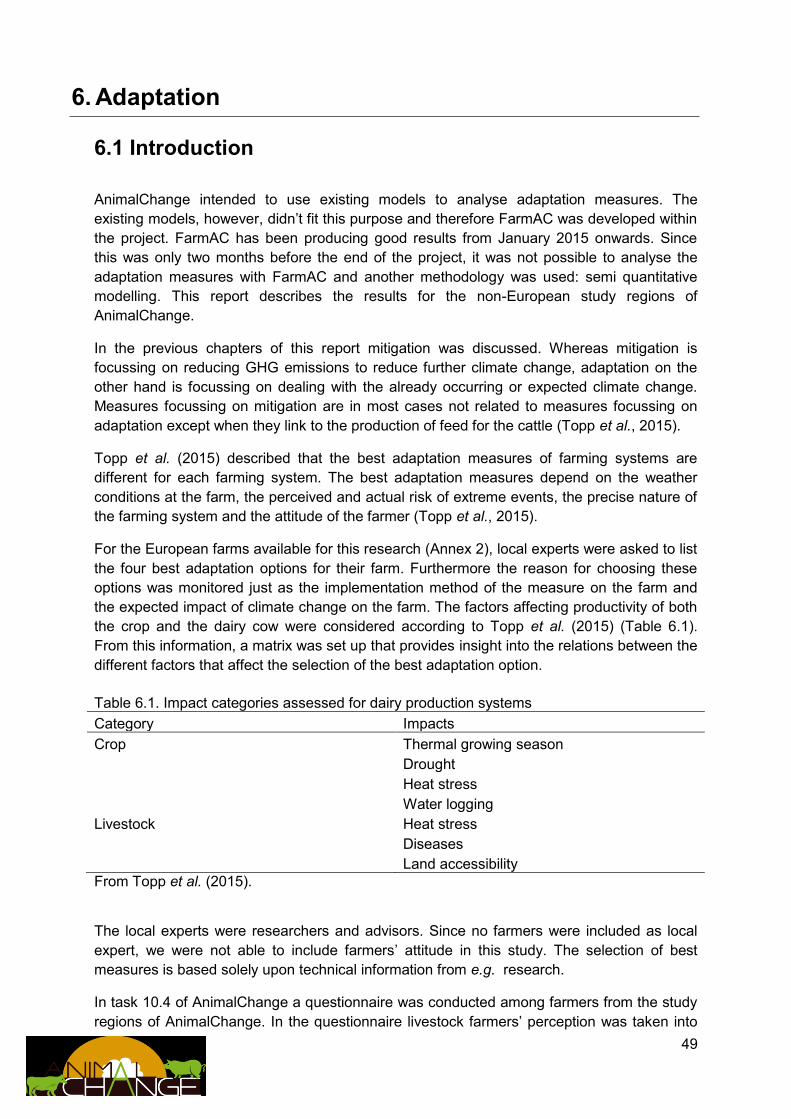
49
6. Adaptation
6.1 Introduction
AnimalChange intended to use existing models to analyse adaptation measures. The
existing models, however, didn’t fit this purpose and therefore FarmAC was developed within
the project. FarmAC has been producing good results from January 2015 onwards. Since
this was only two months before the end of the project, it was not possible to analyse the
adaptation measures with FarmAC and another methodology was used: semi quantitative
modelling. This report describes the results for the non-European study regions of
AnimalChange.
In the previous chapters of this report mitigation was discussed. Whereas mitigation is
focussing on reducing GHG emissions to reduce further climate change, adaptation on the
other hand is focussing on dealing with the already occurring or expected climate change.
Measures focussing on mitigation are in most cases not related to measures focussing on
adaptation except when they link to the production of feed for the cattle (Topp et al., 2015).
Topp et al. (2015) described that the best adaptation measures of farming systems are
different for each farming system. The best adaptation measures depend on the weather
conditions at the farm, the perceived and actual risk of extreme events, the precise nature of
the farming system and the attitude of the farmer (Topp et al., 2015).
For the European farms available for this research (Annex 2), local experts were asked to list
the four best adaptation options for their farm. Furthermore the reason for choosing these
options was monitored just as the implementation method of the measure on the farm and
the expected impact of climate change on the farm. The factors affecting productivity of both
the crop and the dairy cow were considered according to Topp et al. (2015) (Table 6.1).
From this information, a matrix was set up that provides insight into the relations between the
different factors that affect the selection of the best adaptation option.
Table 6.1. Impact categories assessed for dairy production systems
Category Impacts
Crop Thermal growing season
Drought
Heat stress
Water logging
Livestock Heat stress
Diseases
Land accessibility
From Topp et al. (2015).
The local experts were researchers and advisors. Since no farmers were included as local
expert, we were not able to include farmers’ attitude in this study. The selection of best
measures is based solely upon technical information from e.g. research.
In task 10.4 of AnimalChange a questionnaire was conducted among farmers from the study
regions of AnimalChange. In the questionnaire livestock farmers’ perception was taken into
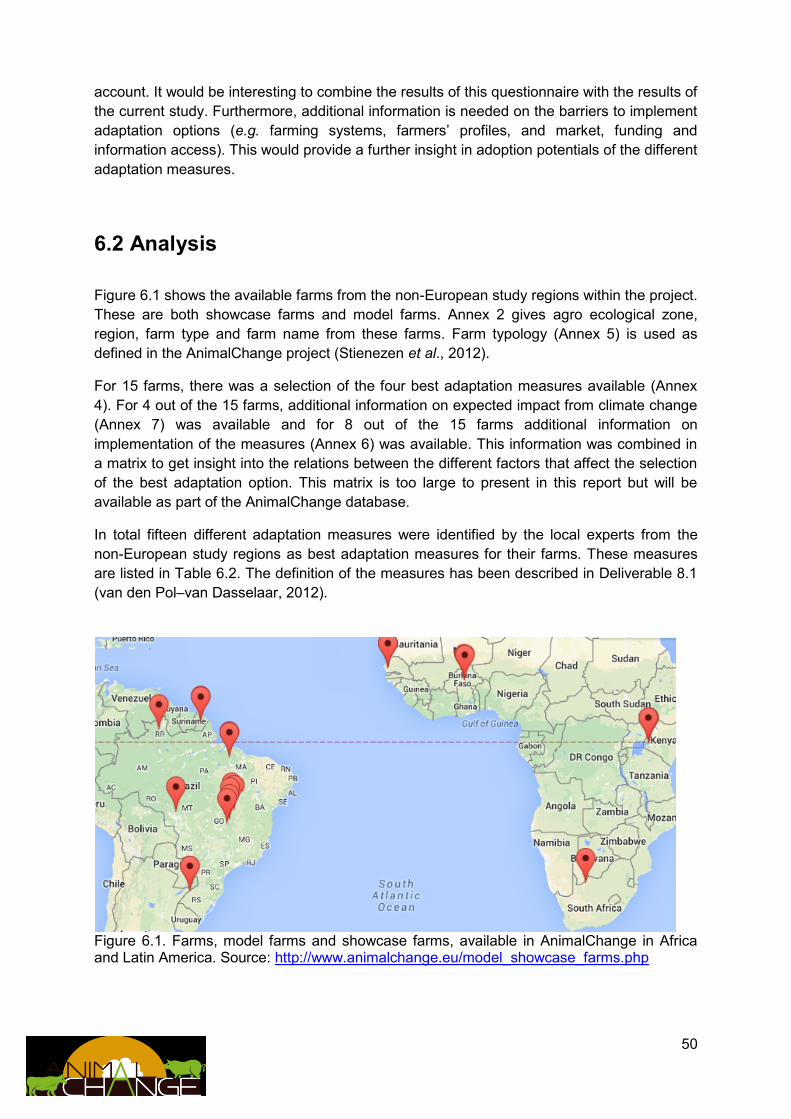
50
account. It would be interesting to combine the results of this questionnaire with the results of
the current study. Furthermore, additional information is needed on the barriers to implement
adaptation options (e.g. farming systems, farmers’ profiles, and market, funding and
information access). This would provide a further insight in adoption potentials of the different
adaptation measures.
6.2 Analysis
Figure 6.1 shows the available farms from the non-European study regions within the project.
These are both showcase farms and model farms. Annex 2 gives agro ecological zone,
region, farm type and farm name from these farms. Farm typology (Annex 5) is used as
defined in the AnimalChange project (Stienezen et al., 2012).
For 15 farms, there was a selection of the four best adaptation measures available (Annex
4). For 4 out of the 15 farms, additional information on expected impact from climate change
(Annex 7) was available and for 8 out of the 15 farms additional information on
implementation of the measures (Annex 6) was available. This information was combined in
a matrix to get insight into the relations between the different factors that affect the selection
of the best adaptation option. This matrix is too large to present in this report but will be
available as part of the AnimalChange database.
In total fifteen different adaptation measures were identified by the local experts from the
non-European study regions as best adaptation measures for their farms. These measures
are listed in Table 6.2. The definition of the measures has been described in Deliverable 8.1
(van den Pol–van Dasselaar, 2012).
Figure 6.1. Farms, model farms and showcase farms, available in AnimalChange in Africa and Latin America. Source: http://www.animalchange.eu/model_showcase_farms.php

51
Table 6.2. Adaptation measures chosen as best option for selection of farms in AnimalChange for Africa and Latin America
The adaptation measures selected by local experts were selected because the measures
were expected to increase animal and plant production or to be the best measures available
for their specific farm situation to maintain plant and livestock productivity under the expected
impact of climate change (Annex 6).
As for farm types in this study are very divers, farm types were clustered to be able to find
trends (Annex 2). These new farm types are used in Table 6.3.
The adaptation measures
“Fertilisation rate”,
the two measures on “Animal breeding”,
“Use of mixtures of plant species”,
“Supplemental feeding” and
“Shifts in livestock system”
were appointed for respectively 7, 6 (3 plus 3), 4, 4 and 4 farm types out of the 8, to be one
of the four best adaptation measures (Table 6.3).
The farm types “Small holder farming”, “Beef grassland based extensive”, “Dairy integrated
cropping and livestock farming” and “Beef integrated cropping and livestock farming” are
represented by respectively 4, 2, 2 and 3 farms in the database. The remaining farm types
are represented by one farm in the database. In “Small holder farming” and “Beef grassland
based extensive” the local experts, from the respectively 4 and 2 farms, selected different
adaptation measures to be the best option for their farm. Therefore more than four
adaptation measures are listed (Table 6.3.).
1 Fertilisation rate
2 Water management (irrigation and drainage)
3 Use of mixtures of plant species
4 Feed storage
5 Animal breeding (local breeds)
6 Animal breeding (change breeds)
7 Supplemental feeding
8 Shifts in livestock systems
9 Livestock mobility
10 Use of plants more resistant to drought, flooding, pests and diseases
11 Rotational grazing
12 Improve livestock management
13 Change the grazing management
14 Clean the pasture from unwanted species
15 Restoring degraded lands

52
“Livestock mobility” is chosen by all local experts from “Small holder farming”. These farms
are all located in Africa.
The local experts from the three farms from “Beef integrated cropping and livestock farming”
all chose the same four adaptation measures to be the best. The farms originated from the
Cerrado region.
The local experts from the two farms from “Dairy integrated cropping and livestock farming”
both chose the same four adaptation measures to be the best. The farms originated from the
Campos region.
Table 6.3 confirms the conclusion of Top et al. (2015) that the best adaptation measures are
dependent on the farming system. However, it is shown that not only the selection of best
adaptation measures can differ between farm types (Table 6.3). The farm implementation
can also differ. An example is shown in Table 6.4. The on farm implementation of
“Fertilisation rate” is for example different for farm type “Small holder farming” and “Beef
integrated cropping and livestock farming” (Table 6.4).
And even within a farm type, the implementation can be different. There may even be
implementation differences between farms of the same farm type within one region as a
result of site differences. The on farm implementation of “Use of plants more resistant to
drought, flooding, pests and diseases” and “Rotational grazing” is for example different for
farm type “Beef integrated cropping and livestock farming” (Table 6.5).
Due to the limited number of farms in the database and available data on the impact from
climate change it was not possible to show impact from climate change upon adaptation
measures.
Taking into account the fact that the implementation of adaptation is site specific we can
conclude that the sets of adaptation measures and ways of implementing are a good advice
for the specific farms represented by the farms in this report.
6.3 Conclusions
The adaptation measures selected by local experts were selected because the measures
were expected to increase animal and plant production or to be the best measures available
for their specific farm situation to maintain plant and livestock productivity under the expected
impact of climate change. Adaptation measures are often presented as generic measures.
On farm implementation is, however, site specific. This should be taken into account when
suggesting a specific adaptation measure.
The adaptation measures
• “Fertilisation rate” and
• “Animal breeding (change of breeds and local breeds)”,
were found to be suitable adaptation measures for most farm types.

53
Table 6.3. Adaptation measures selected as best options for different farm types*
*Farm types used in this table are from combining farm types from Annex 5.
Adaptation measure Nr of farm types Farm type
Nu
mbe
r of
far
m t
ype
s ad
apta
tio
n
mea
sure
is s
elec
ted
as
bei
ng o
ne
of
the
fou
r be
st o
pti
on
sSm
all h
old
er
farm
ing
Be
ef g
rass
lan
d b
ased
ext
ensi
ve
Be
ef in
tegr
ate
d c
rop
pin
g an
d
lives
tock
far
min
gD
airy
inte
gra
ted
cro
pp
ing
and
lives
tock
far
min
gB
eef
inte
grat
ed
cro
pp
ing,
agro
fore
stry
an
d li
vest
ock
far
min
g
Dai
ry g
rass
lan
d b
ase
dB
eef
gra
ssla
nd
bas
ed
Ind
ustr
ial b
eef
1. Fertilisation rate 7 x x x x x x x
2. Water management (irrigation and drainage) 1 x
3. Use of mixtures of plant species 4 x x x x
4. Feed storage 1 x
5. Animal breeding (local breeds) 3 x x x x
6. Animal breeding (change breeds) 3 x x x
7. Supplemental feeding 4 x x x x
8. Shifts in livestock systems 4 x x x x
9. Livestock mobility 1 x
10. Use of plants more resistant to drought, flooding, pests and diseases 3 x x x
11. Rotational grazing 3 x x x
12. Improve livestock management 1 x
13. Change the grazing management 1 x
14. Clean the pasture from unwanted species 1 x
15. Restoring degraded lands 1 x

54
Table 6.4. Reason for selection and implementation method of the adaptation measures “Fertilisation rate” for farm type “Beef grassland based
extensive” and “Small holder farming”
Farm type Why chosen? How implemented on farm?
Beef grassland based
extensive
A pasture fertilization strategy could use 2 MT of lime, 1 MT
of simple superphosfate and 120 kg of urea per
hectare/year. 25 hectares of pasture per year should be renovated.
Small holder farming
Fertilizer it is utilized in crops besides manure to increase
crop productivity in a mixed crop-livestock systems where
animals are also fed in crop residues.
Mineral fertilization: Contribution only on maize (30 kg N / ha)
and manure management (night park Rotation on corn
cropping land every 4 months)

55
Table 6.5. Reason for selection and implementation method of the adaptation measures “Use of plants more resistant to drought, flooding, pests
and diseases” and “Rotational grazing” for farm type “Beef integrated cropping and livestock farming” from two sites from the Cerrado region.
SiteAdaptation
IDWhy measure chosen How measure implemented
11
Sertanejo farm has incorporated many paddocks and by
monitoring and evaluations of their yields, the establishment of
animal stocks can be improved.
New pasture species such as Minerão Stilozants, with better drought
tolerance, should be introduced to supply forage in the dry season.
11 The rotational grazing should be optimized. Electric fences should be used.
Sertaneja farm (S-
LA-003)
Temporary grass-
sugarcane-maize-
eucalyptus-beef
system
Calcare Farm (S-
LA-004) Grain-
grassland based
beef system
10
Most of the planted pasture areas in the Sertanejo farm
presented low yields in 2013 and once that beef price is higher
than two years ago the farmer should invest in soil fertilization
and new available species of pasture.
By using the cropping practice with maize and pasture planted in one
planting operation. After the harvest of maize for the dry feed the
farmer will have a new pasture.
Double crop systems should adopt rotations using plants more
drought tolerant in the second rainy season crop. Moreover,
Brachiaria seeds should be planted with a second cereal crop to
optimize the farm income and the carbon sequestration.
The Brachiaria harvest, in the dry season, should be carried by
grazing of crossbred (bos Indicus and bos taurus) animals.10
56
7. References
Ainsworth, J.A.W., Moe, S.R., Skarpe, C., 2012. Pasture shade and farm management effects on cow productivity in the tropics. Agric. Ecosyst. Environ. 155, 105–110. doi:10.1016/j.agee.2012.04.005
Albertini, T. Z. (2010). Efeito do peso adulto e produção de leite de vacas de corte sobre a eficiência energética-ambiental-econômica do sistema de cria. Doctoral Thesis, Escola Superior de Agricultura Luiz de Queiroz, University of São Paulo, Piracicaba. Retrieved 2015-04-21, from http://www.teses.usp.br/teses/disponiveis/11/11139/tde-14022011-082602/
Andrade, F.M.E. de, 2003. Produção de forragem e valor alimentício do capim-Marandu submetido a regimes de lotação contínua por bovinos de corte. Universidade de São Paulo.
Assad, E.D., Pinto, H.S., Martins, S.C., Groppo, J.D., Salgado, P.R., Evangelista, B., Vasconcellos, E., Sano, E.E., Pavão, E., Luna, R., Camargo, P.B., Martinelli, L.A., 2013. Changes in soil carbon stocks in Brazil due to land use: paired site comparisons and a regional pasture soil survey. Biogeosciences 10, 6141–6160. doi:10.5194/bg-10-6141-2013
Audouin E., 2013. Terroirs comparison in terms of biomass flows and nitrogen balance - Study case of Diohine and Barry Sine in the former groundnut basin of Senegal. MSC Thesis, Norwegian University of Life Sciences, Aas, 92 p.
Barbosa, R.A., NASCIMENTO JÚNIOR, D. do, Euclides, V.P.B., SILVA, S. da, Zimmer, A.H., TORRES JÚNIOR, R. de A., 2007. Capim-tanzânia submetido a combinações entre intensidade e freqüência de pastejo. Pesqui. Agropecuária Bras. 42, 329–340.
Barioni, L. G. ; RAMOS, Allan Kardec Braga ; MARTHA JR, Geraldo Bueno ; FERREIRA, A. C. ; SILVA, F. A. M. ; Vilela L. ;VELOSO, Rui Fonseca . Orçamentação forrageira e Ajustes em Taxas de Lotação. In: Simpósio sobre manejo da pastagem, 2005, Piracicaba. Simpósio sobre manejo da pastagem, 2005. v. 22. p. 217-245.
Bayer, C., Mielniczuk, J., Amado, T. J. C., Martin-Neto, L., & Fernandes, S. V. (2000). Organic matter storage in a sandy clay loam acrisol affected by tillage and cropping systems in southern Brazil. Soil and Tillage Research, 54(1-2), 101–109. doi:10.1016/S0167-1987(00)00090-8
Carvalho, J.L.N., Raucci, G.S., Cerri, C.E.P., Bernoux, M., Feigl, B.J., Wruck, F.J., Cerri, C.C., 2010. Impact of pasture, agriculture and crop-livestock systems on soil C stocks in Brazil. Soil Tillage Res. 110, 175–186. doi:10.1016/j.still.2010.07.011
Cederberg C, Stadig M. System expansion and allocation in life cycle assessment of milk and beef production. Int J Life Cycle Assess. 2003;8:350–356.
Cerri, C. E. P.; Coleman, K.; Jenkinson, D. S.; Bernoux, M.; Victoria, R.; Cerri, C. C. (2003) Modeling Soil Carbon from Forest and Pasture Ecosystems of Amazon, Brazil. Soil Science Society of America Journal, 67 (6), p. 1879 - 1887.
Cerri C.C. et al. (2005) Recent history of the agriculture of the Brazilian Amazon Basin: prospects for sustainble development and a first look at the biogeochemical consequences of pasture reformation. Outlook Agric. 34, 9.

57
Crosson, P., O’Kiely, P., O’Mara, F.P., Wallace, M., 2006. The development of a mathematical model to investigate Irish beef production systems. Agric. Syst. 89, 349–370.
Dalgaard, R. L. and N. Halberg (2007). How to account for emissions from manure? Who bears the burden? 5th International Conference "LCA in Foods" 25-26 April 2007, Gothenburg, Sweden: 1-3.
Delaunay, V. et al. 2013. Profile: the Niakhar Health and Demographic Surveillance System. International journal of epidemiology 42: 1002-1011.
Elsgaard, L., et al. (2010). Greenhouse gas emissions from cultivation of winter wheat and winter rapeseed for biofuels and from production of biogas from manure, see http://pure.au.dk/portal/files/43999218/726859.pdf . : 1-34.
EU (2013). Annex II: product environmental footprint (PEF) guide. Draft.
Fagundes, J.L., Fonseca, D.M. da, Morais, R.V. de, Mistura, C., Vitor, C.M.T., Gomide, J.A., Nascimento Júnior, D. do, Santos, M.E.R., Lambertucci, D.M., 2006. Avaliação das características estruturais do capim-braquiária em pastagens adubadas com nitrogênio nas quatro estações do ano. Rev. Bras. Zootec. 35, 30–37.
Flysjö, A., et al. (2011). "The impact of various parameters on the carbon footprint of milk production in New Zealand and Sweden." Agricultural Systems 104(6): 459-469.
Figueroa, C.M., 2014. Characterization of Agroforestry Systems in the State of Rio de Janeiro, Brazil and their Potential in the Carbon Market (Dissertação de Mestrado). Universidad Autónoma de San Luis Potosí, San Luis Potosi.
Gomide, J.A., Gomide, C. de M., 2001. Utilização e manejo de pastagens. Reunião Anu. Soc. Bras. Zootec. 38, 808–825.
Gouvello, C., Soares Filho, B. S., & Nassar, A. (2011). Land Use, Land Use Change and Forestry: Technical Synthesis Report. Washington DS: The World Bank.
Guo, L., & Guifford, R. (2002). Soil Carbon Stocks and Land Use Change: A meta analysis. Global Change Biology, 8, pp. 345-360.
Hutchings, N.J., 2013. Scientific and technical documentation of the modelling complex. AnimalChange Deliverable report 9.2.
Jalloh, A., E. R. Rhodes, I. Kollo, H. Roy-Macauley, and S. P. 2011. Nature and management of the soils in West and Central Africa: A review to inform farming systems research and development in the region, CORAF/WECARD, Dakar, Senegal.
Koneswaran G, Nierenberg D. Global farm animal production and global warming: impacting and mitigating climate change. Environ Health Perspect. 2008;116:578–582. [PMC free article] [PubMed]
Kristensen, I. S. (2006). Estimating of N-surplus and -losses in Denmark using "Farm-N". Summary in Plant Production Congress 2006. 10.-11. Jan., Herning Kongrescenter. p 461-463. Precentation: https://www.landbrugsinfo.dk/Planteavl/Goedskning/Naeringsstoffer/Kvaelstof-N/Sider/plk06_95_3_I_S_Kristensen.pdf ?download=true.
58
Kristensen, I. S., Kelm, M. og Kristensen, T. (2004). Effects of grassland renovation on farm-gate nitrogen balances and losses. In "Land Use Systems in Grassland Dominated Regions". Eds. Lüscher,A.; Jeangros,B.; Kessler,W.; Huguenin,O.; Lobsiger,M.; Millar,N.; Suter,D. Proceedings of the 20th General Meeting of the European Grassland Federation, Luzern, Switzerland, 21-24. June 2004.
Kristensen, I. S. og Kristensen, T. (2007). N-balances and model calculated N-losses from typical intensive dairy farms in Northern Europe. Eds. Vliegher De,A. and Carlier,L.. Proceedings of the 14th Symposium of the European Grasland Federation. Gent, Belgium. 3-5 September 2007. page 311-314. See http://www.europeangrassland.org/fileadmin/media/EGF2007_GSE_vol12.pdf.
Kristensen, T., et al. (2011). "Effect of production system and farming strategy on greenhouse gas emissions from commercial dairy farms in a life cycle approach. see http://ac.els-cdn.com/S1871141311000850/1-s2.0-S1871141311000850-main.pdf?_tid=be3fa984-d153-11e4-af47-00000aacb361&acdnat=1427112013_58eb3aa37a31b0ce7472301c79ce530b ." Livestock Science 140(1-3): 136-148
Lericollais, A., and A. Faye. 1994. Des Troupeaux sans pâturages en pays sereer au Sénégal. In: C. Blanc-Pamard and J. Boutrais (eds.) A la Croisée des parcours : pasteurs, éleveurs, cultivateurs No. 94. Ed. de l'ORSTOM, Paris.
Lericollais, A., and P. Milleville. 1993. La jachère dans les systèmes agro-pastoraux Sereer au Sénégal. In: C. Floret and G. Serpantié (eds.) La jachère en Afrique de l'Ouest. Colloques et Séminaires. p 133-145. ORSTOM, Paris.
Loss, A., Ribeiro, E.C., Pereira, M.G., Costa, E.M., 2014. Atributos físicos e químicos do solo em sistemas de consórcio e sucessão de lavoura, pastagem e silvipastoril em Santa Teresa, ES. Biosci. J. 30, 1347–1357.
Maia, S.M.F., Ogle, S.M., Cerri, C.E.P., Cerri, C.C., 2009. Effect of grassland management on soil carbon sequestration in Rondônia and Mato Grosso states, Brazil. Geoderma 149, 84–91. doi:10.1016/j.geoderma.2008.11.023
Mogensen, L., et al. (2014). "Carbon footprint of cattle feeds – a method to include contribution from soil carbon changes. ." Journal of Cleaner Production. 73: 40-51.
Mora-Calvo, V., 2012. Es el silvopastoreo una alternativa para la carbono neutralidad de las fincas ganaderas en Costa Rica?, in: II Congreso Colombiano Y 1er Seminario Internacional Silvopastoreo. Presented at the II Congreso Colombiano y 1er Seminario Internacional Silvopastoreo, Universidad Nacional de Colombia, Medelin.
Mozzer, G. B. (2011). Agriculture and cattle raising in the context of a low carbon economy. In R. S. Motta, J. Hargrave, G. Luedemann, & M. B. Gutierrez, Climate Change in Brazil: economic, social and regulatory aspects. Brasilia: IPEA.
Muniz, L.C., Madari, B.E., Trovo, J.B. de F., Cantanhêde, I.S. de L., Machado, P.L.O. de A., Cobucci, T., França, A.F. de S., 2011. Soil biological attributes in pastures of different ages in a crop-livestock integrated system. Pesqui. Agropecuária Bras. 46, 1262–1268.
NaturErhvervstyrelsen (2014). Vejledning om gødsknings- og harmoniregler. 2014/15. see http://naturerhverv.dk/fileadmin/user_upload/NaturErhverv/Filer/Landbrug/Goedningsregnskab/Vejledning_om_goedsknings-_og_harmoniregler_nyeste.pdf . , Ministeriet for Fødevarer, Landbrug og Fiskeri. NaturErhvervsstyrelsen.: 1-170.
59
Neely, C., Bunning, S., & Wilkes, A. (2009). Review of evidence on drylands pastoral systems and climate change: Implications and opportunities for mitigation and adaptation. Rome: FAO.
Neves, C.M.N. das, Silva, M.L.N., Curi, N., Macedo, R.L.G., Tokura, A.M., 2004. Estoque de carbono em sistemas agrossilvopastoril, pastagem e eucalipto sob cultivo convencional na região noroeste do estado de Minas Gerais. Ciênc. E Agrotecnologia 28, 1038–1046.
Nielsen, P. H., et al. (2003). LCA Food data Base. Online at: www.LcaFood.dk.
Odru M., 2013. Flux de biomasse et renouvellement de la fertilité des sols à l’échelle du terroir. Etude de cas d’un terroir villageois Sereer au Sénégal. Mémoire de Master II ISTOM, Cergy-Pontoise, 99 p.Pélissier, P. 1966. Les paysans du Sénégal. Paul Pélissier.
Ogino A, Orito H, Shimada K, Hirooka H. Evaluating environmental impacts of the Japanese beef cow-calf system by the life cycle assessment method. Animal Sci J. 2007;78:424–432.
Olesen, J.E., Schelde, K., Weiske, A., Weisbjerg, M.R., Asman, W.A.H., and Djurhuus, J., 2006. Modelling greenhouse gas emissions from European conventional and organic dairy farms. Agriculture, Ecosystems and Environment 112, 207-220.
Oliveira, P.P.A., Trivelin, P.C.O., Oliveira, W.S., 2003. Eficiência da fertilização nitrogenada com uréia (15N) em Brachiaria brizantha cv. Marandu associada ao parcelamento de superfosfato simples e cloreto de potássio. Rev. Bras. Ciênc. Solo 27, 613–620.
Ramos, L.S., 2013. Eficiência de um sistema silvipastoril em substituição à adubação nitrogenada e a sua relação com a dinâmica da matéria orgânica em solo distrocoeso (Dissertação de Mestrado). São Cristovão, SE.
Salton, J.C., Mielniczuk, J., Bayer, C., Fabrício, A.C., Macedo, M.C.M., Broch, D.L., 2011. Teor e dinâmica do carbono no solo em sistemas de integração lavoura-pecuária. Pesqui. Agropecuária Bras. 46, 1349–1356.
Soussana, J. F., Tallec, T., & Blanfort, V. (2010). Mitigating the greenhouse gas balance of ruminant production systems through carbon sequestration in grasslands. Animal, 4:3, pp. 334-350.
Souza Braz. A.M.; Fernandes, A.R.; Alleoni, L.R.F. (2013) Soil Attributes after Conversion from Forest to Pasture in Amazon. Land Degradation & Development, 24, p. 33-38.
Sow, F. D., B. Aminata, and M. Maloney. 2004. L’embouche paysanne, un exemple d’adaptation de l’élevage traditionnel à la nouvelle situation agricole dans le bassin arachidier du Sénégal. Cahiers Agricultures 13: 211-219.
Stienezen, M.W.J and A. van den Pol-van Dasselaar. 2012. Compiled database on characteristic livestock farms for use in Task 10.3. Deliverable 10.1 AnimalChange project.
Taghizadeh-Toosi, A., Olesen, J. E., Kristensen, K., Elsgaard, L., Østergaard, H. S., Lægdsmand, M., Greve, M. H. og Christensen, B. T. (2014). "Changes in carbon stocks of Danish agricultural mineral soils between 1986 and 2009, See http://dx.doi.org/10.1111/ejss.12169." European Journal Of Soil Science 65(5): 730-740.
60
Tirloni, C., Vitorino, A.C.T., Bergamin, A.C., Souza, L.C.F. de, 2012. Physical properties and particle-size fractions of soil organic matter in crop-livestock integration. Rev. Bras. Ciênc. Solo 36, 1299–1310.
Topp et al., 2015. Report on synergies between mitigation and adaptation options. Kairsty Topp (SRUC), Donal O’Brien (TEAGASC), Marcia Stienezen (DLO), Gertjan Holshof (DLO), Anita Wreford (SRUC), Jorgen Olesen (AU). Deliverable 11.4 AnimalChange project.
Torres, C.M.M.E., Gonçalves Jacovine, L.A., Oliveira Neto, S.N. de, Brianezi, D., Alves, E.B.B.M., 2014. Sistemas Agroflorestais no Brasil: Uma abordagem sobre a estocagem de carbono. Pesqui. Florest. Bras. 34, 235. doi:10.4336/2014.pfb.34.79.633
Van den Pol – van Dasselaar. A. (2013) Qualitative overview of mitigation and adap-tation options and their possible synergies & trade-offs. Deliverable 8.1 Animal-Change project.
Vayssières et al., 2015. Synthesis report on farm barriers to adaptation and mitiga-tion. Jonathan Vayssières, Hélène Frey and Philippe Lecomte (CIRAD). Deliverable 10.6 AnimalChange project.
Vergutz, L., Novais, R.F., Silva, I.R. da, Barros, N.F., Nunes, T.N., Piau, A. de M., 2010. Mudanças na matéria orgânica do solo causadas pelo tempo de adoção de um sistema agrossilvopastoril com eucalipto. Rev. Bras. Ciênc. Solo 34, 43–57.
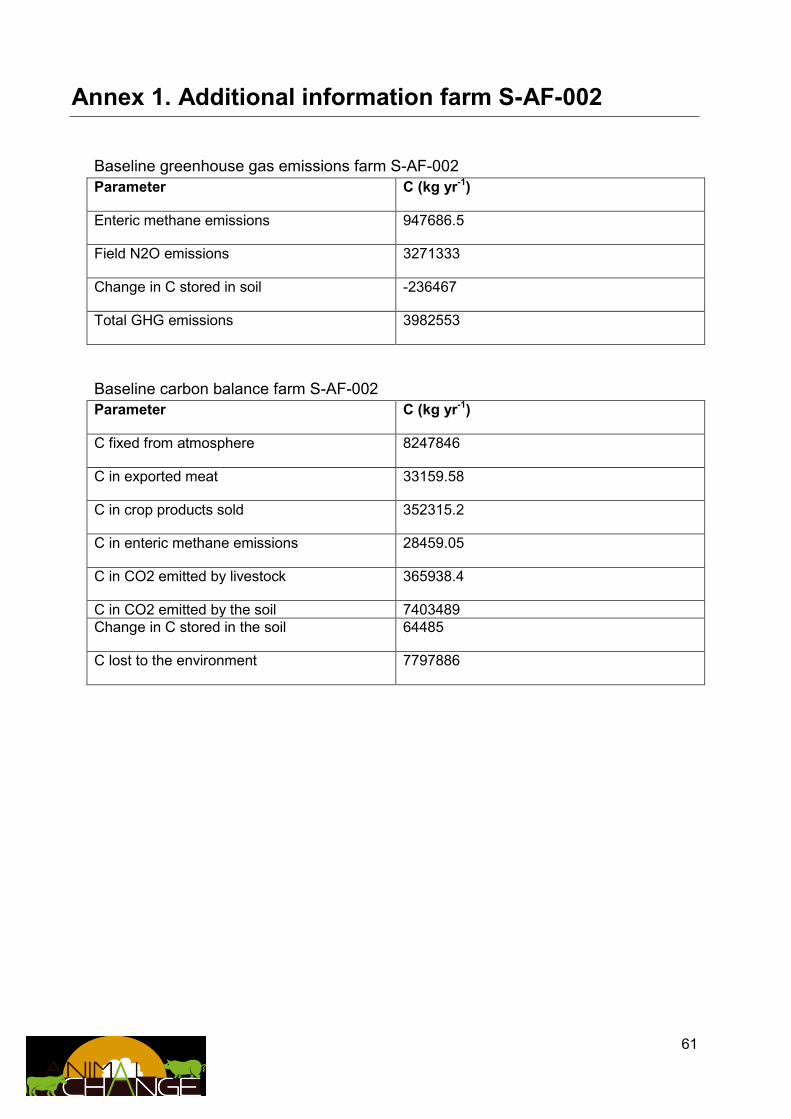
61
Annex 1. Additional information farm S-AF-002
Baseline greenhouse gas emissions farm S-AF-002
Parameter C (kg yr-1)
Enteric methane emissions 947686.5
Field N2O emissions 3271333
Change in C stored in soil -236467
Total GHG emissions 3982553
Baseline carbon balance farm S-AF-002
Parameter C (kg yr-1)
C fixed from atmosphere 8247846
C in exported meat 33159.58
C in crop products sold 352315.2
C in enteric methane emissions 28459.05
C in CO2 emitted by livestock 365938.4
C in CO2 emitted by the soil 7403489
Change in C stored in the soil 64485
C lost to the environment 7797886
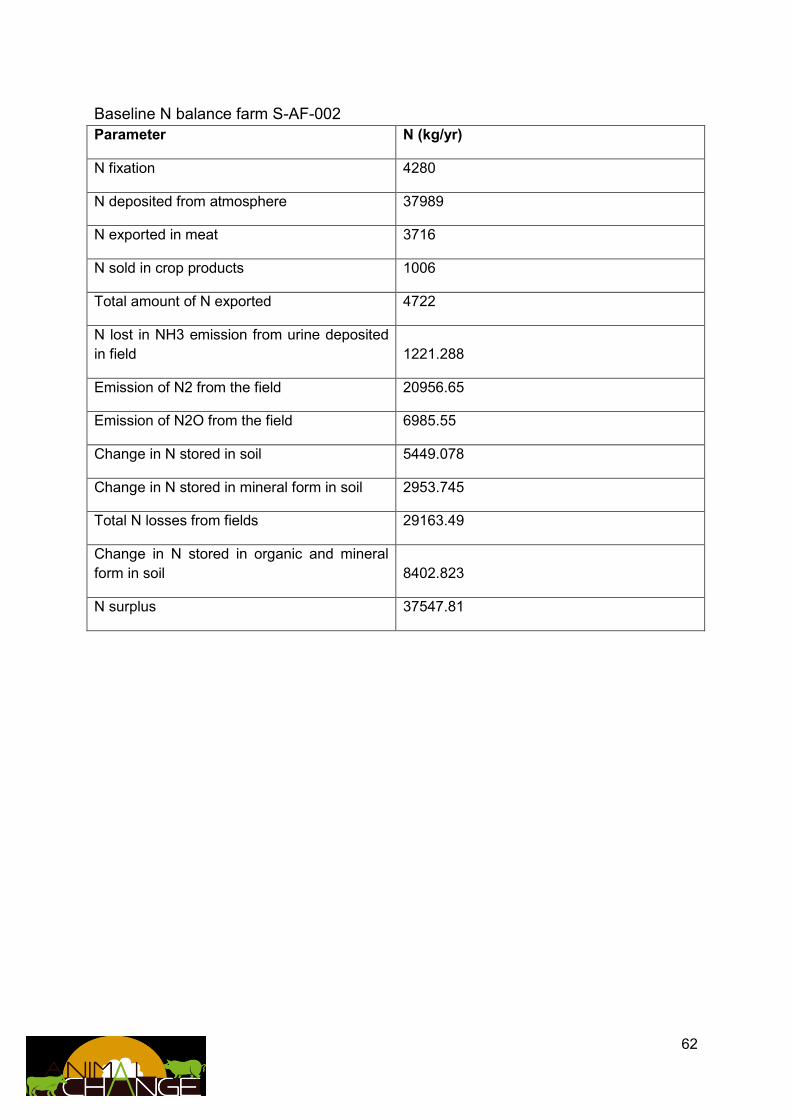
62
Baseline N balance farm S-AF-002
Parameter N (kg/yr)
N fixation 4280
N deposited from atmosphere 37989
N exported in meat 3716
N sold in crop products 1006
Total amount of N exported 4722
N lost in NH3 emission from urine deposited
in field 1221.288
Emission of N2 from the field 20956.65
Emission of N2O from the field 6985.55
Change in N stored in soil 5449.078
Change in N stored in mineral form in soil 2953.745
Total N losses from fields 29163.49
Change in N stored in organic and mineral
form in soil 8402.823
N surplus 37547.81
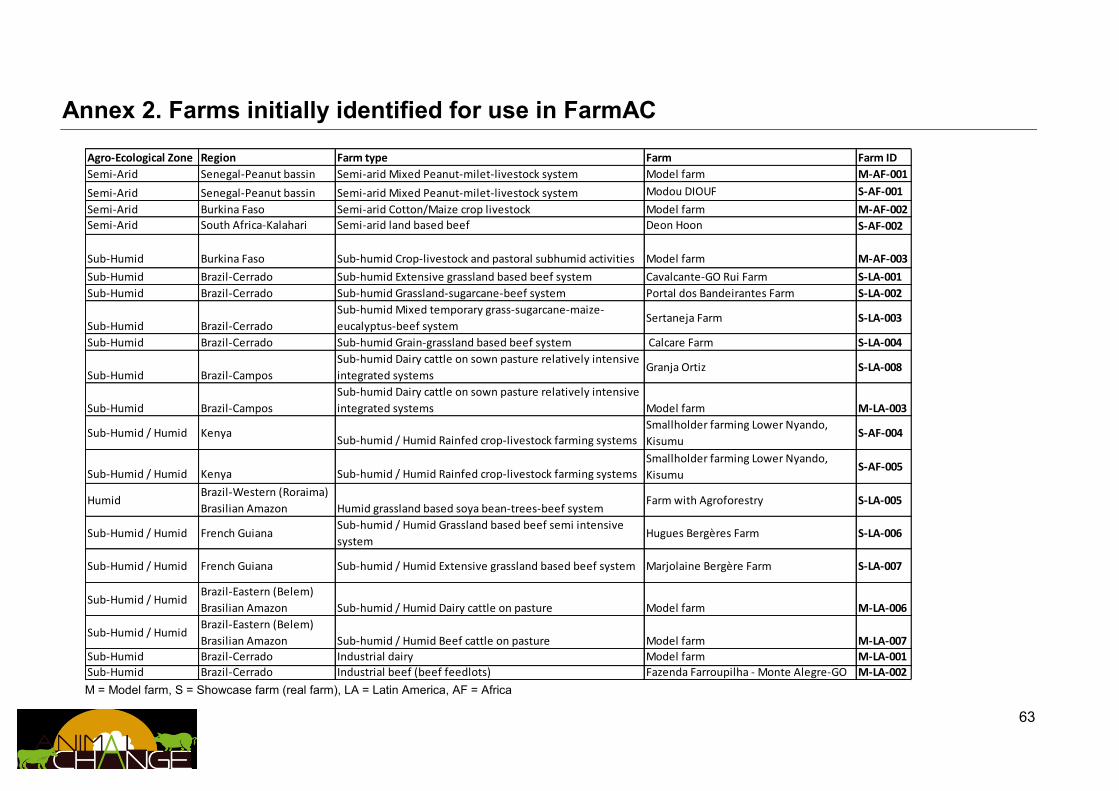
63
Annex 2. Farms initially identified for use in FarmAC
M = Model farm, S = Showcase farm (real farm), LA = Latin America, AF = Africa
Agro-Ecological Zone Region Farm type Farm Farm ID
Semi-Arid Senegal-Peanut bassin Semi-arid Mixed Peanut-milet-livestock system Model farm M-AF-001
Semi-Arid Senegal-Peanut bassin Semi-arid Mixed Peanut-milet-livestock system Modou DIOUF S-AF-001
Semi-Arid Burkina Faso Semi-arid Cotton/Maize crop livestock Model farm M-AF-002
Semi-Arid South Africa-Kalahari Semi-arid land based beef Deon Hoon S-AF-002
Sub-Humid Burkina Faso Sub-humid Crop-livestock and pastoral subhumid activities Model farm M-AF-003
Sub-Humid Brazil-Cerrado Sub-humid Extensive grassland based beef system Cavalcante-GO Rui Farm S-LA-001
Sub-Humid Brazil-Cerrado Sub-humid Grassland-sugarcane-beef system Portal dos Bandeirantes Farm S-LA-002
Sub-Humid Brazil-Cerrado
Sub-humid Mixed temporary grass-sugarcane-maize-
eucalyptus-beef systemSertaneja Farm S-LA-003
Sub-Humid Brazil-Cerrado Sub-humid Grain-grassland based beef system Calcare Farm S-LA-004
Sub-Humid Brazil-Campos
Sub-humid Dairy cattle on sown pasture relatively intensive
integrated systems Granja Ortiz S-LA-008
Sub-Humid Brazil-Campos
Sub-humid Dairy cattle on sown pasture relatively intensive
integrated systems Model farm M-LA-003
Sub-Humid / Humid KenyaSub-humid / Humid Rainfed crop-livestock farming systems
Smallholder farming Lower Nyando,
KisumuS-AF-004
Sub-Humid / Humid Kenya Sub-humid / Humid Rainfed crop-livestock farming systems
Smallholder farming Lower Nyando,
KisumuS-AF-005
HumidBrazil-Western (Roraima)
Brasilian Amazon Humid grassland based soya bean-trees-beef systemFarm with Agroforestry S-LA-005
Sub-Humid / Humid French GuianaSub-humid / Humid Grassland based beef semi intensive
system Hugues Bergères Farm S-LA-006
Sub-Humid / Humid French Guiana Sub-humid / Humid Extensive grassland based beef system Marjolaine Bergère Farm S-LA-007
Sub-Humid / HumidBrazil-Eastern (Belem)
Brasilian Amazon Sub-humid / Humid Dairy cattle on pasture Model farm M-LA-006
Sub-Humid / HumidBrazil-Eastern (Belem)
Brasilian Amazon Sub-humid / Humid Beef cattle on pasture Model farm M-LA-007
Sub-Humid Brazil-Cerrado Industrial dairy Model farm M-LA-001
Sub-Humid Brazil-Cerrado Industrial beef (beef feedlots) Fazenda Farroupilha - Monte Alegre-GO M-LA-002
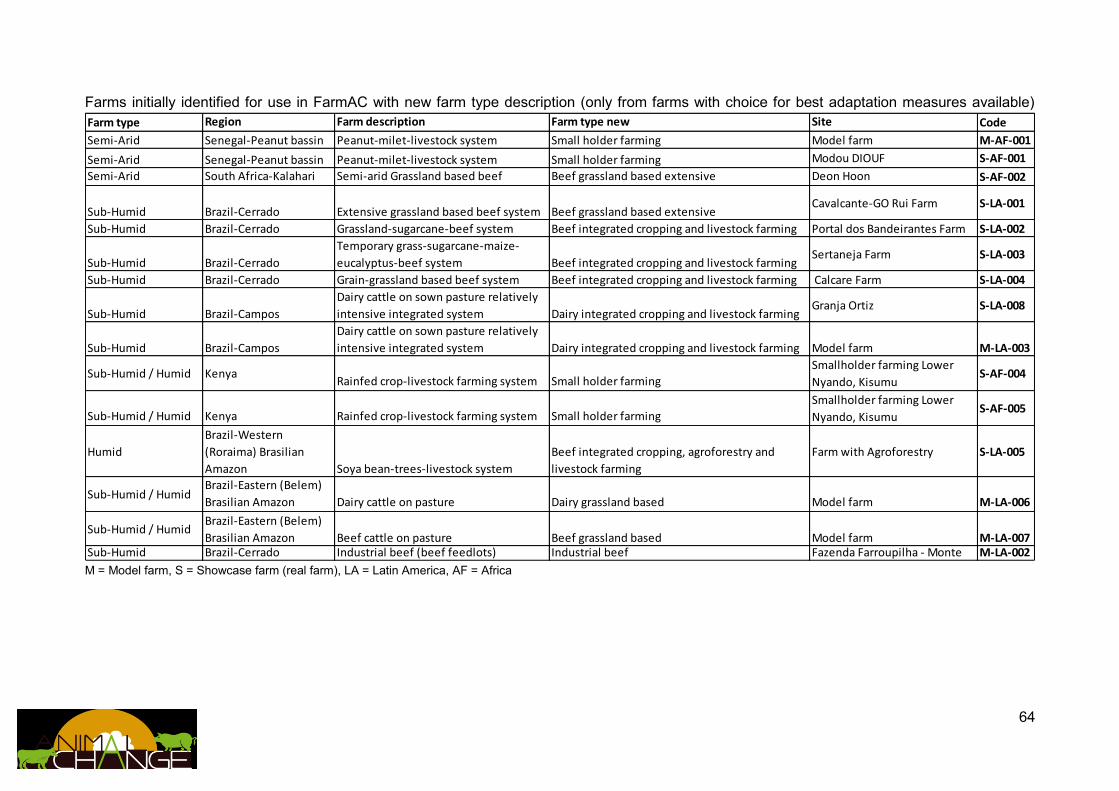
64
Farms initially identified for use in FarmAC with new farm type description (only from farms with choice for best adaptation measures available)
M = Model farm, S = Showcase farm (real farm), LA = Latin America, AF = Africa
Farm type Region Farm description Farm type new Site Code
Semi-Arid Senegal-Peanut bassin Peanut-milet-livestock system Small holder farming Model farm M-AF-001
Semi-Arid Senegal-Peanut bassin Peanut-milet-livestock system Small holder farming Modou DIOUF S-AF-001
Semi-Arid South Africa-Kalahari Semi-arid Grassland based beef Beef grassland based extensive Deon Hoon S-AF-002
Sub-Humid Brazil-Cerrado Extensive grassland based beef system Beef grassland based extensiveCavalcante-GO Rui Farm S-LA-001
Sub-Humid Brazil-Cerrado Grassland-sugarcane-beef system Beef integrated cropping and livestock farming Portal dos Bandeirantes Farm S-LA-002
Sub-Humid Brazil-Cerrado
Temporary grass-sugarcane-maize-
eucalyptus-beef system Beef integrated cropping and livestock farmingSertaneja Farm S-LA-003
Sub-Humid Brazil-Cerrado Grain-grassland based beef system Beef integrated cropping and livestock farming Calcare Farm S-LA-004
Sub-Humid Brazil-Campos
Dairy cattle on sown pasture relatively
intensive integrated system Dairy integrated cropping and livestock farmingGranja Ortiz S-LA-008
Sub-Humid Brazil-Campos
Dairy cattle on sown pasture relatively
intensive integrated system Dairy integrated cropping and livestock farming Model farm M-LA-003
Sub-Humid / Humid KenyaRainfed crop-livestock farming system Small holder farming
Smallholder farming Lower
Nyando, KisumuS-AF-004
Sub-Humid / Humid Kenya Rainfed crop-livestock farming system Small holder farming
Smallholder farming Lower
Nyando, KisumuS-AF-005
Humid
Brazil-Western
(Roraima) Brasilian
Amazon Soya bean-trees-livestock system
Beef integrated cropping, agroforestry and
livestock farming
Farm with Agroforestry S-LA-005
Sub-Humid / HumidBrazil-Eastern (Belem)
Brasilian Amazon Dairy cattle on pasture Dairy grassland based Model farm M-LA-006
Sub-Humid / HumidBrazil-Eastern (Belem)
Brasilian Amazon Beef cattle on pasture Beef grassland based Model farm M-LA-007Sub-Humid Brazil-Cerrado Industrial beef (beef feedlots) Industrial beef Fazenda Farroupilha - Monte M-LA-002

65
Annex 3. Five best mitigation options initially
identified farms
M = Model farm, S = Showcase farm (real farm), LA = Latin America, AF = Africa
a Modou DIOUF is already working on Increasing housing (grass constant) and Improving roughage quality
b Cavalcante-GO Rui Farm is already working on Improving pasture by using a minimum of fertilization rate each three years
c Portal dos Bandeirantes Farm is already working on Improving pasture by using a minimum of fertilization rate each three
years, Sugarcane crop to feed some animals in the dry season. d Sertaneja Farm is already working on Eucalyptus tree crops deployed in degraded pastures, Corn crops to produce dry feed
supplement, Sugarcane crop to feed some animals in the dry season and Production of Brachiaria hay to feed the cows calved during the dry season. e Calcare Farm is already working on Corn silage for feedlot , Use of grain residuals as suplementary animal feed and Use of
sugarcane in a mixed (with elephant grass) forage. f Farm with Agroforestry is already working onAgroforestery with Tectona grandis tree crops deployed in degraded pastures, rice crops, soja crops and rotational grazing. g Hugues Bergères Farm is already working on soil carbon sequestration through grazing management.
h Granja Ortiz is already working on Integrated crop-livestock systems and change in grazing management.
Farm ID Fert
ilisa
tio
n r
ate
Legu
me
s in
th
e ro
tati
on
Co
ver
cro
ps
Irri
gati
on
Re
sto
rin
g d
egra
de
d la
nd
sIm
pro
vin
g p
astu
res
imp
rovi
ng
rou
gha
ge q
ual
ity
Fee
din
g m
aize
an
d le
ss g
rass
Ad
dit
ive
nit
rate
Incr
easi
ng
ho
usi
ng
(gra
ss c
on
stan
t)
Re
pla
cem
nt
rate
cat
tle
Co
ver
slu
ry s
tore
s &
man
ure
he
aps
An
aer
ob
ic d
iges
tio
nA
gro
fore
stry
Gen
eti
c im
pro
vem
en
t in
dai
ry c
attl
e
Ch
ang
e th
e gr
azi
ng
man
age
men
t
Cle
an
th
e p
ast
ure
fro
m u
nw
an
ted
sp
ecie
s
Inte
gra
te li
vest
ock
an
d c
rop
pro
du
ctio
n
Fire
Co
ntr
ol
M-AF-001 - 3 - - - - 4 - - 1 - 5 - - - - - - 2
S-AF-001a - 3 - - - - 4 - - 1 - 5 - - - - - - 2
M-AF-002 - 2 - - - 6 3 - - 4 - 1 5 - - - - - -
M-AF-003 - 3 - - - 5 1 - - 2 - 4 6 - - - - - -
S-AF-002 - - - - 3 5 - - - - 4 - - - - 1 2 - -
S-AF-004 3 - - - - - - - - - - 2 - 4 5 - - 1 -
S-AF-005 2 4 - - - - - - - - - 3 - - 5 - - 1 -
M-LA-001M-LA-002 - - - - - 3 - 1 2 - - - - - - - 5 4 -
S-LA-001b 3 - - 5 1 2 4 - - - - - - - - - - - -
S-LA-002c 3 - - 5 1 2 4 - - - - - - - - - - - -
S-LA-003d 3 - - 5 1 2 4 - - - - - - - - - - - -
S-LA-004e 3 - - 2 1 4 5 6 - - - - - - - - - - -
S-LA-005f - - - - 4 - - - - - - - - 2 - 1 5 3 -
S-LA-006g 4 5 - - - - - - - - 1 - - 3 - 2 - - -
S-LA-007 5 2 - - - 4 - - - - 1 - - 3 - 2 - - -
S-LA-008h 3 5 4 - - - - - - - - - - 6 - 2 - 1 -
M-LA-003 3 5 4 - - - - - - - - - - 6 - 2 - 1 -
M-LA-006 5 - - - 3 2 - - - - - - - - 3 1 4 - -
M-LA-007 6 - 7 - 1 2 5 8 - - - - - - - 3 - 4 -

66
Annex 4. Four best adaptation options initially
identified farms
M = Model farm, S = Showcase farm (real farm), LA = Latin America, AF = Africa
Farm ID Fert
ilisa
tio
n r
ate
Wat
er
man
agem
en
t (i
rrig
ati
on
an
d d
rain
age
)
Use
of
mix
ture
s o
f p
lan
t sp
eci
es
Fee
d s
tora
ge
An
imal
bre
ed
ing
(lo
cal b
ree
ds)
An
imal
bre
ed
ing
(ch
an
ge b
reed
s)
Sup
ple
men
tal f
eed
ing
Shif
ts in
live
sto
ck s
yst
ems
Live
sto
ck m
ob
ility
Use
of
pla
nts
mo
re r
esis
tan
t to
dro
ugh
t,
flo
od
ing
, pes
ts a
nd
dis
ease
sR
ota
tio
nal
gra
zin
gIm
pro
ve l
ives
tock
man
age
me
nt
Ch
ang
e th
e gr
azi
ng
man
age
men
t
Cle
an
th
e p
ast
ure
fro
m u
nw
an
ted
sp
ecie
s
Re
sto
rin
g d
egra
de
d la
nd
s
Code
M-LA-001
M-LA-002 1 - - 4 2 - 3 - - - - - - - -
M-LA-003 4 3 - - - - 2 1 - - - - - - -
M-LA-006 - - 3 - - 2 4 1 - - - - - - -
M-LA-007 2 - 3 - - 4 - 1 - - - - - - -
M-AF-001 - - - - 3 - - 4 1 2 - - - - -
M-AF-002
M-AF-003
S-LA-001 1 - - - 3 - - - - 2 4 - - - -
S-LA-002 1 - - - 3 - - - - 2 4 - - - -
S-LA-003 1 - - - 3 - - - - 2 4 - - - -
S-LA-004 1 - - - 3 - - - - 2 4 - - - -
S-LA-005 3 - 4 - - - - - - - 1 2 - - -
S-LA-006
S-LA-007
S-LA-008 4 3 - - - - 2 1 - - - - - - -
S-AF-001 - - - - 3 - - 4 1 2 - - - - -
S-AF-002 - - - - - - 1 - - - - - 2 3 4
S-AF-004 1 - - - 2 3 - - 4 - - - - - -
S-AF-005 4 - 2 - 1 - - - 3 - - - - - -
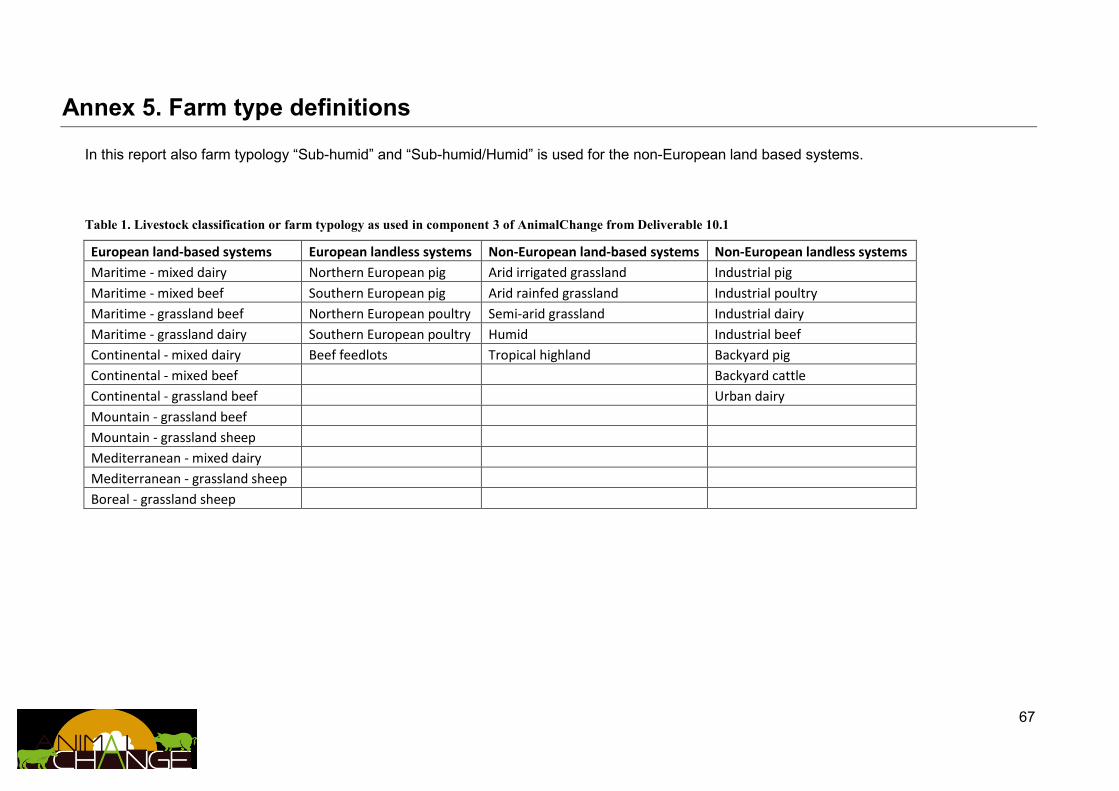
67
Annex 5. Farm type definitions
In this report also farm typology “Sub-humid” and “Sub-humid/Humid” is used for the non-European land based systems.
Table 1. Livestock classification or farm typology as used in component 3 of AnimalChange from Deliverable 10.1
European land-based systems European landless systems Non-European land-based systems Non-European landless systems
Maritime - mixed dairy Northern European pig Arid irrigated grassland Industrial pig
Maritime - mixed beef Southern European pig Arid rainfed grassland Industrial poultry
Maritime - grassland beef Northern European poultry Semi-arid grassland Industrial dairy
Maritime - grassland dairy Southern European poultry Humid Industrial beef
Continental - mixed dairy Beef feedlots Tropical highland Backyard pig
Continental - mixed beef Backyard cattle
Continental - grassland beef Urban dairy
Mountain - grassland beef
Mountain - grassland sheep
Mediterranean - mixed dairy
Mediterranean - grassland sheep
Boreal - grassland sheep

68
Annex 6. Reason why adaptation measure is chosen and how it is implemented
M = Model farm, S = Showcase farm (real farm), LA = Latin America, AF = Africa
Farm ID Adaptation ID Why chosen? How implemented on farm?
M-LA-002 1
The local maize crop for silage production presented yield
below the regional average.
Adequate technical assistance is necessary as well as the
farmer's training to use available appropriate technologies.
4 Store for dry feed was not adequate.
The dry feed mix when prepared and stored locally can,
possibly, be cheaper.
5
Bos Indicus and bos taurus crossbreeding should be used to
produce the indicated animals for the local feedlot because
this technology, economically feasible, has been already
implemented in the cerrado region. The local market should pay a higher price for a softer beef.
7
Alternatives supplementary feeding must be locally
evaluated and cotton, maize and soybean residues
considered.
The farmer should analyse the prices of alternative raw
materials of the regional seed industry and large commercial
crop farms that generate such residues.
S-LA-001 1
A pasture fertilization strategy could use 2 MT of lime, 1 MT
of simple superphosfate and 120 kg of urea per
hectare/year. 25 hectares of pasture per year should be renovated.
5
Bos Indicus and bos taurus crossbreeding should be used to
produce the indicated animals for the local feedlot because
this technology, economically feasible, has been already
implemented in the cerrado region. The local market should pay a higher price for a softer beef.
10
Stylosanthes guianiensis specie should be planted with
Brachiaria at the same time.
The padocks with stylosanthes should be used during the dry
season.
11
The number of pasture areas are 16 but and 30% of the total
area should be reserved to the dry season.
The assumption is that stock pile of dry pasture is enough to
maintain the herd.

69
M = Model farm, S = Showcase farm (real farm), LA = Latin America, AF = Africa
Farm ID Adaptation ID Why chosen? How implemented on farm?
S-LA-003 1
The local maize crop for dry feed presented yield below the
regional average.
Adequate technical assistance is necessary as well as the
farmer's interest to use available appropriate technologies.
For instance, before the planting days the farmer should apply
gypsum in the soil and after the planting date the use (in two
fertilizations) of at least 90 kg of N and 30 kg of k2O per
hectare.
5
Bos Indicus and bos taurus crossbreeding should be used to
produce the indicated animals for the local feedlot because
this technology, economically feasible, has been already
implemented in the cerrado region. The local market should pay a higher price for a softer beef.
10
Most of the planted pasture areas in the Sertanejo farm
presented low yields in 2013 and once that beef price is
higher than two years ago the farmer should invest in soil
fertilization and new available species of pasture.
By using the cropping practice with maize and pasture planted
in one planting operation. After the harvest of maize for the
dry feed the farmer will have a new pasture.
11
Sertanejo farm has incorporated many paddocks and by
monitoring and evaluations of their yields, the
establishment of animal stocks can be improved.
New pasture species such as Minerão Stilozants, with better
drought tolerance, should be introduced to supply forage in
the dry season.
S-LA-004 1
Given that the farm is implanted in a very expensive land
area, the farmer should maximize their crop yields.
The use of gypsum, adequate fertilization rates and other
new agro-technologies should be considered to improve the
crop yields.
5
Bos Indicus and bos taurus crossbreeding should be used to
produce the indicated animals for the local feedlot because
this technology, economically feasible, has been already
implemented in the cerrado region. The local market should pay a higher price for a softer beef.
10
Double crop systems should adopt rotations using plants
more drought tolerant in the second rainy season crop.
Moreover, Brachiaria seeds should be planted with a second
cereal crop to optimize the farm income and the carbon
sequestration.
The Brachiaria harvest, in the dry season, should be carried by
grazing of crossbred (bos Indicus and bos taurus) animals.
11 The rotational grazing should be optimized. Electric fences should be used.
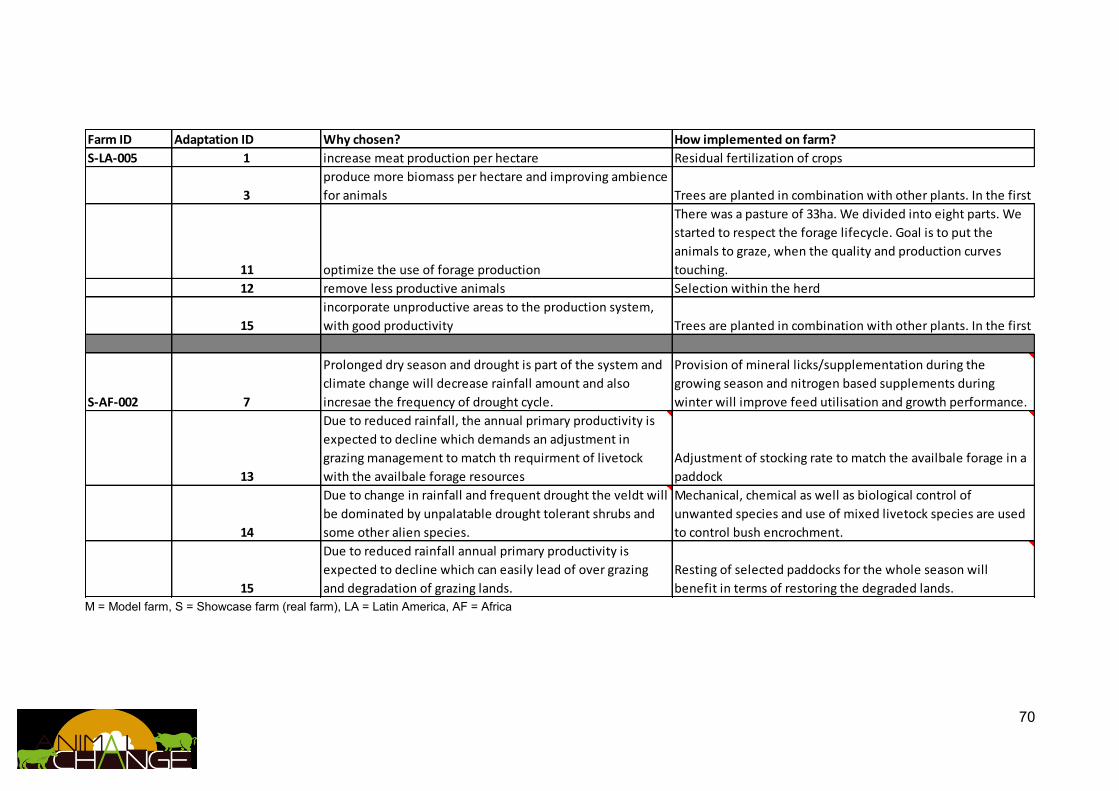
70
M = Model farm, S = Showcase farm (real farm), LA = Latin America, AF = Africa
Farm ID Adaptation ID Why chosen? How implemented on farm?
S-LA-005 1 increase meat production per hectare Residual fertilization of crops
3
produce more biomass per hectare and improving ambience
for animals Trees are planted in combination with other plants. In the first two years soyabeans are planted in between the trees. From the third year onwards pasture is established between the trees and animals are grazing. Trees provide shading for the animals.
11 optimize the use of forage production
There was a pasture of 33ha. We divided into eight parts. We
started to respect the forage lifecycle. Goal is to put the
animals to graze, when the quality and production curves
touching.
12 remove less productive animals Selection within the herd
15
incorporate unproductive areas to the production system,
with good productivity Trees are planted in combination with other plants. In the first two years soyabeans are planted in between the trees. From the third year onwards pasture is established between the trees and animals are grazing. Trees provide shading for the animals.
S-AF-002 7
Prolonged dry season and drought is part of the system and
climate change will decrease rainfall amount and also
incresae the frequency of drought cycle.
Provision of mineral licks/supplementation during the
growing season and nitrogen based supplements during
winter will improve feed utilisation and growth performance.
13
Due to reduced rainfall, the annual primary productivity is
expected to decline which demands an adjustment in
grazing management to match th requirment of livetock
with the availbale forage resources
Adjustment of stocking rate to match the availbale forage in a
paddock
14
Due to change in rainfall and frequent drought the veldt will
be dominated by unpalatable drought tolerant shrubs and
some other alien species.
Mechanical, chemical as well as biological control of
unwanted species and use of mixed livetock species are used
to control bush encrochment.
15
Due to reduced rainfall annual primary productivity is
expected to decline which can easily lead of over grazing
and degradation of grazing lands.
Resting of selected paddocks for the whole season will
benefit in terms of restoring the degraded lands.

71
M = Model farm, S = Showcase farm (real farm), LA = Latin America, AF = Africa
Farm ID Adaptation ID Why chosen? How implemented on farm?
S-AF-004 1
Fertilizer it is utilized in crops besides manure to increase
crop productivity in a mixed crop-livestock systems where
animals are also fed in crop residues.
DAP 25kg/1.5 acres and manure 8 bags of 70kg
5
Traditional agropastoral system to mainstream agriculture 1 local bull, 2 cows, 1 young bull, 3 female calves, 2 rambs, 2
female sheep, 1 young female sheep
6
Change of animal breed to crossbreed which are more
productive and adaptable to the condition of the area
1 crossbreed cow
9 To search for new grazing areas Use of different communal grazing areas
S-AF-005 1
Fertilizer it is utilized in crops besides manure to increase
crop productivity in a mixed crop-livestock systems where
animals are also fed in crop residues.
Mineral fertilization: Contribution only on maize (30 kg N / ha)
and manure management (night park Rotation on corn
cropping land every 4 months)
3 Use of crop residues to feed animals Rotation( 1 acre), maize, potatoes, groundnuts & cassava
5 Traditional agropastoral system to mainstream agriculture Local cows, local sheep, local poultry, donkey, ducks
9 To search for new grazing areas Use of different communal grazing areas

72
Annex 7. Estimated impact from climate change upon farm
Estimated impact from the factors determining the on farm expected impact of climate change on crop and livestock (++ strong positive effect, + positive effect, 0 no effect, - negative effect, -- strong negative effect, a. Depends on the Amazon area. In Water logging area is positive, if not, is negative)
M = Model farm, S = Showcase farm (real farm), LA = Latin America, AF = Africa
Thermal
growing
season Drought
Heat
stress
Water
logging
Heat
stress Diseases
Land
accessibility
S-LA-005
Humid grass land based
soya bean-trees-beef
system
Farm with
Agroforestry0 -- - -- - 0 a
S-AF-002
Semi-arid Grassland
based beef Deon Hoon 0 -- 0 0 + 0 0
S-AF-004
Sub-humid / Humid
Rainfed crop-livestock
farming systems
Smallholder
farming Lower
Nyando, Kisumu - -- - - -- -- -
S-AF-005
Sub-humid / Humid
Rainfed crop-livestock
farming systems
Smallholder
farming Lower
Nyando, Kisumu - -- - - -- -- -
Crop impacts Livestock impacts
FarmFarm typeFarm ID


![SEVENTH FRAMEWORK PROGRAMME THEME FoF.NMP.2010 2 - … · 2015-03-15 · Micro‐Dress [260113] Restricted D8.4 Final Project Report 31/08/2013 Page | 1 SEVENTH FRAMEWORK PROGRAMME](https://static.fdocuments.net/doc/165x107/5f80dd9f7a20db19b9134718/seventh-framework-programme-theme-fofnmp2010-2-2015-03-15-microadress-260113.jpg)