Setup and test of a WFS for NatureSDI+ according to INSPIRE
37
Examiner: Bin Jiang Supervisor: Anders Östman DEPARTMENT OF TECHNOLOGY AND BUILT ENVIRONMENT Setup and test of a WFS for NatureSDI+ according to INSPIRE Klaus Drerup June, 2010 Bachelor’s Thesis in Geomatics
Transcript of Setup and test of a WFS for NatureSDI+ according to INSPIRE

Examiner: Bin Jiang
Supervisor: Anders Östman
DEPARTMENT OF TECHNOLOGY AND BUILT ENVIRONMENT
Setup and test of a WFS for NatureSDI+
according to INSPIRE
Klaus Drerup
June, 2010
Bachelor’s Thesis in Geomatics

Abstract
The INSPIRE initiative requires that every European member state estab-
lishes a national SDI and related web services. Among these a WFS must
be implemented to query spatial data. Therefore several Quality of Ser-
vice specifications must be fulfilled by this web service, among these are
performance, capacity and availability. In this study work a WFS will be
implemented for Nature SDI plus. In this European project the WFS will
provide spatial data from several data specifications of ANNEX I and III.
The main object is to test the conformance to the INSPIRE specification.
Therefore load and performance tests will be performed.
Keywords: Load and performance Testing, Quality of Service (QoS), Web
Feature Service (WFS), Spatial Data Infrastructure (SDI), INSPIRE

Acknowledgements
Writing a thesis is always connected with a great deal of work. This is one
of the longest study works which occurs during the time being a student. I
experienced the same last year when I wrote my first thesis. This year it
was not really different, but I was very interested in doing some research
at a Swedish company, so I saw this as opportunity. Nevertheless, it was
also much work. Even if it is supposed to be done by oneself, it is almost
impossible to do. There have been so many people who supported me,
without their help I would not have been progressed so far right now.
First of all I want to thank my Supervisor Prof. Anders stman. He gave
me the inspiration to do a study work here in Gvle. I wanted to do some
research and he helped me to find some interesting questions. Furthermore
I have to thank him for his support. And I also have to thank for that I
could write my thesis at the GIS Institute. It was a really nice environment
and I had access to resources I would usually not have.
In particular I would like to express my gratitude two people from that
place, those are Finn Hedefalk and Xin He. They were always there when I
had some questions, even to times when most of the people are not working
anymore. All the time they could help me with their expertise, Finn in
SuperMap and purchasing the datasets, Xin in performance testing.
And special thanks to my friends and my family for their support during
that time.

Contents
List of Figures iv
List of Tables v
Glossary vi
1 Introduction 1
2 Background 3
2.1 The INSPIRE directive . . . . . . . . . . . . . . . . . . . . . . . . . . . 3
2.2 Nature SDI plus . . . . . . . . . . . . . . . . . . . . . . . . . . . . . . . 4
2.3 WFS . . . . . . . . . . . . . . . . . . . . . . . . . . . . . . . . . . . . . . 5
2.4 Testing of web applications . . . . . . . . . . . . . . . . . . . . . . . . . 6
2.5 Aims of this study . . . . . . . . . . . . . . . . . . . . . . . . . . . . . . 7
3 Methodology 8
3.1 Software for WFS . . . . . . . . . . . . . . . . . . . . . . . . . . . . . . . 8
3.2 Hardware for WFS . . . . . . . . . . . . . . . . . . . . . . . . . . . . . . 10
3.3 Offered Datasets . . . . . . . . . . . . . . . . . . . . . . . . . . . . . . . 10
3.4 Criteria for Quality of Service . . . . . . . . . . . . . . . . . . . . . . . . 13
3.5 Tools for performance testing . . . . . . . . . . . . . . . . . . . . . . . . 14
3.6 Detailed test description . . . . . . . . . . . . . . . . . . . . . . . . . . . 14
3.6.1 Test INSPIRE conformance . . . . . . . . . . . . . . . . . . . . . 15
3.6.2 Test of large datasets . . . . . . . . . . . . . . . . . . . . . . . . 16
ii

CONTENTS
4 Results 17
4.1 Results of the first test run . . . . . . . . . . . . . . . . . . . . . . . . . 17
4.1.1 Deviation related to time of day . . . . . . . . . . . . . . . . . . 17
4.1.2 Performance of the different operations . . . . . . . . . . . . . . 19
4.1.3 Transfer rate of downloads . . . . . . . . . . . . . . . . . . . . . 22
4.2 Results of the second test run . . . . . . . . . . . . . . . . . . . . . . . . 22
5 Discussion 24
6 Conclusions 27
References 28
iii

List of Figures
2.1 INSPIRE technical architecture overview . . . . . . . . . . . . . . . . . . 4
3.1 Architecture of SuperMap IS .NET 6 . . . . . . . . . . . . . . . . . . . . 9
3.2 Biogeographical regions in Sweden . . . . . . . . . . . . . . . . . . . . . 11
3.3 Protected areas in Gavleborg . . . . . . . . . . . . . . . . . . . . . . . . 12
3.4 Performance criteria download service . . . . . . . . . . . . . . . . . . . 13
4.1 Deviations between measurements at different times of day . . . . . . . 18
4.2 Response times for the GetCapabilities requests . . . . . . . . . . . . . . 19
4.3 Response times for the DescribeFeature requests . . . . . . . . . . . . . 20
4.4 Response times for the GetFeature requests . . . . . . . . . . . . . . . . 21
iv

List of Tables
3.1 Times and locations first test run . . . . . . . . . . . . . . . . . . . . . . 15
3.2 Sizes of the responses to basic requests . . . . . . . . . . . . . . . . . . . 15
3.3 File sizes large data sets . . . . . . . . . . . . . . . . . . . . . . . . . . . 16
4.1 Throughput first test run . . . . . . . . . . . . . . . . . . . . . . . . . . 22
4.2 Transfer rate first test remote computer . . . . . . . . . . . . . . . . . . 22
4.3 Response times second test run . . . . . . . . . . . . . . . . . . . . . . . 23
v

Glossary
GIS Geographic Information System.
Such a system can capture, process
and present geographic data.
GML Geographic Markup Language. A
language to describe a data structure
which is used to store geographical
features
HTTP Hyper text transfer protocol. A pro-
tocol to transfer data over a network.
INSPIRE Infrastructure for Spatial Informa-
tion in the European Community, an
infrastructure for spatial data in Eu-
rope.
OCG Open Geospatial Consortium. A
standardizing organization which de-
fines specifications for web services
for spatial data.
XML Extensible Markup Language. A lan-
guage which saves information in a
hierarchical way as a textfils.
vi

1
Introduction
More and more spatial data are organized in Spatial Data Infrastructures (SDI) today.
An SDI offers access to and shares geographic data among stakeholders for a certain
spatial data user community. They exist at various levels, from a global into a national
to a regional scale and can be found in many countries of the world (Maguire and
Longley, 2005). Their benefits are that they offer harmonized datasets and provide a
central access to the data.
The INSPIRE directive will establish such a solution (THE EUROPEAN PARLIA-
MENT AND COUNCIL, 2007). Its overall goal is to create one SDI for Europe to
have common standards for a more consistent usage of geographical data in Europe.
The framework for access and usage of spatial data are web services. Therefore each
European member state has to implement these web services within a given time frame.
Furthermore each web service has to comply with requirements for their performance.
One of these web service is the Web Feature Service (WFS). It is a download service
for spatial data. There exists an implementation rule (Network Services Drafting Team,
2009) to set minimum performance requirements. To meet these specifications is one
challenge for the implementation of the WFS. Since the member states are going to
setup their download services now there has not been a feedback which software solution
does fulfill these specifications. According to the roadmap of INSPIRE (European
Commission INSPIRE, 2010), there are two years left to setup an operational WFS.
Another issue is how to measure the performance. The specification describes only
some measurements for the conformance, but not how to measure them. There is no
standard testing procedure described.
1

Performance tests itself are a standard method to test software, web sites and other
web services. The Web Mapping Service (WMS) is one of the most known from the
spatial domain. For this view service there has been done some performance tests,
e.g. in (Horak et al., 2009), but one cannot apply these for a WFS. The focus of a
test of WMS is more likely to meet users experience, how fast a user can see a map
after sending the request for it. The primary goal of a WFS is to download data which
requires other test criteria. A WFS can be used to access spatial data from a local
computer but with the emergence of Web Processing Services also in combination with
other services. In a chain of different web services every single one has to be reliable.
What if there are many concurrent users requesting several files and also how does the
size of spatial dataset influence the performance. Will the WFS still be reliable and
respond within a given time interval? It is important to develop an appropriate test as
solution for these questions before publishing a WFS to see if it is operational.
2

2
Background
The chapter gives a short overview of INSPIRE, the Nature SDI plus project, what a
WFS is and reviews related work of web service tests.
2.1 The INSPIRE directive
The Directive (2007/2/EC) of the European Parliament and of the Council is the legal
foundation for a SDI within Europe called INSPIRE (THE EUROPEAN PARLIA-
MENT AND COUNCIL, 2007). It should be based on the infrastructures for spatial
data of the European member states. One goal of INSPIRE is to support policies and
activities with influence on the environment. Moreover this infrastructure shall provide
interoperable spatial data. Therefore measures have to be established to ensure that
the different stakeholders can share, exchange and use the data across different levels
of authorities and boundaries, from a local one to national ones.
The directive has established an overall architecture on a technical level. The
architecture is organized into 4 different tiers (figure 2.1. Each tier aggregates several
processes on a horizontal level. The top tier, Applications and Geoportals, is undefined
and determined for the later usage. The applications have access to the underlaying
tier, the service layer. They are designed to be the only possibility to access and use
the data. Therefore they perform different functions. These are registration of services,
discover services and data, services for view and download and transformation. These
services are using standards for web services defined by the Open Geospatial Consor-
tium (OGC). Their implementation in INSPIRE is regulated in several Implementing
3

2.2 Nature SDI plus
Figure 2.1: INSPIRE technical architecture overview - [(Drafting Teams ”Data
Specifications”, ”Network Services”, ”Metadata”, 2007)].
Rules. E.g. more information about network services and in particular download ser-
vices for spatial data is specified in (Network Services Drafting Team, 2009). The tier
below is the data tier which includes the storage of the data. The tier on the bottom
represents the data schemata. These contain data specification how to model spatial
data. Details about data specification can be found in three Annex of the INSPIRE
directive. Each Annex contains several spatial data themes whereas data specifications
for Annex I are already published, for Annex II and Annex III exist drafts.
2.2 Nature SDI plus
The Nature SDI plus project deals with spatial data about nature conservation (Na-
tureSDIplus consortium , 2009). The aim is to provide harmonized datasets which are
interoperable and can be shared and reused by different stakeholders of the project and
in INSPIRE. The data is specified in Annex I and Annex III of the INSPIRE directive:
Annex I:
• Protected sites:
4

2.3 WFS
Annex III:
• Biogeographical regions:
• Habitats and biotopes:
• Species distribution:
As stated in section 2.1, only the one from Annex I is finalized, the others are
project specific.
The GIS Institute in Gavle is responsible to setup a download service for spatial
datasets related to Sweden.
2.3 WFS
A Web Feature Service (WFS) is a web service defined by the OGC (Open Geospa-
tial Consortium Inc., 2005). Its purpose is to upload and download spatial data and
metadata about spatial data from a server. A WFS provides a level of abstraction.
This guarantees that this service can be used by every client implementing its service
specification. The communication between server and client is performed by several
operations. The most important ones are:
• Get Capabilities
This request returns a document containing information about the service itself.
• Describe Feature Type
A schema with the data specifications of one or several features can be accessed
by this operation.
• Get Feature
This request delivers the spatial data. There are many options how to query the
data. One is to apply a bounding box to get only data of a certain spatial extent.
There are furthermore other operations defined to use a WFS as transactional ser-
vice to upload, update or delete spatial data on the remote server. The transfer protocol
for the operations is HTTP-get or HTTP-post. A request using HTTP-get sends all
5

2.4 Testing of web applications
parameters in the URL of a request, one using http-post sends the parameters in the
body of a request. A response is encoded in XML, the spatial data itself is encoded
in GML. In comparison to other web services, in particular to a WMS is a WFS able
to download the spatial data itself so that it can be used for further computational
processing. This makes this service valuable in chaining different web services as it is
demonstrated in (Kiehle, 2006).
2.4 Testing of web applications
Today there is a shift from desktop applications to web applications in computer science.
More and more applications are outsourced to the Internet. This has the benefit that it
can be used by everyone and on demand. Furthermore is saves operational costs (Troni
et al., 2008). As stated in section 2.1, this also includes web applications dealing with
spatial data. It is an example for the usage of the Internet as the only connection to
access these services. The INSPIRE architecture is completely based on web services.
Before publishing a web service it should be tested so that it will be reliable and has
a minimum performance. First of all, one has to differ between white- and black-box
testing. Black-box testing means to test an application without any knowledge of its
underlying structure and implementation. This is known in white box testing, it is a
concept to analyze and improve a software (Myers et al., 2004).
For application testing many different approaches exists with different goals. Hicks
et el. differ between five different kind of tests: Test precondition data, functional
testing, Stress test functionality, Capacity testing and load and performance testing
(Hicks et al., 1997). One classical application and what is still an issue is testing of web
sites. Menasc reviews load testing of web sites (Menasc, 2002). The test application
simulates several virtual users who behave like a web browser. They request a web
site, wait for the response and after receiving it and after a certain think time they
request the next page. Each virtual user has a certain behavior how he does it. The
test application can simulate many concurrent virtual users to see how many users a
web site can serve within a given time frame. To analyze its performance, several so
called Quality of Service (QoS) measures are presented. Two important QoS measures,
the availability and the response time of a web site are pointed out. The availability
indicates if a user has accessed a web site. The response time shows how fast this
6

2.5 Aims of this study
happens. During the load testing these two aspects help to identify how well a user
will be satisfied with the web service.
Web sites are just one example of a web service. There are many other kinds of
web services. The interaction with INSPIRE and its data is based on network services.
For some of these services already exist so called implementing rules. They define
which operations a service must support and more important specifications of their
QoS. (Network Services Drafting Team, 2009) presents the requirements for a download
service for spatial data. Each member country of the European Union must offer web
services compliant to these requirements. Therefore adequate test concepts have to be
developed.
(Horak et al., 2009) had tested the QoS of a Web Mapping Service in Czech. This is
the implementation of the viewing service required by INSPIRE. They performed load
and performance testing and measured the response time, availability and also other
parameters like error occurrence. Furthermore they made long term tests. Another
concept for conformance testing according to INSPIRE is introduced in (Ostman, 2010).
They are developing the Persistent Testbed. It is a response to many distributed tests
of INSPIRE applications because there is no standard testing procedure defined. One
main goal is to coordinate the testing of such web services.
2.5 Aims of this study
The objective of this study is on the one hand to setup a WFS and on the other hand
to test its performance. Because this WFS shall offer data for the Nature SDI plus
project, it has to be conform to the INSPIRE specifications for download services.
7

3
Methodology
This chapter introduces how I tested the QoS for the WFS. The used software and
hardware for the WFS will be presented, the software for the performance tests, the
datasets, an extensive description of the conformance specifications and details how I
ran the QoS tests.
3.1 Software for WFS
There are many choices for a software to setup a WFS. I decided to use software from
SuperMap because it is also used in the GIS Institute in Gavle (SuperMap Software
Co., Ltd., 2010). SuperMap is a Chinese company, they develop a GIS platform which
can offer different kinds of GIS from Desktop GIS to Web services.
Among all components of the SuperMap GIS I used SuperMap IS .NET 6 to run the
WFS Server and SuperMap Deskpro 6 to create maps for the WFS. After the software is
installed, the next step is to configure SuperMap IS .NET 6 for a WFS. Then one has to
migrate the data to the server. Therefore I created a map in SuperMap Deskpro 6 which
contains all the data I want to provide. This map was uploaded to the server and set
as default workspace for the data in the SuperMap IS .Net Manager, the configuration
page for Internet Services.
SuperMap IS .NET 6 has a four-level structure for web services: The client applica-
tion, web server, GIS application server and data server (SuperMap Software Co., Ltd.,
2009). The last three components can be run on the same or on different computers.
8

3.1 Software for WFS
Subsequently I will explain all components more in detail and how they were involved
in the WFS:
Figure 3.1: Architecture of SuperMap IS .NET 6 - SuperMap structures its web
services for their GIS platform in several layers. - [(SuperMap Software Co., Ltd., 2009)].
• Client application
A WFS can be accessed by many applications which act as client. Many GIS
support WFS and can directly download and process spatial data. Furthermore
using the HTTP-get method as described in section 2.3 enables also simple web
browsers to load geographical features and show the GML as XML. Since I wanted
to run performance tests I used a performance test software (see section 3.5).
• Web server
The web server gives the client access to the underlaying GIS. It provides a service
on the Internet. In the SuperMap WFS implementation this is the part which
9

3.2 Hardware for WFS
forwards requests from the client to the GIS application server and sends also the
response back.
• GIS application server
This server provides the GIS functionality. In a SuperMap WFS this part pro-
cesses requests for data and metadata, accesses the data from the data server,
converts these datasets to GML and sends them to the web server. One or several
GIS services can be setup on one or more computers by using a cluster function.
• Data Server
The data server consists of one or several databases and offers spatial data, meta-
data and other data like business data to the GIS application server. Many types
of databases are supported, for this implementation a SDX+ database of Su-
perMap has been used. Therefore each dataset was migrated to and stored in an
own database.
3.2 Hardware for WFS
The server for the WFS was one from the University of Gavle. It was a HP proliant
ml350 tower. The computer has four Intel Xeon processors with a speed of 2000 Mega
Hertz. The size of the memory is 2 GB. As operating system is Microsoft Windows
Server 2003 installed.
Beside the WFS application a course catalog was running on the server offering
online courses.
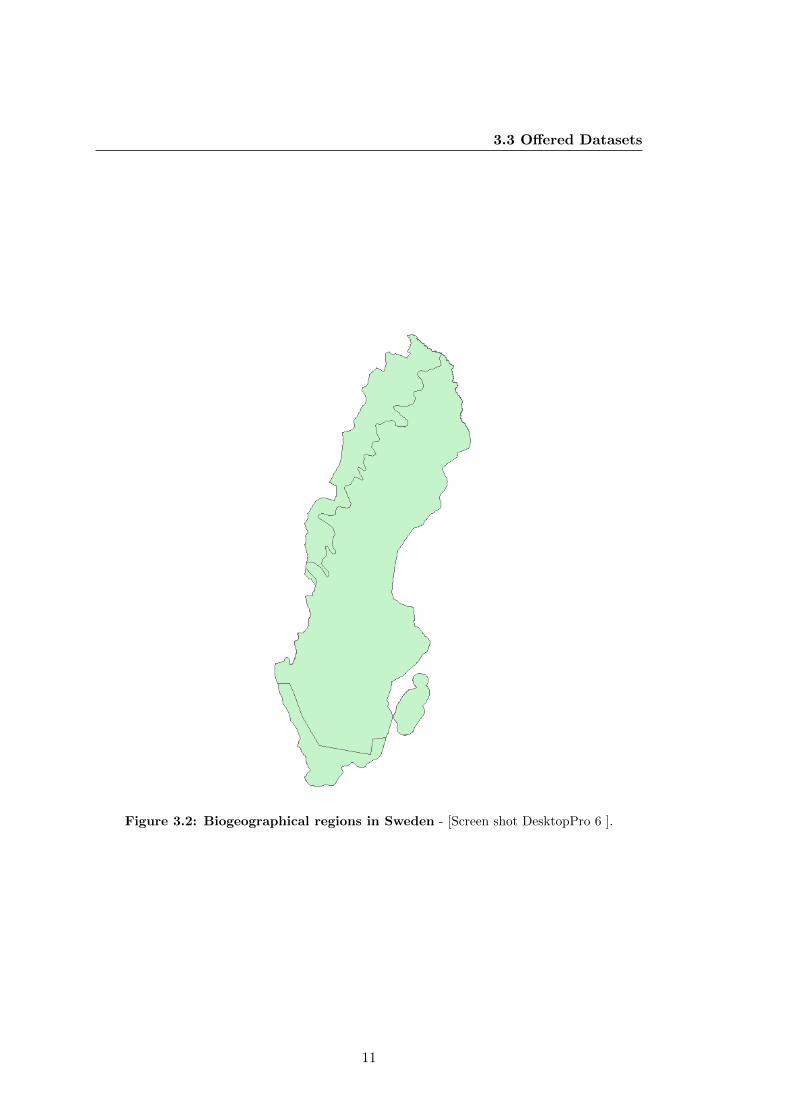
3.3 Offered Datasets
As already stated in section 2.2, the WFS shall offer data according to four INSPIRE
schemata. The time when I ran the tests three different datasets were available. The
first one contained information about protected areas of the Swedish county Gavleborg.
It is harmonized according to the final INSPIRE data specification. The second dataset
contained biogeographical regions of whole Sweden. It is harmonized according to a
draft for this INSPIRE data schema. This is not finalized, so in the future there might
be some changes. Figures 3.2 and 3.3 show data structures of these two datasets.
10
3.3 Offered Datasets
Figure 3.2: Biogeographical regions in Sweden - [Screen shot DesktopPro 6 ].
11

3.3 Offered Datasets
Figure 3.3: Protected areas in Gavleborg - [Screen shot DesktopPro 6 ].
The third one contained data from habitats and biotopes. This one was unhar-
monized, furthermore its data specification is not final. It was included in the tests
because among the four datasets it was the largest one. That is because it had many
features and many attributes. For the fourth schema, species distribution, the data was
not available. The first three datasets were provided by the Swedish Environmental
Protection Agency, the fourth will come from the Swedish University of Agricultural
Sciences.
Therefore three of the four datasets which have to be provided later by the final
WFS had been used to test the performance. The two harmonized datasets founded a
good basis because they had a different number of attributes. As described in section
2.3, a WFS provides spatial data which are downloaded as GML. In a comparison to a
less hierarchical structured text based file format or even a binary file format a GML
file is larger with the same amount of information. For a download service the size of a
file is very important. The number of attributes affects the file size considerably. For
data as specified in one of the INSPIRE schemata, there are several attributes which are
mandatory and must be recorded, but some are voidable. Inclusive the geometry one
feature in protected sites had 14 attributes, one feature in biogeographical regions had
only nine. This should be considered, it could be important to figure out the influence
12

3.4 Criteria for Quality of Service
of a data specification for the performance of the WFS. The dataset about biotopes and
habitates had 73 attributes because is is not harmonized, but after a harmonization
many attributes would be eliminated. However, it is useful to test how the WFS can
deal with requests for large datasets.
3.4 Criteria for Quality of Service
In (Network Services Drafting Team, 2009) are the Quality of Service requirements for
a WFS defined. These are crucial for the main objective of this thesis. In this document
the criteria for the QoS are enlisted which are performance, capacity and availability.
• Performance
The performance is defined as the time the service needs to reply a request. The
maximum response time is given for a certain capacity. Furthermore a certain
transfer speed shall be kept for the ”Get Spatial Objects” and the ”Describe
Spatial Object Types” operations. Figure 3.4 shows in detail all the defaults.
Figure 3.4: Performance criteria download service - [(Network Services Drafting
Team, 2009)].
• Capacity
The capacity is the number of requests a service can reply for the defined perfor-
mance. The minimum is ten requests per second. Furthermore the service can
limit the number of requests to 50 at the same time.
13

3.5 Tools for performance testing
• Availability
The availability defines how often the service must be able to answer a request.
This specification says that this must be the case for 99 % of the time.
3.5 Tools for performance testing
To test the conformance of the WFS, I tried two tools for performance testing. This
kind of software is able to simulate a huge number of virtual concurrent users accessing
a web service. The first one is WAPT (SoftLogica, 2010) and is a commercial software to
test web services. It is a powerful tool but was not able to measure the single download
time in a response. It could only show the overall response time which includes also
the time the server needs to process a request. As stated in the previous section,
the specification defines on the one hand a maximum time for the service to reply to
a request and on the other hand a minimum download speed. The second tool was
JMeter (The jakarta project, 2010). It is open source and based on Java. This tool
has not so powerful evaluation possibilities as WAPT but can measure not only the
overall load time of a response, but also the latency, the time when the first byte of the
response is received. The difference between both numbers is important to compute
the transfer time and -rate. To start a test in JMeter, first a testplan is created which
organizes a test run. It has several types of virtual users, so called Thread-groups
simulating one or several users. Each Thread-group has a defined sequence of requests.
Furthermore many parameters for the result can be recorded. Another advantage of
JMeter is that it is easy to configure and a testplan can be changed quickly.
3.6 Detailed test description
The applied tests were load and performance tests. They were designed as black box
tests since only the performance of the software counts but not how the software itself
works. The first test run was the major one. Its purpose was to figure out the perfor-
mance of the WFS and its INSPIRE conformance. The second test run had the goal
to see how the performance is for large files.
14

3.6 Detailed test description
Location University Server
Time afternoon 13:00 15:45
Time evening 18:00 20:45
Time night 23:00 01:30
Table 3.1: Times and locations for first test run
Request Dataset Size in KB
GetCapabilites - 6.15
DescribeFeatures Biogegraphical regions 1.72
DescribeFeatures Protected areas 2.81
GetFeature Biogegraphical regions 107.6
GetFeature Protected areas small 51.3
GetFeature Protected areas medium 100.37
GetFeature Protected areas large 202.35
Table 3.2: Sizes of the responses to the basic requests.
3.6.1 Test INSPIRE conformance
This test has been repeated two times the same day to obtain reliable results. JMeter
had been executed on two different locations, first from a remote client which was also
connected to the university and then from the server itself. According to the INSPIRE
specifications it must be measured on the server, but I did it also from another computer
to record results for the download speed.
The basic operations for a download service were executed. For GetFeature request
of the protected areas a bounding box has been additionally applied to measure the
performance for different file sizes of the response (Figure 3.2).
The file sizes of the GetFeature request have been determined experimentally before
and are good to demonstrate if the WFS complies with the requirements. Furthermore
each operation has been run with 1, 5, 10, 20 and 50 virtual users each in a separate
thread-group. The duration of each test was 150 s, the break to the next test 30 s.
15

3.6 Detailed test description
File size in KB
1019.22
5235.91
9950.7
19970.13
38831.26
Table 3.3: File sizes of large reqested data sets.
3.6.2 Test of large datasets
The second test has been run some days after the first one to measure the performance
for way larger GML files than requested in the first test. This test run has been per-
formed two times only on the server. The times were 21:00 and 02:00. Only GetFeature
operations of the third dataset with data about biotopes and habitats were requested.
Figure 3.3 presents the received file sizes. Each test for a specific file size was run in
an own thread-group with 10 concurrent users, the duration was 600 s and the break
to the next test 30 seconds.
16

4
Results
This chapter presents the results of the two test runs. Since much data has been
collected, it is impossible to present them all here. Therefore only derived values are
used, the basis is always the average of all recordings of the responses of one thread-
group. This was computed as the arithmetic mean. First data comparing differences
of the time of the measurement will be presented. Then for each of the three WFS
basic operations the results will be shown both for their response time and for their
throughput. To give a clue about the download rate the transfer speed will be presented
for the performance tests from a remote computer. To see how well the WFS can provide
large datasets, data from the second test run show response time for various file sizes.
I used the following abbreviations for the operations: GetCaps = GetCapabilities,
DF = DescribeFeature and GF = GetFeature. For the datasets I used: PA = Protected
Areas, BR = Biogeographical Regions and BH = Biotops and Habitats. For the size
of the dataset the following was used: sma = small, med = medium, lar = large.
4.1 Results of the first test run
4.1.1 Deviation related to time of day
Figure 4.1 illustrates the deviations related to the time when the tests were performed.
First all measurement results for one request at one test run had been averaged. Next
the values for a different number of users has been averaged.
17

4.1 Results of the first test run
Figure 4.1: Deviations between measurements at different times of day - .
18

4.1 Results of the first test run
4.1.2 Performance of the different operations
In the figures 4.2, 4.3 and 4.4 are the response times for the operations illustrated. The
values are the average values from the three test times executed on the server. Table
4.1 depicts the throughput of the different requests. The data was averaged as before
and are also from the same test run.
Figure 4.2: Response times for the GetCapabilities requests - Request: GetCa-
pabilites (GetCaps) .
19

4.1 Results of the first test run
Figure 4.3: Response times for the DescribeFeature requests - Reqests: De-
scribeFeature protected areas (DF PA) and DescribeFeature biogeographical regions (DF
BR).
20

4.1 Results of the first test run
Figure 4.4: Response times for the GetFeature requests - Requests: GetFeature
protected areas small (GF PA sma), GetFeature protected areas medium (GF PA med),
GetFeature protected areas large (GF PA lar) and GetFeature biogeographical regions (GF
BR) .
21

4.2 Results of the second test run
# user GF PA sma GF PA med GF PA lar GF BR GetCaps DF PA DF BR
1 6.94 4.7 2.66 4.36 185.49 31.13 50.85
5 12.62 10.22 7.27 12.25 552.81 39.03 61.91
10 12.65 10.17 6.63 12.03 473.93 39.22 61.62
20 12.66 10.28 7.24 12.18 393.23 39.27 59.71
50 12.62 10.39 7.47 12.31 342.08 38.88 51.95
Table 4.1: Throughput first test run in ms.
# user GF PA sma GF PA med GF PA lar GF BR
1 14707.96 10999.89 10051.79 10790.46
5 14084.52 10904.29 10022.56 10847.12
10 14442.55 10888.56 10088.96 10843.67
20 14136.32 10631.6 10024.36 10781.05
50 13937.58 10793.3 9910.14 10697.6
Table 4.2: Transfer rate first test from remote computer in KB/s.
4.1.3 Transfer rate of downloads
Table 4.2 depicts the values for the transfer speed of several queried datasets. The
values are computed by the difference between the latency and the response time of
this value and the size of the received GML file. The measurements were recorded
during the test run on the remote computer and are the average value of the three
different times. The results for the same test executed on the server show for most of
the responses no time difference. Therefore it was impossible to computer the transfer
speed for this test run.
4.2 Results of the second test run
In table 4.3 the values for the response time of the second test run are shown. These
are the average of the first and second tests and show this value for different file sizes.
Requesting a file larger than 39 MB was not possible.
22

4.2 Results of the second test run
Size Response time
1 8313.94
5 33532.08
10 63169.04
20 24723.37
39 266656.02
Table 4.3: Response times of the second test run in ms.
23

5
Discussion
The results of the performance tests showed little deviation. The variations between
the different times of the day were small and have no regular pattern. Therefore it
is possible to conclude some statements about the performance of the WFS from the
measurements.
The WFS complies with the INSPIRES specification for the QoS requirements of a
download service. For each operation this service could always reply within the given
maximum response time. Even for a number of 50 users, the highest response times
of 0.149 s for Get Capabilities, 1.293 s for Describe Feature Type and 4.117 s for
GetFeatures according to the first test run were under the thresholds of 10, 10 and 30
s respectively for each request.
The simulation of different numbers of users shows that the WFS also fulfills the
capacity requirement. According to this the server may limit the maximum number
of users to 50. This was also the maximum number of tested concurrent users, the
throughput values were almost always higher than ten users. Another result is that the
service keeps a constant throughput for a larger number of users, there is a proportional
relation between the number of users and the response time.
In the first test run one exception does not fulfill the performance requirement.
This is the GetFeature operation when larger files are requested. This infers that the
file size of the returned GML is an important influence factor. The specification indeed
says that the specification is only applicable for a GetFeature operation if a bounding
box constrains the request. But there is no value set for the size of the replied GML
file or how many spatial objects this should contain. The performance requirement for
24

this operation was fulfilled for requesting features from the datasets biogeographical
regions, small and medium protected areas. For the dataset containing protected areas
large which has a size of about 200 KB the throughput was between 6 and 8 users per
second which is not enough.
The results from the second test run show that the WFS lacks in delivering large
files. Querying spatial features which result in a 5 MB large GML file by ten concurrent
users already exceeds with 33 s the limit for an initial response of 30 s. This can be a
practical issue when the service is operational. If one user queries a large dataset this
will slow down the performance for other requests. And the size of 5 MB for spatial
data encoded as GML is not unusual today.
The transfer rate of the WFS is sufficient. The tests performed on a remote com-
puter illustrate that the network connection with 100 Mbit/s was the bottleneck. The
transfer rate was between 10 MB/s and 15 MB/s which is more than the required 0,5
MB/s. Because JMeter is not really able the measure the time from the very first to
the last received byte the value were slightly higher especially for the smaller response
files. When the tests were performed on the server, the time for retrieving the data was
even too short to measure it. There is also an alternative criteria specified for the min-
imum transfer rate of the queried features, but this is very inaccurate. It only makes a
statement about the minimum number of spatial objects that should be delivered per
second. However, a spatial object can have a simple structure with a simple geometry
like a point so that it can be stored with some KBs or it has a complex structure and
the geometry is based on a polygon with many coordinates which file size is multiple.
This can be seen by comparison of the throughput values of PA medium and BR. Both
the size of their responses and the throughput value are slightly smaller which means
that it takes longer to retrieve it from the server.
Since the tests have been performed for a short period of time, it is not possible to
draw conclusions about the reliability of the WFS. It can be only said that there was
always a correct response to a request during the first test. For the second test run
there were three error messages returned while querying the largest dataset which itself
was not very applicable.
To enhance the performance of the WFS so that it could handle large files or a
higher number of users one solution can be cloud computing. This is a new concept for
25

SDI which has already been introduced in other areas of computer science years ago
(Schaffer et al., 2010).
26

6
Conclusions
From the results of the executed load and performance tests the following conclusions
can be derived for this study work :
• The implemented WFS complies with the INSPIRE implementation rules for a
download service.
• In the INSPIRE requirements the performance criteria for the Get Spatial Object
operation is inaccurate. It can be fulfilled by requesting small datasets which does
not meet practical applications.
• In term of the number of concurrent users the WFS shows a good scalability.
Doubling the number of users results in approximately double response time.
27

References
Drafting Teams ”Data Specifications”, ”Network Services”, ”Metadata”. (2007). In-
spire technical architecture - overview. Drafting Teams ”Data Specifications”, ”Net-
work Services” ,”Metadata”.
European Commission INSPIRE. (2010). Inspire workprogramme: Network ser-
vices. Retrieved 2010-06-04, from http://inspire.jrc.ec.europa.eu/index.cfm/
pageid/5/list/5
Hicks, I. D., South, G. J. and Oshisanwo, A. O. (1997). Automated testing as an aid
to systems integration. BT Technology Journal .
Horak, J., Ardielli, J. and Horakova, B. (2009). Testing of web map services. Interna-
tional Journal of Spatial Data Infrastructures Research.
Kiehle, C. (2006). Business logic for geoprocessing of distributed geodata. Computers
and Geosciences, 32 (10), 1746 - 1757.
Maguire, D. J., and Longley, P. A. (2005). The emergence of geoportals and their
role in spatial data infrastructures. Computers, Environment and Urban Systems,
29 (1), 3 - 14. Available from http://www.sciencedirect.com/science/article/
B6V9K-4DS2T8S-2/2/c5da05c31b7ebdecd8e48b8243fa198f (Geoportals)
Menasc, D. A. (2002). Load testing of web sites. IEEE INTERNET COMPUTING .
Myers, G. J., Badgett, T., Thomas, T. M. and Sandler, C. (2004). The art of software
testing. Verlag John Wiley and Sons, Inc.
NatureSDIplus consortium . (2009). Nature sdi plus. Retrieved 2010-05-25, from
http://www.nature-sdi.eu/
Network Services Drafting Team. (2009). Draft implementing rules for download ser-
vices. Available from http://inspire.jrc.ec.europa.eu/index.cfm/pageid/5
28

REFERENCES
Open Geospatial Consortium Inc. (2005). Web feature service implementation specifi-
cation.
Ostman, A. (2010). Network for testing gi services. GIS Ostrava 2010 .
Schaffer, B., Baranskil, B. and Foerster, T. (2010). Towards spatial data infrastructures
in the clouds. AGILE 2010 .
SoftLogica. (2010). Wapt. Retrieved 2010-05-30, from http://www.loadtestingtool
.com/
SuperMap Software Co., Ltd. (2009). Supermap is.net 6 help [Computer software
manual].
SuperMap Software Co., Ltd. (2010). Supermap software. Retrieved 2010-05-30, from
http://www.supermap.com/
THE EUROPEAN PARLIAMENT AND COUNCIL. (2007). Directive 2007/2/ec of
the european parliament and of the council.
The jakarta project. (2010). Jmeter. Retrieved 2010-05-30, from http://jakarta
.apache.org/
Troni, F., Margevicius, M. A. and Silver, M. A. (2008). Total cost of ownership
comparison of pcs with server-based computing. Gartner RAS Core Research Note
G00159622 .
29