
Setting the Context for CCS Dr Simon Reeve · Setting the Context for CCS by Dr Simon Reeve The...
50
1 Setting the Context for CCS by Dr Simon Reeve The LRET Research Collegium Southampton, 11 July – 2 September 2011
Transcript of Setting the Context for CCS Dr Simon Reeve · Setting the Context for CCS by Dr Simon Reeve The...

1
Setting the Context for CCS
by
Dr Simon Reeve
The LRET Research CollegiumSouthampton, 11 July – 2 September 2011

Lloyd’s Register Group
Global Trends in Power Plant DevelopmentSetting the context for CCS
Simon ReevePower Sector DirectorEnergyJuly 2011

Lloyd’s Register Group
Global Trends in Power Plant development
• Lloyd’s Register – An overview
• Global Trends in Power Plant development
• Electricity production 2010 – 2040
• Power Technology Development
• Nuclear
• Thermal (Coal, Gas, Carbon Capture & Storage)
• Renewables (Wind, Marine)
• Other Power Technologies
• Conclusion
• Appendix

Lloyd’s Register Group
How we started
• in a 17th Century Coffee house in London owned by Mr. Edward Lloyd
• customers formed the ‘Register Society’ in 1760 to examine merchant ships and ‘classify’ them. The first ‘Register of Ships’ was published in 1764 –“Lloyd’s Register”
• other customers formed ‘Lloyd’s of London’ the finance institution – no relation to Lloyd’s Register!

Lloyd’s Register Group
The Group at a glance
• 7,500 employees of 90 nationalities
• 101 companies
• Celebrating our 250 year anniversary this year
• Four business divisions:
• Marine
• EnergyEnergyEnergyEnergy
• Transportation
• Management Systems (LRQA)
• Anticipated annual turnover $1.0bn
Lloyd’s Register Group
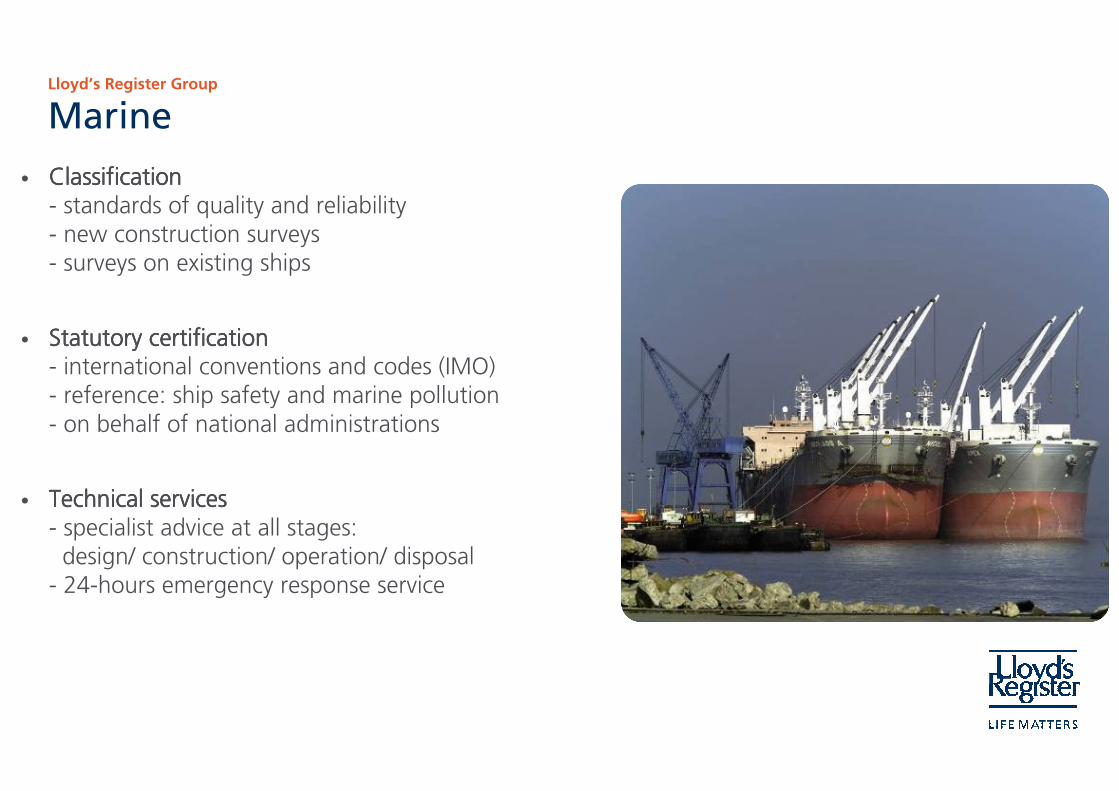
Marine
• ClassificationClassificationClassificationClassification- standards of quality and reliability- new construction surveys- surveys on existing ships
• Statutory certificationStatutory certificationStatutory certificationStatutory certification- international conventions and codes (IMO)- reference: ship safety and marine pollution- on behalf of national administrations
• Technical servicesTechnical servicesTechnical servicesTechnical services- specialist advice at all stages:design/ construction/ operation/ disposal
- 24-hours emergency response service

Lloyd’s Register Group
Transportation
• Services to help improve rail systems safety, quality and asset management
• Strategic and economic management consultancy services to the wider transport sector:- Lloyd’s Register Rail has technology and assurance focus
- BSL Management Consultants focuses on the economic, organisational and corporate governance issues
• Recent projects include:- Taiwan High Speed Rail Project- Palm Jumeirah monorail system in Dubai
- Metro safety assessment, signal in China
- ISA for signal system lifecycle on Incheon Maglev, Korea

Lloyd’s Register Group
Management Systems (LRQA)
• Business Assurance approach
• Assessment and certification - quality/ environmental / health and safety standards- ISO 9000 and ISO 14001
• Verification- EC directives- Carbon emissions
• Serve many industries- over 35,000 clients in 110 countries- food/ telecommunications/ aerospace/ automotive/ pharmaceutical, IT…

Lloyd’s Register Group
Energy - Upstream
Example applications:
• fixed offshore platforms
• pipelines (offshore / onshore)
• semi-submersibles / drilling ships
• FPSO / FSO / FLNG
Example services:
• verification
• optimising risk-based inspection
• classification guidance
• risks and procedures

Lloyd’s Register Group
Energy - Downstream
Example applications:
• storage (tank farms, underground gas storage)
• petrochemicals
• bulk chemicals
Example services:
• optimising risk-based inspection
• life extension studies
• risk consultancy

Lloyd’s Register Group
Energy - Nuclear Power
Example applications:
• first-generation nuclear power plants
• new power plants
Example services:
• design approval
• asset integrity management with bespoke
• software solutions
• regulatory compliance assessment
• risk consultancy
• asset management system certification

Lloyd’s Register Group
Energy - Thermal Power
Example applications:
• New-build fossil plant
• Rehabilitation of existing plant
• Carbon, capture & storage
Example services:
• asset integrity management with bespoke
software solutions
• supply-chain verification
• regulatory compliance assessment
• risk consultancy
• asset management system certification

Lloyd’s Register Group
Energy - Renewable Power
Example applications:
• Off-shore wind
• On-shore wind
• wave and tidal / marine renewables
Example services:
• project certification (IEC TS 61400 – 22)
• wind turbine design evaluation
• support structure manufacturing surveillance
• PAS 55, HSE and IV&V
• measurement and failure investigation

Lloyd’s Register Group
Energy - Manufacturing
Example applications:
• pressure systems
• ports and cranes
• containers
Example services:
• advice on ASME, EN standards and
• EU directives
• risk-based vendor inspection
• design appraisal

Lloyd’s Register Group
Energy - Asset life cycle
We bring added value for our clients at each stage of the asset life cycle.

Lloyd’s Register Group
Energy - Supply chain
We work with businesses operating at every stage of the energy supply chain.

Lloyd’s Register Group
Global Trends
• Oil prices continue to rise though policy action will have a significant effect on the rate & stability.
Source: OECD/IEA 2010. “450 scenario” refers to a scenario wherethe long-term concentration of greenhouse gases in the Earth's atmosphereis limited to 450 parts per million of carbon-dioxide equivalent
Oil price changes in period 2008 - 2035

Lloyd’s Register Group
Global Trends
• Global Energy use grows by 36%
• Lead is China with 75% growth
Source: OECD/IEA 2010
World Primary Energy Demand by region
In New Policies scenario

Lloyd’s Register Group
Global Trends
• The change in fuel source for primary energy demand is markedly different for OECD and non OECD countries.
• Thermal fossil power (Coal, Oil & Gas) continue to grow globally
• Nuclear primary growth is strong in OECD, China & other countries
• Renewables growth is similar in both markets.
Source: OECD/IEA 2010
Change in Primary Energy demand
in New Policies Scenario, 2008 - 2035

Lloyd’s Register Group
Global Trends
• A drop in coal-fired generation in the OECD is offset by big increases elsewhere, especially China, where 600 GW of new capacity exceeds the current capacity of the US, EU & Japan
Source: OECD/IEA 2010
Coal-fired electricity generation by region
In the New Policies scenario

Lloyd’s Register Group
Global Trends
• CO2 abatement technologies will have a significant impact on the balance of power technologies employed.
• Progress in adopting these technologies will accelerate in the period up to 2020.
• EMEA and Americas are likely to adopt in parallel. Asia will follow within a 5–10 year period.
Source: OECD/IEA 2010.
World energy-related CO2 emission savings in 450 scenario, 2008 - 2035

Lloyd’s Register Group
Global Trends
• Tripling of renewable energy driven by electricity supply rising from 19% in 2008 to 32% in 2035
• Largest growth in EU, US & China
Source: OECD/IEA 2010
Renewable primary energy demand
New Policies Scenario 2008 - 2035

Lloyd’s Register GroupLloyd’s Register Group
Nuclear Power

Lloyd’s Register Group
Nuclear Power Drivers
BenefitsBenefitsBenefitsBenefits
• Fuel availability
• Low emissions
• Advanced technology
ChallengesChallengesChallengesChallenges
• Cost
• Safety

Lloyd’s Register Group
Nuclear Technology
Current reactor technology is Generation III+
Pressurised Water Reactors. (PWR)
Leading designs: EPR (Areva)
AP1000 (Westinghouse)
Currently under construction:
EPR Olkiluoto (Finland)
Flaminville (France)
Taishan 1 & 2 (China)
AP1000 Sanmen (China)
Haiyang (China)
UK: Major programme to replace end-of-life Magnox & AGR plant.
Lloyd’s Register Group
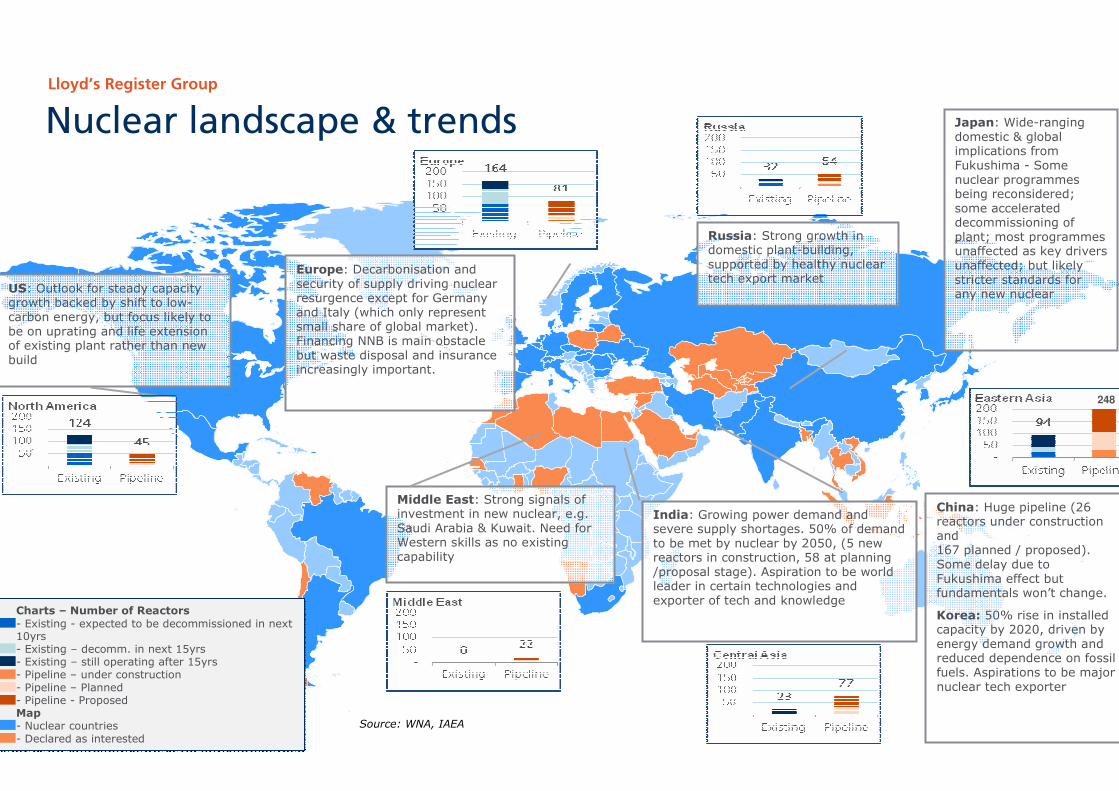
Nuclear landscape & trends
Source: WNA, IAEA
Charts – Number of Reactors
- Existing - expected to be decommissioned in next 10yrs- Existing – decomm. in next 15yrs- Existing – still operating after 15yrs- Pipeline – under construction- Pipeline – Planned- Pipeline - ProposedMap- Nuclear countries- Declared as interested
Charts – Number of Reactors
- Existing - expected to be decommissioned in next 10yrs- Existing – decomm. in next 15yrs- Existing – still operating after 15yrs- Pipeline – under construction- Pipeline – Planned- Pipeline - ProposedMap- Nuclear countries- Declared as interested
Japan: Wide-ranging domestic & global implications from Fukushima - Some nuclear programmes being reconsidered; some accelerated decommissioning of plant; most programmes unaffected as key drivers unaffected; but likely stricter standards for any new nuclear
Middle East: Strong signals of investment in new nuclear, e.g. Saudi Arabia & Kuwait. Need for Western skills as no existing capability
India: Growing power demand and severe supply shortages. 50% of demand to be met by nuclear by 2050, (5 new reactors in construction, 58 at planning /proposal stage). Aspiration to be world leader in certain technologies and exporter of tech and knowledge
US: Outlook for steady capacity growth backed by shift to low-carbon energy, but focus likely to be on uprating and life extension of existing plant rather than new build
China: Huge pipeline (26 reactors under construction and167 planned / proposed). Some delay due to Fukushima effect but fundamentals won’t change.
Korea: 50% rise in installed capacity by 2020, driven by energy demand growth and reduced dependence on fossil fuels. Aspirations to be major nuclear tech exporter
248
Russia: Strong growth in domestic plant-building, supported by healthy nuclear tech export market
Europe: Decarbonisation and security of supply driving nuclear resurgence except for Germany and Italy (which only represent small share of global market). Financing NNB is main obstacle but waste disposal and insurance increasingly important.

Lloyd’s Register Group
Nuclear Market value*Construction Fuelling & Operation Decommissioning
94.2
116.3
28.4
28.9
35.5
48.7
New build construction costs in period 2022-2031 (total: £352.0bn)
Eastern Asia
Europe
Russia
Middle East
Central Asia
North America
131.0
81.6
42.3
29.4
28.825.4
New build construction costs in period 2011-2021 (total: £338.5bn)
Eastern Asia
Europe
Russia
Middle East
Central Asia
North America
5.6 4.2 4.3
4.4 2.8 3.6
2.8 6.4 5.0
13.9
16.3 15.9
-
5
10
15
20
2011 2021 2031
Front-end fuel cycle annual cost (£bn) Middle
East
Central
Asia
Russia
Eastern
Asia
North
America
1.9 1.4 1.4
1.5 0.9 1.2
0.9 2.1 1.7
4.6
5.4 5.3
-
2
4
6
2011 2021 2031
Back-end fuel cycle annual cost (£bn)
Middle
East
Central
Asia
Russia
Eastern
Asia
North
America
13.4 10.1 10.3
8.1
5.2 6.7
3.5
7.8 6.1
27.3 28.6 28.7
-
10
20
30
2011 2021 2031
O&M annual cost (£bn)
Middle
East
Central
Asia
Russia
Eastern
Asia
North
America
29.116.7
3.63.10.1
Decommissioning costs in period 2011-21 (total: £52.6bn)
Europe
North America
Eastern Asia
Russia
Central Asia
Middle East
33.3
13.4
4.31.6 0.1
Decommissioning costs in period 2022-31 (total: £52.7bn)
Europe
North America
Eastern Asia
Russia
Central Asia
Middle East
Front-end: Uranium mining & milling, conversion, enrichment & fuel fabricationBack-end: Spent fuel transport, storage, reprocessing & disposal
New build costs: includes pre-construction, construction (engineering, procurement and construction) and contingency costs, excludes interest during construction
*Estimate based on forecasts of new nuclear build programmes andremaining operational life of existing.
Source: World Nuclear Association (WNA), OECD NEA, IEA, IAEA, PwCanalysis

Lloyd’s Register GroupLloyd’s Register Group
Thermal Power
Lloyd’s Register Group
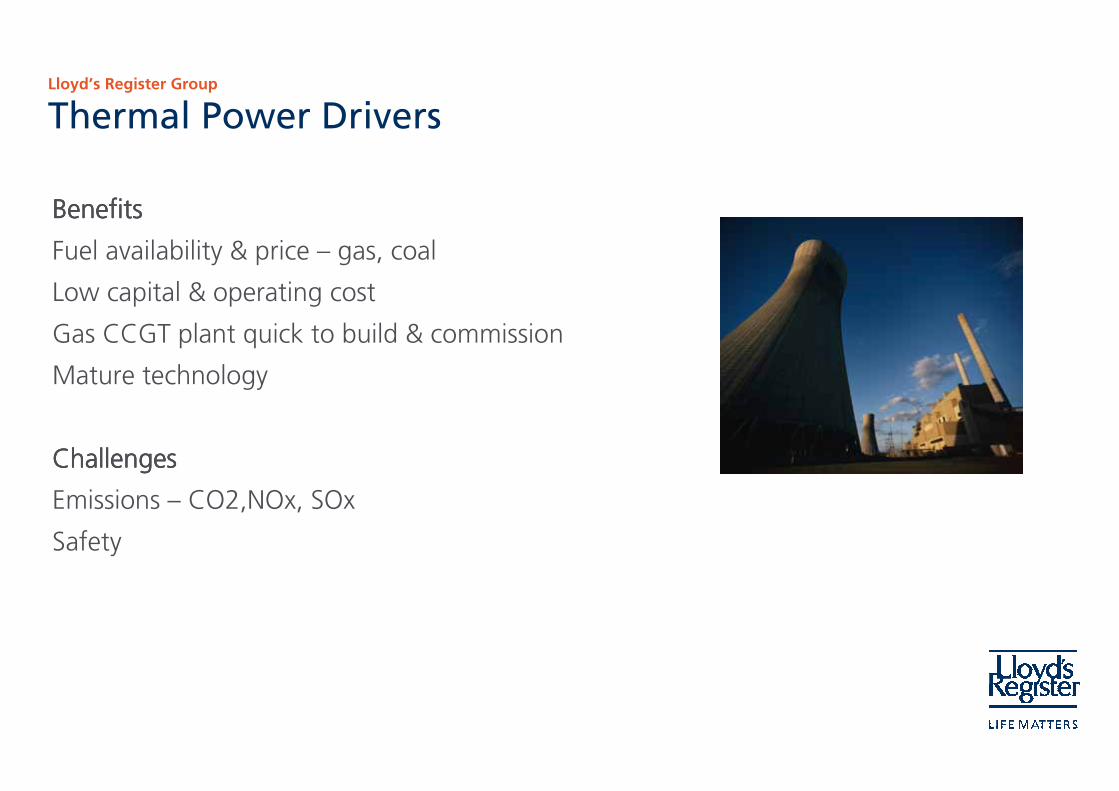
Thermal Power Drivers
BenefitsBenefitsBenefitsBenefits
Fuel availability & price – gas, coal
Low capital & operating cost
Gas CCGT plant quick to build & commission
Mature technology
ChallengesChallengesChallengesChallenges
Emissions – CO2,NOx, SOx
Safety

Lloyd’s Register Group
Thermal Technology
Coal-fired Plant
Boiler TechnologyBoiler TechnologyBoiler TechnologyBoiler Technology
Pulverised Fuel (PF) boilers
- subcritical 30-35% ηth (300bar / 600C / 620C)
- current advanced supercritical (ASC) 46-48% ηth (300bar / 600C / 620C)
- future ASC 50-55% ηth (350bar / 700C / 720C)
2 aims2 aims2 aims2 aims
1. Increase efficiency (less fuel / MW)
2. Decrease Emissions (NOx, SOx, CO2)

Lloyd’s Register Group
Thermal Technology
Coal-fired Plant
Best Available TechnologyBest Available TechnologyBest Available TechnologyBest Available Technology (BAT)
Steam Conditions: ~300bar / 600C / 620C
Net thermal Efficiency: ~46% ηthSelective Catalytic Reduction (SCR) for NOx emissions
Flue Gas Desulpherisation (FGD) for SO2 emissions
Electrostatic Precipitator (ESP) for particulate removal
Plant Layout supports space for carbon capture equipment
Retrofit capability for higher temperatures & pressures, biomass co-firing & CCS
Main challenge to 700C technologies: material & cost limitations
(large volumes, high Ni-content alloys)

Lloyd’s Register Group
Thermal Technology
Natural Gas fired plant
H2 under developmentH2 under developmentH2 under developmentH2 under development
Back-up to NG but likely 30+ years away from H2 economy
Combined-cycle (CCGT) norm for large-scale power generation ηth 57575757----58%58%58%58%
NG preferred technologyNG preferred technologyNG preferred technologyNG preferred technology
1. Availability
2. Price
3. Ease of transport & storage
4. Quick to build/commission
5.5.5.5. Flexible load operationFlexible load operationFlexible load operationFlexible load operation
GT26 Gas Turbine (Alstom)
Lloyd’s Register Group
Thermal Technology
High efficiency, load flexible, low emission CCGTs
Alstom GT26 upgrade: 61% efficiency claimed
99.55% of full load efficiency at 80% load.
Turn down to 40% load & maintain emission compliance:
NOx <25ppm, CO<5ppm
Siemens: SGT5-8000H/Irsching 4: 60.75% CC efficiency witnessed at 578MW
Mitsubishi: M701F4: approaching 60% at 478MW
Source: Powergen Europe: 7 June 2011

Lloyd’s Register GroupLloyd’s Register Group
Renewable Power

Lloyd’s Register Group
Renewable Drivers
BenefitsBenefitsBenefitsBenefits
• Free fuel!
• Low emissions
ChallengesChallengesChallengesChallenges
• Intermittency
• Technology maturity
• Energy density
• Cost

Lloyd’s Register Group
Renewable Technology
Continued development in Onshore wind
Latest development is Offshore wind
• EU North Sea ~100GW to be installed UK, German & Dutch sectors
• East Coast China 21GW
• US
• France
Key issues
• Design for offshore environment
• Shallow, deep water & floating foundations
• Installation & support vessels
• Transmission & Distribution networks
Wind development

Lloyd’s Register Group
37GW UK sector – £100bn capex
27GW German sector
5GW Dutch sector
Wind development
Renewable Technology

Lloyd’s Register Group
Renewable TechnologyMarine Renewables
TidalTidalTidalTidal• Several technologies
• Demonstration projects: Bay of Fundy (Canada) 2012;
Pentland Firth (Scotland) 2013
• Commercial Operation ~2015?
• Technical challenges:
- marine environment,
- civil engineering & power take-off on sea bed,
WaveWaveWaveWave• Earlier in development.
• Many technologies
• Commercial Operation ~2020?
Ocean Power TechnologiesWave Buoy
Atlantis Resources CorporationTidal Turbine

Lloyd’s Register Group
Other Power Technologies
• Biomass / coBiomass / coBiomass / coBiomass / co----firing of power plantsfiring of power plantsfiring of power plantsfiring of power plants
Burning of ”biomass” such as wood, waste etc to generate electricity. One of the most attractive and easily implemented biomass energy technologies is cofiring with coal in existing coal-fired boilers. Biomass can substitute for up to 20% of the coal used in the boiler.
• Solar ThermalSolar ThermalSolar ThermalSolar Thermal
Solar energy is converted into thermal energy , usually steam, that in turn is converted to electrical energy using a turbine and generator.
• GeothermalGeothermalGeothermalGeothermal
Thermal heat obtained from the Earth’s interior is converted into electricity using a heat exchanger connected to a turbine generator set. Geothermal energy is also used for district heating, for example in Reykjavik where a district heating system provides heat for 95% of the buildings.
Solar thermal plant P10 in Seville, Spain
(11 MW from 624 mirrors, cost €35m)
Geothermal energy

Lloyd’s Register Group
Other Power Technologies
- Hydro
- Solar PV
- Grid Technologies(Transmission, Distribution & Smart Grids)
- Energy Storage
- Fuel Cells
- Water & Desalination
Reverse Osmosis DesalinationBarcelona, Spain
Challenge:
To link together with traditional plant in smart regional solutions

Lloyd’s Register Group
Conclusion
• Energy is essential to life and development
• Key drivers are fuel, cost & environment
• Relative merits of drivers change as technologies develop
• Fossil-fired electricity generation will continue to dominate on the world stage.
• Carbon Capture and Storage is sought as a means to use the fuel we have, in a manner that is acceptable to our environment and at a cost that is sustainable.
Change in Primary Energy demand, 2008 - 2035

Lloyd’s Register Group
Global Trends in Power Plant development
• Lloyd’s Register – An overview
• Global Trends in Power Plant development
• Electricity production 2010 – 2040
• Power Technology Development
• Nuclear
• Thermal (Coal, Gas, Carbon Capture & Storage)
• Renewables (Wind, Marine)
• Other Power Technologies
• Conclusion
• AppendixAppendixAppendixAppendix

Lloyd’s Register Group
Capacity and investment needs in power infrastructureNew Policies Scenario
3481171027346469307103685170331European Union
26261181597913243354217998636556562319World
60291261264462272745Brazil
110532543813893451491795Latin America
8842235451385728109876Africa
1024922970144592912910114Middle East
4071976795842821010228822200India
5662741168142760632306105438773China
1265613234724414949754721526741095Asia
74222549413860181436291Russia
2883718303310351329Caspian
1705141315723114443252123161E.Europe/Eurasia
173480834775542146132861721652321542Non-OECD
472821161111105631205074Japan
8248383981901569121159118Pacific
3861281080348498332110694158337Europe
345160873273411302140498191262United States
4241971039324520363169585207322North America
892373250277012088513701490424777OECD
DistributionTransmissionNew PlantRetirementsAdditionsDistributionTransmissionNew PlantRetirementsAdditions
Investment ($2009 billion)Capacity (GW)Investment ($2009 billion)Capacity (GW)
2021 - 20352010 - 2020
Source: IEA 2010New Policies Scenario

Lloyd’s Register Group
Regional Focus – EuropeSummary
MixMixMixMix 2008200820082008 2035203520352035
Electricity demand x 2
Coal 26% 10%
Gas 24% 24%
Renew. 20% 44%*
Nuclear 26% 21%
*Hydro 15%, Wind 18%, Solar 3%
Utilities/DevelopersUtilities/DevelopersUtilities/DevelopersUtilities/Developers
EDF
Vattenfall
RWE
Iberdrola
EoN
Endesa
EnBW
OEMsOEMsOEMsOEMs
Alstom
Siemens
GE
Mitsibushi
Mitsui Babcock
Source: IEA 2010New Policies ScenarioElectricity Generation (TWh)

Lloyd’s Register Group
Regional Focus – Middle EastSummary
MixMixMixMix 2008200820082008 2035203520352035
Electricity demand x 2
Gas 58% 63%
Renewable 1% 16%*
Nuclear <1% 2%
*Hydro 3%, Wind 5%, Solar 6%
Utilities/DevelopersUtilities/DevelopersUtilities/DevelopersUtilities/Developers
EDF
Vattenfall
RWE
Iberdrola
EoN
OEMsOEMsOEMsOEMs
Alstom
Siemens
GE
Mitsibushi
Mitsui Babcock
Source: IEA 2010New Policies ScenarioElectricity Generation (TWh)

Lloyd’s Register Group
Regional Focus – IndiaSummary
MixMixMixMix 2008200820082008 2035203520352035
Electricity demand x 4
Coal 69% 52%
Gas 10% 14%
Renewable11% 27%*
Nuclear 2% 6%
*Hydro 13%, Wind 6%, Solar 4%
Utilities/DevelopersUtilities/DevelopersUtilities/DevelopersUtilities/Developers
Examples:
APGENCO
Essar Energy
Larsen & Toubro
NTPC
NPCIL
OEMsOEMsOEMsOEMs
Alstom
GE
Mitsibushi
Mitsui Babcock
Siemens
Source: IEA 2010New Policies ScenarioElectricity Generation (TWh)

Lloyd’s Register Group
Regional Focus – ChinaSummary
MixMixMixMix 2008200820082008 2035203520352035
Electricity demand x 3
Coal 79% 55%
Gas <1% 9%
Renewable19% 29%*
Nuclear 2% 5%
*Hydro 14%, Wind 7%, Solar 2%
Utilities/DevelopersUtilities/DevelopersUtilities/DevelopersUtilities/Developers
Big 5:
China Datang Corporation
China Guodian Corporation
China Huadian Group
China Huaneng Group
China Power Investment Corporation
Nuclear:
China Guangdong Nuclear Power Group CGNPG
OEMsOEMsOEMsOEMs
Alstom
GE
Siemens
Shanghai Electric Co.
Harbin Steam Turbine Co.
Dongfang Electric Co.
Source: IEA 2010New Policies ScenarioElectricity Generation (TWh)

Lloyd’s Register Group
Regional Focus – United StatesSummary
MixMixMixMix 2008200820082008 2035203520352035
Electricity demand x 1.2
Coal 49% 33%
Gas 21% 23%
Renewable16% 27%*
Nuclear 18% 19%
*Hydro 12% & Wind 10%
Utilities/DevelopersUtilities/DevelopersUtilities/DevelopersUtilities/Developers
AES Corporation
Southern Company
American Electric Power
Duke Energy
Luminant
Reliant Energy
Pacific Gas and Electric Co.
Allegheny Energy
OEMsOEMsOEMsOEMs
Alstom
GE
Mitsibushi
Mitsui Babcock
Siemens - Westinghouse
Source: IEA 2010New Policies ScenarioElectricity Generation (TWh)

Lloyd’s Register Group
Key Organisations & Links for dataInternational Atomic Energy Association (IAEA): www.iaea.org
International Energy Agency (IEA): www.iea.org
IEA World Energy Outlook: www.worldenergyoutlook.org
IEA World Energy Statistics: www.iea.org/stats/
EuropeEuropeEuropeEurope
Nuclear Energy Agency: www.nea.fr/
Europe Energy Portal: www.energy.eu/
EoN www.eon.com
EDF www.edf.com
Endesa www.endesa.es
Iberdrola www.Iberdrola.es
RWE www.rwe.com
Vattenfall www.vattenfall.com
UKUKUKUK
Nuclear Industries Association www.niauk.org
Department of Energy & Climate Change www.decc.gov.uk
UK Energy Statistics (HANDOUT) www.decc.gov.uk/en/content/cms/statistics/publications/dukes

Services are provided by members of the Lloyd's Register Group. For further information visit www.lr.org/entities
For more information, please contact:
Simon ReevePower Sector Director, Energy
Lloyd’s Register group entity71 Fenchurch StreetLondon, EC3M 4BS
T +44 (0)20 7423 2160E [email protected] www.lr.org/energy
For more information, please contact:
Simon Reeve
Power Sector Director, Energy
Lloyd’s Register group entity71 Fenchurch StreetLondon, EC3M 4BS
T +44 (0)20 7423 2160E [email protected] www.lr.org/energy