Session Number T2003 Feedstock Ammonia in the BASF …klmtechgroup.com/PDF/Articles/articles/AIChE...
16
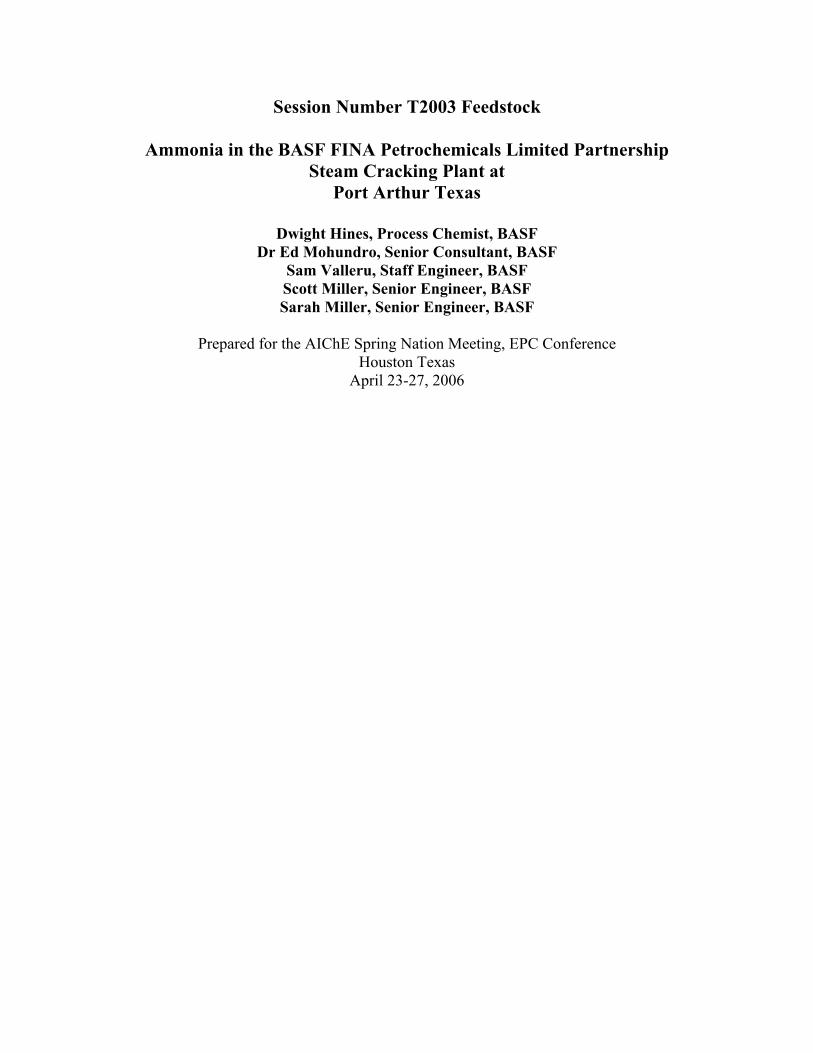
Session Number T2003 Feedstock Ammonia in the BASF FINA Petrochemicals Limited Partnership Steam Cracking Plant at Port Arthur Texas Dwight Hines, Process Chemist, BASF Dr Ed Mohundro, Senior Consultant, BASF Sam Valleru, Staff Engineer, BASF Scott Miller, Senior Engineer, BASF Sarah Miller, Senior Engineer, BASF Prepared for the AIChE Spring Nation Meeting, EPC Conference Houston Texas April 23-27, 2006
Transcript of Session Number T2003 Feedstock Ammonia in the BASF …klmtechgroup.com/PDF/Articles/articles/AIChE...
Session Number T2003 Feedstock
Ammonia in the BASF FINA Petrochemicals Limited Partnership Steam Cracking Plant at
Port Arthur Texas
Dwight Hines, Process Chemist, BASF Dr Ed Mohundro, Senior Consultant, BASF
Sam Valleru, Staff Engineer, BASF Scott Miller, Senior Engineer, BASF Sarah Miller, Senior Engineer, BASF
Prepared for the AIChE Spring Nation Meeting, EPC Conference
Houston Texas April 23-27, 2006

Ammonia in the BASF FINA Petrochemicals Limited Partnership Steam Cracking Plant at
Port Arthur Texas
Dwight Hines, BASF Chemical Company Dr Ed Mohundro, BASF Chemical Company
Sam Valleru, BASF Chemical Company Scott Miller, BASF Chemical Company Sarah Miller, BASF Chemical Company
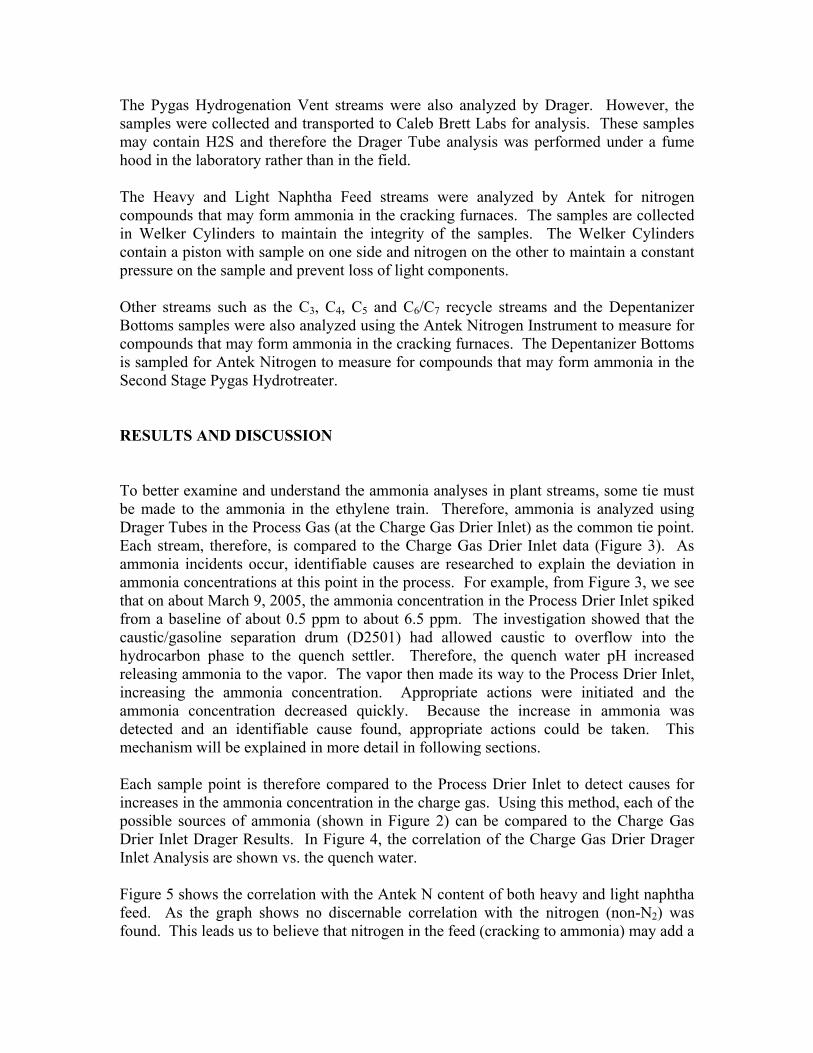
ABSTRACT Ammonia is a common contaminant in ethylene plants throughout the world. It can enter the plant in refinery gases, gas feeds or as nitrogen compounds that crack to ammonia in the steam cracking furnaces. Ammonia is a serious contaminant in ethylene and propylene because it is a poison to polyethylene and polypropylene catalysts. This paper is a case study on some causes of ammonia contamination in our plant, how it proceeds through the plant and some mitigation techniques. INTRODUCTION The BASF FINA Petrochemicals Limited Partnership (“BFLP”) steam cracker is located in Port Arthur Texas. The plant is a naphtha cracker with a nameplanet capacity of approximately 2.1 MMlbs/year of ethylene and 1.3 MMlbs/year of propylene. In late 2003 and early 2004, several customers began to notice small amounts of ammonia in the pipeline ethylene coming from the BFLP in Port Arthur. An investigation began even though the on-line Gas Chromatograph/Mass Spectrometer for ammonia analysis did not detect ammonia in the ethylene product. Other techniques (including the MDA tape analyzer from C.I. Analytics, Drager Tubes, scrubbing the ethylene through water and then using wet chemical methods for detecting the ammonia in water, and later Ion Mobility) confirmed that ammonia was in the ethylene product. Subsequent investigation revealed the drier upstream of the C2 splitter was saturated with ammonia. As moisture adsorbed on to the drier containing 3A molecular sieve, ammonia was desorbed into the ethylene stream. The drier was taken off-line for regeneration and the Ion Mobility Ammonia Analyzer (as well as the scrubbed samples and the MDA Tape Analyzer) clearly showed the drop in ammonia in the ethylene product (see Figure 1). From April through September of 2004, no off-spec incidents took place but monitoring of ammonia was done using the on-line Ion Mobility technology. However, during October, while the ethylene drier was being regenerated, ammonia again went off-spec in the ethylene product and a flaring event occurred. Since October of 2004, ammonia has been monitored but no off-spec events have occurred.

An in depth analysis of the sources of the ammonia began and in February of 2005 an Ammonia Mitigation Team was formed. The following analysis is the result of data collected over many months. SAMPLES, SAMPLING AND ANALYSIS METHODS The “root cause” investigation began by identifying potential sources of ammonia and the streams where the ammonia (or nitrogen compounds that may crack to ammonia), could be found. This list is found in Figure 2. The streams were sampled and ammonia and/or nitrogen compounds were measured. Ammonia is measured in several different ways depending on the substrate being measured. The on-line analyzer for ethylene uses a technique called Ion Mobility. It is very accurate even in the low ppb range. The detection limit is about 5 wppb in ethylene. However, this technique can only be used in pure gases such as ethylene product or propylene product. In water streams, ammonia was measured using an Ion Specific Electrode (ISE). In the charge gas or other vapor streams, length of stain tubes (Drager Tubes) are used to determine the concentration of ammonia. Drager Tubes can be used in the field directly or in the laboratory from sample bags or cylinders. Some streams may not contain ammonia but do contain other nitrogen compounds that could form ammonia in furnaces or reactors. For these streams, a laboratory-based instrument from the Antek Company is used. This instrument measures nitrogen compounds other than diatomic nitrogen (N2). These may include certain additives used in olefins plants (such as amines) or extraction solvents such as NMP (n-methylpyrrolidone) or NFM (n-formylmorpholine). Samples are done routinely at several different locations in the olefins plant. Water samples were taken through out the quench water circuit including:
1.) Quench Water 2.) Process Water Stripper Inlet 3.) Process Water Stripper Outlet 4.) Dilution Steam Condensate 5.) Blowdown
The Charge Gas samples were collected at the charge gas drier inlet and outlet, and were analyzed in the field by Drager. The samples were collected at this point because the drier will remove ammonia. Therefore, the inlet sample reflects the concentration of ammonia into the system and the outlet will show any breakthrough of ammonia.
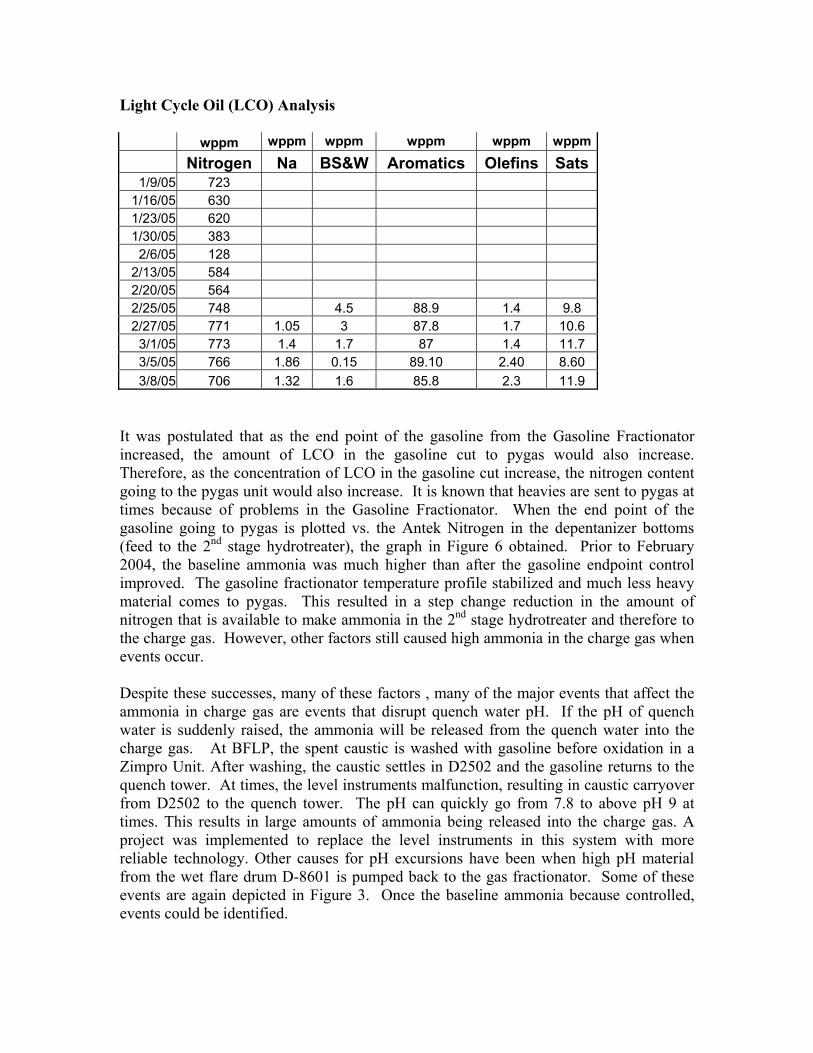
The Pygas Hydrogenation Vent streams were also analyzed by Drager. However, the samples were collected and transported to Caleb Brett Labs for analysis. These samples may contain H2S and therefore the Drager Tube analysis was performed under a fume hood in the laboratory rather than in the field. The Heavy and Light Naphtha Feed streams were analyzed by Antek for nitrogen compounds that may form ammonia in the cracking furnaces. The samples are collected in Welker Cylinders to maintain the integrity of the samples. The Welker Cylinders contain a piston with sample on one side and nitrogen on the other to maintain a constant pressure on the sample and prevent loss of light components. Other streams such as the C3, C4, C5 and C6/C7 recycle streams and the Depentanizer Bottoms samples were also analyzed using the Antek Nitrogen Instrument to measure for compounds that may form ammonia in the cracking furnaces. The Depentanizer Bottoms is sampled for Antek Nitrogen to measure for compounds that may form ammonia in the Second Stage Pygas Hydrotreater. RESULTS AND DISCUSSION To better examine and understand the ammonia analyses in plant streams, some tie must be made to the ammonia in the ethylene train. Therefore, ammonia is analyzed using Drager Tubes in the Process Gas (at the Charge Gas Drier Inlet) as the common tie point. Each stream, therefore, is compared to the Charge Gas Drier Inlet data (Figure 3). As ammonia incidents occur, identifiable causes are researched to explain the deviation in ammonia concentrations at this point in the process. For example, from Figure 3, we see that on about March 9, 2005, the ammonia concentration in the Process Drier Inlet spiked from a baseline of about 0.5 ppm to about 6.5 ppm. The investigation showed that the caustic/gasoline separation drum (D2501) had allowed caustic to overflow into the hydrocarbon phase to the quench settler. Therefore, the quench water pH increased releasing ammonia to the vapor. The vapor then made its way to the Process Drier Inlet, increasing the ammonia concentration. Appropriate actions were initiated and the ammonia concentration decreased quickly. Because the increase in ammonia was detected and an identifiable cause found, appropriate actions could be taken. This mechanism will be explained in more detail in following sections. Each sample point is therefore compared to the Process Drier Inlet to detect causes for increases in the ammonia concentration in the charge gas. Using this method, each of the possible sources of ammonia (shown in Figure 2) can be compared to the Charge Gas Drier Inlet Drager Results. In Figure 4, the correlation of the Charge Gas Drier Drager Inlet Analysis are shown vs. the quench water. Figure 5 shows the correlation with the Antek N content of both heavy and light naphtha feed. As the graph shows no discernable correlation with the nitrogen (non-N2) was found. This leads us to believe that nitrogen in the feed (cracking to ammonia) may add a

small amount to the base load of ammonia but is not the cause of the high ammonia incidents in the plant. From Figure 3, we see that the next possibilities for ammonia formation are the recycle streams from different parts of the plant. The C2 and C3 recycle streams were tested for ammonia by Drager Tube Analysis, and no ammonia was detected. These streams were analyzed for ammonia rather than nitrogen because they have already been through the cracking furnaces and would have formed ammonia there. The C4 recycle stream was tested for Antek Nitrogen (again non-N2 nitrogen) because the Butadiene Plant uses NMP (N-methylpyrrolidone), which does contain a nitrogen atom that could form ammonia in the cracking furnaces. However, the Antek Nitrogen levels for that stream have been very low. Some examples of typical analysis are shown below.
Antek Nitrogen in C4 Recycle to the Cracker
Date wt ppm 6/28/04 0.8 6/30/04 1.6 7/3/04 0.3
The C5 recycle stream was a definite suspect for ammonia formation because the depentanizer overhead contains a GE BETZ additive for corrosion control. The additive is a filming amine and would form ammonia during the cracking process. However, stream analyses again showed Antek Nitrogen levels to be very low. The depentanizer does have a water boot and water samples from this boot did show high levels of Antek Nitrogen. This water is sent back to the quench water system which is use to make dilution steam. These amines however would contribute very little to the amount of ammonia measured in the system. Also, the additive was discontinued for several weeks to test this theory and no discernable difference was detected. The C6/C7 Recycle from the pygas unit was suspect because the solvent used in the aromatics extraction (NFM n-formylmorpholine) unit contains nitrogen that could crack to ammonia. Although measurements showed small amounts of nitrogen in this stream, the flowrate is too low to account for the ammonia in the charge gas. Antek Nitrogen in the C6/C7 Recycle to the Steam Cracking Furnaces
Date wppm N
2004-04-03 09:14:29.0 3.7 2004-04-04 23:03:03.0 2.4 2004-04-05 09:07:09.0 1.9 2004-04-05 23:17:53.0 3.2 2005-12-02 09:49:01.0 3.2 2006-02-04 16:01:35.0 1.4
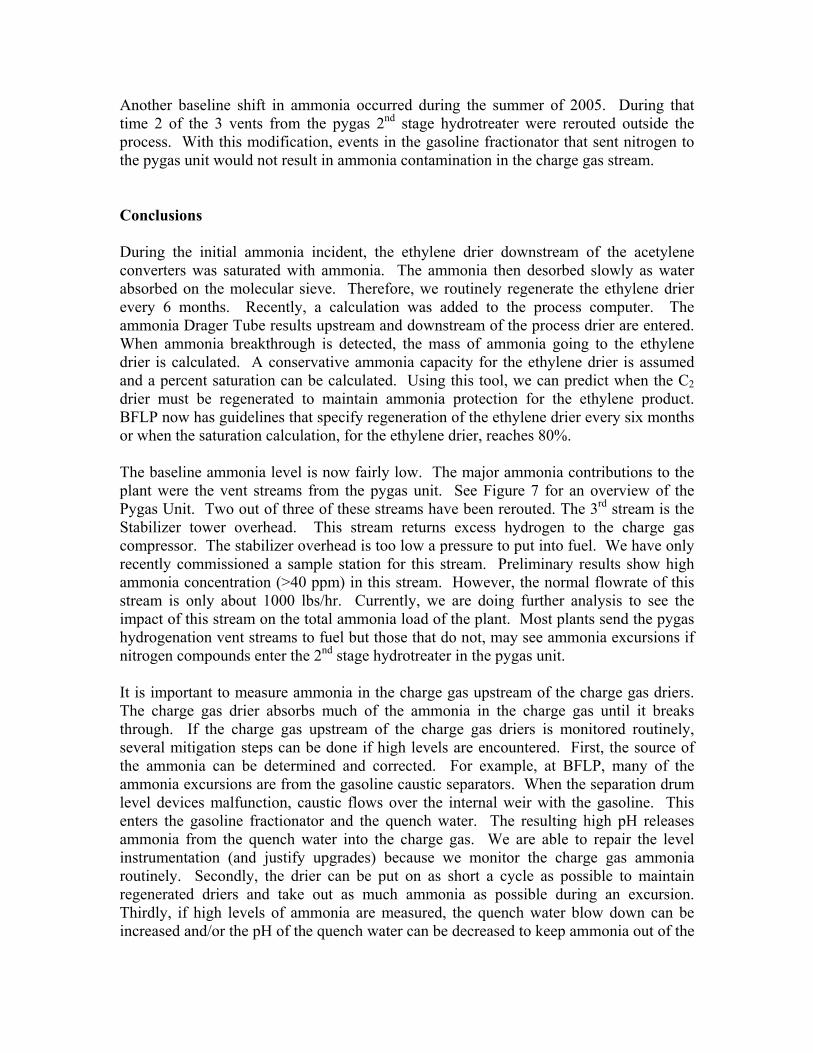
Other possibilities included FCCU gas from the refinery, fuel gas from the plant and purchased fuel gas or natural gas. The streams were tested using ammonia Drager Tubes and no evidence of ammonia was found. The use of corrosion inhibitors and antifoulants in steam crackers presents many real possibilities to form ammonia and NOx. Many of these contain nitrogen compounds that can crack to ammonia. These compounds would have enter the furnaces via recycle streams, to form ammonia. Therefore, recycle streams were monitored for Antek Nitrogen. As shown above, the recycle streams show very low Antek Nitrogen levels. In late 2004 and early 2005, we began to notice that when the Pygas Unit went down the ammonia in the quench water samples as well as Drager results at the charge gas drier inlet, decreased dramatically. Measurements for Antek Nitrogen were made in streams around the unit, with special attention to recycle streams. It was thought that additives, especially the filming amine used in the depentanizer overhead for corrosion control, might form ammonia in the furnaces. However, measurements were low and the amine was discontinued for a time and no appreciable difference was seen in the ammonia levels in the quench water or the drier inlet. Also, several instances occurred where the first stage hydrotreater and the depentanizer remained in service, while the second stage hydrotreater was down. During these times the ammonia in the quench water samples and drier inlet decreased just as they had when the entire unit was down. This led us to survey around the second stage for ammonia formation. Small amounts of Antek Nitrogen were measured in the depentanizer bottoms, which fed the second stage hydrotreater. The second stage hydrotreater is vapor phase and is operated at high temperature (about 500 F inlet temperature and about 600 F outlet temperature) and high pressure. This hydrotreater is used to hydrogenate thiophene and olefins. This severe hydrotreating will also hydrogenate many nitrogen compounds to ammonia. The excess hydrogen, hydrogen sulfide and other lights such as ammonia are vented back to the first and second stage of the charge gas compressor. When these streams were measured for ammonia with Drager Tubes, very high (as high as 650 ppm) amounts ammonia were found. The amount of ammonia returning to the first and second stage charge gas compressor would be sufficient to see the readings we found at the drier inlet. The remaining question was to find the source of the nitrogen to the second stage hydrotreater. As the nitrogen source was traced, we knew that the LCO (Light Cycle Oil) brought into the steam cracker for viscosity control in the gas fractionator. As seen below, the Antek Nitrogen in LCO ranges from about 100 ppm to about 800 ppm.
Light Cycle Oil (LCO) Analysis wppm wppm wppm wppm wppm wppm Nitrogen Na BS&W Aromatics Olefins Sats
1/9/05 723 1/16/05 630 1/23/05 620 1/30/05 383
2/6/05 128 2/13/05 584 2/20/05 564 2/25/05 748 4.5 88.9 1.4 9.8 2/27/05 771 1.05 3 87.8 1.7 10.6
3/1/05 773 1.4 1.7 87 1.4 11.7 3/5/05 766 1.86 0.15 89.10 2.40 8.60 3/8/05 706 1.32 1.6 85.8 2.3 11.9
It was postulated that as the end point of the gasoline from the Gasoline Fractionator increased, the amount of LCO in the gasoline cut to pygas would also increase. Therefore, as the concentration of LCO in the gasoline cut increase, the nitrogen content going to the pygas unit would also increase. It is known that heavies are sent to pygas at times because of problems in the Gasoline Fractionator. When the end point of the gasoline going to pygas is plotted vs. the Antek Nitrogen in the depentanizer bottoms (feed to the 2nd stage hydrotreater), the graph in Figure 6 obtained. Prior to February 2004, the baseline ammonia was much higher than after the gasoline endpoint control improved. The gasoline fractionator temperature profile stabilized and much less heavy material comes to pygas. This resulted in a step change reduction in the amount of nitrogen that is available to make ammonia in the 2nd stage hydrotreater and therefore to the charge gas. However, other factors still caused high ammonia in the charge gas when events occur. Despite these successes, many of these factors , many of the major events that affect the ammonia in charge gas are events that disrupt quench water pH. If the pH of quench water is suddenly raised, the ammonia will be released from the quench water into the charge gas. At BFLP, the spent caustic is washed with gasoline before oxidation in a Zimpro Unit. After washing, the caustic settles in D2502 and the gasoline returns to the quench tower. At times, the level instruments malfunction, resulting in caustic carryover from D2502 to the quench tower. The pH can quickly go from 7.8 to above pH 9 at times. This results in large amounts of ammonia being released into the charge gas. A project was implemented to replace the level instruments in this system with more reliable technology. Other causes for pH excursions have been when high pH material from the wet flare drum D-8601 is pumped back to the gas fractionator. Some of these events are again depicted in Figure 3. Once the baseline ammonia because controlled, events could be identified.
Another baseline shift in ammonia occurred during the summer of 2005. During that time 2 of the 3 vents from the pygas 2nd stage hydrotreater were rerouted outside the process. With this modification, events in the gasoline fractionator that sent nitrogen to the pygas unit would not result in ammonia contamination in the charge gas stream. Conclusions During the initial ammonia incident, the ethylene drier downstream of the acetylene converters was saturated with ammonia. The ammonia then desorbed slowly as water absorbed on the molecular sieve. Therefore, we routinely regenerate the ethylene drier every 6 months. Recently, a calculation was added to the process computer. The ammonia Drager Tube results upstream and downstream of the process drier are entered. When ammonia breakthrough is detected, the mass of ammonia going to the ethylene drier is calculated. A conservative ammonia capacity for the ethylene drier is assumed and a percent saturation can be calculated. Using this tool, we can predict when the C2 drier must be regenerated to maintain ammonia protection for the ethylene product. BFLP now has guidelines that specify regeneration of the ethylene drier every six months or when the saturation calculation, for the ethylene drier, reaches 80%. The baseline ammonia level is now fairly low. The major ammonia contributions to the plant were the vent streams from the pygas unit. See Figure 7 for an overview of the Pygas Unit. Two out of three of these streams have been rerouted. The 3rd stream is the Stabilizer tower overhead. This stream returns excess hydrogen to the charge gas compressor. The stabilizer overhead is too low a pressure to put into fuel. We have only recently commissioned a sample station for this stream. Preliminary results show high ammonia concentration (>40 ppm) in this stream. However, the normal flowrate of this stream is only about 1000 lbs/hr. Currently, we are doing further analysis to see the impact of this stream on the total ammonia load of the plant. Most plants send the pygas hydrogenation vent streams to fuel but those that do not, may see ammonia excursions if nitrogen compounds enter the 2nd stage hydrotreater in the pygas unit. It is important to measure ammonia in the charge gas upstream of the charge gas driers. The charge gas drier absorbs much of the ammonia in the charge gas until it breaks through. If the charge gas upstream of the charge gas driers is monitored routinely, several mitigation steps can be done if high levels are encountered. First, the source of the ammonia can be determined and corrected. For example, at BFLP, many of the ammonia excursions are from the gasoline caustic separators. When the separation drum level devices malfunction, caustic flows over the internal weir with the gasoline. This enters the gasoline fractionator and the quench water. The resulting high pH releases ammonia from the quench water into the charge gas. We are able to repair the level instrumentation (and justify upgrades) because we monitor the charge gas ammonia routinely. Secondly, the drier can be put on as short a cycle as possible to maintain regenerated driers and take out as much ammonia as possible during an excursion. Thirdly, if high levels of ammonia are measured, the quench water blow down can be increased and/or the pH of the quench water can be decreased to keep ammonia out of the
vapor phase. Also, in situations where ammonia is very high, the process water stripper overhead can be rerouted away from the charge gas. BFLP has had ammonia excursions due to high nitrogen in the naphtha feed. Therefore a nitrogen specification of 3 to 5 ppm is suggested. If several furnaces of 5-ppm material is cracked, a higher than normal baseline ammonia yield may be detected and a lower specification may be needed. If however, only one furnace of 5-ppm material is cracked, no noticeable change in baseline ammonia may be measured. Therefore, a specification range may be of more use depending on how many furnaces are cracking a given feedstock.

Figure 1. Ammonia Results in Ethylene Product
0
0.1
0.2
0.3
0.4
0.5
0.6
0.7
0.8
4/11/04 12:00
4/12/04 0:00
4/12/04 12:00
4/13/04 0:00
4/13/04 12:00
4/14/04 0:00
4/14/04 12:00
4/15/04 0:00
4/15/04 12:00
4/16/04 0:00
4/16/04 12:00
ppm
NH
3
MDA Tape Online Scrub

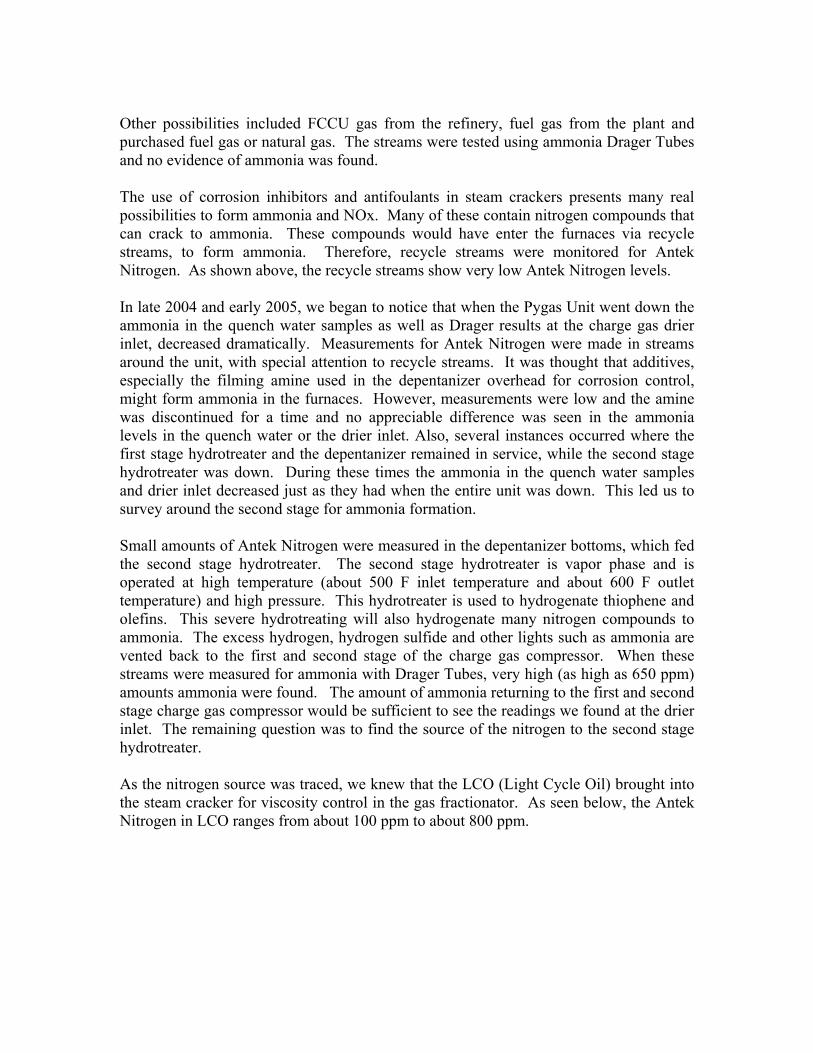
Figure 2 Possible Sources of Ammonia or Nitrogen Compounds
Stream Possibility of Contribution to the NH3 Problem at BFLP Average Amount of Nitrogen/NH3 Present
Build-up in Quench Water System
High Possibility - sometimes very high ammonia 15-300 wppm
Heavy and/or Light Naphtha Feed
Low Possibility- Low nitrogen content but no correlation with NH3 events
3 to 6 wppm
C2 Recycle Low Possibility- no nitrogen compounds detected None Detected C3 Recycle Low Possibility- no nitrogen compounds detected None Detected C4 Recycle/C4 Acetylenes Recycle
Low Possibility- very low nitrogen levels detected Detection Limit (0.3wppm) to 0.7wppm
C5 Recycle Low Possibility- very low nitrogen levels detected About 1 wppm C6/C7 From Pygas Low Possibility- no nitrogen compounds detected None Detected FCCU Gas Low Possibility- no ammonia detected so far None Detected Natural Gas Low Possibility- no ammonia detected None Detected Additives Medium Possibility- some additive used at BFLP do contain
nitrogen compounds Varies
Hydrogen Vent from Pygas
High Possibility - sometimes very high ammonia levels 3 to 620 wppm
Light Cycle Oil (LCO) High Possibility - very high in nitrogen content 150-800 wppm

Figure 3 Ammonia Drager Results at the Charge Gas Drier Inlet – Bases for Other Graphs
0
2
4
6
8
10
12
14
12/31/2004
1/30/2005
3/1/2005
3/31/2005
4/30/2005
5/30/2005
6/29/2005
7/29/2005
8/28/2005
9/27/2005
10/27/2005
11/26/2005
12/26/2005pp
m v
ol
Inlet to Drier Drager Results
Caustic Separator Upsets
Wet Flare Drum Transfer
Gas Frac Upset; Offspec Pygas Barge
High Antek N in Water Hit in Light Naphtha
Caustic Separator Upsets
High Antek N in the Light Naphtha
D8601
D2501 Upset
Pygas Down
Pygas Down
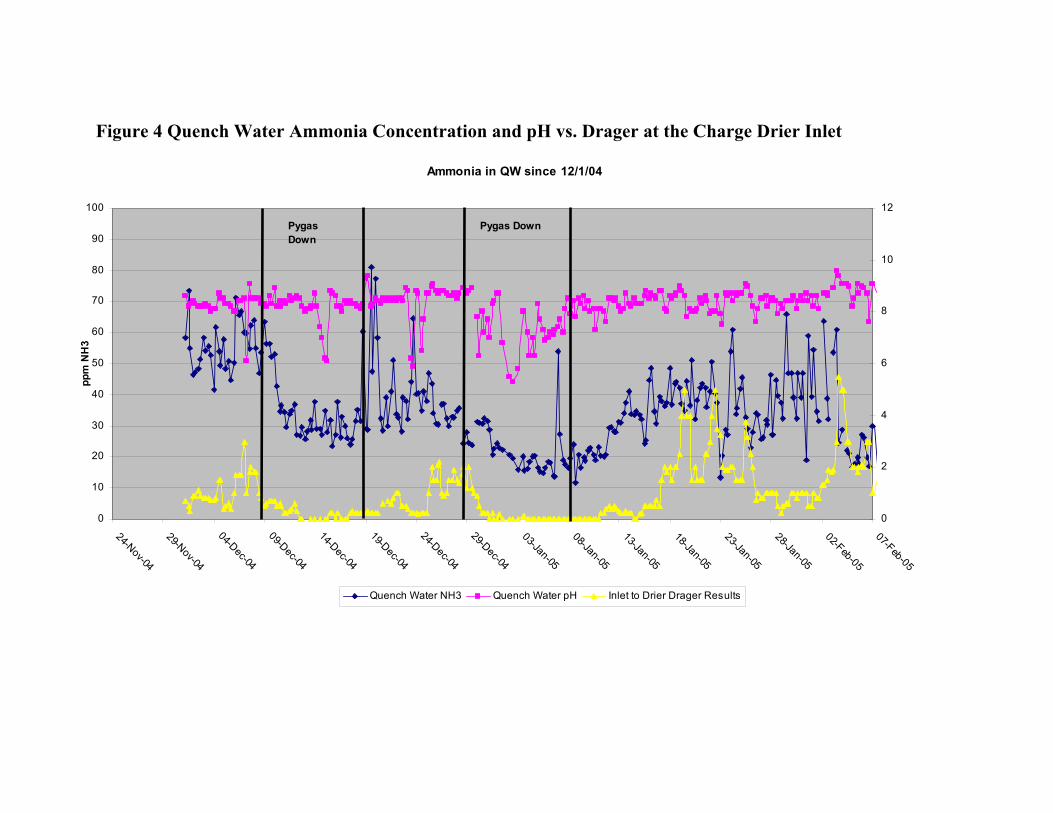
Figure 4 Quench Water Ammonia Concentration and pH vs. Drager at the Charge Drier Inlet
Ammonia in QW since 12/1/04
0
10
20
30
40
50
60
70
80
90
100
24-Nov-04
29-Nov-04
04-Dec-04
09-Dec-04
14-Dec-04
19-Dec-04
24-Dec-04
29-Dec-04
03-Jan-05
08-Jan-05
13-Jan-05
18-Jan-05
23-Jan-05
28-Jan-05
02-Feb-05
07-Feb-05
ppm
NH
3
0
2
4
6
8
10
12
Quench Water NH3 Quench Water pH Inlet to Drier Drager Results
Pygas Down
Pygas Down

Figure 5 – Antek Measured Nitrogen (Non-N2) in Heavy and Light Naphtha vs Charge Gas Drier Drager Results
Heavy & Light Naphtha Nitrogen vs Drier Inlet NH3
0
1
2
3
4
5
6
7
12/31/04
1/20/05
2/9/053/1/05
3/21/05
4/10/05
4/30/05
Ant
ek N
0
0.5
1
1.5
2
2.5
Inlet to Drier Drager Results Heavy Feed Total N Light Feed Total N

Figure 6 Gasoline End Point vs. Depentanizer Bottoms
2
3
4
5
6
7
8
9
10
11/9/04 0:00
12/29/04 0:00
2/17/05 0:00
4/8/05 0:00
5/28/05 0:00
7/17/05 0:00
9/5/05 0:00
10/25/05 0:00
350
370
390
410
430
450
470
490
510
530
550
Depent Btms Total N Quench Settler Gasoline

Figure 7 Overview of the Pygas Unit
F i r s t S t a g e G a s o l in eH y d r o t r e a t e r
S e c o n d S t a g e P y g a sR e a c t o r
Depentanizer
C 5 P r o d u c tb a c k t oH e a t e r s
H y d r o g e nA d d i t io n
R 5 5 0 1
R 5 5 0 2
D 5 5 0 3
T o P r e d is t i l l a t io na n d A r o m a t ic s
E x t r a c t io nStabilizer T 5502
P y g a s F e e dF r o m G a s o l in e
S e t t le r s ,D e b u ta n iz e rB o t to m s a n dC o m p r e s s o r
K n o c k o u t D r u m s
O f f g a s t o C o ldS e c t io n
H 2P u r g e
t o C G C
H 2P u r g e
t o C G C