Session 2 - EPRImydocs.epri.com/docs/PublicMeetingMaterials/1028/Session_2...Conservation and...
81
1 © 2014 Electric Power Research Institute, Inc. All rights reserved. EPRI / DOE The Smart Grid Experience: Applying Results, Reaching Beyond Session 2: Conservation and Optimization Via Volt/Var Control The Smart Grid Experience: Applying Results, Reaching Beyond
Transcript of Session 2 - EPRImydocs.epri.com/docs/PublicMeetingMaterials/1028/Session_2...Conservation and...
1 © 2014 Electric Power Research Institute, Inc. All rights reserved. EPRI / DOE The Smart Grid Experience: Applying Results, Reaching Beyond
Session 2: Conservation and Optimization Via Volt/Var Control
The Smart Grid Experience:
Applying Results,
Reaching Beyond
Conservation and Optimization Via Volt/var Control
Tuesday, October 28, 2014
8:00 a.m. Session
Moderators
Jared Green, EPRI
Joe Paladino, DOE
The Smart Grid Experience: Applying Results, Reaching Beyond
October 27-29, 2014
3 © 2014 Electric Power Research Institute, Inc. All rights reserved. EPRI / DOE The Smart Grid Experience: Applying Results, Reaching Beyond
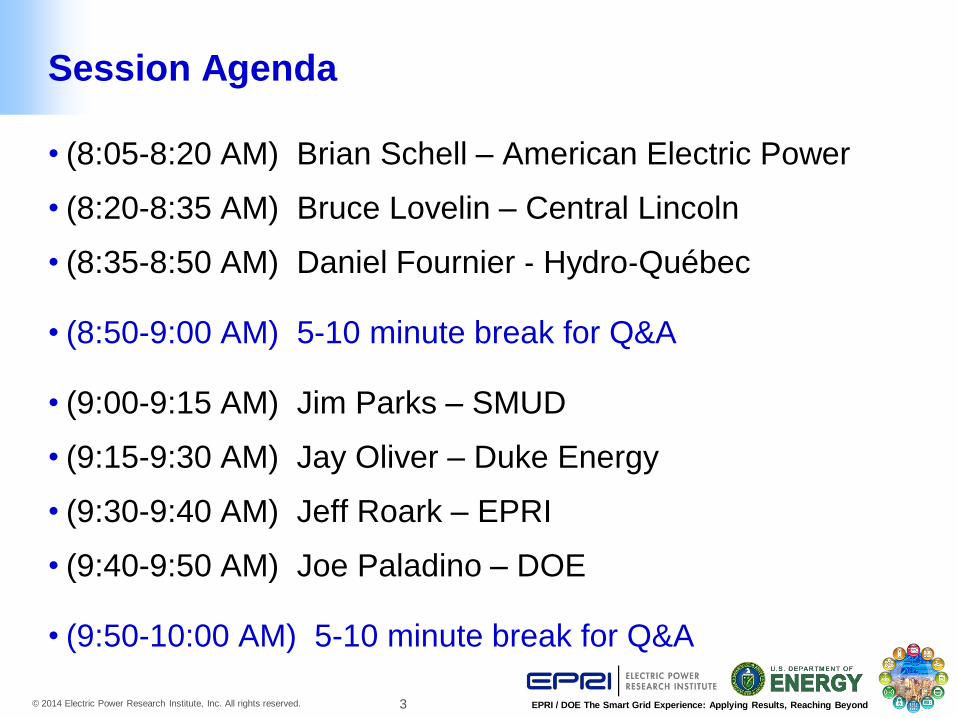
Session Agenda
• (8:05-8:20 AM) Brian Schell – American Electric Power
• (8:20-8:35 AM) Bruce Lovelin – Central Lincoln
• (8:35-8:50 AM) Daniel Fournier ‐ Hydro‐Québec
• (8:50-9:00 AM) 5-10 minute break for Q&A
• (9:00-9:15 AM) Jim Parks – SMUD
• (9:15-9:30 AM) Jay Oliver – Duke Energy
• (9:30-9:40 AM) Jeff Roark – EPRI
• (9:40-9:50 AM) Joe Paladino – DOE
• (9:50-10:00 AM) 5-10 minute break for Q&A
4 © 2014 Electric Power Research Institute, Inc. All rights reserved. EPRI / DOE The Smart Grid Experience: Applying Results, Reaching Beyond
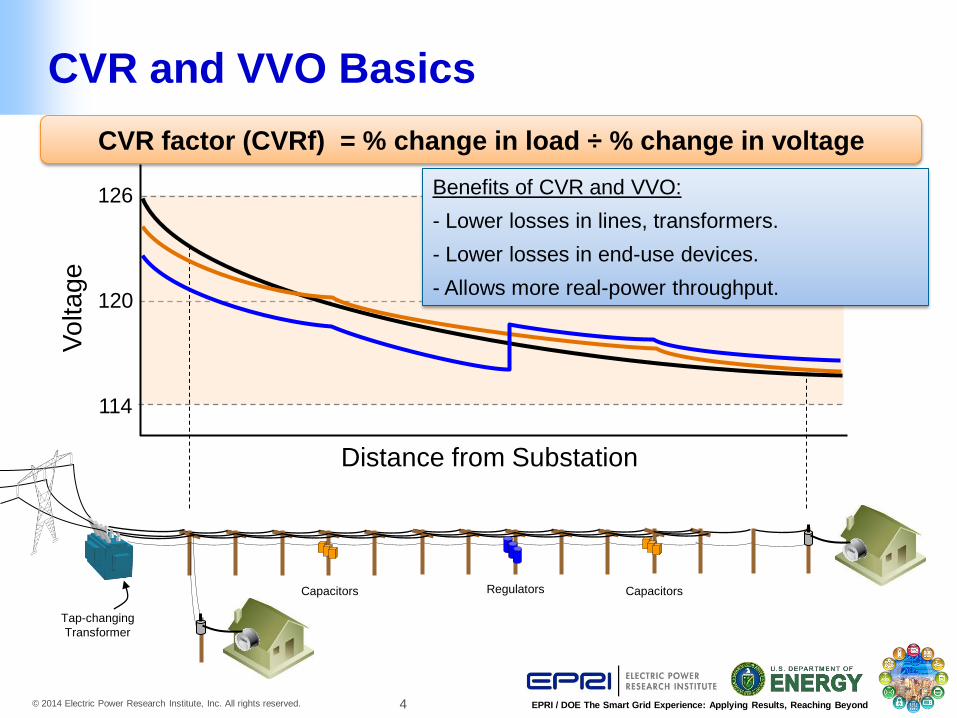
CVR and VVO Basics
Distance from Substation
Vo
lta
ge
126
120
114
Capacitors Capacitors Regulators
Tap-changing
Transformer
Benefits of CVR and VVO:
- Lower losses in lines, transformers.
- Lower losses in end-use devices.
- Allows more real-power throughput.
CVR factor (CVRf) = % change in load ÷ % change in voltage
5 © 2014 Electric Power Research Institute, Inc. All rights reserved. EPRI / DOE The Smart Grid Experience: Applying Results, Reaching Beyond
Brian Schell, American Electric Power Email: [email protected]
• Brian received his B.S.E.E. degree from West Virginia
University in 1988 and has been a licensed
Professional Engineer in the State of Ohio since 1995.
• Principal Engineer employed with American Electric
Power for 25 years.
• Worked first 5 years in the Region Engineering
Organization in Columbus, Ohio.
• Worked for 15 years in the Distribution Planning
organization and was supervisor for Ohio the last few
years.
• Since 2010 worked in the Grid Management
Deployment organization for American Electric Power.
6 © 2014 Electric Power Research Institute, Inc. All rights reserved. EPRI / DOE The Smart Grid Experience: Applying Results, Reaching Beyond
Experience with three vendors: (alphabetical order)
• Cooper Yukon VVO
• GE VVO
• Utilidata AdaptiVolt™ VVO
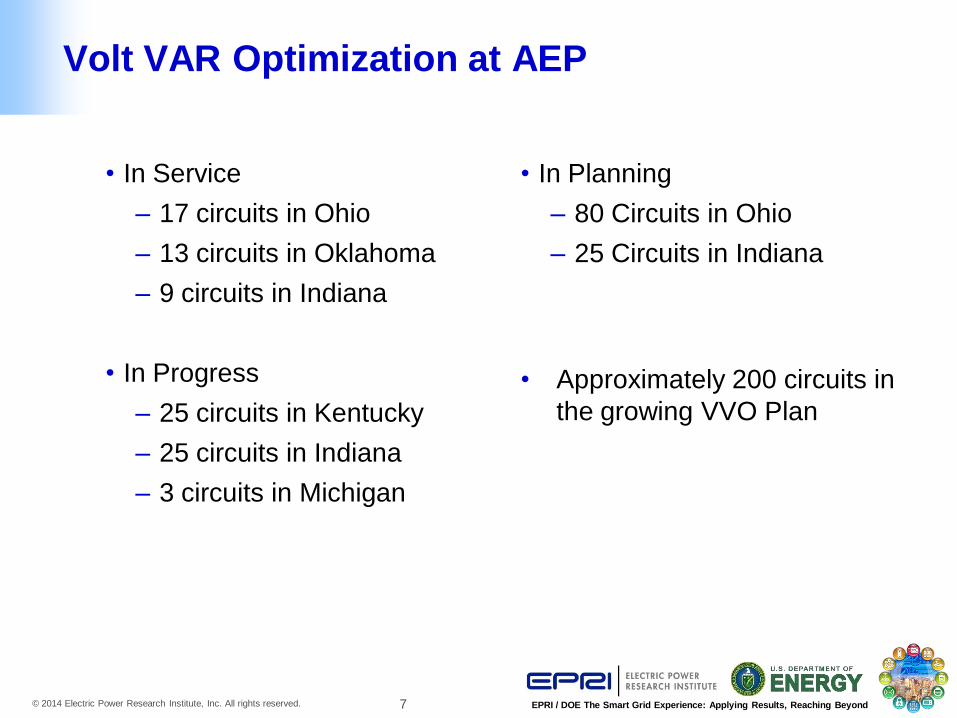
Volt VAR Optimization at AEP
7 © 2014 Electric Power Research Institute, Inc. All rights reserved. EPRI / DOE The Smart Grid Experience: Applying Results, Reaching Beyond
• In Service
– 17 circuits in Ohio
– 13 circuits in Oklahoma
– 9 circuits in Indiana
• In Progress
– 25 circuits in Kentucky
– 25 circuits in Indiana
– 3 circuits in Michigan
• In Planning
– 80 Circuits in Ohio
– 25 Circuits in Indiana
• Approximately 200 circuits in
the growing VVO Plan
Volt VAR Optimization at AEP
8 © 2014 Electric Power Research Institute, Inc. All rights reserved. EPRI / DOE The Smart Grid Experience: Applying Results, Reaching Beyond
8
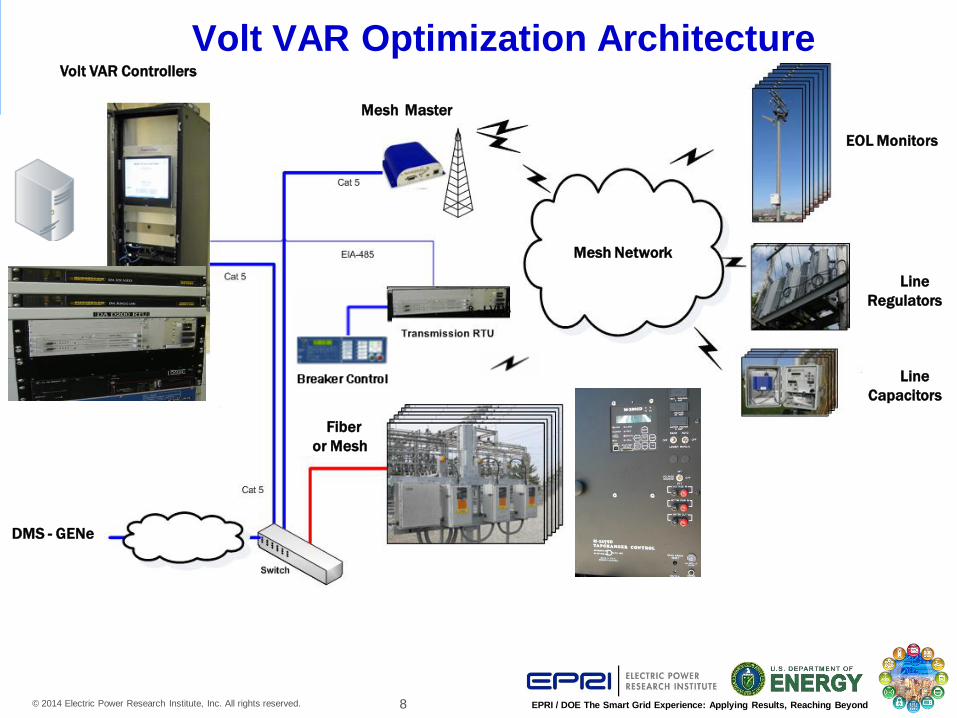
Volt VAR Controllers
Mesh Network
Mesh Master
EOL Monitors
Line
Regulators
Line
Capacitors
DMS - GENe
Fiber
or Mesh
Volt VAR Optimization Architecture
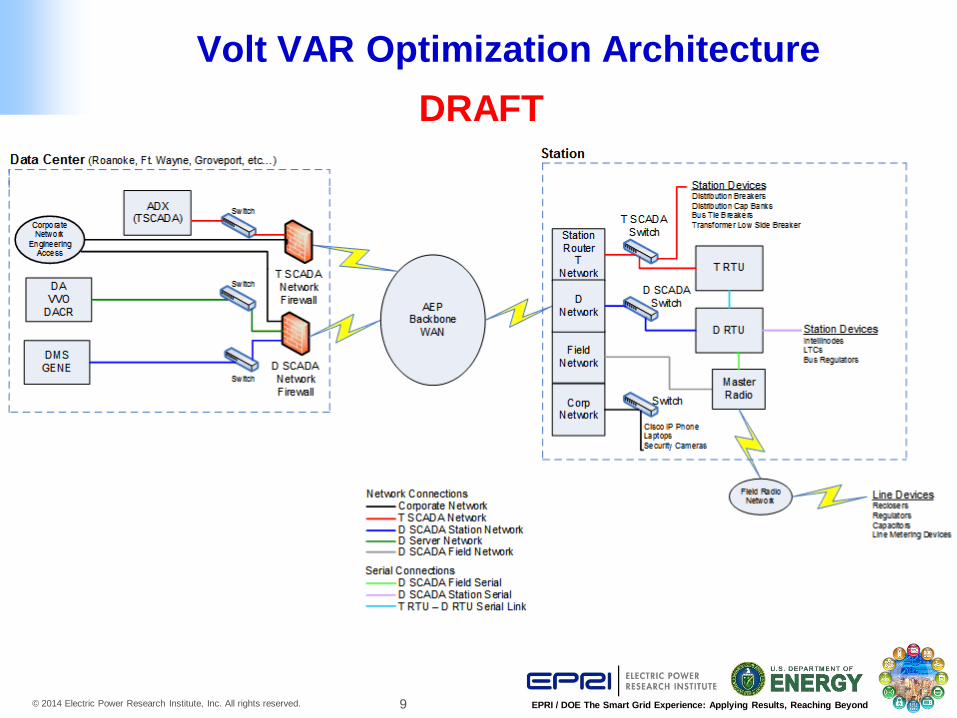
9 © 2014 Electric Power Research Institute, Inc. All rights reserved. EPRI / DOE The Smart Grid Experience: Applying Results, Reaching Beyond
Volt VAR Optimization Architecture
DRAFT
10 © 2014 Electric Power Research Institute, Inc. All rights reserved. EPRI / DOE The Smart Grid Experience: Applying Results, Reaching Beyond
116.0
118.0
120.0
122.0
124.0
126.0
0 20 40 60 80 100
Normal Operation
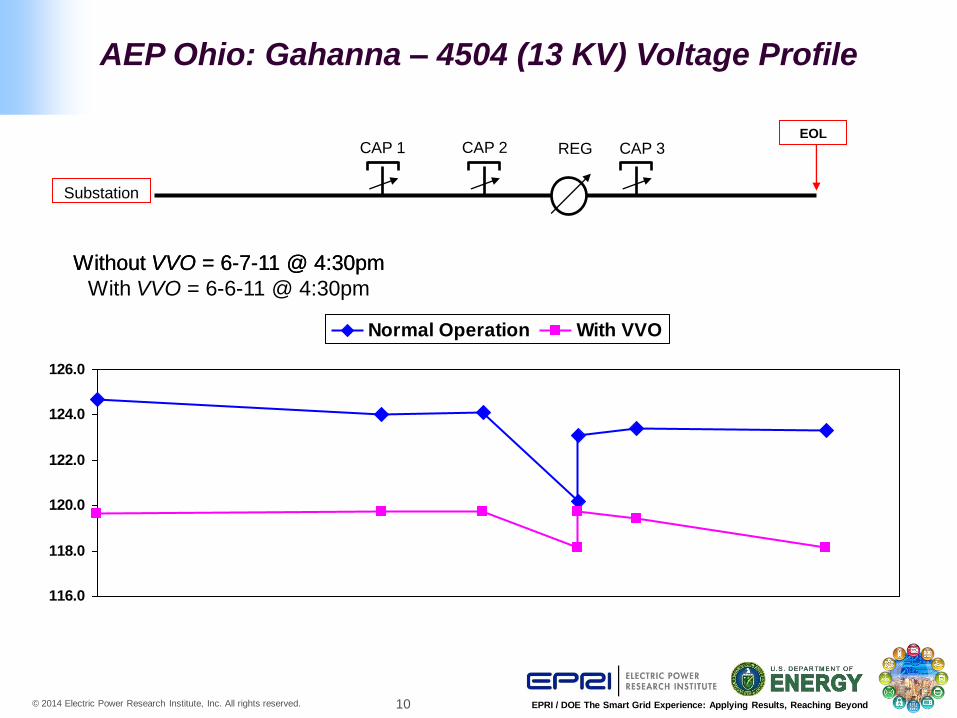
Without VVO = 6-7-11 @ 4:30pm
Substation
EOL CAP 1 CAP 3 REG
Without VVO = 6-7-11 @ 4:30pm
With VVO = 6-6-11 @ 4:30pm
116.0
118.0
120.0
122.0
124.0
126.0
0 20 40 60 80 100
Normal Operation With VVO
CAP 2
AEP Ohio: Gahanna – 4504 (13 KV) Voltage Profile
11 © 2014 Electric Power Research Institute, Inc. All rights reserved. EPRI / DOE The Smart Grid Experience: Applying Results, Reaching Beyond
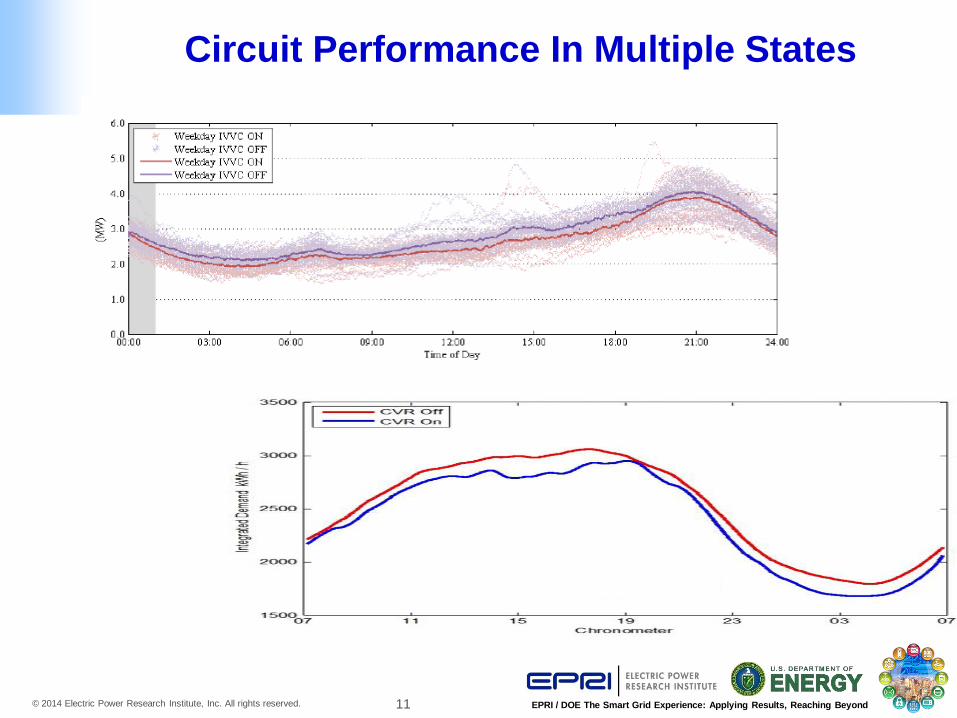
Circuit Performance In Multiple States
12 © 2014 Electric Power Research Institute, Inc. All rights reserved. EPRI / DOE The Smart Grid Experience: Applying Results, Reaching Beyond
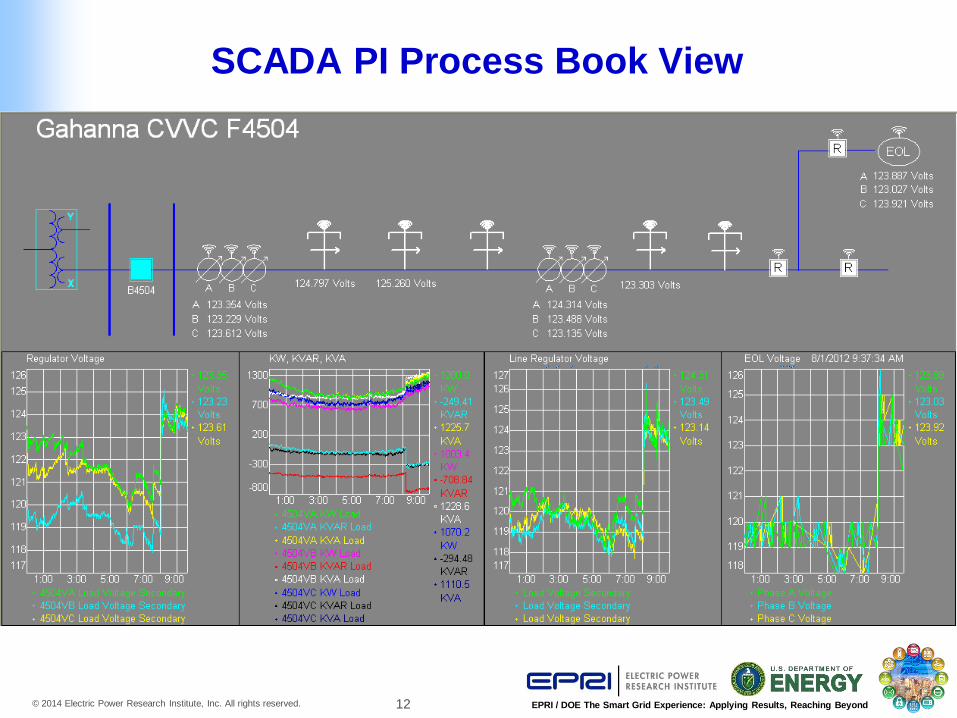
SCADA PI Process Book View
13 © 2014 Electric Power Research Institute, Inc. All rights reserved. EPRI / DOE The Smart Grid Experience: Applying Results, Reaching Beyond
• Volt Var Optimization technology works as expected Testing validates that ~2-4% energy and demand reduction is
achievable.
Volt VAR Optimization at AEP
14 © 2014 Electric Power Research Institute, Inc. All rights reserved. EPRI / DOE The Smart Grid Experience: Applying Results, Reaching Beyond
Demand and Energy Reduction Results
• Measurement &Verification (M&V) Analysis Methods
Requires Day On Day Off Testing
Battelle/PNNL Third Party Analysis
Protocol #1
How do we improve M&V methodology?
15 © 2014 Electric Power Research Institute, Inc. All rights reserved. EPRI / DOE The Smart Grid Experience: Applying Results, Reaching Beyond
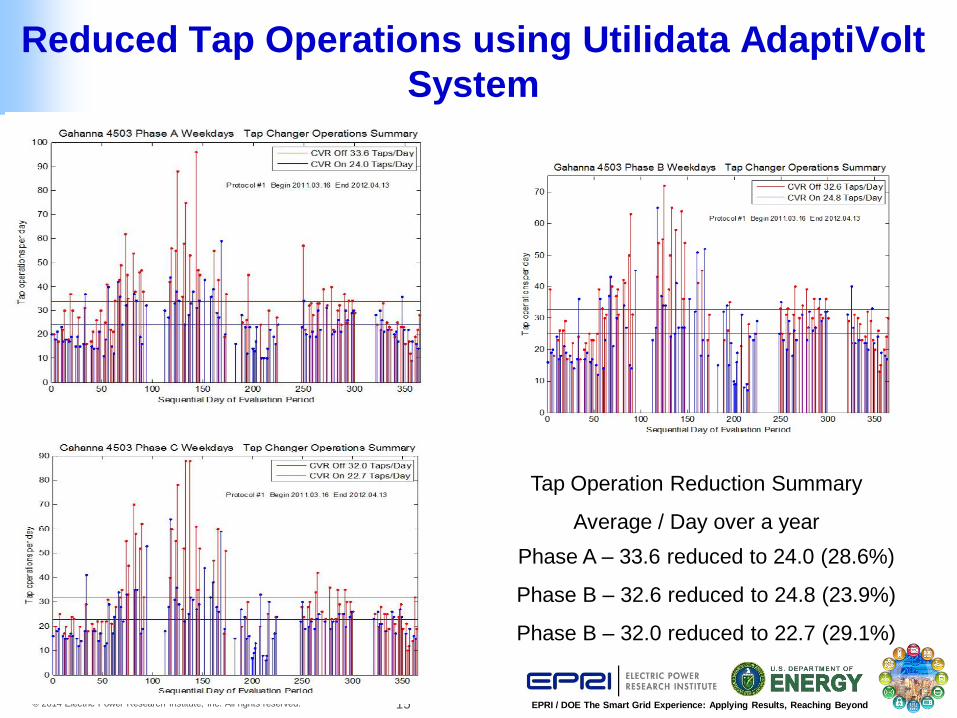
Reduced Tap Operations using Utilidata AdaptiVolt
System
Tap Operation Reduction Summary
Average / Day over a year
Phase A – 33.6 reduced to 24.0 (28.6%)
Phase B – 32.6 reduced to 24.8 (23.9%)
Phase B – 32.0 reduced to 22.7 (29.1%)
16 © 2014 Electric Power Research Institute, Inc. All rights reserved. EPRI / DOE The Smart Grid Experience: Applying Results, Reaching Beyond
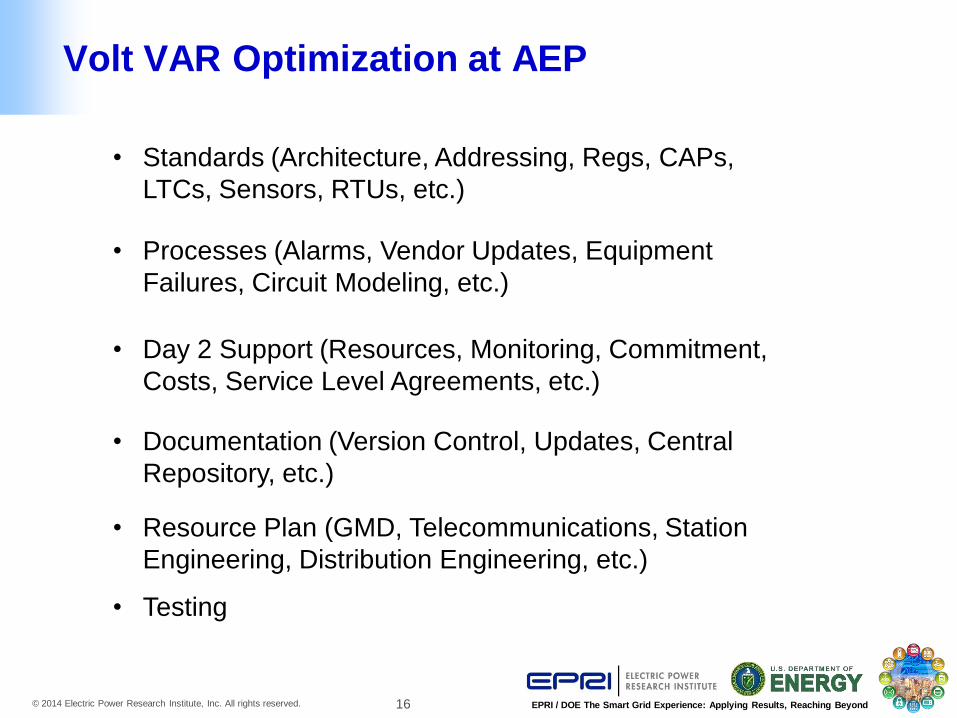
Volt VAR Optimization at AEP
• Standards (Architecture, Addressing, Regs, CAPs,
LTCs, Sensors, RTUs, etc.)
• Day 2 Support (Resources, Monitoring, Commitment,
Costs, Service Level Agreements, etc.)
• Processes (Alarms, Vendor Updates, Equipment
Failures, Circuit Modeling, etc.)
• Documentation (Version Control, Updates, Central
Repository, etc.)
• Resource Plan (GMD, Telecommunications, Station
Engineering, Distribution Engineering, etc.)
• Testing
17 © 2014 Electric Power Research Institute, Inc. All rights reserved. EPRI / DOE The Smart Grid Experience: Applying Results, Reaching Beyond
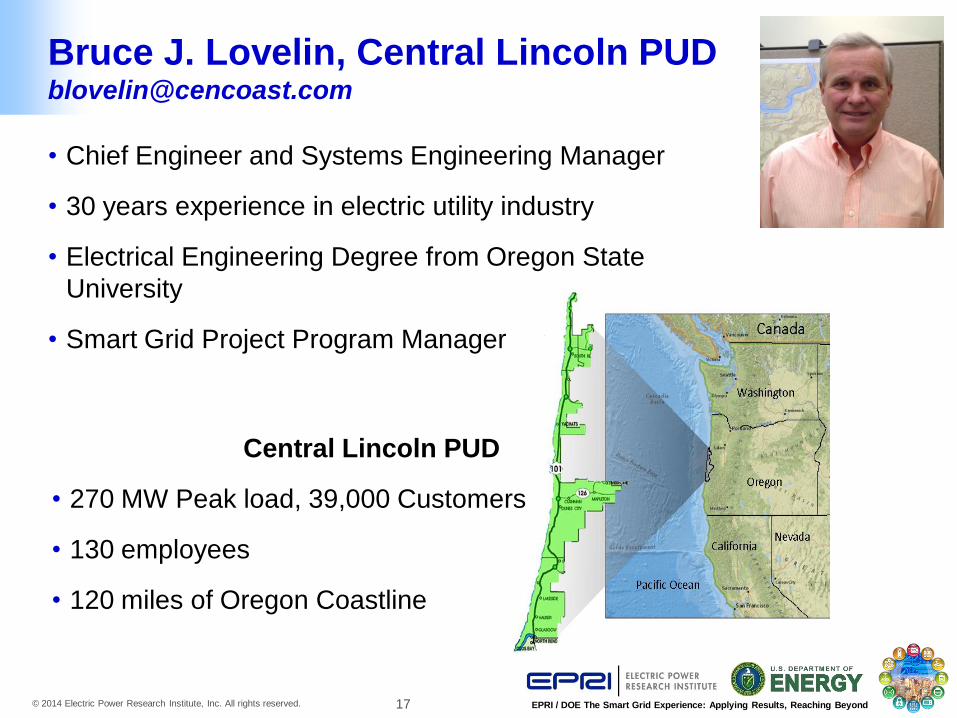
Bruce J. Lovelin, Central Lincoln PUD [email protected]
• Chief Engineer and Systems Engineering Manager
• 30 years experience in electric utility industry
• Electrical Engineering Degree from Oregon State
University
• Smart Grid Project Program Manager
Central Lincoln PUD
• 270 MW Peak load, 39,000 Customers
• 130 employees
• 120 miles of Oregon Coastline
18 © 2014 Electric Power Research Institute, Inc. All rights reserved. EPRI / DOE The Smart Grid Experience: Applying Results, Reaching Beyond
Could a AMI System be used to Manage
Customers’ Voltage real time?
19 © 2014 Electric Power Research Institute, Inc. All rights reserved. EPRI / DOE The Smart Grid Experience: Applying Results, Reaching Beyond
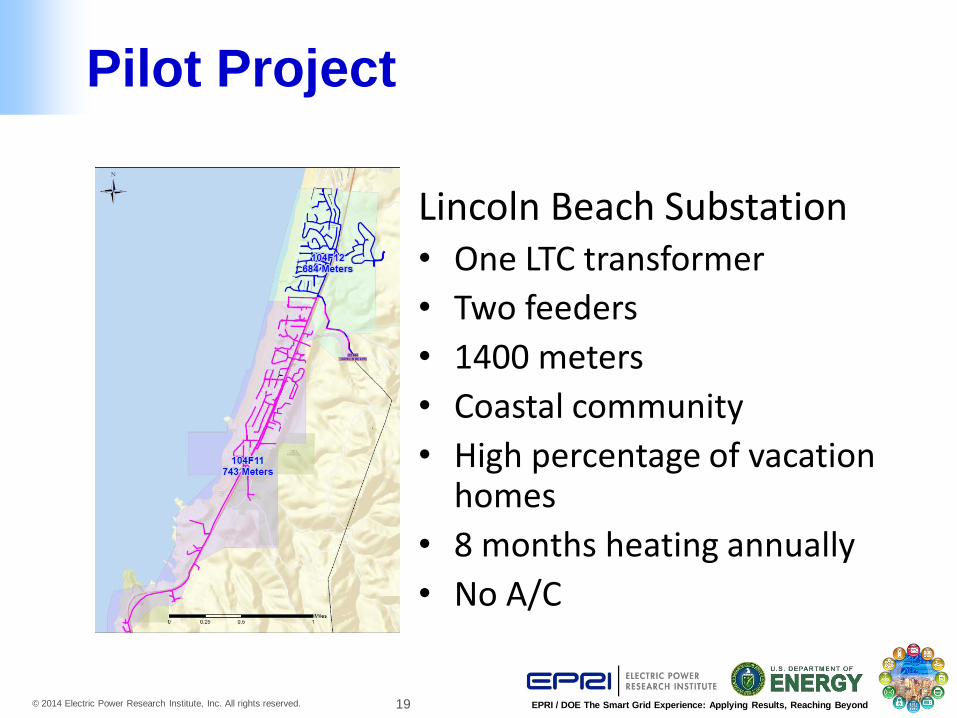
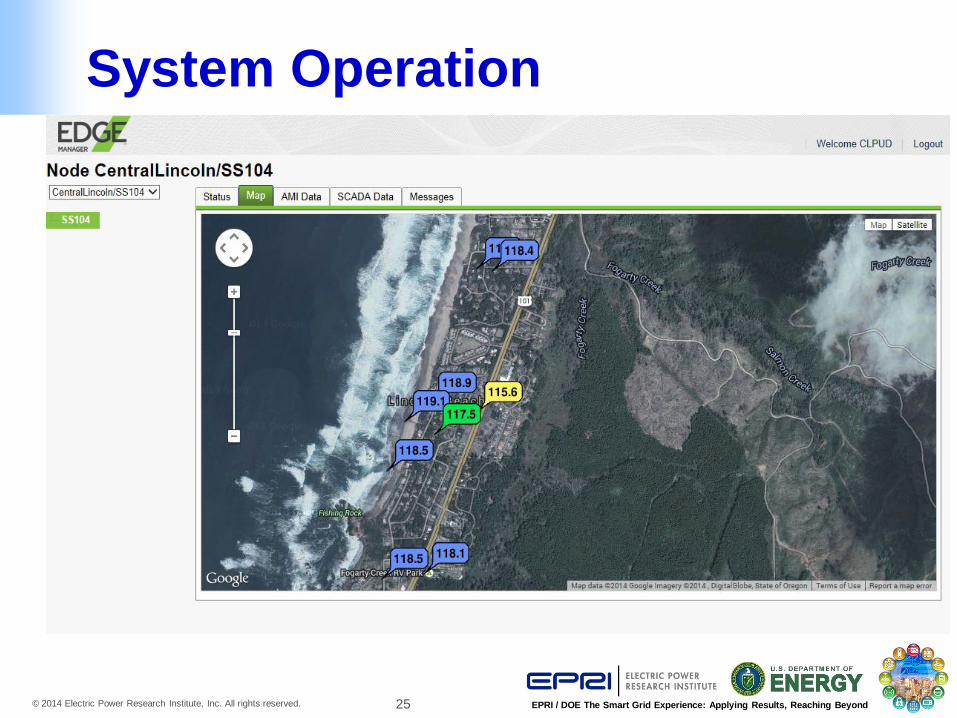
Pilot Project
Lincoln Beach Substation • One LTC transformer
• Two feeders
• 1400 meters
• Coastal community
• High percentage of vacation homes
• 8 months heating annually
• No A/C
20 © 2014 Electric Power Research Institute, Inc. All rights reserved. EPRI / DOE The Smart Grid Experience: Applying Results, Reaching Beyond
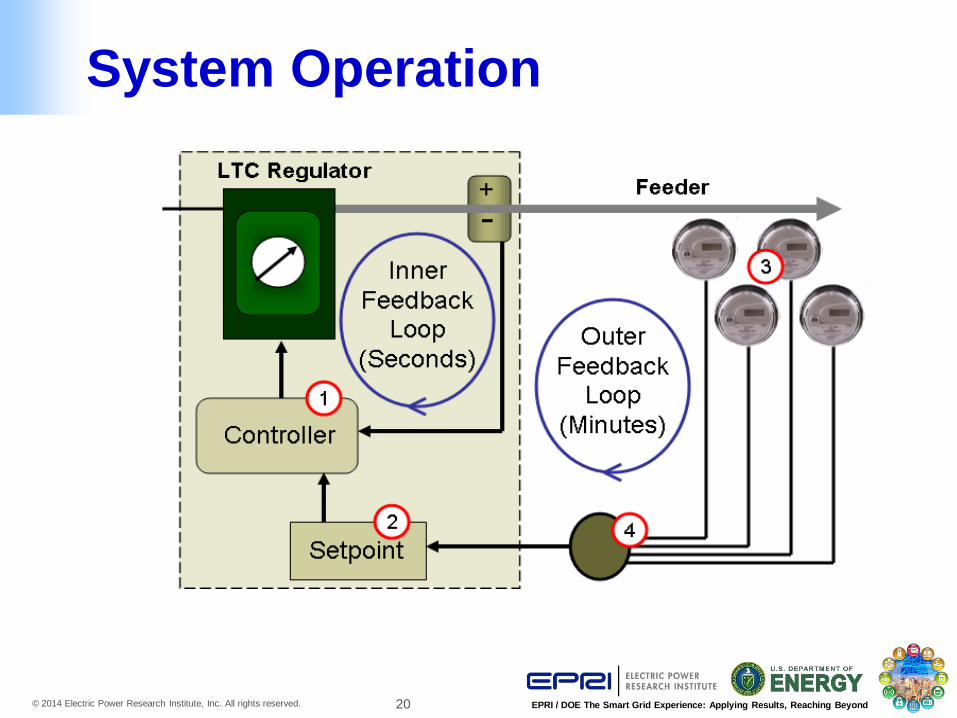
System Operation
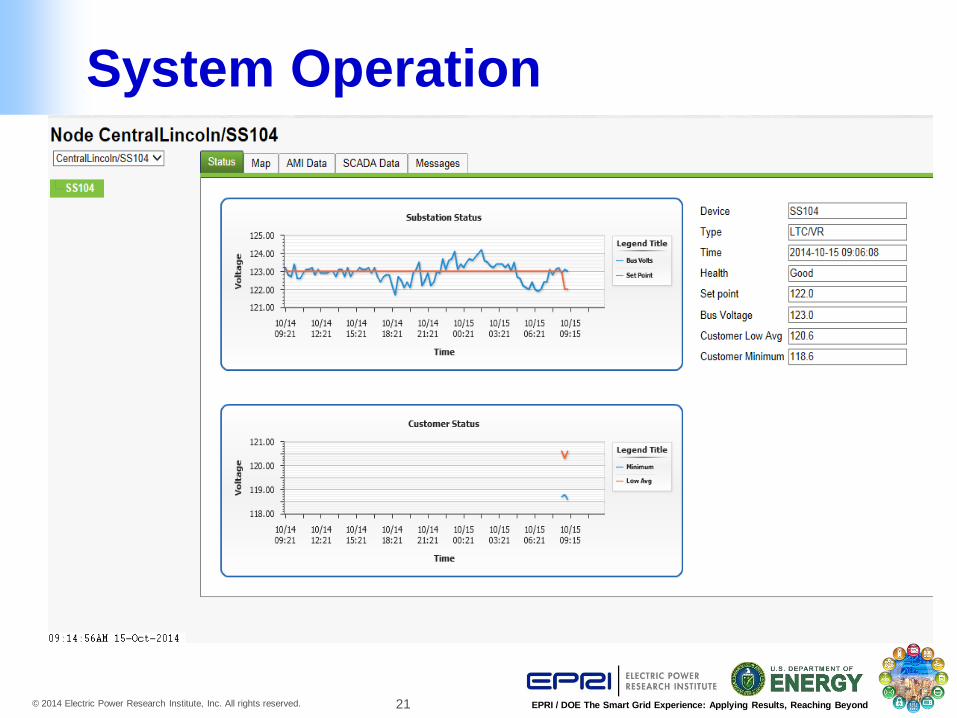
21 © 2014 Electric Power Research Institute, Inc. All rights reserved. EPRI / DOE The Smart Grid Experience: Applying Results, Reaching Beyond
System Operation
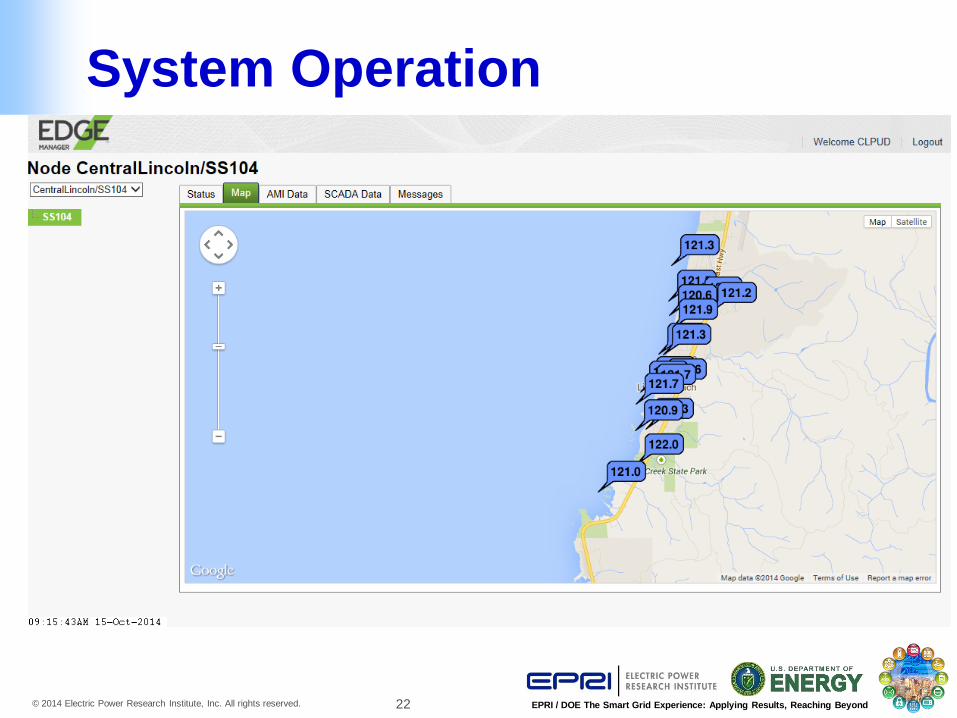
22 © 2014 Electric Power Research Institute, Inc. All rights reserved. EPRI / DOE The Smart Grid Experience: Applying Results, Reaching Beyond
System Operation
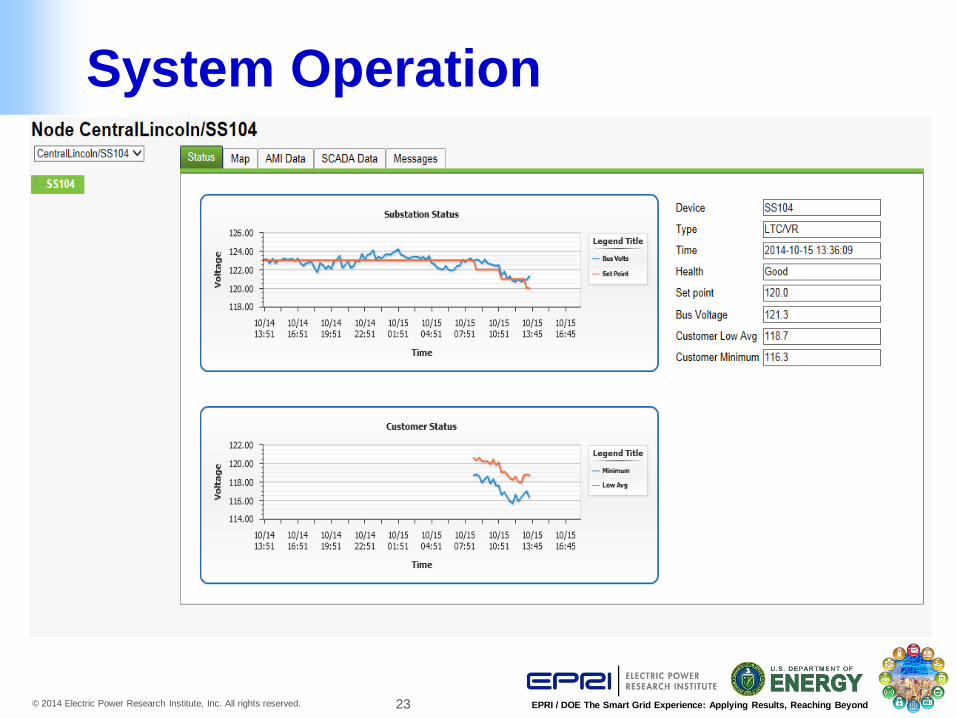
23 © 2014 Electric Power Research Institute, Inc. All rights reserved. EPRI / DOE The Smart Grid Experience: Applying Results, Reaching Beyond
System Operation
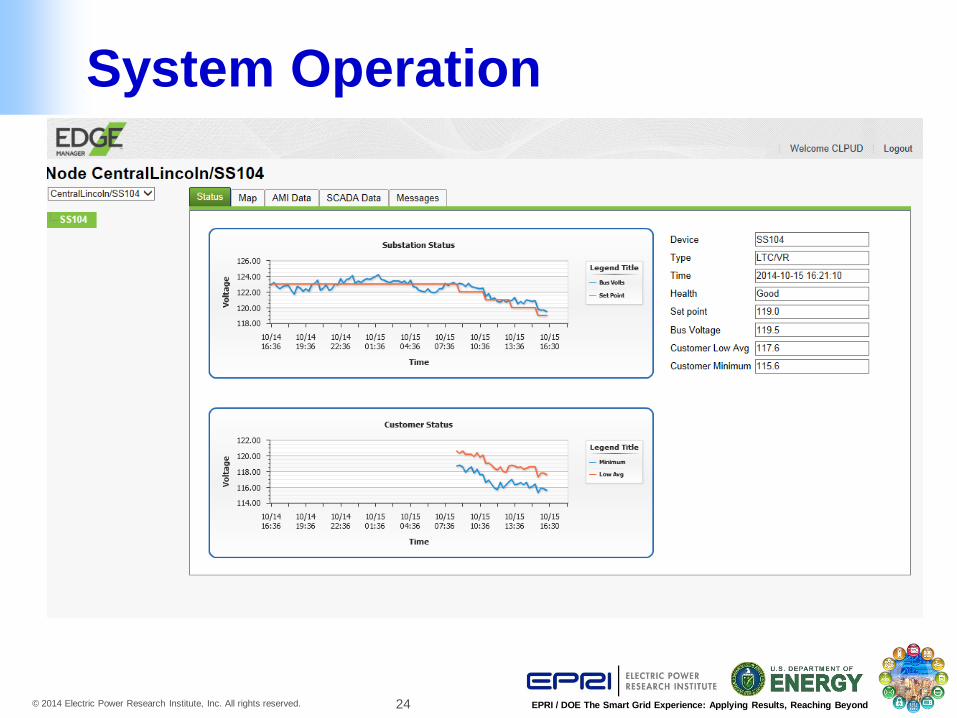
24 © 2014 Electric Power Research Institute, Inc. All rights reserved. EPRI / DOE The Smart Grid Experience: Applying Results, Reaching Beyond
System Operation
25 © 2014 Electric Power Research Institute, Inc. All rights reserved. EPRI / DOE The Smart Grid Experience: Applying Results, Reaching Beyond
System Operation
26 © 2014 Electric Power Research Institute, Inc. All rights reserved. EPRI / DOE The Smart Grid Experience: Applying Results, Reaching Beyond
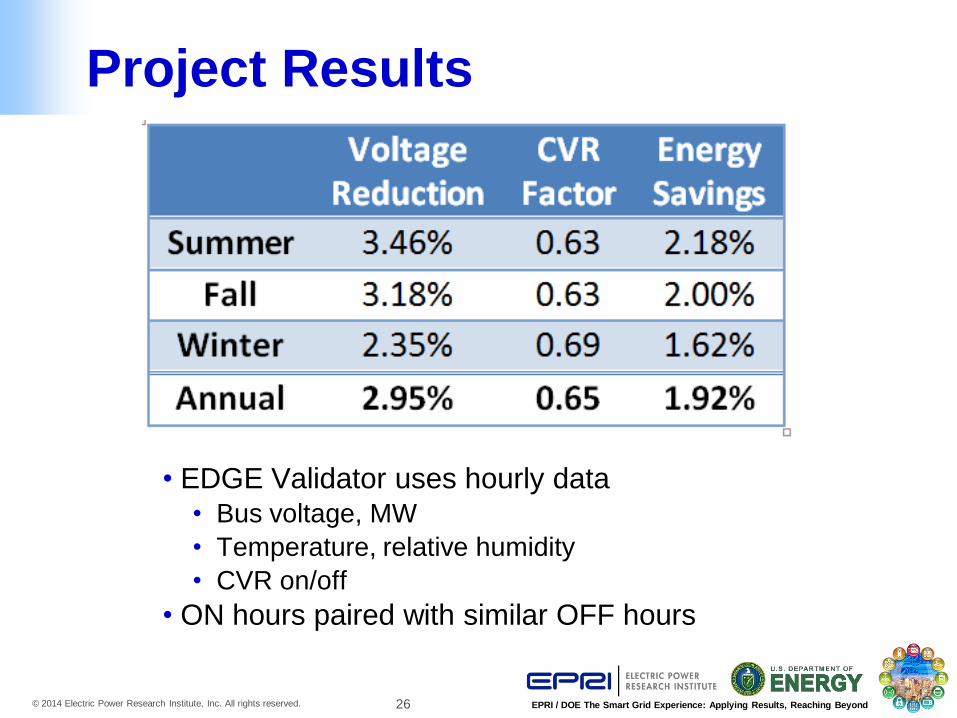
Project Results
• EDGE Validator uses hourly data • Bus voltage, MW
• Temperature, relative humidity
• CVR on/off
• ON hours paired with similar OFF hours
27 © 2014 Electric Power Research Institute, Inc. All rights reserved. EPRI / DOE The Smart Grid Experience: Applying Results, Reaching Beyond
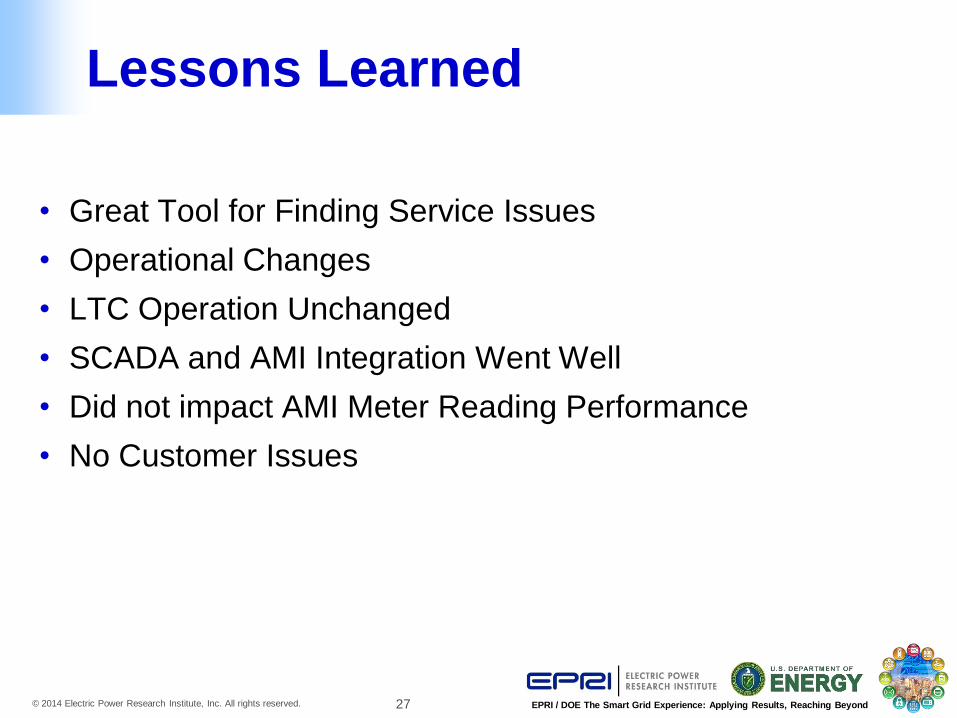
Lessons Learned
• Great Tool for Finding Service Issues
• Operational Changes
• LTC Operation Unchanged
• SCADA and AMI Integration Went Well
• Did not impact AMI Meter Reading Performance
• No Customer Issues
28 © 2014 Electric Power Research Institute, Inc. All rights reserved. EPRI / DOE The Smart Grid Experience: Applying Results, Reaching Beyond
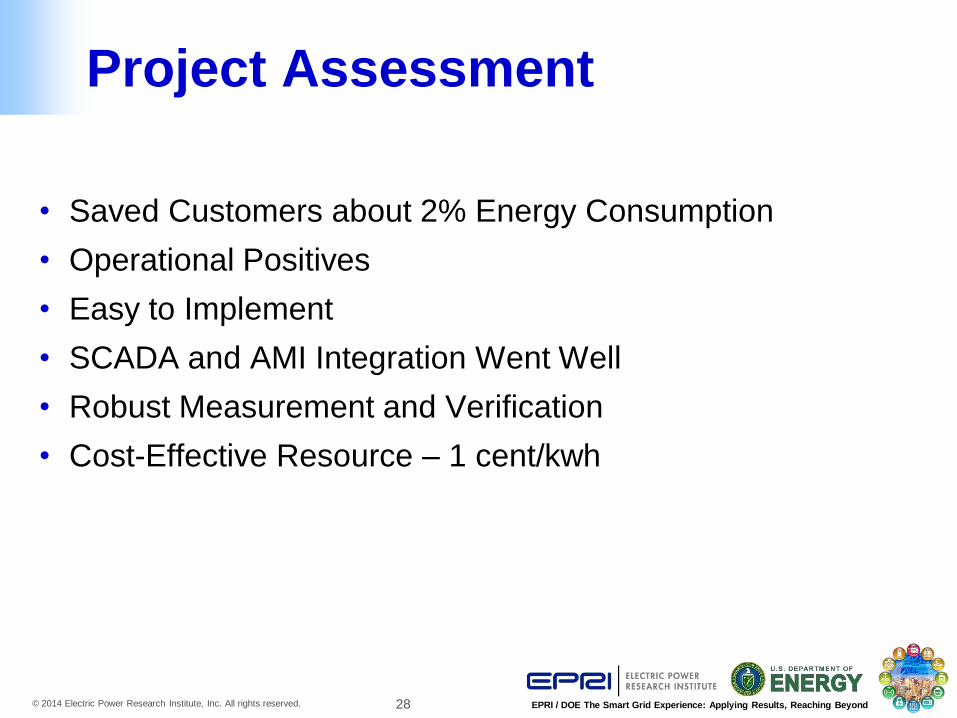
Project Assessment
• Saved Customers about 2% Energy Consumption
• Operational Positives
• Easy to Implement
• SCADA and AMI Integration Went Well
• Robust Measurement and Verification
• Cost-Effective Resource – 1 cent/kwh
29 © 2014 Electric Power Research Institute, Inc. All rights reserved. EPRI / DOE The Smart Grid Experience: Applying Results, Reaching Beyond
Next Steps
• Full System Implementation
• Up to 25 Substations
• 3 Year Project
• Begins Winter 2015
30 © 2014 Electric Power Research Institute, Inc. All rights reserved. EPRI / DOE The Smart Grid Experience: Applying Results, Reaching Beyond
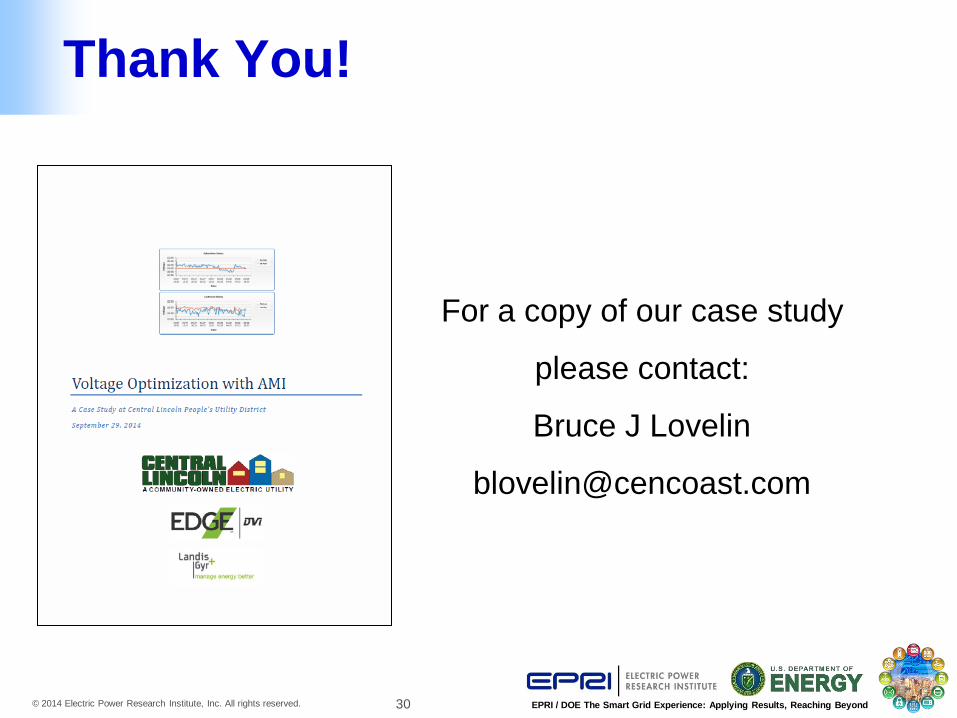
Thank You!
For a copy of our case study
please contact:
Bruce J Lovelin
31 © 2014 Electric Power Research Institute, Inc. All rights reserved. EPRI / DOE The Smart Grid Experience: Applying Results, Reaching Beyond
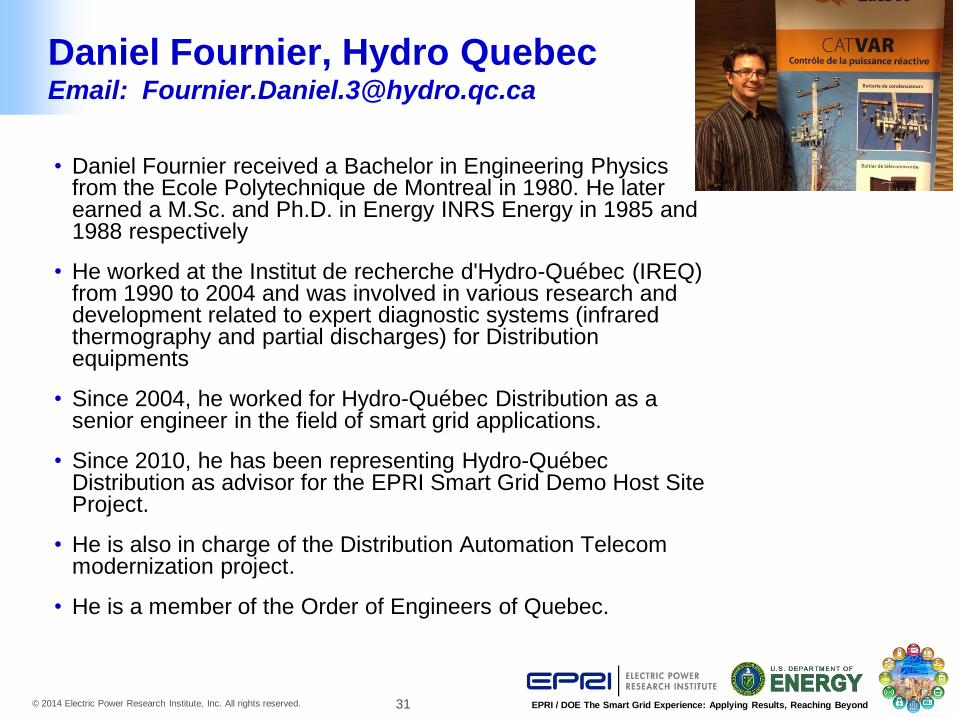
Daniel Fournier, Hydro Quebec Email: [email protected]
• Daniel Fournier received a Bachelor in Engineering Physics from the Ecole Polytechnique de Montreal in 1980. He later earned a M.Sc. and Ph.D. in Energy INRS Energy in 1985 and 1988 respectively
• He worked at the Institut de recherche d'Hydro-Québec (IREQ) from 1990 to 2004 and was involved in various research and development related to expert diagnostic systems (infrared thermography and partial discharges) for Distribution equipments
• Since 2004, he worked for Hydro-Québec Distribution as a senior engineer in the field of smart grid applications.
• Since 2010, he has been representing Hydro-Québec Distribution as advisor for the EPRI Smart Grid Demo Host Site Project.
• He is also in charge of the Distribution Automation Telecom modernization project.
• He is a member of the Order of Engineers of Quebec.
October 27-29, 2014
Charlotte, NC
VVC at Hydro-Québec Distribution
by: Daniel Fournier, Eng.
Jordi Drouin, Eng
Laurier Demers, Eng.
The Smart Grid Experience:
Applying Results, Reaching Beyond
33 © 2014 Electric Power Research Institute, Inc. All rights reserved. EPRI / DOE The Smart Grid Experience: Applying Results, Reaching Beyond
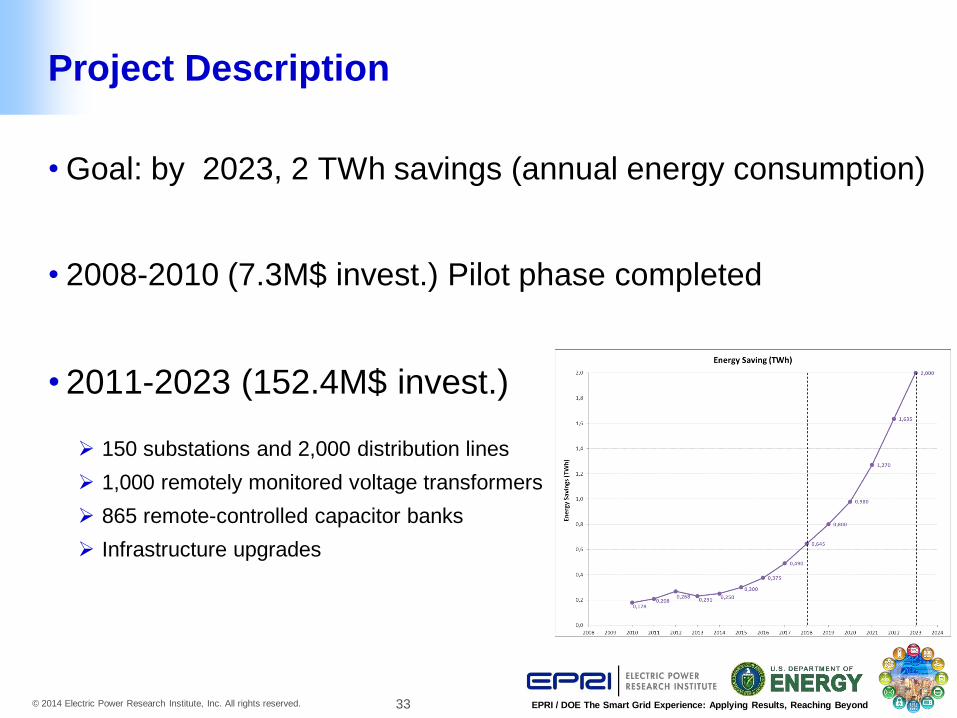
Project Description
• Goal: by 2023, 2 TWh savings (annual energy consumption)
• 2008-2010 (7.3M$ invest.) Pilot phase completed
• 2011-2023 (152.4M$ invest.)
150 substations and 2,000 distribution lines
1,000 remotely monitored voltage transformers
865 remote-controlled capacitor banks
Infrastructure upgrades
34 © 2014 Electric Power Research Institute, Inc. All rights reserved. EPRI / DOE The Smart Grid Experience: Applying Results, Reaching Beyond
VVC Project Status
• Voltage control on 17 substations (10 more to come in 2014)
• 195 TTT (medium voltage sensors) installed
• 865 remote controlled capacitors banks installed
35 © 2014 Electric Power Research Institute, Inc. All rights reserved. EPRI / DOE The Smart Grid Experience: Applying Results, Reaching Beyond
Reactive Power Control System status
Overview of system components 865 capacitors at 1.2 Mvar each – total capacity 1038 Mvar
Remote control capacitors are controlled by the distribution control system
576 capacitors currently remote controlled
Objectives Switching of the shunt distribution capacitors by remote control in order to
• improve voltage profile (distribution)
• reduce losses (transmission and distribution)
• increase stability limits (transmission)
• increase the transit of power (transmission)
Consider the real time needs and constraints of the transmission provider
Increase the energy gains if the substation has both volt & var control
36 © 2014 Electric Power Research Institute, Inc. All rights reserved. EPRI / DOE The Smart Grid Experience: Applying Results, Reaching Beyond
Reactive Power Control System
Observations: Pilot project: ~1800 capacitor switching operations
Some issues with capacitor bank operations: mechanical or remote control related deficiencies (approx. 5% total)
Important to use integrated measurements in the algorithm as opposed to instantaneous measurements
No customer complaints related to the reactive power control system observed during the pilot project
Next steps: Improve the algorithm to optimise the number of capacitor operations
Reduce maintenance cycles on the equipment
Increase capacitors being managed by the VAR control system from 576 capacitors to 865 capacitors
Develop indicators to determine the frequency in which each capacitor is used. (less frequently operated units could be moved to another location)
Integrate a VVO system in order to maximize the energy gains
37 © 2014 Electric Power Research Institute, Inc. All rights reserved. EPRI / DOE The Smart Grid Experience: Applying Results, Reaching Beyond
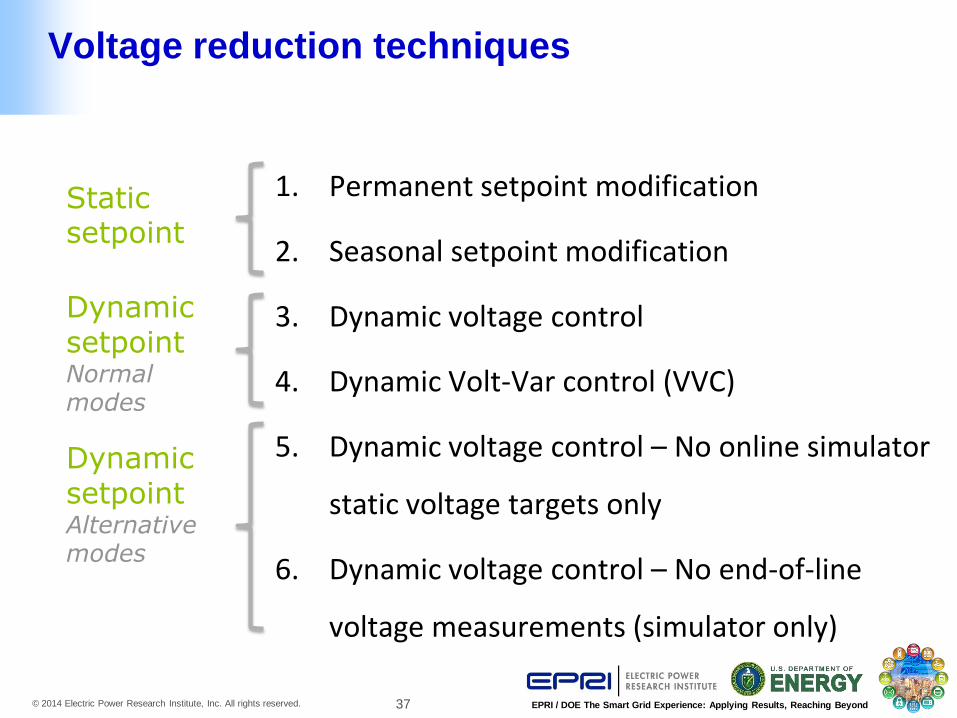
Voltage reduction techniques
1. Permanent setpoint modification
2. Seasonal setpoint modification
3. Dynamic voltage control
4. Dynamic Volt-Var control (VVC)
5. Dynamic voltage control – No online simulator
static voltage targets only
6. Dynamic voltage control – No end-of-line
voltage measurements (simulator only)
Static setpoint
Dynamic setpoint Normal modes
Dynamic setpoint Alternative modes
38 © 2014 Electric Power Research Institute, Inc. All rights reserved. EPRI / DOE The Smart Grid Experience: Applying Results, Reaching Beyond
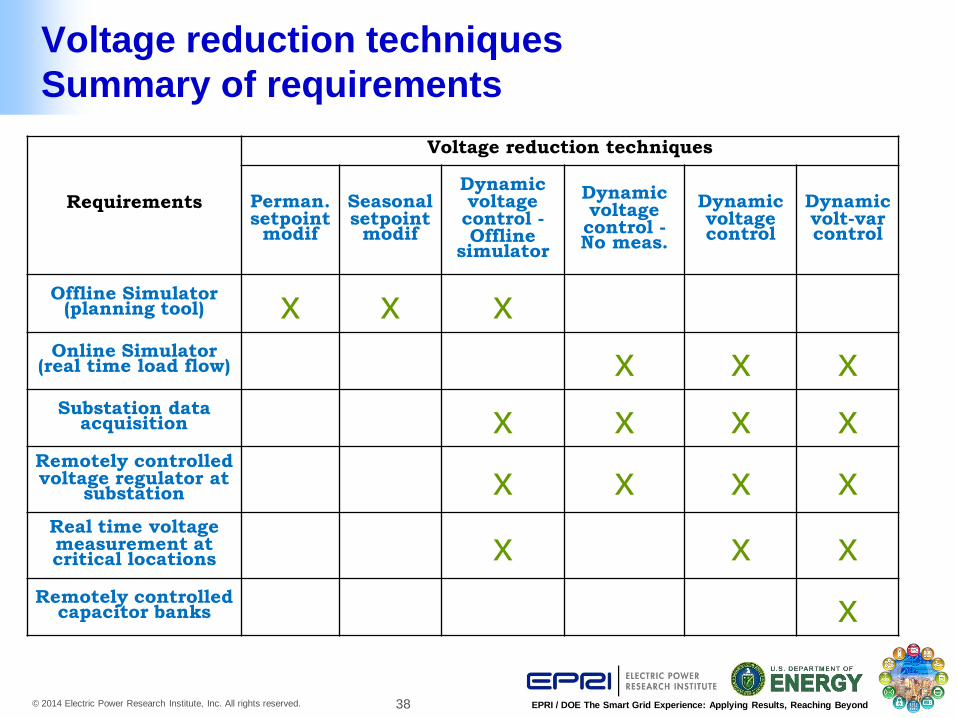
Voltage reduction techniques
Summary of requirements
Requirements
Voltage reduction techniques
Perman. setpoint modif
Seasonal setpoint modif
Dynamic voltage control - Offline
simulator
Dynamic voltage control - No meas.
Dynamic voltage control
Dynamic volt-var control
Offline Simulator (planning tool) x x x
Online Simulator (real time load flow) x x x
Substation data acquisition x x x x
Remotely controlled voltage regulator at
substation x x x x Real time voltage measurement at critical locations x x x
Remotely controlled capacitor banks x
39 © 2014 Electric Power Research Institute, Inc. All rights reserved. EPRI / DOE The Smart Grid Experience: Applying Results, Reaching Beyond
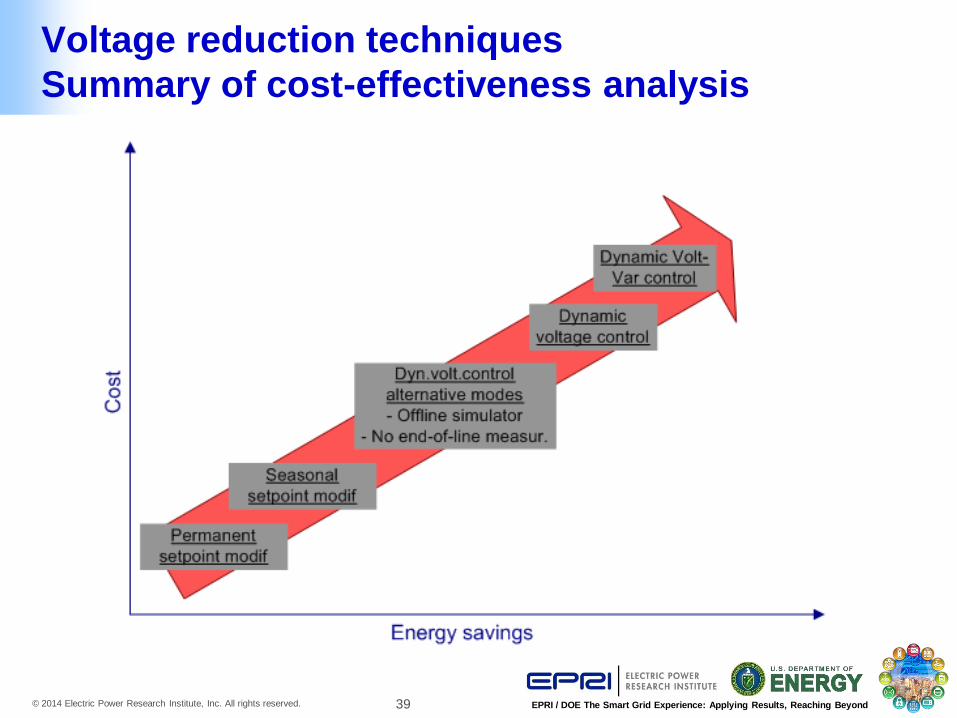
Voltage reduction techniques
Summary of cost-effectiveness analysis
40 © 2014 Electric Power Research Institute, Inc. All rights reserved. EPRI / DOE The Smart Grid Experience: Applying Results, Reaching Beyond
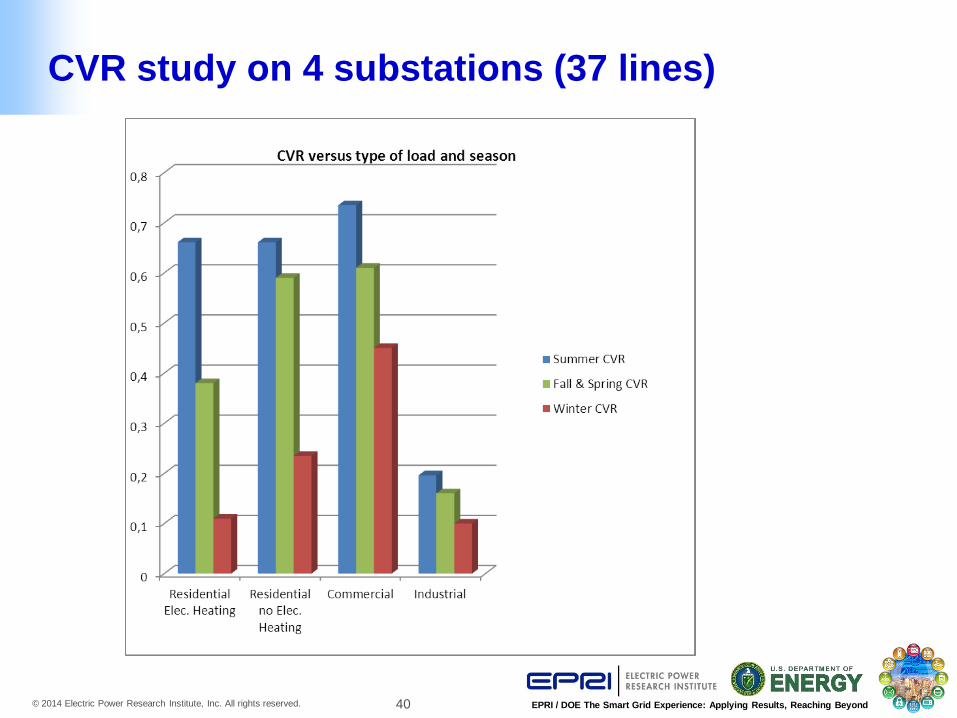
CVR study on 4 substations (37 lines)
41 © 2014 Electric Power Research Institute, Inc. All rights reserved. EPRI / DOE The Smart Grid Experience: Applying Results, Reaching Beyond
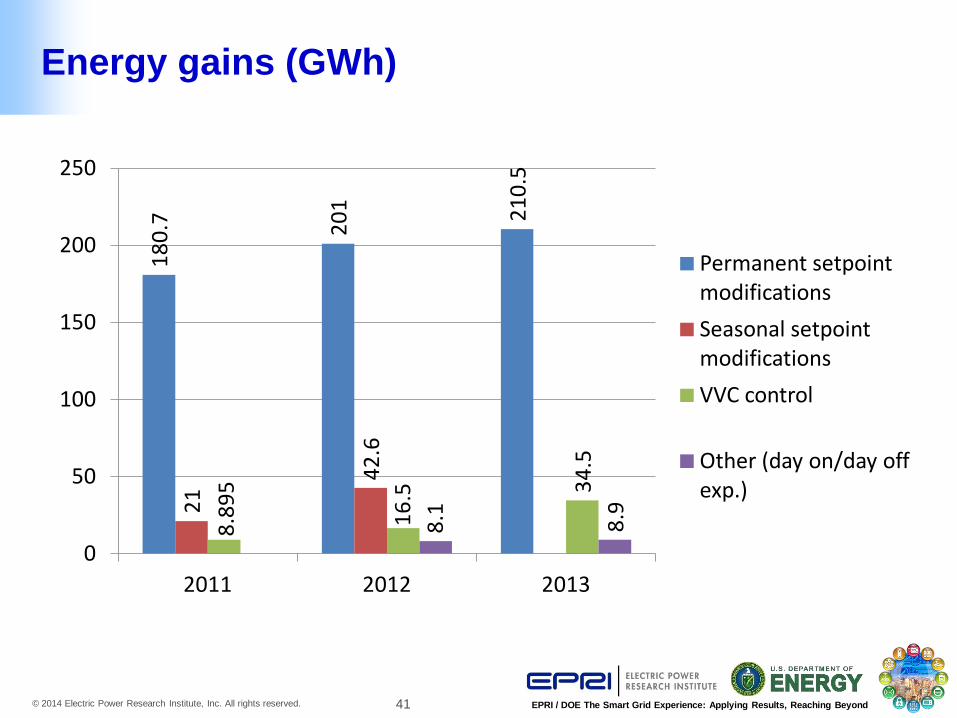
Energy gains (GWh)
1
80
.7
20
1
21
0.5
21
42
.6
8.8
95
16
.5 34
.5
8.1
8.9
0
50
100
150
200
250
2011 2012 2013
Permanent setpoint modifications
Seasonal setpoint modifications
VVC control
Other (day on/day off exp.)
42 © 2014 Electric Power Research Institute, Inc. All rights reserved. EPRI / DOE The Smart Grid Experience: Applying Results, Reaching Beyond
Lessons learned
– Low voltage on substation’s distribution panel:
in certain substations, because of a design flaw, lowering the voltage creates a risk of affecting the operation of the substation itself. Take that into account.
– During planning, two limitations are often overlooked :
• Regulation dead band (tap changer)
• Voltage unbalance (greater than expected). Must use the lowest phase voltage
– Some customers need an adaptation period even though the reduced voltage stays within the standard limits. (ex. hospitals with sensitive equipment).
43 © 2014 Electric Power Research Institute, Inc. All rights reserved. EPRI / DOE The Smart Grid Experience: Applying Results, Reaching Beyond
Conclusion
• It is not realistic to implement VVC in all substations. Still,
there are several other ways of minimizing energy
consumption through voltage reduction.
• Benefits are :
– Allows to minimize cost and/or maximize energy saved
– Could reveal issues before wasting investments.
44 © 2014 Electric Power Research Institute, Inc. All rights reserved. EPRI / DOE The Smart Grid Experience: Applying Results, Reaching Beyond
Next steps:
• Adjust our communication process to keep sensitive customers
informed of every voltage reduction as soon as planned (often
one year ahead)
• Evaluate the cost of fixing the low voltage issue in each
problematic substations
• Evaluate the use of the AMI for voltage measurements
• With the gained knowledge, refine our deployment strategy and
our business case
45 © 2014 Electric Power Research Institute, Inc. All rights reserved. EPRI / DOE The Smart Grid Experience: Applying Results, Reaching Beyond
Reference
• Hydro-Québec Smart Grid Host Site Progress Report
For the Period Ending October 2013 (Technical
Update, February 2014)
EPRI Report: 300200144 (members only report)
46 © 2014 Electric Power Research Institute, Inc. All rights reserved. EPRI / DOE The Smart Grid Experience: Applying Results, Reaching Beyond
Jim Parks,
Sacramento Municipal Utility District Email: [email protected]
• Program manager in the Energy Research and
Development department at SMUD.
• Completing a $308 million smart grid initiative,
SmartSacramento®.
• SmartSacramento has over 40 individual projects.
• Projects include distribution automation, smart
meters, demand response, dynamic pricing and more.
• Past work includes transmission planning, energy
efficiency, electric transportation and emerging
technologies.
• Over 25 years’ experience in the energy industry.
47 © 2014 Electric Power Research Institute, Inc. All rights reserved. EPRI / DOE The Smart Grid Experience: Applying Results, Reaching Beyond
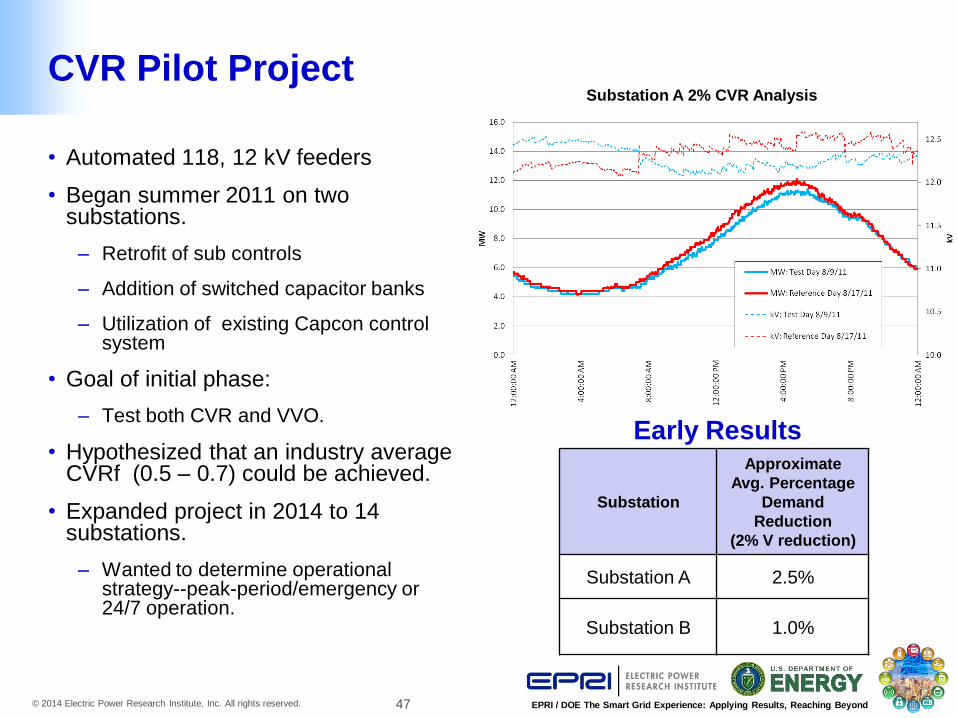
CVR Pilot Project
• Automated 118, 12 kV feeders
• Began summer 2011 on two substations.
– Retrofit of sub controls
– Addition of switched capacitor banks
– Utilization of existing Capcon control system
• Goal of initial phase:
– Test both CVR and VVO.
• Hypothesized that an industry average CVRf (0.5 – 0.7) could be achieved.
• Expanded project in 2014 to 14 substations.
– Wanted to determine operational strategy--peak-period/emergency or 24/7 operation.
Substation A 2% CVR Analysis
Substation
Approximate
Avg. Percentage
Demand
Reduction
(2% V reduction)
Substation A 2.5%
Substation B 1.0%
Early Results

48 © 2014 Electric Power Research Institute, Inc. All rights reserved. EPRI / DOE The Smart Grid Experience: Applying Results, Reaching Beyond
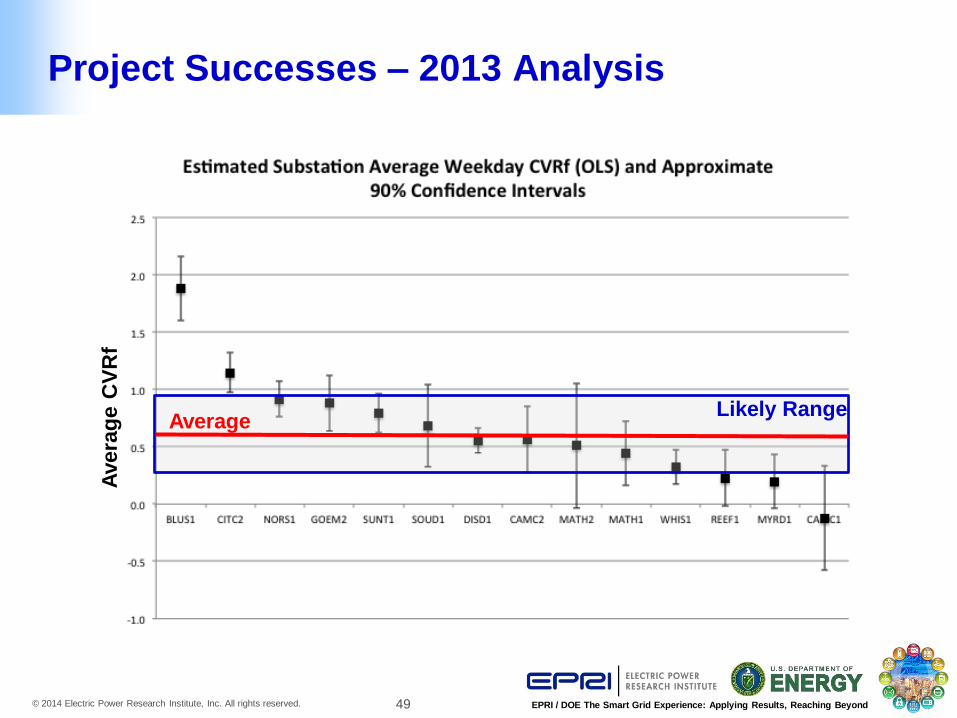
Project Successes - Overview
• Modified control system worked as designed.
• Conducted three years of CVR testing.
• Developed a statistical model to predict CVR
impacts.
– Used a variety of variables, including PV.
– Two separate regression methods produced similar
results.
• 1.8% average voltage reduction ≈
– 2% average daily energy (MWh) reduction
– 1.1 % average load (MW) reduction
49 © 2014 Electric Power Research Institute, Inc. All rights reserved. EPRI / DOE The Smart Grid Experience: Applying Results, Reaching Beyond
Project Successes – 2013 Analysis A
vera
ge C
VR
f
Average Likely Range
50 © 2014 Electric Power Research Institute, Inc. All rights reserved. EPRI / DOE The Smart Grid Experience: Applying Results, Reaching Beyond
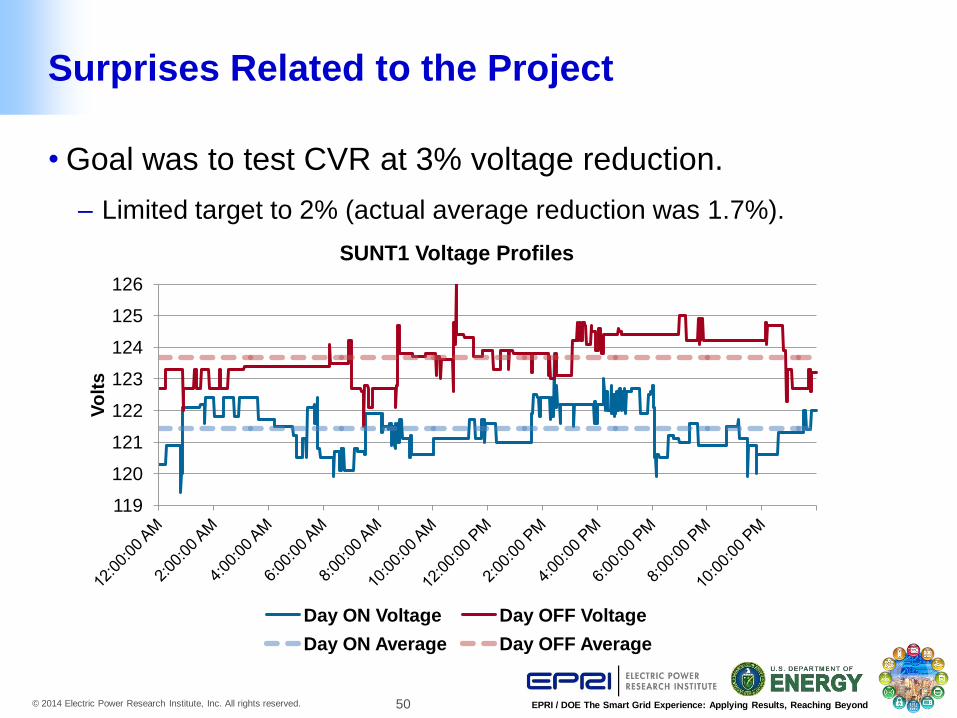
Surprises Related to the Project
• Goal was to test CVR at 3% voltage reduction.
– Limited target to 2% (actual average reduction was 1.7%).
119
120
121
122
123
124
125
126
Vo
lts
SUNT1 Voltage Profiles
Day ON Voltage Day OFF Voltage
Day ON Average Day OFF Average
51 © 2014 Electric Power Research Institute, Inc. All rights reserved. EPRI / DOE The Smart Grid Experience: Applying Results, Reaching Beyond
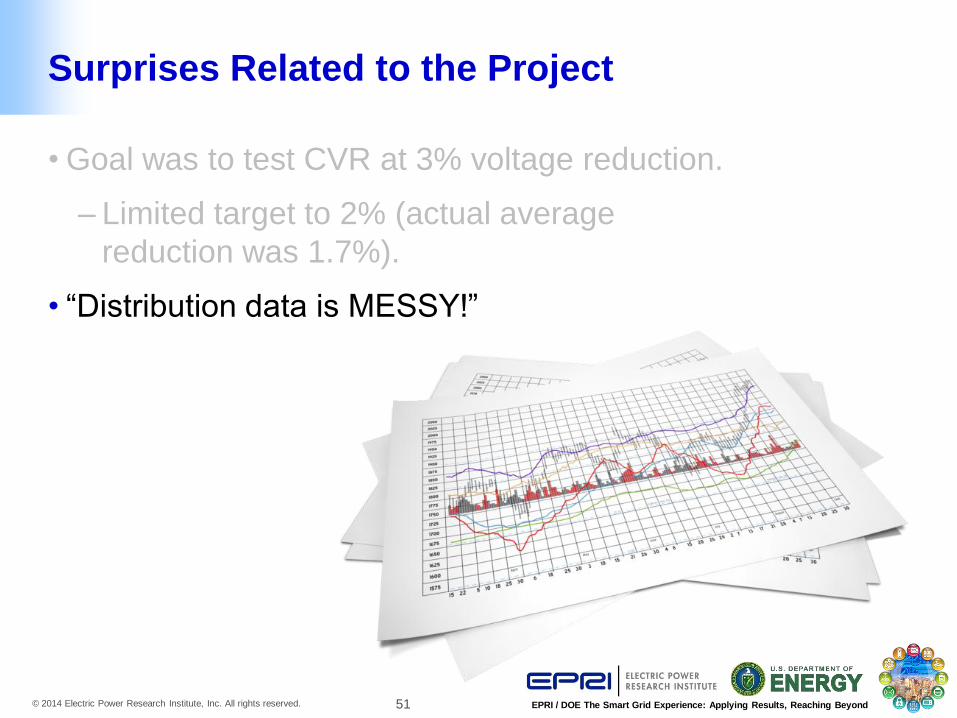
Surprises Related to the Project
• Goal was to test CVR at 3% voltage reduction.
– Limited target to 2% (actual average
reduction was 1.7%).
• “Distribution data is MESSY!”
52 © 2014 Electric Power Research Institute, Inc. All rights reserved. EPRI / DOE The Smart Grid Experience: Applying Results, Reaching Beyond
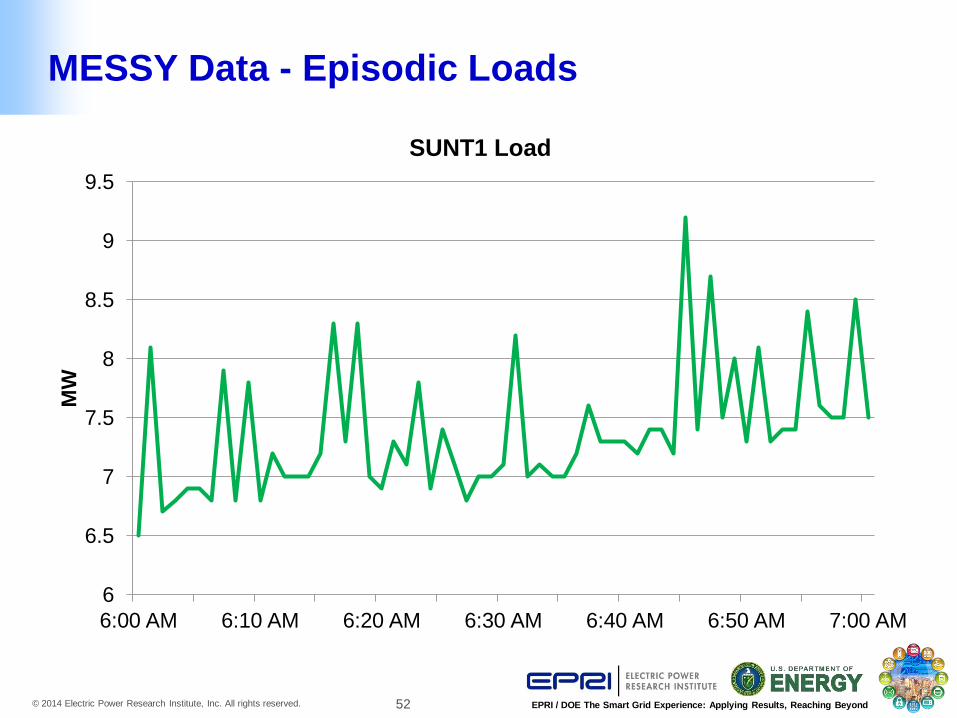
MESSY Data - Episodic Loads
6
6.5
7
7.5
8
8.5
9
9.5
6:00 AM 6:10 AM 6:20 AM 6:30 AM 6:40 AM 6:50 AM 7:00 AM
MW
SUNT1 Load
53 © 2014 Electric Power Research Institute, Inc. All rights reserved. EPRI / DOE The Smart Grid Experience: Applying Results, Reaching Beyond
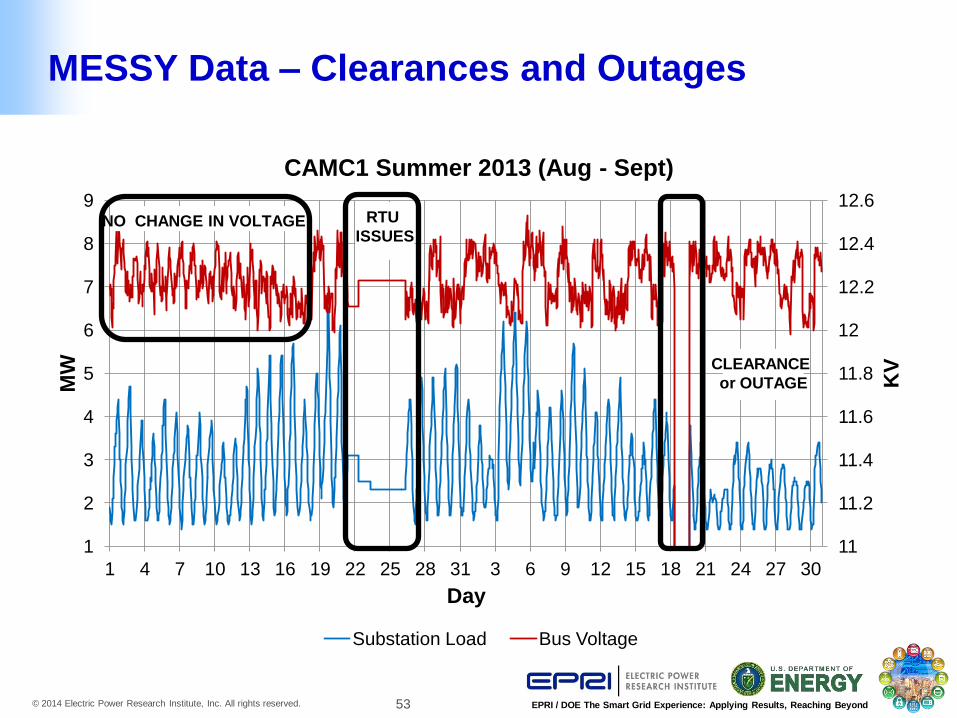
MESSY Data – Clearances and Outages
11
11.2
11.4
11.6
11.8
12
12.2
12.4
12.6
1
2
3
4
5
6
7
8
9
1 4 7 10 13 16 19 22 25 28 31 3 6 9 12 15 18 21 24 27 30
KV
MW
Day
CAMC1 Summer 2013 (Aug - Sept)
Substation Load Bus Voltage
RTU
ISSUES NO CHANGE IN VOLTAGE
CLEARANCE
or OUTAGE
54 © 2014 Electric Power Research Institute, Inc. All rights reserved. EPRI / DOE The Smart Grid Experience: Applying Results, Reaching Beyond
Surprises Related to the Project
• Goal was to test CVR at 3% voltage reduction.
– Limited target to 2% (actual average
reduction was 1.7%).
• “Distribution data is MESSY!”
– Episodic loads
– Power transformer clearance for
maintenance.
– Communication failures
• Difficulty explaining the CVRf outliers.
• No known customer complaints.
55 © 2014 Electric Power Research Institute, Inc. All rights reserved. EPRI / DOE The Smart Grid Experience: Applying Results, Reaching Beyond
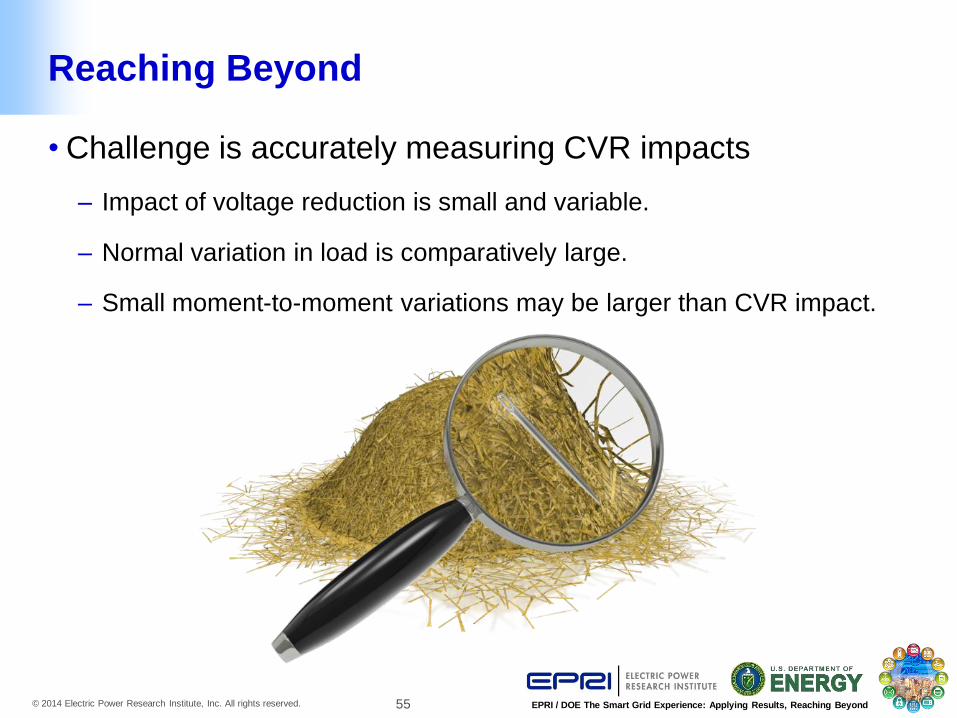
Reaching Beyond
• Challenge is accurately measuring CVR impacts
– Impact of voltage reduction is small and variable.
– Normal variation in load is comparatively large.
– Small moment-to-moment variations may be larger than CVR impact.
56 © 2014 Electric Power Research Institute, Inc. All rights reserved. EPRI / DOE The Smart Grid Experience: Applying Results, Reaching Beyond
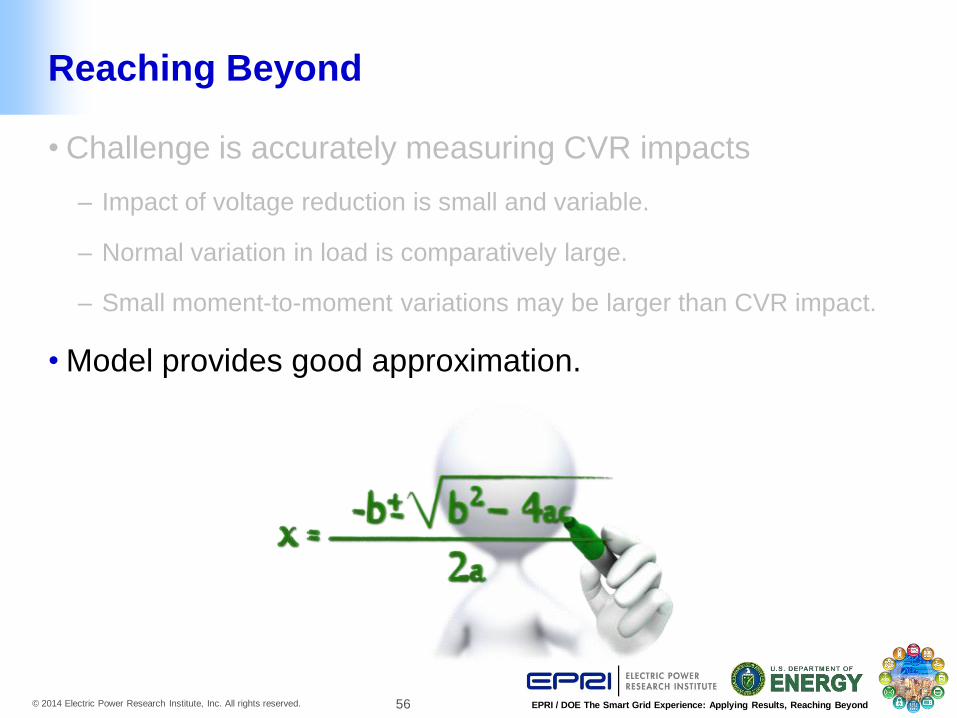
Reaching Beyond
• Challenge is accurately measuring CVR impacts
– Impact of voltage reduction is small and variable.
– Normal variation in load is comparatively large.
– Small moment-to-moment variations may be larger than CVR impact.
• Model provides good approximation.
57 © 2014 Electric Power Research Institute, Inc. All rights reserved. EPRI / DOE The Smart Grid Experience: Applying Results, Reaching Beyond
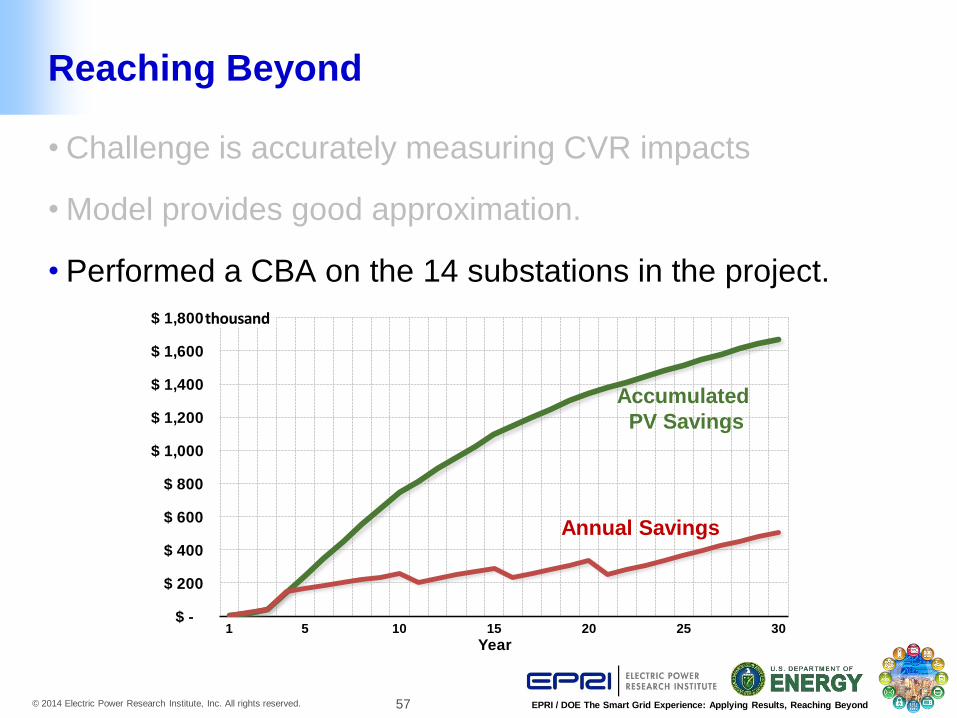
Reaching Beyond
• Challenge is accurately measuring CVR impacts
• Model provides good approximation.
• Performed a CBA on the 14 substations in the project.
$ -
$ 200
$ 400
$ 600
$ 800
$ 1,000
$ 1,200
$ 1,400
$ 1,600
$ 1,800
1 5 10 15 20 25 30
Year
thousand
Annual Savings
Accumulated
PV Savings
58 © 2014 Electric Power Research Institute, Inc. All rights reserved. EPRI / DOE The Smart Grid Experience: Applying Results, Reaching Beyond
Reaching Beyond – Next Steps
• Challenge is accurately
measuring CVR impacts
• Developed model provides
good approximation.
• Performed a CBA on the 14
substations in the project.
• Developing a business case
for peak-time and full-time
CVR.
• Present findings to
management.
59 © 2014 Electric Power Research Institute, Inc. All rights reserved. EPRI / DOE The Smart Grid Experience: Applying Results, Reaching Beyond
Jay Oliver, Duke Energy Email: [email protected]
• Held Director of Grid Automation role since Fall 2012
• Prior to this, served as
– Major Projects Manager, Distribution System Demand
Response, Progress Energy Florida
– Director, Distribution Services, Progress Energy Florida
– General Manager, South Coastal Region, Progress
Energy Florida
• Received bachelor’s degree in electrical engineering from
the Georgia Institute of Technology
• Earned his master’s degree in business administration from
the University of South Florida.
• Licensed Professional Engineer in Florida.
60 © 2014 Electric Power Research Institute, Inc. All rights reserved. EPRI / DOE The Smart Grid Experience: Applying Results, Reaching Beyond
IVVC Projects at Duke Energy
Duke Energy Ohio
• IVVC designed to operate 24/7
• Targets an average 2% voltage reduction on approx. 500 circuits
• Included gaining control of voltage regulating devices (in substations
and on distribution circuits) through DMS
Duke Energy Progress
• Distribution System Demand Response (DSDR) targeted 310MW of
peak demand reduction capability to avoid new CT plant construction
• Peak shaving voltage reduction currently approaches 4%
• North Carolina Utility Commission classified DSDR as an Energy
Efficiency program with rider recovery
• Included significant circuit conditioning and automation of voltage
regulating devices through DMS
61 © 2014 Electric Power Research Institute, Inc. All rights reserved. EPRI / DOE The Smart Grid Experience: Applying Results, Reaching Beyond
IVVC Projects at Duke Energy
Other Jurisdictions
(Carolinas, Florida, Indiana and Kentucky)
• Evaluating Volt/VAR control opportunities to
determine appropriate methodologies and
optimal design for each area
• Applying lessons learned and best practices
from IVVC and DSDR projects
62 © 2014 Electric Power Research Institute, Inc. All rights reserved. EPRI / DOE The Smart Grid Experience: Applying Results, Reaching Beyond
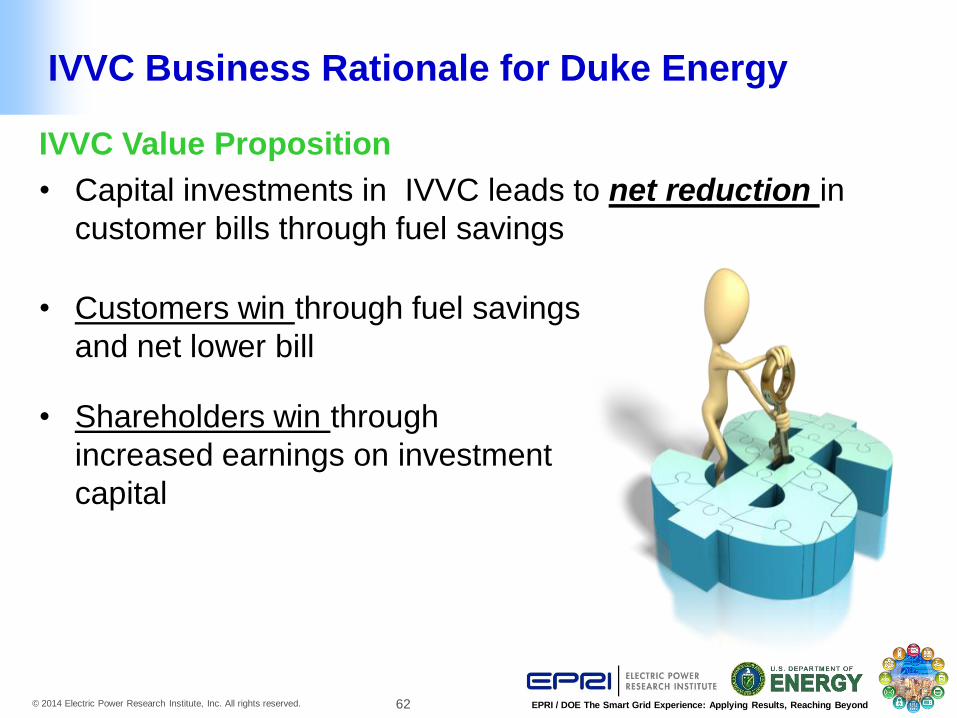
IVVC Value Proposition
• Capital investments in IVVC leads to net reduction in
customer bills through fuel savings
.
IVVC Business Rationale for Duke Energy
• Customers win through fuel savings
and net lower bill
• Shareholders win through
increased earnings on investment
capital
63 © 2014 Electric Power Research Institute, Inc. All rights reserved. EPRI / DOE The Smart Grid Experience: Applying Results, Reaching Beyond
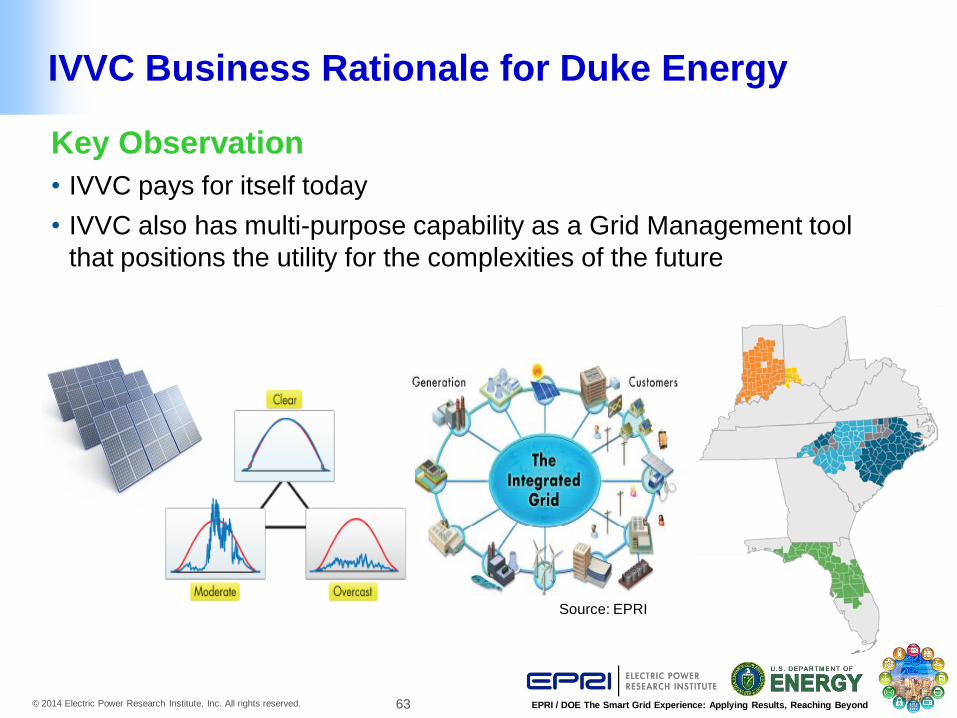
IVVC Business Rationale for Duke Energy
Key Observation
• IVVC pays for itself today
• IVVC also has multi-purpose capability as a Grid Management tool
that positions the utility for the complexities of the future
Source: EPRI
64 © 2014 Electric Power Research Institute, Inc. All rights reserved. EPRI / DOE The Smart Grid Experience: Applying Results, Reaching Beyond
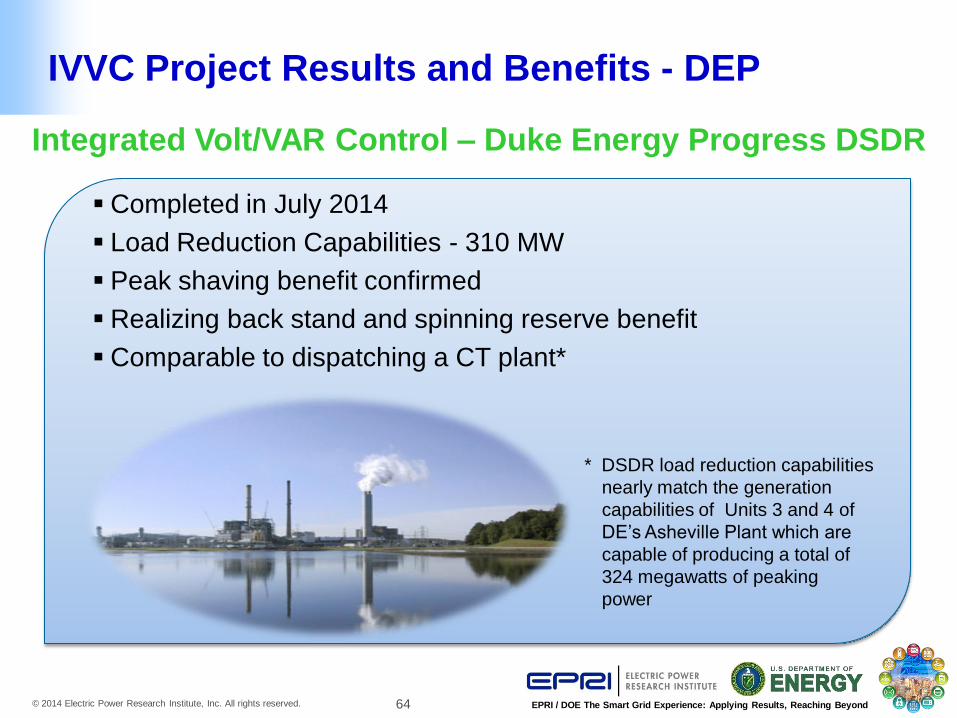
Integrated Volt/VAR Control – Duke Energy Progress DSDR
* DSDR load reduction capabilities
nearly match the generation
capabilities of Units 3 and 4 of
DE’s Asheville Plant which are
capable of producing a total of
324 megawatts of peaking
power
IVVC Project Results and Benefits - DEP
Completed in July 2014
Load Reduction Capabilities - 310 MW
Peak shaving benefit confirmed
Realizing back stand and spinning reserve benefit
Comparable to dispatching a CT plant*
65 © 2014 Electric Power Research Institute, Inc. All rights reserved. EPRI / DOE The Smart Grid Experience: Applying Results, Reaching Beyond
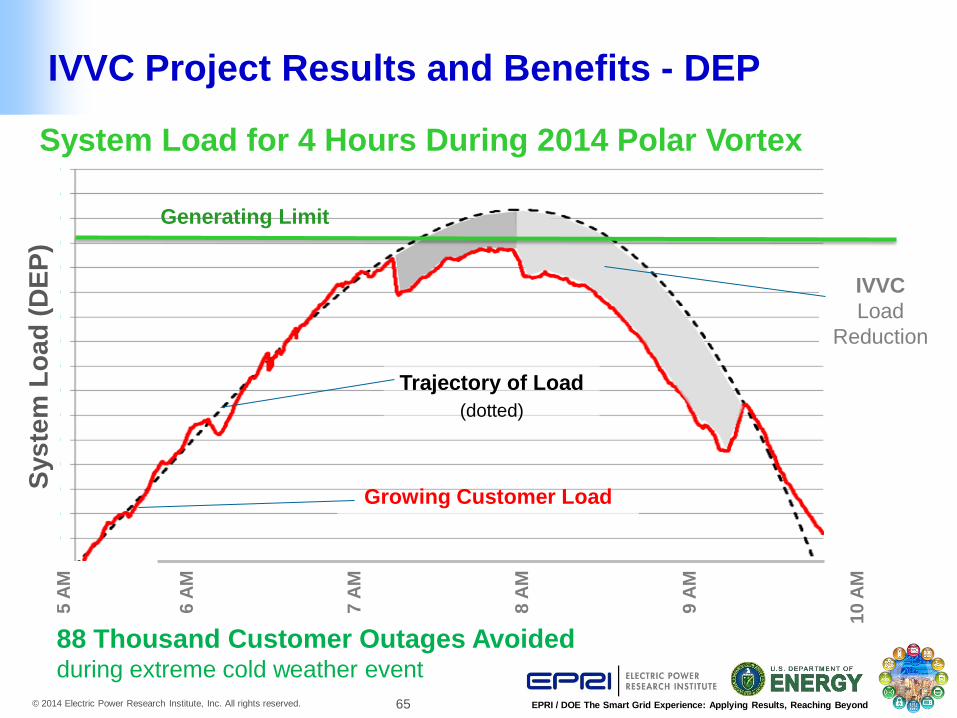
Growing Customer Load
Trajectory of Load
(dotted)
Sys
tem
Lo
ad
(D
EP
)
System Load for 4 Hours During 2014 Polar Vortex
Generating Limit
IVVC
Load
Reduction
5 A
M
6 A
M
7 A
M
8 A
M
9 A
M
10 A
M
88 Thousand Customer Outages Avoided during extreme cold weather event
IVVC Project Results and Benefits - DEP
66 © 2014 Electric Power Research Institute, Inc. All rights reserved. EPRI / DOE The Smart Grid Experience: Applying Results, Reaching Beyond
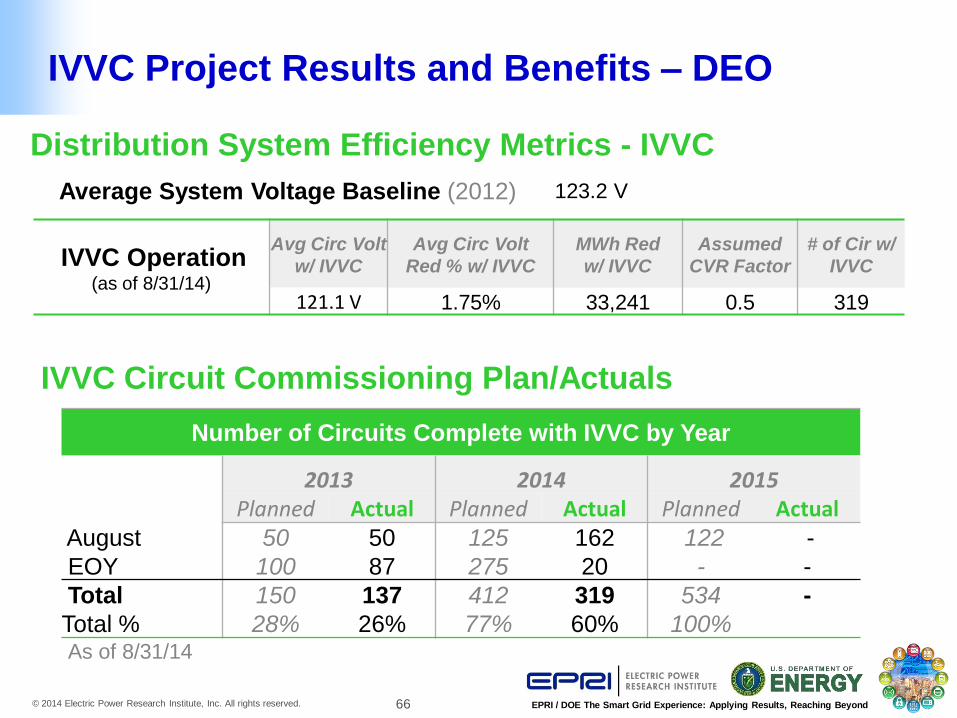
IVVC Circuit Commissioning Plan/Actuals
Distribution System Efficiency Metrics - IVVC
Number of Circuits Complete with IVVC by Year
2013 2014 2015 Planned Actual Planned Actual Planned Actual August 50 50 125 162 122 - EOY 100 87 275 20 - - Total 150 137 412 319 534 - Total % 28% 26% 77% 60% 100%
Average System Voltage Baseline (2012) 123.2 V
IVVC Operation (as of 8/31/14)
Avg Circ Volt
w/ IVVC Avg Circ Volt
Red % w/ IVVC MWh Red
w/ IVVC Assumed
CVR Factor # of Cir w/
IVVC
121.1 V 1.75% 33,241 0.5 319
IVVC Project Results and Benefits – DEO
As of 8/31/14
67 © 2014 Electric Power Research Institute, Inc. All rights reserved. EPRI / DOE The Smart Grid Experience: Applying Results, Reaching Beyond
Successes, Surprises, and Next Steps
Lessons Learned
• IVVC projects require dedicated and cross functional project team
• Somebody needs to be “in charge” of delivering the benefit
• Do not underestimate efforts for DMS configuration and testing
• Legacy data accuracy is critical to DMS system model
• Utility and vendor senior management sponsorship is critical
• Received higher level of regulatory oversight than we expected
Next Steps
• Will consider a combination of 24/7 and peak shaving modes
• Developing Duke Energy IVVC road map
68 © 2014 Electric Power Research Institute, Inc. All rights reserved. EPRI / DOE The Smart Grid Experience: Applying Results, Reaching Beyond
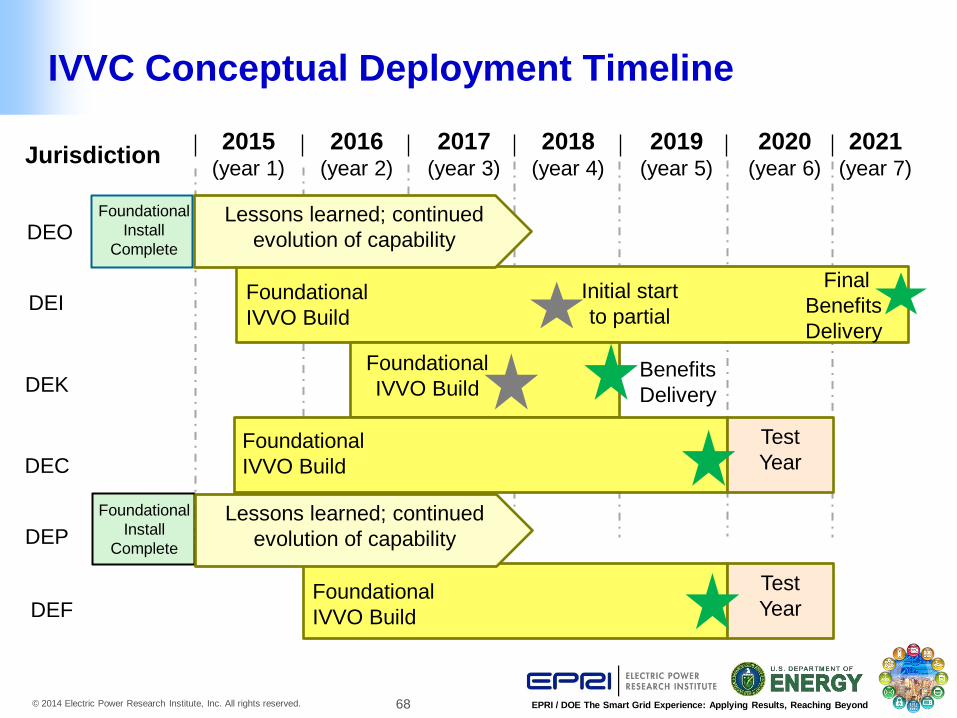
Jurisdiction 2015 (year 1)
2016 (year 2)
2017 (year 3)
2018 (year 4)
2019 (year 5)
2020 (year 6)
DEO
DEI
DEK
DEC
DEP
DEF
Foundational
Install
Complete
Foundational
IVVO Build
Initial start
to partial
Final
Benefits
Delivery
Foundational
IVVO Build
Foundational
IVVO Build
2021 (year 7)
Foundational
IVVO Build
Test
Year
Test
Year
Lessons learned; continued
evolution of capability
Lessons learned; continued
evolution of capability
IVVC Conceptual Deployment Timeline
Benefits
Delivery
Foundational
Install
Complete
69 © 2014 Electric Power Research Institute, Inc. All rights reserved. EPRI / DOE The Smart Grid Experience: Applying Results, Reaching Beyond
Jeffrey D. Roark, EPRI Email: [email protected]
• 34 years experience in regulated, unregulated, and
government utilities
– transmission and generation system planning,
– strategic planning
– bulk power contracts
– power market analysis
– wholesale deal structuring
– trading and marketing research
– regulatory analysis (as both regulator and regulated)
• With EPRI since 2011, responsible for cost/benefit
analysis in the Smart Grid Demonstrations program
• BEE, MSEE Auburn University
MBA, University of Alabama at Birmingham
70 © 2014 Electric Power Research Institute, Inc. All rights reserved. EPRI / DOE The Smart Grid Experience: Applying Results, Reaching Beyond
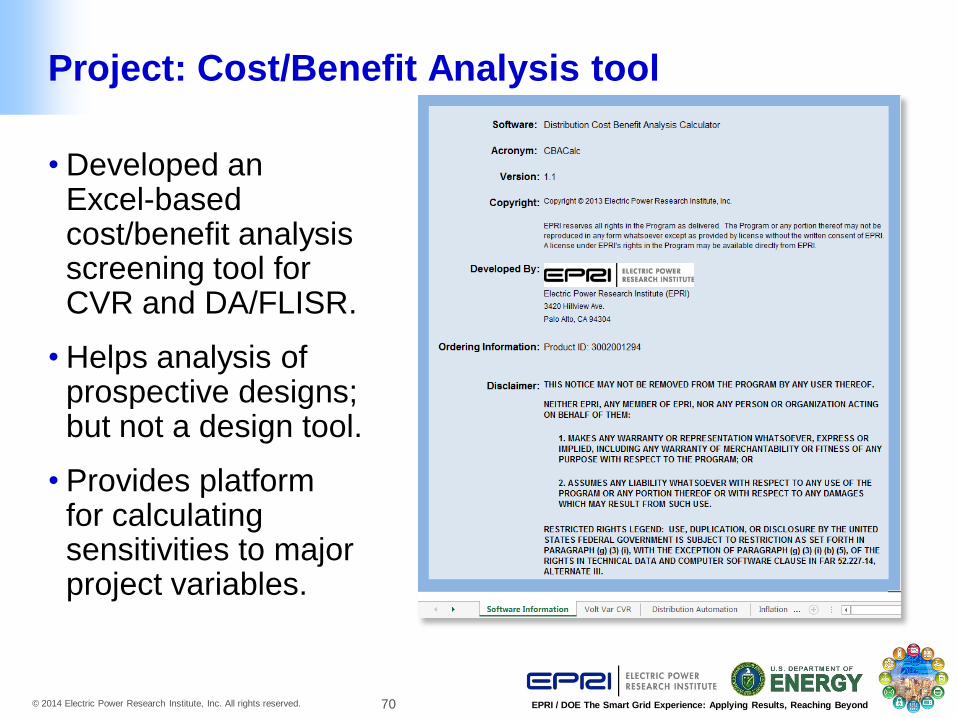
Project: Cost/Benefit Analysis tool
• Developed an Excel-based cost/benefit analysis screening tool for CVR and DA/FLISR.
• Helps analysis of prospective designs; but not a design tool.
• Provides platform for calculating sensitivities to major project variables.
71 © 2014 Electric Power Research Institute, Inc. All rights reserved. EPRI / DOE The Smart Grid Experience: Applying Results, Reaching Beyond
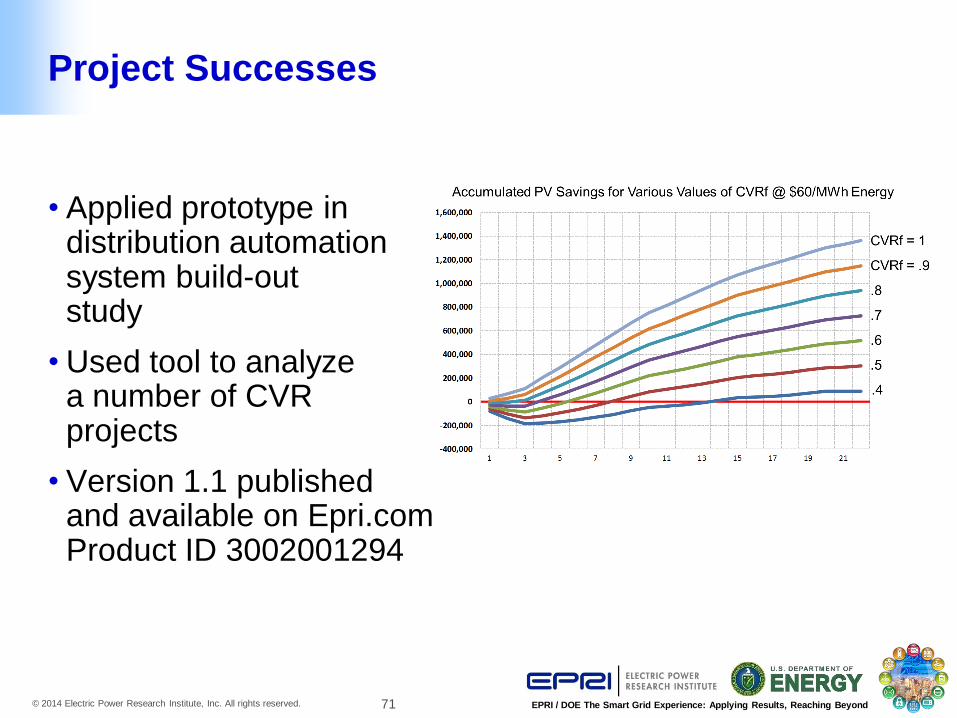
Project Successes
• Applied prototype in distribution automation system build-out study
• Used tool to analyze a number of CVR projects
• Version 1.1 published and available on Epri.com Product ID 3002001294
72 © 2014 Electric Power Research Institute, Inc. All rights reserved. EPRI / DOE The Smart Grid Experience: Applying Results, Reaching Beyond
Cost/Benefit Analysis for VVC/CVR
• CBA for CVR is mostly straightforward.
– Utility Costs: Capital for VVC equipment & systems
– Utility Savings: energy, GT&D capital deferrals
• Capacity and energy impacts are easily monetized.
• The tool handles the largest cost and impact components.
73 © 2014 Electric Power Research Institute, Inc. All rights reserved. EPRI / DOE The Smart Grid Experience: Applying Results, Reaching Beyond
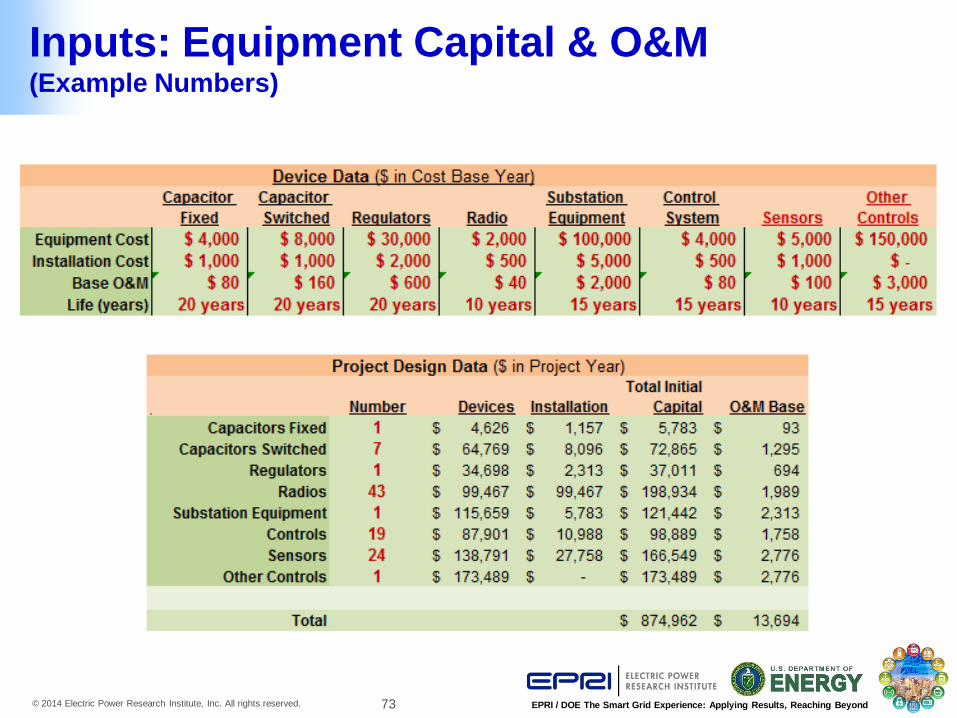
Inputs: Equipment Capital & O&M (Example Numbers)
74 © 2014 Electric Power Research Institute, Inc. All rights reserved. EPRI / DOE The Smart Grid Experience: Applying Results, Reaching Beyond
$ -
$ 50
$ 100
$ 150
$ 200
$ 250
$ 300
1 5 10 15 20 25 30
Year
Thousand
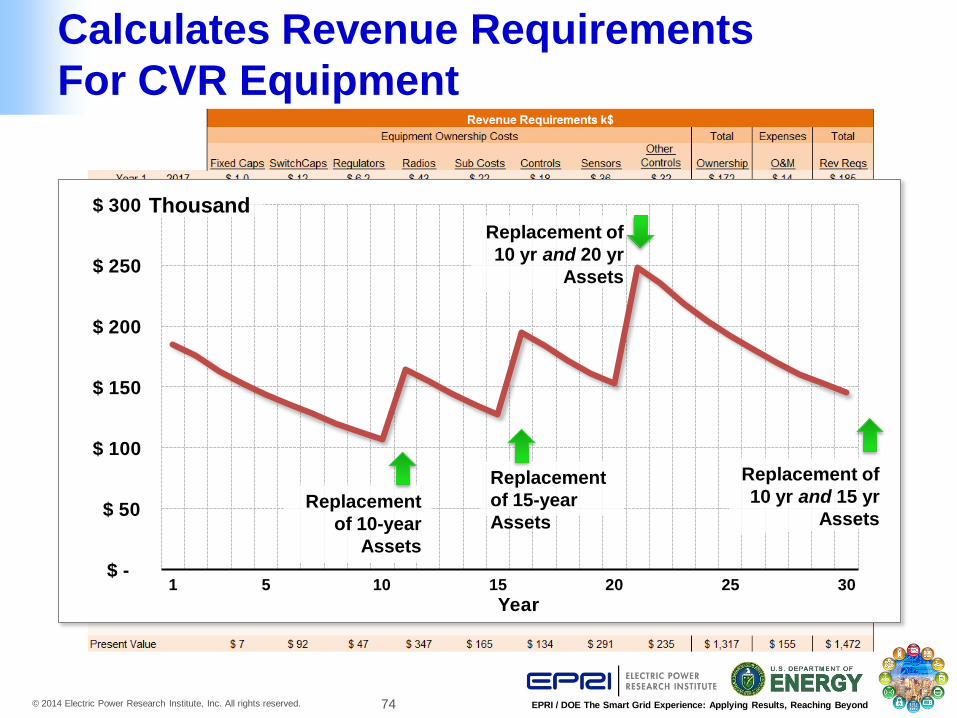
Calculates Revenue Requirements
For CVR Equipment
Replacement
of 10-year
Assets
Replacement
of 15-year
Assets
Replacement of
10 yr and 20 yr
Assets
Replacement of
10 yr and 15 yr
Assets
75 © 2014 Electric Power Research Institute, Inc. All rights reserved. EPRI / DOE The Smart Grid Experience: Applying Results, Reaching Beyond
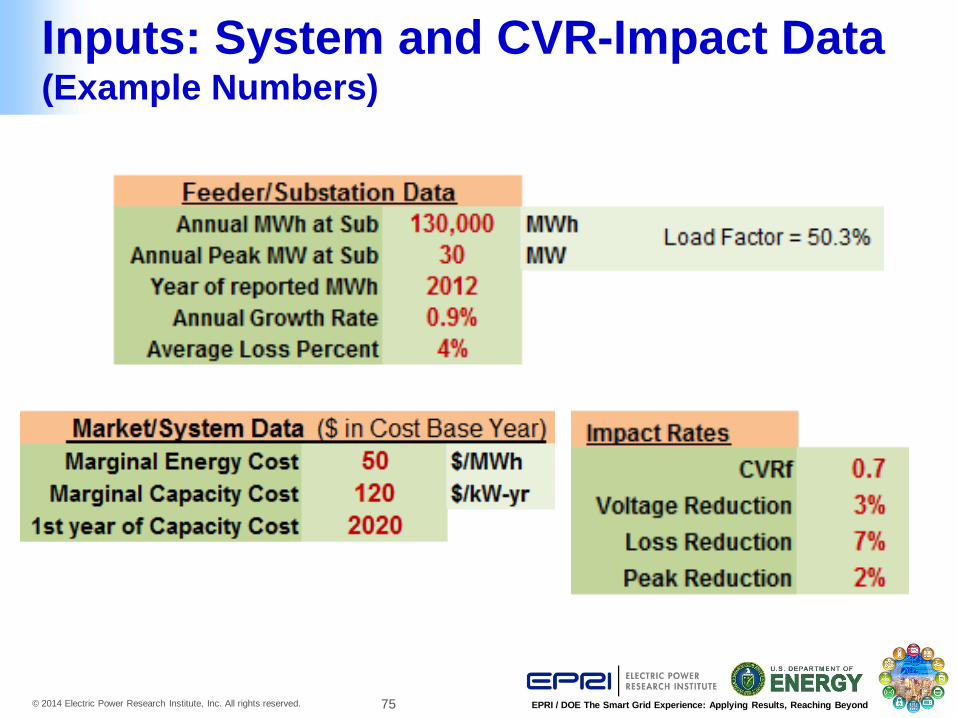
Inputs: System and CVR-Impact Data (Example Numbers)
76 © 2014 Electric Power Research Institute, Inc. All rights reserved. EPRI / DOE The Smart Grid Experience: Applying Results, Reaching Beyond
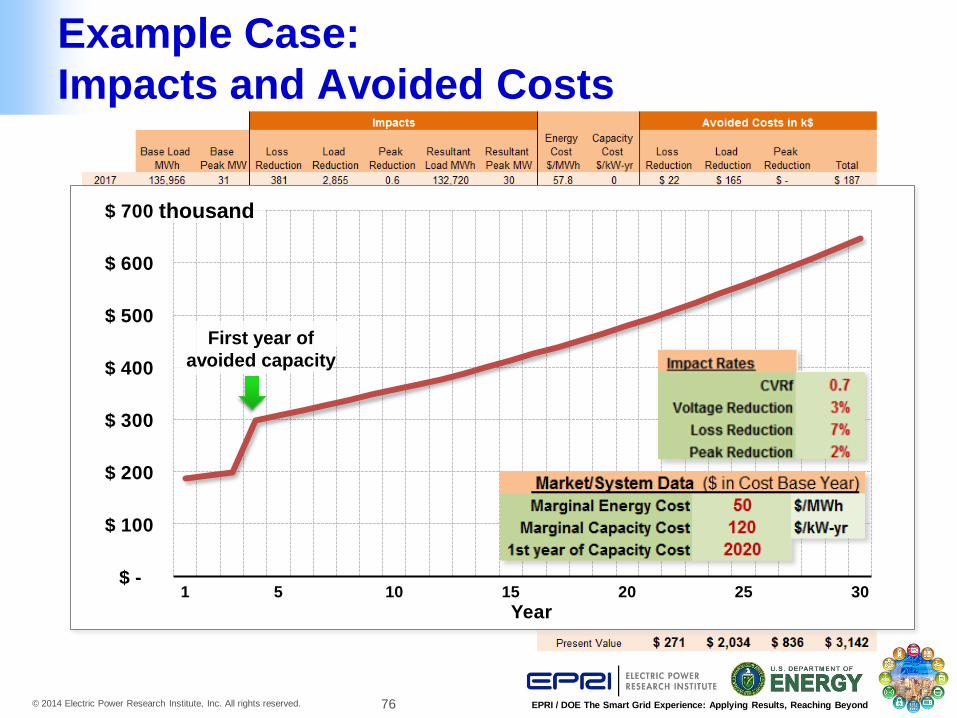
Example Case:
Impacts and Avoided Costs
$ -
$ 100
$ 200
$ 300
$ 400
$ 500
$ 600
$ 700
1 5 10 15 20 25 30
Year
thousand
First year of
avoided capacity
77 © 2014 Electric Power Research Institute, Inc. All rights reserved. EPRI / DOE The Smart Grid Experience: Applying Results, Reaching Beyond
$ -
$ 200
$ 400
$ 600
$ 800
$ 1,000
$ 1,200
$ 1,400
$ 1,600
$ 1,800
1 5 10 15 20 25 30
Year
thousand
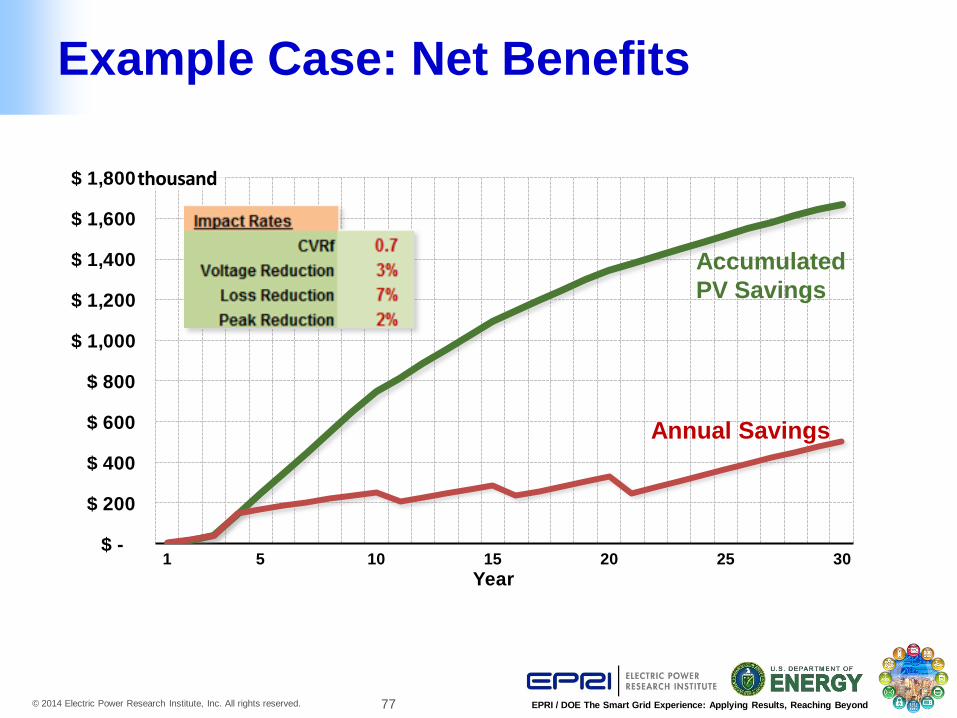
Example Case: Net Benefits
Annual Savings
Accumulated
PV Savings
78 © 2014 Electric Power Research Institute, Inc. All rights reserved. EPRI / DOE The Smart Grid Experience: Applying Results, Reaching Beyond
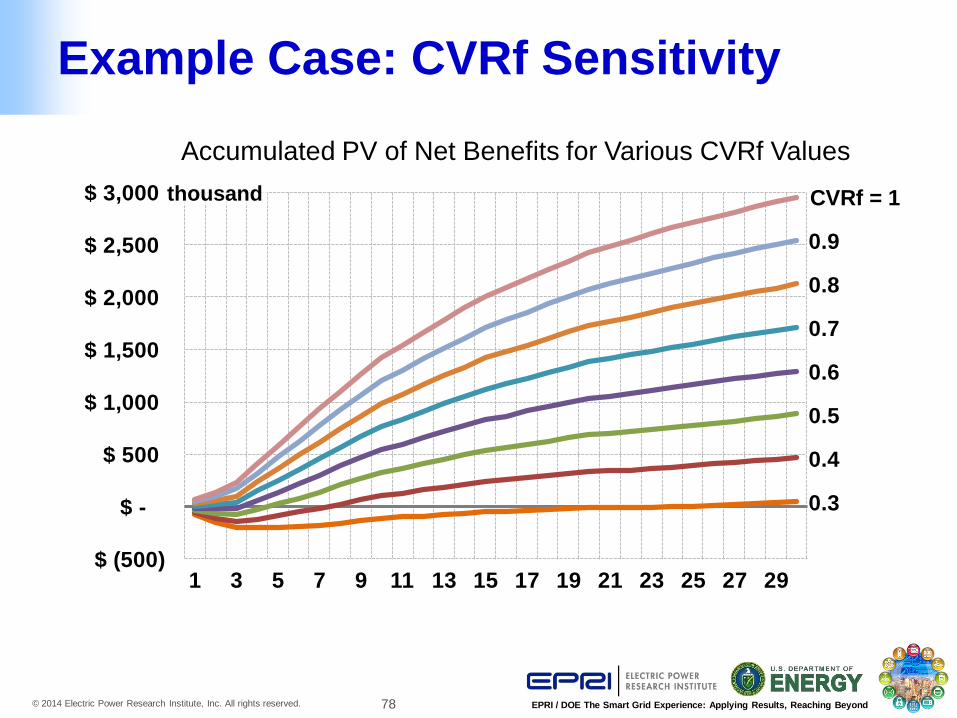
Example Case: CVRf Sensitivity
0.3
0.4
0.5
0.6
0.7
0.8
0.9
CVRf = 1
$ (500)
$ -
$ 500
$ 1,000
$ 1,500
$ 2,000
$ 2,500
$ 3,000
1 3 5 7 9 11 13 15 17 19 21 23 25 27 29
thousand
Accumulated PV of Net Benefits for Various CVRf Values
79 © 2014 Electric Power Research Institute, Inc. All rights reserved. EPRI / DOE The Smart Grid Experience: Applying Results, Reaching Beyond
Surprises Related to the Project
Not so surprising:
• Utilities’ monetization assumptions (marginal energy and
capacity) may not fit simple inflation scheme.
– Used modified version to incorporate custom marginal
energy and marginal capacity values
• Sensitivities provide sense of assumption importance.
– CVRf variation low to high
– CVRf decay to a lower value
80 © 2014 Electric Power Research Institute, Inc. All rights reserved. EPRI / DOE The Smart Grid Experience: Applying Results, Reaching Beyond
A Few Comments on M&V for CVR
• Low or nonsensical results from day-on/off regression
analysis does not necessarily mean that CVR is not
effective on a particular circuit.
• Large, non-conforming loads or singular events can mask
the CVR effect.
• Evaluate statistical significance of all results, including
high and “expected” results.
• Given M&V issues, nothing is precise.
Look at a range of possibilities.
81 © 2014 Electric Power Research Institute, Inc. All rights reserved. EPRI / DOE The Smart Grid Experience: Applying Results, Reaching Beyond
Questions / Discussion