Session 105 - Maximizing Health of the Workforce … 105 Maximizing the Health of the Workforce MY...
12
4/2/2014 1 CULTURE OF HEALTH: The Healthy Worker Advantage (c) ACOEM 2012 Sunday April 27, 2014 AOHC 2014 Session 105 Maximizing the Health of the Workforce MY BACKGROUND: A PATIENT, A PROVIDER, A PAYER, A PURCHASER, A VENDOR, A CONSULTANT, AN INFORMATIST Ray Fabius MD Co-founder & President HealthNEXT HISTORICAL PERSPECTIVE 3 Agenda • What is a Culture of Health f • How do you Build a Culture of Health • Why do it – What is the Value to Organizations • Emerging Technologies Learning Objectives • Describe the core elements of a Culture of Health and master two methods to build one into their own company. • Understand the relationship between health and productivity and be able to discuss the business case for building a culture fh lh ofhealth • Explore the connection between health status and wealth generation • Articulate steps required to effectively implement workplace health, wellness & safety programs • Identify sources of data for understanding the true costs of health Learning Objectives • Discuss the 3 types of prevention strategies • Understand the components of the implementation plan • Discuss the value of evaluating workplace health & wellness programs
Transcript of Session 105 - Maximizing Health of the Workforce … 105 Maximizing the Health of the Workforce MY...

4/2/2014
1
CULTURE OF HEALTH:The Healthy Worker Advantage
(c) ACOEM 2012
Sunday April 27, 2014AOHC 2014Session 105
Maximizing the Health of the Workforce
MY BACKGROUND: A PATIENT, A PROVIDER, A PAYER, A PURCHASER, A VENDOR, A CONSULTANT, AN INFORMATIST
Ray Fabius MDCo-founder & President HealthNEXT
HISTORICAL PERSPECTIVE
3
Agenda
• What is a Culture of Health
f• How do you Build a Culture of Health
• Why do it – What is the Value to Organizations
• Emerging Technologies
Learning Objectives
• Describe the core elements of a Culture of Health and master two methods to build one into their own company.
• Understand the relationship between health and productivity and be able to discuss the business case for building a culture f h l hof health
• Explore the connection between health status and wealth generation
• Articulate steps required to effectively implement workplace health, wellness & safety programs
• Identify sources of data for understanding the true costs of health
Learning Objectives
• Discuss the 3 types of prevention strategies
• Understand the components of the implementation plan
• Discuss the value of evaluating workplace health & wellness programs

4/2/2014
2
What is a Culture of Health?How Do You Build One?How Do You Build One? Why Is It Important?
What is a Culture of Health?
• A process that documents a flat or decreasing medical cost trend and the elevation of the health status of the population or participants
• A comprehensive approach that includes environmental cues, corporate or organizational structures and policies, data warehousing and analytics marketing anddata warehousing and analytics, marketing and communications, evidence based benefit design, and vendor management.
• Addresses corporate competitiveness as a human asset investment versus a necessary cost to be reduced to the extent possible
A Healthy Workforce is a Competitive Advantage
How Do You Build a COH?
• Methods have emerged
– ACOEM MethodologyMethodology
– CAWG Roadmap
• New Approaches
– Comparison to Benchmark
– Our Research
STEP 1
STEP 2
COMPANY ASSESSMENT
DATA ANDMETRICS
ROADMAP FOR IMPLEMENTING WORKPLACE WELLNESS PROGRAMS
STEP 2
STEP 3
STEP 4
STEP 5
DATA AND METRICS
OPERATIONAL PLAN
INTERVENTIONS
EVALUATION & REFINEMENTS
Step 1
COMPANY ASSESSMENT
Ethical IssuesSelection Bias & Internal Threats
Senior Support &Communications
ExternalCollaborators
Internal Collaborators
Components of a successful health and productivity program
• General Philosophy
• Organizational Structure
• Goals and Metrics
Company Assessment
• Interventions and Outcomes
• Integration and Trends
• Incentives
hpm.acoem.org

4/2/2014
3
Corporate Health Achievement Award (CHAA) Self‐Assessment developed to:
• Help organizations identify their strengths, weaknesses, and gaps
• Encourage organizational self‐assessment and continuous improvement
Company Assessment
p• Foster understanding of standards of excellence for workplace
health, wellness and safety utilizing the CHAA criteria • Gain a better understanding of the award criteria and scoring
www.chaa.org
• Stakeholders
– Broad based company support
– Inclusion of managers in program development
• Must have a commitment to prevention and a culture of health rather than just more treatment and cure ‐ (Loeppke, R.
Senior Support and Communications
j pp
The Value of Health and the Power of Prevention IJWHM. 2008; 1 (2):95‐108)
• Align incentives among the key stakeholders – to promote wellness, reduce risk, enhance health and improve quality of care for those that already have a medical condition (Loeppke and Hymel, 2006; Loeppke, 2002).
STEP 1
STEP 2
COMPANY ASSESSMENT
DATA ANDMETRICS
ROADMAP FOR IMPLEMENTING WORKPLACE WELLNESS PROGRAMS
STEP 2
STEP 3
STEP 4
STEP 5
DATA AND METRICS
OPERATIONAL PLAN
INTERVENTIONS
EVALUATION & REFINEMENTS
DATA AND METRICS
HealthM t i
ProductivityM t i
CURRENT MEASURABLE DATA NEW SURVEYS
Presenteeism
Step 2
HRAMetrics Metrics
Health Risks
PharmacyCosts
DiseasePrevalence
MedicalCosts
AbsenceOvertimeStaffing
Worker’sComp
Presenteeismsurvey
EmployeeNeeds Survey
Total Cost of Employee Health
Presenteeism
Health Costs:Medical & PharmacyProductivity
Costs:
AbsenteeismAbsenteeism
STD
LTD
McCunney, A Practical Approach to Occupational and Environmental Medicine, Lippincott 2003
WC
STEP 1
STEP 2
COMPANY ASSESSMENT
DATA ANDMETRICS
ROADMAP FOR IMPLEMENTING WORKPLACE WELLNESS PROGRAMS
STEP 2
STEP 3
STEP 4
STEP 5
DATA AND METRICS
OPERATIONAL PLAN
INTERVENTIONS
EVALUATION & REFINEMENTS

4/2/2014
4
OPERATIONAL PLAN
Step 3
Vision, MissionGoals & Objectives
Marketing/ CommPlan
Budget/TimelinesImplementationPlan / Benefits
Program Evaluations
– Vision and mission statement of wellness program
– Overall goals of benefit design and wellness programs
– Clear, concise, measurable objectives, preferably based on assessment results
– When and how participants will be enrolled
Periodic meetings to assess program progress
Operational Plan Components
– Periodic meetings to assess program progress
– Plan for evaluating progress against goals and objectives including mid term evaluation and mid course corrections if necessary
– Program timeline
– Itemized budget sufficient to implement program
– Date for final report and recommendations for future
Health Care Benefits Design
Health plans should incorporate the following elements:
– Prevention and wellness
– Disease management
Chronic care management– Chronic care management
– Pharmacy benefits with guidance on medication adherence
– Education on appropriate care delivery/patient rights
• Support from ALL levels of management
• Buy‐in from Employees
• Heath Risk Assessments and Appraisals
• Employee buy‐in through surveys
• Establish Wellness Team/Coordinator
Elements of Successful Programs
• Develop program based on interest, needs, appropriate interventions
• Effective use of Incentives
• Measure results and effectiveness
STEP 1
STEP 2
COMPANY ASSESSMENT
DATA ANDMETRICS
ROADMAP FOR IMPLEMENTING WORKPLACE WELLNESS PROGRAMS
STEP 2
STEP 3
STEP 4
STEP 5
DATA AND METRICS
OPERATIONAL PLAN
INTERVENTIONS
EVALUATION & REFINEMENTS
INTERVENTIONS
Step 4
PrimordialPrevention
PrimaryPrevention
Secondary Prevention
Tertiary Prevention

4/2/2014
5
LEVELS OF PREVENTION
• Primordial – Smoke Free– Exercise Supported – Healthy food options
• Primary– Lifestyle Change– Immunizations– Seat Belts
• Secondary– Compliance with guidelines– Screenings
• Tertiary– Compliance with Care– Disease Management
• Matching the needs
Lif t l
Environment 19%
Health Services 10%
Health Behaviors: The Main Mortality Risk Factors in U.S.
Lifestyle
Personal Health Behaviors are the main Causes of Death
Lifestyle 51%
Heredity 20%
Heredity
Environment
Health Services
Mokdad AH, et.al. Actual Causes of death in the United States, 2000. JAMA. 2004; 291:1238-1245.
Health & Health & ProductivityProductivity
BUILDING A CULTURE OF HEALTHHealth Advocate• Provide Direction• Get the Care You Need• Coaching & Outreach Health Plan Design
Environmental DesignBehavioral Health•Work/Family•Work Life Plus
Health Portal•Stay healthy•Health information•Make informed choices
Disease Management•High Acuity (identified high cost disease)•Low Acuity (identified lower cost disease; lifestyle behavior focus)
ProductivityProductivity
Occupational Health•Medical Surveillance •Illness And Injury Management
Health Risk Assessment • Assess and track health behaviors• Maintain health• Address health risks
Fitness Centers•Low risk maintenance•High risk reduction
Wellness Programs•Active expansion•Retiree communications/awareness program
Case Management
• STD, LTD•Workers’ Compensation• Scattered Absence
Absence Management
STEP 1
STEP 2
COMPANY ASSESSMENT
DATA ANDMETRICS
ROADMAP FOR IMPLEMENTING WORKPLACE WELLNESS PROGRAMS
STEP 2
STEP 3
STEP 4
STEP 5
DATA AND METRICS
OPERATIONAL PLAN
INTERVENTIONS
EVALUATION & REFINEMENTS
EVALUATION & REFINEMENTS
Step 5
Analysis of allevaluations
Participant Survey Results
ROI/VOI Recommendations
PERFORMANCE MEASURES: CRITICAL STEPS TO SUCCESS
30

4/2/2014
6
MANAGEMENT : TRACKING PERFORMANCE
31
A ROADMAP FOR IMPROVING THE HEALTH OF YOUR EMPLOYEES AND YOUR ORGANIZATION
Search for Employer Health Asset Management Roadmap
STEP 1: DEVELOP AND EMBRACE A CULTURE OF HEALTH
• Consider establishing a corporate wellness advisory board
“Investment in health delivery is consistent with a long‐term view of maximizing return on human capital.”Michael Critelli—CEO,
• Integrate within the existing corporate culture
– Credo
– Principles
– Corporate Mission
– Corporate Vision
Michael Critelli CEO, Pitney‐Bowes
“Our profit potential is inextricably linked to the capability and performance of our employees.”Andrew Liveris—President and CEO, The Dow Chemical Company
33
STEP 2: SECURE SENIOR MANAGEMENT COMMITMENT AND PARTICIPATION
• Senior Leadership sets the tone
– Committed in good economic times and bad
• What senior leaders DO in is far more important than what they SAY
– Must “walk the talk”
• Senior Leadership must communicate importance of a healthy workforce & support strategies & initiatives
– Sponsorship of key initiatives
– Facilitates employee & management buy‐in 34
STEP 3: ADDRESS WORKPLACE POLICIES AND THE WORK ENVIRONMENT
• Workplace Policies: written & disseminated in coordination with facilities management
• Work Environment: Promote healthy behaviors– First step: Focus on job safety, ergonomics
– Next step: Non‐smoking environment thenNext step: Non‐smoking environment, then
• Healthy eating –cafeteria “teachable moment”
• Physical activity at work
• Marketing plan drives communications– Branding
– Multimedia
35
Ultimate Goal: Employees will view health as a priority on a par with other organizational values
STEP 4: USE DIAGNOSTICS, INFORMATICS AND METRICS TO EVALUATE PROGRAM
• Population health management involves:
– Data
– Demographics
• Data collection and analysis crucial:
– Allows baseline measurement of the problem
– Behaviors
– Illness Burden
– Allows measurement of progress
– Provides information to facilitate necessary behavior changes
– Risk stratify employees (i.e. high/acute risk, chronic risk, moderate risk, low risk)
• Tailor prevention & intervention programs for specific employee populations
• Future offers “personalization” – implication to engagement and compliance

4/2/2014
7
A CULTURE OF HEALTH: COMPREHENSIVE IMPLEMENTATION REQUIRES INTEGRATED DATA
WAREHOUSE & ANALYTICS
Business DataHR/Payroll
Business DataCustomer SatisfactionProduction DataQuality DataOperational DataNet IncomeGross RevenueHuman Capital Costs
Lost Time Data
HR/PayrollEmployee DemographicsTime ReportingEmployee SurveysTurnover/Overtime DataPerformance Appraisals
37
Lost TimeData
Medical Data
ProductivityMetricsSUBJECT
WC/Safety Data
Productivity MetricsStaffing/OvertimePer Employee Costs and RevenuesSelf-Reported Presenteeism
WC/Safety DataOSHA, Accident ReportingDrug TestingWC Claims Data
Medical DataGroup HealthPharmacyMental HealthHealth Risk AppraisalsDisease PrevalenceEAP Utilizaiton
Lost Time DataSTDLTDFMLAPTO/Sick Leave
Integrated Data Analysis
STEP 5: SET HEALTH GOALS AND PROGRAM ELEMENTS
• As organizations progress they:
– Broaden their health goals to promote productivity
– Focus on the full spectrum of population health
• treating high‐risk employees
• Put at‐risk employees on the road to better health
• Keep healthy employees healthy!
Seek continual improvement in health outcomes– Seek continual improvement in health outcomes
• Phase 3 organizations:
– Integrate a robust set of program elements– Both the employer and employees take responsibility for meeting health goals
– Have established health committees/teams to support and execute the organization’s health vision
– Use rewards (intrinsic vs. extrinsic) and recognition to increase participation in health improvement programs
GREATER RETURN TO KEEP THE WELL WELL~ 2:1WELLNESS SCORE & MEDICAL COSTS OVER 3 YEARS
YEAR 1
9,452 (34%)
71.8
$7,728
18,347 (66%)
85.9
$3,822
N=27,799
Wellness Score 81.1
Mean Cost $5,150 WELLILL
YEAR 2
YEAR 3
6,285
71.4
$8,801
3,167
82.5
$5,675
2,810
75.6
$7,051
15,537
87
$3691
4,819
70.9
$9,555
1,466
82.6
$6,564
1,131
74.8
$6,812
2,036
83.9
$4,899
1306
74.3
$9,078
1,504
84.1
$6,728
1,742
76
$6,893
13,795
87.6
$3,704
Zero Trends; Dee Edington 2009
39
STEP 6: CREATE A VALUE‐BASED DESIGN PLAN
Classic Examples:
• Out of pocket costs based on value provided by medication or treatment
– No co‐payments for generic “rescue inhalers” for asthmatics
• Provide rewards and recognitions for h lth b h i
• Value Based Design Plan
– Data ‐ understand the risk profile of the covered population
– Design ‐ understand which services have value
– Deliver ‐ communicate the
40
healthy behaviors
– Completing health risk assessments
• Having a non‐smoking status
– Participating in health coaching
– Earn basic, better and best benefit plans
40
Deliver communicate the benefits to employees early and often
– Dividends ‐ evaluate program effectiveness using metrics (evidence‐based)
Leveraging Behavioral Economics & Rewarding Engagement
LEVERAGING BEHAVIORAL ECONOMICS TO IMPROVE ENGAGEMENT
• Use the magic of opt‐out– Make the preferred choice the
default
• Mere measurement– Interventional surveys
• Aversion of lossk l d
• Provide rewards and recognitions for healthy behaviors
– Completing health risk assessments
– Having a non‐smoking status
– Participating in health coaching
• Earn basic better and best– Taking away privileges or rewards
• Value Based Benefit Design– Out of pocket costs based on proven
value provided by medication or treatment
– No co‐payments for generic “rescue inhalers” for asthmatics
• Earn basic, better and best benefit plans
• Mastery– Educate leading to self‐care
– Peer mentoring
• Rank Comparison– Competition
41
EngagementReinforcing Behaviors then OUTCOME
Cash Trinkets Lottery Recognition CompetitionBetter Benefits
Health
42
Moving Rewards From Extrinsic to Intrinsic
4/2/2014
8
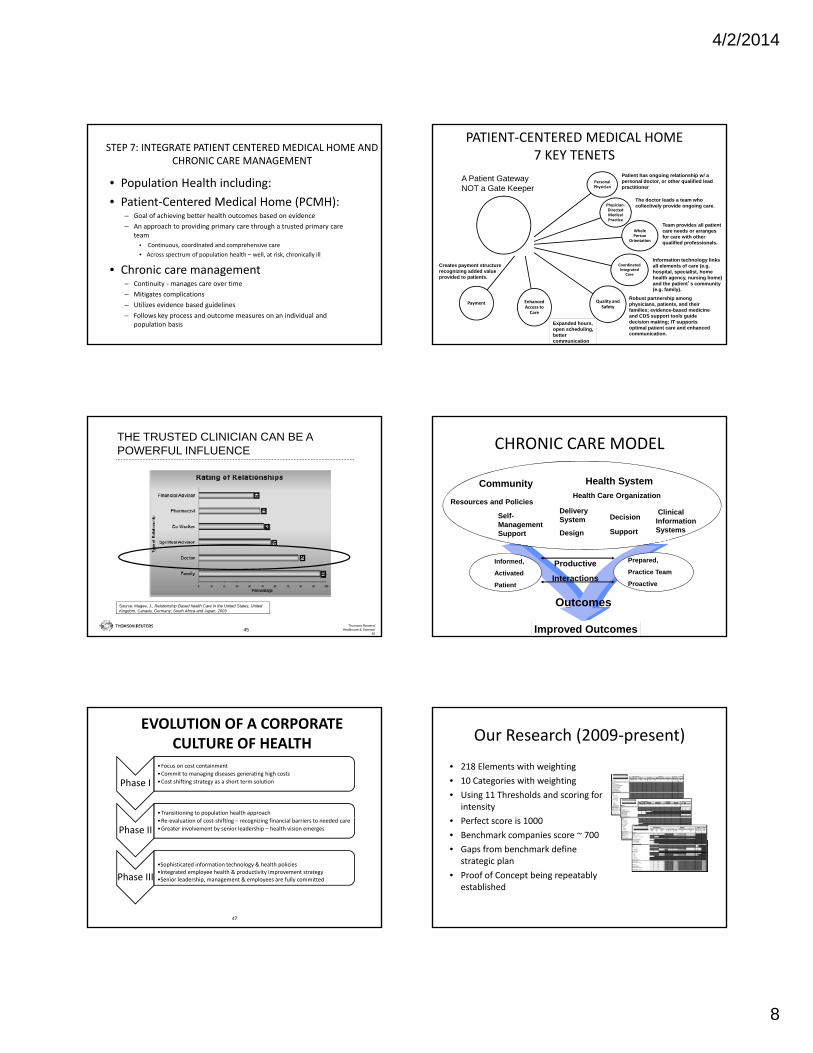
STEP 7: INTEGRATE PATIENT CENTERED MEDICAL HOME AND CHRONIC CARE MANAGEMENT
• Population Health including:
• Patient‐Centered Medical Home (PCMH):– Goal of achieving better health outcomes based on evidence
– An approach to providing primary care through a trusted primary care teamteam
• Continuous, coordinated and comprehensive care
• Across spectrum of population health – well, at risk, chronically ill
• Chronic care management – Continuity ‐manages care over time
– Mitigates complications
– Utilizes evidence based guidelines
– Follows key process and outcome measures on an individual and population basis
Personal Physician
Physician‐Directed Medical Practice
Whole P
PATIENT‐CENTERED MEDICAL HOME 7 KEY TENETS
Patient has ongoing relationship w/ a personal doctor, or other qualified lead practitioner
The doctor leads a team who collectively provide ongoing care.
Team provides all patient care needs or arranges
A Patient GatewayNOT a Gate Keeper
44
Person Orientation
CoordinatedIntegrated
Care
Quality and Safety
Enhanced Access to Care
Payment
for care with other qualified professionals.
Information technology links all elements of care (e.g. hospital, specialist, home health agency, nursing home) and the patient’s community (e.g. family).
Robust partnership among physicians, patients, and their families; evidence-based medicine and CDS support tools guide decision making; IT supports optimal patient care and enhanced communication.
Expanded hours, open scheduling, better communication
Creates payment structure recognizing added value provided to patients.
THE TRUSTED CLINICIAN CAN BE A POWERFUL INFLUENCE
Thomson Reuters/Healthcare & Science/
4545
Source: Magee, J., Relationship Based health Care in the United States, United Kingdom, Canada, Germany, South Africa and Japan. 2003
CHRONIC CARE MODEL
DeliverySystem Decision
ClinicalInformation
Health System
Resources and Policies
Community
Self-Management
Health Care Organization
Productive
Interactions
Outcomes
Informed,
Activated
Patient
Prepared,
Practice Team
Proactive
Design Support SystemsManagement Support
Improved Outcomes
EVOLUTION OF A CORPORATE CULTURE OF HEALTH
Phase I
•Focus on cost containment
•Commit to managing diseases generating high costs
•Cost shifting strategy as a short term solution
•Transitioning to population health approach
47
Phase II •Re‐evaluation of cost‐shifting – recognizing financial barriers to needed care
•Greater involvement by senior leadership – health vision emerges
Phase III
•Sophisticated information technology & health policies•Integrated employee health & productivity improvement strategy •Senior leadership, management & employees are fully committed
Our Research (2009‐present)
• 218 Elements with weighting
• 10 Categories with weighting
• Using 11 Thresholds and scoring for intensity
P f i 1000• Perfect score is 1000
• Benchmark companies score ~ 700
• Gaps from benchmark define strategic plan
• Proof of Concept being repeatably established

4/2/2014
9
Why Do It ?
• It Is Where The Puck Is Going
• Some Companies Have Achieved It
di l S i• Medical Cost Savings
• Improved Workforce Performance
• Reduced Absence & Disability
• Employer of Choice Status
“A good hockey player plays where the puck is. A great hockey player plays where
the puck is going to be”.Wayne Gretzky
Employer HealthcareThe Case For Change
• Decades of unabated health premium increases
– Fueled by avoidable medical costs – wasteful spending – $1 out of every $3
– Resulting in unaffordable health costs and great strain on organization budgets
– Medical benefits eat up approximately 3‐6 % of topline revenue in US organizations
• Avoidable health issues drive unacceptably high levels of
presenteeism & absenteeism
– Significantly reducing workforce efficiency and effectiveness
– Poor performance due to illness costs employers 2 to 3 times more than medical costs
• Continuous medical benefit cost shifting (contribution increases, etc.) and the lack of help given to employees to manage their families’ health needs has resulted in much lower than possible employee appreciation and engagement
• Research however suggests that:
– Though some rebalancing may be initially appropriate for some, this approach to cost containment is unsustainable, and strategically more costly in the long run
– This may in fact accelerate costs in the near future (due to employees delaying or ignoring issues until they become catastrophic; while increasing the “medically homeless”)
– This is just making the “holes in the boat” smaller. It has been proven that cost shifting over the last decade has consumed virtually all of employee compensation gains, leaving family discretionary income lower on an inflation adjusted basis. This has also been correlated with declining employee satisfaction, loyalty and productivity in many cases.
50Proprietary & Confidential
Because Benchmark Employers Have Achieved ItProviding Competitive Advantage
113
121
100
105
110
115
120
125
nu
al
Tre
nd
(2
005
= 1
00)
High Performer Net Cost Trends 2005 - 2010 Adjusted For Consumer Price Index (CPI-U) Inflation
51
Truven Health Analytics Clients: eight employers, with self funded plans, spanning multiple industries who also utilize Thomson Reuters decision support and analytic consulting services. These clients consistently outperformed net pay trend rates for the broader 53 client group each year and cumulatively from 2005 – 2010. As a group, they have consistently made innovative use of healthcare data to support all aspects of population health, productivity and plan management.
MarketScan: a group of over 50 Thomson Reuters clients with 5 million members covered in self funded plans that contributed to MarketScan continuously since 2005.
2010 Mercer National Survey of Employer Sponsored Health Plans: a comprehensive survey of 2,836 US employers. Reflecting the average reported healthcare trend rates across group size, geographic region and industry type.
93
85
90
95
100
2005 2006 2007 2008 2009 2010
Co
mp
ou
nd
An
n
High Performing Clients MarketScan Mercer
Demonstrates a Sustainable Culture of Health
Average Savings 2002‐2008 = $565/employee/yearEstimated ROI: $1.88 ‐ $3.92 to $1.00
Proprietary & Confidential
52
2010 World Congress on Health Presentation
“Since beginning the (IHOA) in 2005, Crownʼs total health care spend has been lower than general inflation by $4 million over the five year span”Ken Wright VP Medical Benefits; Crown Cork & Seal
53Proprietary & Confidential
Health Correlates with PerformanceLampLighter Findings
68
69
70
71
72
73
Sco
re
64
65
66
67
68
Health 72.4 67.5 66.9
Top Performer Middle Performer Bottom Performer
54
Unileverʼs global “LampLighter” program research established a direct correlation between individual LampLighter wellness scores, and employee performance / engagement
Proprietary & Confidential

4/2/2014
10
Personal Health CostsMedical CarePharmaceutical costs
Productivity Costs
The Full Cost of Poor Health to EmployersImpact of poor health on productivity can be 2‐3x total cost
70%
30%
Presenteeism OvertimeTurnover
Temporary StaffingAdministrative Costs
Replacement TrainingOff-Site Travel for Care
Customer DissatisfactionVariable Product Quality
Absenteeism Short-term Disability Long-term Disability
Iceberg of Full Costs from Poor Health
Loeppke, R., et al., "Health and Productivity as a Business Strategy: A Multi‐Employer Study", JOEM.2009; 51(4):411‐428. and Edington DW, Burton WN. Health and Productivity. In McCunney RJ, Editor. A Practical Approach to Occupational and Environmental Medicine. 3rd edition. Philadelphia, PA. Lippincott, Williams and Wilkens; 2003: 40‐152
7
Health & Productivity Why is this important to Coca‐Cola?
Continuum of Employee Performance Outcomes
Not doing work on k i
Not doing wellwhile working
unscheduled breaksunfocused time
health exams on work time
errorscomplaints
delaysteam breakdown
Lost to the workforce
Not at work
work time
permanent disabilityearly retirement due to health issues
premature death spousal illness
unscheduled absencedisability
workersʼ comp
replacement workers
health exams on work timeinformation gathering
56Proprietary & Confidential
Health & Employee Commitment Unilever Lamplighter Program
Health Benefits • 18% increase in the number of employees who
exercised
• 5% drop in the number of employees with high BMI
• 13% drop in the number of employees with high bl d (d f 2 % j 8%)
Engagement Enhancement • The Lancaster study showed that
employees who participated in Lamplighter:
• Felt significantly more engaged with their work
blood pressure…(down from 21% to just 8%)
• 8% drop in the number of employees with high cholesterol
• 5% decrease in the number of employees classed as having poor nutrition
• 8% decrease in the number of smokers. Overall the number of employees classed as ʻhigh health riskʼ dropped by 5%
• Overall the number of employees classed as ʻlow health riskʼ increased by 23%
work
• Were less likely to take time off work due to health problems
• Were able to perform better in their job
• Were less likely to be adversely affected by pressure at work
• Were more likely to practice healthy behaviors at work
Proprietary & ConfidentialAll Rights Reserved
57
Employer of Choice
• Supporting Health & 100 Best Companies to Work For
• Yum Brands – reducing turnover
G ld S h i i d i h• Goldman Sachs – retaining and attraction the best talent
• Return to Investors
Proprietary & ConfidentialAll Rights Reserved
58
Fortune Magazine Identified Workplace Health as a Key Driver of Employee Satisfaction
Comprehensive health and wellness services are
mentioned several times
59
mentioned several times as the reason why a company achieved “Employer of Choice”
status
Yum Brands Reducing Turnover
Proprietary & ConfidentialAll Rights Reserved
60

4/2/2014
11
The Goldman Sachs Wellness ExchangeRetracting and Retaining Talent
• An integrated suite of services designed to support your personal health and well‐being and to help you manage your personal and family responsibilities.
• While specific services may vary by location/region, core offerings generally include: Supporting Your Health and Well‐Being
O it h lth t ith t di l f i l– On‐site health centers with access to medical professional
– On‐site fitness centers or off‐site fitness subsidies
– Referrals to medical professionals
– Patient advocacy and critical health solutions assistance
– Smoking cessation programs
– Travel resources and immunizations
– Ergonomic work station evaluations
– Recreational activities/events (outings, runs/walks, team clubs and leagues)
Proprietary & ConfidentialAll Rights Reserved
61
Return to Investors
• I‐trax (AMX:DMX) Research (2006)
– The Connection of Workplace Health Centers and Market Performance
• Towers Watson Research (2010)• Towers Watson Research (2010)
• Our Most Recent Publication (2013) JOEM – The Link Between Workforce Health and the Bottom Line – Tracking the Market Performance of Companies that Nurture a Culture of Health
• The HealthNEXT Advantage Fund (today)
Proprietary & ConfidentialAll Rights Reserved
62
I‐trax Research (2006)
• Over 200 onsite health clinics; Over 60 employers; 65% of them publicly traded
• Tracked as an investment portfolio; back‐cast to 2003
• For every $1 invested in the DJIA and S&P 500, our (I‐trax) client portfolio yielded at least 2X the growth to their shareholders in less than 3 years
Proprietary &ConfidentialAll Rights Reserved
63
HEALTH MEANS WEALTH HEALTHY EMPLOYEES YIELD WEALTHY EMPLOYERS
towerswatson.com © 2011 Towers Watson. All rights reserved. Proprietary and Confidential. For Towers Watson and Towers Watson client use only. Financial outcomes
ACOEM / HealthNEXT Research (2013)
Marketplace rewards companies who achieve cultures of health:
• Used the ACOEM Corporate Health Achievement Award (CHAA) culture of health award winners as a stock portfolio
65Proprietary & Confidential
All Rights Reserved656565
• A portfolio of approximately twenty publicly traded award winners; over nearly two decades
• Published last month (September) in the JOEM
• Once again the portfolio outperformed the market significantly; in all four test scenarios
HealthNEXT Research (2008 – present)
• Created a stock portfolio based on the key learning from the HealthNEXTEmployer Health Opportunity Assessment (EHOA) scorecard
• Invested $400,000 into the portfolio of approximately 30
25 Points 20 Points 15 Points 10 Points 10 Points 10 Points 10 Points 75% / 25%20 20 15 5 10 10 10 3.60 3.37 3.54225 20 15 5 10 10 10 3.80 2.51 3.47825 10 10 5 10 10 10 3.20 3.35 3.23815 15 15 10 10 10 5 3.20 3.31 3.22820 20 15 5 10 10 10 3.60 3.07 3.46825 5 10 10 5 5 0 2.40 4.00 2.80010 15 15 10 10 10 5 3.00 3.38 3.09610 15 15 10 10 10 10 3.20 3.34 3.23615 15 15 5 10 10 5 3.00 2.57 2.89225 5 5 5 10 10 10 2.80 3.74 3.03415 15 10 10 10 10 10 3.20 2.40 3.00020 15 15 5 10 10 0 3.00 3.39 3.09815 10 10 10 10 10 5 2.80 3.39 2.94815 10 10 5 10 10 10 2.80 3.39 2.94815 10 10 10 10 10 5 2.80 3.07 2.86810 5 15 10 5 10 10 2.60 3.06 2.71615 10 10 5 10 10 5 2.60 3.49 2.82210 20 10 0 10 10 10 2.80 3.20 2.90010 10 15 5 10 10 5 2.60 3.16 2.74010 10 10 5 10 10 10 2.60 3.00 2.70015 15 10 5 5 5 5 2.40 3.58 2.69410 20 5 5 5 5 10 2 40 3 50 2 674
Silver (23%)
Gold (30%)
Health PointsAverage
Weighted Health
Platinum (35%)
Concensus Overall
Weighted
publicly traded companies; using a scoring criteria to weight & unweight the portfolio based on employer score
• Back‐casted to 2001
• Again, this portfolio has consistently outperformed the market by magnitudes; in both good times and bad
Proprietary &ConfidentialAll Rights Reserved
66
10 20 5 5 5 5 10 2.40 3.50 2.67415 5 10 5 10 10 10 2.60 2.85 2.66210 5 5 10 10 10 10 2.40 3.34 2.63610 20 5 0 5 10 10 2.40 2.33 2.38210 5 15 5 5 5 5 2.00 3.33 2.33210 10 10 5 5 5 10 2.20 2.98 2.39615 5 5 10 5 5 0 1.80 3.20 2.15010 5 5 10 10 5 0 1.80 3.17 2.1425 5 10 10 10 5 10 2.20 2.53 2.282
10 0 5 10 5 5 10 1.80 3.13 2.13210 0 5 5 5 5 10 1.60 3.56 2.090
x 10 0 0 10 5 5 10 1.60 3.00 1.950x 5 5 0 10 0 5 5 1.20 2.78 1.596x 10 0 0 10 0 0 0 0.80 3.48 1.470x 10 0 0 10 0 0 0 0.80 2.89 1.322
Bronze (12%)

4/2/2014
12
Research ConclusionA preponderance of evidence; yet lacking clear roadmaps…
until now
“Thoughcorrelationisnotthesameascausation,theresultsconsistentlyandsignificantlysuggestthatcompaniesfocusingonthehealthandsafetyoftheirworkforceareyieldinggreatervaluefortheirinvestorsaswell.Moreresearchneedstobedonetobetterunderstandthevalueofbuildingthese“culturesofhealth” intheworkplace. Perhapssucheffortsasthissimplyidentify“smart” companiesthatout‐perform.Buttheevidenceappearstobebuildingthathealthyworkforcesprovideacompetitiveadvantageinwaysthatbenefittheirinvestors.”
67Proprietary & Confidential
HEALTH MEANS WEALTH
LIFE EXPECTANCY CORELATES WITH INCOME
Life Expectancy Mean Income
Source – Mapping the Measure of America 2010‐2011
68
HEALTH MEANS WEALTH
69
The Research Informs Business Success
A large proportion of illness is preventable by reducing health risks(Healthy People 2000, 2010; Amler & Dull, 1987; Breslow, 1993; McGinnis &
Foege, 1993; Mokdad et al., 2004).
Health risks can be improved through workplace health programs (Loeppke, et al., 2008; Wilson et al., 1996; Heaney & Goetzel, 1997; Pelletier,
1999).
Reductions of health risks can lead to reductions in health costs (Edington et al., 2001; Goetzel et al., 1999)
Healthy Workforce is More Productive & Engaged(Unilever Lamplighter Program 2011)
Companies that Focus on Health & Safety Outperform(Fabius et al 2013)
THE EVOLUTION OF MEDICAL MANAGEMENT
The evaluation of the appropriateness, medical need and efficiency of healthcare services
A system of coordinated healthcare interventions and communications for populations with conditions in
The health outcomes of a group of individuals, including the distribution of such outcomes
Reducing or eliminating health and injury & their risks enhances the performance of a workforce
GAME CHANGER
71
services. with conditions in which patient self-care efforts are significant.
such outcomes within the group.
workforce
UtilizationManagement
DiseaseManagement
PopulationHealth
Health &Productivity
Culture of Health