Services productivity growth in Australia, Europe and US Robert Inklaar Groningen Growth and...
21
Services productivity growth in Australia, Europe and US Robert Inklaar Groningen Growth and Development Centre, University of Groningen and The Conference Board with Bart van Ark and Marcel Timmer
-
date post
20-Dec-2015 -
Category
Documents
-
view
213 -
download
0
Transcript of Services productivity growth in Australia, Europe and US Robert Inklaar Groningen Growth and...

Services productivity growth in Australia, Europe and US
Robert InklaarGroningen Growth and Development Centre,
University of Groningen andThe Conference Board
with Bart van Ark and Marcel Timmer

Background: analysis
Different growth pattern since 1995 US, Australia faster GDP growth Europe has slowed down
Mainly diverging productivity growth But where is it coming from?
Need industry data Productivity growth and levels Investment in new technology (ICT)

Background: data
Results based on preliminary version of EUKLEMS database
Full industry productivity database; growth & levels; 1970-2004; 30-70 industries; Europe, US, and others
Big EU-funded project 15 institutions, GGDC leading
15 March 2007 first public release See www.euklems.net for details Australia will be added later
Current results prepared for Economic Policy

Main findings
Productivity growth accelerated after 1995 in Anglo-Saxon countries
Market services main source of strength Growth in Europe slowed down, in
particular in services ICT investment & complementary
intangibles explain part Competition and regulation further
candidates

Surge in services productivity growth main post-1995 story
Industry contributions to market economy labour productivity growth, 1987-2004
-0.5
0.0
0.5
1.0
1.5
2.0
2.5
3.0
3.5
1987-1995 1995-2004 1987-1995 1995-2004 1987-1995 1995-2003
US EU-11 Australia
ICT production Goods-producing industries Market services Reallocation of hours

First suspect: ICT investment
Perform industry growth accounting exercise:
Aqvkvkvy LN
KI
K NI
Labour productivity growth
ICT capital deepening
Non-ICT capital deepening
TFP growth
Labour composition change

Labour productivity growth and the contribution of ICT capital in market services, 1995-2004
-1.0 -0.5 0.0 0.5 1.0 1.5 2.0 2.5 3.0
ESPITA
GERDNKFRAAUTBELNLDSWE
FINUK
EU11US
AUS
ICT contribution Other labour productivity
ICT is part of the story

But ICT may be more important
General purpose technology => complementary investments
For ICT mostly intangible, time-consuming mismeasured in National Accounts?
Firm research & case studies find support So far less from industry-level
Follow method of Brynjolfsson & Hitt (2003, REStat)

Main idea: increase time horizon
11,1, ttIK
tt KvA I
1010,10, ttIK
tt KvA I

Long-term effect of ICT is twice as large as short-term effect
Productive effect of ICT relative to user cost of ICT capital, 1-year to 10-year time horizon
-0.2
0.0
0.2
0.4
0.6
0.8
1.0
1.2
1.4
1 2 3 4 5 6 7 8 9 10
95% Lower bound Point estimate 95% Upper bound

Robustness checks (1)
Works only for relatively measured industries Excludes finance, business services
Other production function specifications (more general) Show even higher returns (even short-term
excess returns) All show upward trend in coefficients All show excess returns in the long-run
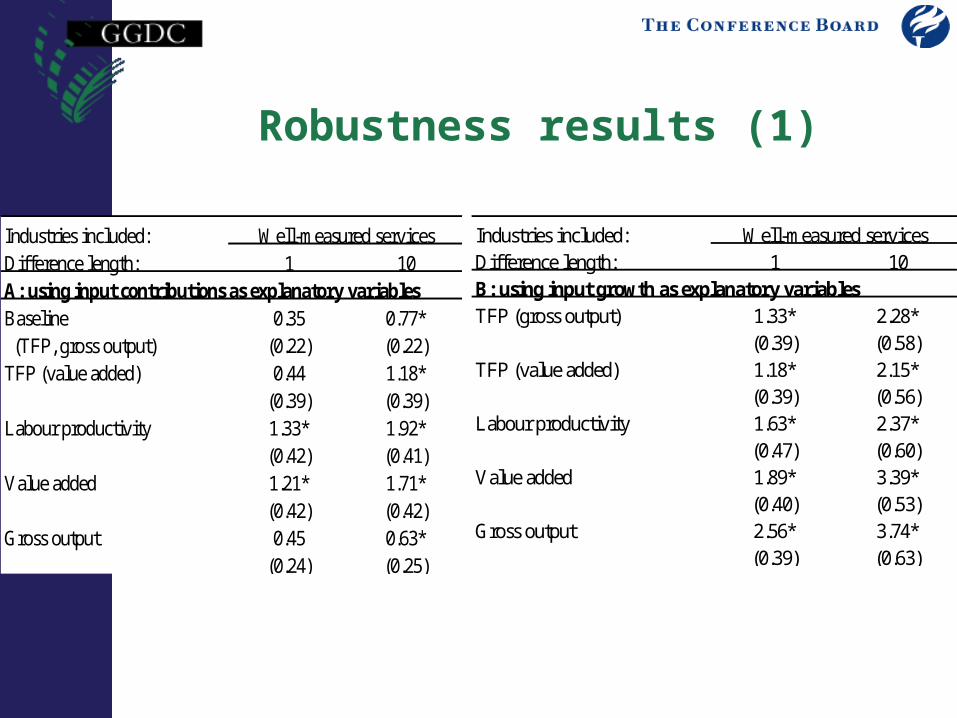
Industries included:Difference length: 1 10A: using input contributions as explanatory variablesBaseline 0.35 0.77* (TFP, gross output) (0.22) (0.22)TFP (value added) 0.44 1.18*
(0.39) (0.39)Labour productivity 1.33* 1.92*
(0.42) (0.41)Value added 1.21* 1.71*
(0.42) (0.42)Gross output 0.45 0.63*
(0.24) (0.25)
Well-measured services Industries included:Difference length: 1 10B: using input growth as explanatory variablesTFP (gross output) 1.33* 2.28*
(0.39) (0.58)TFP (value added) 1.18* 2.15*
(0.39) (0.56)Labour productivity 1.63* 2.37*
(0.47) (0.60)Value added 1.89* 3.39*
(0.40) (0.53)Gross output 2.56* 3.74*
(0.39) (0.63)
Well-measured services
Robustness results (1)
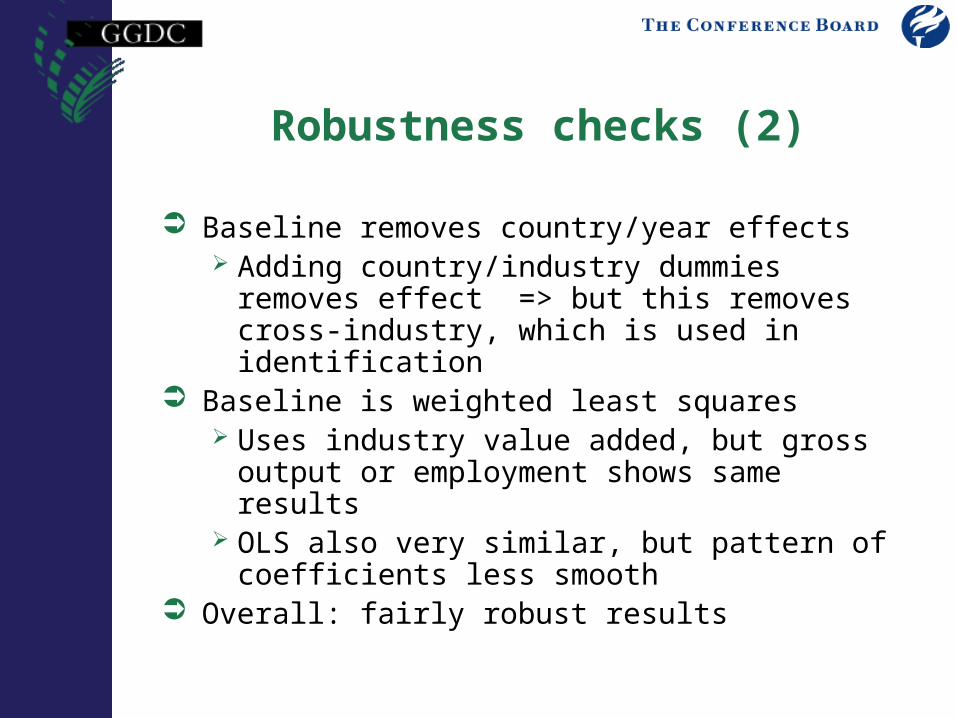
Robustness checks (2)
Baseline removes country/year effects Adding country/industry dummies removes
effect => but this removes cross-industry, which is used in identification
Baseline is weighted least squares Uses industry value added, but gross
output or employment shows same results OLS also very similar, but pattern of
coefficients less smooth Overall: fairly robust results

Robustness results (2)Industries included:Difference length: 1 10Panel A: country, industry and year controlsBaseline 0.35 0.77* (WLS, value added weights, country/year dummies) (0.22) (0.22)WLS, country dummies -0.22 0.28
(0.23) (0.29)WLS, country/industry dummies -0.84* -1.01*
(0.32) (0.30)WLS, country/industry/year dummies -1.32* -1.71*
(0.36) (0.36)Panel B: weightingOLS, country/year dummies 0.32 0.77*
(0.18) (0.18)WLS, hours weights, country/year dummies 0.40 1.00*
(0.30) (0.23)WLS, gross output weights, country/year dummies 0.46 0.88*
(0.24) (0.26)
Well-measured industries
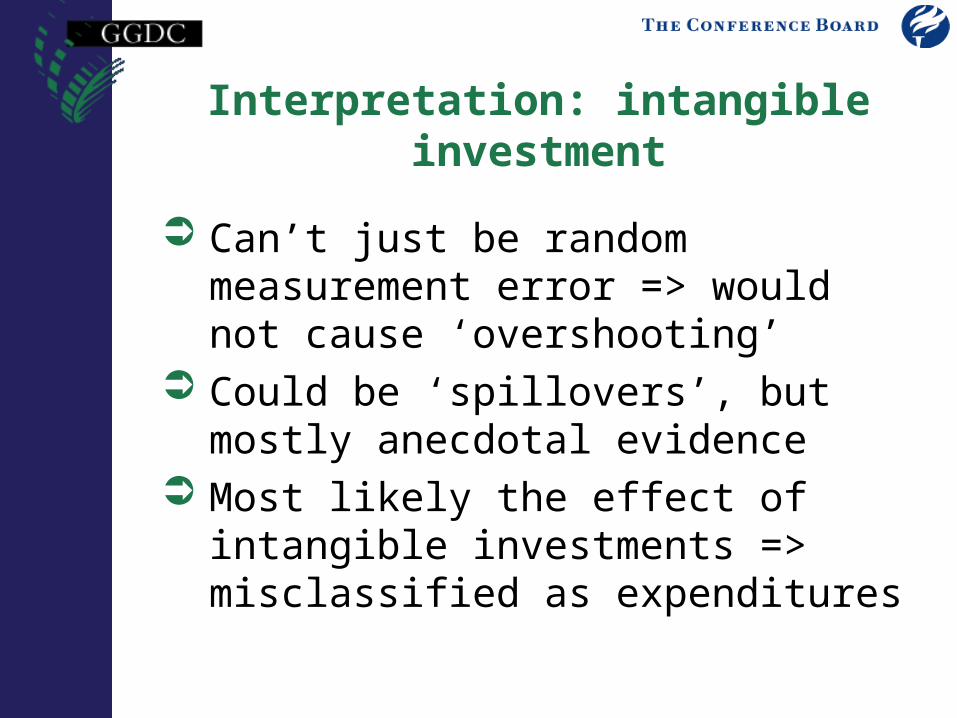
Interpretation: intangible investment
Can’t just be random measurement error => would not cause ‘overshooting’
Could be ‘spillovers’, but mostly anecdotal evidence
Most likely the effect of intangible investments => misclassified as expenditures
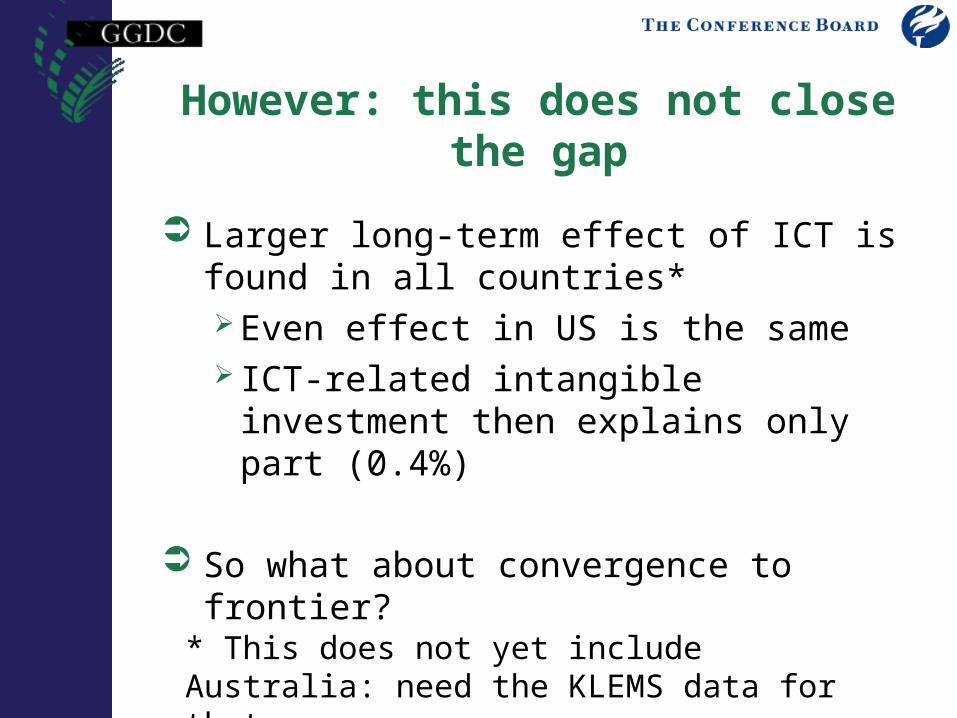
However: this does not close the gap
Larger long-term effect of ICT is found in all countries* Even effect in US is the same ICT-related intangible investment
then explains only part (0.4%)
So what about convergence to frontier?
* This does not yet include Australia: need the KLEMS data for that

Convergence in only the minority of countries for total services
TFP level in market services in 1995 and 2004, US=100
60
70
80
90
100
110
120
DNK BEL NLD AUS FIN GBR AUT SWE ITA ESP FRA GER
1995 2004
Convergence
Divergence

But convergence is an industry story
Figure 9, Number of market services industries where productivity was at the frontier or converged to the frontier between 1995 and 2004
0
1
2
3
4
5
6
7
8
9
FIN US UK NLD SWE AUT DNK DEU BEL FRA ESP ITA

So what does this mean?
Convergence is happening, even in services But not everywhere
Nicoletti & Scarpetta (’03): convergence depends on regulation Confirmed here: more regulation =>
less convergence (correlation -0.6)
Competition is key (probably)
Regulation story is complex Regulatory burden can be very
industry-specific (retail case study) Competition is about more than
regulation e.g. need robust competition authority
But still the most plausible explanation for productivity growth differences

Erwin’s Enquiries
Does not include land and inventories Uses an internal rate of return Assumes equal av. wage of self-
employed as employees Has a zero floor of user cost and capital
share