Service Managing Inventory 2021
17
1 Managing Service Inventory • Reasons to Hold Inventory • Inventory Models • News Vendor Problem • ABC Classification Shin‐Ming Guo NKUST Who Cares About a Surplus? 2 In Taiwan, convenience stores and supermarkets reportedly throw away 36,000 tons of food every year. The loss is at least 3.8 billion NT dollars. In North America, the loss from overstocks in the region is estimated to cost retailers $123.4 billion annually
Transcript of Service Managing Inventory 2021

1
Managing Service Inventory
• Reasons to Hold Inventory
• Inventory Models
• News Vendor Problem
• ABC Classification
Shin‐Ming GuoNKUST
Who Cares About a Surplus?
2
In Taiwan, convenience stores and supermarkets reportedly throw away 36,000 tons of food every year. The loss is at least 3.8 billion NT dollars.
In North America, the loss from overstocks in the region is estimated to cost retailers $123.4 billion annually

2
What About a Shortage?
3
In 2006, Nintendo launched the Wii game console and could not make enough units to keep up with the demand. Some people would wait in long lines to purchase scarce units and resell them online for several hundred dollars over the retail price
What is Inventory Management?The planning and controlling of inventories to meet the competitive priorities of the organization.
What is Inventory?A stock of materials used to satisfy customer demand or to support the production of services or goods.
Manufacturing Inventoryraw materials, WIP, maintenance and repairs, supplies, FGI
Retail Inventorymerchandise, supplies, goods in transit (pipeline inventory)
4

3
Flow of Inventory
5
Reasons to Hold Inventory
• In‐transit Inventory
• Decoupling Inventory/Buffers
• Cycle Inventory
• Seasonal Inventory
• Safety Inventory
• Speculative Inventory
6

4
Reasons to Hold Less Inventory
• Inventory might become obsolete.
• Inventory might perish.
• Inventory might be stolen.
• Inventory requires storage space and other overhead cost.
• Opportunity cost.
7
Costs of Inventory Control
8
Holding or Carrying cost order too much or too earlystorage cost: facility, handlingrisk cost: depreciation, pilferage, insuranceopportunity cost
Ordering cost order too little or too oftencost placing an order: preparing, negotiating, receiving and inspection
Shortage costs or Lost Sales order too little or too latecosts of canceling an order or penalty
Annual cost ≈ 20% to 40% of the inventory’s worth

5
Inventory Value vs. Holding Cost
average unit cost P
average inventory value = avg. inventory P(units cost per units)
annual holding cost H=% of the unit cost (dollars per unit per year)
Total Holding Cost=average inventory H number of years
Inventory Performance
10
Inventory Cost (inventory on hand + in transit inventory)
Inventory turn =
Service level = in‐stock probability before the replenishment order arrives
Fill rate =
Cost of Goods Sold___________________average inventory value
number of demands
number of sales_________________
Video: What Is Inventory Management

6
Inventory Control Decisions
11
Periodic ReviewFixed Order Period
Continuous ReviewFixed Order Quantity
When to order? Reorder point, order frequency
How many to order? Order quantity, target inventory level
Continuous Review System: Variable Demand
Time
On-
hand
inve
ntor
y
TBO1 TBO2 TBO3
L1 L2 L3
R
Q
Orderplaced
Orderplaced
Orderreceived
IP IP
Q
Orderplaced
QOrderreceived
Orderreceived
0
IP
12
Place a new order whenever the inventory position (on hand + on order ‐ backorder) drops to ROP (reorder point).
7
Q Model Example
Day Demand OH On Order BO Inventory Position Q
1 400
2
3
4
5
6
7
8
400 + 0 = 400
340 + 0 = 340
250 after ordering260 < R before ordering
60
80
40
75
55
95
260+250 after ordering260
220
145
90
0
340
250 availableDay 8
250
250
250
220 + 250 = 470
145 + 250 = 395
90 + 250 = 340
250+ 250 = 500after ordering
0+250–5=245 before ordering
245 + 250 after ordering
250 availableDay 12
5
ROP=300, Q=250, L=4 days
50 250‐50‐5 =195
250 195 + 250 = 445
13
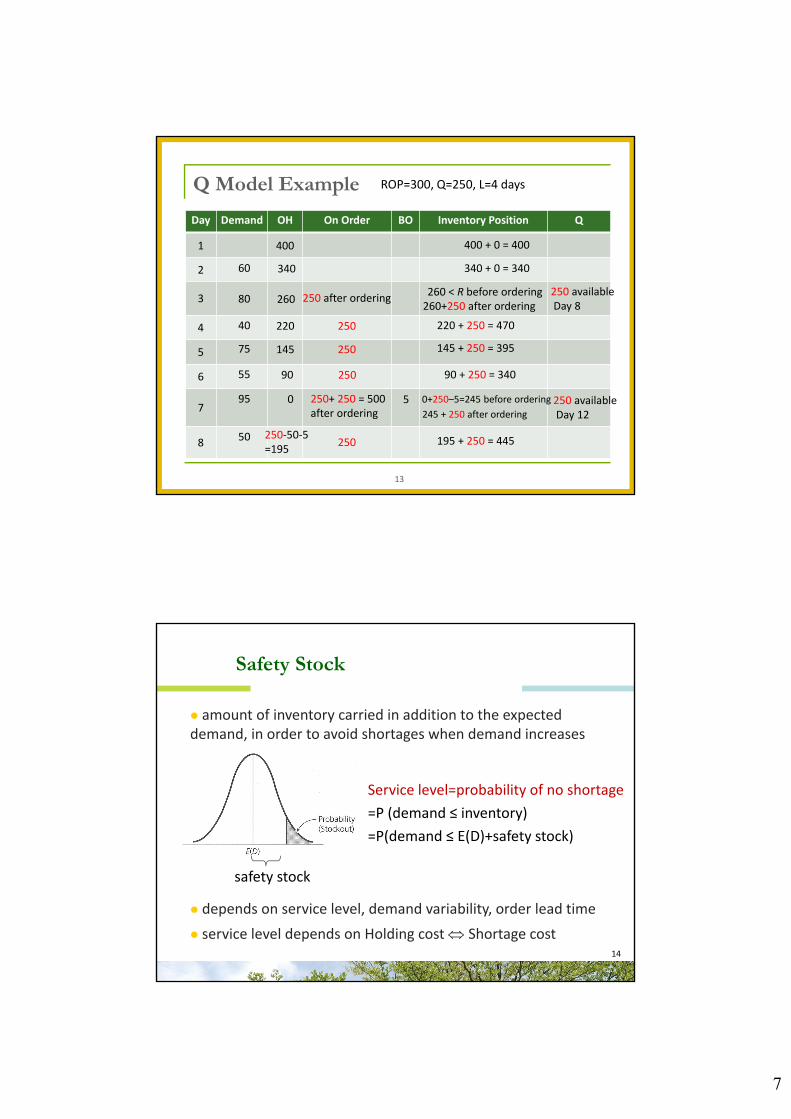
amount of inventory carried in addition to the expected demand, in order to avoid shortages when demand increases
Safety Stock
14
safety stock
Service level=probability of no shortage
=P (demand ≤ inventory)
=P(demand ≤ E(D)+safety stock)
depends on service level, demand variability, order lead time
service level depends on Holding cost Shortage cost

8
15
=daily demand
=std dev. of daily demand
LzL
LROP
stocksafety duringdemandexpected
Service level or probability of no shortage =95% (99%) z=1.64 (2.33)
Q EOQ
Periodic Review System
P P
Target
L L L
Protection interval
Time
On-
hand
inve
ntor
y
IP3
IP1
IP2
Orderplaced
Orderplaced
Orderreceived
Orderreceived
Orderreceived
IP
OHQ1
Q2
Q3
Orderplaced
16
Place an order at fixed time points and bring inventory position (on hand + on order ‐Backorder) up to Target Inventory Level.

9
P Model ExampleDay Demand OH On Order BO Inventory Position Q
1
2
3
4
5
6
7
8
400
340 before ordering
280 260 + 280 = 540
60
80
40
75
55
95
260
220
145
90+280–95=275
90
340 620 – 340 = 280 available Day 7
280
280
280
220 + 280 = 500
145 + 280 = 425
90 + 280 = 370
400
280 after ordering 340+280=620 after ordering
275 + 0 = 275
620–225=395 available Day 13
225395 after ordering
225 before ordering225+395=620 after ordering
50
Target = 620, P = 6 days, L = 4 days
17
18
Review Period
Order Quantity = target inventory –inventory position
LPzLP )(
Target Inventory = expected demand + safety stock
𝑃𝐸𝑂𝑄
�̅�

10
Quantity Discounts vs. Planned Shortage
• Suppliers offer a price discount to customers who buy in large quantities to obtain the savings in manufacturing cost, inventory holding cost, or transportation cost.
• Price discount vs. holding a large‐than‐desired quantity.
• What if customers are willing to tolerate stockouts?
• Reduce safety stock or target inventory level to save holding costs.
Surplus Stocks
• There are various reasons for surplus stocks.
Over ordering, obsolescence, fall in demand, inaccurate stock records, stocks being retuned
• Solutions
Retention with reduction of any further orders.
Offer discount to other users .
Sale as scrap or for recycling.
Disposal as waste.

11
Single Period Inventory Decision
• Only one production or procurement opportunity.
• Stochastic demand leads to lost sales or leftover.
• Order too little: losses of profit and goodwill for each unsatisfied customer.
21
Order too much: low salvage value for each unit of leftover.
Forecasting helps balancing cost of ordering too much vs. cost of ordering too little.
Case : Order Management at Sport Obermeyer
Klaus Obermeyer founded Obermeyer in 1947, when he was among the first ski instructors on Aspen Mountain.
Customer service, marketing, design & research, accounting in Colorado Rockies.
Contract manufacturers in Hong Kong and China.
Long lead time, short sales period
Increasing product variety, more marked downs

12
Forecasting and Ordering at Sport Obermeyer
• Demands depend on weather, fashion trend, economy.
• Forecasts based on Panel Consensus.
• Dominant members have stronger influence on the outcome of a consensus forecast.
• Independent forecasts can provide an indicator of the forecast accuracy for each style.
23
Working with Customers to Improve Forecasts
• Obermeyer invites key customers to place early orders (20% of total sales) to get market information.
• Forecasts are updated based on those early orders.
24

13
Order Planning at Sport Obermeyer
Early bird orders
Panel forecasts
Phase 1min. orders
Revised forecasts
Phase 2revised orders
1st shipment
Summerextra orders and expensive styles
2nd shipment
Selling season
Effective Inventory Management
A system to keep track of inventory on hand and on order. periodic counting, perpetual counting.
A reliable forecast of demand.
Knowledge of lead times and lead time variability.
Reasonable estimates of inventory costs.
holding costs, ordering costs, shortage costs.
A classification system for inventory items.

14
Barcode Scanning
A barcode consists of a series of vertical bars of varying widths that represent letters, numbers and other symbols. Barcodes are used to identify products, locations in the warehouse, containers (totes, cartons, pallets), serial and batch numbers.
EAN‐13
Radio Frequency IDentification
• RFID is a means of uniquely identifying an item using radio waves. Data is exchanged between tags and readers and depending on the frequency, may or may not require line of sight. Many opportunities exist for RFID applications in services, such as medical bracelets for patients in hospitals.
https://www.youtube.com/watch?v=gEQJxNDSKAE
https://www.youtube.com/watch?v=eob532iEpqk

15
Hospitals and Inventory Management
Control• Barcodes and computers keep track of
every bottle of antibiotics and other supplies.
• Secure supply cabinets with thumbprint security technology
29
Management Analyze how much is spent on every type of illness and
surgical procedure. Computers keep track of stock and automatically reorder
from suppliers
ABC Classification
30
dollar usage=usage × cost
There are other ways to do ABC classification. Review ABC classification periodically.
Pareto’s 80/20 principle

16
ABC Classification for Inventory Control
31
A Q model
B P model with R=1 week
C P model with R=1 month
Long Tail Effects
• A retailing concept describing the niche strategy of selling small volumes of hard‐to‐find items to many customers instead of only selling large volumes of popular items.
• A streaming music service currently offers more than 735,000 tracks. Once you dig below the top 40,000 tracks, you cannot find inventory in most real‐world record stores. However, not only is every one of its top 100,000 tracks streamed at least once each month, the same is true for its top 400,000.
• The market that lies outside the reach of the physical retailer is big and getting bigger.
32

17
Summary
• Good inventory management is characterized by concern for holding costs, ordering costs, shortage costs, and the purchase price.
• Consider lead time for replenishment and the appropriate service level.
• Keeping track of inventory using information technology is common practice.