Service improvement using the power of data for decision … · · 2018-01-04Service improvement...
41
Service improvement – using the power of data for decision-making NHS NSS:ISD HSCBN Conference 29 November 2017
Transcript of Service improvement using the power of data for decision … · · 2018-01-04Service improvement...

Service improvement –
using the power of data
for decision-making
NHS NSS:ISD
HSCBN Conference
29 November 2017

Taster examples of current ISD work (40 mins):
1 ‘Source’ Social Care data
Pete Knight [email protected]
2 Ministerial Strategic Group improvement data
Alistair Smith [email protected]
3 a local ISD/LIST Primary Care project
Paul Carroll [email protected]
4 a local ISD/LIST HSCP project
Jenny Boyd [email protected]

Group discussion / feedback (25 mins):
1. how do ISD/others better share work from across
Scotland?
2. what new questions should we attempting to answer
(including from new data)?
3. how can we individually further use data, to help
service improvement?

websites – e.g. ISD and ScotPHO

Partnership X

Holding slide for Pete Knight

Alistair SmithPrincipal Information Analyst
Ministerial
Strategic Group
(MSG) Indicators
and ImprovementLocal
Intelligence
Support
Team

Ministerial Strategic Group for Health and Community Care
(MSG) Indicators
• Background to the indicators
• Guidance on producing and sharing local objectives
• How ISD and LIST can help
• Monitoring Performance
• Examples
This presentation

Initial Request
• Letter on 19th January – ‘Measuring Performance Under
Integration’
• 32 indicators; 6 High Level
• Objectives for each partnership were provided to the
MSG
• Trajectories and projections for these sent to ISD
• Returns to ISD/MSG were by end of February – under 6
weeks
• These were to be monitored regularly – quarterly reports
to the MSG
• Feedback on the initial ask sought – event in June
• Taken on board and a data working group set up
Background

Letter on 22nd November
Simplified returns and opportunity to contextualise
objectives
• Updated objectives to ISD for 2018/19 by end of
January 2018
• ISD will use these to produce trajectories
• Figures need to be put into context; different areas will
have different issues and priorities
• Partnerships will have the opportunity to present at MSG
meetings
• Other indictors will be included in the future (social care)
Update

Objectives should be returned for each of the following
indicators:
1. Number of emergency admissions into Acute specialties
2. Number of unscheduled hospital bed days, with separate
objectives for Acute, Geriatric Long Stay and Mental Health
specialties
3. Number of A&E attendances and the percentage of
patients seen within 4 hours
4. Number of delayed discharge bed days
5. Percentage of last 6 months of life spent in the community
6. Percentage of population residing in non-hospital setting
for all adults and 75+
Indicators for
Objectives

<insert
Partnership
name>
Unplanned
admissions
Unplanned bed
days
A&E attendances Delayed
discharge bed
days
Last 6 months of
life
Balance of Care
Baseline
Objective
How will it be
achieved
Progress
(updated by ISD)
Notes
MSG Improvement Objectives – summary of objectives for Adults and Children
Template

Information required in each section of the template
• Baseline
• Summary of recent trends
• Baseline suggested as 2015/16
• Objective
• Expected Change
• The baseline period this change is based on
• Expected figure for 2018/19
• How will it be achieved
• Progress – provided by ISD/LIST
• Notes
• Local context to the objectives
• Nuances of local data
• Data completeness issues
Expectations

Partnership A Unplanned admissions Unplanned bed days A&E attendances Delayed discharge bed days Last 6 months of life Balance of Care
Baseline 2016/17 change: 1% decrease
in overall total compared to
2015/16
2016/17 change: 2% decrease
in overall total compared to
2015/16
2016/17 change: 2% increase
in overall total compared to
2015/16
H&SC reasons: 5% increase in
2016/17 compared to 2015/16
Patient/Carer/Family-related:
3% increase in 2016/17
compared to 2015/16
Code 9 reasons: 2% increase in
2016/17 compared to 2015/16
2016/17 change: Percentage
of time spent in community in
L6M increased from 86.1% in
2015/16 to 87.2% in 2016/17.
Proportion of people (all ages)
living at home has gradually
increased from 97.8% in
2013/14 to 99.1% in 2015/16.
For the same time period for
75+, there has been an
increase from 83.8% to 85.6%
Objective 2017/18 change: 4% reduction
in overall total compared to
2015/16
Expected 2017/18 total:
16,320 admissions
2018/19 change: 7% reduction
in overall total compared to
2015/16
Expected 2018/19 total:
15,810 admissions
2017/18 acute change: 6%
reduction in acute total
compared to 2015/16
Expected 2017/18 acute total:
291,400 bed days
2018/19 acute change: 10%
reduction in acute total
compared to 2015/16
Expected 2018/19 acute total:
279,000 bed days
Maintain number of bed days
seen in GLS and Mental Health
specialties in 2015/16 during
2017/18 and 2018/19
Expected 2017/18 GLS total:
8,000 bed days
Expected 2018/19 GLS total:
8,000 bed days
Expected 2017/18 Mental
Health total: 52,000 bed days
Expected 2018/19 Mental
Health total: 52,000 bed days
2017/18 change: 4.5%
reduction in overall total
compared to 2015/16
Expected 2017/18 total:
31,990 attendances
2018/19 change: 6.5%
reduction in overall total
compared to 2015/16
Expected 2018/19 total:
30,980 attendances
Maintain average A&E % seen
within 4 hours (95.3%) in
2015/16 during 2017/18 and
2018/19
All reasons, 2017/18: 10%
reduction in total compared
to 2015/16
Expected 2017/18 total:
85,500 bed days
All reasons, 2018/19: 17%
reduction in total compared to
2015/16
Expected 2018/19 total:
78,850 bed days
Increase percentage of time
spent in community in L6M to
89.5% by 2018/19.
Expect to maintain 2015/16
proportion of people living at
home until 2018/19.
How will it be achieved Falls prevention, Care and
Repair, Home Safe Initiative
Progress
(updated by ISD)
April to September 2017
update: 3% reduction in
overall total compared to
same period in 2015/16
April to September 2017
update: 6% reduction in acute
total compared to same
period in 2015/16
GLS and Mental Health figures
similar to same quarter in
2015/16.
April to September 2017
update: 5% reduction in
overall total compared to
same period in 2015/16.
Average A&E % seen within 4
hours similar to same quarter
in 2015/16.
April to September 2017
update: 12% reduction in all
delayed bed days, compared
to same period in 2015/16
Information presented
annually – update will be
included once data for this
period becomes available.
Information presented
annually – update will be
included once data for this
period becomes available.
Notes Ward attenders included
within admissions
Step-up and step-down beds
included within figures. See
section 2.1 for details.
MSG Improvement Objectives – summary of objectives for Adults and Children
Completed

Partnership A Unplanned admissions
Baseline 2016/17 change: 1% decrease in overall
total compared to 2015/16
Objective 2017/18 change: 4% reduction in overall
total compared to 2015/16
Expected 2017/18 total: 16,320 admissions
2018/19 change: 7% reduction in overall
total compared to 2015/16
Expected 2018/19 total: 15,810 admissions
How will it be achieved Falls prevention, Care and Repair, Home
Safe Initiative
Progress
(updated by ISD)
April to September 2017 update: 3%
reduction in overall total compared to
same period in 2015/16
Notes Ward attenders included within admissions
MSG Improvement Objectives – summary of objectives for Adults and Children
Example – Unplanned Admissions
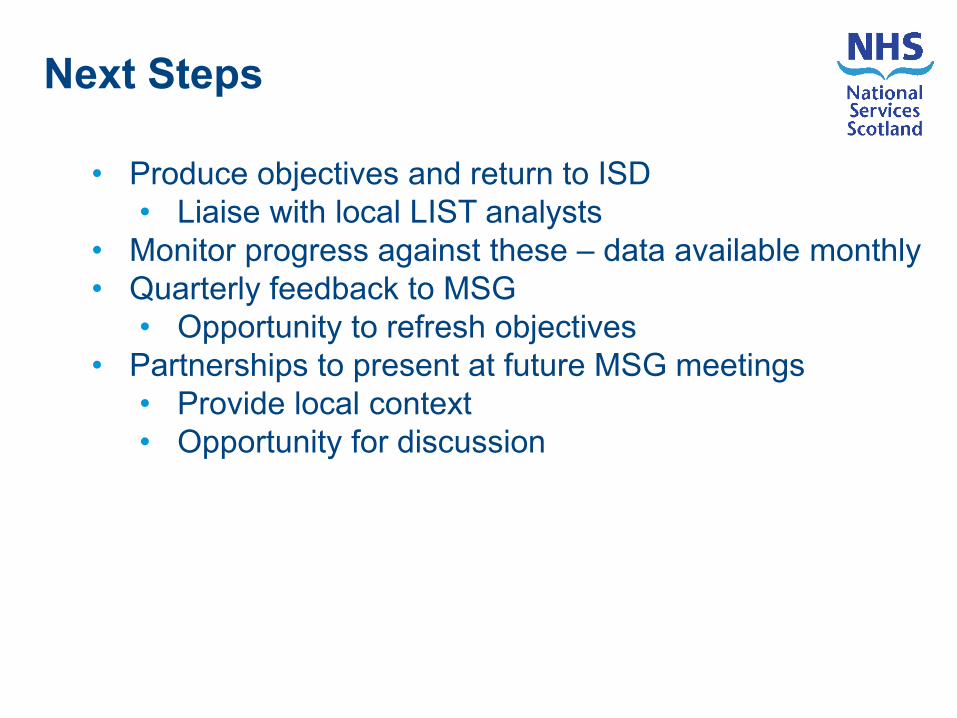
• Produce objectives and return to ISD
• Liaise with local LIST analysts
• Monitor progress against these – data available monthly
• Quarterly feedback to MSG
• Opportunity to refresh objectives
• Partnerships to present at future MSG meetings
• Provide local context
• Opportunity for discussion
Next Steps

Monitoring Progress

Alistair SmithPrincipal Information Analyst
Local
Intelligence
Support
Team

LIST
Inverclyde
New Ways
Primary Care

Background and overview
• Tests of change
• Advanced nurse practitioner
• Advanced practice physiotherapist as first point of
contact for MSK conditions
• Specialist paramedic
• Culture change
• Prescribing support pharmacists
• Week of care audit
New Ways
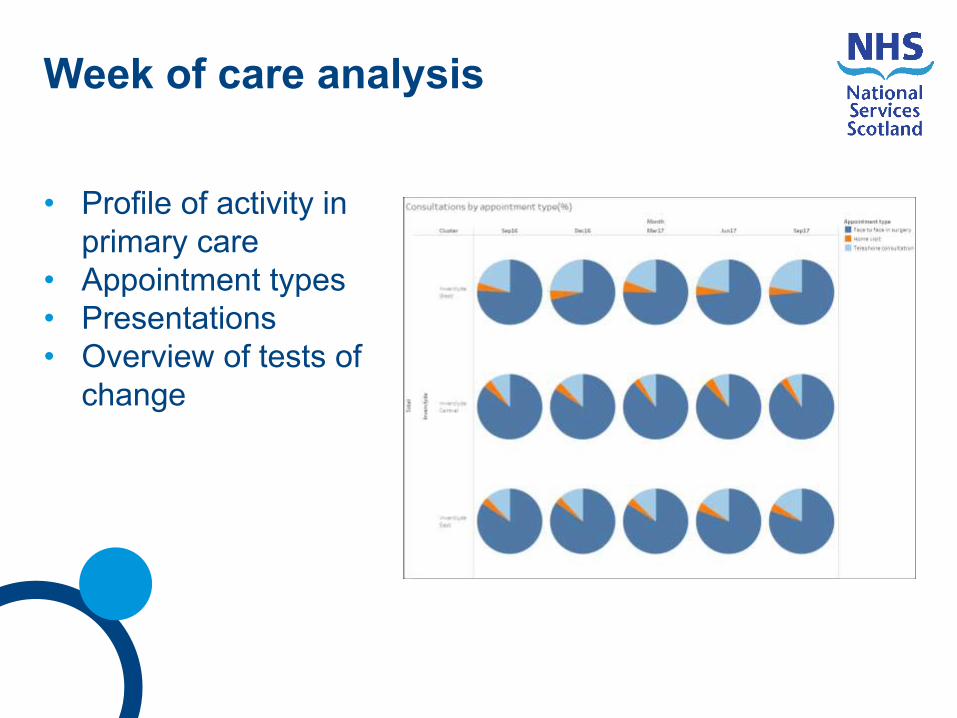
• Profile of activity in
primary care
• Appointment types
• Presentations
• Overview of tests of
change
Week of care analysis

Week of care analysis

Week of care analysis

Week of care analysis

Future developments
• Effect of physiotherapist on mainstream physiotherapy
waiting times.
• SAS want to investigate whether paramedic work is
affecting emergency presentations and outcomes for
patients who are admitted.
• Build on and reinforce existing links between health and
social care.
The Way
Local
Intelligence
Support Team
(LIST)
Hospital Flow
Dashboard for
Lothian HSCPsJennifer Boyd,
Principal Information Analyst
Information Services Division

Performance, Performance, Performance!!!
Some of the Lothian HSCP Performance
Indicators
• 23 National Core Set of Integration Indicators
• “Big Six” Ministerial Strategic Group
Indicators
• IJB Performance and Quality Group
• HSCP Annual Performance Report
• NHS Lothian HSCP Scorecard
Updated
on a
monthly,
quarterly
and
annual
basis
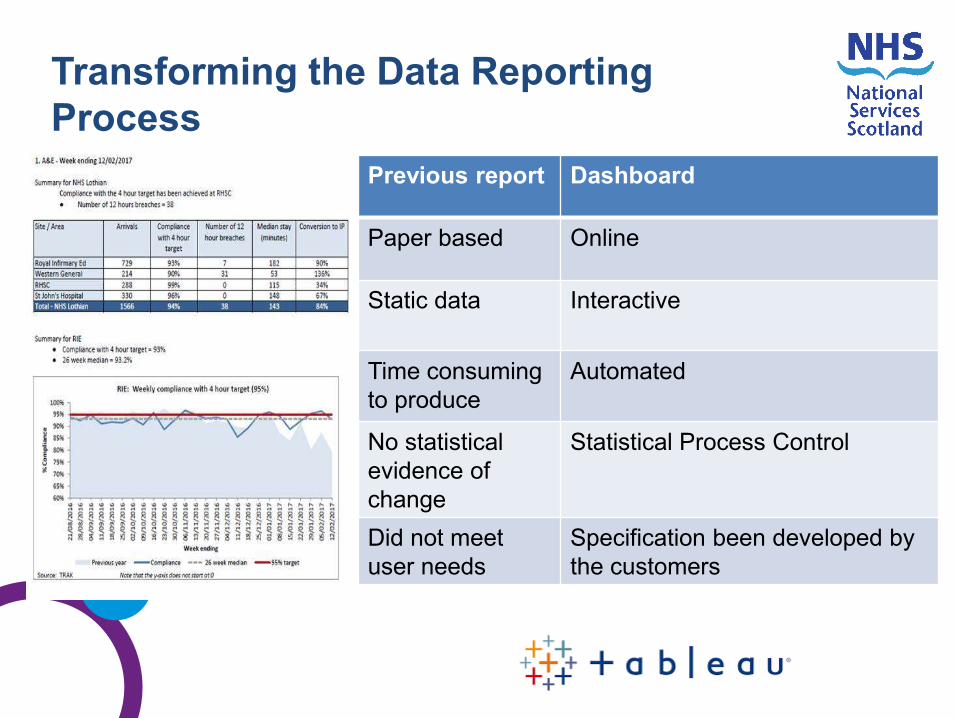
Transforming the Data Reporting
Process
Previous report Dashboard
Paper based Online
Static data Interactive
Time consuming
to produce
Automated
No statistical
evidence of
change
Statistical Process Control
Did not meet
user needs
Specification been developed by
the customers

Statistical method of measuring improvement:
• Helps to understand variation
• Differentiates type of variation
Understanding variation allows us to:
• Improve system
• Test change
• Enable prediction
• Identify process capability
Data Visualisation: SPC Charts
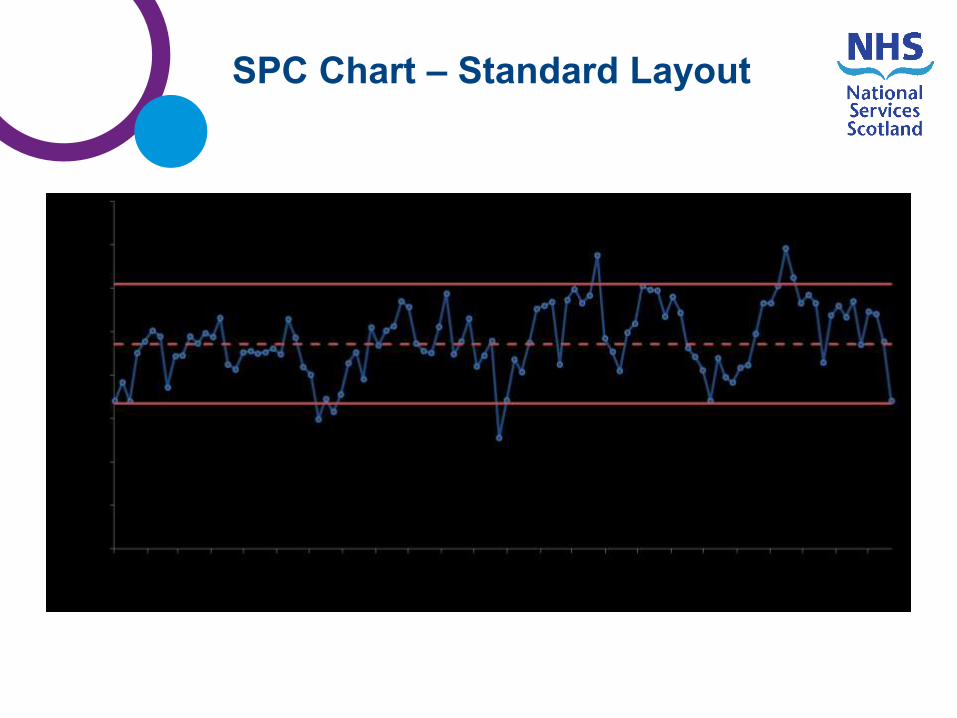
SPC Chart – Standard Layout
Upper Control
Limit
Lower Control
Limit
Mean/ Centre
Line
Data
Points

Outlier = Data points outside one of the control limits:• 0.3% chance it’s caused by the normal process.
SPC Chart – Interpretation Rules
Outer 1/3 (2 sigma) = Two of three data points outside one of the
warning limits:• Probability for two out of three points in a row is ~ 1%.
Higher warning limit
Lower control limit
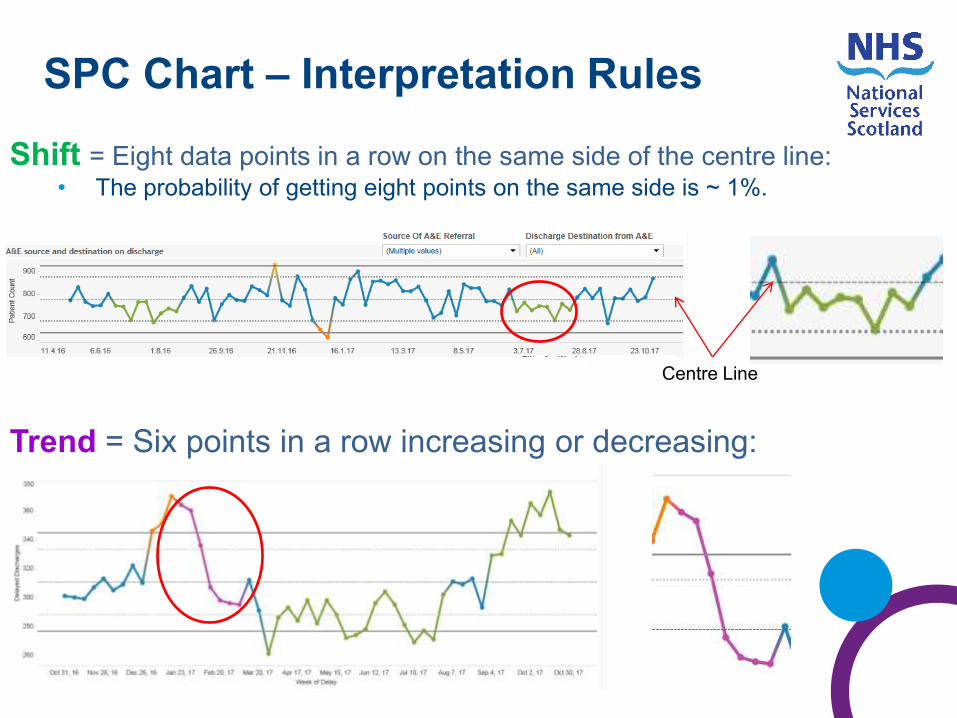
Shift = Eight data points in a row on the same side of the centre line:• The probability of getting eight points on the same side is ~ 1%.
SPC Chart – Interpretation Rules
Trend = Six points in a row increasing or decreasing:
Centre Line

Summary
dashboard
A&E
The
Dashboard
Admissions
Delayed
Discharges
Social
Care*
*where
supplied

Dashboard Layout
Partnership
selections

A&E AttendanceSelecting AE Attendance Dashboard tab
Drop down
selections for:
•Partnership
•Locality
•Practice
Locality
•GP Practice
•Hospital
•Sex
•Age Band
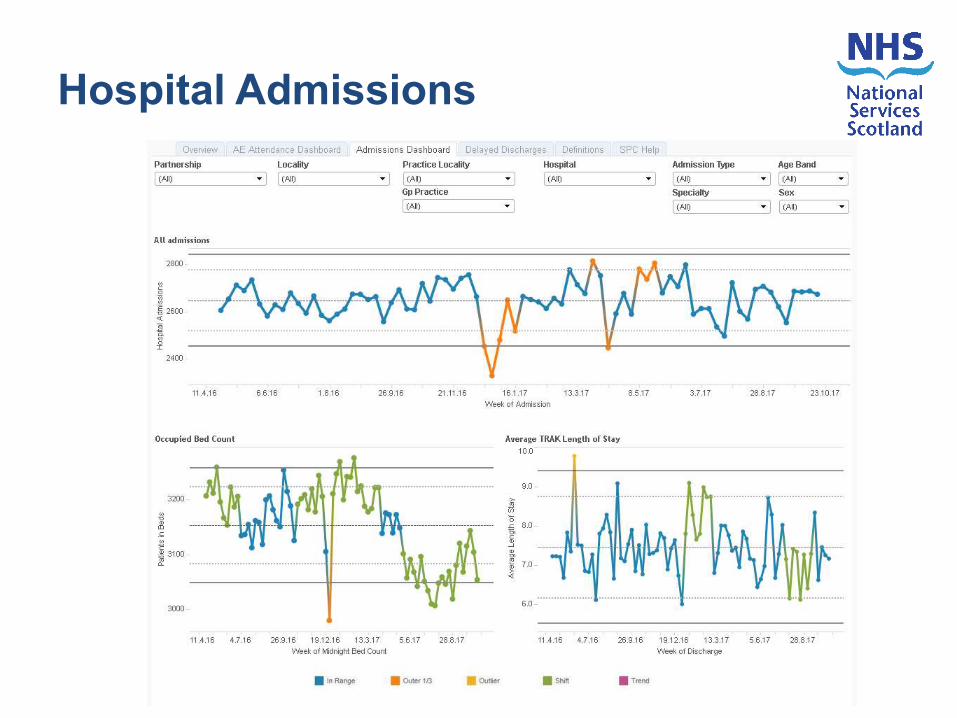
Hospital Admissions

Delayed Discharges

Training completed in Edinburgh, Midlothian
and East Lothian
Implemented a buddy system for support
NHS Lothian Improvement Advisor support
Phase 2 development:
• Delayed Discharges
• Packages of Care
• Social Care Assessment Flow
• ‘Targets’ on overview page
Going Forward

Group discussion / feedback (25 mins):
1. how do ISD/others better share work from across
Scotland?
2. what new questions should we attempting to answer
(including from new data)?
3. how can we individually further use data, to help
service improvement?

Questions ?