Service Delivery Statements - Queensland Treasury€¦ · Strategic Innovation and Policy...
52
budget.qld.gov.au Service Delivery Statements Department of Innovation, Tourism Industry Development and the Commonwealth Games
Transcript of Service Delivery Statements - Queensland Treasury€¦ · Strategic Innovation and Policy...

budget.qld.gov.au
Service Delivery StatementsDepartment of Innovation, Tourism Industry Development and the Commonwealth Games

© Crown copyright All rights reservedQueensland Government 2018
Excerpts from this publication may be reproduced, with appropriate acknowledgement, as permitted under the Copyright Act.
Service Delivery StatementsISSN 1445-4890 (Print)ISSN 1445-4904 (Online)
2018–19 Queensland Budget Papers1. Budget Speech
2. Budget Strategy and Outlook
3. Capital Statement
4. Budget Measures
5. Service Delivery Statements
Appropriation Bills
Budget Highlights
The Budget Papers are available online at budget.qld.gov.au

Department of Innovation, Tourism Industry Development and the Commonwealth Games
Summary of portfolio
Page Department of Innovation, Tourism Industry Development and the Commonwealth Games
3 Department of Innovation, Tourism Industry Development and the Commonwealth Games - controlled
Department of Innovation, Tourism Industry Development and the Commonwealth Games - administered
28 Gold Coast 2018 Commonwealth Games Corporation
37 Tourism and Events Queensland

Portfolio overview
Ministerial and portfolio responsibilities
The table below represents the agencies and services which are the responsibility of the Minister for Innovation and Tourism Industry Development and Minister for the Commonwealth Games:
Minister for Innovation and Tourism Industry Development and Minister for the Commonwealth Games
The Honourable Kate Jones MP
Assistant Minister for Tourism Industry Development
Ms Meaghan Scanlon MP
Department of Innovation, Tourism Industry Development and the Commonwealth Games
Director-General: Damien Walker
Service area 1: Tourism Industry Development
Service area 2: Advancing Queensland through Innovation
The Minister for Innovation and Tourism Industry Development and Minister for the Commonwealth Games is also responsible for:
Gold Coast 2018 Commonwealth Games Corporation
Chief Executive Officer: Mark Peters
Objective: To plan, organise and deliver the Gold Coast 2018 Commonwealth Games in conjunction with Commonwealth Games Australia, the Commonwealth Games Federation, the City of Gold Coast, the Office of the Commonwealth Games within this portfolio, and the Australian Government.
Tourism and Events Queensland
Chief Executive Officer: Leanne Coddington
Objective: To attract visitors to Queensland, generate overnight visitor expenditure, contribute to the Queensland economy, enhance the profile of Queensland, and foster community pride in Queensland.
2018-19 Queenland State Budget - Service Delivery Statements - Department of Innovation,Tourism Industry Development and the Commonwealth Games
1

Additional information about these agencies can be sourced from:
www.ditid.qld.gov.au
www.advance.qld.gov.au
www.qld.gov.au/dsiti/digital
www.gc2018.com
www.teq.queensland.com
2018-19 Queenland State Budget - Service Delivery Statements - Department of Innovation,Tourism Industry Development and the Commonwealth Games
2

Departmental overview The Department of Innovation, Tourism Industry Development and the Commonwealth Games (DITID) has a lead strategic role with the Advance Queensland agenda, growing the State's visitor economy and major events program. It has a further role in realising the legacy of the Gold Coast 2018 Commonwealth Games (GC2018).
Our vision is to drive economic growth and job creation through innovation, tourism industry development and major events. We work collaboratively with industry and other Government agencies to harness strategic opportunities. In an increasingly competitive global economy, we are also working to position Queensland as a vibrant innovation hub and an attractive investment destination for venture capital and industry investment.
We contribute to the Queensland Government's objectives to create jobs in a strong economy; be a responsive government; protect the Great Barrier Reef and keep communities safe by:
capitalising on our competitive advantages and supporting innovative practice across Government and leading theAdvance Queensland initiative to foster innovation and entrepreneurship
working in partnership with Tourism and Events Queensland and the Queensland tourism industry, to grow visitors,yield jobs and create a business environment conducive to a strong, profitable and globally competitive visitoreconomy
leveraging achievements and return on investment from GC2018 legacy initiatives to maximise long-term economicand social benefits for Queensland.
We recognise the need for innovation, enhanced digital skills, connectivity and increased inclusion is critical to position Queensland as a global innovation hub.
The department’s key priorities for 2018-19 are to:
lead the Advance Queensland initiatives and programs to support innovation-led jobs growth
encourage the innovation ecosystem through Ignite Ideas, expanding the Precinct, and supporting regionalinnovators
support research through fellowship and the uptake of key technologies like big data, artificial intelligence and dronesby industry
progress the Advancing Tourism 2016-20: Growing Queensland Jobs strategy to drive tourism growth
progress initiatives under the Growing Tourism, Growing Tourism Jobs policy including the $48.6 million AttractingTourism Fund, $46 million Regional Tourism Infrastructure and Experience Development Program including$10 million for the Outback Tourism Infrastructure fund
deliver infrastructure to the Great Barrier Reef islands of $50 million, with priority on growing, greening and cleaningprojects, and a new Great Keppel Island recovery package to support the delivery of major tourism infrastructureimprovements
mobilise Government in partnership with industry to drive the visitor economy, especially through the growth oftourism, major events and international education throughout Queensland
continue to deliver the Queen's Wharf Brisbane Global Tourism Hub project and processes for regional GlobalTourism Hubs in Cairns and the Gold Coast
implement strategies and evaluations under the Embracing 2018 Legacy program to ensure the GC2018 leaves alasting legacy for the Gold Coast and Queensland and that the facilities and infrastructure ultimately supports thelong−term needs of the region
work with the Minister for Environment and the Great Barrier Reef, Minister for Science and Minister for the Arts toidentify opportunities to support the growth of the ecotourism industry in Queensland.
2018-19 Queenland State Budget - Service Delivery Statements - Department of Innovation,Tourism Industry Development and the Commonwealth Games
3

Service performance The service area structure presented reflects the machinery-of-government changes, effective 12 December 2017 under which the former Department of Tourism, Major Events, Small Business and the Commonwealth Games was renamed the Department of Innovation, Tourism Industry Development and the Commonwealth Games.
As part of the machinery-of-government changes:
Strategic Innovation and Policy transferred from the former Department of Science, Information Technology andInnovation, and was renamed Innovation. The Innovation division is responsible for delivering the AdvanceQueensland though the Innovation service area.
Responsibility for Global Tourism Hubs was transferred from the former Department of State Development into theservice area Tourism Industry Development.
Responsibility for the Office of Small Business was transferred to the Department of Employment, Small Businessand Training.
Tourism Industry Development
Service area objective
To promote long-term growth of the tourism industry by facilitating a strategic whole-of-government approach to planning and investment in the State's tourism infrastructure, assets and products and the coordination and leveraging of key major events to generate jobs.
Service area description
The service area works across Government to:
develop and influence whole-of-government policy that creates an environment to support economic growth and jobsin the visitor economy
work in partnership with industry to increase the competitiveness in the global and domestic markets of the tourismsector
facilitate and manage the delivery of visitor ecotourism funded projects to:
- increase visitor access to Queensland
- develop new tourism infrastructure and products
- attract investment into tourism infrastructure and products
attract and coordinate Government support for the delivery of major events and maximise the economic benefits fromhosting major events in Queensland such as the Gold Coast 2018 Commonwealth Games (GC2018).
The service area works closely with Tourism and Events Queensland (TEQ) to showcase Queensland as an attractive destination for tourists, and a place to invest in tourism infrastructure, events and experiences.
Services
Industry development
Infrastructure development
2018-19 service area highlights
Finalise the delivery, reporting, dissolution and transfer of knowledge of GC2018, working collaboratively andtransparently with partners and stakeholders.
Continue to implement strategies under the Embracing 2018 Legacy program, to evaluate the outcomes fromGC2018.
Continue to drive tourism growth, in partnership with industry, by progressing initiatives under the Advancing Tourism2016−20: Growing Queensland Jobs strategy.
Mobilise Government in partnership with industry to drive the visitor economy, especially through the growth oftourism, major events and international education throughout Queensland.
2018-19 Queenland State Budget - Service Delivery Statements - Department of Innovation,Tourism Industry Development and the Commonwealth Games
4

Progress initiatives under the Growing Tourism, Growing Tourism Jobs policy, including administering the following:
- an Attracting Tourism Fund to provide incentives to attract new international airline routes and connectivity toQueensland
- a new Regional Tourism Infrastructure and Experience Development program to assist communities to growtourism by developing new and improved tourism experiences or products and develop tourism industry capability.
To deliver infrastructure to the Great Barrier Reef islands (including Great Keppel Island), with priority onrevitalisation projects to support the delivery of major tourism infrastructure investments.
Facilitate the successful delivery of the Queen's Wharf Brisbane Global Tourism Hub and continue processes forprocurement of regional Global Tourism Hubs in Cairns and the Gold Coast.
Facilitate new investments in eco and adventure tourism in Queensland, particularly on Government owned landssuch as National Parks or State Forests.
Work with the Minister for Environment and the Great Barrier Reef, Minister for Science and Minister for the Arts toidentify opportunities to support the growth of the ecotourism industry in Queensland.
Department of Innovation, Tourism Industry Development and the
Commonwealth Games Notes
2017-18
Target/Est.
2017-18
Est. Actual
2018-19
Target/Est.
Service area: Tourism Industry Development 1
Service: Industry Development 2
Service standards
Effectiveness measures
Inbound seat capacity supported by route development programs 3 New measure New measure 600,000
Grow international overnight visitor expenditure in Queensland supported by tourism development programs 4, 5 $40 million $50 million $60 million
Service: Infrastructure Development 6
Service standards
Effectiveness measures
Amount of additional capital attracted into tourism investment 7 $120 million $120 million $144 million
Value of capital investment being developed or delivered through the department’s facilitated tourism infrastructure projects 8, 9 New measure New measure $3 billion
Efficiency measure
Ratio of tourism investment attraction costs to the value of direct capital attracted $1:$168 $1:$168 $1:$168
Notes:
1. The name of this Service Area changed from Tourism and Events Development to Tourism Industry Development as previously publishedin the 2017-18 Service Delivery Statement to acknowledge the broadening of the service area to have a stronger focus on visitor access, tourism infrastructure and industry development.
2. This is a new Service for the 2018-19 Service Delivery Statement. Industry development encompasses the work of the department acrossgovernment and industry to create the conditions for a successful tourism industry and to grow the number of visitors to Queensland.
3. This new measure replaces the former measure “Additional seats by targeted airlines on routes supported by the Attracting AviationInvestment Fund” published in the 2017-18 Service Delivery Statement. The measure expands on the data collected for additional airline capacity under the following funds - the Attracting Aviation Investment Fund, Connecting with Asia and Attracting Tourism Fund and changes the way the measure is calculated to include seats over the life of the agreement.
4. The wording of this measure has been amended to remove the reference to program names as over time program titles tend to change.The methodology has not changed. The measure is an estimate of growth in overnight visitor expenditure from activities funded under Connecting with Asia and the Attracting Tourism Fund to attract additional overnight visitors.
2018-19 Queenland State Budget - Service Delivery Statements - Department of Innovation,Tourism Industry Development and the Commonwealth Games
5

5. The increase in 2018-19 Target/Estimate reflects a full year of operation of all services considers potential fluctuations of services due toseasonal demand.
6. This is a new Service for the 2018-19 Service Delivery Statement. Tourism Infrastructure Development focuses on facilitating investmentand supporting the development and delivery of key infrastructure projects which includes the transfer of Global Tourism Hub developmentfrom the former Department of State Development and the rejuvenation of the Great Barrier Reef Island resorts to enhance visitors’experience of Queensland.
7. The target for the attraction of capital into tourism is expected to remain strong with an average growth of 20 per cent per annum. Theincrease in the 2018-19 Target/Estimate reflects this anticipated growth and sustained support received by investors through thedepartment’s tourism attraction program.
8. This new service standard has been introduced as a result of machinery-of-government changes in December 2017. Responsibility forGlobal Tourism Hubs, which are integrated tourism resorts and may include casino licences, was transferred from the former Departmentof State Development. Reporting on this measure now also includes significant infrastructure for Great Barrier Reef island resorts andGreat Keppel Island.
9. The investment amount reported in this measure refers to the full investment value over the entire life of the project even where this isexpected to be fulfilled over several financial years.
2018-19 Queenland State Budget - Service Delivery Statements - Department of Innovation,Tourism Industry Development and the Commonwealth Games
6

Advancing Queensland through Innovation
Service area objective
To drive economic growth and job creation through innovation, harnessing Queensland’s research strengths and entrepreneurship and using new technology, capital and ideas to support business and industry creation and growth.
Service area description
The service area provides support to build a more collaborative and effective innovation ecosystem in Queensland.
Our areas of focus are to:
inspire Queenslanders to engage with science, technology and entrepreneurship
connect Queenslanders to world-leading local and international innovators through programs that encouragecollaboration and build the entrepreneurial ecosystem
invest in Queensland innovation through programs to encourage seed funding, venture capital and emergingindustries
grow the competitiveness of our businesses, industries and regions through programs to accelerate growth andunlock new markets and opportunities
encourage greater innovation in Government and grow Government as a lead customer for emerging technologies.
2018-19 service area highlights
Lead the Advance Queensland initiatives and programs across government to support innovation-led growth andenhance Queensland’s capacity to adapt and thrive, including:
- encouraging innovative startups and small businesses to commercialise their products through the Ignite Ideasfund
- supporting new ideas for growing Queensland’s competitive strengths through Industry Research Fellowships
- driving innovation in regional Queensland through the Regional Startup Onramp program
- fostering diversity in innovation by encouraging the success of female founders and researchers
- increasing the skills and opportunities for Aboriginal and Torres Strait Islander innovators and entrepreneurs.
'IndustryTech' – working with our key industries to drive cross-cutting technologies, like artificial intelligence, that willboost our global competitiveness.
Department of Innovation, Tourism Industry Development and the
Commonwealth Games Notes
2017-18
Target/Est.
2017-18
Est. Actual
2018-19
Target/Est.
Service area: Advancing Queensland through Innovation 1
Service standards
Effectiveness measures
Proportion of stakeholders who are satisfied with innovation and commercialisation consultative and engagement processes 2 ≥85% 90% ≥85%
Percentage of collaboration opportunities identified by participants of innovation programs/events 3 ≥25% 30% ≥30%
Percentage of Advance Queensland funding recipients satisfied with contract management services provided for related grant programs (overall satisfaction) New measure New measure ≥80%
2018-19 Queenland State Budget - Service Delivery Statements - Department of Innovation,Tourism Industry Development and the Commonwealth Games
7
Department of Innovation, Tourism Industry Development and the
Commonwealth Games Notes
2017-18
Target/Est.
2017-18
Est. Actual
2018-19
Target/Est.
Efficiency measure
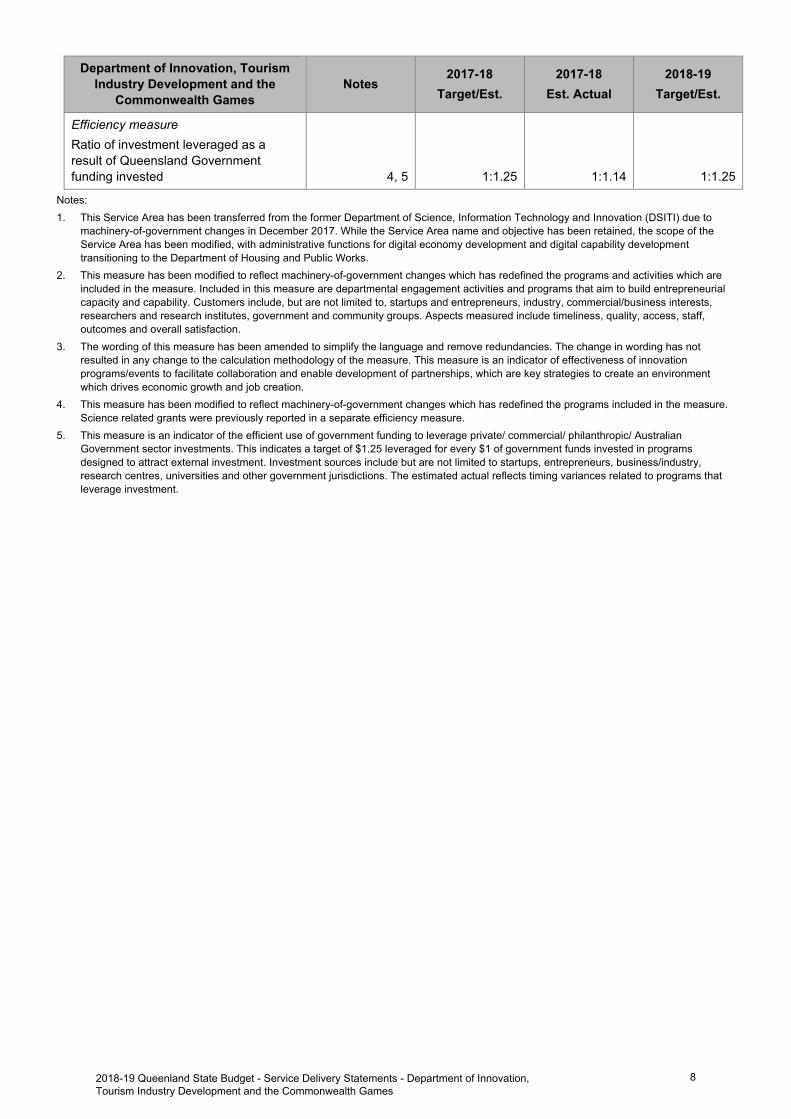
Ratio of investment leveraged as a result of Queensland Government funding invested 4, 5 1:1.25 1:1.14 1:1.25
Notes:
1. This Service Area has been transferred from the former Department of Science, Information Technology and Innovation (DSITI) due tomachinery-of-government changes in December 2017. While the Service Area name and objective has been retained, the scope of the Service Area has been modified, with administrative functions for digital economy development and digital capability development transitioning to the Department of Housing and Public Works.
2. This measure has been modified to reflect machinery-of-government changes which has redefined the programs and activities which areincluded in the measure. Included in this measure are departmental engagement activities and programs that aim to build entrepreneurial capacity and capability. Customers include, but are not limited to, startups and entrepreneurs, industry, commercial/business interests, researchers and research institutes, government and community groups. Aspects measured include timeliness, quality, access, staff, outcomes and overall satisfaction.
3. The wording of this measure has been amended to simplify the language and remove redundancies. The change in wording has notresulted in any change to the calculation methodology of the measure. This measure is an indicator of effectiveness of innovation programs/events to facilitate collaboration and enable development of partnerships, which are key strategies to create an environment which drives economic growth and job creation.
4. This measure has been modified to reflect machinery-of-government changes which has redefined the programs included in the measure.Science related grants were previously reported in a separate efficiency measure.
5. This measure is an indicator of the efficient use of government funding to leverage private/ commercial/ philanthropic/ AustralianGovernment sector investments. This indicates a target of $1.25 leveraged for every $1 of government funds invested in programs designed to attract external investment. Investment sources include but are not limited to startups, entrepreneurs, business/industry, research centres, universities and other government jurisdictions. The estimated actual reflects timing variances related to programs that leverage investment.
2018-19 Queenland State Budget - Service Delivery Statements - Department of Innovation,Tourism Industry Development and the Commonwealth Games
8

Discontinued measures
Performance measures included in the 2017-18 Service Delivery Statements that have been discontinued or replaced are reported in the following table with estimated actual results.
Department of Innovation, Tourism Industry Development and the
Commonwealth Games Notes
2017-18
Target/Est.
2017-18
Est. Actual
2018-19
Target/Est.
Service area: Tourism and Events Development 1
Additional seats by targeted airlines on routes supported by the Attracting Aviation Investment Fund 2, 3 240,000 537,620
Discontinued measure
Level of Commonwealth Games Federation's satisfaction with preparedness for the Commonwealth Games 4 Satisfied Satisfied
Discontinued measure
Value of capital investment being developed or delivered through projects 5, 6, 7 $4.287 billion ..
Discontinued measure
Estimated number of jobs enabled through projects developed or delivered 5, 6, 8 5,585 ..
Discontinued measure
Value of capital investment enabled per dollar spent on project development and delivery 5, 6, 9 $351 ..
Discontinued measure
Service area: Advancing Queensland through Innovation 10
Proportion of stakeholders who are satisfied with digital economy and productivity services, consultative and engagement processes 11 ≥85% 84%
Discontinued measure
External funds leveraged from grants funds committed 12, 13 1:1.25 1:0.78
Discontinued measure
Notes:
1. The name of this service area was Tourism and Events Development in the 2017-18 Service Delivery Statement and has been renamed toTourism Industry Development within the Department of Innovation, Tourism Industry Development and the Commonwealth Games (DITID).
2. This measure has been discontinued. A new measure “Inbound seat capacity supported by route development programs” that includes allfunds contributing to increased airline capacity has been included in the 2018-19 Service Delivery Statement. Additional funding has been allocated and the initiatives to increase visitor access routes to Queensland have been widened.
3. The increase in the 2017-18 Estimated Actual reflects increased program output due to additional investment in routes supported by theAttracting Aviation Investment fund.
4. The 2018 Gold Coast Commonwealth Games (GC2018) was held in April 2018. The final preparedness assessment by theCommonwealth Games Federation occurred in December 2017. Monitoring and evaluating the legacy outcomes from GC2018 will continue to be publicly reported through the Embracing GC2018 Reports and the department’s Annual Report.
5. This service standard was previously published in the Department of State Development in the 2017-18 Service Delivery Statement andwas transferred to DITID due to machinery-of-government changes in December 2017.
6. This service standard has been discontinued due to machinery-of-government changes as the calculation methodology included MajorProjects and Property which remains the responsibility of the Department of State Development, Manufacturing, Infrastructure and Planning. 2017-18 Estimated Actuals are unable to be reported due to the transfer out of services due to machinery-of-government changes in December 2017.
7. A new service standard has been introduced in the 2018-19 Service Delivery Statement "Value of capital investment being developed ordelivered through the department's facilitated tourism infrastructure projects" to measure Integrated tourism resorts/Global tourism hubs along with other tourism infrastructure projects delivered by the Tourism Infrastructure Service Area.
2018-19 Queenland State Budget - Service Delivery Statements - Department of Innovation,Tourism Industry Development and the Commonwealth Games
9

8. A new service standard has been introduced in the 2018-19 Service Delivery Statement "Estimated number of jobs enabled throughtourism infrastructure projects developed or delivered" to replace this discontinued measure.
9. A new service standard has been introduced in the 2018-19 Service Delivery Statement "Value of capital investment enabled per dollarspent on tourism infrastructure project development and delivery to replace this discontinued measure.
10. Following machinery-of-government changes, this Service Area was transferred from the former Department of Science, InformationTechnology and Innovation to DITID.
11. This measure has been discontinued as a result of machinery-of-government changes. The scope of the Service Area has been modified,with administrative functions for digital economy development and digital capability development transitioning to the Department of Housingand Public Works.
12. This measure has been discontinued and the funding programs have been incorporated with other relevant service delivery into theexisting efficiency measure "Ratio of investment leveraged as a result of Queensland Government funding invested".
13. The 2017-18 Estimated Actual for this measure is due to the timing of funding rounds.
2018-19 Queenland State Budget - Service Delivery Statements - Department of Innovation,Tourism Industry Development and the Commonwealth Games
10
Administered items
Administered activities are those undertaken by departments on behalf of the Government.
The Department of Innovation, Tourism Industry Development and the Commonwealth Games (DITID) administers funds on behalf of the State which includes the provision of funding to Tourism and Events Queensland (TEQ) and the Gold Coast 2018 Commonwealth Games Corporation (GOLDOC).
TEQ is the Queensland Government’s lead marketing, experience development and major events agency.
GOLDOC planned, organised and delivered the Gold Coast 2018 Commonwealth Games in conjunction with the Australian Commonwealth Games Association, the Commonwealth Games Federation, the City of Gold Coast and the Office of Commonwealth Games within DITID and the Australian Government.
Financial statements and variance explanations in relation to administered items appear in the departmental financial statements.
2018-19 Queenland State Budget - Service Delivery Statements - Department of Innovation,Tourism Industry Development and the Commonwealth Games
11

Departmental budget summary The table below shows the total resources available in 2018-19 from all sources and summarises how resources will be applied by service area and by controlled and administered classifications.
Department of Innovation, Tourism Industry Development and the
Commonwealth Games
2017-18
Adjusted Budget
$’000
2017-18
Est. Actual
$’000
2018-19
Budget
$’000
CONTROLLED
Income
Appropriation revenue1
Deferred from previous year/s 33,970 39,575 49,560
Balance of service appropriation2 326,075 305,778 173,274
Other revenue 25,519 26,650 ..
Total income 385,564 372,003 222,834
Expenses
Tourism Industry Development2 333,713 315,381 133,949
Advancing Queensland through Innovation 43,236 46,376 88,885
Small Business Services3 9,194 10,246 ..
Total expenses 386,143 372,003 222,834
Operating surplus/deficit (579) .. ..
Net assets 1,402 6,812 6,557
ADMINISTERED
Revenue
Commonwealth revenue .. .. ..
Appropriation revenue4 623,869 625,534 107,889
Other administered revenue .. .. ..
Total revenue 623,869 625,534 107,889
Expenses
Transfers to government .. .. ..
Administered expenses 623,869 625,534 107,889
Total expenses 623,869 625,534 107,889
Net assets .. .. ..
Notes:
1. Includes State and Commonwealth funding.
2. The decrease in the 2018-19 Budget principally relates to the cessation of funding for the Gold Coast 2018 Commonwealth Games.
3. As part of the machinery-of-government changes Small Business Services has been transferred to the newly formed Department ofEmployment, Small Business and Training.
4. The decrease in the 2018-19 Budget principally relates to the cessation of funding for the Gold Coast 2018 Commonwealth GamesCorporation (GOLDOC).
2018-19 Queenland State Budget - Service Delivery Statements - Department of Innovation,Tourism Industry Development and the Commonwealth Games
12

Service area sources of revenue1
Sources of revenue
2018-19 Budget
Department of Innovation, Tourism Industry Development and the
Commonwealth Games
Total cost
$’000
State
contribution
$’000
User
charges
and fees
$’000
C’wealth
revenue
$’000
Other
revenue
$’000
Tourism Industry Development 133,949 133,949 .. .. ..
Advancing Queensland through Innovation 88,885 88,885 .. .. ..
Total 222,834 222,834 .. .. ..
Note:
1. Explanations of variances are provided in the financial statements.
2018-19 Queenland State Budget - Service Delivery Statements - Department of Innovation,Tourism Industry Development and the Commonwealth Games
13

Budget measures summary
This table shows a summary of budget measures relating to the department since the 2017-18 State Budget. Further details are contained in Budget Measures (Budget Paper 4).
Department of Innovation, Tourism Industry Development and the
Commonwealth Games
2017-18
$’000
2018-19
$’000
2019-20
$’000
2020-21
$’000
2021-22
$’000
Revenue measures
Administered .. .. .. .. ..
Departmental .. .. .. .. ..
Expense measures1
Administered .. 7,500 12,000 16,500 46,875
Departmental 41,434 61,104 66,726 66,514 33,650
Capital measures
Administered .. .. .. .. ..
Departmental 5,000 10,000 10,000 .. ..
Note:
1. Figures reconcile with Budget Measures (Budget Paper 4), including the whole-of-government expense measure ‘Reprioritisations’.
2018-19 Queenland State Budget - Service Delivery Statements - Department of Innovation,Tourism Industry Development and the Commonwealth Games
14

Departmental capital program
Property, Plant and Equipment
The department’s total plant and equipment purchases in 2018-19 is $196,000, including:
$172,000 allocated to the Carrara Stadium upgrades
$24,000 allocated for the replacement of office equipment.
Capital Grants
Total capital grants for the department in 2018-19 are $34.5 million, including:
$12.4 million allocated in 2018-19 to the Regional Tourism Infrastructure and Experience Development Program toassist communities to grow tourism by developing new and improved tourism experiences which includes thefacilitation of outback tourism infrastructure projects.
$10 million allocated for the Great Barrier Reef Island Rejuvenation Package to help industry rejuvenate GreatBarrier Reef Island resorts and offer world-class experiences to visitors.
$5.8 million allocated in 2018-19 to the Great Keppel Island Recovery Package to support the delivery of majortourism infrastructure improvements.
$3.1 million allocated for the finalisation of works on Gold Coast 2018 Commonwealth Games venues to enableongoing public and community use of the facilities for post-games events.
$2.4 million allocated to facilitate outback tourism infrastructure projects, as part of the Regional TourismInfrastructure and Experience Development Program.
$2.2 million allocated in 2018-19 for the Australian Workers Heritage Centre to help meet costs of refurbishment andextension of premises and exhibits.
$524,000 allocated to Mt Inkerman Nature Tourism Development for roadworks, car parking and other infrastructureupgrades.
$413,000 is allocated to Mackay Tourism Visitor Information Centre development to a new Visitor Information Centreat Sarina, repositioned on the highway.
Capital budget
Department of Innovation, Tourism Industry Development and the
Commonwealth Games Notes
2017-18
Adjusted Budget
$’000
2017-18
Est. Actual
$’000
2018-19
Budget
$’000
Capital purchases 1
Total land, buildings and infrastructure 923 2,168 172
Total plant and equipment 12 12 24
Total other capital 19,730 10,932 34,484
Total capital purchases 20,665 13,112 34,680
Note:
1. For more detail on the agency’s capital acquisitions please refer to Capital Statement (Budget Paper 3).
2018-19 Queenland State Budget - Service Delivery Statements - Department of Innovation,Tourism Industry Development and the Commonwealth Games
15

Staffing1
Department of Innovation, Tourism Industry Development and the
Commonwealth Games Notes
2017-18 Adjusted
Budget
2017-18
Est. Actual
2018-19
Budget
Tourism Industry Development 2, 3, 4 116 117 90
Advancing Queensland through Innovation 2, 3 77 77 83
TOTAL 193 194 173
Notes:
1. Full-time equivalents (FTEs) as at 30 June.
2. Corporate FTEs are allocated across the service to which they relate.
3. The department participates in a partnership arrangement with the Departments of Agriculture and Fisheries and the Department of NaturalResources, Mines and Energy from which it receives other corporate services.
4. The reduction in FTEs is due to the cessation of temporary staff engaged for the Commonwealth Games.
2018-19 Queenland State Budget - Service Delivery Statements - Department of Innovation,Tourism Industry Development and the Commonwealth Games
16

Chart: Total departmental expenses across the Forward Estimates period
Budgeted financial statements
Analysis of budgeted financial statements
An analysis of the department's budgeted financial statements, as reflected in the department's financial statements, is provided below.
Departmental income statement
Total expenses are estimated to be $222.8 million in 2018-19, a decrease of $149.2 million from the 2017-18 Estimated Actual. The decrease is mainly due to a reduction in expenses for the Gold Coast 2018 Commonwealth Games (GC2018); which is partially offset by increased expenses for Aviation Boost and the Advance Queensland initiatives including the Advance Queensland: Connecting with Asia Strategy and Innovation Projects; and additional expenses for Major Events Funding, the Great Barrier Reef Island Rejuvenation Package, Great Keppel Island Recovery Package and the Museum of Underwater Art.
The variation in funding over the Forward Estimate period is a result of the cessation in limited life funding for programs delivered by the department.
0
50,000
100,000
150,000
200,000
250,000
300,000
350,000
400,000
2017-18 2018-19 2019-20 2020-21 2021-22
$'00
0
Financial year
Total expenses
Total expenses
2018-19 Queenland State Budget - Service Delivery Statements - Department of Innovation,Tourism Industry Development and the Commonwealth Games
17

Controlled income statement
Department of Innovation, Tourism Industry Development and the Commonwealth Games
Notes
2017-18Adjusted
Budget$'000
2017-18 Est. Act.
$'000
2018-19 Budget
$'000
INCOME
Appropriation revenue 1,8,15 360,045 345,353 222,834
Taxes .. .. ..
User charges and fees .. .. ..
Royalties and land rents .. .. ..
Grants and other contributions 2,9,16 25,519 26,650 ..
Interest .. .. ..
Other revenue .. .. ..
Gains on sale/revaluation of assets .. .. ..
Total income 385,564 372,003 222,834
EXPENSES
Employee expenses 3,10,17 24,585 23,534 21,375
Supplies and services 4,11,18 141,172 118,786 48,191
Grants and subsidies 5,12,19 215,268 223,388 152,406
Depreciation and amortisation 22 226 618
Finance/borrowing costs .. .. ..
Other expenses 6,13,20 5,096 6,069 244
Losses on sale/revaluation of assets .. .. ..
Total expenses 386,143 372,003 222,834
OPERATING SURPLUS/(DEFICIT) 7,14 (579) .. ..
2018-19 Queenland State Budget - Service Delivery Statements - Department of Innovation,Tourism Industry Development and the Commonwealth Games
18

Controlled balance sheet
Department of Innovation, Tourism Industry Development and the Commonwealth Games
Notes
2017-18Adjusted
Budget$'000
2017-18 Est. Act.
$'000
2018-19 Budget
$'000
CURRENT ASSETS
Cash assets 21,28 4,021 7,906 7,900
Receivables 22,29 1,548 6,823 6,538
Other financial assets .. .. ..
Inventories .. .. ..
Other (15) 161 171
Non-financial assets held for sale .. .. ..
Total current assets 5,554 14,890 14,609
NON-CURRENT ASSETS
Receivables .. .. ..
Other financial assets .. .. ..
Property, plant and equipment 23,30 77 3,933 3,511
Intangibles .. .. ..
Other 24,31 .. 1,033 1,033
Total non-current assets 77 4,966 4,544
TOTAL ASSETS 5,631 19,856 19,153
CURRENT LIABILITIES
Payables 25,32 2,998 8,739 8,525
Accrued employee benefits 1,026 1,189 955
Interest bearing liabilities and derivatives .. .. ..
Provisions .. .. ..
Other 205 529 529
Total current liabilities 4,229 10,457 10,009
NON-CURRENT LIABILITIES
Payables .. .. ..
Accrued employee benefits .. .. ..
Interest bearing liabilities and derivatives .. .. ..
Provisions .. .. ..
Other 26,33 .. 2,587 2,587
Total non-current liabilities .. 2,587 2,587
TOTAL LIABILITIES 4,229 13,044 12,596
NET ASSETS/(LIABILITIES) 1,402 6,812 6,557
EQUITY
TOTAL EQUITY 27,34 1,402 6,812 6,557
2018-19 Queenland State Budget - Service Delivery Statements - Department of Innovation,Tourism Industry Development and the Commonwealth Games
19

Controlled cash flow statement
Department of Innovation, Tourism Industry Development and the Commonwealth Games
Notes
2017-18Adjusted
Budget$'000
2017-18 Est. Act.
$'000
2018-19 Budget
$'000
CASH FLOWS FROM OPERATING ACTIVITIES
Inflows:
Appropriation receipts 35,43,51 359,573 346,453 222,834
User charges and fees 44,52 (1,196) (1,251) (6)
Royalties and land rent receipts .. .. ..
Grants and other contributions 36,45,53 20,567 19,882 ..
Interest received .. .. ..
Taxes .. .. ..
Other 355 355 225
Outflows:
Employee costs 37,46,54 (24,316) (22,977) (21,543)
Supplies and services 38,47,55 (141,848) (118,147) (48,419)
Grants and subsidies 39,48,56 (215,268) (227,038) (152,396)
Borrowing costs .. .. ..
Other 446 (149) (250)
Net cash provided by or used in operating activities (1,687) (2,872) 445
CASH FLOWS FROM INVESTING ACTIVITIES
Inflows:
Sales of non-financial assets .. .. ..
Investments redeemed .. .. ..
Loans and advances redeemed .. .. ..
Outflows:
Payments for non-financial assets 40,57 (935) (2,180) (196)
Payments for investments .. .. ..
Loans and advances made .. .. ..
Net cash provided by or used in investing activities (935) (2,180) (196)
CASH FLOWS FROM FINANCING ACTIVITIES
Inflows:
Borrowings .. .. ..
Equity injections 41,49,58 4,511 6,818 172
Outflows:
Borrowing redemptions .. .. ..
Finance lease payments .. .. ..
Equity withdrawals (8) (8) (427)
Net cash provided by or used in financing activities 4,503 6,810 (255)
Net increase/(decrease) in cash held 1,881 1,758 (6)
Cash at the beginning of financial year 4,173 9,977 7,906
Cash transfers from restructure 42,50,59 (2,033) (3,829) ..
Cash at the end of financial year 4,021 7,906 7,900
2018-19 Queenland State Budget - Service Delivery Statements - Department of Innovation,Tourism Industry Development and the Commonwealth Games
20

Administered income statement
Department of Innovation, Tourism Industry Development and the Commonwealth Games
Notes 2017-18 Budget
$'000
2017-18 Est. Act.
$'000
2018-19 Budget
$'000
INCOME
Appropriation revenue 60,61,62 623,869 625,534 107,889
Taxes .. .. ..
User charges and fees .. .. ..
Royalties and land rents .. .. ..
Grants and other contributions .. .. ..
Interest .. .. ..
Other revenue .. .. ..
Gains on sale/revaluation of assets .. .. ..
Total income 623,869 625,534 107,889
EXPENSES
Employee expenses .. .. ..
Supplies and services .. .. ..
Grants and subsidies 60,61,62 623,869 625,534 107,889
Depreciation and amortisation .. .. ..
Finance/borrowing costs .. .. ..
Other expenses .. .. ..
Losses on sale/revaluation of assets .. .. ..
Transfers of Administered Revenue to Government .. .. ..
Total expenses 623,869 625,534 107,889
OPERATING SURPLUS/(DEFICIT) .. .. ..
2018-19 Queenland State Budget - Service Delivery Statements - Department of Innovation,Tourism Industry Development and the Commonwealth Games
21

Administered balance sheet
Department of Innovation, Tourism Industry Development and the Commonwealth Games
Notes 2017-18 Budget
$'000
2017-18 Est. Act.
$'000
2018-19 Budget
$'000
CURRENT ASSETS
Cash assets .. .. ..
Receivables .. .. ..
Other financial assets .. .. ..
Inventories .. .. ..
Other .. .. ..
Non-financial assets held for sale .. .. ..
Total current assets .. .. ..
NON-CURRENT ASSETS
Receivables .. .. ..
Other financial assets .. .. ..
Property, plant and equipment .. .. ..
Intangibles .. .. ..
Other .. .. ..
Total non-current assets .. .. ..
TOTAL ASSETS .. .. ..
CURRENT LIABILITIES
Payables .. .. ..
Transfers to Government payable .. .. ..
Accrued employee benefits .. .. ..
Interest bearing liabilities and derivatives .. .. ..
Provisions .. .. ..
Other .. .. ..
Total current liabilities .. .. ..
NON-CURRENT LIABILITIES
Payables .. .. ..
Accrued employee benefits .. .. ..
Interest bearing liabilities and derivatives .. .. ..
Provisions .. .. ..
Other .. .. ..
Total non-current liabilities .. .. ..
TOTAL LIABILITIES .. .. ..
NET ASSETS/(LIABILITIES) .. .. ..
EQUITY
TOTAL EQUITY .. .. ..
2018-19 Queenland State Budget - Service Delivery Statements - Department of Innovation,Tourism Industry Development and the Commonwealth Games
22

Administered cash flow statement
Department of Innovation, Tourism Industry Development and the Commonwealth Games
Notes 2017-18 Budget
$'000
2017-18 Est. Act.
$'000
2018-19 Budget
$'000
CASH FLOWS FROM OPERATING ACTIVITIES
Inflows:
Appropriation receipts 63,64,65 623,869 625,872 107,889
User charges and fees .. .. ..
Royalties and land rent receipts .. .. ..
Grants and other contributions .. .. ..
Interest received .. .. ..
Taxes .. .. ..
Other .. .. ..
Outflows:
Employee costs .. .. ..
Supplies and services .. .. ..
Grants and subsidies 63,64,65 (623,869) (625,872) (107,889)
Borrowing costs .. .. ..
Other .. .. ..
Transfers to Government .. .. ..
Net cash provided by or used in operating activities .. .. ..
CASH FLOWS FROM INVESTING ACTIVITIES
Inflows:
Sales of non-financial assets .. .. ..
Investments redeemed .. .. ..
Loans and advances redeemed .. .. ..
Outflows:
Payments for non-financial assets .. .. ..
Payments for investments .. .. ..
Loans and advances made .. .. ..
Net cash provided by or used in investing activities .. .. ..
CASH FLOWS FROM FINANCING ACTIVITIES
Inflows:
Borrowings .. .. ..
Equity injections .. .. ..
Outflows:
Borrowing redemptions .. .. ..
Finance lease payments .. .. ..
Equity withdrawals .. .. ..
Net cash provided by or used in financing activities .. .. ..
Net increase/(decrease) in cash held .. .. ..
Cash at the beginning of financial year .. .. ..
Cash transfers from restructure .. .. ..
Cash at the end of financial year .. .. ..
2018-19 Queenland State Budget - Service Delivery Statements - Department of Innovation,Tourism Industry Development and the Commonwealth Games
23

Income statementMajor variations between 2017-18 Adjusted Budget and 2017-18 Estimated Actual include:
1. The decrease relates largely to the realignment of revenue to match anticipated expenses for Aviation Boost,Advancing Small Business Queensland Strategy (ASBQS), Tourism Demand Driver Infrastructure (TDDI)programs, the Advance Queensland initiatives including Advance Queensland: Connecting with Asia Strategy(AQCA), Innovation Projects, and the Special Projects Unit (SPU) for Global Tourism Hubs and Integrated ResortDevelopments. This is partially offset by new funding for Advance Queensland.
2. The increase principally relates to funding received for delivery of the Business Advisory Services for the Taxi andLimousine Industry Grant Program and an increase for Services Received Below Fair Value for the GC2018 forstaff seconded to the Office of the Commonwealth Games (OCG) to deliver the GC2018 through the Whole ofGovernment Resource Sharing Model (WOGRSM) process (see note 6 for the corresponding expense). This ispartially offset by a reduction in contributions towards CG2018 from the City of Gold Coast (CGC).
3. The decrease principally relates to a realignment of staffing requirements within the OCG to deliver the GC2018.
4. The decrease relates largely to the realignment to match the timing of anticipated expenditure for the GC2018,and SPU.
5. The increase principally relates to new expenditure for Advance Queensland and an increase of additionaloperating grants required to deliver the GC2018. This is partially offset by the realignment of planned operatinggrants expenditure for the Aviation Boost, ASBQS and AQCA programs. Additionally, it is also impacted byadjustments due to transfers in and out with the implementation of machinery-of-government changes.
6. The increase relates to Services Received Below Fair Value for staff seconded to the OCG to deliver the GC2018through the WOGRSM process (see note 2 for the corresponding revenue).
7. This variance is due to the timing of machinery-of-government transfer relating to the Advance Queensland ValleyPrecinct Initiative rental incentives arrangement.
Major variations between 2017-18 Adjusted Budget and 2018-19 Budget include:
8. The decrease principally relates to the reduction of funding for the CG2018. This is partially offset by the matching of funding to anticipated expenditure for existing Aviation Boost, AQCA programs, Advance Queensland andInnovation projects. Additional funding has been provided for Major Events Funding (MEF),the Great Barrier ReefIsland Rejuvenation Package (GBRIRP), Great Keppel Island Recovery Package (GKIRP), Museum ofUnderwater Art (MUA) and Advance Queensland as part of Election Commitments. This is also impacted byadjustments due to the implementation of machinery-of-government changes.
9. The decrease principally relates to the cessation of funding for the GC2018 venues from the CGC. It also includesthe cessation of Services Received Below Fair Value for staff seconded to the OCG to deliver the GC2018through the WOGRSM process (see note 12 for the corresponding expense).
10. The decrease principally relates to a reduction for staffing within the OCG. This is partially offset by adjustmentsdue to the implementation of machinery-of-government changes.
11. The decrease primarily relates to the reduction in funding for the GC2018. This is partially offset by a realignmentof expenditure for the Growing Tourism, Growing Tourism Jobs (GTGTJ) program, new expenditure for AdvanceQueensland and is also impacted by adjustments due to the implementation of machinery-of-governmentchanges.
12. The decrease principally relates to the reduction of operating grants required to deliver the GC2018. This ispartially offset by additional expenses for MEF, GTGTJ, GBRIRP, GKIRP, MUA, Advance Queensland andrealignments for the Aviation Boost and AQCA programs. This is also impacted by adjustments due to theimplementation of machinery-of-government changes.
13. The decrease relates to cessation of Services Received Below Fair Value for staff seconded to the OCG todeliver the GC2018 through the WOGRSM process (see note 8 for the corresponding revenue).
14. This variance is due to the timing of machinery-of-government transfer relating to the Advance Queensland ValleyPrecinct Initiative rental incentives arrangement.
Explanation of variances in the financial statements
2018-19 Queenland State Budget - Service Delivery Statements - Department of Innovation,Tourism Industry Development and the Commonwealth Games
24

Major variations between 2017-18 Estimated Actual and the 2018-19 Budget include:
15. The decrease principally relates to the reduction of funding for the CG2018. This is partially offset by the matching of funding to anticipated expenditure for existing Aviation Boost, AQCA programs, Advance Queensland and Innovation projects. New funding has been provided for MEF, the GBRIRP, GKIRP, MUA and Advance Queensland. This is also impacted by adjustments due to the implementation of machinery-of-government changes.
16. The decrease principally relates to the cessation of funding for the GC2018 venues from the CGC. It also includes the cessation of Services Received Below Fair Value for staff seconded to the OCG to deliver the GC2018 through the WOGRSM process (see note 18 for the corresponding expense).
17. The decrease principally relates to a reduction for staffing within the OCG. This is partially offset by adjustments due to the implementation of machinery-of-government changes.
18. The decrease primarily relates to the reduction in funding for the GC2018. This is partially offset by a realignment of expenditure for the GTGTJ program, new expenditure for Advance Queensland and is also impacted by adjustments due to the implementation of machinery-of-government changes.
19. The decrease principally relates to the reduction of operating grants required to deliver the GC2018. This is partially offset by new expenditure allocations for MEF, GTGTJ, GBRIRP, GKIRP, MUA, Advance Queensland and realignments for the Aviation Boost and AQCA programs. This is also impacted by adjustments due to the implementation of machinery-of-government changes.
20. The decrease relates to cessation of Services Received Below Fair Value for staff seconded to the OCG to deliver the GC2018 through the WOGRSM process (see note 14 for the corresponding revenue).
Balance sheetMajor variations between 2017-18 Adjusted Budget and 2017-18 Estimated Actual include:
21. The increase is due to the implementation of machinery-of-government changes.
22. The increase is due to machinery-of-government changes for operating receivables and employee related receivables.
23. The increase is due to machinery-of-government changes for Leasehold Improvements and office equipment.
24. The increase is due to machinery-of-government changes for the Advance Queensland Valley Precinct initiative.
25. The increase is due to machinery-of-government changes for operating payables and employee related payables.
26. The increase is due to machinery-of-government changes for the Advance Queensland Valley Precinct initiative.
27. The increase is due to the implementation of machinery-of-government changes.
Major variations between 2017-18 Adjusted Budget and 2018-19 Budget include:
28. The increase is due to the implementation of machinery-of-government changes.
29. The increase is due to machinery-of-government changes for operating receivables and employee related receivables.
30. The increase is due to machinery-of-government changes for Leasehold Improvements and office equipment.
31. The increase is due to machinery-of-government changes for the Advance Queensland Valley Precinct initiative.
32. The increase is due to machinery-of-government changes for operating payables and employee related payables.
33. The increase is due to machinery-of-government changes for the Advance Queensland Valley Precinct initiative.
34. The increase is due to the implementation of machinery-of-government changes.
Cash flow statementMajor variations between 2017-18 Adjusted Budget and 2017-18 Estimated Actual include:
35. The decrease relates largely to the realignment of revenue to match anticipated expenses for Aviation Boost, ASBQS, TDDI programs, the Advance Queensland initiatives including AQCA and Innovation Projects, and the SPU for Global Tourism Hubs and Integrated Resort Developments. This is partially offset by new funding for Advance Queensland.
2018-19 Queenland State Budget - Service Delivery Statements - Department of Innovation,Tourism Industry Development and the Commonwealth Games
25
36. The increase principally relates to funding received for delivery of the Business Advisory Services for the Taxi andLimousine Industry Grant Program. This is partially offset by a reduction in contributions towards CG2018 fromthe City of Gold Coast (CGC).
37. The decrease principally relates to a realignment of staffing requirements within the OCG to deliver the GC2018.
38. The decrease relates largely to the realignment to match the timing of anticipated expenditure for the GC2018,and SPU.
39. The increase principally relates to new expenditure for Advance Queensland and an increase of additionaloperating grants required to deliver the GC2018. This is partially offset by the realignment of planned operatinggrants expenditure for the Aviation Boost, ASBQS and AQCA programs. Additionally, it is also impacted byadjustments due to transfers in and out with the implementation of machinery-of-government changes.
40. The variance principally relates to a planned reduction in GC2018 venues capital expenditure for the CarraraStadium.
41. The increase is due to the implementation of machinery-of-government changes.
42. The decrease is due to the implementation of machinery-of-government changes.
Major variations between 2017-18 Adjusted Budget and 2018-19 Budget include:
43. The decrease principally relates to the reduction of funding for the CG2018. This is partially offset by the matching of funding to anticipated expenditure for existing Aviation Boost, AQCA programs, Advance Queensland andInnovation projects. Additional funding has been provided for MEF, the GBRIRP, GKIRP, MUA and AdvanceQueensland as part of Election Commitments. This is also impacted by adjustments due to the implementation ofmachinery-of-government changes.
44. The increase is due to the implementation of machinery-of-government changes.
45. The decrease principally relates to the cessation of funding for the GC2018 venues from the CGC.
46. The decrease principally relates to a reduction for staffing within the OCG. This is partially offset by adjustmentsdue to the implementation of machinery-of-government changes.
47. The decrease primarily relates to the reduction in funding for the GC2018. This is partially offset by a realignmentof expenditure for the Growing Tourism, Growing Tourism Jobs (GTGTJ) program, new expenditure for AdvanceQueensland and is also impacted by adjustments due to the implementation of machinery-of-governmentchanges.
48. The decrease principally relates to the reduction of operating grants required to deliver the GC2018. This ispartially offset by additional expenses for MEF, GTGTJ, GBRIRP, GKIRP, MUA, Advance Queensland andrealignments for the Aviation Boost and AQCA programs. This is also impacted by adjustments due to theimplementation of machinery-of-government changes.
49. The decrease principally relates to a planned reduction in GC2018 venues capital expenditure for the CarraraStadium and the implementation of machinery-of-government changes.
50. The increase is due to the implementation of machinery-of-government changes.
Major variations between 2017-18 Estimated Actual and the 2018-19 Budget include:
51. The decrease principally relates to the reduction of funding for the CG2018. This is partially offset by the matching of funding to anticipated expenditure for existing Aviation Boost, AQCA programs, Advance Queensland andInnovation projects. New funding has been provided for MEF,the GBRIRP, GKIRP, MUA and AdvanceQueensland. This is also impacted by adjustments due to the implementation of machinery-of-governmentchanges.
52. The increase is due to transfers in with the implementation of machinery-of-government adjustments.
53. The decrease principally relates to the cessation of funding for the GC2018 venues from the CGC.
54. The decrease principally relates to a reduction for staffing within the OCG. This is partially offset by adjustmentsdue to the implementation of machinery-of-government changes.
55. The decrease primarily relates to the reduction in funding for the GC2018. This is partially offset by a realignmentof expenditure for the GTGTJ program, new expenditure for Advance Queensland and is also impacted byadjustments due to the implementation of machinery-of-government changes.
56. The decrease principally relates to the reduction of operating grants required to deliver the GC2018. This ispartially offset by new expenditure allocations for MEF, GTGTJ, GBRIRP, GKIRP, MUA, Advance Queenslandand realignments for the Aviation Boost and AQCA programs. This is also impacted by adjustments due to theimplementation of machinery-of-government changes.
2018-19 Queenland State Budget - Service Delivery Statements - Department of Innovation,Tourism Industry Development and the Commonwealth Games
26

57. The variance principally relates to a planned reduction in GC2018 venues capital expenditure for the CarraraStadium.
58. The decrease principally relates to a planned reduction in GC2018 venues capital expenditure for the CarraraStadium and the implementation of machinery-of-government changes.
59. The increase is due to the implementation of machinery-of-government changes.
Administered income statementMajor variations between 2017-18 Budget and 2017-18 Estimated Actual include:
60. The increase principally relates to a realignment for Gold Coast 2018 Commonwealth Games Corporation(GOLDOC) for costs in 2017-18 relating to event preparation and is partially offset by a realignment from 2017-18to 2018-19 for Tourism and Events Queensland (TEQ) to match cashflows to known commitments for tourismcampaigns and events.
Major variations between 2017-18 Budget and 2018-19 Budget include:
61. The decrease relates to the cessation of funding for GOLDOC.
Major variations between 2017-18 Estimated Actual and the 2018-19 Budget include:
62. The decrease relates to the cessation of funding for GOLDOC.
Administered cash flow statementMajor variations between 2017-18 Budget and 2017-18 Estimated Actual include:
63. The increase principally relates to a realignment for GOLDOC for costs in 2017-18 relating to event preparationand is partially offset by a realignment from 2017-18 to 2018-19 for TEQ to match cashflows to knowncommitments for tourism campaigns and events.
Major variations between 2017-18 Budget and 2018-19 Budget include:
64. The decrease relates to the cessation of funding for GOLDOC.
Major variations between 2017-18 Estimated Actual and the 2018-19 Budget include:
65. The decrease relates to the cessation of funding for GOLDOC.
2018-19 Queenland State Budget - Service Delivery Statements - Department of Innovation,Tourism Industry Development and the Commonwealth Games
27

Statutory bodies
Gold Coast 2018 Commonwealth Games Corporation
Overview
Gold Coast 2018 Commonwealth Games Corporation (GOLDOC) was established on 1 January 2012 under the Commonwealth Games Arrangements Act 2011 to plan, organise and deliver the Gold Coast 2018 Commonwealth Games (GC2018).
In delivering GC2018, GOLDOC contributed to the Queensland Government's objectives of:
creating jobs in a strong economy by:
- helping to stimulate economic growth and innovation by working with our government and non-governmentpartners to promote Queensland tourism as part of the GC2018 experience
- supporting the delivery of new infrastructure and investment by working with our government andnon-government partners to make the most of the opportunities presented by GC2018
keeping Queenslanders healthy by:
- encouraging Queenslanders to get involved in sport and maintain a healthy lifestyle through the promotion ofGC2018 in schools via the School Connect program
- engaged and trained 15,000 volunteers
being a responsive Government by:
- engaging and harnessing communities and local industry to participate in Games related activities.
Service summary
With the Games now delivered, GOLDOC will be dissolved and through the year 2018-19 GOLDOC’s activities and transactions will be decommissioned.
Key strategic priorities to ensure the completion of the post-GC2018 obligations include:
finalising all staff contracts
closing all commercial and procurement contracts
completing the financial accounts and auditing requirements
transferring and handing over information and physical assets to legacy custodians
winding-up GOLDOC as required under the Commonwealth Games Arrangements Act 2011.
2018-19 Queenland State Budget - Service Delivery Statements - Department of Innovation,Tourism Industry Development and the Commonwealth Games
28

Service performance
Performance statement
Gold Coast 2018 Commonwealth Games Corporation (GOLDOC)
Service area objective
To plan, organise and deliver the Gold Coast 2018 Commonwealth Games (GC2018) in conjunction with Commonwealth Games Australia (CGA), the Commonwealth Games Federation (CGF), the City of Gold Coast (CGC), the Office of the Commonwealth Games (OCG) within the department, and the Australian Government.
Service area description
GOLDOC was responsible for planning, organising and conducting GC2018. GOLDOC did this in conjunction with the CGA, the CGF, the OCG and the CGC. Its role also included the promotion, marketing and the commercial and financial management of GC2018.
Gold Coast 2018 Commonwealth Games Corporation
Notes 2017-18
Target/Est.
2017-18
Est. Actual
2018-19
Target/Est.
Service area: Gold Coast 2018 Commonwealth Games Corporation 1
Service standards
Effectiveness measures
CGF’s level of satisfaction with preparedness for GC2018 2, 3 Satisfied Satisfied ..
Level of target markets engagement in GC2018 3, 4 65% 57% ..
Efficiency measure
Percentage of total GC2018 commercial revenue target contracted 3, 5 100% 96% ..
Notes:
1. GOLDOC will continue to function until 31 December 2018 when it is planned to be dissolved.
2. This assessment of satisfaction is undertaken by a comprehensive external assessment of progress against an extensive list of requirements compiled from the experience of previous Commonwealth Games and the host city bid proposal and schedules. The assessment is made by the international oversight body, the CGF. This service standard was shared by GOLDOC which was responsible for planning the delivery of the actual event and the department which was responsible for coordinating the necessary infrastructure and government services to support GC2018.
3. 2018-19 Target/Estimate has not been published due to the completion of the Games in 2017-18 and subsequent dissolution of GOLDOC.
4. Given the Games has now passed, engagement can now be measured by the number of tickets sold (over 1.2 million, 98 per cent of all tickets), social media engagement (over 1.5 million followers) and spectator satisfaction of their experience with the Games (92 per cent of spectators stated their overall experience was good or very good).
5. The 2017-18 Estimated Actual figures are based on actual performance up to 30 April 2018. Final negotiations and reconciliations of key commercial revenue contracts are on-going and are not expected to be completely closed out until 30 June 2018.
2018-19 Queenland State Budget - Service Delivery Statements - Department of Innovation,Tourism Industry Development and the Commonwealth Games
29

Staffing1
Gold Coast 2018 Commonwealth Games Corporation
Notes 2017-18
Budget
2017-18
Est. Actual
2018-19
Budget
Gold Coast 2018 Commonwealth Games Corporation (GOLDOC) 2, 3, 4 867 58 ..
Notes:
1. Full-time equivalents (FTEs) as at 30 June.
2. The 2017-18 Budget number reflected FTEs averaged over the reporting period, as GOLDOC is a limited life statutory body with short term employees recruited progressively.
3. The 2017-18 Estimated Actual reflects the FTEs as at 30 June during GOLDOC’s dissolution phase, after delivering GC2018 in April 2018.
4. The 2018-19 Budget reflects GOLDOC’s planned dissolution by 31 December 2018.
2018-19 Queenland State Budget - Service Delivery Statements - Department of Innovation,Tourism Industry Development and the Commonwealth Games
30

Income statement
Gold Coast 2018 Commonwealth Games Corporation
Notes 2017-18 Budget
$'000
2017-18 Est. Act.
$'000
2018-19 Budget
$'000
INCOME
Taxes .. .. ..
User charges and fees 1,8,15 221,304 235,080 3,323
Grants and other contributions 2,9,16 524,973 535,450 1,000
Interest 1,746 3,542 ..
Other revenue 157 488 ..
Gains on sale/revaluation of assets .. 23 1
Total income 748,180 774,583 4,324
EXPENSES
Employee expenses 10,17 100,423 104,122 1,164
Supplies and services 3,11,18 652,210 714,658 3,664
Grants and subsidies 4,19 .. 13,254 ..
Depreciation and amortisation 5,12,20 11,938 16,650 ..
Finance/borrowing costs .. .. ..
Other expenses 6,13,21 298 532 77
Losses on sale/revaluation of assets 4 .. ..
Total expenses 764,873 849,216 4,905
OPERATING SURPLUS/(DEFICIT) 7,14,22 (16,693) (74,633) (581)
2018-19 Queenland State Budget - Service Delivery Statements - Department of Innovation,Tourism Industry Development and the Commonwealth Games
31
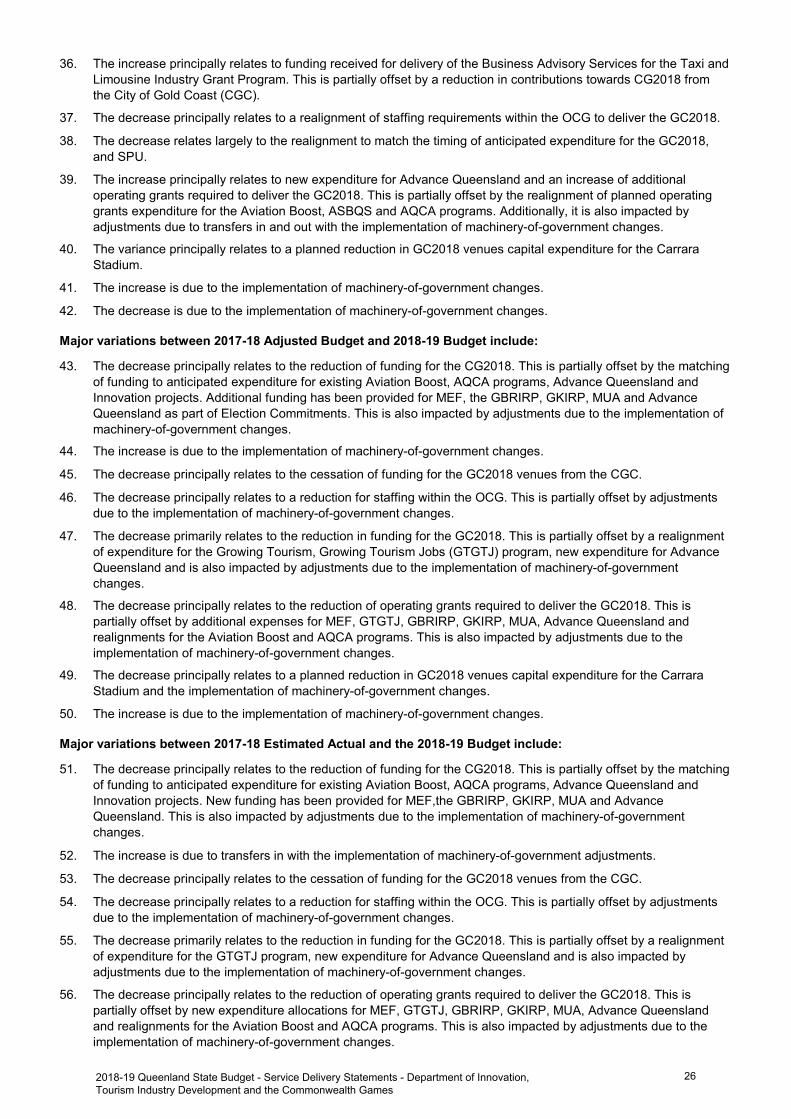
Balance sheet
Gold Coast 2018 Commonwealth Games Corporation
Notes 2017-18 Budget
$'000
2017-18 Est. Act.
$'000
2018-19 Budget
$'000
CURRENT ASSETS
Cash assets 23,28,31 3,183 4,963 ..
Receivables 24,29 1,282 .. ..
Other financial assets (1) .. ..
Inventories .. .. ..
Other 532 533 ..
Non-financial assets held for sale .. .. ..
Total current assets 4,996 5,496 ..
NON-CURRENT ASSETS
Receivables .. .. ..
Other financial assets .. .. ..
Property, plant and equipment .. .. ..
Intangibles .. .. ..
Other .. .. ..
Total non-current assets .. .. ..
TOTAL ASSETS 4,996 5,496 ..
CURRENT LIABILITIES
Payables 25,32 59 2,652 ..
Accrued employee benefits 26,33 .. 2,262 ..
Interest bearing liabilities and derivatives .. 1 ..
Provisions .. .. ..
Other .. .. ..
Total current liabilities 59 4,915 ..
NON-CURRENT LIABILITIES
Payables .. .. ..
Accrued employee benefits .. .. ..
Interest bearing liabilities and derivatives .. .. ..
Provisions .. .. ..
Other .. .. ..
Total non-current liabilities .. .. ..
TOTAL LIABILITIES 59 4,915 ..
NET ASSETS/(LIABILITIES) 4,937 581 ..
EQUITY
TOTAL EQUITY 27,30,34 4,937 581 ..
2018-19 Queenland State Budget - Service Delivery Statements - Department of Innovation,Tourism Industry Development and the Commonwealth Games
32

Cash flow statement
Gold Coast 2018 Commonwealth Games Corporation
Notes 2017-18 Budget
$'000
2017-18 Est. Act.
$'000
2018-19 Budget
$'000
CASH FLOWS FROM OPERATING ACTIVITIES
Inflows:
User charges and fees 35,42,49 155,413 180,547 3,355
Grants and other contributions 36,43,50 524,973 535,450 1,000
Interest received 1,746 3,826 ..
Taxes .. .. ..
Other 37,44,51 60,702 66,704 300
Outflows:
Employee costs 45,52 (103,557) (108,660) (3,426)
Supplies and services 38,46,53 (712,769) (781,198) (6,083)
Grants and subsidies 39,54 .. (13,254) ..
Borrowing costs .. .. ..
Other 40,47,55 (10,661) (15,910) (109)
Net cash provided by or used in operating activities (84,153) (132,495) (4,963)
CASH FLOWS FROM INVESTING ACTIVITIES
Inflows:
Sales of non-financial assets .. .. ..
Investments redeemed .. .. ..
Loans and advances redeemed .. .. ..
Outflows:
Payments for non-financial assets 41,48,56 (1,853) (4,598) ..
Payments for investments .. .. ..
Loans and advances made .. .. ..
Net cash provided by or used in investing activities (1,853) (4,598) ..
CASH FLOWS FROM FINANCING ACTIVITIES
Inflows:
Borrowings .. .. ..
Equity injections .. .. ..
Outflows:
Borrowing redemptions .. .. ..
Finance lease payments .. .. ..
Equity withdrawals .. .. ..
Net cash provided by or used in financing activities .. .. ..
Net increase/(decrease) in cash held (86,006) (137,093) (4,963)
Cash at the beginning of financial year 89,189 142,056 4,963
Cash transfers from restructure .. .. ..
Cash at the end of financial year 3,183 4,963 ..
2018-19 Queenland State Budget - Service Delivery Statements - Department of Innovation,Tourism Industry Development and the Commonwealth Games
33
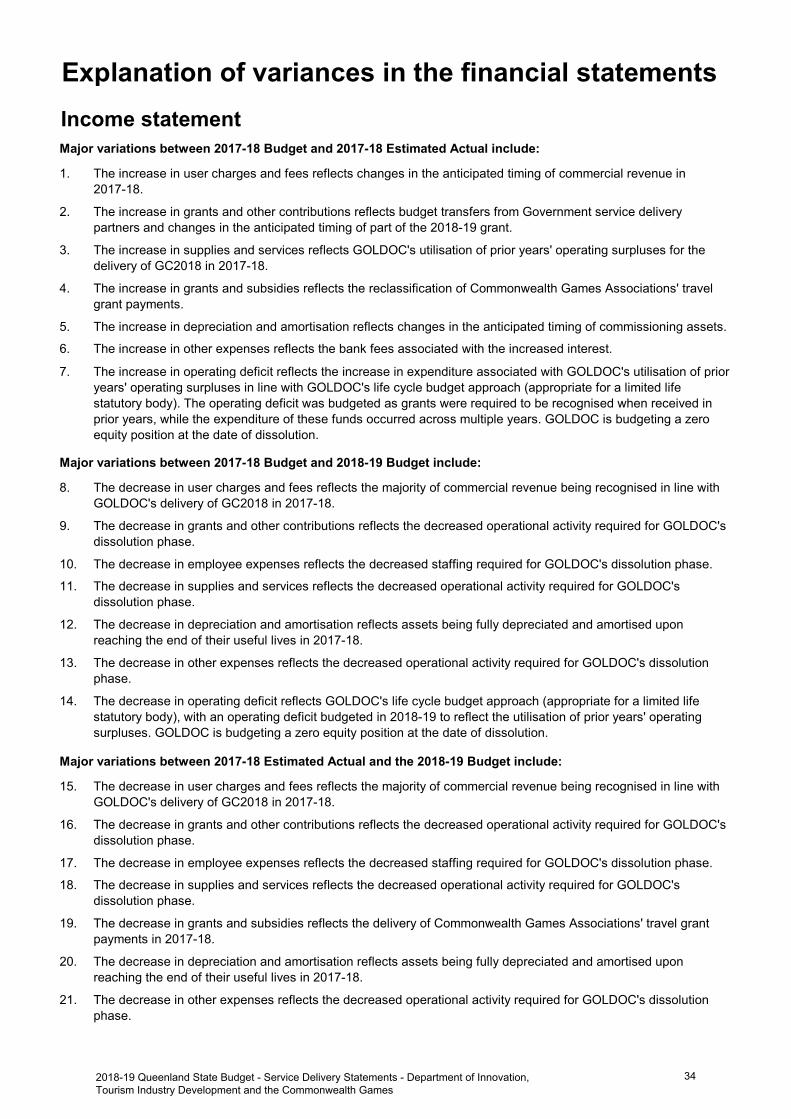
Income statementMajor variations between 2017-18 Budget and 2017-18 Estimated Actual include:
1. The increase in user charges and fees reflects changes in the anticipated timing of commercial revenue in 2017-18.
2. The increase in grants and other contributions reflects budget transfers from Government service delivery partners and changes in the anticipated timing of part of the 2018-19 grant.
3. The increase in supplies and services reflects GOLDOC's utilisation of prior years' operating surpluses for the delivery of GC2018 in 2017-18.
4. The increase in grants and subsidies reflects the reclassification of Commonwealth Games Associations' travel grant payments.
5. The increase in depreciation and amortisation reflects changes in the anticipated timing of commissioning assets.
6. The increase in other expenses reflects the bank fees associated with the increased interest.
7. The increase in operating deficit reflects the increase in expenditure associated with GOLDOC's utilisation of prior years' operating surpluses in line with GOLDOC's life cycle budget approach (appropriate for a limited life statutory body). The operating deficit was budgeted as grants were required to be recognised when received in prior years, while the expenditure of these funds occurred across multiple years. GOLDOC is budgeting a zero equity position at the date of dissolution.
Major variations between 2017-18 Budget and 2018-19 Budget include:
8. The decrease in user charges and fees reflects the majority of commercial revenue being recognised in line with GOLDOC's delivery of GC2018 in 2017-18.
9. The decrease in grants and other contributions reflects the decreased operational activity required for GOLDOC's dissolution phase.
10. The decrease in employee expenses reflects the decreased staffing required for GOLDOC's dissolution phase.
11. The decrease in supplies and services reflects the decreased operational activity required for GOLDOC's dissolution phase.
12. The decrease in depreciation and amortisation reflects assets being fully depreciated and amortised upon reaching the end of their useful lives in 2017-18.
13. The decrease in other expenses reflects the decreased operational activity required for GOLDOC's dissolution phase.
14. The decrease in operating deficit reflects GOLDOC's life cycle budget approach (appropriate for a limited life statutory body), with an operating deficit budgeted in 2018-19 to reflect the utilisation of prior years' operating surpluses. GOLDOC is budgeting a zero equity position at the date of dissolution.
Major variations between 2017-18 Estimated Actual and the 2018-19 Budget include:
15. The decrease in user charges and fees reflects the majority of commercial revenue being recognised in line with GOLDOC's delivery of GC2018 in 2017-18.
16. The decrease in grants and other contributions reflects the decreased operational activity required for GOLDOC's dissolution phase.
17. The decrease in employee expenses reflects the decreased staffing required for GOLDOC's dissolution phase.
18. The decrease in supplies and services reflects the decreased operational activity required for GOLDOC's dissolution phase.
19. The decrease in grants and subsidies reflects the delivery of Commonwealth Games Associations' travel grant payments in 2017-18.
20. The decrease in depreciation and amortisation reflects assets being fully depreciated and amortised upon reaching the end of their useful lives in 2017-18.
21. The decrease in other expenses reflects the decreased operational activity required for GOLDOC's dissolution phase.
Explanation of variances in the financial statements
2018-19 Queenland State Budget - Service Delivery Statements - Department of Innovation,Tourism Industry Development and the Commonwealth Games
34

22. The decrease in operating deficit reflects GOLDOC's life cycle budget approach (appropriate for a limited life statutory body), with an operating deficit budgeted in 2018-19 to reflect the utilisation of prior years' operating surpluses. GOLDOC is budgeting a zero equity position at the date of dissolution.
Balance sheetMajor variations between 2017-18 Budget and 2017-18 Estimated Actual include:
23. The increase in cash assets reflects changes in the anticipated timing of receivables and payables in 2017-18.
24. The decrease in current receivables reflects the anticipated timing of Goods and Services Tax (GST) collectible from the Australian Taxation Office (ATO) being received in 2017-18.
25. The increase in current payables reflects changes in the anticipated timing of supplier payments planned for 2017-18 being payable in 2018-19.
26. The increase in current accrued employee benefits reflects changes to the anticipated timing of employee entitlement payments planned for 2017-18 being payable in 2018-19.
27. The decrease in total equity reflects the increase in expenditure associated with GOLDOC's utilisation of prior year operating surpluses in line with GOLDOC's life cycle budget approach (appropriate for a limited life statutory body). GOLDOC is budgeting a zero equity position at the date of dissolution.
Major variations between 2017-18 Budget and 2018-19 Budget include:
28. The decrease in cash assets reflects GOLDOC's anticipated dissolution in 2018-19.
29. The decrease in current receivables reflects revenue to be fully received prior to GOLDOC's anticipated dissolution in 2018-19.
30. The decrease in total equity reflects GOLDOC's utilisation of prior years' operating surpluses in line with GOLDOC's life cycle budget approach (appropriate for a limited life statutory body). GOLDOC is budgeting a zero equity position at the date of dissolution.
Major variations between 2017-18 Estimated Actual and the 2018-19 Budget include:
31. The decrease in cash assets reflects GOLDOC's anticipated dissolution in 2018-19.
32. The decrease in current payables reflects supplier payments to be fully paid prior to GOLDOC's anticipated dissolution in 2018-19.
33. The decrease in current accrued employee benefits reflects employee entitlements to be fully paid prior to GOLDOC's anticipated dissolution in 2018-19.
34. The decrease in total equity reflects GOLDOC's utilisation of prior years' operating surpluses in line with GOLDOC's life cycle budget approach (appropriate for a limited life statutory body). GOLDOC is budgeting a zero equity position at the date of dissolution.
Cash flow statementMajor variations between 2017-18 Budget and 2017-18 Estimated Actual include:
35. The increase in inflows for user charges and fees reflects changes in the anticipated timing of commercial revenue in 2017-18.
36. The increase in grants and other contributions reflects budget transfers from Government service delivery partners and part of a grant being received in 2017-18 when anticipated to be receivable in 2018-19.
37. The increase in other operating inflows reflects changes in the anticipated timing of GST collectible from the ATO for supplies and services in 2017-18.
38. The increase in supplies and services reflects GOLDOC's utilisation of prior years' operating surpluses for the delivery of GC2018 in 2017-18.
39. The increase in grants and subsidies reflects the reclassification of Commonwealth Games Associations' travel grant payments.
40. The increase in other operating outflows reflects changes in the anticipated timing of GST payable to the ATO for commercial revenues in 2017-18.
41. The increase in outflows for payments for non-financial assets reflects the reclassification of plant and equipment and intangibles asset costs as capital expenditure.
2018-19 Queenland State Budget - Service Delivery Statements - Department of Innovation,Tourism Industry Development and the Commonwealth Games
35
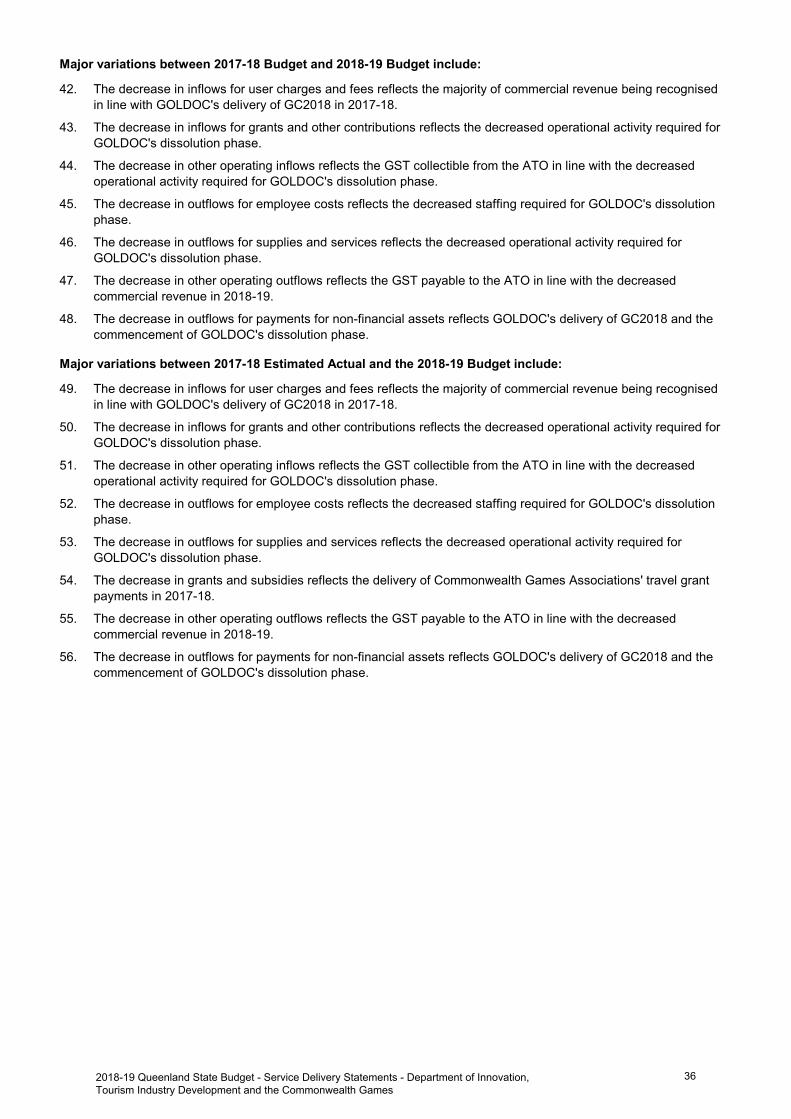
Major variations between 2017-18 Budget and 2018-19 Budget include:
42. The decrease in inflows for user charges and fees reflects the majority of commercial revenue being recognised in line with GOLDOC's delivery of GC2018 in 2017-18.
43. The decrease in inflows for grants and other contributions reflects the decreased operational activity required for GOLDOC's dissolution phase.
44. The decrease in other operating inflows reflects the GST collectible from the ATO in line with the decreased operational activity required for GOLDOC's dissolution phase.
45. The decrease in outflows for employee costs reflects the decreased staffing required for GOLDOC's dissolution phase.
46. The decrease in outflows for supplies and services reflects the decreased operational activity required for GOLDOC's dissolution phase.
47. The decrease in other operating outflows reflects the GST payable to the ATO in line with the decreased commercial revenue in 2018-19.
48. The decrease in outflows for payments for non-financial assets reflects GOLDOC's delivery of GC2018 and the commencement of GOLDOC's dissolution phase.
Major variations between 2017-18 Estimated Actual and the 2018-19 Budget include:
49. The decrease in inflows for user charges and fees reflects the majority of commercial revenue being recognised in line with GOLDOC's delivery of GC2018 in 2017-18.
50. The decrease in inflows for grants and other contributions reflects the decreased operational activity required for GOLDOC's dissolution phase.
51. The decrease in other operating inflows reflects the GST collectible from the ATO in line with the decreased operational activity required for GOLDOC's dissolution phase.
52. The decrease in outflows for employee costs reflects the decreased staffing required for GOLDOC's dissolution phase.
53. The decrease in outflows for supplies and services reflects the decreased operational activity required for GOLDOC's dissolution phase.
54. The decrease in grants and subsidies reflects the delivery of Commonwealth Games Associations' travel grant payments in 2017-18.
55. The decrease in other operating outflows reflects the GST payable to the ATO in line with the decreased commercial revenue in 2018-19.
56. The decrease in outflows for payments for non-financial assets reflects GOLDOC's delivery of GC2018 and the commencement of GOLDOC's dissolution phase.
2018-19 Queenland State Budget - Service Delivery Statements - Department of Innovation,Tourism Industry Development and the Commonwealth Games
36

Tourism and Events Queensland
Overview
Tourism and Events Queensland’s (TEQ) vision is to inspire the world to experience the best address on earth. The organisation's objectives are to attract visitors to Queensland, generate overnight visitor expenditure, contribute to the Queensland economy, enhance the profile of Queensland and foster community pride in Queensland.
TEQ contributes to the Queensland Government’s objectives of creating jobs in a strong economy; protecting the Great Barrier Reef; and being a responsive government by:
marketing and promoting tourism in Queensland
tourism experience and destination development
working to identify, attract and promote major events
providing support and leadership to Queensland's regional tourism organisation (RTO) network and industry.
Service summary
TEQ's focus areas for 2018-19 include:
showcasing Queensland's tourism and events experiences to key domestic and international markets through TEQ's experience-based marketing strategy. Marketing activity is delivered under the five pillars of: Reef, Islands, Beaches; Natural Encounters; Adventure and Discovery; Queensland Lifestyle, Culture and People; and Events. TEQ is working with Tourism Australia, Regional Tourism Organisations and industry to identify leverage opportunities under this strategy
working collaboratively with the Department of Innovation, Tourism Industry Development and the Commonwealth Games (DITID) to implement the Advancing Tourism 2016-2020: Growing Queensland Jobs strategy and the new Growing Tourism, Growing Tourism Jobs policy. This will include collaboration with the Attracting Tourism Fund and the Growing Tourism Infrastructure Program
focussing on the conversion of more high value travellers through the continued delivery of Queensland’s creative platform and fresh ‘Find your perfect next…’ marketing campaign
maximising the values of Queensland's events calendar through: attracting and securing anchor events for Queensland and strategically investing in events that deliver the greatest benefits across Queensland. Event highlights include: Mount Isa Mines Rotary Rodeo (60th anniversary), the Toowoomba Carnival of Flowers and the TV WEEK Logie Awards; high value business events such as Amway’s annual Leadership Seminar; and supporting regional tourism through TEQ’s Queensland Destination Events Program
leveraging the legacy of the Gold Coast 2018 Commonwealth Games to drive incremental tourism outcomes and secure future international events for Queensland
working in partnership with DITID, RTOs, industry, airports and airlines to successfully implement all aviation investment programs. TEQ will focus on supporting airports in the acquisition and/or expansion of services into Queensland, with strong destination messaging
delivering destination and experience development activities such as: reinforcing Queensland's competitive position through the Best of Queensland Experiences Program, encouraging and supporting the tourism industry to innovate and deliver quality visitor experiences, and supporting Queensland's RTOs
implementing activities to strengthen the tourism potential of the international education market in Queensland. During 2018-19 TEQ will continue to work with Trade and Investment Queensland to assist in implementing its International Education and Training Strategy to Advance Queensland 2016-2026.
2018-19 Queenland State Budget - Service Delivery Statements - Department of Innovation,Tourism Industry Development and the Commonwealth Games
37

Service performance
Performance statement
Tourism and Events Queensland
Service area objective
To achieve economic and social benefits for the State by growing the tourism and events industry in a partnership between industry and Government.
Service area description
Tourism and Events Queensland’s (TEQ) core functions are marketing, event acquisition and experience development.
Tourism and Events Queensland Notes 2017-18
Target/Est.
2017-18
Est. Actual
2018-19
Target/Est.
Service area: Tourism and Events Queensland
Service standards
Effectiveness measures
Overnight visitor expenditure generated by events within the TEQ portfolio $330 million $335 million
$370 million
Direct visitor nights generated by events within the TEQ portfolio 1,925,000 1,930,000 2,156,000
Direct and incremental spending generated by events within the TEQ portfolio $412.5 million $415 million $462 million
Visitors to Queensland generated by events within the TEQ portfolio 247,500 250,000 277,200
Publicity and promotional value generated by TEQ activities 1 $220 million $650 million $275 million
Value of collaborative support 2 $20 million $21 million $27 million
Efficiency measure
Efficient leverage of regional and strategic partnership investment 2 1:1 1:1 1:1
Notes:
1. TEQ-led activity in key international markets such as China and the publicity generated from the Gold Coast 2018 Commonwealth Games (GC2018) have contributed significantly to the strong publicity outcome for 2017-18. The publicity value generated by GC2018 activity is a one-off impact. The significant publicity value generated in key international markets such as China is difficult to predict and apply to future activity.
2. Collaborative value includes all direct, indirect, contra and in-kind partner support (valued in writing from partners and/or forming part of a formalised agreement) for tourism and event marketing and destination and experience development projects.
2018-19 Queenland State Budget - Service Delivery Statements - Department of Innovation,Tourism Industry Development and the Commonwealth Games
38

Staffing1
Tourism and Events Queensland Notes 2017-18
Budget
2017-18
Est. Actual
2018-19
Budget
Tourism and Events Queensland 2, 3 151 136 151
Notes:
1. Full-time equivalents (FTEs) as at 30 June.
2. The 2017-18 Estimated Actual is lower than anticipated due to a number of temporary vacancies.
3. The 2018-19 Budget includes a base FTE of 140 and eight temporary project positions to deliver activities under the $33.5 million Advance Queensland: Connecting with Asia strategy and three temporary project positions to deliver the additional $36 million for making Queensland Australia's events capital.
2018-19 Queenland State Budget - Service Delivery Statements - Department of Innovation,Tourism Industry Development and the Commonwealth Games
39
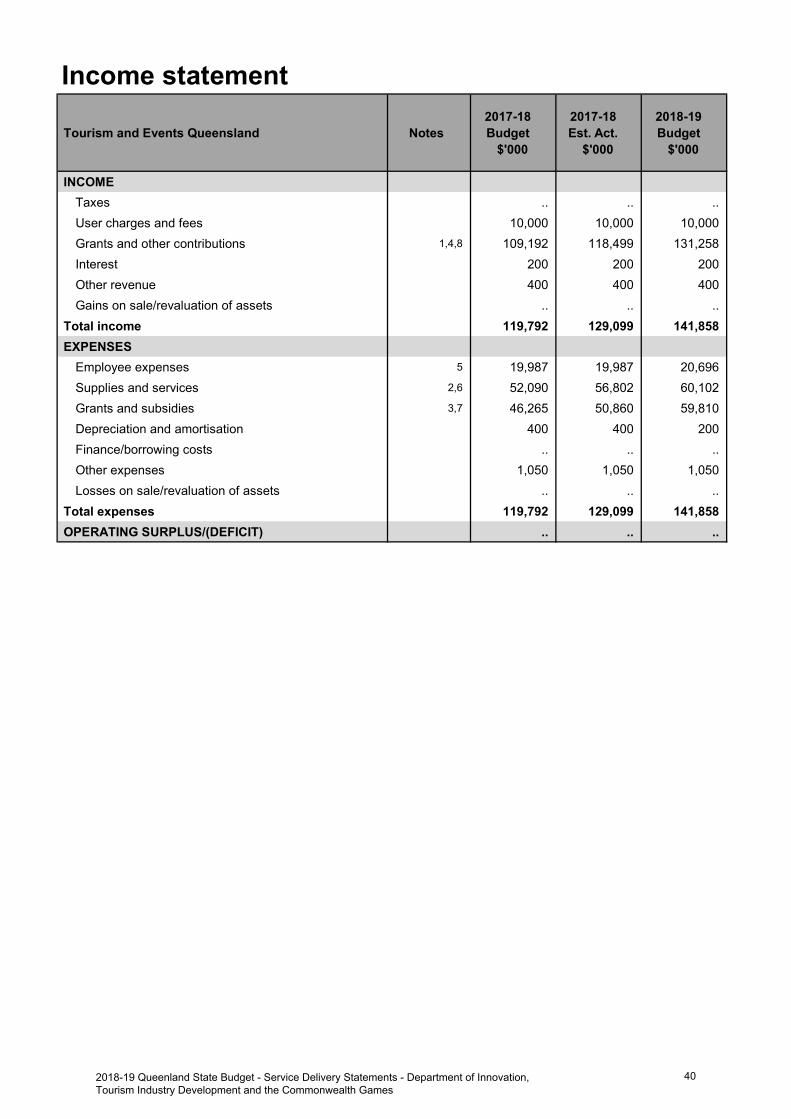
Income statement
Tourism and Events Queensland Notes 2017-18 Budget
$'000
2017-18 Est. Act.
$'000
2018-19 Budget
$'000
INCOME
Taxes .. .. ..
User charges and fees 10,000 10,000 10,000
Grants and other contributions 1,4,8 109,192 118,499 131,258
Interest 200 200 200
Other revenue 400 400 400
Gains on sale/revaluation of assets .. .. ..
Total income 119,792 129,099 141,858
EXPENSES
Employee expenses 5 19,987 19,987 20,696
Supplies and services 2,6 52,090 56,802 60,102
Grants and subsidies 3,7 46,265 50,860 59,810
Depreciation and amortisation 400 400 200
Finance/borrowing costs .. .. ..
Other expenses 1,050 1,050 1,050
Losses on sale/revaluation of assets .. .. ..
Total expenses 119,792 129,099 141,858
OPERATING SURPLUS/(DEFICIT) .. .. ..
2018-19 Queenland State Budget - Service Delivery Statements - Department of Innovation,Tourism Industry Development and the Commonwealth Games
40

Balance sheet
Tourism and Events Queensland Notes 2017-18 Budget
$'000
2017-18 Est. Act.
$'000
2018-19 Budget
$'000
CURRENT ASSETS
Cash assets 4,322 6,255 6,303
Receivables 3,421 2,504 2,714
Other financial assets 9 100 .. ..
Inventories .. .. ..
Other 10 94 349 352
Non-financial assets held for sale .. .. ..
Total current assets 7,937 9,108 9,369
NON-CURRENT ASSETS
Receivables .. .. ..
Other financial assets .. .. ..
Property, plant and equipment 355 279 179
Intangibles .. .. ..
Other .. 22 22
Total non-current assets 355 301 201
TOTAL ASSETS 8,292 9,409 9,570
CURRENT LIABILITIES
Payables 2,688 4,019 4,120
Accrued employee benefits 3,121 3,237 3,287
Interest bearing liabilities and derivatives .. .. ..
Provisions .. .. ..
Other 11 204 41 41
Total current liabilities 6,013 7,297 7,448
NON-CURRENT LIABILITIES
Payables 12 217 60 60
Accrued employee benefits 517 507 517
Interest bearing liabilities and derivatives .. .. ..
Provisions .. .. ..
Other .. .. ..
Total non-current liabilities 734 567 577
TOTAL LIABILITIES 6,747 7,864 8,025
NET ASSETS/(LIABILITIES) 1,545 1,545 1,545
EQUITY
TOTAL EQUITY 1,545 1,545 1,545
2018-19 Queenland State Budget - Service Delivery Statements - Department of Innovation,Tourism Industry Development and the Commonwealth Games
41

Cash flow statement
Tourism and Events Queensland Notes 2017-18 Budget
$'000
2017-18 Est. Act.
$'000
2018-19 Budget
$'000
CASH FLOWS FROM OPERATING ACTIVITIES
Inflows:
User charges and fees 9,602 9,602 9,802
Grants and other contributions 13,16,20 109,192 118,499 131,258
Interest received 200 200 200
Taxes .. .. ..
Other 388 388 388
Outflows:
Employee costs 17 (19,927) (19,927) (20,636)
Supplies and services 14,18 (52,192) (56,904) (60,004)
Grants and subsidies 15,19 (46,265) (50,860) (59,810)
Borrowing costs .. .. ..
Other (1,050) (1,050) (1,050)
Net cash provided by or used in operating activities (52) (52) 148
CASH FLOWS FROM INVESTING ACTIVITIES
Inflows:
Sales of non-financial assets .. .. ..
Investments redeemed .. .. ..
Loans and advances redeemed .. .. ..
Outflows:
Payments for non-financial assets (100) (100) (100)
Payments for investments .. .. ..
Loans and advances made .. .. ..
Net cash provided by or used in investing activities (100) (100) (100)
CASH FLOWS FROM FINANCING ACTIVITIES
Inflows:
Borrowings .. .. ..
Equity injections .. .. ..
Outflows:
Borrowing redemptions .. .. ..
Finance lease payments .. .. ..
Equity withdrawals .. .. ..
Net cash provided by or used in financing activities .. .. ..
Net increase/(decrease) in cash held (152) (152) 48
Cash at the beginning of financial year 4,474 6,407 6,255
Cash transfers from restructure .. .. ..
Cash at the end of financial year 4,322 6,255 6,303
2018-19 Queenland State Budget - Service Delivery Statements - Department of Innovation,Tourism Industry Development and the Commonwealth Games
42

Income statementMajor variations between 2017-18 Budget and 2017-18 Estimated Actual include:
1. The increase is primarily due to additional funding received from the State Government during 2017-18 under the Advance Queensland: Connecting with Asia Strategy, the Attracting Aviation Investment Fund and other special initiative grants.
2. The increase primarily reflects additional spend on marketing activities as a result of funding received under the Advance Queensland: Connecting with Asia Strategy and the Attracting Aviation Investment Fund.
3. The increase reflects the re-allocation of spend between event and marketing activities in line with anticipated program activity.
Major variations between 2017-18 Budget and 2018-19 Budget include:
4. The increase is primarily due to additional funding to be received from the State Government in 2018-19 under the Advance Queensland: Connecting with Asia Strategy, the Attracting Aviation Investment Fund and special initiative grant funding for event acquisition.
5. The increase primarily reflects the cost of additional temporary roles related to events initiatives in addition to agreed wage increases.
6. The increase primarily reflects additional spend on marketing activities as a result of funding to be received under the Advance Queensland: Connecting with Asia Strategy and the Attracting Aviation Investment Fund.
7. The increase primarily reflects additional event related grant spend as a result of special initiative grant funding to be received for event acquisition.
Major variations between 2017-18 Estimated Actual and the 2018-19 Budget include:
8. The increase is primarily due to special initiative grants that will be received from the State Government in 2018-19 relating to event acquisition and the deferral of grant funding of $2.5 million from 2017-18 to match the timing of anticipated program activity.
Balance sheetMajor variations between 2017-18 Budget and 2017-18 Estimated Actual include:
9. The decrease is as a result of lower than expected derivative financial instruments on hand at 30 June 2018.
10. The increase reflects expected prepayments relating to a small number of subscriptions and services with contracted payment in advance of service.
11. The decrease is primarily due to lower than expected unearned revenue at 30 June 2018.
12. The decrease reflects a reduction in lease incentive liabilities.
Cash flow statementMajor variations between 2017-18 Budget and 2017-18 Estimated Actual include:
13. The increase is primarily due to additional funding received from the State Government during 2017-18 under the Advance Queensland: Connecting with Asia Strategy, the Attracting Aviation Investment Fund and other special initiative grants.
14. The increase primarily reflects additional spend on marketing activities as a result of funding received under the Advance Queensland: Connecting with Asia Strategy and the Attracting Aviation Investment Fund.
15. The increase reflects the re-allocation of spend between event and marketing activities in line with anticipated program activity.
Major variations between 2017-18 Budget and 2018-19 Budget include:
16. The increase is primarily due to additional funding to be received from the State Government in 2018-19 under the Advance Queensland: Connecting with Asia Strategy, the Attracting Aviation Investment Fund and special initiative grant funding for event acquisition.
Explanation of variances in the financial statements
2018-19 Queenland State Budget - Service Delivery Statements - Department of Innovation,Tourism Industry Development and the Commonwealth Games
43

17. The increase primarily reflects the cost of additional temporary roles related to events initiatives in addition to agreed wage increases.
18. The increase primarily reflects additional spend on marketing activities as a result of funding to be received under the Advance Queensland: Connecting with Asia Strategy and the Attracting Aviation Investment Fund.
19. The increase primarily reflects additional event related grant spend as a result of special initiative grant funding received for event acquisition.
Major variations between 2017-18 Estimated Actual and the 2018-19 Budget include:
20. The increase is principally explained by special initiative grants that will be received from the State Government in 2018-19 relating to event acquisition and the deferral of grant funding of $2.5 million from 2017-18 to match the timing of anticipated program activity.
2018-19 Queenland State Budget - Service Delivery Statements - Department of Innovation,Tourism Industry Development and the Commonwealth Games
44

Glossary of terms
Accrual accounting Recognition of economic events and other financial transactions involving revenue, expenses, assets, liabilities and equity as they occur and reporting in financial statements in the period to which they relate, rather than when a flow of cash occurs.
Administered items Assets, liabilities, revenues and expenses an entity administers, without discretion, on behalf of the Government.
Agency/entity Used generically to refer to the various organisational units within Government that deliver services or otherwise service Government objectives. The term can include departments, commercialised business units, statutory bodies or other organisations established by Executive decision.
Appropriation Funds issued by the Treasurer, under Parliamentary authority, to agencies during a financial year for: • delivery of agreed services• administered items• adjustment of the Government’s equity in agencies, including acquiring of
capital.
Balance sheet A financial statement that reports the assets, liabilities and equity of an entity as at a particular date.
Capital A term used to refer to an entity’s stock of assets and the capital grants it makes to other agencies. Assets include property, plant and equipment, intangible items and inventories that an entity owns/controls and uses in the delivery of services.
Cash Flow Statement A financial statement reporting the cash inflows and outflows for an entity’s operating, investing and financing activities in a particular period.
Controlled items Assets, liabilities, revenues and expenses that are controlled by departments. These relate directly to the departmental operational objectives and arise at the discretion and direction of that department.
Depreciation The periodic allocation of the cost of physical assets, representing the amount of the asset consumed during a specified time.
Equity Equity is the residual interest in the assets of the entity after deduction of its liabilities. It usually comprises the entity’s accumulated surpluses/losses, capital injections and any reserves.
Equity injection An increase in the investment of the Government in a public sector agency.
2018-19 Queenland State Budget - Service Delivery Statements - Department of Innovation,Tourism Industry Development and the Commonwealth Games
45
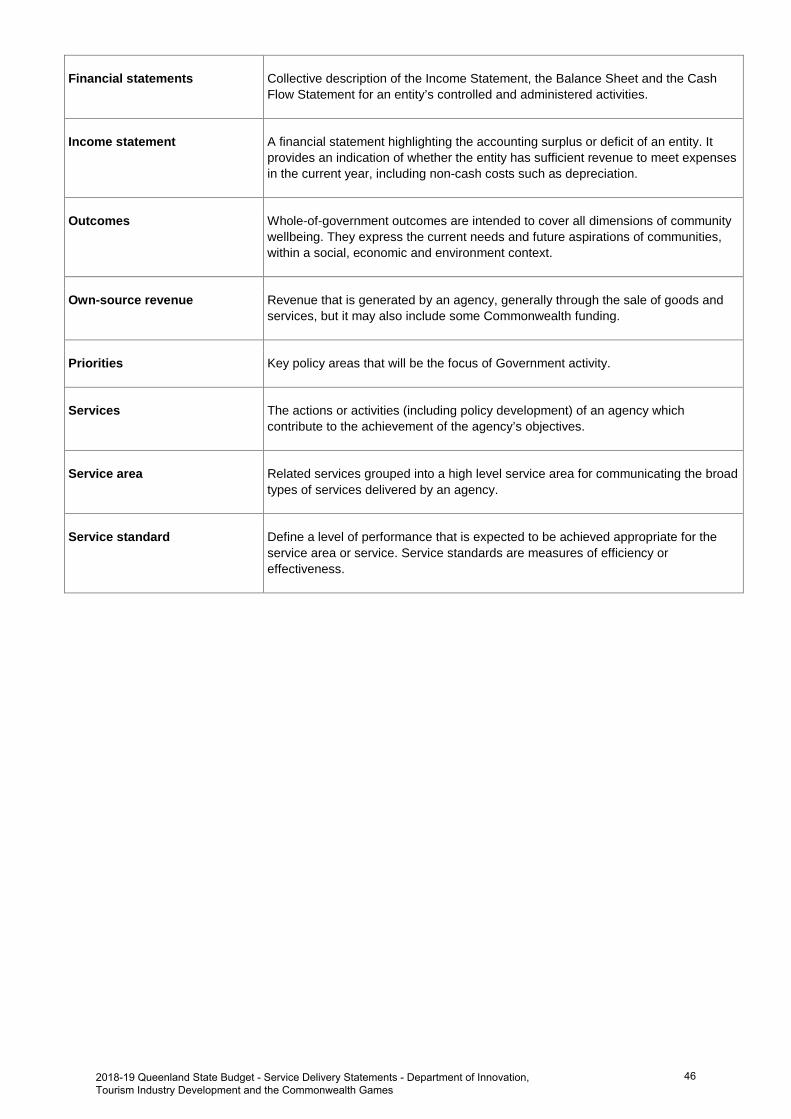
Financial statements Collective description of the Income Statement, the Balance Sheet and the Cash Flow Statement for an entity’s controlled and administered activities.
Income statement A financial statement highlighting the accounting surplus or deficit of an entity. It provides an indication of whether the entity has sufficient revenue to meet expenses in the current year, including non-cash costs such as depreciation.
Outcomes Whole-of-government outcomes are intended to cover all dimensions of community wellbeing. They express the current needs and future aspirations of communities, within a social, economic and environment context.
Own-source revenue Revenue that is generated by an agency, generally through the sale of goods and services, but it may also include some Commonwealth funding.
Priorities Key policy areas that will be the focus of Government activity.
Services The actions or activities (including policy development) of an agency which contribute to the achievement of the agency’s objectives.
Service area Related services grouped into a high level service area for communicating the broad types of services delivered by an agency.
Service standard Define a level of performance that is expected to be achieved appropriate for the service area or service. Service standards are measures of efficiency or effectiveness.
2018-19 Queenland State Budget - Service Delivery Statements - Department of Innovation,Tourism Industry Development and the Commonwealth Games
46


Queensland Budget 2018–19 Service Delivery Statements

Queensland Budget 2018–19
Service Delivery Statements
budget.qld.gov.au