
Service Delivery Statements Queensland Health · Director-General: Michael Walsh Service area 1:...
232
Queensland Health Service Delivery Statements Queensland Budget 2016-17
Transcript of Service Delivery Statements Queensland Health · Director-General: Michael Walsh Service area 1:...
Queensland Budget 2016-17 Service Delivery Statements www.budget.qld.gov.au
Queensland HealthService Delivery Statements
Queensland Budget 2016-17
16-066 2016-17 SDS covers A4 mono.indd 58 7/06/2016 10:23 AM
2016-17 Queensland Budget Papers1. Budget Speech
2. Budget Strategy and Outlook
3. Capital Statement
4. Budget Measures
5. Service Delivery Statements
Appropriation Bills
Budget Highlights
The Budget Papers are available online at
www.budget.qld.gov.au
© Crown copyright All rights reservedQueensland Government 2016
Excerpts from this publication may be reproduced, with appropriate acknowledgement, as permitted under the Copyright Act.
Service Delivery Statements
ISSN 1445-4890 (Print)ISSN 1445-4904 (Online) Queensland Budget 2016-17 Service Delivery Statements www.budget.qld.gov.au
16-066 2016-17 SDS covers A4 mono.indd 60 7/06/2016 10:23 AM
Health Portfolio
Summary of portfolio
Page Health Portfolio
5 Health Consolidated
27 Department of Health - controlled
Department of Health - administered
43 Queensland Ambulance Service
52 Cairns and Hinterland Hospital and Health Service
62 Central Queensland Hospital and Health Service
73 Central West Hospital and Health Service
81 Children's Health Queensland Hospital and Health Service
91 Darling Downs Hospital and Health Service
100 Gold Coast Hospital and Health Service

108 Mackay Hospital and Health Service
118 Metro North Hospital and Health Service
128 Metro South Hospital and Health Service
137 North West Hospital and Health Service
146 South West Hospital and Health Service
154 Sunshine Coast Hospital and Health Service
165 Torres and Cape Hospital and Health Service
175 Townsville Hospital and Health Service
184 West Moreton Hospital and Health Service
194 Wide Bay Hospital and Health Service
203 The Council of the Queensland Institute of Medical Research
211 Queensland Mental Health Commission
218 Office of the Health Ombudsman
Portfolio overview
Ministerial and portfolio responsibilities
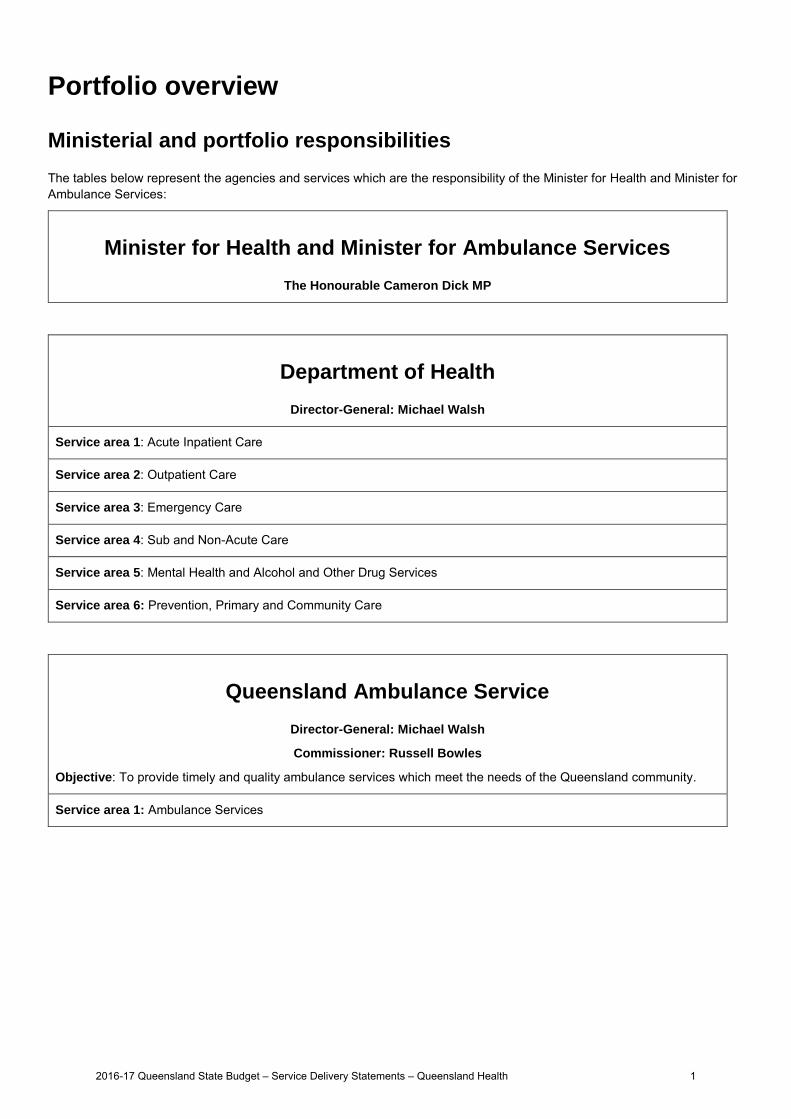
The tables below represent the agencies and services which are the responsibility of the Minister for Health and Minister for Ambulance Services:
Minister for Health and Minister for Ambulance Services
The Honourable Cameron Dick MP
Department of Health
Director-General: Michael Walsh
Service area 1: Acute Inpatient Care
Service area 2: Outpatient Care
Service area 3: Emergency Care
Service area 4: Sub and Non-Acute Care
Service area 5: Mental Health and Alcohol and Other Drug Services
Service area 6: Prevention, Primary and Community Care
Queensland Ambulance Service
Director-General: Michael Walsh
Commissioner: Russell Bowles
Objective: To provide timely and quality ambulance services which meet the needs of the Queensland community.
Service area 1: Ambulance Services
2016-17 Queensland State Budget – Service Delivery Statements – Queensland Health 1
Hospital and Health Services
Objective: Hospital and Health Services are independent statutory bodies established on 1 July 2012, to provide public hospital and health services in accordance with the Hospital and Health Boards Act 2011, the principles and objectives of the national health system and the Queensland Government’s priorities for the public health system.
Cairns and Hinterland Hospital and Health Service
Board Chair: Carolyn Eagle
Acting Chief Executive: Clare Douglas
Central Queensland Hospital and Health Service
Board Chair: Paul Bell
Chief Executive: Len Richards
Central West Hospital and Health Service
Board Chair: Jane Williams
Chief Executive: Michel Lok
Children's Health Queensland Hospital and Health Service
Board Chair: Rachel Hunter
Chief Executive: Fionnagh Dougan
Darling Downs Hospital and Health Service
Board Chair: Michael Horan
Chief Executive: Peter Gillies
Gold Coast Hospital and Health Service
Board Chair: Ian Langdon
Chief Executive: Ron Calvert
Mackay Hospital and Health Service
Board Chair: Timothy Mulherin
Acting Chief Executive: Helen Chalmers
Metro North Hospital and Health Service
Board Chair: Robert Stable
Chief Executive: Ken Whelan
Metro South Hospital and Health Service
Board Chair: Terry White
Chief Executive: Richard Ashby
2016-17 Queensland State Budget – Service Delivery Statements – Queensland Health 2
North West Hospital and Health Service
Board Chair: Paul Woodhouse
Interim Chief Executive: Lisa Davies Jones
South West Hospital and Health Service
Board Chair: Lindsay Godfrey
Chief Executive: Glynis Schultz
Sunshine Coast Hospital and Health Service
Board Chair: Lorraine Ferguson
Chief Executive: Kevin Hegarty
Torres and Cape Hospital and Health Service
Board Chair: Robert McCarthy
Chief Executive: Jill Newland
Townsville Hospital and Health Service
Board Chair: Tony Mooney
Chief Executive: Peter Bristow
West Moreton Hospital and Health Service
Board Chair: Michael Willis
Chief Executive: Sue McKee
Wide Bay Hospital and Health Service
Board Chair: Dominic Devine
Chief Executive: Adrian Pennington
The Council of the Queensland Institute of Medical Research
(QIMR)
Council Chair: Douglas McTaggart
Director and Chief Executive Officer: Frank Gannon
Objective: To enhance health by developing improved diagnostics, treatments and prevention strategies in the areas of cancer, infectious diseases, mental health and complex disorders.
2016-17 Queensland State Budget – Service Delivery Statements – Queensland Health 3
Queensland Mental Health Commission
Commissioner: Lesley van Schoubroeck
Objective: To drive ongoing reform towards a more integrated, evidence-based, recovery-oriented mental health, drug and alcohol system.
Office of the Health Ombudsman
Ombudsman: Leon Atkinson-MacEwen
Objective: To protect the health and safety of the public, promote professional, safe and competent practice by health practitioners, promote high standards of service delivery by health service organisations, and maintain confidence in Queensland's health system by managing health complaints in a timely, fair, impartial and independent manner, while operating transparently and reporting publicly on its performance.
Additional information about these agencies can be sourced from:
www.health.qld.gov.au
www.qimrberghofer.edu.au
www.qmhc.qld.gov.au
www.oho.qld.gov.au
2016-17 Queensland State Budget – Service Delivery Statements – Queensland Health 4
Health overview
The Queensland public healthcare system, collectively known as ‘Queensland Health’, comprises 16 independent Hospital and Health Services (HHSs), the Department of Health (the department) and the Queensland Ambulance Service. The Council of the Queensland Institute of Medical Research, the Queensland Mental Health Commission, and the Office of the Health Ombudsman make up the remainder of the Health Portfolio.
The 2015-16 State Budget provided additional funding of $2.302 billion over four years including $426.9 million in 2016-17 to ensure that health and ambulance services keep pace with the ongoing growth in demand for these services.
This additional funding has provided Queensland Health with funding certainty to ensure the healthcare system is robust and able to respond to both medium term and emerging challenges.
The drivers of the increasing demand for health services are diverse. They include a population that is growing and ageing, an increasing prevalence of chronic disease, an expanding range of new treatment options and technological interventions, as well as heightened expectations from the community and consumers around their healthcare needs.
Along with these drivers of demand, Queensland faces the additional challenge of continuing to provide equitable access to quality healthcare across Queensland's unique landscape and relatively decentralised population, combined with changes to Commonwealth funding arrangements.
In order to meet these challenges while ensuring that the health system provides services that represent value for money, Queensland Health must continue to become more efficient by embracing technological advances such as Digital Hospitals and telehealth, focusing on hospital avoidance strategies such as integrated and alternative models of care, and driving health promotion and prevention measures.
The recently released 10 Year Vision: My Health, Queensland’s Future: Advancing Health 2026 provides a strong platform to enable Queensland Health to focus and strengthen its decision-making and policy development over the next decade. The vision outlines that by 2026 Queenslanders will be among the healthiest people in the world and this outcome will be guided by five core principles of: Sustainability; Compassion; Inclusion; Excellence; and Empowerment.
The health system directly supports the Queensland Government’s priorities and objectives for the community by keeping people healthier and productive. The vision also builds on the Government’s Advance Queensland suite of initiatives which aim to harness innovation and create jobs for the future.
The 2015-16 Budget also provided an additional $320.3 million over four years to deliver the Government’s health related election commitments. Key priority areas of need included: the nursing workforce; preventative health; patient safety; and mental health.
To date, all of the Government’s election commitments are delivered or on track. Highlights for 2015-16 across priority areas include:
Nursing Workforce
recruiting 16 nurse educators across HHSs to coach, mentor and support up to 4,000 additional graduate nurses andmidwives to be recruited over the next four years
recruiting the first 50 of 400 new nurse navigators to facilitate the patient journey across the health sector, and educatepatients on their condition and its management to improve health literacy
recruiting 31 additional registered nurses to deliver the Primary School Nurse Health Readiness Program
enacting legislation that mandates nurse-to-patient ratios in Queensland public hospitals.
Preventative Health
delivering the Health for Life! – Taking Action on Diabetes Program targeted at Queenslanders at high risk of developingType 2 diabetes. The program is aimed at assisting individuals make healthier lifestyle choices and reducing avoidablehospital admissions
introducing the Public Health (Childcare Vaccination and Other Legislation) Amendment Bill 2015 to protect vulnerableQueenslanders from preventable diseases
progressing implementation of legislation which extends the range of smoke-free places in Queensland, which willcommence on 1 September 2016
delivering a range of preventive health initiatives including 10,000 Steps, Heart Foundation Walking Groups to increaselevels of physical activity and social marketing campaigns to promote the consumption of fruit and vegetables
encouraging Queenslanders to make healthy choices helps mitigate health problems before more expensive hospitalbased care is required.
2016-17 Queensland State Budget – Service Delivery Statements – Queensland Health 5
Patient Safety
re-establishing the Patient Safety and Quality Improvement Service
engaging the Australian Council on Healthcare Standards to conduct an audit of the patient safety and qualityimprovement functions of all HHSs.
Mental Health
increasing residential rehabilitation care for young people in Townsville through a partnership with Mind Australia
undertaking the biggest mental health reform in 15 years by overhauling the Mental Health Act 2000 following theintroduction of the Mental Health Bill 2015. The new laws will benefit Queenslanders living with mental illness and thosewho care for them by ensuring new laws reflect up to date developments in patient rights and clinical practice
increasing respite care for Queenslanders living with dementia or neurodegenerative conditions to support Queenslandseniors and to address the needs of their carers.
Operating Budget
In 2016-17, Queensland Health's operating budget will be $15.274 billion, which is an increase of $1.091 billion (7.7 per cent) from the published 2015-16 operating budget of $14.183 billion.
Hospital and Health Services
A total of $12.614 billion (82.6 per cent of the total operating budget) will be allocated through service agreements to provide public healthcare services from HHSs and other organisations including Mater Health Services and St Vincent's Health Australia. Funding provided to HHSs and other organisations through the service agreements represents an increase of 8.6 per cent compared to the published 2015-16 Budget, and 2.8 per cent compared to the most recent 2015-16 contracts (based on amendment window 2). This growth in activity will enable significant service expansion in areas such as outpatients and across HHSs enabling them to grow services to meet local need.
The targeted opening of the Sunshine Coast University Hospital in April 2017, with approximately 450 overnight beds, will also lead to a range of additional secondary and tertiary health services, including neurosurgery and cardiac surgery.
Outpatient Strategy
The 2015-16 Budget provided an additional $361.2 million over four years for the Specialist Outpatient Strategy. The strategy has been developed by the department to deliver system wide performance improvements to specialist outpatient services. In 2016-17, $114.2 million will be invested to support the strategy. The strategy is focused on improving the patient journey by investing in more services, new models of care, improved technology, and greater support for general practitioners to ensure patients receive timely and appropriate outpatient services. The immediate focus of the strategy will be reducing the current number of patients waiting longer than clinically recommended for a specialist outpatient appointment.
Priority Areas
In 2016-17, Queensland Health will provide new funding to support a range of initiatives aimed at improving health outcomes for disadvantaged and/or vulnerable people in our community including:
$6 million over four years (including $1.5 million in 2016-17) to continue the statewide Pre-Exposure ProphylaxisDemonstration project being led by Cairns and Hinterland HHS which involves those at high risk of acquiring HIV takingmedication on a daily basis to prevent HIV becoming established within the body
$15.8 million over three years to fund the North Queensland Aboriginal and Torres Strait Islander SexuallyTransmissible Infections Action Plan 2016-2021. This plan will strengthen the capacity of the health system tosignificantly lower the incidence of sexually transmitted infections in North Queensland
$9.6 million over three years (including $1.7 million in 2016-17) for a Suicide Prevention in Health Services Initiative.This funding will be utilised to develop and implement a health service targeted suicide prevention strategy which willinclude the establishment of a dedicated taskforce to develop evidence based prevention initiatives
$700,000 in 2016-17 to fund the development of an education program for health staff across a range of domestic andfamily violence initiatives
$100,000 per annum over three years (2016-17 to 2018-19) to implement the proposed Refugee Health and WellbeingPolicy and Action Plan, including refugee health and wellbeing resources, training and communications.
Responding to Ice
Funding of $6 million in 2016-17 has been internally reallocated by Queensland Health to tackle the Ice epidemic in Queensland. Funding will support the continuation of Drug and Alcohol Brief Intervention Teams in the Emergency Departments of Logan, Rockhampton and Townsville Hospitals, as well as a range of service responses in targeted areas including Cooktown, Gold Coast, Charleville and Cunnamulla.
2016-17 Queensland State Budget – Service Delivery Statements – Queensland Health 6
Queensland Ambulance Service1
An additional $13 million over three years to fast track employment of an additional 75 ambulance officers in the Queensland Ambulance Service to ensure the delivery of quality ambulance services in a timely manner.
Election Commitments
During 2016-17, Queensland Health will continue to deliver on the Government’s election commitments, with a continued focus on rebuilding the nursing workforce including: additional nurse graduates and midwives; a further 68 additional nurse navigators; and recruitment of more nurses where required to comply with mandated nurse-to-patient ratios. Other key highlights include:
commencing construction of a new Integrated Community Health Centre in Wynnum
considering the recommendations of the Parliamentary Inquiry into the establishment of a Queensland Health PromotionCommission.
eHealth and Built Infrastructure
In 2015-16, Queensland Health achieved a major milestone with both the Princess Alexandra and Cairns Hospitals becoming digital. This integrated electronic medical records (ieMR) project will improve patient care through the development of a statewide authoritative single source of patient records. Specifically, this capability is:
supporting clinicians to make better decisions at the bedside
optimising the management of patients, resources and provision of services
supporting interaction across a network of providers by making it easier to transfer information and collaborate withhealthcare partners.
During 2015-16, Queensland Health continued to operate a comprehensive built infrastructure and eHealth planning and prioritisation process. Through this work, the department maintains a comprehensive, forward looking view of priority health infrastructure and eHealth projects across Queensland.
In 2016-17, Queensland Health’s total capital investment program of $948.7 million2 will progress a range of health infrastructure priorities including: hospitals; health technology; research and scientific services; mental health services; and information technologies.
The Government is providing additional funding of $230 million over five years to 2020-21 ($20 million in 2016-17) for the Advancing Queensland’s Health Infrastructure Program. The program will facilitate essential upgrades to health facilities and supporting infrastructure across Queensland, including repurposing of the Nambour General Hospital, redevelopment of the Atherton Hospital including the emergency department and operating theatres, and redevelopment of the Thursday Island Hospital. The program will also support the development of a new health precinct for the southern corridor of Cairns and short term carpark solutions at Caboolture and Logan Hospitals.
Other capital investment program highlights for 2016-17 include:
$167 million to complete delivery of the $1.872 billion Sunshine Coast University Hospital and the Sunshine CoastHealth Institute
$27.9 million as part of the Enhancing Regional Hospitals Program for upgrades at the Hervey Bay and GladstoneEmergency Departments, Caloundra Health Service, and Roma Hospital
$12.7 million (of a total $13.6 million) for the Integrated Community Health Centre in Wynnum
$909,000 toward the refurbishment of the Alan Ticehurst Building in Cloncurry
$2.3 million (of a total $4.5 million) to commence replacement of the Dimbulah Primary Healthcare Clinic
$15.5 million to complete the $334 million Queensland and Australian Government funded Townsville HospitalExpansion
$80 million to continue delivering a range of asset renewal and enhancement works across the State under the PriorityCapital Program.
During 2015-16, the department undertook a comprehensive review of the current approved capital program. This review identified funds totalling $173.7 million as a result of project and/or program efficiencies.
1 Further details about the Queensland Ambulance Service can be found in the Queensland Ambulance section of this Service Delivery Statement. 2 In addition to the $948.7 million capital investment, Queensland Health has entered into a Public Private Partnership finance lease for the Sunshine Coast University Hospital of $460 million, which will involve principal repayments over the period 2017-42. The repayment for 2016-17 is $2.3 million.
2016-17 Queensland State Budget – Service Delivery Statements – Queensland Health 7
It is proposed that this funding will be reallocated over four years from 2016-17 (subject to business case approval) to fund the two highest areas of risk, the Financial System Renewal project and Laboratory Information System project, as both systems are at end of life and require replacement.
During 2016-17, the department will progress the development of business cases for a range of eHealth priority projects including:
continued delivery of the Digital Hospitals Program to extend the functionality and implementation of ieMR capability toadditional facilities across the State
the Patient Administration System.
In 2016-17, the department will support the new Infrastructure Portfolio Office within the Department of Infrastructure, Local Government and Planning to deliver a range of health related regional capital projects including: Palm Island Primary Health Care Centre; Townsville Paediatric Redevelopment project; McKinlay Multi-purpose Health Centre, Boulia Community Hospital refurbishment; and Step-up Step-down mental health services at Gladstone, Bundaberg and Mackay.
Commonwealth Budget Impacts
The 1 April 2016 Council of Australian Governments Agreement on Public Hospital Funding has partially restored activity based funding for an interim three year period between 2017-18 and 2019-20, with the Commonwealth funding 45 per cent of ‘efficient growth’ in public hospital services but subject to a national cap in funding growth of 6.5 per cent per year.
The Australian Government recognised that the previous policy, whereby Commonwealth funding would have grown by population and the Consumer Price Index only, was not sustainable. The department has estimated that the new agreement will lead to an additional $445 million for the Queensland public hospital system over the three year period.
The 2016-17 Commonwealth Budget also announced major changes to dental funding arrangements. These arrangements were scheduled to commence on 1 July 2016, however the Commonwealth legislation to enable them was not passed before the Commonwealth Parliament was dissolved on 8 May 2016. The proposed model, which would involve activity-based funding for public dental services and would replace existing Commonwealth funding support for both public and private dental services, would transfer all responsibility and risk for Commonwealth funded dental services to states and territories. The Australian Government has provided very little detail regarding how the new arrangements would work.
The Commonwealth Budget did not make provision for an extension of the National Partnership Agreement on Supporting National Mental Health Reform which expires on 30 June 2016 and will result in the loss of $10.4 million per annum across Queensland.
The Commonwealth Budget also included a revision to the Aged Care Funding Instrument. Based on preliminary analysis on a per capita basis, the department estimates a $230.4 million reduction in funding for Queensland aged care services over four years.
Service performance
Performance statement
Acute Inpatient Care
Service area objective
To provide safe, timely, appropriately accessible, patient-centred care that maximises the health outcomes of patients.
Service area description
Acute inpatient care includes a broad range of services provided to patients under a formal admission process and can refer to care provided in hospital and/or in a patient’s home.
2016-17 Queensland State Budget – Service Delivery Statements – Queensland Health 8
Health Consolidated Notes 2015-16
Target/Est.
2015-16
Est. Actual
2016-17
Target/Est.
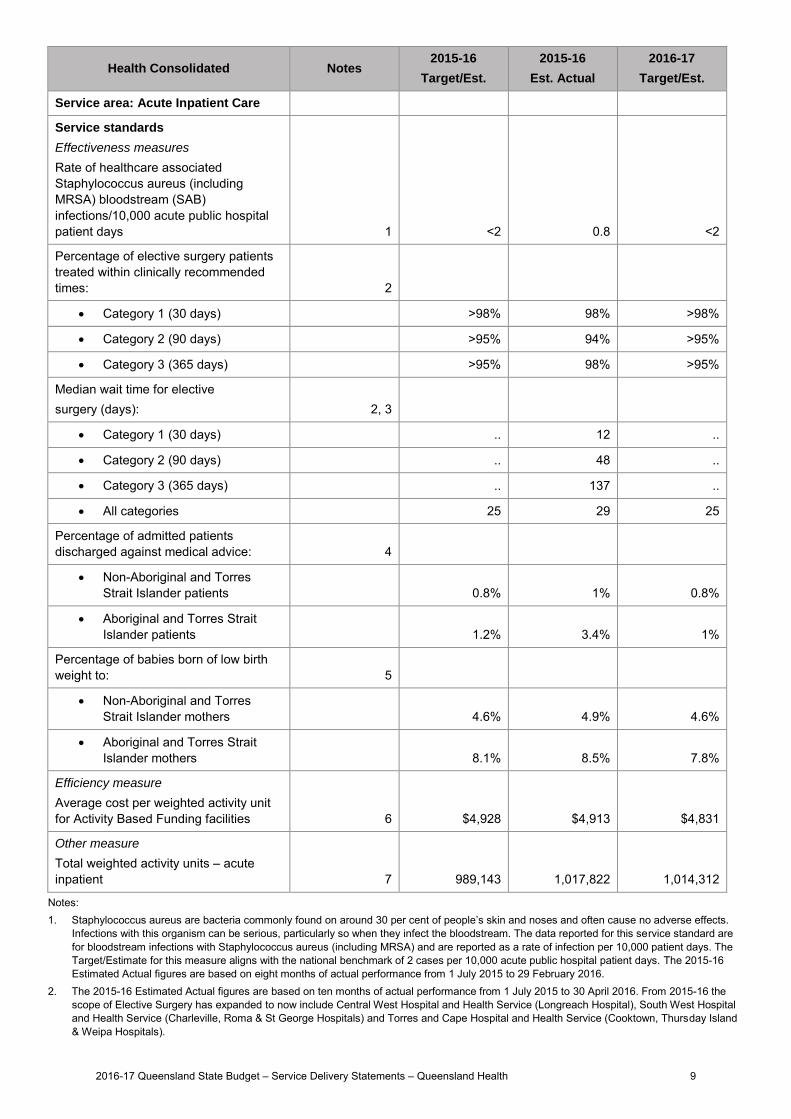
Service area: Acute Inpatient Care
Service standards
Effectiveness measures
Rate of healthcare associated Staphylococcus aureus (including MRSA) bloodstream (SAB) infections/10,000 acute public hospital patient days 1 <2 0.8 <2
Percentage of elective surgery patients treated within clinically recommended times: 2
Category 1 (30 days) >98% 98% >98%
Category 2 (90 days) >95% 94% >95%
Category 3 (365 days) >95% 98% >95%
Median wait time for elective surgery (days): 2, 3
Category 1 (30 days) .. 12 ..
Category 2 (90 days) .. 48 ..
Category 3 (365 days) .. 137 ..
All categories 25 29 25
Percentage of admitted patients discharged against medical advice: 4
Non-Aboriginal and TorresStrait Islander patients 0.8% 1% 0.8%
Aboriginal and Torres StraitIslander patients 1.2% 3.4% 1%
Percentage of babies born of low birth weight to: 5
Non-Aboriginal and TorresStrait Islander mothers 4.6% 4.9% 4.6%
Aboriginal and Torres StraitIslander mothers 8.1% 8.5% 7.8%
Efficiency measure
Average cost per weighted activity unit for Activity Based Funding facilities 6 $4,928 $4,913 $4,831
Other measure
Total weighted activity units – acute inpatient 7 989,143 1,017,822 1,014,312
Notes: 1. Staphylococcus aureus are bacteria commonly found on around 30 per cent of people’s skin and noses and often cause no adverse effects.
Infections with this organism can be serious, particularly so when they infect the bloodstream. The data reported for this service standard are for bloodstream infections with Staphylococcus aureus (including MRSA) and are reported as a rate of infection per 10,000 patient days. The Target/Estimate for this measure aligns with the national benchmark of 2 cases per 10,000 acute public hospital patient days. The 2015-16 Estimated Actual figures are based on eight months of actual performance from 1 July 2015 to 29 February 2016.
2. The 2015-16 Estimated Actual figures are based on ten months of actual performance from 1 July 2015 to 30 April 2016. From 2015-16 thescope of Elective Surgery has expanded to now include Central West Hospital and Health Service (Longreach Hospital), South West Hospital and Health Service (Charleville, Roma & St George Hospitals) and Torres and Cape Hospital and Health Service (Cooktown, Thursday Island & Weipa Hospitals).
2016-17 Queensland State Budget – Service Delivery Statements – Queensland Health 9
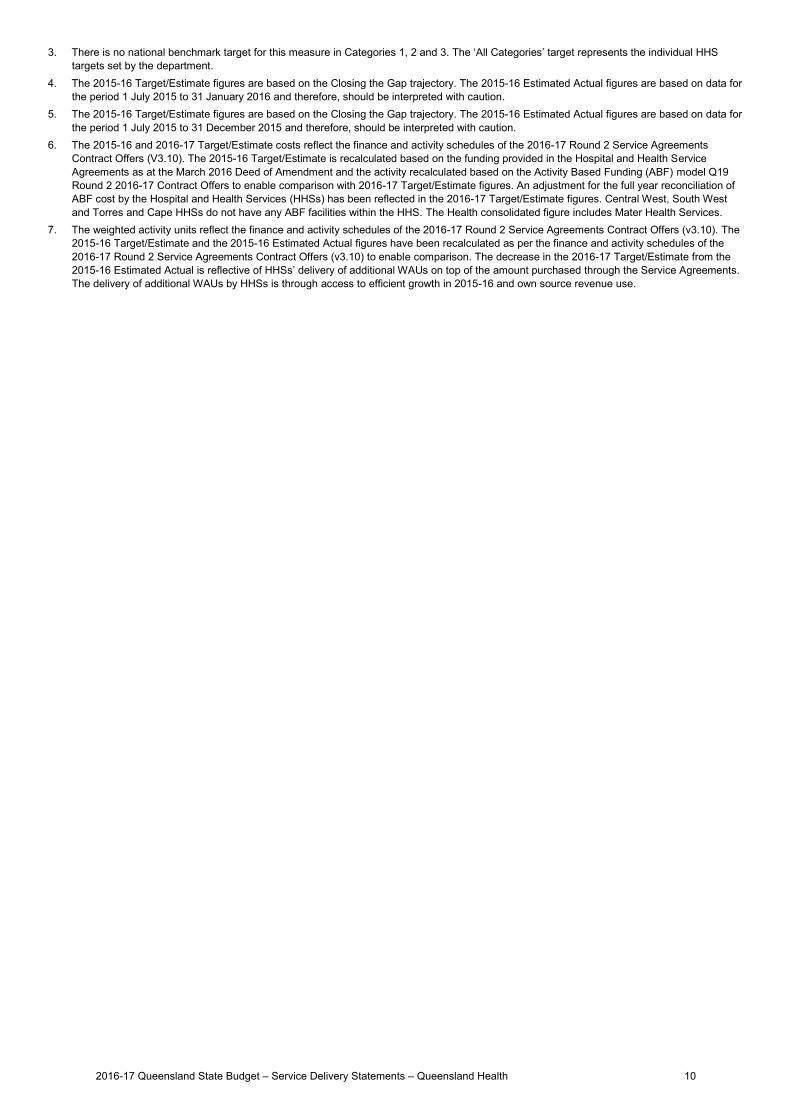
3. There is no national benchmark target for this measure in Categories 1, 2 and 3. The ‘All Categories’ target represents the individual HHStargets set by the department.
4. The 2015-16 Target/Estimate figures are based on the Closing the Gap trajectory. The 2015-16 Estimated Actual figures are based on data forthe period 1 July 2015 to 31 January 2016 and therefore, should be interpreted with caution.
5. The 2015-16 Target/Estimate figures are based on the Closing the Gap trajectory. The 2015-16 Estimated Actual figures are based on data forthe period 1 July 2015 to 31 December 2015 and therefore, should be interpreted with caution.
6. The 2015-16 and 2016-17 Target/Estimate costs reflect the finance and activity schedules of the 2016-17 Round 2 Service AgreementsContract Offers (V3.10). The 2015-16 Target/Estimate is recalculated based on the funding provided in the Hospital and Health ServiceAgreements as at the March 2016 Deed of Amendment and the activity recalculated based on the Activity Based Funding (ABF) model Q19Round 2 2016-17 Contract Offers to enable comparison with 2016-17 Target/Estimate figures. An adjustment for the full year reconciliation ofABF cost by the Hospital and Health Services (HHSs) has been reflected in the 2016-17 Target/Estimate figures. Central West, South Westand Torres and Cape HHSs do not have any ABF facilities within the HHS. The Health consolidated figure includes Mater Health Services.
7. The weighted activity units reflect the finance and activity schedules of the 2016-17 Round 2 Service Agreements Contract Offers (v3.10). The2015-16 Target/Estimate and the 2015-16 Estimated Actual figures have been recalculated as per the finance and activity schedules of the2016-17 Round 2 Service Agreements Contract Offers (v3.10) to enable comparison. The decrease in the 2016-17 Target/Estimate from the2015-16 Estimated Actual is reflective of HHSs’ delivery of additional WAUs on top of the amount purchased through the Service Agreements.The delivery of additional WAUs by HHSs is through access to efficient growth in 2015-16 and own source revenue use.
2016-17 Queensland State Budget – Service Delivery Statements – Queensland Health 10

Outpatient Care
Service area objective
To deliver coordinated care, clinical follow up and appropriate discharge planning throughout the patient journey.
Service area description
Outpatient services are examinations, consultations, treatments or other services provided to patients who are not currently admitted to hospital that require specialist care. Outpatient services also provide associated allied health services (such as physiotherapy) and diagnostic testing.
Health Consolidated Notes 2015-16
Target/Est.
2015-16
Est. Actual
2016-17
Target/Est.
Service area: Outpatient Care
Service standards
Effectiveness measures
Percentage of specialist outpatients waiting within clinically recommended times: 1
Category 1 (30 days) .. 61% 65%
Category 2 (90 days) .. 50% 55%
Category 3 (365 days) .. 74% 75%
Efficiency measure2
Other measure
Total weighted activity units – Outpatients 3 229,878 231,821 247,220
Notes: 1. The 2015-16 Estimated Actual figures are based on an average of ten months actual performance from 1 July 2015 to 30 April 2016 with the
following exceptions due to a temporary inability to report for some facilities during the transition to a new electronic information system: no data has been included for Cairns Base Hospital and Royal Brisbane and Women’s Hospital for the period February to April 2016 and no data has been included for the Princess Alexandra Hospital for the period January to April 2016. Reporting functions for these facilities will commence once the transition to the new electronic system is complete. The 2015-16 Service Delivery Statement did not include a 2015-16 Target/Estimate as the target was under review. The review has been completed and has enabled HHS specific targets to be set for 2016-17.
2. An efficiency measure is being investigated for this service area and will be included in a future Service Delivery Statement.3. The weighted activity units reflect the finance and activity schedules of the 2016-17 Round 2 Service Agreements Contract Offers (v3.10). The
2015-16 Target/Estimate and the 2015-16 Estimated Actual figures have been recalculated as per the finance and activity schedules of the2016-17 Round 2 Service Agreements Contract Offers (v3.10) to enable comparison.
2016-17 Queensland State Budget – Service Delivery Statements – Queensland Health 11
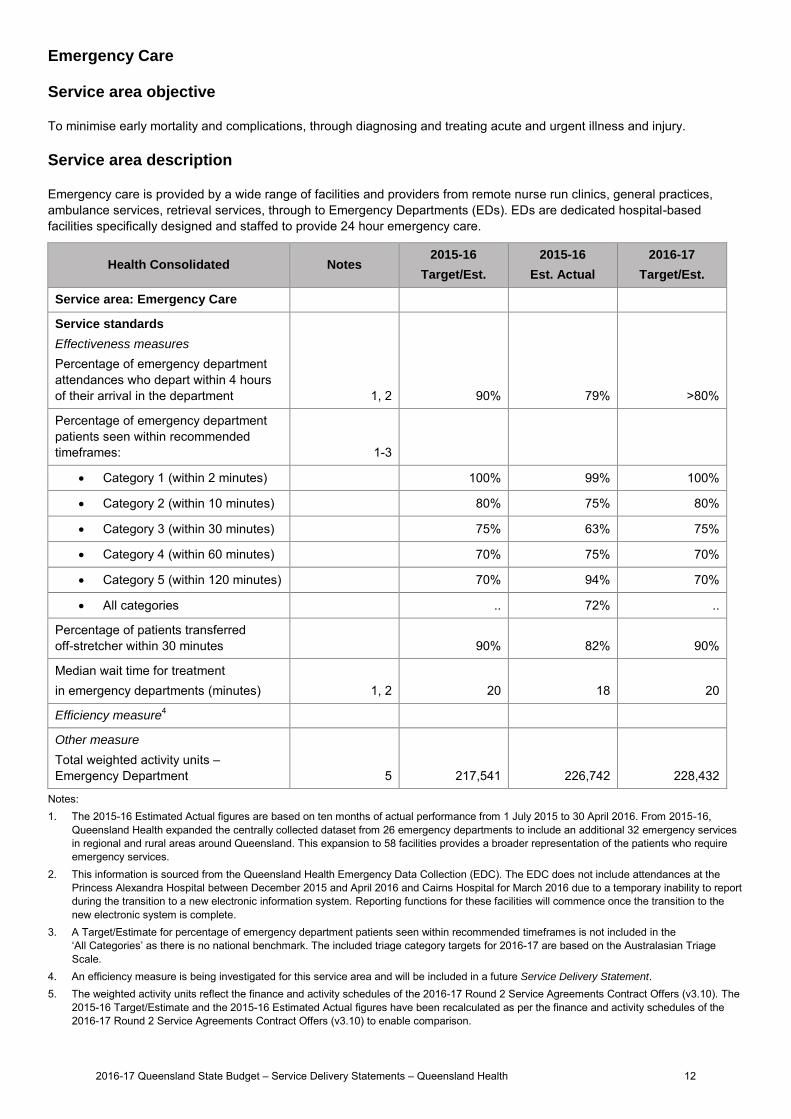
Emergency Care
Service area objective
To minimise early mortality and complications, through diagnosing and treating acute and urgent illness and injury.
Service area description
Emergency care is provided by a wide range of facilities and providers from remote nurse run clinics, general practices, ambulance services, retrieval services, through to Emergency Departments (EDs). EDs are dedicated hospital-based facilities specifically designed and staffed to provide 24 hour emergency care.
Health Consolidated Notes 2015-16
Target/Est.
2015-16
Est. Actual
2016-17
Target/Est.
Service area: Emergency Care
Service standards
Effectiveness measures
Percentage of emergency department attendances who depart within 4 hours of their arrival in the department 1, 2 90% 79% >80%
Percentage of emergency department patients seen within recommended timeframes: 1-3
Category 1 (within 2 minutes) 100% 99% 100%
Category 2 (within 10 minutes) 80% 75% 80%
Category 3 (within 30 minutes) 75% 63% 75%
Category 4 (within 60 minutes) 70% 75% 70%
Category 5 (within 120 minutes) 70% 94% 70%
All categories .. 72% ..
Percentage of patients transferred off-stretcher within 30 minutes 90% 82% 90%
Median wait time for treatment in emergency departments (minutes) 1, 2 20 18 20
Efficiency measure4
Other measure
Total weighted activity units – Emergency Department 5 217,541 226,742 228,432
Notes: 1. The 2015-16 Estimated Actual figures are based on ten months of actual performance from 1 July 2015 to 30 April 2016. From 2015-16,
Queensland Health expanded the centrally collected dataset from 26 emergency departments to include an additional 32 emergency services in regional and rural areas around Queensland. This expansion to 58 facilities provides a broader representation of the patients who require emergency services.
2. This information is sourced from the Queensland Health Emergency Data Collection (EDC). The EDC does not include attendances at thePrincess Alexandra Hospital between December 2015 and April 2016 and Cairns Hospital for March 2016 due to a temporary inability to report during the transition to a new electronic information system. Reporting functions for these facilities will commence once the transition to the new electronic system is complete.
3. A Target/Estimate for percentage of emergency department patients seen within recommended timeframes is not included in the‘All Categories’ as there is no national benchmark. The included triage category targets for 2016-17 are based on the Australasian Triage Scale.
4. An efficiency measure is being investigated for this service area and will be included in a future Service Delivery Statement.5. The weighted activity units reflect the finance and activity schedules of the 2016-17 Round 2 Service Agreements Contract Offers (v3.10). The
2015-16 Target/Estimate and the 2015-16 Estimated Actual figures have been recalculated as per the finance and activity schedules of the2016-17 Round 2 Service Agreements Contract Offers (v3.10) to enable comparison.
2016-17 Queensland State Budget – Service Delivery Statements – Queensland Health 12
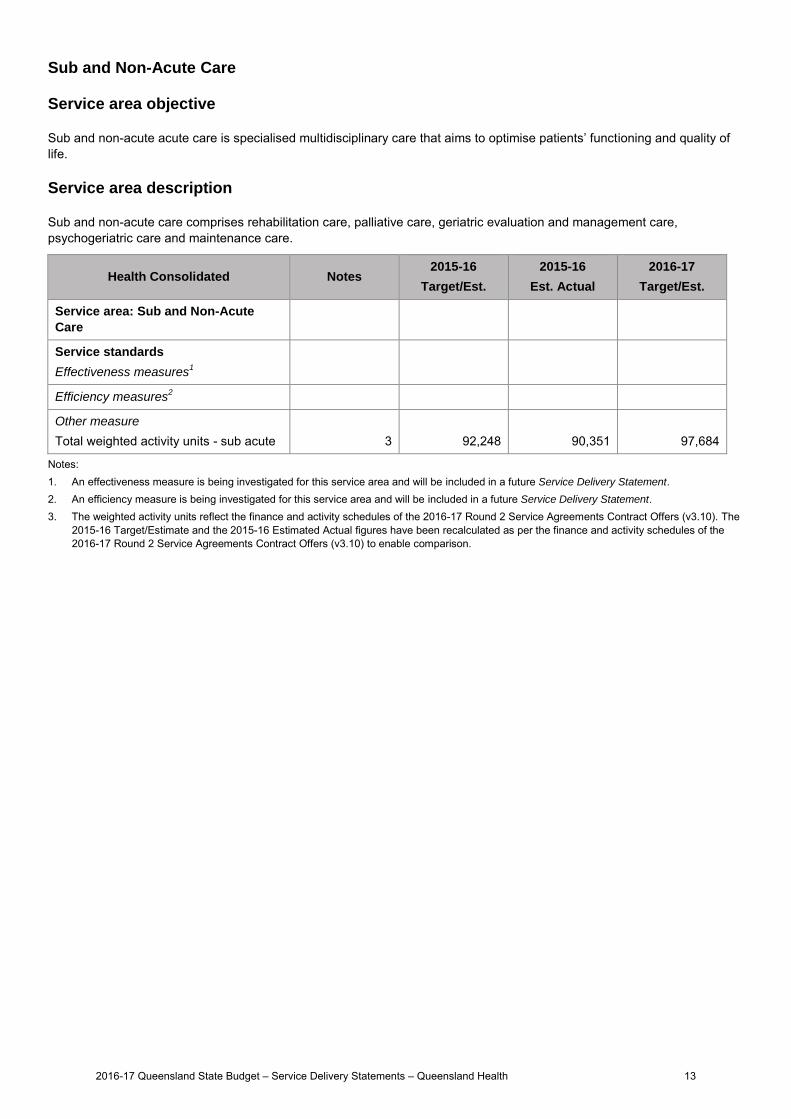
Sub and Non-Acute Care
Service area objective
Sub and non-acute acute care is specialised multidisciplinary care that aims to optimise patients’ functioning and quality of life.
Service area description
Sub and non-acute care comprises rehabilitation care, palliative care, geriatric evaluation and management care, psychogeriatric care and maintenance care.
Health Consolidated Notes 2015-16
Target/Est.
2015-16
Est. Actual
2016-17
Target/Est.
Service area: Sub and Non-Acute
Care
Service standards
Effectiveness measures1
Efficiency measures2
Other measure
Total weighted activity units - sub acute 3 92,248 90,351 97,684
Notes: 1. An effectiveness measure is being investigated for this service area and will be included in a future Service Delivery Statement.2. An efficiency measure is being investigated for this service area and will be included in a future Service Delivery Statement.3. The weighted activity units reflect the finance and activity schedules of the 2016-17 Round 2 Service Agreements Contract Offers (v3.10). The
2015-16 Target/Estimate and the 2015-16 Estimated Actual figures have been recalculated as per the finance and activity schedules of the2016-17 Round 2 Service Agreements Contract Offers (v3.10) to enable comparison.
2016-17 Queensland State Budget – Service Delivery Statements – Queensland Health 13
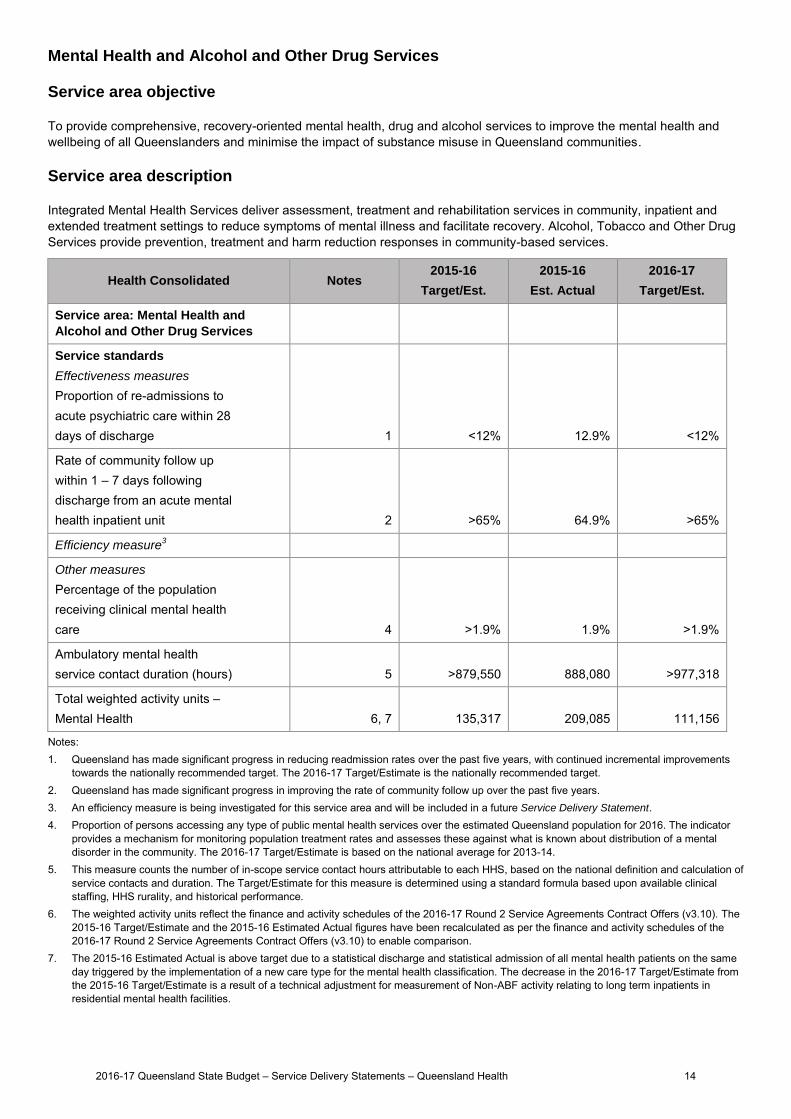
Mental Health and Alcohol and Other Drug Services
Service area objective
To provide comprehensive, recovery-oriented mental health, drug and alcohol services to improve the mental health and wellbeing of all Queenslanders and minimise the impact of substance misuse in Queensland communities.
Service area description
Integrated Mental Health Services deliver assessment, treatment and rehabilitation services in community, inpatient and extended treatment settings to reduce symptoms of mental illness and facilitate recovery. Alcohol, Tobacco and Other Drug Services provide prevention, treatment and harm reduction responses in community-based services.
Health Consolidated Notes 2015-16
Target/Est.
2015-16
Est. Actual
2016-17
Target/Est.
Service area: Mental Health and
Alcohol and Other Drug Services
Service standards
Effectiveness measures
Proportion of re-admissions to acute psychiatric care within 28 days of discharge 1 <12% 12.9% <12%
Rate of community follow up within 1 – 7 days following discharge from an acute mental health inpatient unit 2 >65% 64.9% >65%
Efficiency measure3
Other measures
Percentage of the population receiving clinical mental health care 4 >1.9% 1.9% >1.9%
Ambulatory mental health service contact duration (hours) 5 >879,550 888,080 >977,318
Total weighted activity units – Mental Health 6, 7 135,317 209,085 111,156
Notes: 1. Queensland has made significant progress in reducing readmission rates over the past five years, with continued incremental improvements
towards the nationally recommended target. The 2016-17 Target/Estimate is the nationally recommended target. 2. Queensland has made significant progress in improving the rate of community follow up over the past five years.3. An efficiency measure is being investigated for this service area and will be included in a future Service Delivery Statement.4. Proportion of persons accessing any type of public mental health services over the estimated Queensland population for 2016. The indicator
provides a mechanism for monitoring population treatment rates and assesses these against what is known about distribution of a mentaldisorder in the community. The 2016-17 Target/Estimate is based on the national average for 2013-14.
5. This measure counts the number of in-scope service contact hours attributable to each HHS, based on the national definition and calculation ofservice contacts and duration. The Target/Estimate for this measure is determined using a standard formula based upon available clinicalstaffing, HHS rurality, and historical performance.
6. The weighted activity units reflect the finance and activity schedules of the 2016-17 Round 2 Service Agreements Contract Offers (v3.10). The2015-16 Target/Estimate and the 2015-16 Estimated Actual figures have been recalculated as per the finance and activity schedules of the2016-17 Round 2 Service Agreements Contract Offers (v3.10) to enable comparison.
7. The 2015-16 Estimated Actual is above target due to a statistical discharge and statistical admission of all mental health patients on the sameday triggered by the implementation of a new care type for the mental health classification. The decrease in the 2016-17 Target/Estimate fromthe 2015-16 Target/Estimate is a result of a technical adjustment for measurement of Non-ABF activity relating to long term inpatients inresidential mental health facilities.
2016-17 Queensland State Budget – Service Delivery Statements – Queensland Health 14
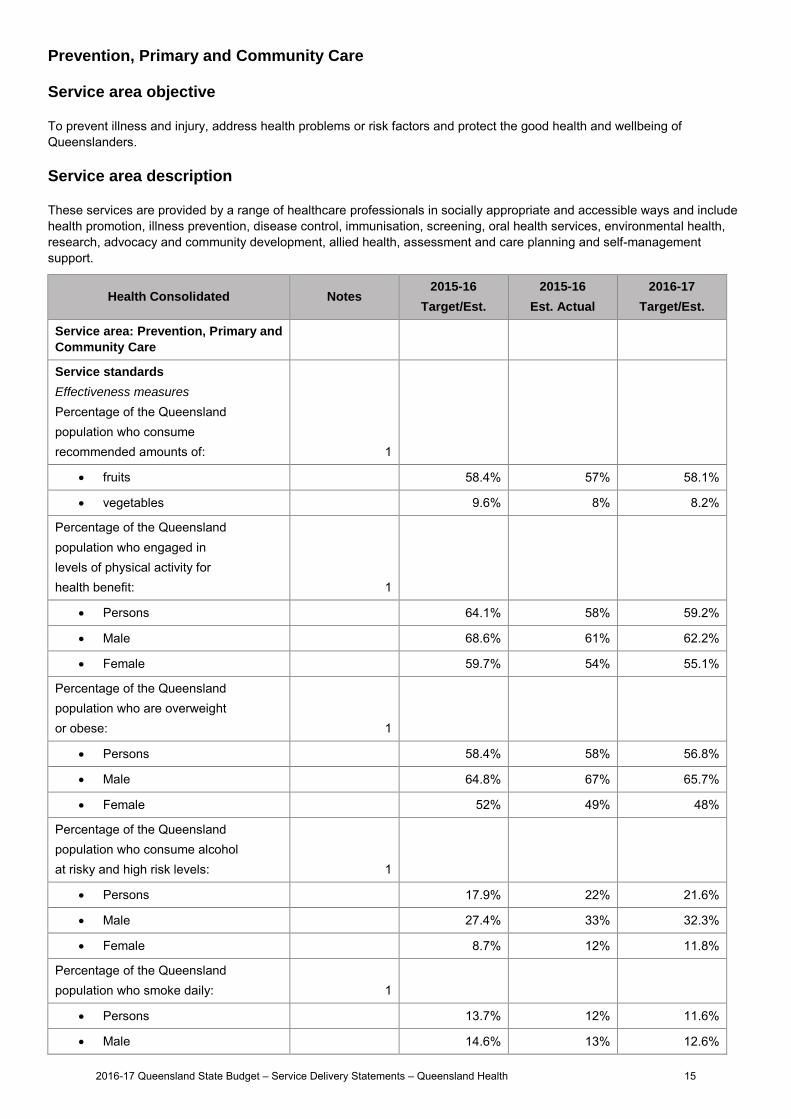
Prevention, Primary and Community Care
Service area objective
To prevent illness and injury, address health problems or risk factors and protect the good health and wellbeing of Queenslanders.
Service area description
These services are provided by a range of healthcare professionals in socially appropriate and accessible ways and include health promotion, illness prevention, disease control, immunisation, screening, oral health services, environmental health, research, advocacy and community development, allied health, assessment and care planning and self-management support.
Health Consolidated Notes 2015-16
Target/Est.
2015-16
Est. Actual
2016-17
Target/Est.
Service area: Prevention, Primary and
Community Care
Service standards
Effectiveness measures
Percentage of the Queensland population who consume recommended amounts of: 1
fruits 58.4% 57% 58.1%
vegetables 9.6% 8% 8.2%
Percentage of the Queensland population who engaged in levels of physical activity for health benefit: 1
Persons 64.1% 58% 59.2%
Male 68.6% 61% 62.2%
Female 59.7% 54% 55.1%
Percentage of the Queensland population who are overweight or obese: 1
Persons 58.4% 58% 56.8%
Male 64.8% 67% 65.7%
Female 52% 49% 48%
Percentage of the Queensland population who consume alcohol at risky and high risk levels: 1
Persons 17.9% 22% 21.6%
Male 27.4% 33% 32.3%
Female 8.7% 12% 11.8%
Percentage of the Queensland population who smoke daily: 1
Persons 13.7% 12% 11.6%
Male 14.6% 13% 12.6%
2016-17 Queensland State Budget – Service Delivery Statements – Queensland Health 15
Health Consolidated Notes 2015-16
Target/Est.
2015-16
Est. Actual
2016-17
Target/Est.
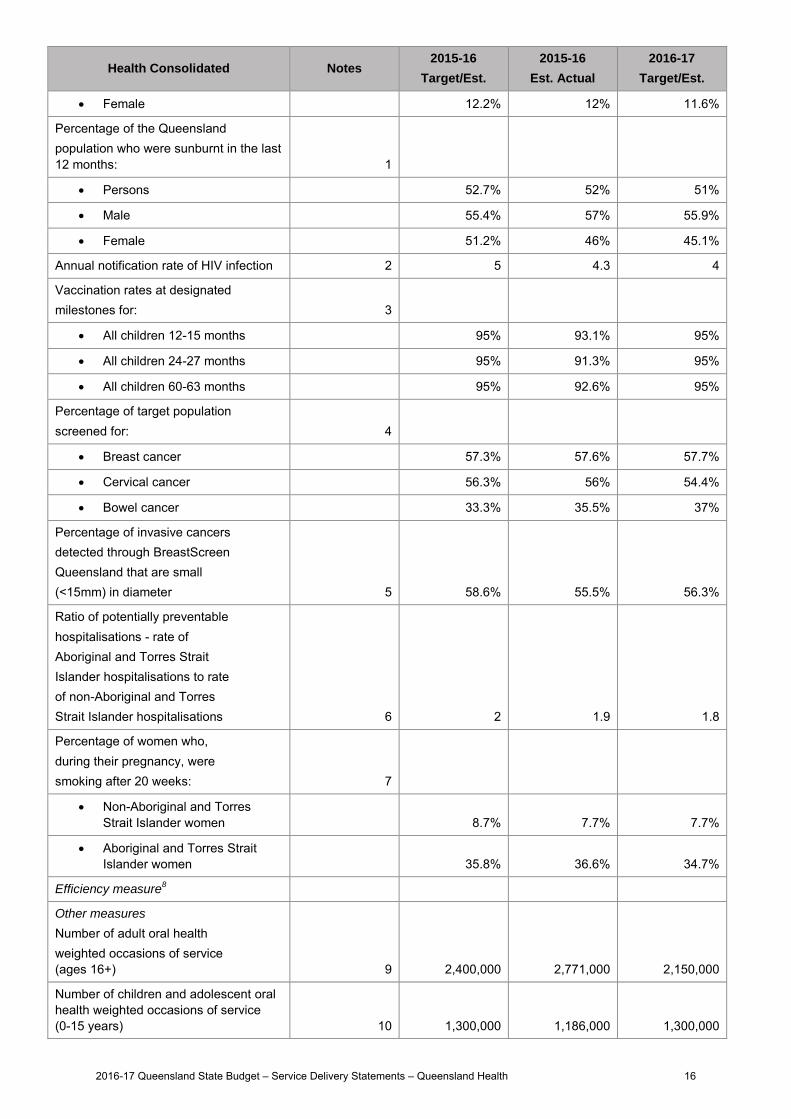
Female 12.2% 12% 11.6%
Percentage of the Queensland population who were sunburnt in the last 12 months: 1
Persons 52.7% 52% 51%
Male 55.4% 57% 55.9%
Female 51.2% 46% 45.1%
Annual notification rate of HIV infection 2 5 4.3 4
Vaccination rates at designated milestones for: 3
All children 12-15 months 95% 93.1% 95%
All children 24-27 months 95% 91.3% 95%
All children 60-63 months 95% 92.6% 95%
Percentage of target population screened for: 4
Breast cancer 57.3% 57.6% 57.7%
Cervical cancer 56.3% 56% 54.4%
Bowel cancer 33.3% 35.5% 37%
Percentage of invasive cancers detected through BreastScreen Queensland that are small (<15mm) in diameter 5 58.6% 55.5% 56.3%
Ratio of potentially preventable hospitalisations - rate of Aboriginal and Torres Strait Islander hospitalisations to rate of non-Aboriginal and Torres Strait Islander hospitalisations 6 2 1.9 1.8
Percentage of women who, during their pregnancy, were smoking after 20 weeks: 7
Non-Aboriginal and TorresStrait Islander women 8.7% 7.7% 7.7%
Aboriginal and Torres StraitIslander women 35.8% 36.6% 34.7%
Efficiency measure8
Other measures
Number of adult oral health weighted occasions of service (ages 16+) 9 2,400,000 2,771,000 2,150,000
Number of children and adolescent oral health weighted occasions of service (0-15 years) 10 1,300,000 1,186,000 1,300,000
2016-17 Queensland State Budget – Service Delivery Statements – Queensland Health 16
Health Consolidated Notes 2015-16
Target/Est.
2015-16
Est. Actual
2016-17
Target/Est.
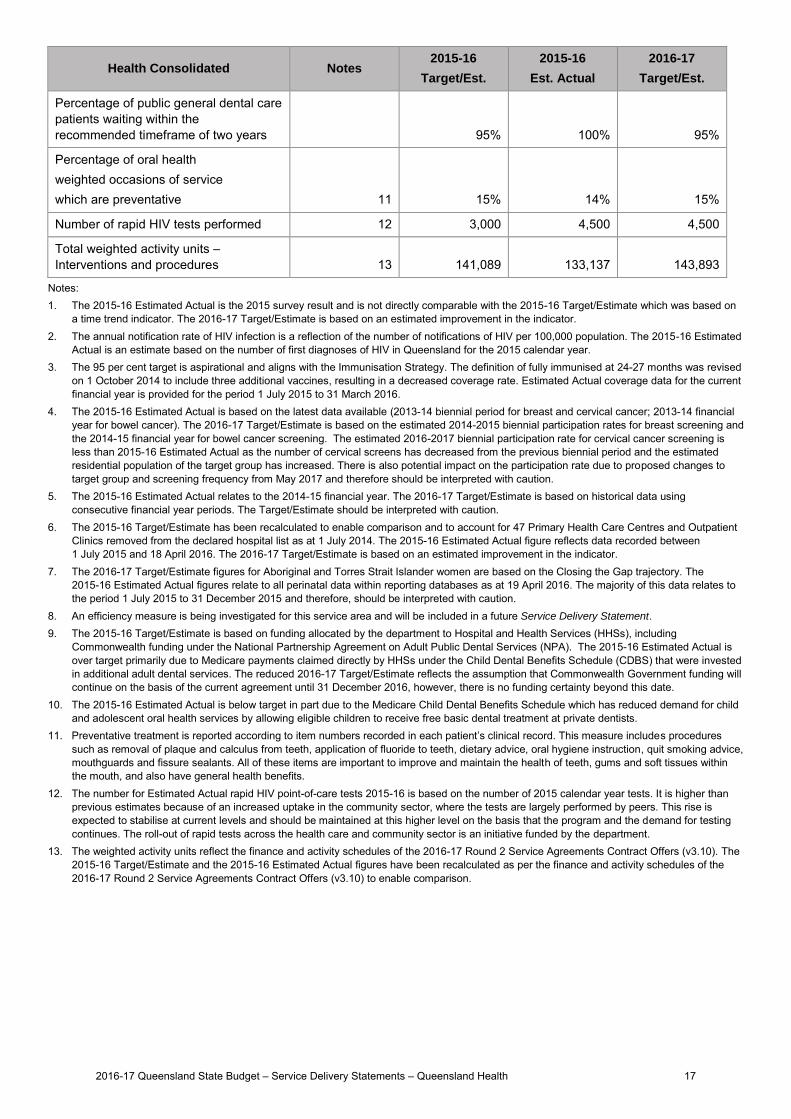
Percentage of public general dental care patients waiting within the recommended timeframe of two years 95% 100% 95%
Percentage of oral health weighted occasions of service which are preventative 11 15% 14% 15%
Number of rapid HIV tests performed 12 3,000 4,500 4,500
Total weighted activity units – Interventions and procedures 13 141,089 133,137 143,893
Notes: 1. The 2015-16 Estimated Actual is the 2015 survey result and is not directly comparable with the 2015-16 Target/Estimate which was based on
a time trend indicator. The 2016-17 Target/Estimate is based on an estimated improvement in the indicator. 2. The annual notification rate of HIV infection is a reflection of the number of notifications of HIV per 100,000 population. The 2015-16 Estimated
Actual is an estimate based on the number of first diagnoses of HIV in Queensland for the 2015 calendar year. 3. The 95 per cent target is aspirational and aligns with the Immunisation Strategy. The definition of fully immunised at 24-27 months was revised
on 1 October 2014 to include three additional vaccines, resulting in a decreased coverage rate. Estimated Actual coverage data for the current financial year is provided for the period 1 July 2015 to 31 March 2016.
4. The 2015-16 Estimated Actual is based on the latest data available (2013-14 biennial period for breast and cervical cancer; 2013-14 financialyear for bowel cancer). The 2016-17 Target/Estimate is based on the estimated 2014-2015 biennial participation rates for breast screening and the 2014-15 financial year for bowel cancer screening. The estimated 2016-2017 biennial participation rate for cervical cancer screening is less than 2015-16 Estimated Actual as the number of cervical screens has decreased from the previous biennial period and the estimated residential population of the target group has increased. There is also potential impact on the participation rate due to proposed changes to target group and screening frequency from May 2017 and therefore should be interpreted with caution.
5. The 2015-16 Estimated Actual relates to the 2014-15 financial year. The 2016-17 Target/Estimate is based on historical data usingconsecutive financial year periods. The Target/Estimate should be interpreted with caution.
6. The 2015-16 Target/Estimate has been recalculated to enable comparison and to account for 47 Primary Health Care Centres and OutpatientClinics removed from the declared hospital list as at 1 July 2014. The 2015-16 Estimated Actual figure reflects data recorded between 1 July 2015 and 18 April 2016. The 2016-17 Target/Estimate is based on an estimated improvement in the indicator.
7. The 2016-17 Target/Estimate figures for Aboriginal and Torres Strait Islander women are based on the Closing the Gap trajectory. The2015-16 Estimated Actual figures relate to all perinatal data within reporting databases as at 19 April 2016. The majority of this data relates to the period 1 July 2015 to 31 December 2015 and therefore, should be interpreted with caution.
8. An efficiency measure is being investigated for this service area and will be included in a future Service Delivery Statement.9. The 2015-16 Target/Estimate is based on funding allocated by the department to Hospital and Health Services (HHSs), including
Commonwealth funding under the National Partnership Agreement on Adult Public Dental Services (NPA). The 2015-16 Estimated Actual isover target primarily due to Medicare payments claimed directly by HHSs under the Child Dental Benefits Schedule (CDBS) that were investedin additional adult dental services. The reduced 2016-17 Target/Estimate reflects the assumption that Commonwealth Government funding willcontinue on the basis of the current agreement until 31 December 2016, however, there is no funding certainty beyond this date.
10. The 2015-16 Estimated Actual is below target in part due to the Medicare Child Dental Benefits Schedule which has reduced demand for childand adolescent oral health services by allowing eligible children to receive free basic dental treatment at private dentists.
11. Preventative treatment is reported according to item numbers recorded in each patient’s clinical record. This measure includes proceduressuch as removal of plaque and calculus from teeth, application of fluoride to teeth, dietary advice, oral hygiene instruction, quit smoking advice,mouthguards and fissure sealants. All of these items are important to improve and maintain the health of teeth, gums and soft tissues withinthe mouth, and also have general health benefits.
12. The number for Estimated Actual rapid HIV point-of-care tests 2015-16 is based on the number of 2015 calendar year tests. It is higher thanprevious estimates because of an increased uptake in the community sector, where the tests are largely performed by peers. This rise isexpected to stabilise at current levels and should be maintained at this higher level on the basis that the program and the demand for testingcontinues. The roll-out of rapid tests across the health care and community sector is an initiative funded by the department.
13. The weighted activity units reflect the finance and activity schedules of the 2016-17 Round 2 Service Agreements Contract Offers (v3.10). The2015-16 Target/Estimate and the 2015-16 Estimated Actual figures have been recalculated as per the finance and activity schedules of the2016-17 Round 2 Service Agreements Contract Offers (v3.10) to enable comparison.
2016-17 Queensland State Budget – Service Delivery Statements – Queensland Health 17

Health consolidated budget summary The table below shows the total resources available in 2016-17 from all sources and summarises how resources will be applied by service area and by controlled and administered classifications.
Health Consolidated
2015-16
Budget
$’000
2015-16
Est. Actual
$’000
2016-17
Budget
$’000
CONTROLLED
Income
Appropriation revenue1
Deferred from previous year/s .. .. ..
Balance of service appropriation 9,406,668 9,540,920 10,014,701
Other revenue 4,761,378 4,997,724 5,260,100
Total income 14,168,046 14,538,644 15,274,801
Expenses
Acute Inpatient Care 6,293,123 6,501,829 6,885,729
Outpatient Care 1,873,664 1,935,803 1,952,915
Emergency Care 1,394,113 1,440,348 1,486,823
Sub and Non-Acute Care 528,814 546,352 563,202
Mental Health and Alcohol and Other Drug Services 1,493,982 1,543,529 1,552,693
Prevention, Primary and Community Care 2,035,158 2,102,652 2,229,024
Ambulance Services 563,707 567,700 603,585
Total expenses 14,182,562 14,638,213 15,273,970
Operating surplus/deficit (14,516) (99,569) 831
Net assets 12,612,831 11,922,411 12,184,867
ADMINISTERED
Revenue
Commonwealth revenue .. .. ..
Appropriation revenue 33,544 33,508 33,974
Other administered revenue 4 25 25
Total revenue 33548 33,533 33,999
Expenses
Transfers to government .. 25 25
Administered expenses 33,548 33,508 33,974
Total expenses 33,548 33,533 33,999
Net assets .. .. ..
Note: 1. Appropriation revenue includes State and Commonwealth funding.
2016-17 Queensland State Budget – Service Delivery Statements – Queensland Health 18
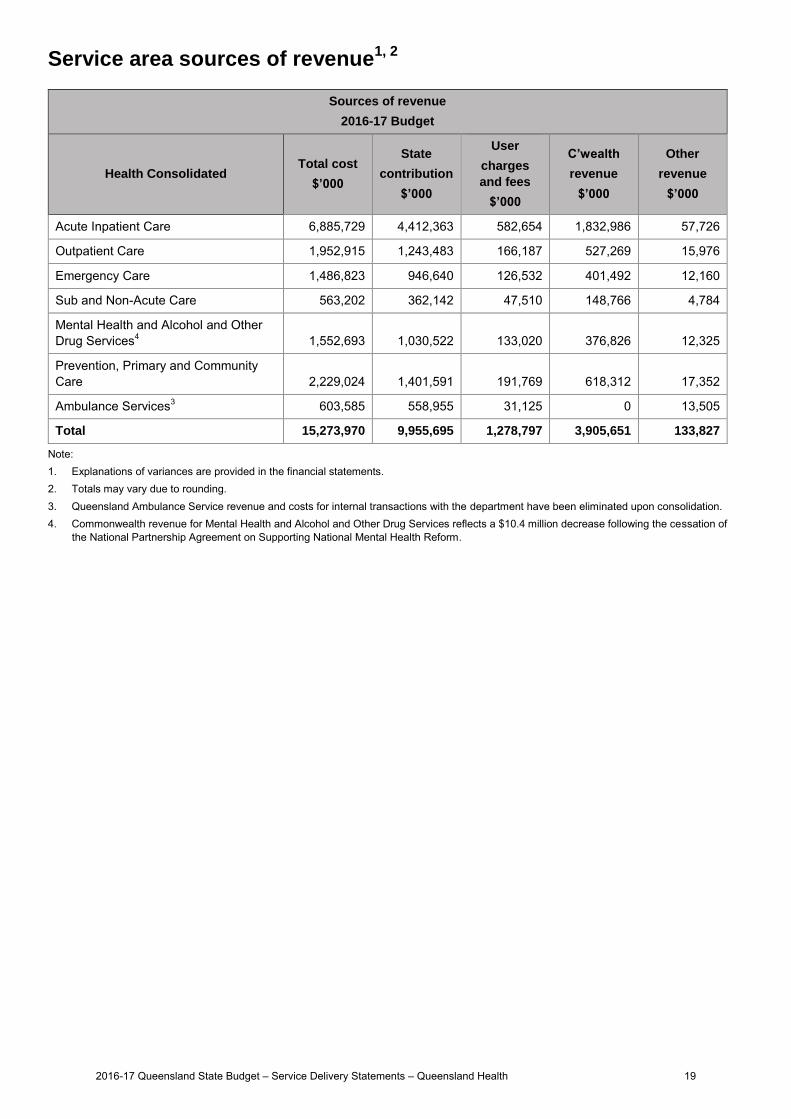
Service area sources of revenue1, 2
Sources of revenue
2016-17 Budget
Health Consolidated Total cost
$’000
State
contribution
$’000
User
charges
and fees
$’000
C’wealth
revenue
$’000
Other
revenue
$’000
Acute Inpatient Care 6,885,729 4,412,363 582,654 1,832,986 57,726
Outpatient Care 1,952,915 1,243,483 166,187 527,269 15,976
Emergency Care 1,486,823 946,640 126,532 401,492 12,160
Sub and Non-Acute Care 563,202 362,142 47,510 148,766 4,784
Mental Health and Alcohol and Other Drug Services4 1,552,693 1,030,522 133,020 376,826 12,325
Prevention, Primary and Community Care 2,229,024 1,401,591 191,769 618,312 17,352
Ambulance Services3 603,585 558,955 31,125 0 13,505
Total 15,273,970 9,955,695 1,278,797 3,905,651 133,827
Note: 1. Explanations of variances are provided in the financial statements.2. Totals may vary due to rounding.3. Queensland Ambulance Service revenue and costs for internal transactions with the department have been eliminated upon consolidation.4. Commonwealth revenue for Mental Health and Alcohol and Other Drug Services reflects a $10.4 million decrease following the cessation of
the National Partnership Agreement on Supporting National Mental Health Reform.
2016-17 Queensland State Budget – Service Delivery Statements – Queensland Health 19
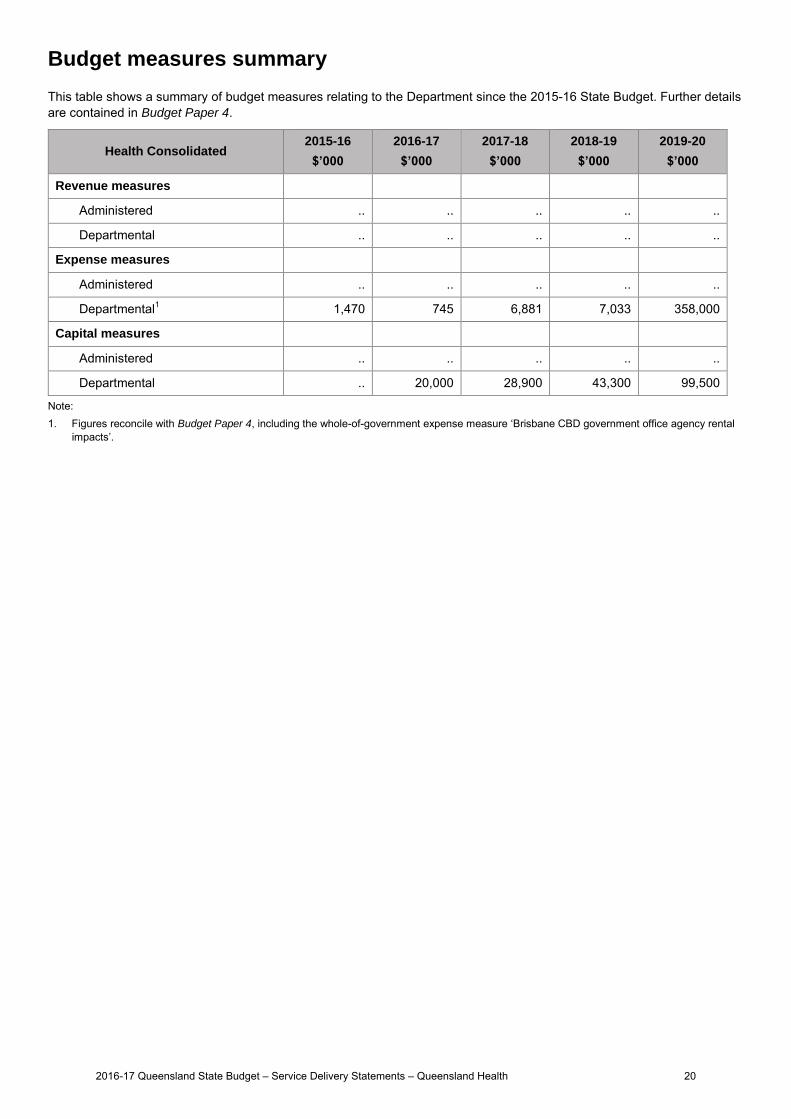
Budget measures summary
This table shows a summary of budget measures relating to the Department since the 2015-16 State Budget. Further details are contained in Budget Paper 4.
Health Consolidated 2015-16
$’000
2016-17
$’000
2017-18
$’000
2018-19
$’000
2019-20
$’000
Revenue measures
Administered .. .. .. .. ..
Departmental .. .. .. .. ..
Expense measures
Administered .. .. .. .. ..
Departmental1 1,470 745 6,881 7,033 358,000
Capital measures
Administered .. .. .. .. ..
Departmental .. 20,000 28,900 43,300 99,500
Note: 1. Figures reconcile with Budget Paper 4, including the whole-of-government expense measure ‘Brisbane CBD government office agency rental
impacts’.
2016-17 Queensland State Budget – Service Delivery Statements – Queensland Health 20
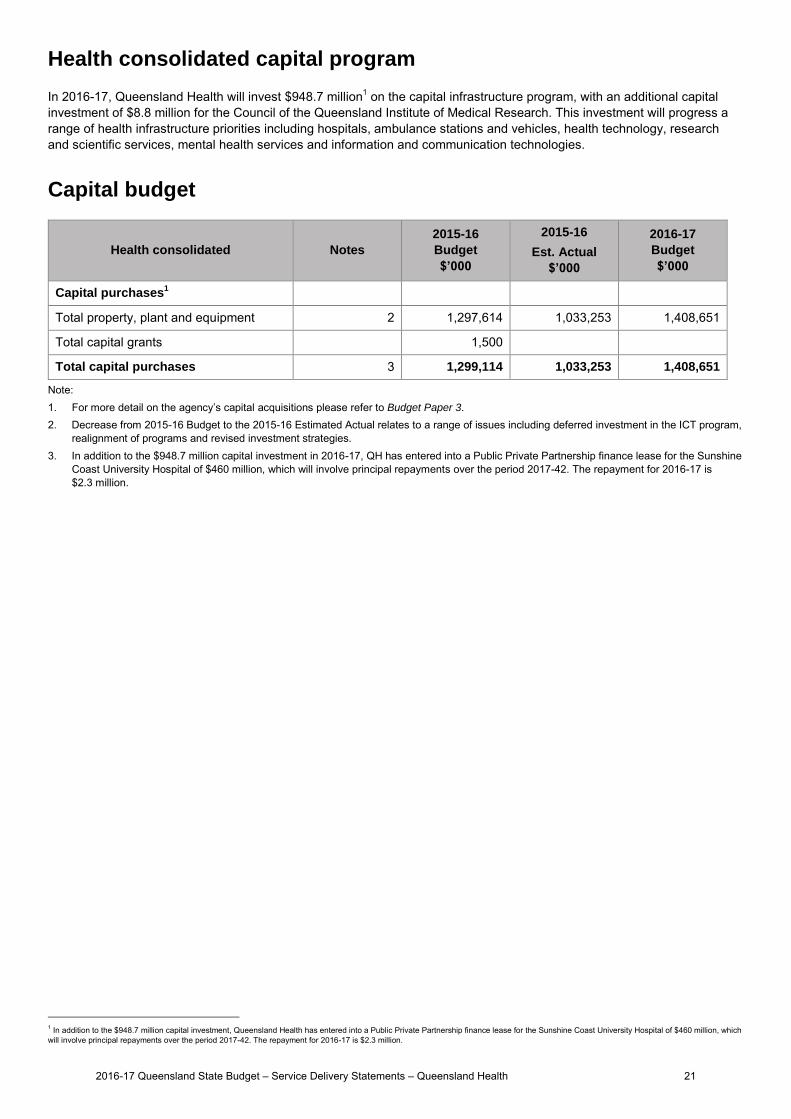
Health consolidated capital program
In 2016-17, Queensland Health will invest $948.7 million1 on the capital infrastructure program, with an additional capital investment of $8.8 million for the Council of the Queensland Institute of Medical Research. This investment will progress a range of health infrastructure priorities including hospitals, ambulance stations and vehicles, health technology, research and scientific services, mental health services and information and communication technologies.
Capital budget
Health consolidated Notes
2015-16
Budget
$’000
2015-16
Est. Actual
$’000
2016-17
Budget
$’000
Capital purchases1
Total property, plant and equipment 2 1,297,614 1,033,253 1,408,651
Total capital grants 1,500
Total capital purchases 3 1,299,114 1,033,253 1,408,651
Note: 1. For more detail on the agency’s capital acquisitions please refer to Budget Paper 3.2. Decrease from 2015-16 Budget to the 2015-16 Estimated Actual relates to a range of issues including deferred investment in the ICT program,
realignment of programs and revised investment strategies.3. In addition to the $948.7 million capital investment in 2016-17, QH has entered into a Public Private Partnership finance lease for the Sunshine
Coast University Hospital of $460 million, which will involve principal repayments over the period 2017-42. The repayment for 2016-17 is$2.3 million.
1 In addition to the $948.7 million capital investment, Queensland Health has entered into a Public Private Partnership finance lease for the Sunshine Coast University Hospital of $460 million, which will involve principal repayments over the period 2017-42. The repayment for 2016-17 is $2.3 million.
2016-17 Queensland State Budget – Service Delivery Statements – Queensland Health 21
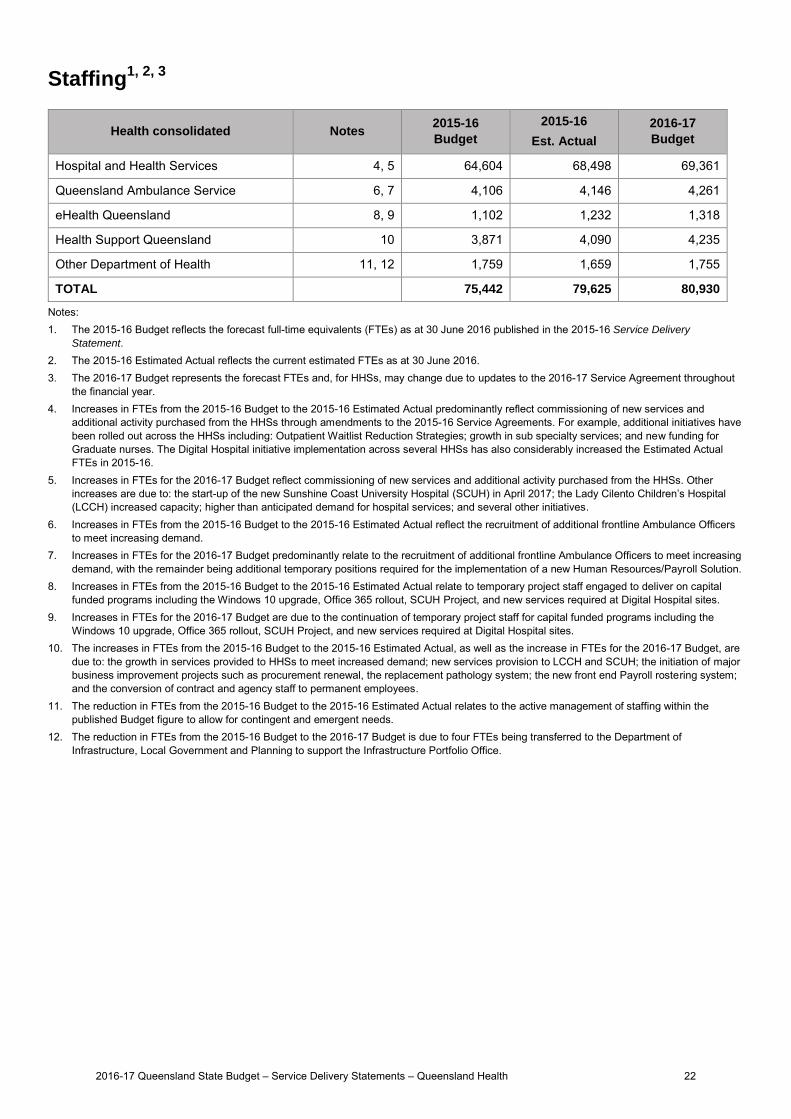
Staffing1, 2, 3
Health consolidated Notes 2015-16
Budget
2015-16
Est. Actual
2016-17
Budget
Hospital and Health Services 4, 5 64,604 68,498 69,361
Queensland Ambulance Service 6, 7 4,106 4,146 4,261
eHealth Queensland 8, 9 1,102 1,232 1,318
Health Support Queensland 10 3,871 4,090 4,235
Other Department of Health 11, 12 1,759 1,659 1,755
TOTAL 75,442 79,625 80,930
Notes: 1. The 2015-16 Budget reflects the forecast full-time equivalents (FTEs) as at 30 June 2016 published in the 2015-16 Service Delivery
Statement. 2. The 2015-16 Estimated Actual reflects the current estimated FTEs as at 30 June 2016.3. The 2016-17 Budget represents the forecast FTEs and, for HHSs, may change due to updates to the 2016-17 Service Agreement throughout
the financial year.4. Increases in FTEs from the 2015-16 Budget to the 2015-16 Estimated Actual predominantly reflect commissioning of new services and
additional activity purchased from the HHSs through amendments to the 2015-16 Service Agreements. For example, additional initiatives havebeen rolled out across the HHSs including: Outpatient Waitlist Reduction Strategies; growth in sub specialty services; and new funding forGraduate nurses. The Digital Hospital initiative implementation across several HHSs has also considerably increased the Estimated ActualFTEs in 2015-16.
5. Increases in FTEs for the 2016-17 Budget reflect commissioning of new services and additional activity purchased from the HHSs. Otherincreases are due to: the start-up of the new Sunshine Coast University Hospital (SCUH) in April 2017; the Lady Cilento Children’s Hospital(LCCH) increased capacity; higher than anticipated demand for hospital services; and several other initiatives.
6. Increases in FTEs from the 2015-16 Budget to the 2015-16 Estimated Actual reflect the recruitment of additional frontline Ambulance Officersto meet increasing demand.
7. Increases in FTEs for the 2016-17 Budget predominantly relate to the recruitment of additional frontline Ambulance Officers to meet increasingdemand, with the remainder being additional temporary positions required for the implementation of a new Human Resources/Payroll Solution.
8. Increases in FTEs from the 2015-16 Budget to the 2015-16 Estimated Actual relate to temporary project staff engaged to deliver on capitalfunded programs including the Windows 10 upgrade, Office 365 rollout, SCUH Project, and new services required at Digital Hospital sites.
9. Increases in FTEs for the 2016-17 Budget are due to the continuation of temporary project staff for capital funded programs including theWindows 10 upgrade, Office 365 rollout, SCUH Project, and new services required at Digital Hospital sites.
10. The increases in FTEs from the 2015-16 Budget to the 2015-16 Estimated Actual, as well as the increase in FTEs for the 2016-17 Budget, aredue to: the growth in services provided to HHSs to meet increased demand; new services provision to LCCH and SCUH; the initiation of majorbusiness improvement projects such as procurement renewal, the replacement pathology system; the new front end Payroll rostering system;and the conversion of contract and agency staff to permanent employees.
11. The reduction in FTEs from the 2015-16 Budget to the 2015-16 Estimated Actual relates to the active management of staffing within thepublished Budget figure to allow for contingent and emergent needs.
12. The reduction in FTEs from the 2015-16 Budget to the 2016-17 Budget is due to four FTEs being transferred to the Department ofInfrastructure, Local Government and Planning to support the Infrastructure Portfolio Office.
2016-17 Queensland State Budget – Service Delivery Statements – Queensland Health 22
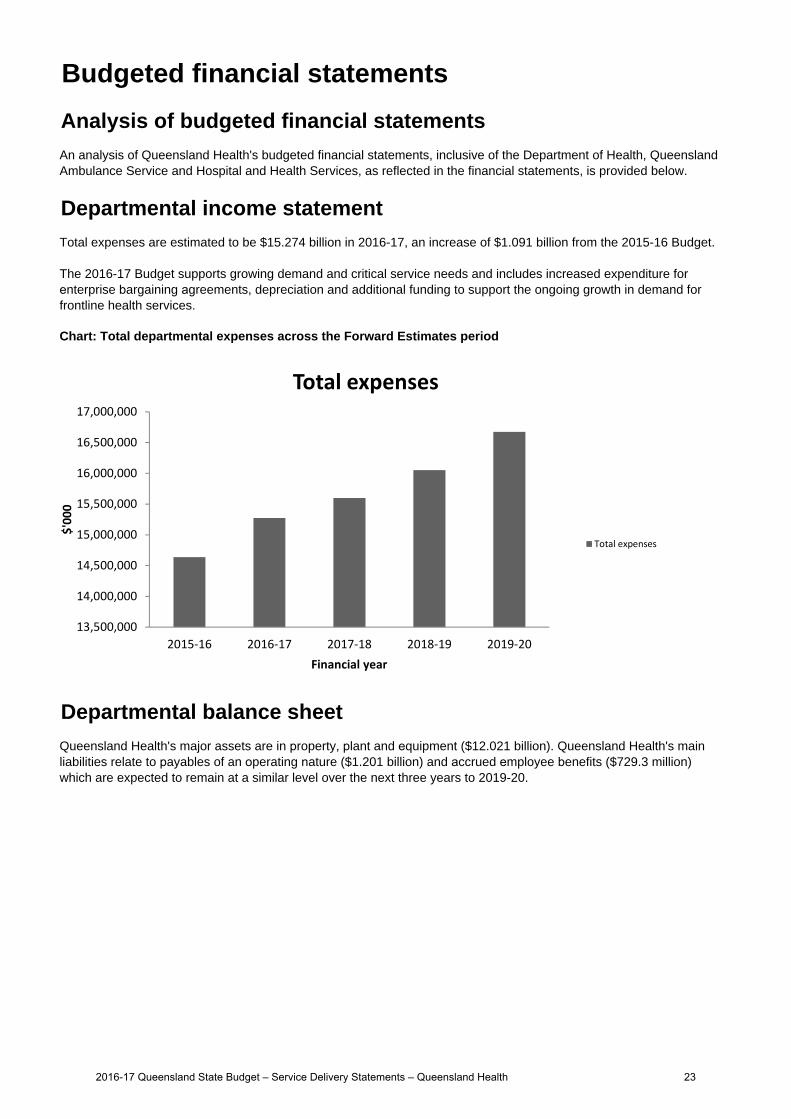
Chart: Total departmental expenses across the Forward Estimates period
Queensland Health's major assets are in property, plant and equipment ($12.021 billion). Queensland Health's main liabilities relate to payables of an operating nature ($1.201 billion) and accrued employee benefits ($729.3 million) which are expected to remain at a similar level over the next three years to 2019-20.
Budgeted financial statements
Analysis of budgeted financial statements
An analysis of Queensland Health's budgeted financial statements, inclusive of the Department of Health, Queensland Ambulance Service and Hospital and Health Services, as reflected in the financial statements, is provided below.
Departmental income statement
Total expenses are estimated to be $15.274 billion in 2016-17, an increase of $1.091 billion from the 2015-16 Budget.
The 2016-17 Budget supports growing demand and critical service needs and includes increased expenditure for enterprise bargaining agreements, depreciation and additional funding to support the ongoing growth in demand for frontline health services.
Departmental balance sheet
13,500,000
14,000,000
14,500,000
15,000,000
15,500,000
16,000,000
16,500,000
17,000,000
2015‐16 2016‐17 2017‐18 2018‐19 2019‐20
$'000
Financial year
Total expenses
Total expenses
2016-17 Queensland State Budget – Service Delivery Statements – Queensland Health 23
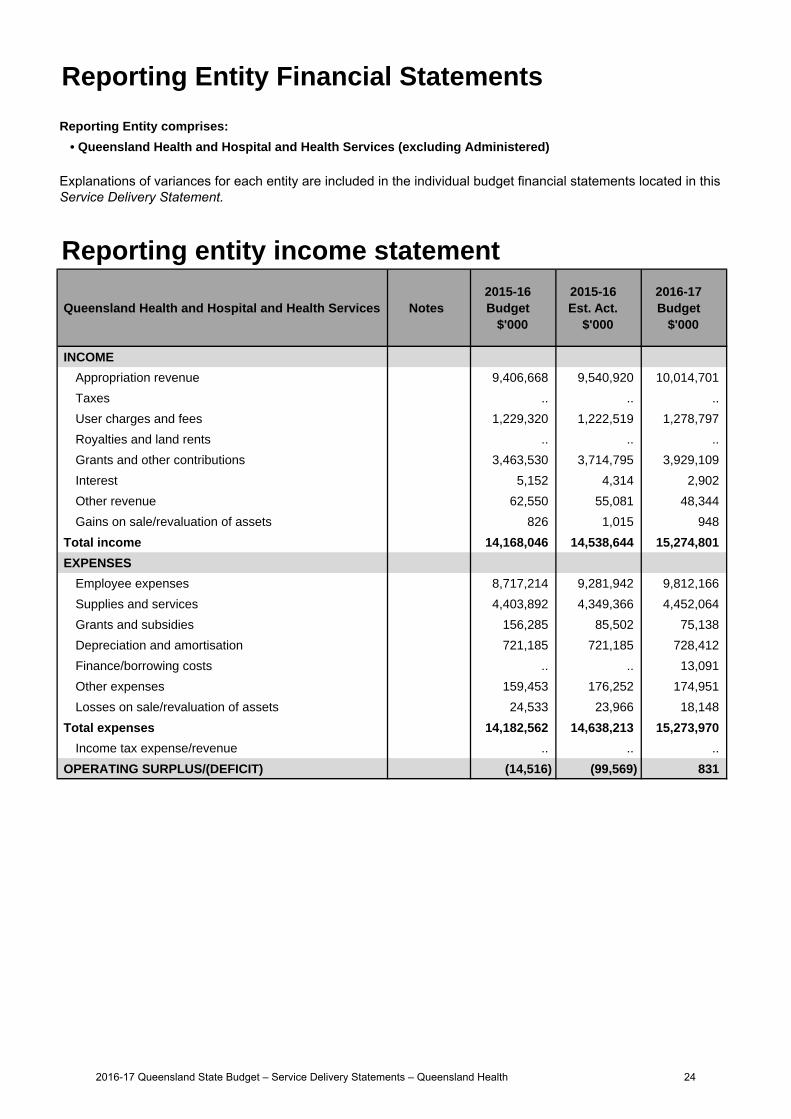
Reporting Entity Financial Statements
Reporting Entity comprises:
• Queensland Health and Hospital and Health Services (excluding Administered)
Reporting entity income statement
Queensland Health and Hospital and Health Services Notes 2015-16 Budget
$'000
2015-16 Est. Act.
$'000
2016-17 Budget
$'000
INCOME
Appropriation revenue 9,406,668 9,540,920 10,014,701
Taxes .. .. ..
User charges and fees 1,229,320 1,222,519 1,278,797
Royalties and land rents .. .. ..
Grants and other contributions 3,463,530 3,714,795 3,929,109
Interest 5,152 4,314 2,902
Other revenue 62,550 55,081 48,344
Gains on sale/revaluation of assets 826 1,015 948
Total income 14,168,046 14,538,644 15,274,801
EXPENSES
Employee expenses 8,717,214 9,281,942 9,812,166
Supplies and services 4,403,892 4,349,366 4,452,064
Grants and subsidies 156,285 85,502 75,138
Depreciation and amortisation 721,185 721,185 728,412
Finance/borrowing costs .. .. 13,091
Other expenses 159,453 176,252 174,951
Losses on sale/revaluation of assets 24,533 23,966 18,148
Total expenses 14,182,562 14,638,213 15,273,970
Income tax expense/revenue .. .. ..
OPERATING SURPLUS/(DEFICIT) (14,516) (99,569) 831
Explanations of variances for each entity are included in the individual budget financial statements located in this Service Delivery Statement.
2016-17 Queensland State Budget – Service Delivery Statements – Queensland Health 24
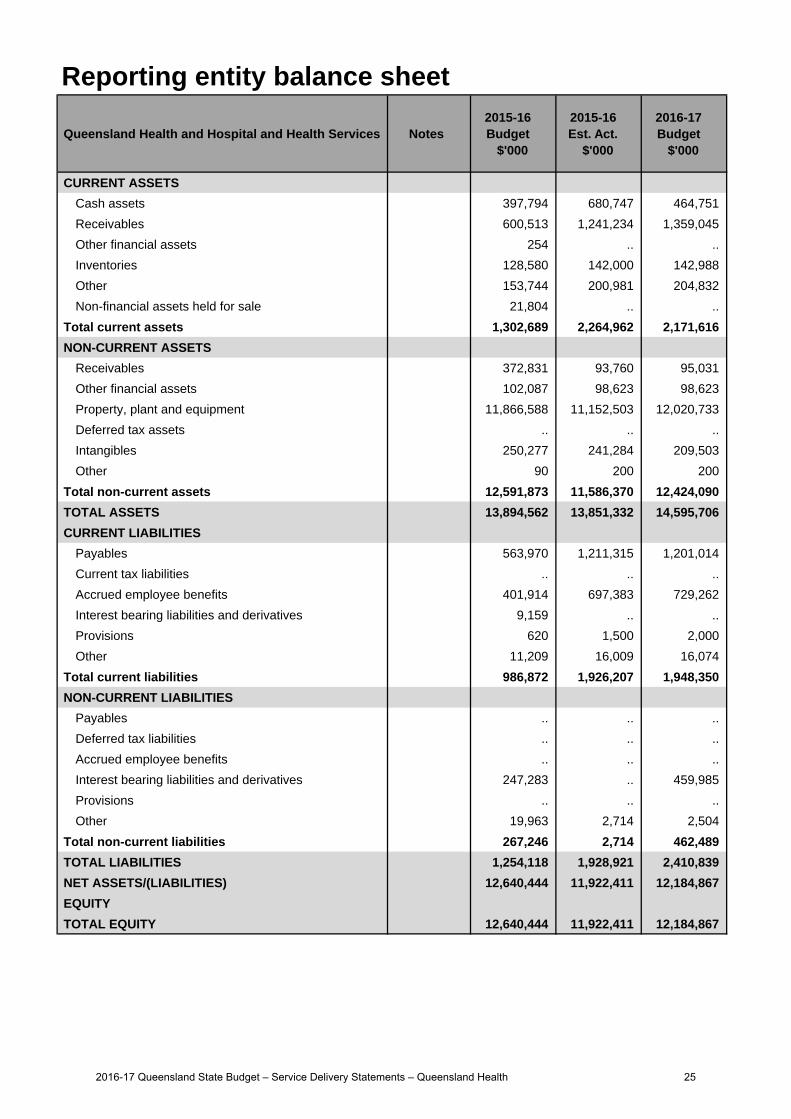
Reporting entity balance sheet
Queensland Health and Hospital and Health Services Notes 2015-16 Budget
$'000
2015-16 Est. Act.
$'000
2016-17 Budget
$'000
CURRENT ASSETS
Cash assets 397,794 680,747 464,751
Receivables 600,513 1,241,234 1,359,045
Other financial assets 254 .. ..
Inventories 128,580 142,000 142,988
Other 153,744 200,981 204,832
Non-financial assets held for sale 21,804 .. ..
Total current assets 1,302,689 2,264,962 2,171,616
NON-CURRENT ASSETS
Receivables 372,831 93,760 95,031
Other financial assets 102,087 98,623 98,623
Property, plant and equipment 11,866,588 11,152,503 12,020,733
Deferred tax assets .. .. ..
Intangibles 250,277 241,284 209,503
Other 90 200 200
Total non-current assets 12,591,873 11,586,370 12,424,090
TOTAL ASSETS 13,894,562 13,851,332 14,595,706
CURRENT LIABILITIES
Payables 563,970 1,211,315 1,201,014
Current tax liabilities .. .. ..
Accrued employee benefits 401,914 697,383 729,262
Interest bearing liabilities and derivatives 9,159 .. ..
Provisions 620 1,500 2,000
Other 11,209 16,009 16,074
Total current liabilities 986,872 1,926,207 1,948,350
NON-CURRENT LIABILITIES
Payables .. .. ..
Deferred tax liabilities .. .. ..
Accrued employee benefits .. .. ..
Interest bearing liabilities and derivatives 247,283 .. 459,985
Provisions .. .. ..
Other 19,963 2,714 2,504
Total non-current liabilities 267,246 2,714 462,489
TOTAL LIABILITIES 1,254,118 1,928,921 2,410,839
NET ASSETS/(LIABILITIES) 12,640,444 11,922,411 12,184,867
EQUITY
TOTAL EQUITY 12,640,444 11,922,411 12,184,867
2016-17 Queensland State Budget – Service Delivery Statements – Queensland Health 25
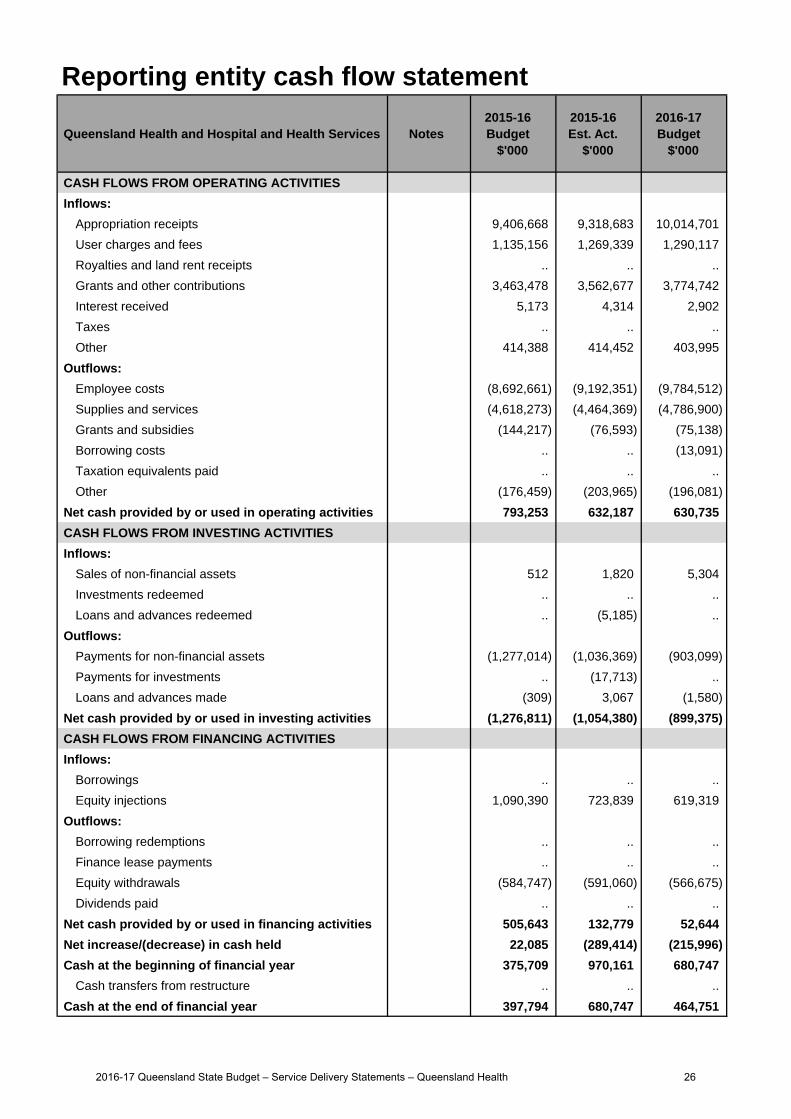
Reporting entity cash flow statement
Queensland Health and Hospital and Health Services Notes 2015-16 Budget
$'000
2015-16 Est. Act.
$'000
2016-17 Budget
$'000
CASH FLOWS FROM OPERATING ACTIVITIES
Inflows:
Appropriation receipts 9,406,668 9,318,683 10,014,701
User charges and fees 1,135,156 1,269,339 1,290,117
Royalties and land rent receipts .. .. ..
Grants and other contributions 3,463,478 3,562,677 3,774,742
Interest received 5,173 4,314 2,902
Taxes .. .. ..
Other 414,388 414,452 403,995
Outflows:
Employee costs (8,692,661) (9,192,351) (9,784,512)
Supplies and services (4,618,273) (4,464,369) (4,786,900)
Grants and subsidies (144,217) (76,593) (75,138)
Borrowing costs .. .. (13,091)
Taxation equivalents paid .. .. ..
Other (176,459) (203,965) (196,081)
Net cash provided by or used in operating activities 793,253 632,187 630,735
CASH FLOWS FROM INVESTING ACTIVITIES
Inflows:
Sales of non-financial assets 512 1,820 5,304
Investments redeemed .. .. ..
Loans and advances redeemed .. (5,185) ..
Outflows:
Payments for non-financial assets (1,277,014) (1,036,369) (903,099)
Payments for investments .. (17,713) ..
Loans and advances made (309) 3,067 (1,580)
Net cash provided by or used in investing activities (1,276,811) (1,054,380) (899,375)
CASH FLOWS FROM FINANCING ACTIVITIES
Inflows:
Borrowings .. .. ..
Equity injections 1,090,390 723,839 619,319
Outflows:
Borrowing redemptions .. .. ..
Finance lease payments .. .. ..
Equity withdrawals (584,747) (591,060) (566,675)
Dividends paid .. .. ..
Net cash provided by or used in financing activities 505,643 132,779 52,644
Net increase/(decrease) in cash held 22,085 (289,414) (215,996)
Cash at the beginning of financial year 375,709 970,161 680,747
Cash transfers from restructure .. .. ..
Cash at the end of financial year 397,794 680,747 464,751
2016-17 Queensland State Budget – Service Delivery Statements – Queensland Health 26
Department of Health overview
The Department of Health is responsible for providing leadership and direction to enable the health system to deliver safe and responsive services for Queenslanders and works in close collaboration with Hospital and Health Services (HHSs) and other organisations to achieve these goals.
The department's strategic objectives, as identified in its 2016-2020 Strategic Plan, are:
supporting Queenslanders to be healthier: promoting and protecting the health of Queenslanders
enabling safe, quality services: delivering and enabling safe, clinically effective, high quality health services
equitable health outcomes: improving health outcomes through better access to services for Queenslanders
high performance: responsive, dynamic and accountable management of the Department and of funding and serviceperformance
dynamic policy leadership: driving service improvement and innovation through a collaborative policy cycle
broad engagement with partners: harnessing the skill and knowledge of our partners
an engaged and productive workforce: fostering a culture that is vibrant, innovative and collaborative.
By implementing these strategic objectives, the department contributes to the Queensland Government’s objectives of:
delivering quality frontline services
building safe, caring and connected communities
creating jobs and a diverse economy.
The department's key responsibilities include:
Providing strategic leadership and direction through the development of policies and legislation and regulation for the health of Queenslanders by: implementing the My Health, Queensland’s Future: Advancing Health 2026 10-year vision, which provides a shared
sense of purpose and strategic direction to support improved health outcomes for all Queenslanders improving governance arrangements to ensure better coordination and collaboration across Queensland Health through
Executive Committees specifically set up for the key focus areas of: Policy and Planning; Patient Safety; StrategicProcurement; Disaster Management; eHealth; Investment; Purchasing and Performance
improving governance arrangements for administering public health legislation for which the department is responsible,such as the Food Act 2006, and implementing best practice arrangements for assessing compliance with this legislation
enacting significant changes to legislation during 2015-16 including:
- a substantial overhaul of the Mental Health Act 2000
- amendment of the Hospital and Health Boards Act 2011 to mandate safe nurse-to-patient ratios in Queensland’spublic hospitals
- amendment of the Tobacco and Other Smoking Products Act 1998 to create more smoke-free public places
- amendment of the Food Act 2006 to require fast food outlets to display kilojoule content of their food and drinks on menus
- amendment of the Public Health Act 2005 to improve the management and control of health risks (such as Legionella bacteria) associated with the supply and use of water in health and residential aged care facilities
- introduction of the Public Health (Childcare Vaccination and Other Legislation) Amendment Bill 2015 to protect vulnerable Queenslanders from preventable diseases
progressing further proposed legislative and policy changes in 2016-17, including:
- the Public Health (Medicinal Cannabis) Bill 2016 which will change current access to medicinal cannabis
- the recommendations of the Parliamentary inquiry into licensing arrangements affecting the sale and use of tobaccoin Queensland
- the Medicines, Poisons and Therapeutic Goods Bill will be introduced to provide for a contemporary and cost-effective regulatory regime for control of public health harms arising from inappropriate use of medicines and poisons
leading policy development on issues that impact on the health of Queenslanders and contributing to national policydirections where national approaches are most appropriate (e.g. blood supply and use, organ and tissue donation).
2016-17 Queensland State Budget – Service Delivery Statements – Department of Health 27
Developing statewide plans for health services, workforce, and major capital investment through: continuing to implement a range of statewide service plans for high priority areas to provide oversight and linkages
across the entire State’s healthcare system and eliminate duplication of effort and associated waste progressing business cases in line with the department’s built infrastructure and eHealth priorities to ensure
Queensland’s health infrastructure has the flexibility and capacity to meet future service requirements.Purchasing, supporting and monitoring the quality of health service delivery through: purchasing health services from HHSs, not-for-profit, community and other non-government organisations through a
range of funding mechanisms including partnerships, service agreements and grant funding ensuring agreed targets and outcomes of funded organisations are clearly established through service agreements, in
order to achieve the most effective and efficient delivery of healthcare within the allocated resources collaborating with HHSs to assess service performance, investigate the key drivers of any reduced performance and
mitigate existing or potential risks to achieving targeted outcomes set out in service agreements planning, purchasing and enabling health services to achieve the outcomes in Making Tracks towards closing the gap in
health outcomes for Indigenous Queenslanders by 2033: Investment Strategy 2015-2018 partnering with HHSs in addressing emerging statewide patient safety and quality issues to achieve safer, high quality
care.Delivering specialised health services, providing ambulance, public health, health information and communication technology and state wide health support services through: providing specialised aeromedical retrieval, disaster management and emergency telehealth support capability engaging consumers and communities in their health and promoting healthier choices and protective behaviours. In
2015-16, the department funded a range of preventative health initiatives including the 10,000 steps program, HeartFoundation Walking Groups and media campaigns which promote the consumption of fruit and vegetables
partnering with industry, communities and governments to create living and work environments that support improvedhealth through:
- continuing to support the Parliamentary Inquiry into the establishment of a Queensland Health PromotionCommission by providing advice on the potential role, scope and purpose of a commission, and evidence on the effectiveness of similar agencies and models
- progressing Health and Wellbeing Strategy 2015-2020 initiatives including:
brief interventions and support for hospital inpatients to quit smoking, pre-natal and workplace quit smokingprograms, awareness programs delivered in schools and programs to target a reduction in the high levelsof smoking in the indigenous population. These interventions are supported by Quitline and socialmarketing campaigns
the Health for Life! risk assessment and early intervention initiative to improve identification of people athigh risk of developing chronic diseases such as Type 2 diabetes and provision of lifestyle modificationsupport. The program is aimed at assisting individuals make healthier lifestyle choices and reducingavoidable hospital admissions. As part of this initiative, cross-referral will be encouraged across all fundedorganisations to better target needs and realise efficiencies through increased participation numbers
a tri-partite arrangement with the Office of Industrial Relations and WorkCover Queensland to promotehealth and wellbeing initiatives in the workplace
funding cooking and lifestyle programs being delivered by non-government organisations in high schools,rural and remote locations and disadvantaged communities
enhancing surveillance and response to emerging health threats and disasters through:
- progressing a range of endeavours which will further strengthen planning and emergency management arrangements across Queensland Health as a result of the Ravenshoe Review
- planning for the Gold Coast 2018 Commonwealth Games and the coordination of arrangements across the department, Queensland Ambulance Service, designated hospitals and supporting HHSs
delivering health technologies that have the flexibility and capacity to meet future health care and service deliveryneeds:
- in 2015-16 the department released the eHealth Investment Strategy for a digital system which provides a cohesive plan to address both legacy system risks and strategic investments needed to enable information sharing across care settings, facilities and public/provider boundaries
2016-17 Queensland State Budget – Service Delivery Statements – Department of Health 28
- leading digital healthcare innovation with the recent launch of digital hospital exemplars at the Princess Alexandra and Cairns Hospitals
- delivering a range of health services across the State that support the delivery of better health outcomes while also harnessing economies of scale across the health system
building the leadership and management capability of Queensland Health clinicians:
- delivering a range of transformational leadership and management development programs, including the Medical Leadership in Action Program, the Emerging Clinical Leaders Program, the Clinician Business Development Program, the “Step UP’ Program for early career clinicians, and the “Learn2Lead” Program for junior doctors
improving healthcare services provided in Queensland public hospitals:
- engaging and partnering with the HHSs to deliver real improvements to patient care and drive sustainable system-wide improvement, specifically in relation to access, equity and quality of services provided.
Service performance
Performance statement
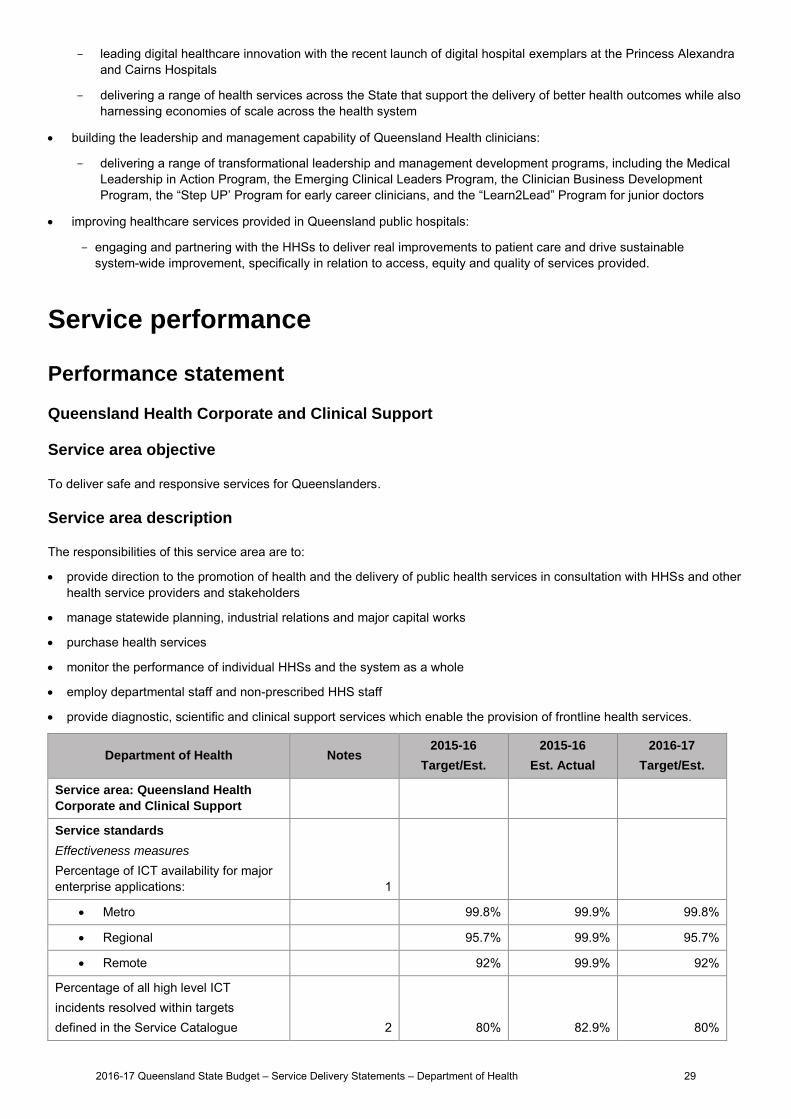
Queensland Health Corporate and Clinical Support
Service area objective
To deliver safe and responsive services for Queenslanders.
Service area description
The responsibilities of this service area are to:
provide direction to the promotion of health and the delivery of public health services in consultation with HHSs and otherhealth service providers and stakeholders
manage statewide planning, industrial relations and major capital works
purchase health services
monitor the performance of individual HHSs and the system as a whole
employ departmental staff and non-prescribed HHS staff
provide diagnostic, scientific and clinical support services which enable the provision of frontline health services.
Department of Health Notes 2015-16
Target/Est.
2015-16
Est. Actual
2016-17
Target/Est.
Service area: Queensland Health
Corporate and Clinical Support
Service standards
Effectiveness measures
Percentage of ICT availability for major enterprise applications: 1
Metro 99.8% 99.9% 99.8%
Regional 95.7% 99.9% 95.7%
Remote 92% 99.9% 92%
Percentage of all high level ICT incidents resolved within targets defined in the Service Catalogue 2 80% 82.9% 80%
2016-17 Queensland State Budget – Service Delivery Statements – Department of Health 29
Department of Health Notes 2015-16
Target/Est.
2015-16
Est. Actual
2016-17
Target/Est.
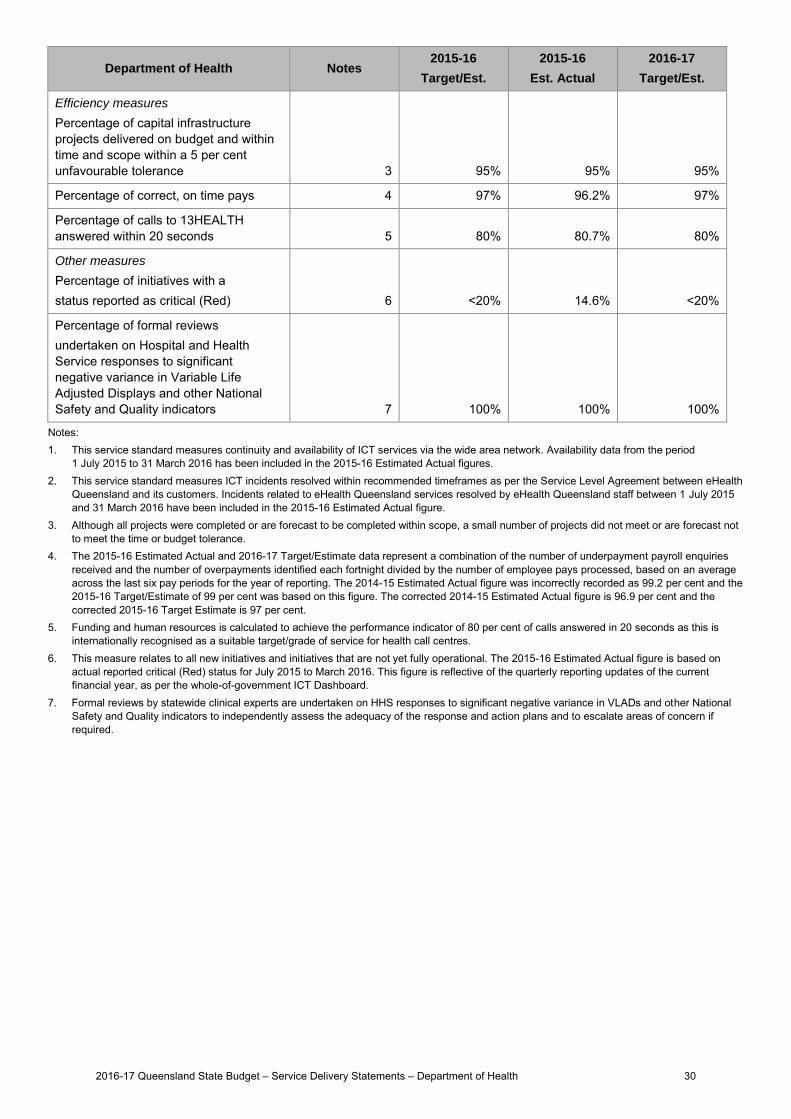
Efficiency measures
Percentage of capital infrastructure projects delivered on budget and within time and scope within a 5 per cent unfavourable tolerance 3 95% 95% 95%
Percentage of correct, on time pays 4 97% 96.2% 97%
Percentage of calls to 13HEALTH answered within 20 seconds 5 80% 80.7% 80%
Other measures
Percentage of initiatives with a status reported as critical (Red) 6 <20% 14.6% <20%
Percentage of formal reviews undertaken on Hospital and Health Service responses to significant negative variance in Variable Life Adjusted Displays and other National Safety and Quality indicators 7 100% 100% 100%
Notes: 1. This service standard measures continuity and availability of ICT services via the wide area network. Availability data from the period
1 July 2015 to 31 March 2016 has been included in the 2015-16 Estimated Actual figures. 2. This service standard measures ICT incidents resolved within recommended timeframes as per the Service Level Agreement between eHealth
Queensland and its customers. Incidents related to eHealth Queensland services resolved by eHealth Queensland staff between 1 July 2015 and 31 March 2016 have been included in the 2015-16 Estimated Actual figure.
3. Although all projects were completed or are forecast to be completed within scope, a small number of projects did not meet or are forecast notto meet the time or budget tolerance.
4. The 2015-16 Estimated Actual and 2016-17 Target/Estimate data represent a combination of the number of underpayment payroll enquiriesreceived and the number of overpayments identified each fortnight divided by the number of employee pays processed, based on an average across the last six pay periods for the year of reporting. The 2014-15 Estimated Actual figure was incorrectly recorded as 99.2 per cent and the 2015-16 Target/Estimate of 99 per cent was based on this figure. The corrected 2014-15 Estimated Actual figure is 96.9 per cent and the corrected 2015-16 Target Estimate is 97 per cent.
5. Funding and human resources is calculated to achieve the performance indicator of 80 per cent of calls answered in 20 seconds as this isinternationally recognised as a suitable target/grade of service for health call centres.
6. This measure relates to all new initiatives and initiatives that are not yet fully operational. The 2015-16 Estimated Actual figure is based onactual reported critical (Red) status for July 2015 to March 2016. This figure is reflective of the quarterly reporting updates of the current financial year, as per the whole-of-government ICT Dashboard.
7. Formal reviews by statewide clinical experts are undertaken on HHS responses to significant negative variance in VLADs and other NationalSafety and Quality indicators to independently assess the adequacy of the response and action plans and to escalate areas of concern if required.
2016-17 Queensland State Budget – Service Delivery Statements – Department of Health 30
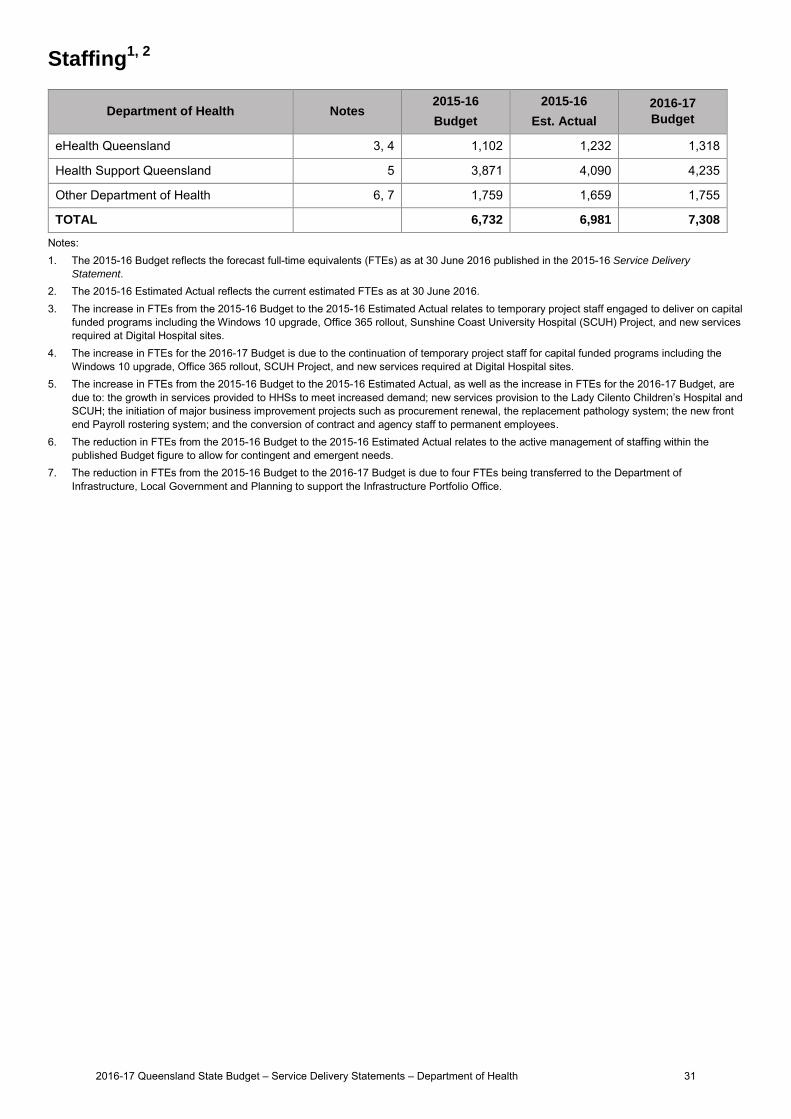
Staffing1, 2
Department of Health Notes 2015-16
Budget
2015-16
Est. Actual
2016-17
Budget
eHealth Queensland 3, 4 1,102 1,232 1,318
Health Support Queensland 5 3,871 4,090 4,235
Other Department of Health 6, 7 1,759 1,659 1,755
TOTAL 6,732 6,981 7,308
Notes: 1. The 2015-16 Budget reflects the forecast full-time equivalents (FTEs) as at 30 June 2016 published in the 2015-16 Service Delivery
Statement. 2. The 2015-16 Estimated Actual reflects the current estimated FTEs as at 30 June 2016.3. The increase in FTEs from the 2015-16 Budget to the 2015-16 Estimated Actual relates to temporary project staff engaged to deliver on capital
funded programs including the Windows 10 upgrade, Office 365 rollout, Sunshine Coast University Hospital (SCUH) Project, and new servicesrequired at Digital Hospital sites.
4. The increase in FTEs for the 2016-17 Budget is due to the continuation of temporary project staff for capital funded programs including theWindows 10 upgrade, Office 365 rollout, SCUH Project, and new services required at Digital Hospital sites.
5. The increase in FTEs from the 2015-16 Budget to the 2015-16 Estimated Actual, as well as the increase in FTEs for the 2016-17 Budget, aredue to: the growth in services provided to HHSs to meet increased demand; new services provision to the Lady Cilento Children’s Hospital andSCUH; the initiation of major business improvement projects such as procurement renewal, the replacement pathology system; the new frontend Payroll rostering system; and the conversion of contract and agency staff to permanent employees.
6. The reduction in FTEs from the 2015-16 Budget to the 2015-16 Estimated Actual relates to the active management of staffing within thepublished Budget figure to allow for contingent and emergent needs.
7. The reduction in FTEs from the 2015-16 Budget to the 2016-17 Budget is due to four FTEs being transferred to the Department ofInfrastructure, Local Government and Planning to support the Infrastructure Portfolio Office.
2016-17 Queensland State Budget – Service Delivery Statements – Department of Health 31
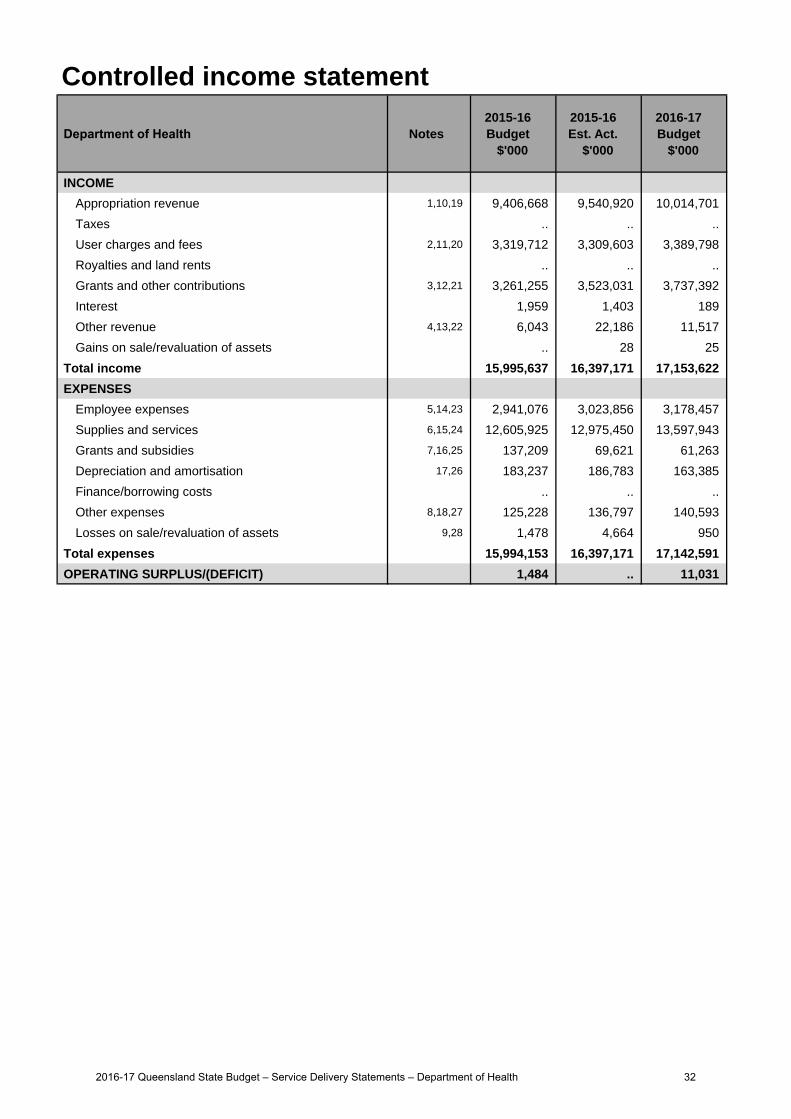
Controlled income statement
Department of Health Notes 2015-16 Budget
$'000
2015-16 Est. Act.
$'000
2016-17 Budget
$'000
INCOME
Appropriation revenue 1,10,19 9,406,668 9,540,920 10,014,701
Taxes .. .. ..
User charges and fees 2,11,20 3,319,712 3,309,603 3,389,798
Royalties and land rents .. .. ..
Grants and other contributions 3,12,21 3,261,255 3,523,031 3,737,392
Interest 1,959 1,403 189
Other revenue 4,13,22 6,043 22,186 11,517
Gains on sale/revaluation of assets .. 28 25
Total income 15,995,637 16,397,171 17,153,622
EXPENSES
Employee expenses 5,14,23 2,941,076 3,023,856 3,178,457
Supplies and services 6,15,24 12,605,925 12,975,450 13,597,943
Grants and subsidies 7,16,25 137,209 69,621 61,263
Depreciation and amortisation 17,26 183,237 186,783 163,385
Finance/borrowing costs .. .. ..
Other expenses 8,18,27 125,228 136,797 140,593
Losses on sale/revaluation of assets 9,28 1,478 4,664 950
Total expenses 15,994,153 16,397,171 17,142,591
OPERATING SURPLUS/(DEFICIT) 1,484 .. 11,031
2016-17 Queensland State Budget – Service Delivery Statements – Department of Health 32
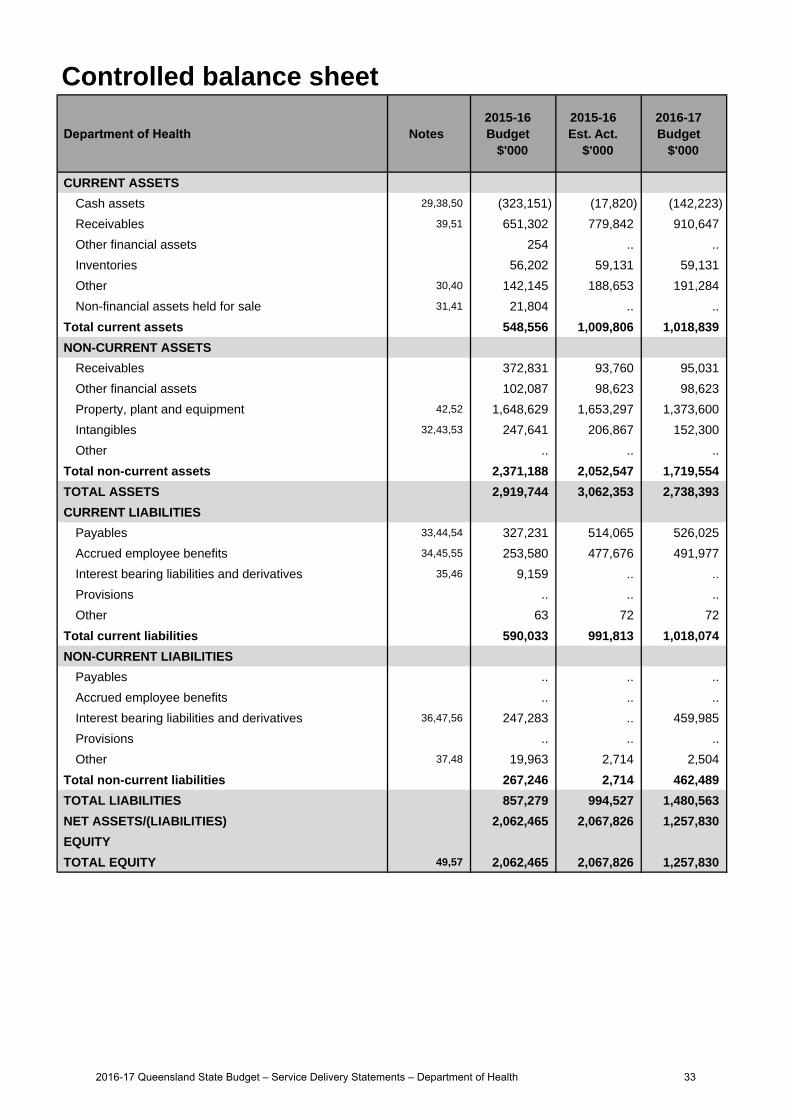
Controlled balance sheet
Department of Health Notes 2015-16 Budget
$'000
2015-16 Est. Act.
$'000
2016-17 Budget
$'000
CURRENT ASSETS
Cash assets 29,38,50 (323,151) (17,820) (142,223)
Receivables 39,51 651,302 779,842 910,647
Other financial assets 254 .. ..
Inventories 56,202 59,131 59,131
Other 30,40 142,145 188,653 191,284
Non-financial assets held for sale 31,41 21,804 .. ..
Total current assets 548,556 1,009,806 1,018,839
NON-CURRENT ASSETS
Receivables 372,831 93,760 95,031
Other financial assets 102,087 98,623 98,623
Property, plant and equipment 42,52 1,648,629 1,653,297 1,373,600
Intangibles 32,43,53 247,641 206,867 152,300
Other .. .. ..
Total non-current assets 2,371,188 2,052,547 1,719,554
TOTAL ASSETS 2,919,744 3,062,353 2,738,393
CURRENT LIABILITIES
Payables 33,44,54 327,231 514,065 526,025
Accrued employee benefits 34,45,55 253,580 477,676 491,977
Interest bearing liabilities and derivatives 35,46 9,159 .. ..
Provisions .. .. ..
Other 63 72 72
Total current liabilities 590,033 991,813 1,018,074
NON-CURRENT LIABILITIES
Payables .. .. ..
Accrued employee benefits .. .. ..
Interest bearing liabilities and derivatives 36,47,56 247,283 .. 459,985
Provisions .. .. ..
Other 37,48 19,963 2,714 2,504
Total non-current liabilities 267,246 2,714 462,489
TOTAL LIABILITIES 857,279 994,527 1,480,563
NET ASSETS/(LIABILITIES) 2,062,465 2,067,826 1,257,830
EQUITY
TOTAL EQUITY 49,57 2,062,465 2,067,826 1,257,830
2016-17 Queensland State Budget – Service Delivery Statements – Department of Health 33
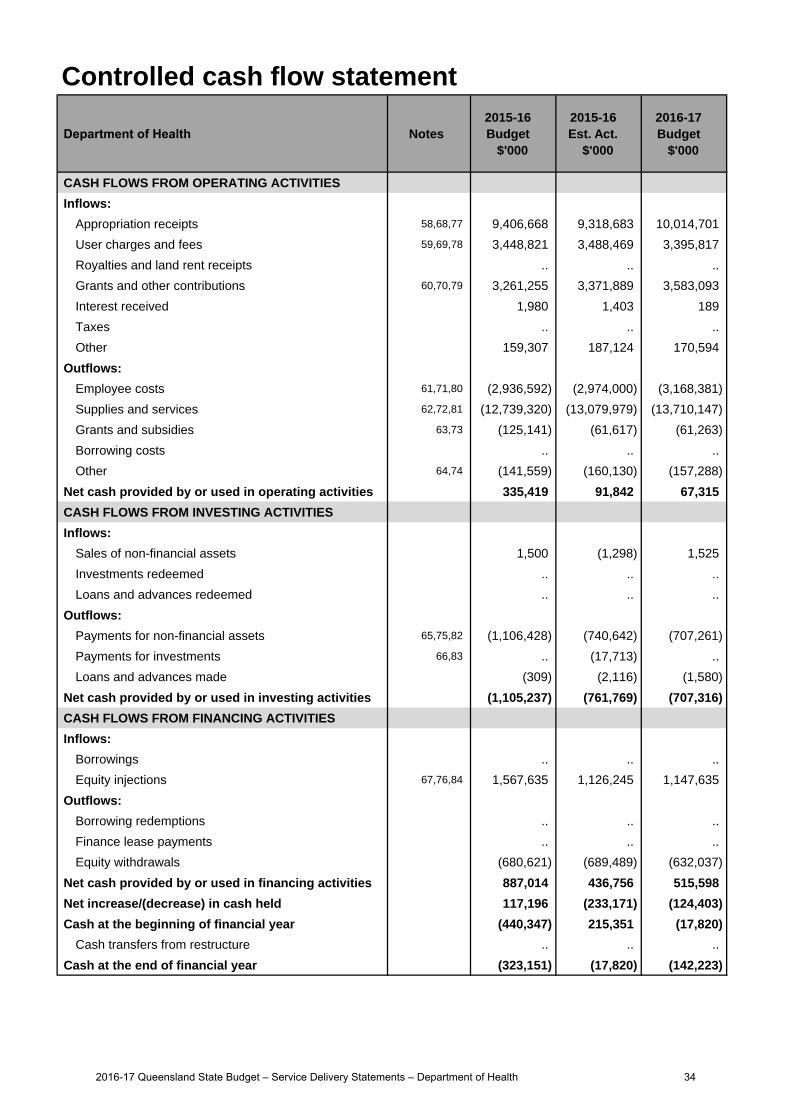
Controlled cash flow statement
Department of Health Notes 2015-16 Budget
$'000
2015-16 Est. Act.
$'000
2016-17 Budget
$'000
CASH FLOWS FROM OPERATING ACTIVITIES
Inflows:
Appropriation receipts 58,68,77 9,406,668 9,318,683 10,014,701
User charges and fees 59,69,78 3,448,821 3,488,469 3,395,817
Royalties and land rent receipts .. .. ..
Grants and other contributions 60,70,79 3,261,255 3,371,889 3,583,093
Interest received 1,980 1,403 189
Taxes .. .. ..
Other 159,307 187,124 170,594
Outflows:
Employee costs 61,71,80 (2,936,592) (2,974,000) (3,168,381)
Supplies and services 62,72,81 (12,739,320) (13,079,979) (13,710,147)
Grants and subsidies 63,73 (125,141) (61,617) (61,263)
Borrowing costs .. .. ..
Other 64,74 (141,559) (160,130) (157,288)
Net cash provided by or used in operating activities 335,419 91,842 67,315
CASH FLOWS FROM INVESTING ACTIVITIES
Inflows:
Sales of non-financial assets 1,500 (1,298) 1,525
Investments redeemed .. .. ..
Loans and advances redeemed .. .. ..
Outflows:
Payments for non-financial assets 65,75,82 (1,106,428) (740,642) (707,261)
Payments for investments 66,83 .. (17,713) ..
Loans and advances made (309) (2,116) (1,580)
Net cash provided by or used in investing activities (1,105,237) (761,769) (707,316)
CASH FLOWS FROM FINANCING ACTIVITIES
Inflows:
Borrowings .. .. ..
Equity injections 67,76,84 1,567,635 1,126,245 1,147,635
Outflows:
Borrowing redemptions .. .. ..
Finance lease payments .. .. ..
Equity withdrawals (680,621) (689,489) (632,037)
Net cash provided by or used in financing activities 887,014 436,756 515,598
Net increase/(decrease) in cash held 117,196 (233,171) (124,403)
Cash at the beginning of financial year (440,347) 215,351 (17,820)
Cash transfers from restructure .. .. ..
Cash at the end of financial year (323,151) (17,820) (142,223)
2016-17 Queensland State Budget – Service Delivery Statements – Department of Health 34
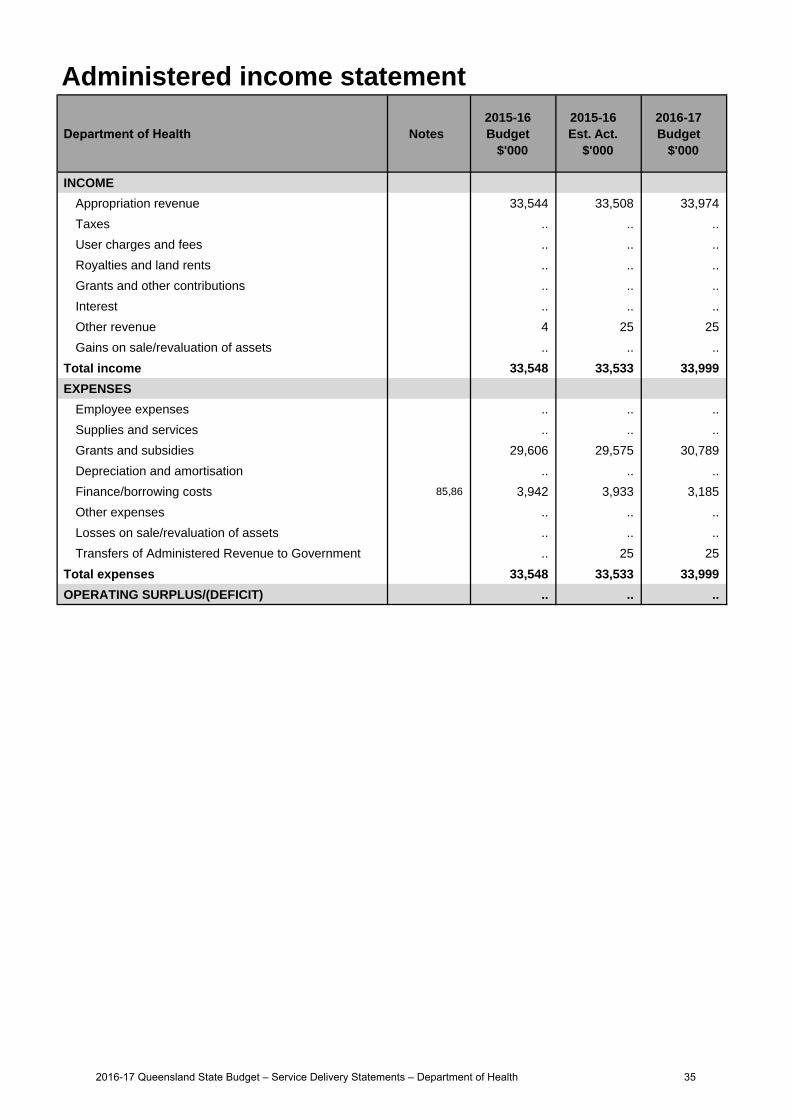
Administered income statement
Department of Health Notes 2015-16 Budget
$'000
2015-16 Est. Act.
$'000
2016-17 Budget
$'000
INCOME
Appropriation revenue 33,544 33,508 33,974
Taxes .. .. ..
User charges and fees .. .. ..
Royalties and land rents .. .. ..
Grants and other contributions .. .. ..
Interest .. .. ..
Other revenue 4 25 25
Gains on sale/revaluation of assets .. .. ..
Total income 33,548 33,533 33,999
EXPENSES
Employee expenses .. .. ..
Supplies and services .. .. ..
Grants and subsidies 29,606 29,575 30,789
Depreciation and amortisation .. .. ..
Finance/borrowing costs 85,86 3,942 3,933 3,185
Other expenses .. .. ..
Losses on sale/revaluation of assets .. .. ..
Transfers of Administered Revenue to Government .. 25 25
Total expenses 33,548 33,533 33,999
OPERATING SURPLUS/(DEFICIT) .. .. ..
2016-17 Queensland State Budget – Service Delivery Statements – Department of Health 35
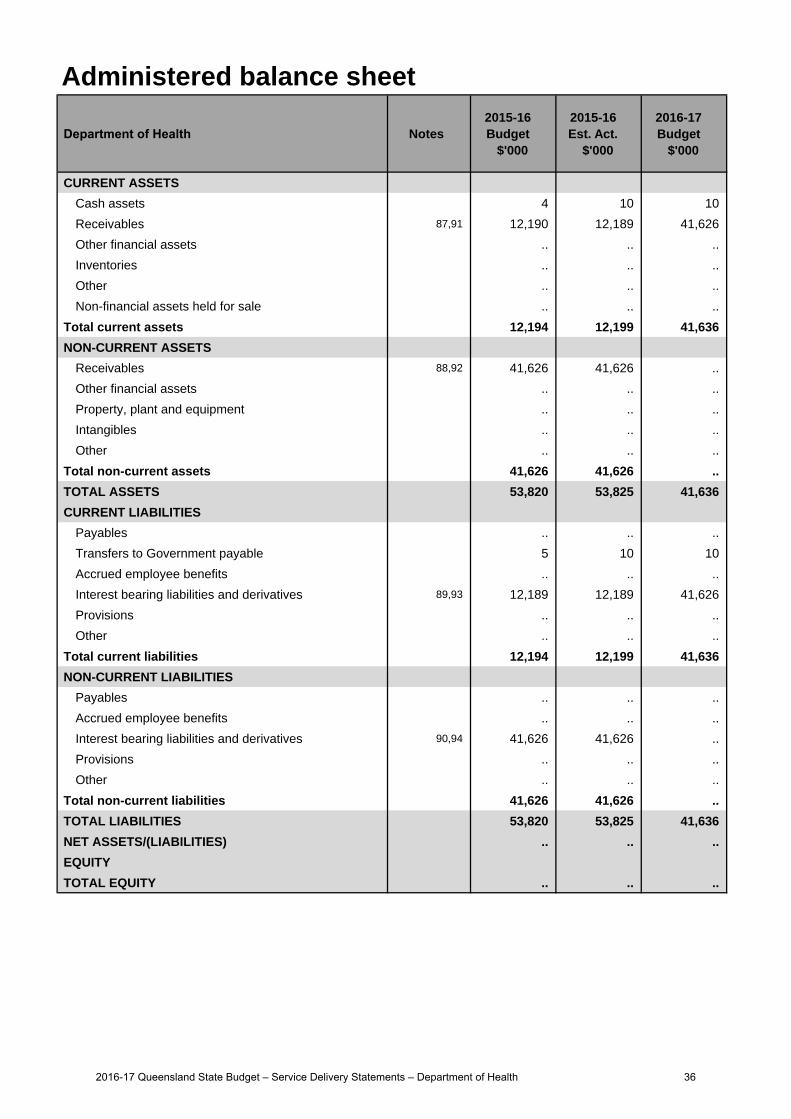
Administered balance sheet
Department of Health Notes 2015-16 Budget
$'000
2015-16 Est. Act.
$'000
2016-17 Budget
$'000
CURRENT ASSETS
Cash assets 4 10 10
Receivables 87,91 12,190 12,189 41,626
Other financial assets .. .. ..
Inventories .. .. ..
Other .. .. ..
Non-financial assets held for sale .. .. ..
Total current assets 12,194 12,199 41,636
NON-CURRENT ASSETS
Receivables 88,92 41,626 41,626 ..
Other financial assets .. .. ..
Property, plant and equipment .. .. ..
Intangibles .. .. ..
Other .. .. ..
Total non-current assets 41,626 41,626 ..
TOTAL ASSETS 53,820 53,825 41,636
CURRENT LIABILITIES
Payables .. .. ..
Transfers to Government payable 5 10 10
Accrued employee benefits .. .. ..
Interest bearing liabilities and derivatives 89,93 12,189 12,189 41,626
Provisions .. .. ..
Other .. .. ..
Total current liabilities 12,194 12,199 41,636
NON-CURRENT LIABILITIES
Payables .. .. ..
Accrued employee benefits .. .. ..
Interest bearing liabilities and derivatives 90,94 41,626 41,626 ..
Provisions .. .. ..
Other .. .. ..
Total non-current liabilities 41,626 41,626 ..
TOTAL LIABILITIES 53,820 53,825 41,636
NET ASSETS/(LIABILITIES) .. .. ..
EQUITY
TOTAL EQUITY .. .. ..
2016-17 Queensland State Budget – Service Delivery Statements – Department of Health 36
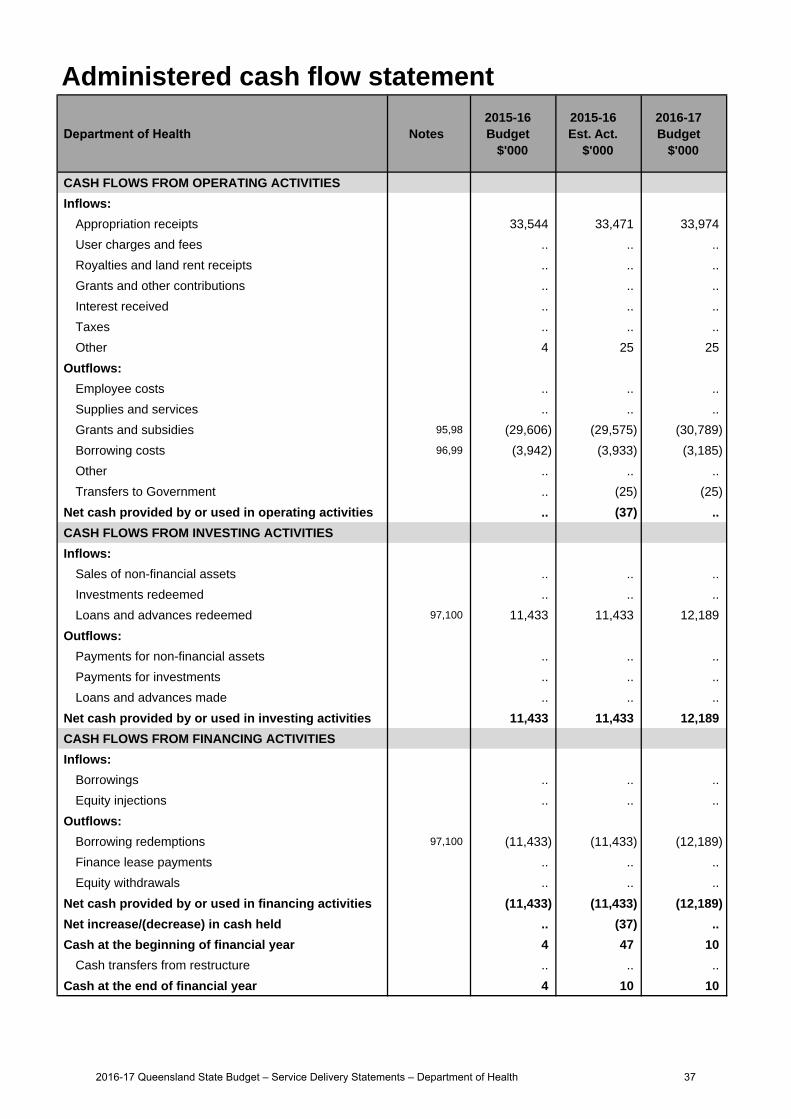
Administered cash flow statement
Department of Health Notes 2015-16 Budget
$'000
2015-16 Est. Act.
$'000
2016-17 Budget
$'000
CASH FLOWS FROM OPERATING ACTIVITIES
Inflows:
Appropriation receipts 33,544 33,471 33,974
User charges and fees .. .. ..
Royalties and land rent receipts .. .. ..
Grants and other contributions .. .. ..
Interest received .. .. ..
Taxes .. .. ..
Other 4 25 25
Outflows:
Employee costs .. .. ..
Supplies and services .. .. ..
Grants and subsidies 95,98 (29,606) (29,575) (30,789)
Borrowing costs 96,99 (3,942) (3,933) (3,185)
Other .. .. ..
Transfers to Government .. (25) (25)
Net cash provided by or used in operating activities .. (37) ..
CASH FLOWS FROM INVESTING ACTIVITIES
Inflows:
Sales of non-financial assets .. .. ..
Investments redeemed .. .. ..
Loans and advances redeemed 97,100 11,433 11,433 12,189
Outflows:
Payments for non-financial assets .. .. ..
Payments for investments .. .. ..
Loans and advances made .. .. ..
Net cash provided by or used in investing activities 11,433 11,433 12,189
CASH FLOWS FROM FINANCING ACTIVITIES
Inflows:
Borrowings .. .. ..
Equity injections .. .. ..
Outflows:
Borrowing redemptions 97,100 (11,433) (11,433) (12,189)
Finance lease payments .. .. ..
Equity withdrawals .. .. ..
Net cash provided by or used in financing activities (11,433) (11,433) (12,189)
Net increase/(decrease) in cash held .. (37) ..
Cash at the beginning of financial year 4 47 10
Cash transfers from restructure .. .. ..
Cash at the end of financial year 4 10 10
2016-17 Queensland State Budget – Service Delivery Statements – Department of Health 37
Income statementMajor variations between 2015-16 Budget and 2015-16 Estimated Actual include:
1. Increase in appropriation is due to the reprovision of prior year surplus, the re-profiling of departmental fundingoffset by the deferral of current year funding in line with revised expenditure forecasts.
2. Decrease due to reductions in forecast revenues for Interstate Patients, Licence Fees, Rent Revenue andWorkCover reimbursements together with a change in process for WorkCover recoveries. This is offset with anincrease in contract labour revenue for payroll arrangements between the department and Hospital and HealthServices.
3. Increase is driven by greater National Health Reform Agreement funding as well as increased Commonwealthprograms funding estimates.
4. Increase relates to higher revenues from recoveries and reimbursements including non recurrent Blood Programefficiencies.
5. Increase due to indexation in line with enterprise bargaining agreement rates and increase in non-prescribedHospital and Health Service staffing levels to deliver critical frontline services. Increases within the departmentare due to temporary and project based staff required in response to an increased demand for frontline servicesin Hospital and Health Services which are recoverable under fee for service arrangements.
6. Increase due to the impact of reclassification of grants expense to supplies and services in line with QueenslandTreasury Accounting Policy Guideline 20. This has been offset by a decrease due to deferrals to future years andthe re-profiling of departmental expenditure.
7. Decrease due to reclassification of grants expense to supplies and services in line with Queensland TreasuryAccounting Policy Guideline 20. This has been offset an increase in expense for contributions to non-governmententities (Sunshine Coast University Hospital project).
8. Increase relates to higher than anticipated expenditure for frontline services provided to Hospital and HealthServices in line with increased activity.
9. Increase relates to capital works in progress written off in 2015-16 as a result of revaluation of works in progressprior to capitalisation and transfer to Hospital and Health Services.
Major variations between 2015-16 Budget and 2016-17 Budget include:
10. Increase in appropriation includes growth funding for frontline services, increased funding for enterprisebargaining agreements and the deferral of program funding in line with revised expenditure forecasts. Thisincrease is offset by an overall decrease in Commonwealth National Partnership Agreement funding due toprograms either ceasing or yet to be renegotiated.
11. Increase due to additional service revenue in response to an increased demand for frontline services in Hospitaland Health Services under fee for service arrangements.
12. Increase is driven by greater National Health Reform Agreement funding as well as increased Commonwealthprograms funding estimates offset by reduced general grants.
13. Increase relates to higher than anticipated recoveries and general reimbursements, consistent with increasedfrontline services expenses.
14. Increase due to indexation in line with enterprise bargaining agreement rates and increase in non-prescribedHospital and Health Service staffing levels to deliver critical frontline services. Increases within the departmentare due to temporary and project based staff required in response to an increased demand for frontline servicesin Hospital and Health Services which are recoverable under fee for service arrangements.
15. Increase due to the inclusion of expenses associated with deferred and new funding programs, such as growthfunding for frontline services, and indexation to account for likely overall increase.
16. Decrease due to the impact of reclassification of grants expense to supplies and services in line withQueensland Treasury Accounting Policy Guideline 20.
17. Decrease relates to assets coming to the end of their useful life and a reduction in commissioning of departmentalassets in line with reduced Capital Acquisition Plan activity.
18. Increase relates to higher than anticipated expenditure for frontline services provided to Hospital and HealthServices in line with increased activity.
Explanation of variances in the financial statements
2016-17 Queensland State Budget – Service Delivery Statements – Department of Health 38
Major variations between 2015-16 Estimated Actual and the 2016-17 Budget include:
19. Increase in appropriation includes growth funding for frontline services, increased funding for enterprisebargaining agreements and the deferral of program funding in line with revised expenditure forecasts. Thisincrease is offset by an overall decrease in Commonwealth National Partnership Agreement funding due toprograms either ceasing or yet to be renegotiated.
20. Increase due to additional service revenue in response to an increased demand for frontline services in Hospitaland Health Services under fee for service arrangements.
21. Increase is driven by higher levels of National Health Reform Agreement funding which has been offset by areduction in general grants funding.
22. Decrease is due to the non-recurrent funding for the Blood Program provided in 2015-16.
23. Increase due to indexation in line with enterprise bargaining agreement rates and increase in non-prescribedHospital and Health Service staffing levels to deliver critical frontline services. Increases within the departmentare due to temporary and project based staff required in response to an increased demand for frontline servicesin Hospital and Health Services which are recoverable under fee for service arrangements.
24. Increase due to the inclusion of expenses associated with deferred and new funding programs, such as growthfunding for frontline services, and indexation to account for likely overall increase.
25. Decrease due to the impact of reclassification of grants expense to supplies and services in line withQueensland Treasury Accounting Policy Guideline 20.
26. Decrease relates to assets coming to the end of their useful life and a reduction in commissioning of departmentalassets in line with reduced Capital Acquisition Plan activity.
27. Increase relates to higher than anticipated expenditure for frontline services provided to Hospital and HealthServices in line with increased activity.
28. Decrease relates to reduction capital works in progress anticipated to be written down prior to transfer to Hospitaland Health Services in 2016-17, consistent with reduced Capital Acquisition Plan activity.
Balance sheetMajor variations between 2015-16 Budget and 2015-16 Estimated Actual include:
29. Increase in cash predominantly to an increase in payables and a reduction in anticipated outstanding debtors andend of year.
30. Increase due to change in expected balance for prepayments at end of financial year.
31. Decrease due to cancellation of land asset transfer, previously assumed to occur in 2015-16.
32. Decrease due to deferrals relating to the reduced commissioning forecast in the Capital Acquisition Plan, includingICT and software projects.
33. Increase due to change in required accrual days for payroll expenditure to be recovered from non-prescribedHospital and Health Services.
34. Increase due to timing of payments to QSuper and other contributions resulting in higher accrual amountsrequired at the end of the financial year.
35. Decrease due to reclassification in line with Lend Lease revised loan schedule.
36. Decrease due to de-recognition of anticipated liability in 2015-16.
37. Decrease due to reclassification in line with Lend Lease revised loan schedule.
Major variations between 2015-16 Budget and 2016-17 Budget include:
38. Increase in cash predominantly to an increase in payables and a reduction in anticipated outstanding debtors andend of year.
39. Increase due to change in required accrual days for payroll expenditure to be recovered from non-prescribedHospital and Health Services.
40. Increase due to change in expected balance for prepayments at end of financial year.
41. Decrease due to cancellation of land asset transfer, previously assumed to occur in 2015-16.
42. Decrease due to reduced commissioning forecast in the Capital Acquisition Plan.
43. Decrease due to the reduced activity forecast in the Capital Acquisition Plan.
2016-17 Queensland State Budget – Service Delivery Statements – Department of Health 39
44. Increase due to change in required accrual days for payroll expenditure to be recovered from non-prescribedHospital and Health Services.
45. Increase due to timing of payments to QSuper and other contributions resulting in higher accrual amountsrequired at the end of the financial year.
46. Decrease due to reclassification in line with Lend Lease revised loan schedule.
47. Increase due to recognition of Sunshine Coast University Hospital Exemplar lease arrangements.
48. Decrease due to reclassification in line with Lend Lease revised loan schedule.
49. Decrease due to the reduced activity forecast in the Capital Acquisition Plan, offset by deferral of capital funding.
Major variations between 2015-16 Estimated Actual and the 2016-17 Budget include:
50. Decrease in cash predominantly due to an increase in anticipated outstanding debtors and end of year.
51. Increase due to change in required accrual days for payroll expenditure to be recovered from non-prescribedHospital and Health Services.
52. Decrease due to reduced commissioning forecast in the Capital Acquisition Plan.
53. Decrease due to the reduced activity forecast in the Capital Acquisition Plan.
54. Increase due to indexation to account for likely overall increase in expenditure.
55. Increase in line with enterprise bargaining agreement anticipated increase.
56. Increase due to recognition of Sunshine Coast University Hospital Exemplar lease transfer.
57. Decrease due to the reduced activity forecast in the Capital Acquisition Plan, offset by deferral of capital funding.
Cash flow statementMajor variations between 2015-16 Budget and 2015-16 Estimated Actual include:
58. Decrease in appropriation is due to the deferral of current year funding in line with revised expenditure forecasts.
59. Increase due to higher contract labour revenue for payroll arrangements between the department and Hospitaland Health Services.
60. Increase is driven by greater National Health Reform Agreement funding as well as increased Commonwealthprograms funding estimates.
61. Increase due to indexation in line with enterprise bargaining agreement rates and increase in non-prescribedHospital and Health Service staffing levels to deliver critical frontline services. Increases within the departmentare due to temporary and project based staff required in response to an increased demand for frontline servicesin Hospital and Health Services which are recoverable under fee for service arrangements.
62. Increase due to the impact of reclassification of grants expense to supplies and services in line with QueenslandTreasury Accounting Policy Guideline 20. This has been offset by a decrease due to deferrals to future years andthe re-profiling of Departmental expenditure.
63. Decrease due to reclassification of grants expense to supplies and services in line with Queensland TreasuryAccounting Policy Guideline 20. This has been offset an increase in expense for contributions to non-Governmententities (Sunshine Coast University Hospital project).
64. Increase relates to higher than anticipated expenditure for frontline services provided to Hospital and HealthServices in line with increased activity.
65. Decrease due to the reduced expenditure forecast in line with reduced Capital Acquisition Plan activity anddeferral of funding into 2016-17.
66. Increase due to adjustment to the anticipated payment for the telecommunications loan as per updated loanschedule.
67. Decrease relates to deferral of Capital Acquisition Plan funding from 2015-16 to 2016-17 in line with plannedexpenditure.
2016-17 Queensland State Budget – Service Delivery Statements – Department of Health 40
Major variations between 2015-16 Budget and 2016-17 Budget include:
68. Increase in appropriation includes growth funding for frontline services, increased funding for enterprisebargaining agreements and the deferral of program funding in line with revised expenditure forecasts. Thisincrease is offset by an overall decrease in Commonwealth National Partnership Agreement funding due toprograms either ceasing or yet to be renegotiated.
69. Decrease due to reduction in anticipated timing of receipt of revenue charged to Hospital and Health Servicesunder fee for service arrangements.
70. Increase is driven by greater National Health Reform Agreement funding as well as increased Commonwealthprograms funding estimates.
71. Increase due to indexation in line with enterprise bargaining agreement rates and increase in non-prescribedHospital and Health Service staffing levels to deliver critical frontline services. Increases within the departmentare due to temporary and project based staff required in response to an increased demand for frontline servicesin Hospital and Health Services under fee for service arrangements.
72. Increase due to the inclusion of expenses associated with deferred and new funding programs, such as growthfunding for frontline services, and indexation to account for likely overall increase.
73. Decrease due to the impact of reclassification of grants expense to supplies and services in line withQueensland Treasury Accounting Policy Guideline 20.
74. Increase relates to higher than anticipated expenditure for frontline services provided to Hospital and HealthServices in line with increased activity.
75. Decrease due to the reduced expenditure forecast in line with reduced Capital Acquisition Plan funding in2016-17.
76. Decrease relates to deferrals in Capital Acquisition Plan funding.
Major variations between 2015-16 Estimated Actual and the 2016-17 Budget include:
77. Increase in appropriation includes growth funding for frontline services, increased funding for enterprisebargaining agreements and the deferral of program funding in line with revised expenditure forecasts. Thisincrease is offset by an overall decrease in Commonwealth National Partnership Agreement funding due toprograms either ceasing or yet to be renegotiated.
78. Decrease due to reduction in anticipated timing of receipt of revenue charged to Hospital and Health Servicesunder fee for service arrangements.
79. Increase is driven by higher levels of National Health Reform Agreement funding which has been offset by areduction in general grants funding.
80. Increase due to indexation in line with enterprise bargaining agreement rates and increase in non-prescribedHospital and Health Service staffing levels to deliver critical frontline services. Increases within the departmentare due to temporary and project based staff required in response to an increased demand for frontline servicesin Hospital and Health Services which are recoverable under fee for service arrangements.
81. Increase due to the inclusion of expenses associated with deferred and new funding programs, such as growthfunding for frontline services, and indexation to account for likely overall increase.
82. Decrease due to the reduced expenditure forecast in line with reduced Capital Acquisition Plan funding, partiallyoffset by deferrals of funding from 2015-16 into 2016-17 year.
83. Decrease due to 2015-16 adjustment to the anticipated payment for the telecommunications loan as per updatedloan schedule.
84. Increase relates to deferrals from the 2015-16 Capital Acquisition Plan activity, offset by an overall reduction inthe Capital Acquisition Plan.
Administered income statementMajor variations between 2015-16 Budget and 2016-17 Budget include:
85. Decrease relates to realignment of expenses to reflect loan schedule interest.
Major variations between 2015-16 Estimated Actual and the 2016-17 Budget include:
86. Decrease relates to realignment of expenses to reflect loan schedule interest.
2016-17 Queensland State Budget – Service Delivery Statements – Department of Health 41
Administered balance sheetMajor variations between 2015-16 Budget and 2016-17 Budget include:
87. Increase due to reclassification of non-current portion of loan receivable to current as per loan schedule.
88. Decrease due to reclassification of non-current portion of loan receivable to current as per loan schedule.
89. Increase due to reclassification of non-current portion of loan payable to current as per loan schedule.
90. Decrease due to reclassification of non-current portion of loan payable to current as per loan schedule.
Major variations between 2015-16 Estimated Actual and the 2016-17 Budget include:
91. Increase due to reclassification of non-current portion of loan receivable to current as per loan schedule.
92. Decrease due to reclassification of non-current portion of loan receivable to current as per loan schedule.
93. Increase due to reclassification of non-current portion of loan payable to current as per loan schedule.
94. Decrease due to reclassification of non-current portion of loan payable to current as per loan schedule.
Administered cash flow statementMajor variations between 2015-16 Budget and 2016-17 Budget include:
95. Increase relates to realignment of expenses to reflect loan schedule interest.
96. Decrease relates to realignment of expenses to reflect loan schedule interest.
97. Increase due to increased Mater loan receipts as per loan schedule.
Major variations between 2015-16 Estimated Actual and the 2016-17 Budget include:
98. Increase relates to realignment of expenses to reflect loan schedule interest.
99. Decrease relates to realignment of expenses to reflect loan schedule interest.
100. Increase due to increased Mater loan receipts as per loan schedule.
2016-17 Queensland State Budget – Service Delivery Statements – Department of Health 42
Queensland Ambulance Service
Overview
The Queensland Ambulance Service (QAS) is an integral part of the primary health care sector in Queensland. QAS’s mission is to deliver value to the community through timely, patient-focused ambulance services. Established by the Ambulance Service Act 1991, the QAS operates as a statewide service within Queensland Health, and is accountable for the delivery of pre-hospital ambulance response services, emergency and non-emergency pre-hospital patient care and transport services, inter-facility ambulance transport, casualty room services, and planning and coordination of multi-casualty incidents and disasters.
The QAS delivers ambulance services through 15 Local Ambulance Service Networks (LASNs) which are aligned to the State’s Hospital and Health Services. A 16th statewide LASN comprises the Operations Centres (OpCens). There are seven QAS OpCens throughout Queensland responsible for emergency call taking, operational deployment and dispatch, and coordination of non-urgent patient transport services.
The QAS is committed to enhancing patient and staff safety, delivering quality ambulance services in a timely manner and retaining a well-trained, well-equipped workforce. This approach meets the Government’s objectives and priorities including delivering quality front line services, strengthening the public health system and providing responsive and integrated government services.
Service summary
The QAS delivers services from 290 response locations across Queensland. In 2015-16, the QAS had an approved staff establishment of 4,106 full-time equivalents. In 2015-16, the QAS:
recruited an additional 75 ambulance officers to provide enhanced roster coverage, plus a further 40 ambulance officersas part of the department’s demand management strategies
completed the rollout of operational iPads to over 3,000 paramedics enabling them real time in-field access tocommunications and training
expanded the Higher Acuity Response Unit to service the Gold Coast utilising Critical Care Paramedics to provideadvanced lifesaving medical care to seriously injured patients
expanded the Lower Acuity Response Units (LARU) to Cairns and Sunshine Coast. LARU explores alternativepathways for lower acuity patients which may include referring or transporting a patient to their local general practitioner
completed the statewide rollout of replacement defibrillators commissioned 155 new and replacement ambulance vehicles completed construction of the Miriam Vale Station and Russell Island Station and residence replacement commenced the rollout of 116 Satellite Communication Push-to-Talk Radios in regional Queensland to increase
communication where there is no land mobile radio network coverage commenced the expansion of acute therapy for patients suffering the most serious form of heart attack.The QAS will have an operating expense budget of $673.1 million for 2016-17 which is an increase of $39.8 million (6.3 per cent) from the published 2015-16 operating expense budget of $633.3 million. Key deliverables for the QAS through 2016-17 include: recruiting 110 additional ambulance officers to provide enhanced roster coverage to manage increasing demand for
ambulance services, in addition to the 40 ambulance officers recruited in late 2015-16 commissioning 170 new and replacement ambulance vehicles and continuing the rollout of the new power assisted
stretchers (these stretchers provide an enhanced work platform for paramedics and greatly assist in improving patientand officer safety)
investing $15.9 million to undertake minor works at various ambulance stations and for the planning or delivery of newand replacement ambulance stations at Collinsville, Rainbow Beach, Yandina, Bundaberg, Birtinya, Kenilworth, CoralGardens, Wynnum and Thursday Island
enhancing emergency and disaster response capability through the construction of a QAS Emergency and FleetManagement Hub
commencing procurement of Dynamic Deployment software as a new solution to enhance resourcing and scheduling offrontline and response
providing ambulance officers with refresher training in situational awareness to reduce the potential impact ofoccupational violence of paramedics.
2016-17 Queensland State Budget – Service Delivery Statements – Queensland Ambulance Service 43
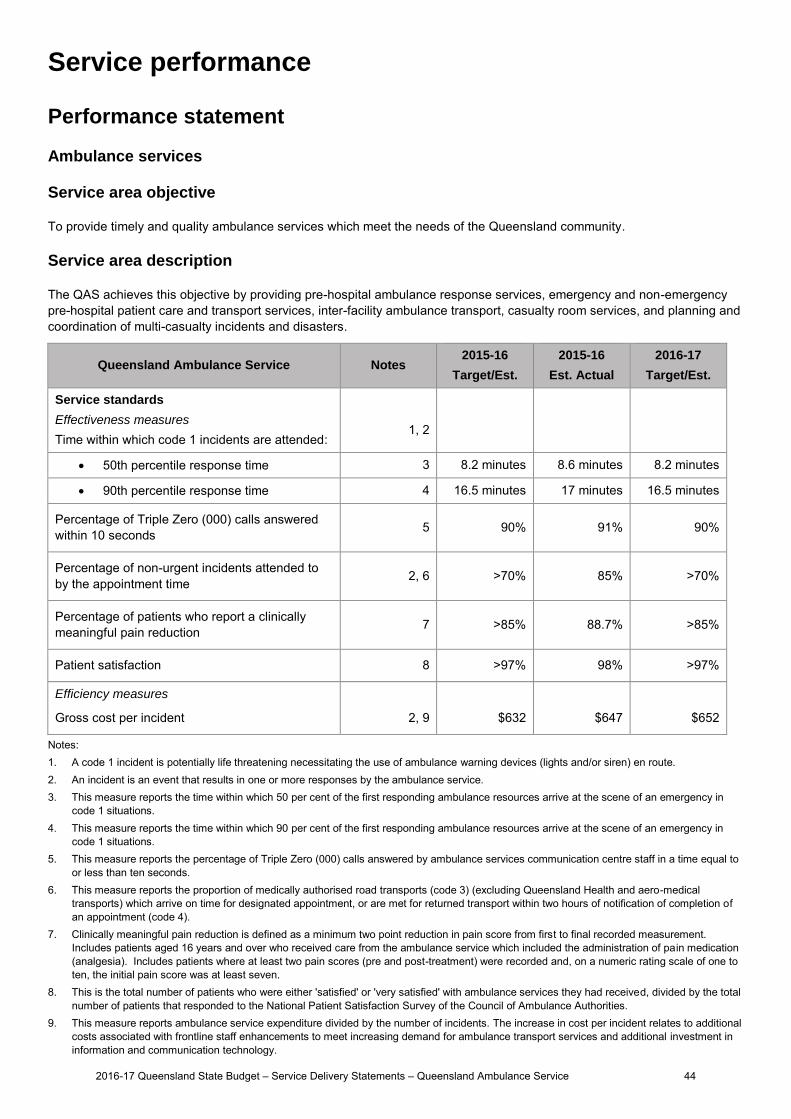
Service performance
Performance statement
Ambulance services
Service area objective
To provide timely and quality ambulance services which meet the needs of the Queensland community.
Service area description
The QAS achieves this objective by providing pre-hospital ambulance response services, emergency and non-emergency pre-hospital patient care and transport services, inter-facility ambulance transport, casualty room services, and planning and coordination of multi-casualty incidents and disasters.
Queensland Ambulance Service Notes 2015-16
Target/Est.
2015-16
Est. Actual
2016-17
Target/Est.
Service standards
Effectiveness measures
Time within which code 1 incidents are attended: 1, 2
50th percentile response time 3 8.2 minutes 8.6 minutes 8.2 minutes
90th percentile response time 4 16.5 minutes 17 minutes 16.5 minutes
Percentage of Triple Zero (000) calls answered within 10 seconds 5 90% 91% 90%
Percentage of non-urgent incidents attended to by the appointment time 2, 6 >70% 85% >70%
Percentage of patients who report a clinically meaningful pain reduction 7 >85% 88.7% >85%
Patient satisfaction 8 >97% 98% >97%
Efficiency measures
Gross cost per incident 2, 9 $632 $647 $652
Notes: 1. A code 1 incident is potentially life threatening necessitating the use of ambulance warning devices (lights and/or siren) en route.2. An incident is an event that results in one or more responses by the ambulance service.3. This measure reports the time within which 50 per cent of the first responding ambulance resources arrive at the scene of an emergency in
code 1 situations.4. This measure reports the time within which 90 per cent of the first responding ambulance resources arrive at the scene of an emergency in
code 1 situations.5. This measure reports the percentage of Triple Zero (000) calls answered by ambulance services communication centre staff in a time equal to
or less than ten seconds.6. This measure reports the proportion of medically authorised road transports (code 3) (excluding Queensland Health and aero-medical
transports) which arrive on time for designated appointment, or are met for returned transport within two hours of notification of completion ofan appointment (code 4).
7. Clinically meaningful pain reduction is defined as a minimum two point reduction in pain score from first to final recorded measurement.Includes patients aged 16 years and over who received care from the ambulance service which included the administration of pain medication(analgesia). Includes patients where at least two pain scores (pre and post-treatment) were recorded and, on a numeric rating scale of one toten, the initial pain score was at least seven.
8. This is the total number of patients who were either 'satisfied' or 'very satisfied' with ambulance services they had received, divided by the totalnumber of patients that responded to the National Patient Satisfaction Survey of the Council of Ambulance Authorities.
9. This measure reports ambulance service expenditure divided by the number of incidents. The increase in cost per incident relates to additionalcosts associated with frontline staff enhancements to meet increasing demand for ambulance transport services and additional investment ininformation and communication technology.
2016-17 Queensland State Budget – Service Delivery Statements – Queensland Ambulance Service 44
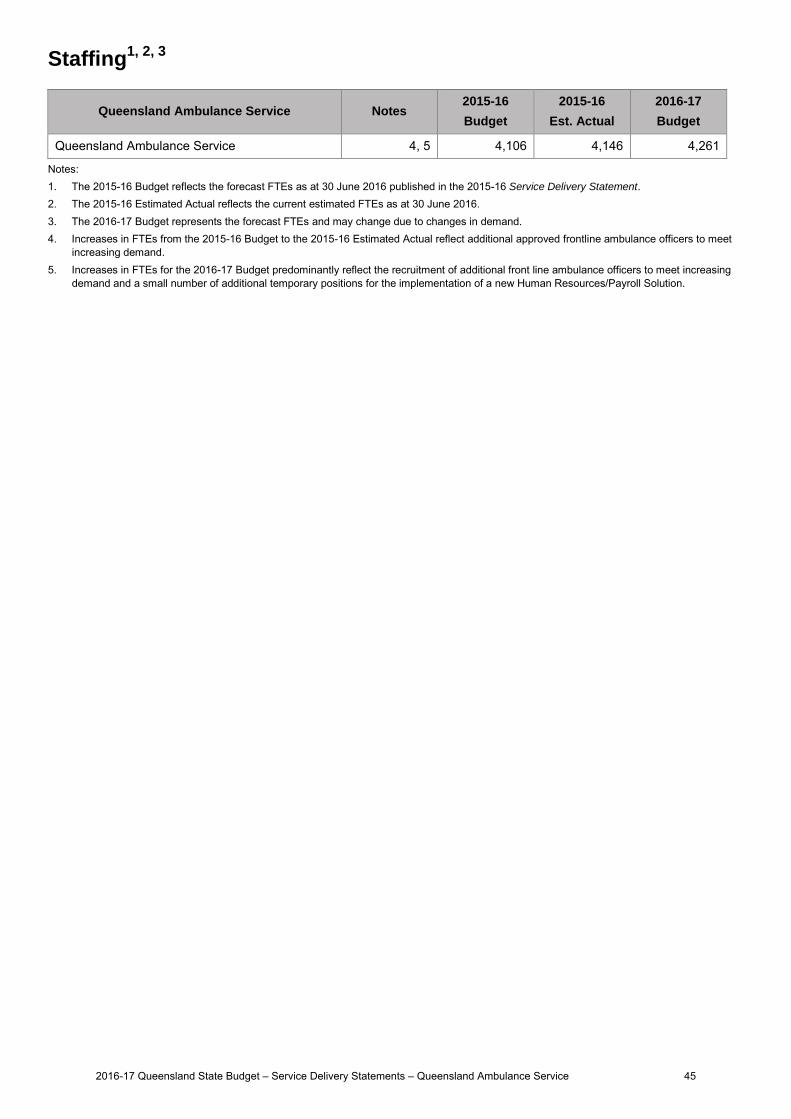
Staffing1, 2, 3
Queensland Ambulance Service Notes 2015-16
Budget
2015-16
Est. Actual
2016-17
Budget
Queensland Ambulance Service 4, 5 4,106 4,146 4,261
Notes: 1. The 2015-16 Budget reflects the forecast FTEs as at 30 June 2016 published in the 2015-16 Service Delivery Statement.2. The 2015-16 Estimated Actual reflects the current estimated FTEs as at 30 June 2016.3. The 2016-17 Budget represents the forecast FTEs and may change due to changes in demand.4. Increases in FTEs from the 2015-16 Budget to the 2015-16 Estimated Actual reflect additional approved frontline ambulance officers to meet
increasing demand.5. Increases in FTEs for the 2016-17 Budget predominantly reflect the recruitment of additional front line ambulance officers to meet increasing
demand and a small number of additional temporary positions for the implementation of a new Human Resources/Payroll Solution.
2016-17 Queensland State Budget – Service Delivery Statements – Queensland Ambulance Service 45
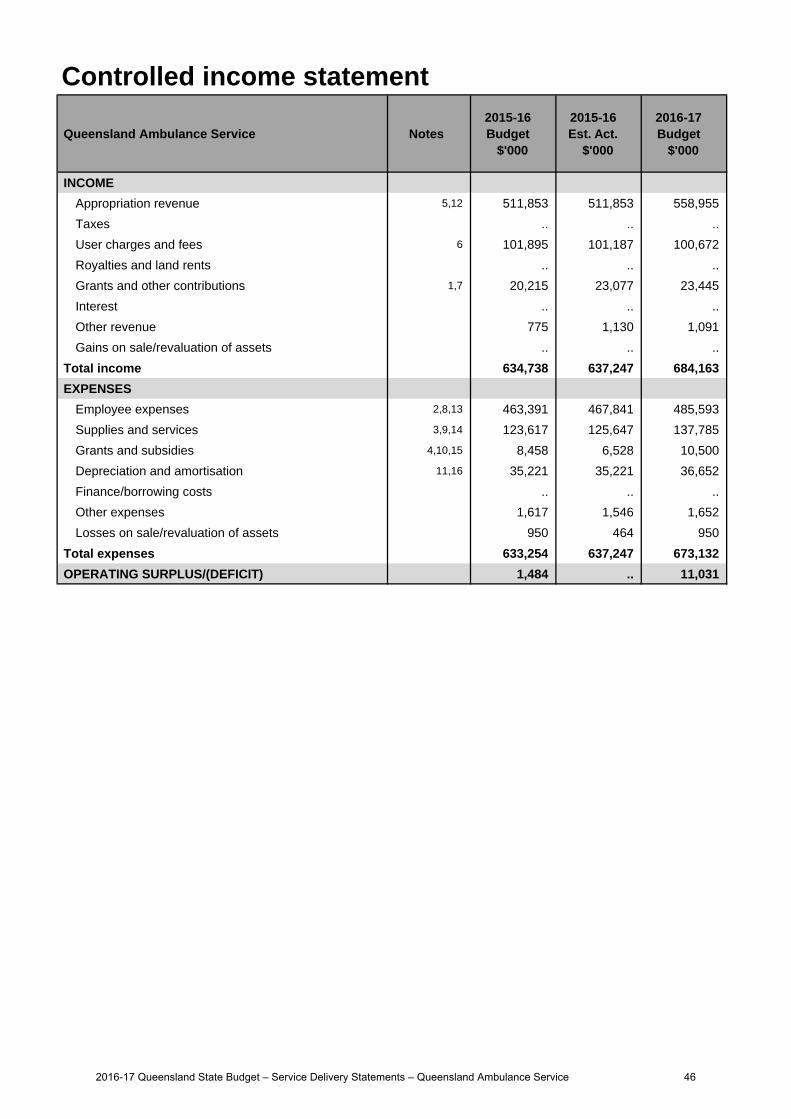
Controlled income statement
Queensland Ambulance Service Notes 2015-16 Budget
$'000
2015-16 Est. Act.
$'000
2016-17 Budget
$'000
INCOME
Appropriation revenue 5,12 511,853 511,853 558,955
Taxes .. .. ..
User charges and fees 6 101,895 101,187 100,672
Royalties and land rents .. .. ..
Grants and other contributions 1,7 20,215 23,077 23,445
Interest .. .. ..
Other revenue 775 1,130 1,091
Gains on sale/revaluation of assets .. .. ..
Total income 634,738 637,247 684,163
EXPENSES
Employee expenses 2,8,13 463,391 467,841 485,593
Supplies and services 3,9,14 123,617 125,647 137,785
Grants and subsidies 4,10,15 8,458 6,528 10,500
Depreciation and amortisation 11,16 35,221 35,221 36,652
Finance/borrowing costs .. .. ..
Other expenses 1,617 1,546 1,652
Losses on sale/revaluation of assets 950 464 950
Total expenses 633,254 637,247 673,132
OPERATING SURPLUS/(DEFICIT) 1,484 .. 11,031
2016-17 Queensland State Budget – Service Delivery Statements – Queensland Ambulance Service 46

Controlled balance sheet
Queensland Ambulance Service Notes 2015-16 Budget
$'000
2015-16 Est. Act.
$'000
2016-17 Budget
$'000
CURRENT ASSETS
Cash assets 17,25,32 16,488 42,969 37,060
Receivables 18,26 38,245 21,573 21,573
Other financial assets 254 .. ..
Inventories 1,478 1,642 1,642
Other 19,27 1,739 3,817 3,817
Non-financial assets held for sale 200 .. ..
Total current assets 58,404 70,001 64,092
NON-CURRENT ASSETS
Receivables .. .. ..
Other financial assets .. .. ..
Property, plant and equipment 20,28,33 448,010 428,055 446,560
Intangibles 21,34 4,434 2,163 5,198
Other .. .. ..
Total non-current assets 452,444 430,218 451,758
TOTAL ASSETS 510,848 500,219 515,850
CURRENT LIABILITIES
Payables 22,29 24,934 35,555 35,555
Accrued employee benefits 23,30 17,867 16,607 16,607
Interest bearing liabilities and derivatives .. .. ..
Provisions .. .. ..
Other 23 32 32
Total current liabilities 42,824 52,194 52,194
NON-CURRENT LIABILITIES
Payables .. .. ..
Accrued employee benefits .. .. ..
Interest bearing liabilities and derivatives .. .. ..
Provisions .. .. ..
Other .. .. ..
Total non-current liabilities .. .. ..
TOTAL LIABILITIES 42,824 52,194 52,194
NET ASSETS/(LIABILITIES) 468,024 448,025 463,656
EQUITY
TOTAL EQUITY 24,31,35 468,024 448,025 463,656
2016-17 Queensland State Budget – Service Delivery Statements – Queensland Ambulance Service 47
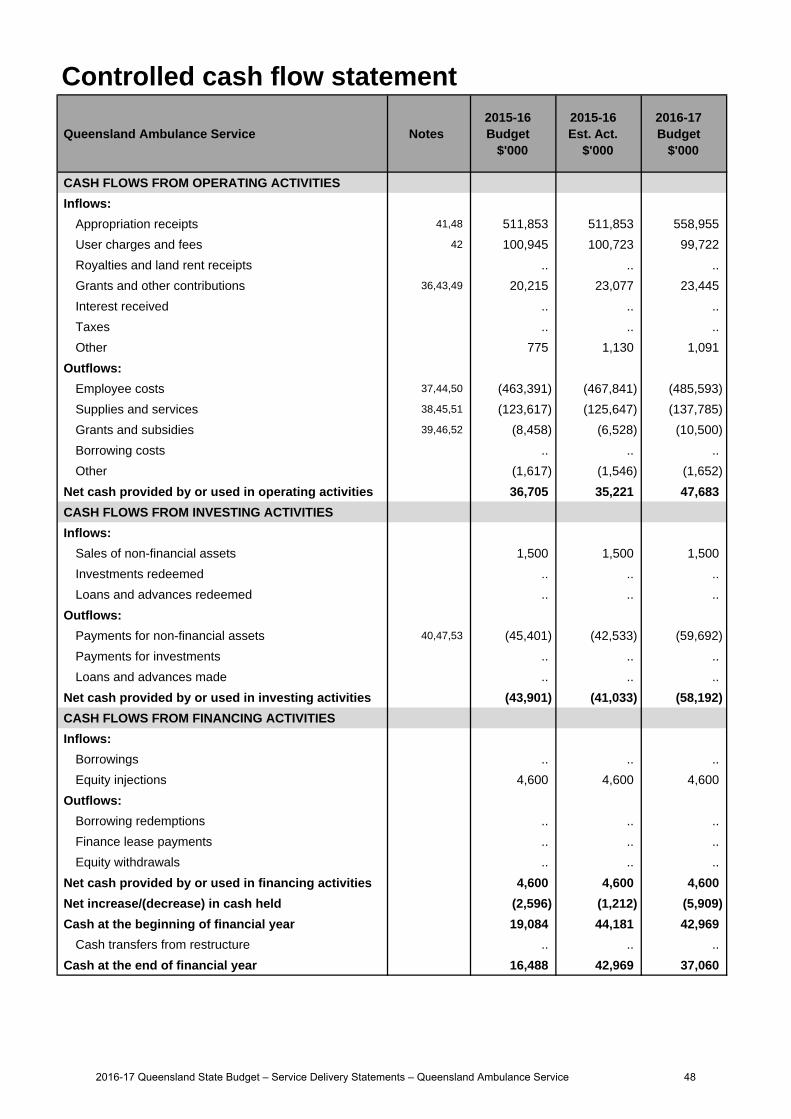
Controlled cash flow statement
Queensland Ambulance Service Notes 2015-16 Budget
$'000
2015-16 Est. Act.
$'000
2016-17 Budget
$'000
CASH FLOWS FROM OPERATING ACTIVITIES
Inflows:
Appropriation receipts 41,48 511,853 511,853 558,955
User charges and fees 42 100,945 100,723 99,722
Royalties and land rent receipts .. .. ..
Grants and other contributions 36,43,49 20,215 23,077 23,445
Interest received .. .. ..
Taxes .. .. ..
Other 775 1,130 1,091
Outflows:
Employee costs 37,44,50 (463,391) (467,841) (485,593)
Supplies and services 38,45,51 (123,617) (125,647) (137,785)
Grants and subsidies 39,46,52 (8,458) (6,528) (10,500)
Borrowing costs .. .. ..
Other (1,617) (1,546) (1,652)
Net cash provided by or used in operating activities 36,705 35,221 47,683
CASH FLOWS FROM INVESTING ACTIVITIES
Inflows:
Sales of non-financial assets 1,500 1,500 1,500
Investments redeemed .. .. ..
Loans and advances redeemed .. .. ..
Outflows:
Payments for non-financial assets 40,47,53 (45,401) (42,533) (59,692)
Payments for investments .. .. ..
Loans and advances made .. .. ..
Net cash provided by or used in investing activities (43,901) (41,033) (58,192)
CASH FLOWS FROM FINANCING ACTIVITIES
Inflows:
Borrowings .. .. ..
Equity injections 4,600 4,600 4,600
Outflows:
Borrowing redemptions .. .. ..
Finance lease payments .. .. ..
Equity withdrawals .. .. ..
Net cash provided by or used in financing activities 4,600 4,600 4,600
Net increase/(decrease) in cash held (2,596) (1,212) (5,909)
Cash at the beginning of financial year 19,084 44,181 42,969
Cash transfers from restructure .. .. ..
Cash at the end of financial year 16,488 42,969 37,060
2016-17 Queensland State Budget – Service Delivery Statements – Queensland Ambulance Service 48
Income statementMajor variations between 2015-16 Budget and 2015-16 Estimated Actual include:
1. The increase in grants and other contributions is principally due to an increased allocation of Motor AccidentInsurance Commission (MAIC) funds.
2. The increase in employee expenses principally relates to additional staff enhancements and enterprise bargainingincreases, the implementation of the aggregate rate, additional recruitment costs, staff uniforms and protectiveequipment.
3. The increase in supplies and services is principally due to increased operational equipment requirements,property costs, contractor and professional services, operating leases and additional shared services costs.
4. The decrease in grants and subsidies is principally due to a delayed capital program. As part of the 2013machinery-of-government change, Queensland Ambulance Service (QAS) communications assets weretransferred to the Public Safety Business Agency (PSBA) to enable efficiencies and consistency across thenetwork. The QAS pay an operating grant for its ongoing communications capital program.
Major variations between 2015-16 Budget and 2016-17 Budget include:
5. The increase in appropriation revenue is principally due to supplementation received for anticipated growth inQAS activities. These funds are primarily for additional operational staff.
6. The decrease in user charges is principally due to reduced activity from interstate patient transports andeducational training due to increased competition and a decline from the mining sector.
7. The increase in grants and other contributions is principally due to an increased allocation of MAIC funds.
8. The increase in employee expenses is principally due to additional funding received for the anticipated growth inQAS activities. These funds are primarily for additional operational staff costs.
9. The increase in supplies and services is principally due to: motor vehicles and other operational costs associatedadditional ambulance officers, increased software licenses, stretcher maintenance, Government Wireless Network(GWN) recurrent costs and data management costs for defibrillators and an allocation for Consumer Price Index(CPI) cost increases.
10. The increase in grants and subsidies is principally due to an increased communications capital program, whichincludes operations centre modernisation and communication network upgrades, PSBA Network upgrades andBrisbane operations centre console refurbishment programs.
11. The increase in depreciation and amortisation is principally due to asset purchases from additional ambulancevehicles and stretchers required for growth to meet increased activities.
Major variations between 2015-16 Estimated Actual and the 2016-17 Budget include:
12. The increase in appropriation revenue is principally due to supplementation received for anticipated growth inQAS activities. These funds are primarily for additional operational staff.
13. The increase in employee expenses is principally due to additional funding received for the anticipated growth inQAS activities. These funds are primarily for additional operational staff costs.
14. The increase in supplies and services is principally due to: motor vehicle and other operational costs associatedadditional ambulance officers, increased software licenses, stretcher maintenance, GWN recurrent costs and datamanagement costs for defibrillators and an allocation for CPI cost increases.
15. The increase in grants and subsidies is principally due to an increased communications capital program, whichincludes operations centre modernisation and communication network upgrades, PSBA Network upgrades andBrisbane operations centre console refurbishment programs.
16. The increase in depreciation and amortisation is principally due to asset purchases from additional ambulancevehicles and stretchers required for growth to meet increased activities.
Balance sheetMajor variations between 2015-16 Budget and 2015-16 Estimated Actual include:
17. The increase in cash assets is principally due to a better than anticipated final balance in the 2015-16 financialyear. Reduced receivables and a delayed capital program contributed to the increased cash balance.
Explanation of variances in the financial statements
2016-17 Queensland State Budget – Service Delivery Statements – Queensland Ambulance Service 49
18. The decrease in receivables is primarily due to a lower than expected opening balance.
19. The increase in other current assets is primarily due to an estimated higher value associated with prepayments.
20. The decrease in property plant and equipment is due to a delayed capital program during 2015-16.
21. The decrease in intangibles is due to delays in the ICT program due to changes in scope and direction of the2015-16 program.
22. The increase in payables is principally due to a higher than originally estimated opening balance for 2015-16.
23. The decrease in accrued employee benefits largely reflects lower than anticipated payables for staff entitlements.
24. The decrease in equity is principally due to the capital expenditure planned for 2015-16.
Major variations between 2015-16 Budget and 2016-17 Budget include:
25. The increase in cash assets is principally due to a better than anticipated final balance in the 2015-16 financialyear. Reduced receivables and a delayed capital program contributed to the increased cash balance.
26. The decrease in receivables is primarily due to a lower than expected opening balance.
27. The increase in other current assets is primarily due to an estimated higher value associated with prepayments.
28. The decrease in property plant and equipment is due to a delayed capital program during 2015-16.
29. The increase in payables is principally due to a higher than originally estimated opening balance for 2015-16.
30. The decrease in accrued employee benefits largely reflects lower than anticipated payables for staff entitlements.
31. The decrease in equity is principally due to the increase in payables for 2015-16.
Major variations between 2015-16 Estimated Actual and the 2016-17 Budget include:
32. The decrease in cash assets is principally due to the planned capital expenditure for 2016-17.
33. The increase in property, plant and equipment is due to the increased capital expenditure planned for 2016-17.
34. The increase in intangibles is due to the capital expenditure planned for 2016-17 for internally generatedcomputer software.
35. The increase in equity is due to the capital expenditure planned for 2016-17.
Cash flow statementMajor variations between 2015-16 Budget and 2015-16 Estimated Actual include:
36. The increase in grants and contributions is principally due to an increase in the allocation of MAIC funds.
37. The increase in employee expenses principally relates to additional overtime and penalty costs incurred from thedelay in implementing changes to the overtime meal allowance directive, the implementation of the aggregaterate, additional recruitment costs, staff uniforms and protective equipment.
38. The increase in supplies and services is principally due to increased operational equipment requirements,property costs, contractor and professional services, operating leases and additional shared services costs.
39. The decrease in grants and subsidies is principally due to a delayed communications capital program, whichincludes operations centre modernisation and communication network upgrades, PSBA Network upgrades andthe Brisbane Operations Centre console refurbishment program.
40. The decrease in payments for property plant and equipment is mainly due to a delayed capital program for2015-16.
Major variations between 2015-16 Budget and 2016-17 Budget include:
41. The increase in appropriation revenue is principally due to supplementation received for anticipated growth inQAS activities. These funds are primarily for additional operational staff.
42. The decrease in receipts for user charges and fees is principally due to reduced activity from interstate patienttransports and educational training due to increased competition and a decline from the mining sector.
43. The increase in grants and contributions is principally due to an increase in the allocation of MAIC funds.
44. The increase in employee expenses is principally due to additional funding received for the anticipated growth inQAS activities. These funds are primarily for additional operational staff costs.
2016-17 Queensland State Budget – Service Delivery Statements – Queensland Ambulance Service 50
45. The increase in supplies and services is principally due to: motor vehicles and other operational costs associatedadditional ambulance officers, increased software licenses, stretcher maintenance, GWN recurrent costs and datamanagement costs for defibrillators and an allocation for CPI cost increases.
46. The increase in grants and subsidies is principally due to an increased communications capital program, whichincludes operations centre modernisation and communication network upgrades, PSBA Network upgrades andthe Brisbane Operations Centre console refurbishment program.
47. The increase in payments for property, plant and equipment and intangibles is due to the capital expenditureplanned for 2016-17.
Major variations between 2015-16 Estimated Actual and the 2016-17 Budget include:
48. The increase in appropriation revenue is principally due to supplementation received for anticipated growth inQAS activities. These funds are primarily for additional operational staff.
49. The increase in grants and contributions is principally due to an increase in the allocation of MAIC funds andVeteran Affairs for CPI increases.
50. The increase in employee expenses is principally due to additional funding received for the anticipated growth inQAS activities. These funds are primarily for additional operational staff costs.
51. The increase in supplies and services is principally due to: motor vehicles and other operational costs associatedadditional ambulance officers, increased software licenses, stretcher maintenance, GWN recurrent costs and datamanagement costs for defibrillators and an allocation for CPI cost increases.
52. The increase in grants and subsidies is principally due to an increased communications capital program, whichincludes operations centre modernisation and communication network upgrades, PSBA Network upgrades andthe Brisbane Operations Centre console refurbishment program.
53. The increase in payments for property, plant and equipment and intangibles is due to the capital expenditureplanned for 2016-17.
2016-17 Queensland State Budget – Service Delivery Statements – Queensland Ambulance Service 51
Cairns and Hinterland Hospital and Health Service
Overview
The Cairns and Hinterland Hospital and Health Service (HHS) is an independent statutory body overseen by a local Hospital and Health Board. The Cairns and Hinterland HHS is responsible for the delivery of public hospital and health services in the geographical area stretching from Jumbun in the south to Cow Bay in the north and Croydon in the west.
The Cairns and Hinterland HHS is responsible for the direct management of the facilities within the HHS's geographical boundaries including:
Atherton Hospital Innisfail Hospital
Babinda Hospital Mareeba Hospital
Cairns Hospital Mossman Multi-purpose Health Service
Gordonvale Memorial Hospital Tully Hospital
Herberton Hospital/Aged Care Unit
The Cairns and Hinterland HHS operates Community Health Centres and Primary Health Care Centres providing a comprehensive range of community and primary health services, including aged care assessment; Aboriginal and Torres Strait Islander health programs; child and maternal health services; alcohol, tobacco and other drug services; home care services; community health nursing; sexual health service; allied health services; oral health; offender and refugee health services; and health promotion programs.
The Cairns and Hinterland HHS is determined to achieve its vision of providing world-class health services to improve the social, emotional and physical well-being of people in Cairns and Hinterland and the North East Australian region.
In working towards better health for Queenslanders, the strategic plan of the Cairns and Hinterland HHS aligns with the Queensland Government’s objectives for the community to strengthen our public health system, deliver quality frontline services and restoring integrity and accountability. This will be achieved through the following strategic objectives:
striving to continually improve patient care, safety and outcomes providing health care services that are patient focused and culturally appropriate actively engaging stakeholders and considering their input in the delivery of healthcare services deploying the right people, to the right service, in the right place at the right time, and creating and maintaining a positive
and productive workplace culture that will enable our workforce to be fully engaged, educated and supported ensuring fiscally responsible decision making while providing stable and sustainable health services establishing engaged, consistent and timely decision making processes at all levels of the organisation and at the
closest point to service delivery building, developing and implementing technology and systems that support integrated health care delivery and
enhance organisational performance.The Cairns and Hinterland HHS serves a large Indigenous population, and is the referral service for the Torres Strait, Cape York and Northern Peninsula Area. In addition, the HHS provides significant services to Papua New Guineans. A key challenge for the Cairns and Hinterland HHS is its growing and ageing population. By 2026, an extra 67,000 people are expected to reside within the catchment area and close to one in five will be aged over 65.
Service summary
The Cairns and Hinterland HHS has an operating budget of $777.9 million for 2016-17 which is an increase of $65.1 million (9.1 per cent) from the published 2015-16 operating budget of $712.8 million.
In February 2016, Cairns Hospital became Australia’s first large-scale regional Digital Hospital. This key transformation connects patients, clinicians and health services through fully integrated health care. Patients can quickly and easily access up to date health records and clinicians have immediate access to patient treatment plans, allowing more time for delivering care. This is a significant achievement for Cairns and Hinterland HHS and in 2016-17 the HHS will continue to capitalise on the new digital capability to improve health services for the community.
In 2016-17, the Cairns and Hinterland HHS will focus on key initiatives including implementing the Regional eHealth Project to improve clinical and patient electronic information sharing between Queensland Health facilities and external healthcare partners, implementing the Nurse Navigator Program that will facilitate the patient’s journey through the complex health
2016-17 Queensland State Budget – Service Delivery Statements – Cairns and Hinterland Hospital and Health Service 52
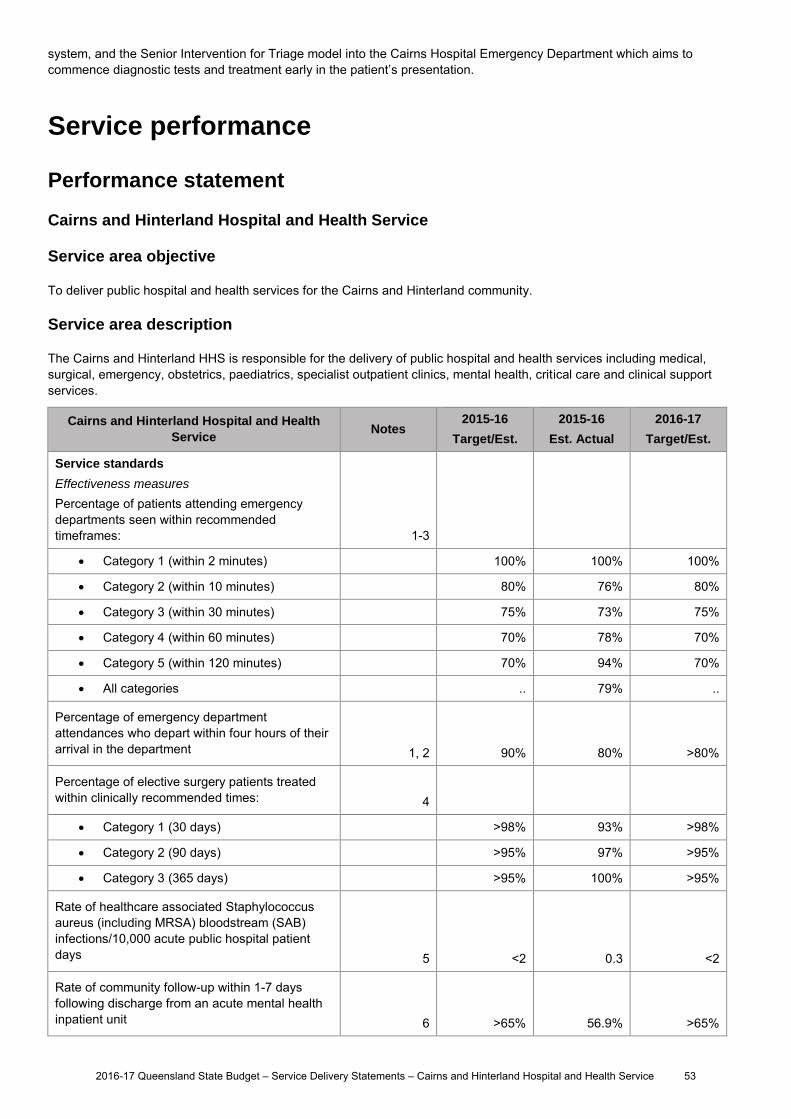
system, and the Senior Intervention for Triage model into the Cairns Hospital Emergency Department which aims to commence diagnostic tests and treatment early in the patient’s presentation.
Service performance
Performance statement
Cairns and Hinterland Hospital and Health Service
Service area objective
To deliver public hospital and health services for the Cairns and Hinterland community.
Service area description
The Cairns and Hinterland HHS is responsible for the delivery of public hospital and health services including medical, surgical, emergency, obstetrics, paediatrics, specialist outpatient clinics, mental health, critical care and clinical support services.
Cairns and Hinterland Hospital and Health
Service Notes
2015-16
Target/Est.
2015-16
Est. Actual
2016-17
Target/Est.
Service standards
Effectiveness measures
Percentage of patients attending emergency departments seen within recommended timeframes:
1-3
Category 1 (within 2 minutes) 100% 100% 100%
Category 2 (within 10 minutes) 80% 76% 80%
Category 3 (within 30 minutes) 75% 73% 75%
Category 4 (within 60 minutes) 70% 78% 70%
Category 5 (within 120 minutes) 70% 94% 70%
All categories .. 79% ..
Percentage of emergency department attendances who depart within four hours of their arrival in the department 1, 2 90% 80% >80%
Percentage of elective surgery patients treated within clinically recommended times: 4
Category 1 (30 days) >98% 93% >98%
Category 2 (90 days) >95% 97% >95%
Category 3 (365 days) >95% 100% >95%
Rate of healthcare associated Staphylococcus aureus (including MRSA) bloodstream (SAB) infections/10,000 acute public hospital patient days 5 <2 0.3 <2
Rate of community follow-up within 1-7 days following discharge from an acute mental health inpatient unit 6 >65% 56.9% >65%
2016-17 Queensland State Budget – Service Delivery Statements – Cairns and Hinterland Hospital and Health Service 53
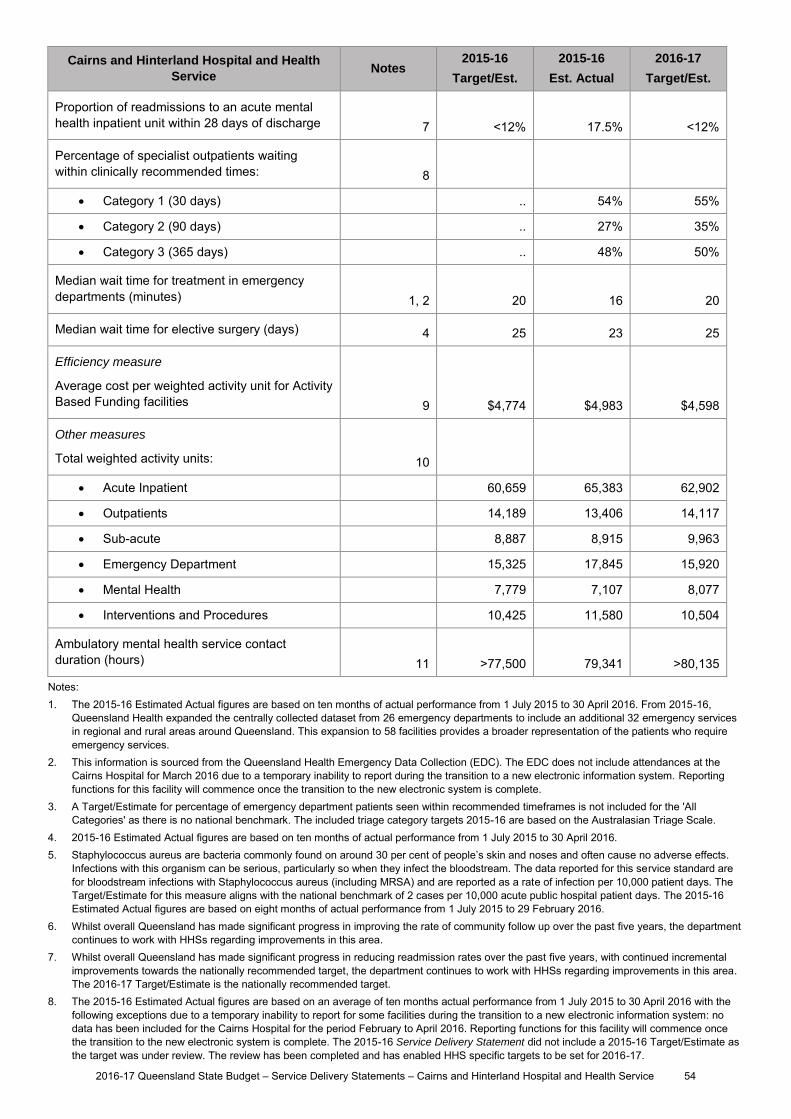
Cairns and Hinterland Hospital and Health
Service Notes
2015-16
Target/Est.
2015-16
Est. Actual
2016-17
Target/Est.
Proportion of readmissions to an acute mental health inpatient unit within 28 days of discharge 7 <12% 17.5% <12%
Percentage of specialist outpatients waiting within clinically recommended times: 8
Category 1 (30 days) .. 54% 55%
Category 2 (90 days) .. 27% 35%
Category 3 (365 days) .. 48% 50%
Median wait time for treatment in emergency departments (minutes) 1, 2 20 16 20
Median wait time for elective surgery (days) 4 25 23 25
Efficiency measure
Average cost per weighted activity unit for Activity Based Funding facilities 9 $4,774 $4,983 $4,598
Other measures
Total weighted activity units: 10
Acute Inpatient 60,659 65,383 62,902
Outpatients 14,189 13,406 14,117
Sub-acute 8,887 8,915 9,963
Emergency Department 15,325 17,845 15,920
Mental Health 7,779 7,107 8,077
Interventions and Procedures 10,425 11,580 10,504
Ambulatory mental health service contact duration (hours) 11 >77,500 79,341 >80,135
Notes: 1. The 2015-16 Estimated Actual figures are based on ten months of actual performance from 1 July 2015 to 30 April 2016. From 2015-16,
Queensland Health expanded the centrally collected dataset from 26 emergency departments to include an additional 32 emergency services in regional and rural areas around Queensland. This expansion to 58 facilities provides a broader representation of the patients who require emergency services.
2. This information is sourced from the Queensland Health Emergency Data Collection (EDC). The EDC does not include attendances at the Cairns Hospital for March 2016 due to a temporary inability to report during the transition to a new electronic information system. Reporting functions for this facility will commence once the transition to the new electronic system is complete.
3. A Target/Estimate for percentage of emergency department patients seen within recommended timeframes is not included for the 'All Categories' as there is no national benchmark. The included triage category targets 2015-16 are based on the Australasian Triage Scale.
4. 2015-16 Estimated Actual figures are based on ten months of actual performance from 1 July 2015 to 30 April 2016. 5. Staphylococcus aureus are bacteria commonly found on around 30 per cent of people’s skin and noses and often cause no adverse effects.
Infections with this organism can be serious, particularly so when they infect the bloodstream. The data reported for this service standard are for bloodstream infections with Staphylococcus aureus (including MRSA) and are reported as a rate of infection per 10,000 patient days. The Target/Estimate for this measure aligns with the national benchmark of 2 cases per 10,000 acute public hospital patient days. The 2015-16 Estimated Actual figures are based on eight months of actual performance from 1 July 2015 to 29 February 2016.
6. Whilst overall Queensland has made significant progress in improving the rate of community follow up over the past five years, the department continues to work with HHSs regarding improvements in this area.
7. Whilst overall Queensland has made significant progress in reducing readmission rates over the past five years, with continued incremental improvements towards the nationally recommended target, the department continues to work with HHSs regarding improvements in this area. The 2016-17 Target/Estimate is the nationally recommended target.
8. The 2015-16 Estimated Actual figures are based on an average of ten months actual performance from 1 July 2015 to 30 April 2016 with the following exceptions due to a temporary inability to report for some facilities during the transition to a new electronic information system: no data has been included for the Cairns Hospital for the period February to April 2016. Reporting functions for this facility will commence once the transition to the new electronic system is complete. The 2015-16 Service Delivery Statement did not include a 2015-16 Target/Estimate as the target was under review. The review has been completed and has enabled HHS specific targets to be set for 2016-17.
2016-17 Queensland State Budget – Service Delivery Statements – Cairns and Hinterland Hospital and Health Service 54
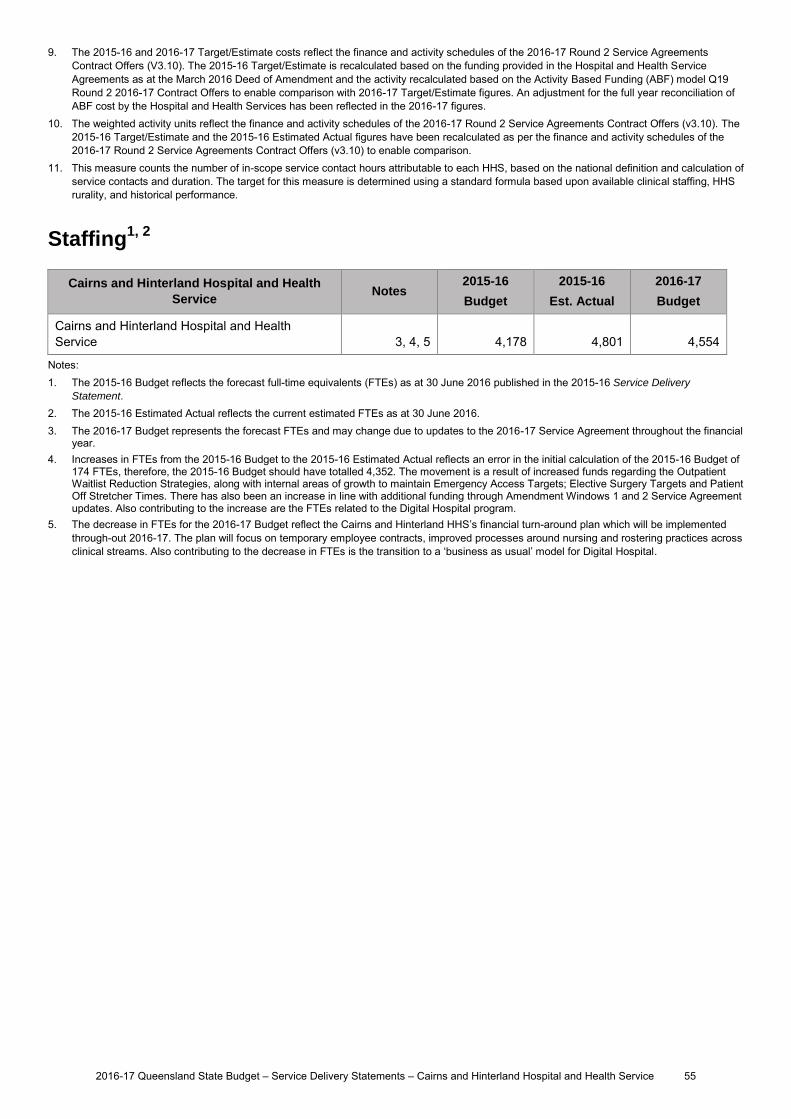
9. The 2015-16 and 2016-17 Target/Estimate costs reflect the finance and activity schedules of the 2016-17 Round 2 Service Agreements Contract Offers (V3.10). The 2015-16 Target/Estimate is recalculated based on the funding provided in the Hospital and Health Service Agreements as at the March 2016 Deed of Amendment and the activity recalculated based on the Activity Based Funding (ABF) model Q19 Round 2 2016-17 Contract Offers to enable comparison with 2016-17 Target/Estimate figures. An adjustment for the full year reconciliation of ABF cost by the Hospital and Health Services has been reflected in the 2016-17 figures.
10. The weighted activity units reflect the finance and activity schedules of the 2016-17 Round 2 Service Agreements Contract Offers (v3.10). The 2015-16 Target/Estimate and the 2015-16 Estimated Actual figures have been recalculated as per the finance and activity schedules of the 2016-17 Round 2 Service Agreements Contract Offers (v3.10) to enable comparison.
11. This measure counts the number of in-scope service contact hours attributable to each HHS, based on the national definition and calculation of service contacts and duration. The target for this measure is determined using a standard formula based upon available clinical staffing, HHS rurality, and historical performance.
Staffing1, 2
Cairns and Hinterland Hospital and Health
Service Notes
2015-16
Budget
2015-16
Est. Actual
2016-17
Budget
Cairns and Hinterland Hospital and Health Service 3, 4, 5 4,178 4,801 4,554
Notes: 1. The 2015-16 Budget reflects the forecast full-time equivalents (FTEs) as at 30 June 2016 published in the 2015-16 Service Delivery
Statement. 2. The 2015-16 Estimated Actual reflects the current estimated FTEs as at 30 June 2016. 3. The 2016-17 Budget represents the forecast FTEs and may change due to updates to the 2016-17 Service Agreement throughout the financial
year. 4. Increases in FTEs from the 2015-16 Budget to the 2015-16 Estimated Actual reflects an error in the initial calculation of the 2015-16 Budget of
174 FTEs, therefore, the 2015-16 Budget should have totalled 4,352. The movement is a result of increased funds regarding the Outpatient Waitlist Reduction Strategies, along with internal areas of growth to maintain Emergency Access Targets; Elective Surgery Targets and Patient Off Stretcher Times. There has also been an increase in line with additional funding through Amendment Windows 1 and 2 Service Agreement updates. Also contributing to the increase are the FTEs related to the Digital Hospital program.
5. The decrease in FTEs for the 2016-17 Budget reflect the Cairns and Hinterland HHS’s financial turn-around plan which will be implemented through-out 2016-17. The plan will focus on temporary employee contracts, improved processes around nursing and rostering practices across clinical streams. Also contributing to the decrease in FTEs is the transition to a ‘business as usual’ model for Digital Hospital.
2016-17 Queensland State Budget – Service Delivery Statements – Cairns and Hinterland Hospital and Health Service 55
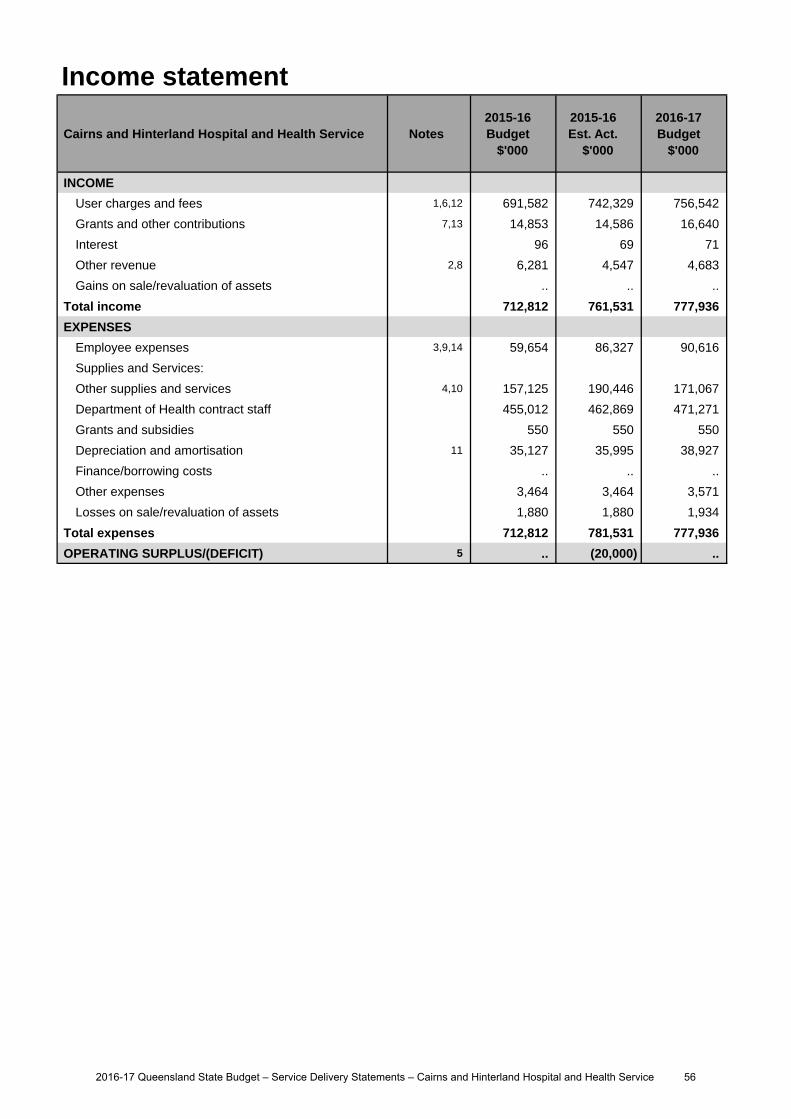
Income statement
Cairns and Hinterland Hospital and Health Service Notes 2015-16 Budget
$'000
2015-16 Est. Act.
$'000
2016-17 Budget
$'000
INCOME
User charges and fees 1,6,12 691,582 742,329 756,542
Grants and other contributions 7,13 14,853 14,586 16,640
Interest 96 69 71
Other revenue 2,8 6,281 4,547 4,683
Gains on sale/revaluation of assets .. .. ..
Total income 712,812 761,531 777,936
EXPENSES
Employee expenses 3,9,14 59,654 86,327 90,616
Supplies and Services:
Other supplies and services 4,10 157,125 190,446 171,067
Department of Health contract staff 455,012 462,869 471,271
Grants and subsidies 550 550 550
Depreciation and amortisation 11 35,127 35,995 38,927
Finance/borrowing costs .. .. ..
Other expenses 3,464 3,464 3,571
Losses on sale/revaluation of assets 1,880 1,880 1,934
Total expenses 712,812 781,531 777,936
OPERATING SURPLUS/(DEFICIT) 5 .. (20,000) ..
2016-17 Queensland State Budget – Service Delivery Statements – Cairns and Hinterland Hospital and Health Service 56
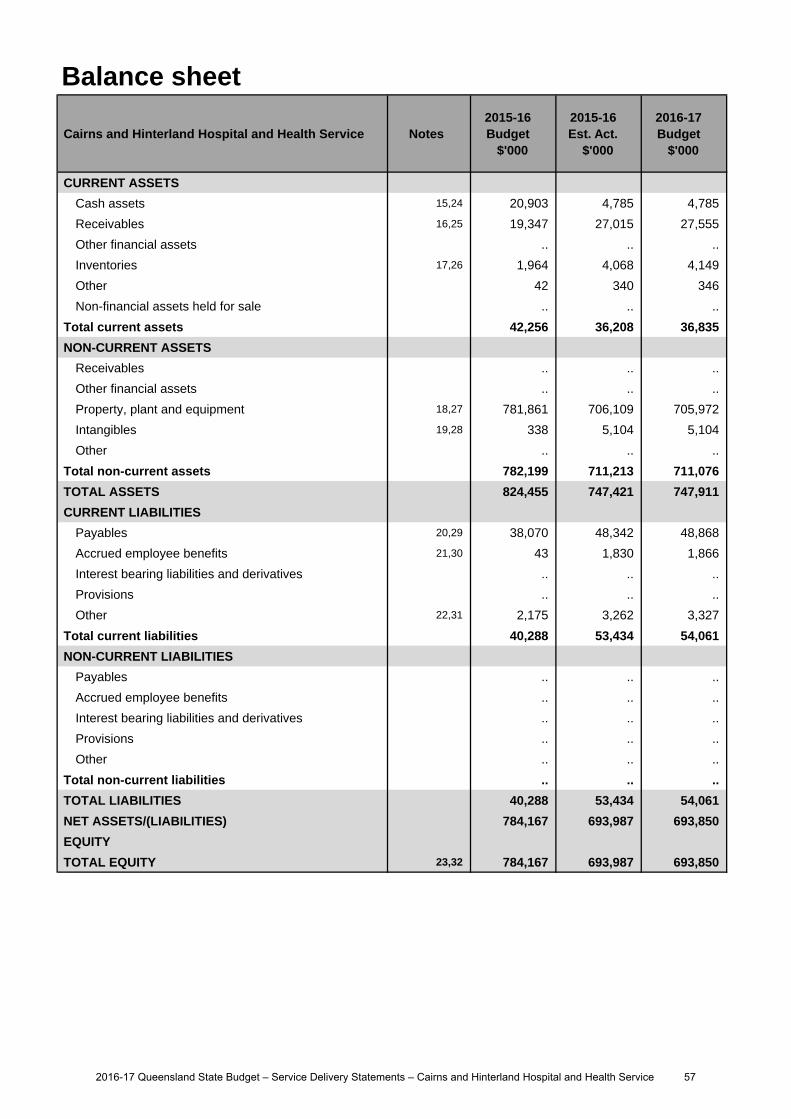
Balance sheet
Cairns and Hinterland Hospital and Health Service Notes 2015-16 Budget
$'000
2015-16 Est. Act.
$'000
2016-17 Budget
$'000
CURRENT ASSETS
Cash assets 15,24 20,903 4,785 4,785
Receivables 16,25 19,347 27,015 27,555
Other financial assets .. .. ..
Inventories 17,26 1,964 4,068 4,149
Other 42 340 346
Non-financial assets held for sale .. .. ..
Total current assets 42,256 36,208 36,835
NON-CURRENT ASSETS
Receivables .. .. ..
Other financial assets .. .. ..
Property, plant and equipment 18,27 781,861 706,109 705,972
Intangibles 19,28 338 5,104 5,104
Other .. .. ..
Total non-current assets 782,199 711,213 711,076
TOTAL ASSETS 824,455 747,421 747,911
CURRENT LIABILITIES
Payables 20,29 38,070 48,342 48,868
Accrued employee benefits 21,30 43 1,830 1,866
Interest bearing liabilities and derivatives .. .. ..
Provisions .. .. ..
Other 22,31 2,175 3,262 3,327
Total current liabilities 40,288 53,434 54,061
NON-CURRENT LIABILITIES
Payables .. .. ..
Accrued employee benefits .. .. ..
Interest bearing liabilities and derivatives .. .. ..
Provisions .. .. ..
Other .. .. ..
Total non-current liabilities .. .. ..
TOTAL LIABILITIES 40,288 53,434 54,061
NET ASSETS/(LIABILITIES) 784,167 693,987 693,850
EQUITY
TOTAL EQUITY 23,32 784,167 693,987 693,850
2016-17 Queensland State Budget – Service Delivery Statements – Cairns and Hinterland Hospital and Health Service 57

Cash flow statement
Cairns and Hinterland Hospital and Health Service Notes 2015-16 Budget
$'000
2015-16 Est. Act.
$'000
2016-17 Budget
$'000
CASH FLOWS FROM OPERATING ACTIVITIES
Inflows:
User charges and fees 33,40,45 689,465 740,104 754,255
Grants and other contributions 41,46 14,853 14,586 16,640
Interest received 96 69 71
Other 22,051 20,317 20,453
Outflows:
Employee costs 34,42,47 (59,676) (86,289) (90,580)
Supplies and services 35,43 (643,203) (661,894) (657,791)
Grants and subsidies (550) (550) (550)
Borrowing costs .. .. ..
Other (3,464) (3,461) (3,571)
Net cash provided by or used in operating activities 19,572 22,882 38,927
CASH FLOWS FROM INVESTING ACTIVITIES
Inflows:
Sales of non-financial assets .. .. ..
Investments redeemed .. .. ..
Loans and advances redeemed 36,48 .. (5,185) ..
Outflows:
Payments for non-financial assets 37,49 (7,533) (20,156) (5,485)
Payments for investments .. .. ..
Loans and advances made 38,50 .. 5,185 ..
Net cash provided by or used in investing activities (7,533) (20,156) (5,485)
CASH FLOWS FROM FINANCING ACTIVITIES
Inflows:
Borrowings .. .. ..
Equity injections 39,51 7,533 13,269 5,485
Outflows:
Borrowing redemptions .. .. ..
Finance lease payments .. .. ..
Equity withdrawals 44,52 (35,127) (35,995) (38,927)
Net cash provided by or used in financing activities (27,594) (22,726) (33,442)
Net increase/(decrease) in cash held (15,555) (20,000) ..
Cash at the beginning of financial year 36,458 24,785 4,785
Cash transfers from restructure .. .. ..
Cash at the end of financial year 20,903 4,785 4,785
2016-17 Queensland State Budget – Service Delivery Statements – Cairns and Hinterland Hospital and Health Service 58
Income statementMajor variations between 2015-16 Budget and 2015-16 Estimated Actual include:
1. The increase relates to additional funding provided through amendments to the Service Agreement betweenCairns and Hinterland Hospital and Health Service and the department. Additional funding is provided forincreases in service activity, enterprise bargaining agreements, non-labour escalation and depreciation expense.
2. The decrease relates to a reduction in recoveries from other government departments. The 2015-16 Budget wasbased on historic performance. The reduction relates to Integrated Electronic Medical Record (ieMR) staff costswhich were reimbursed during the 2014-15 year, which are no longer reimbursed in 2015-16.
3. The increase is largely due to the increased number of Senior Medical Officers employed by the HHS, along withenterprise bargaining back pays to 1 July 2015. Additional movement relates to increased Health ServiceExecutive costs and Board costs.
4. The increase relates to additional expenditure associated with the increase in full-time equivalent (FTE) numbers, due to growth in activity and programs such as Digital Hospital and enterprise bargaining agreements. Activity increases are in line with strategies put in place to achieve Tier 1 Key Performance Indicators (KPIs), specifically around National Emergency Access Targets; National Elective Surgery Target and Patients Off Stretcher Time.
5. The forecasted deficit is attributed to strategies adopted by the Hospital and Health Service to maintain orsignificantly improve Tier 1 KPI targets, specifically around the National Emergency Access Targets, NationalElective Surgery Targets and Patient Off Stretcher Times. The deficit is expected to be partially funded from prioryear surpluses.
Major variations between 2015-16 Budget and 2016-17 Budget include:
6. The increase relates to additional funding provided through the Service Agreement between Cairns andHinterland Hospital and Health Service and the department. Additional funding is provided for increasesin service activity, enterprise bargaining, block funded services, teaching, training and research fundingand own source revenue.
7. The increase relates to additional funding expected from the Commonwealth for items such as Remote MedicalBenefits Scheme; Council Of Australian Governments S19(2) Initiative funding and Regional Health ServicesFunding
8. The decrease relates to a reduction in recoveries from other government departments. The 2015-16 Budget was based on historic performance. The reduction relates to ieMR staff costs which were reimbursed during 2014-15. In 2015-16, costs are no longer reimbursed in this fashion.
9. The increase is largely due to allowing for additional Senior Medical Officer FTEs, along with enterprisebargaining adjustments.
10. The increase relates to additional expenditure associated with the increase in FTE numbers, due to growth inactivity and programs such as Digital Hospital and enterprise bargaining agreements. Activity increases are inline with strategies put in place to achieve Tier 1 KPIs, specifically around National Emergency Access Targets;National Elective Surgery Target and Patients Off Stretcher Time.
11. The increase predominantly relates to the commissioning of assets in 2016-17.
Major variations between 2015-16 Estimated Actual and the 2016-17 Budget include:
12. The increase relates to additional funding provided through the Service Agreement between Cairns andHinterland Hospital and Health Service and the department. Additional funding is provided for increases inservice activity, enterprise bargaining, block funded services, teaching, training and research funding and ownsource revenue.
13. The increase relates to additional funding expected from the Commonwealth for items such as Remote MedicalBenefits Scheme; Council Of Australian Governments S19(2) Initiative funding and Regional Health ServicesFunding
14. The increase relates to additional expenditure associated with the increase in FTE numbers, due to growth inactivity and programs such as Digital Hospital and enterprise bargaining agreements.
Explanation of variances in the financial statements
2016-17 Queensland State Budget – Service Delivery Statements – Cairns and Hinterland Hospital and Health Service 59
Balance sheetMajor variations between 2015-16 Budget and 2015-16 Estimated Actual include:
15. The decrease is due to a revision of the anticipated increase in the receivables balance at end of year whichresulted in a reduction in the cash position.
16. The increase is due to additional funding provided through amendments to the Service Agreement between the department and the Cairns and Hinterland Hospital and Health Service.
17. The increase is predominantly due to increase in Pharmacy Inventory due to an overall increase in activity.
18. The decrease relates to a revised commissioning schedule for asset transfers from the department.
19. The increase relates to software purchases for the Digital Hospital project.
20. The increase is as a result of a higher operational expenditure on supplies and services.
21. The increase relates to the revised provision requirement in line with the increase in employee expenses.
22. The increase is due to unforeseeable receipt of advance payments.
23. The decrease relates to a revised commissioning schedule for asset transfers from the department, along witha forecasted deficit at year end. The forecasted deficit is attributed to strategies adopted by the Hospital andHealth Service to maintain or significantly improve Tier 1 KPI targets, specifically around the NationalEmergency Access Targets; National Elective Surgery Targets and Patient Off Stretcher Times. The deficit isexpected to be partially funded from prior year surpluses.
Major variations between 2015-16 Budget and 2016-17 Budget include:
24. The decrease is due to a revision of the anticipated increase in receivables balance at end of year.
25. The increase is in line with higher estimated user charges and fees per the Service Agreement.
26. The increase is predominantly due to increase in Pharmacy Inventory due to an overall increase in activity.
27. The decrease relates to a revised commissioning schedule for asset transfers from the department.
28. The increase relates to software costs related to the Digital Hospital project.
29. The increase is as a result of a higher operational expenditure on supplies and services.
30. The increase relates to a revision of provision for accrual of employee expenses.
31. The increase is due to unforeseeable receipt of advance payments.
32. The decrease relates to the revised calculation of contributed equity for the transfer of potential commissionedassets from the department, along with the full year forecast loss the Health Service is predicting.
Cash flow statementMajor variations between 2015-16 Budget and 2015-16 Estimated Actual include:
33. The increase relates to additional funding provided through amendments to the Service Agreement betweenCairns and Hinterland Hospital and Health Service and the department. Additional funding is provided forincreases in service activity, enterprise bargaining agreements, non-labour escalation and depreciation expense.
34. The increase is largely due to the increased number of Senior Medical Officers employed by the Cairns andHinterland Hospital and Health Service, along with enterprise bargaining back pays to 1 July 2015.Additional movement relates to increased Health Service Executive costs and Board costs.
35. The increase relates to additional expenditure associated with the increase in FTE numbers, due to growth in activity and programs such as the Digital Hospital project and enterprise bargaining agreements. Activity increases are in line with strategies put in place to achieve Tier 1 KPIs, specifically around National Emergency Access Targets, National Elective Surgery Target and Patients Off Stretcher Time.
36. The decrease is a result of a reclassification of loans and advances.
37. The increase is a result of additional acquisitions over and above initial projections at the beginning of2015-16.
38. The increase is a result of a reclassification of loans and advances.
39. The increase relates to the commissioning of assets to be transferred from the department to Cairns andHinterland Hospital and Health Service via contributed equity.
2016-17 Queensland State Budget – Service Delivery Statements – Cairns and Hinterland Hospital and Health Service 60
Major variations between 2015-16 Budget and 2016-17 Budget include:
40. The increase relates to additional funding provided through the Service Agreement between Cairns andHinterland Hospital and Health Service and the department. Additional funding is provided for increases inservice activity, enterprise bargaining, block funded services, teaching, training and research funding and ownsource revenue.
41. The increase relates to additional funding expected from the Commonwealth for items such as Remote MedicalBenefits Scheme; Council Of Australian Governments S19(2) Initiative funding and Regional Health ServicesFunding
42. The increase is largely due to allowing for additional Senior Medical Officer FTEs, along with expenditurerelating to enterprise bargaining agreements.
43. The increase relates to additional expenditure associated with the increase in FTE numbers, due to growth inactivity and programs such as Digital Hospital and enterprise bargaining agreements. Activity increases are in linewith strategies put in place to achieve Tier 1 KPIs, specifically around National Emergency Access Targets;National Elective Surgery Target and Patients Off Stretcher Time.
44. The increase relates to additional depreciation funding, which is subsequently returned to Queensland Treasury.
Major variations between 2015-16 Estimated Actual and the 2016-17 Budget include:
45. The increase relates to additional funding provided through the Service Agreement between Cairns andHinterland Hospital and Health Service and the department. Additional funding is provided for increases inservice activity, enterprise bargaining, block funded services, teaching, training and research funding and ownsource revenue.
46. The increase relates to additional funding expected from the Commonwealth for items such as Remote MedicalBenefits Scheme; Council Of Australian Governments S19(2) Initiative funding and Regional Health ServicesFunding.
47. The increase relates to additional expenditure associated with the increase in FTE numbers, due to growth inactivity and programs such as the Digital Hospital project and enterprise bargaining agreements.
48. The decrease is a result of reclassification of loans and advances.
49. The decrease is related to minimal projected acquisitions for 2016-17.
50. The decrease is a result of a reclassification of loans and advances.
51. The decrease relates to a reduction of cash received from the department for capital items.
52. The increase relates to additional depreciation funding, which is subsequently returned to Queensland Treasury.
2016-17 Queensland State Budget – Service Delivery Statements – Cairns and Hinterland Hospital and Health Service 61
Central Queensland Hospital and Health Service
Overview
The Central Queensland Hospital and Health Service (HHS) is an independent statutory body overseen by a local Hospital and Health Board. The Central Queensland HHS is responsible for providing public hospital and health services including medical, surgical, emergency, obstetrics, paediatrics, specialist outpatient clinics, mental health, critical care and clinical support services.
The Central Queensland HHS is responsible for the direct management of more than 16 hospitals and facilities including:
Baralaba Hospital Mount Morgan Hospital
Biloela Hospital Moura Hospital
Blackwater Hospital Rockhampton Hospital
Capricorn Coast Hospital Springsure Hospital
Emerald Hospital Theodore Hospital
Gladstone Hospital Woorabinda Hospital
Central Queensland HHS provides mental health services, oral health services and aged care services, with a number of facilities also providing community health services.
Central Queensland HHS is committed to delivering safe, evidence-based, patient-centred, effective and economically sustainable care with a highly skilled and valued workforce that meets the community’s needs.
The Central Queensland HHS’s six strategic objectives contribute to the Queensland Government’s objectives for the community to: deliver quality frontline services; create jobs and a diverse economy; and build safe, caring and connected communities.
With a vision of Changing Lives for the Better, Central Queensland HHS recently introduced a radiation oncology service and reintroduced a public ophthalmology service. Its priorities include the future development of a cardiac service at the Rockhampton Hospital and the utilisation of surgical theatres in Gladstone and Emerald.
The health of Central Queenslanders is influenced by a range of factors including increasing rates of lifestyle-related diseases, an ageing population, the geographic diversity of our region and the distance to a tertiary facility which require innovative models of care to effectively optimise the wellbeing of the community.
Service summary
The Central Queensland HHS has an operating budget of $531.5 million for 2016-17 which is an increase of $43.5 million (8.9 per cent) from the published 2015-16 operating budget of $488 million.
The Cancer Services Building at Rockhampton Hospital was opened in October 2015, providing the platform for a range of new and improved services to Central Queenslanders. The introduction of a radiation oncology service from the new building is the first step in the delivery of a range of cancer treatments to the Central Queensland HHS catchment. A rooftop helipad and state-of-the-art Intensive Care Unit ensure the most urgent patients receive the critical care they need sooner.
A Master Planning project for the Gladstone Hospital Campus will be undertaken this year and will incorporate planning for the new Gladstone Hospital Emergency Department development. Improvements to car parking facilities at Rockhampton Hospital have been identified as a capital funding priority for the HHS.
In 2015, Central Queensland HHS introduced a model of continuous improvement based on the principles of Lean Methodology which engages those who deliver a service in the design and implementation of safer, more efficient and more effective services that improve patient access and patient experience. Called the CQ Way, this initiative will continue to deliver service improvement.
Developing effective partner relations is identified as essential to the delivery of new and improved services to Central Queenslanders. Valuable relationships, such as with those delivering medical imaging and radiation oncology services will be prioritised in 2016-17 alongside reintroducing a public ophthalmology service, the delivery of a cardiac service and other identified service needs.
2016-17 Queensland State Budget – Service Delivery Statements – Central Queensland Hospital and Health Service 62
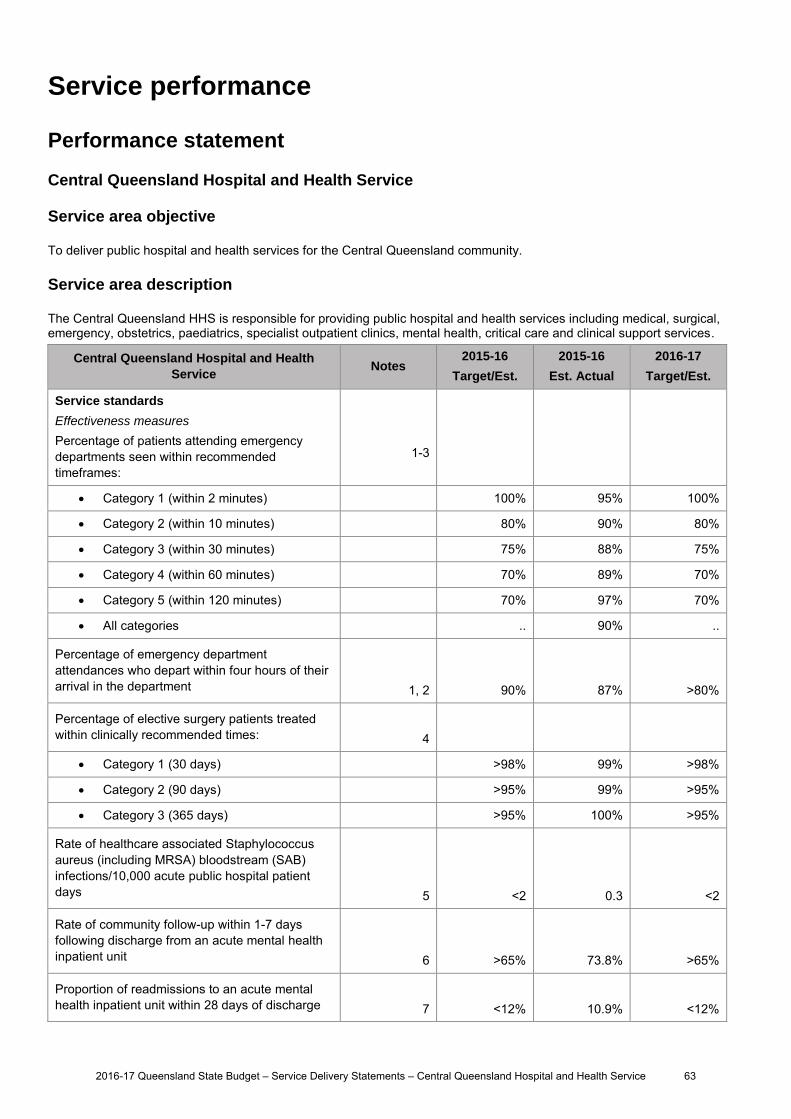
Service performance
Performance statement
Central Queensland Hospital and Health Service
Service area objective
To deliver public hospital and health services for the Central Queensland community.
Service area description
The Central Queensland HHS is responsible for providing public hospital and health services including medical, surgical, emergency, obstetrics, paediatrics, specialist outpatient clinics, mental health, critical care and clinical support services.
Central Queensland Hospital and Health
Service Notes
2015-16
Target/Est.
2015-16
Est. Actual
2016-17
Target/Est.
Service standards
Effectiveness measures
Percentage of patients attending emergency departments seen within recommended timeframes:
1-3
Category 1 (within 2 minutes) 100% 95% 100%
Category 2 (within 10 minutes) 80% 90% 80%
Category 3 (within 30 minutes) 75% 88% 75%
Category 4 (within 60 minutes) 70% 89% 70%
Category 5 (within 120 minutes) 70% 97% 70%
All categories .. 90% ..
Percentage of emergency department attendances who depart within four hours of their arrival in the department 1, 2 90% 87% >80%
Percentage of elective surgery patients treated within clinically recommended times: 4
Category 1 (30 days) >98% 99% >98%
Category 2 (90 days) >95% 99% >95%
Category 3 (365 days) >95% 100% >95%
Rate of healthcare associated Staphylococcus aureus (including MRSA) bloodstream (SAB) infections/10,000 acute public hospital patient days 5 <2 0.3 <2
Rate of community follow-up within 1-7 days following discharge from an acute mental health inpatient unit 6 >65% 73.8% >65%
Proportion of readmissions to an acute mental health inpatient unit within 28 days of discharge 7 <12%
10.9% <12%
2016-17 Queensland State Budget – Service Delivery Statements – Central Queensland Hospital and Health Service 63
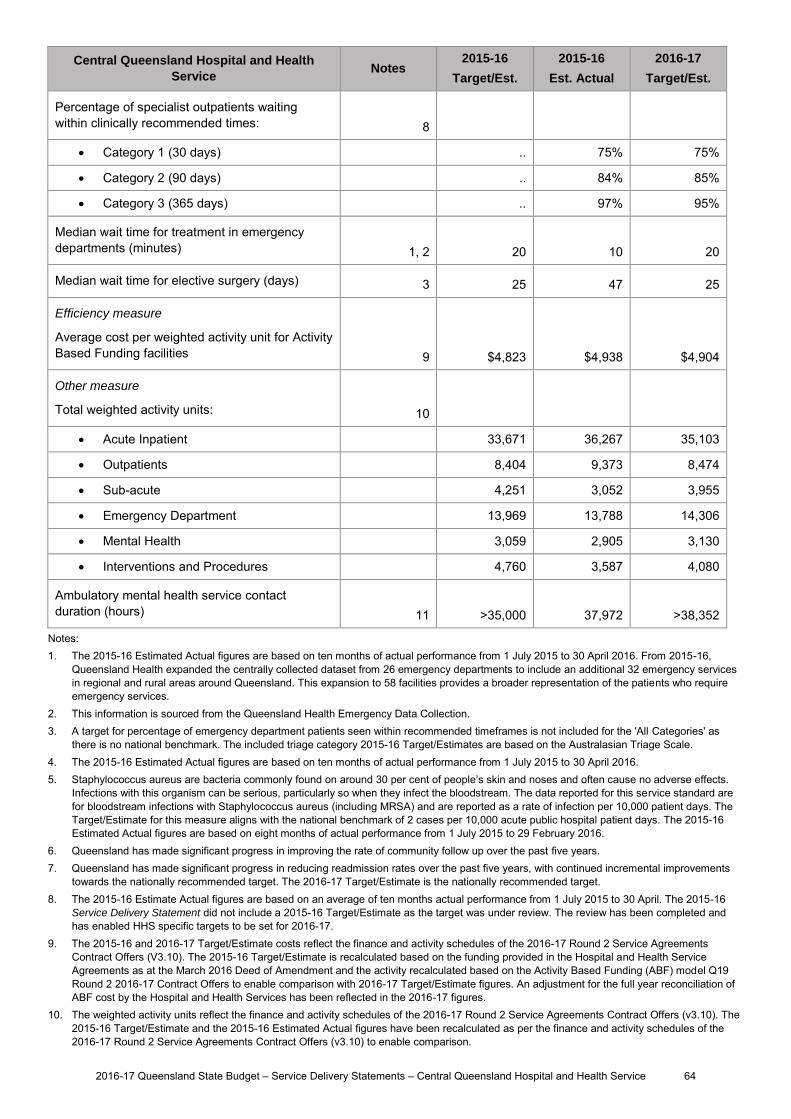
Central Queensland Hospital and Health
Service Notes
2015-16
Target/Est.
2015-16
Est. Actual
2016-17
Target/Est.
Percentage of specialist outpatients waiting within clinically recommended times: 8
Category 1 (30 days) .. 75% 75%
Category 2 (90 days) .. 84% 85%
Category 3 (365 days) .. 97% 95%
Median wait time for treatment in emergency departments (minutes) 1, 2 20 10 20
Median wait time for elective surgery (days) 3 25 47 25
Efficiency measure
Average cost per weighted activity unit for Activity Based Funding facilities 9 $4,823 $4,938 $4,904
Other measure
Total weighted activity units: 10
Acute Inpatient 33,671 36,267 35,103
Outpatients 8,404 9,373 8,474
Sub-acute 4,251 3,052 3,955
Emergency Department 13,969 13,788 14,306
Mental Health 3,059 2,905 3,130
Interventions and Procedures 4,760 3,587 4,080
Ambulatory mental health service contact duration (hours) 11 >35,000 37,972 >38,352
Notes: 1. The 2015-16 Estimated Actual figures are based on ten months of actual performance from 1 July 2015 to 30 April 2016. From 2015-16,
Queensland Health expanded the centrally collected dataset from 26 emergency departments to include an additional 32 emergency services in regional and rural areas around Queensland. This expansion to 58 facilities provides a broader representation of the patients who require emergency services.
2. This information is sourced from the Queensland Health Emergency Data Collection. 3. A target for percentage of emergency department patients seen within recommended timeframes is not included for the 'All Categories' as
there is no national benchmark. The included triage category 2015-16 Target/Estimates are based on the Australasian Triage Scale. 4. The 2015-16 Estimated Actual figures are based on ten months of actual performance from 1 July 2015 to 30 April 2016. 5. Staphylococcus aureus are bacteria commonly found on around 30 per cent of people’s skin and noses and often cause no adverse effects.
Infections with this organism can be serious, particularly so when they infect the bloodstream. The data reported for this service standard are for bloodstream infections with Staphylococcus aureus (including MRSA) and are reported as a rate of infection per 10,000 patient days. The Target/Estimate for this measure aligns with the national benchmark of 2 cases per 10,000 acute public hospital patient days. The 2015-16 Estimated Actual figures are based on eight months of actual performance from 1 July 2015 to 29 February 2016.
6. Queensland has made significant progress in improving the rate of community follow up over the past five years. 7. Queensland has made significant progress in reducing readmission rates over the past five years, with continued incremental improvements
towards the nationally recommended target. The 2016-17 Target/Estimate is the nationally recommended target. 8. The 2015-16 Estimate Actual figures are based on an average of ten months actual performance from 1 July 2015 to 30 April. The 2015-16
Service Delivery Statement did not include a 2015-16 Target/Estimate as the target was under review. The review has been completed and has enabled HHS specific targets to be set for 2016-17.
9. The 2015-16 and 2016-17 Target/Estimate costs reflect the finance and activity schedules of the 2016-17 Round 2 Service Agreements Contract Offers (V3.10). The 2015-16 Target/Estimate is recalculated based on the funding provided in the Hospital and Health Service Agreements as at the March 2016 Deed of Amendment and the activity recalculated based on the Activity Based Funding (ABF) model Q19 Round 2 2016-17 Contract Offers to enable comparison with 2016-17 Target/Estimate figures. An adjustment for the full year reconciliation of ABF cost by the Hospital and Health Services has been reflected in the 2016-17 figures.
10. The weighted activity units reflect the finance and activity schedules of the 2016-17 Round 2 Service Agreements Contract Offers (v3.10). The 2015-16 Target/Estimate and the 2015-16 Estimated Actual figures have been recalculated as per the finance and activity schedules of the 2016-17 Round 2 Service Agreements Contract Offers (v3.10) to enable comparison.
2016-17 Queensland State Budget – Service Delivery Statements – Central Queensland Hospital and Health Service 64
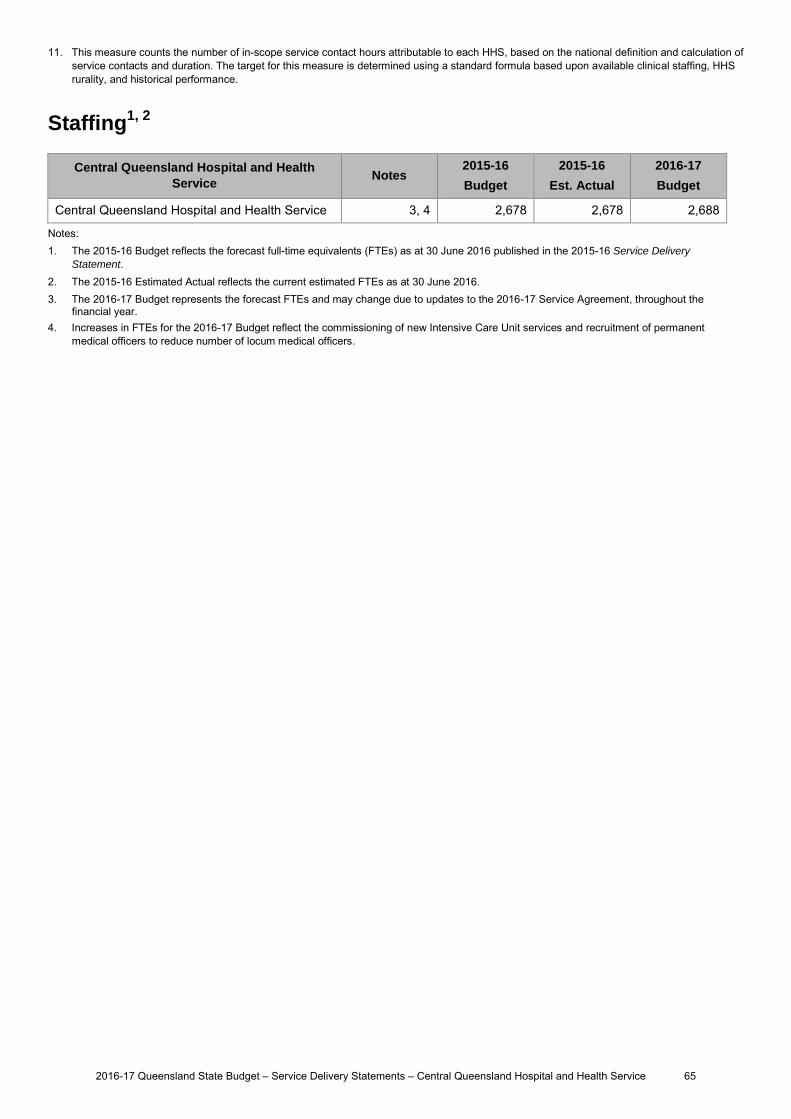
11. This measure counts the number of in-scope service contact hours attributable to each HHS, based on the national definition and calculation of service contacts and duration. The target for this measure is determined using a standard formula based upon available clinical staffing, HHS rurality, and historical performance.
Staffing1, 2
Central Queensland Hospital and Health
Service Notes
2015-16
Budget
2015-16
Est. Actual
2016-17
Budget
Central Queensland Hospital and Health Service 3, 4 2,678 2,678 2,688
Notes: 1. The 2015-16 Budget reflects the forecast full-time equivalents (FTEs) as at 30 June 2016 published in the 2015-16 Service Delivery
Statement. 2. The 2015-16 Estimated Actual reflects the current estimated FTEs as at 30 June 2016. 3. The 2016-17 Budget represents the forecast FTEs and may change due to updates to the 2016-17 Service Agreement, throughout the
financial year. 4. Increases in FTEs for the 2016-17 Budget reflect the commissioning of new Intensive Care Unit services and recruitment of permanent
medical officers to reduce number of locum medical officers.
2016-17 Queensland State Budget – Service Delivery Statements – Central Queensland Hospital and Health Service 65
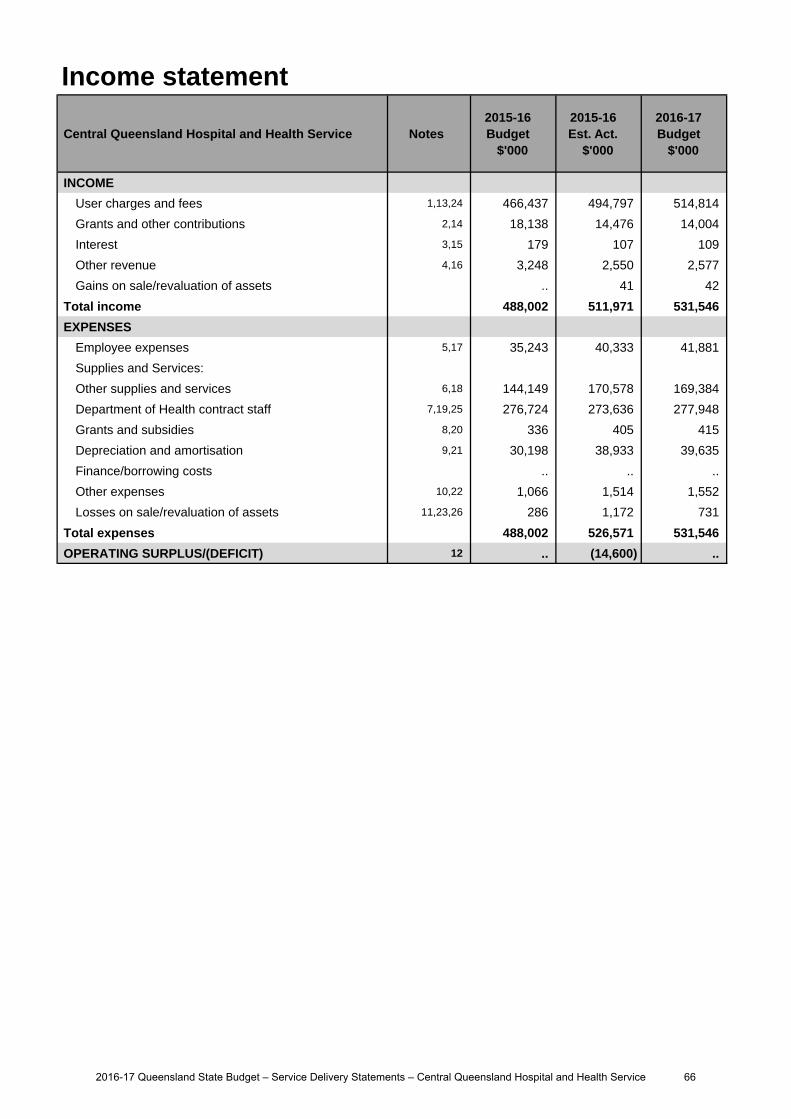
Income statement
Central Queensland Hospital and Health Service Notes 2015-16 Budget
$'000
2015-16 Est. Act.
$'000
2016-17 Budget
$'000
INCOME
User charges and fees 1,13,24 466,437 494,797 514,814
Grants and other contributions 2,14 18,138 14,476 14,004
Interest 3,15 179 107 109
Other revenue 4,16 3,248 2,550 2,577
Gains on sale/revaluation of assets .. 41 42
Total income 488,002 511,971 531,546
EXPENSES
Employee expenses 5,17 35,243 40,333 41,881
Supplies and Services:
Other supplies and services 6,18 144,149 170,578 169,384
Department of Health contract staff 7,19,25 276,724 273,636 277,948
Grants and subsidies 8,20 336 405 415
Depreciation and amortisation 9,21 30,198 38,933 39,635
Finance/borrowing costs .. .. ..
Other expenses 10,22 1,066 1,514 1,552
Losses on sale/revaluation of assets 11,23,26 286 1,172 731
Total expenses 488,002 526,571 531,546
OPERATING SURPLUS/(DEFICIT) 12 .. (14,600) ..
2016-17 Queensland State Budget – Service Delivery Statements – Central Queensland Hospital and Health Service 66
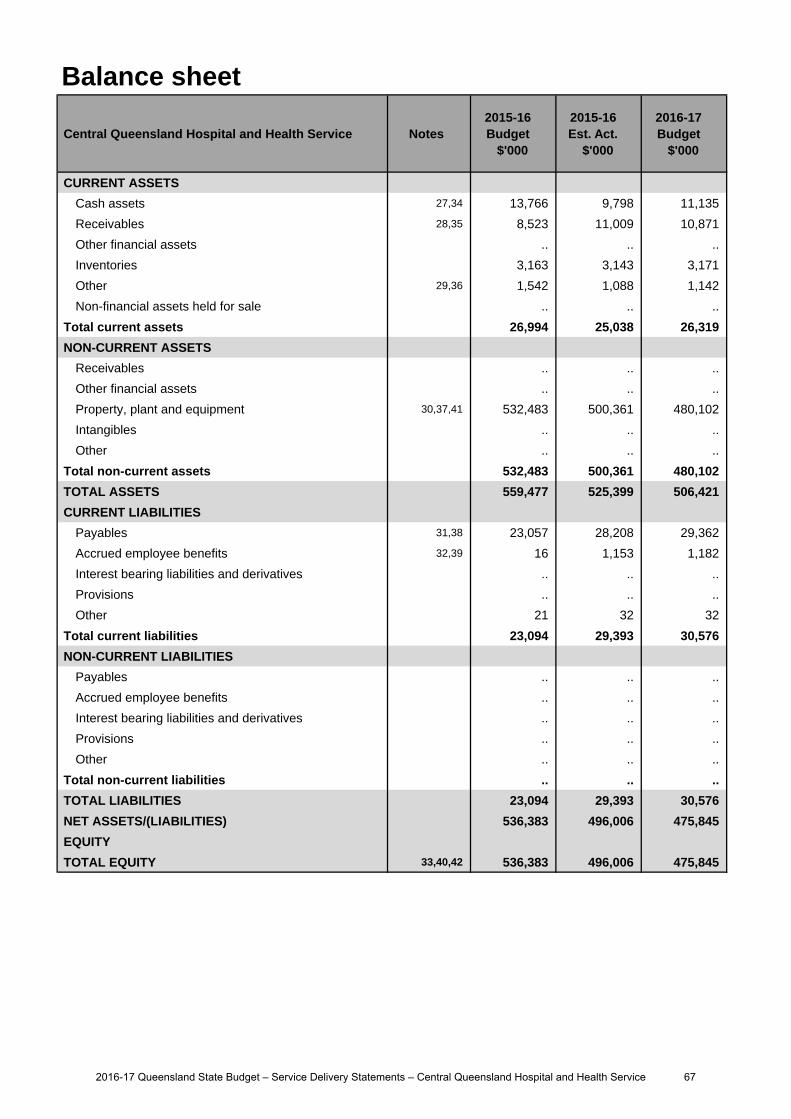
Balance sheet
Central Queensland Hospital and Health Service Notes 2015-16 Budget
$'000
2015-16 Est. Act.
$'000
2016-17 Budget
$'000
CURRENT ASSETS
Cash assets 27,34 13,766 9,798 11,135
Receivables 28,35 8,523 11,009 10,871
Other financial assets .. .. ..
Inventories 3,163 3,143 3,171
Other 29,36 1,542 1,088 1,142
Non-financial assets held for sale .. .. ..
Total current assets 26,994 25,038 26,319
NON-CURRENT ASSETS
Receivables .. .. ..
Other financial assets .. .. ..
Property, plant and equipment 30,37,41 532,483 500,361 480,102
Intangibles .. .. ..
Other .. .. ..
Total non-current assets 532,483 500,361 480,102
TOTAL ASSETS 559,477 525,399 506,421
CURRENT LIABILITIES
Payables 31,38 23,057 28,208 29,362
Accrued employee benefits 32,39 16 1,153 1,182
Interest bearing liabilities and derivatives .. .. ..
Provisions .. .. ..
Other 21 32 32
Total current liabilities 23,094 29,393 30,576
NON-CURRENT LIABILITIES
Payables .. .. ..
Accrued employee benefits .. .. ..
Interest bearing liabilities and derivatives .. .. ..
Provisions .. .. ..
Other .. .. ..
Total non-current liabilities .. .. ..
TOTAL LIABILITIES 23,094 29,393 30,576
NET ASSETS/(LIABILITIES) 536,383 496,006 475,845
EQUITY
TOTAL EQUITY 33,40,42 536,383 496,006 475,845
2016-17 Queensland State Budget – Service Delivery Statements – Central Queensland Hospital and Health Service 67

Cash flow statement
Central Queensland Hospital and Health Service Notes 2015-16 Budget
$'000
2015-16 Est. Act.
$'000
2016-17 Budget
$'000
CASH FLOWS FROM OPERATING ACTIVITIES
Inflows:
User charges and fees 43,51,60 466,741 497,119 514,997
Grants and other contributions 44,52 18,138 14,476 14,004
Interest received 45,53 179 107 109
Other 15,307 14,609 15,239
Outflows:
Employee costs 46,54 (35,243) (39,997) (41,852)
Supplies and services 47,55,61 (444,289) (455,429) (458,966)
Grants and subsidies (336) (405) (415)
Borrowing costs .. .. ..
Other 48,56 (1,741) (2,190) (2,261)
Net cash provided by or used in operating activities 18,756 28,290 40,855
CASH FLOWS FROM INVESTING ACTIVITIES
Inflows:
Sales of non-financial assets 96 114 117
Investments redeemed .. .. ..
Loans and advances redeemed .. .. ..
Outflows:
Payments for non-financial assets 49,57,62 (15,424) (22,408) (3,932)
Payments for investments .. .. ..
Loans and advances made .. .. ..
Net cash provided by or used in investing activities (15,328) (22,294) (3,815)
CASH FLOWS FROM FINANCING ACTIVITIES
Inflows:
Borrowings .. .. ..
Equity injections 58,63 6,451 5,854 3,932
Outflows:
Borrowing redemptions .. .. ..
Finance lease payments .. .. ..
Equity withdrawals 50,59 (30,198) (38,933) (39,635)
Net cash provided by or used in financing activities (23,747) (33,079) (35,703)
Net increase/(decrease) in cash held (20,319) (27,083) 1,337
Cash at the beginning of financial year 34,085 36,881 9,798
Cash transfers from restructure .. .. ..
Cash at the end of financial year 13,766 9,798 11,135
2016-17 Queensland State Budget – Service Delivery Statements – Central Queensland Hospital and Health Service 68
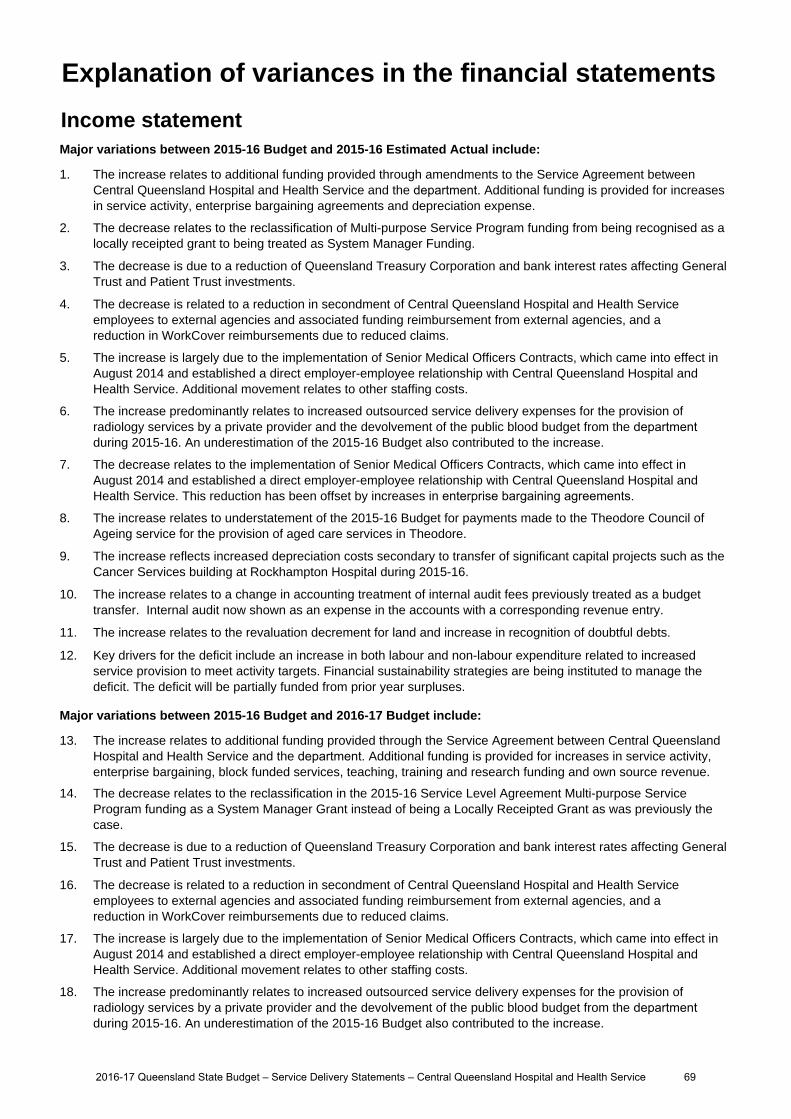
Income statementMajor variations between 2015-16 Budget and 2015-16 Estimated Actual include:
1. The increase relates to additional funding provided through amendments to the Service Agreement betweenCentral Queensland Hospital and Health Service and the department. Additional funding is provided for increasesin service activity, enterprise bargaining agreements and depreciation expense.
2. The decrease relates to the reclassification of Multi-purpose Service Program funding from being recognised as alocally receipted grant to being treated as System Manager Funding.
3. The decrease is due to a reduction of Queensland Treasury Corporation and bank interest rates affecting GeneralTrust and Patient Trust investments.
4. The decrease is related to a reduction in secondment of Central Queensland Hospital and Health Serviceemployees to external agencies and associated funding reimbursement from external agencies, and areduction in WorkCover reimbursements due to reduced claims.
5. The increase is largely due to the implementation of Senior Medical Officers Contracts, which came into effect in August 2014 and established a direct employer-employee relationship with Central Queensland Hospital and Health Service. Additional movement relates to other staffing costs.
6. The increase predominantly relates to increased outsourced service delivery expenses for the provision of radiology services by a private provider and the devolvement of the public blood budget from the department during 2015-16. An underestimation of the 2015-16 Budget also contributed to the increase.
7. The decrease relates to the implementation of Senior Medical Officers Contracts, which came into effect inAugust 2014 and established a direct employer-employee relationship with Central Queensland Hospital andHealth Service. This reduction has been offset by increases in enterprise bargaining agreements.
8. The increase relates to understatement of the 2015-16 Budget for payments made to the Theodore Council ofAgeing service for the provision of aged care services in Theodore.
9. The increase reflects increased depreciation costs secondary to transfer of significant capital projects such as theCancer Services building at Rockhampton Hospital during 2015-16.
10. The increase relates to a change in accounting treatment of internal audit fees previously treated as a budgettransfer. Internal audit now shown as an expense in the accounts with a corresponding revenue entry.
11. The increase relates to the revaluation decrement for land and increase in recognition of doubtful debts.
12. Key drivers for the deficit include an increase in both labour and non-labour expenditure related to increasedservice provision to meet activity targets. Financial sustainability strategies are being instituted to manage thedeficit. The deficit will be partially funded from prior year surpluses.
Major variations between 2015-16 Budget and 2016-17 Budget include:
13. The increase relates to additional funding provided through the Service Agreement between Central Queensland Hospital and Health Service and the department. Additional funding is provided for increases in service activity, enterprise bargaining, block funded services, teaching, training and research funding and own source revenue.
14. The decrease relates to the reclassification in the 2015-16 Service Level Agreement Multi-purpose ServiceProgram funding as a System Manager Grant instead of being a Locally Receipted Grant as was previously thecase.
15. The decrease is due to a reduction of Queensland Treasury Corporation and bank interest rates affecting GeneralTrust and Patient Trust investments.
16. The decrease is related to a reduction in secondment of Central Queensland Hospital and Health Serviceemployees to external agencies and associated funding reimbursement from external agencies, and areduction in WorkCover reimbursements due to reduced claims.
17. The increase is largely due to the implementation of Senior Medical Officers Contracts, which came into effect in August 2014 and established a direct employer-employee relationship with Central Queensland Hospital and Health Service. Additional movement relates to other staffing costs.
18. The increase predominantly relates to increased outsourced service delivery expenses for the provision of radiology services by a private provider and the devolvement of the public blood budget from the department during 2015-16. An underestimation of the 2015-16 Budget also contributed to the increase.
Explanation of variances in the financial statements
2016-17 Queensland State Budget – Service Delivery Statements – Central Queensland Hospital and Health Service 69
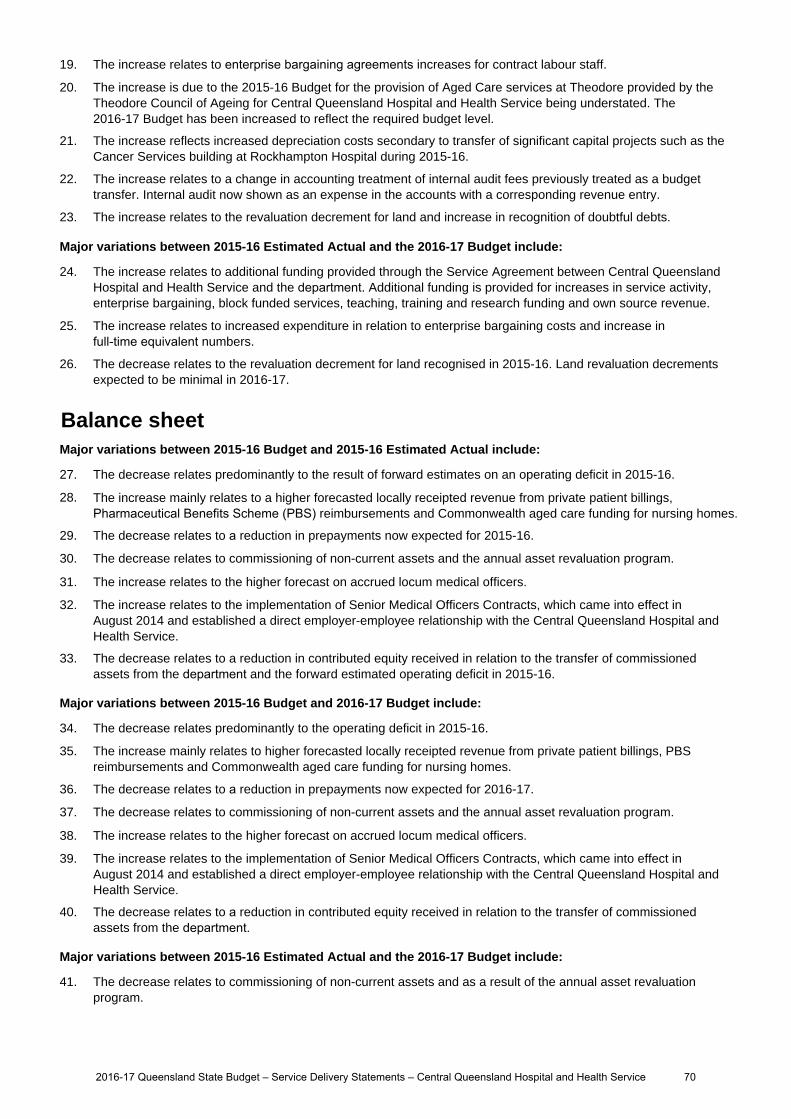
19. The increase relates to enterprise bargaining agreements increases for contract labour staff.
20. The increase is due to the 2015-16 Budget for the provision of Aged Care services at Theodore provided by the Theodore Council of Ageing for Central Queensland Hospital and Health Service being understated. The 2016-17 Budget has been increased to reflect the required budget level.
21. The increase reflects increased depreciation costs secondary to transfer of significant capital projects such as theCancer Services building at Rockhampton Hospital during 2015-16.
22. The increase relates to a change in accounting treatment of internal audit fees previously treated as a budget transfer. Internal audit now shown as an expense in the accounts with a corresponding revenue entry.
23. The increase relates to the revaluation decrement for land and increase in recognition of doubtful debts.
Major variations between 2015-16 Estimated Actual and the 2016-17 Budget include:
24. The increase relates to additional funding provided through the Service Agreement between Central Queensland Hospital and Health Service and the department. Additional funding is provided for increases in service activity, enterprise bargaining, block funded services, teaching, training and research funding and own source revenue.
25. The increase relates to increased expenditure in relation to enterprise bargaining costs and increase infull-time equivalent numbers.
26. The decrease relates to the revaluation decrement for land recognised in 2015-16. Land revaluation decrementsexpected to be minimal in 2016-17.
Balance sheetMajor variations between 2015-16 Budget and 2015-16 Estimated Actual include:
27. The decrease relates predominantly to the result of forward estimates on an operating deficit in 2015-16.
28. The increase mainly relates to a higher forecasted locally receipted revenue from private patient billings,Pharmaceutical Benefits Scheme (PBS) reimbursements and Commonwealth aged care funding for nursing homes.
29. The decrease relates to a reduction in prepayments now expected for 2015-16.
30. The decrease relates to commissioning of non-current assets and the annual asset revaluation program.
31. The increase relates to the higher forecast on accrued locum medical officers.
32. The increase relates to the implementation of Senior Medical Officers Contracts, which came into effect inAugust 2014 and established a direct employer-employee relationship with the Central Queensland Hospital andHealth Service.
33. The decrease relates to a reduction in contributed equity received in relation to the transfer of commissionedassets from the department and the forward estimated operating deficit in 2015-16.
Major variations between 2015-16 Budget and 2016-17 Budget include:
34. The decrease relates predominantly to the operating deficit in 2015-16.
35. The increase mainly relates to higher forecasted locally receipted revenue from private patient billings, PBSreimbursements and Commonwealth aged care funding for nursing homes.
36. The decrease relates to a reduction in prepayments now expected for 2016-17.
37. The decrease relates to commissioning of non-current assets and the annual asset revaluation program.
38. The increase relates to the higher forecast on accrued locum medical officers.
39. The increase relates to the implementation of Senior Medical Officers Contracts, which came into effect inAugust 2014 and established a direct employer-employee relationship with the Central Queensland Hospital andHealth Service.
40. The decrease relates to a reduction in contributed equity received in relation to the transfer of commissionedassets from the department.
Major variations between 2015-16 Estimated Actual and the 2016-17 Budget include:
41. The decrease relates to commissioning of non-current assets and as a result of the annual asset revaluationprogram.
2016-17 Queensland State Budget – Service Delivery Statements – Central Queensland Hospital and Health Service 70
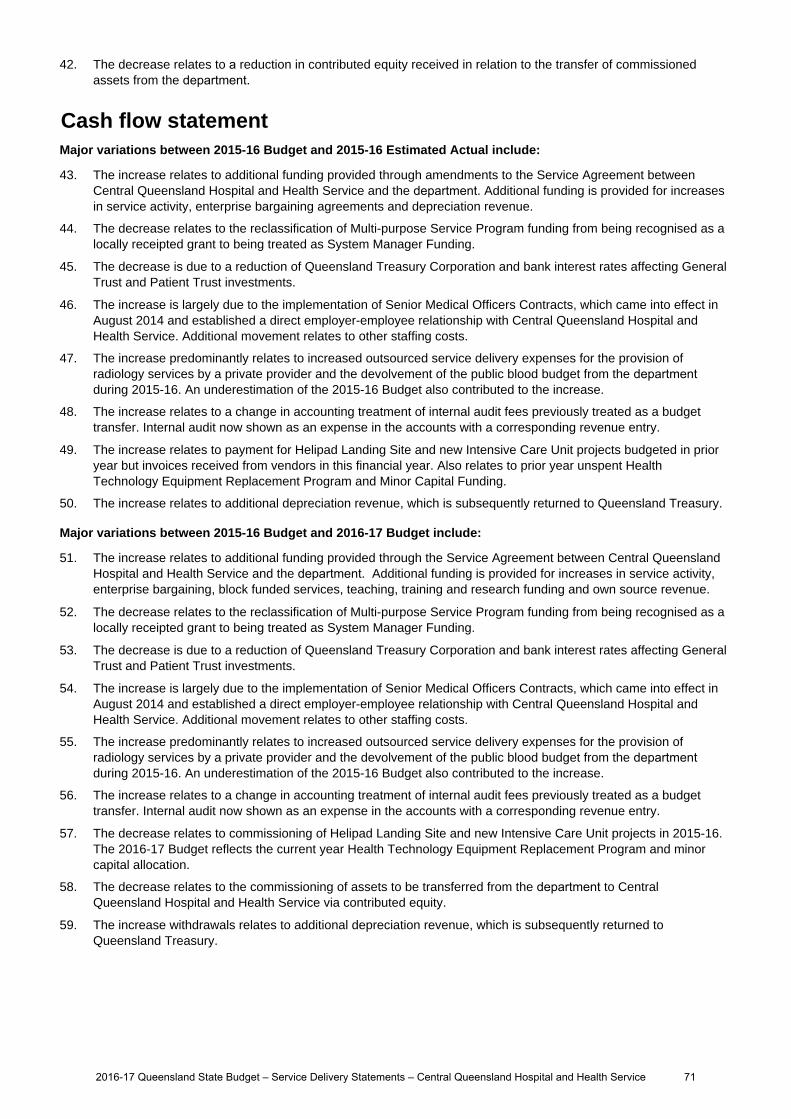
42. The decrease relates to a reduction in contributed equity received in relation to the transfer of commissionedassets from the department.
Cash flow statementMajor variations between 2015-16 Budget and 2015-16 Estimated Actual include:
43. The increase relates to additional funding provided through amendments to the Service Agreement betweenCentral Queensland Hospital and Health Service and the department. Additional funding is provided for increasesin service activity, enterprise bargaining agreements and depreciation revenue.
44. The decrease relates to the reclassification of Multi-purpose Service Program funding from being recognised as alocally receipted grant to being treated as System Manager Funding.
45. The decrease is due to a reduction of Queensland Treasury Corporation and bank interest rates affecting GeneralTrust and Patient Trust investments.
46. The increase is largely due to the implementation of Senior Medical Officers Contracts, which came into effect in August 2014 and established a direct employer-employee relationship with Central Queensland Hospital and Health Service. Additional movement relates to other staffing costs.
47. The increase predominantly relates to increased outsourced service delivery expenses for the provision of radiology services by a private provider and the devolvement of the public blood budget from the department during 2015-16. An underestimation of the 2015-16 Budget also contributed to the increase.
48. The increase relates to a change in accounting treatment of internal audit fees previously treated as a budget transfer. Internal audit now shown as an expense in the accounts with a corresponding revenue entry.
49. The increase relates to payment for Helipad Landing Site and new Intensive Care Unit projects budgeted in prior year but invoices received from vendors in this financial year. Also relates to prior year unspent Health Technology Equipment Replacement Program and Minor Capital Funding.
50. The increase relates to additional depreciation revenue, which is subsequently returned to Queensland Treasury.
Major variations between 2015-16 Budget and 2016-17 Budget include:
51. The increase relates to additional funding provided through the Service Agreement between Central QueenslandHospital and Health Service and the department. Additional funding is provided for increases in service activity,enterprise bargaining, block funded services, teaching, training and research funding and own source revenue.
52. The decrease relates to the reclassification of Multi-purpose Service Program funding from being recognised as alocally receipted grant to being treated as System Manager Funding.
53. The decrease is due to a reduction of Queensland Treasury Corporation and bank interest rates affecting GeneralTrust and Patient Trust investments.
54. The increase is largely due to the implementation of Senior Medical Officers Contracts, which came into effect inAugust 2014 and established a direct employer-employee relationship with Central Queensland Hospital andHealth Service. Additional movement relates to other staffing costs.
55. The increase predominantly relates to increased outsourced service delivery expenses for the provision of radiology services by a private provider and the devolvement of the public blood budget from the department during 2015-16. An underestimation of the 2015-16 Budget also contributed to the increase.
56. The increase relates to a change in accounting treatment of internal audit fees previously treated as a budget transfer. Internal audit now shown as an expense in the accounts with a corresponding revenue entry.
57. The decrease relates to commissioning of Helipad Landing Site and new Intensive Care Unit projects in 2015-16.The 2016-17 Budget reflects the current year Health Technology Equipment Replacement Program and minorcapital allocation.
58. The decrease relates to the commissioning of assets to be transferred from the department to CentralQueensland Hospital and Health Service via contributed equity.
59. The increase withdrawals relates to additional depreciation revenue, which is subsequently returned toQueensland Treasury.
2016-17 Queensland State Budget – Service Delivery Statements – Central Queensland Hospital and Health Service 71
Major variations between 2015-16 Estimated Actual and the 2016-17 Budget include:
60. The increase relates to additional funding provided through the Service Agreement between Central QueenslandHospital and Health Service and the department. Additional funding is provided for increases in service activity,enterprise bargaining, block funded services, teaching, training and research funding and own source revenue.
61. The increase predominantly relates to increased outsourced service delivery expenses for the provision ofradiology services by a private provider and the devolvement of the public blood budget from the departmentduring 2015-16. An underestimation of the 2015-16 Budget also contributed to the increase.
62. The decrease relates to purchases of other plant and equipment being higher in 2015-16 due to construction ofthe helipad and intensive care unit at Rockhampton Hospital. The 2016-17 Budget reflects the current year minorcapital allocation and reduced Health Technology Equipment Replacement Program.
63. The decrease relates to the commissioning of assets to be transferred from the department to CentralQueensland Hospital and Health Service via contributed equity.
2016-17 Queensland State Budget – Service Delivery Statements – Central Queensland Hospital and Health Service 72
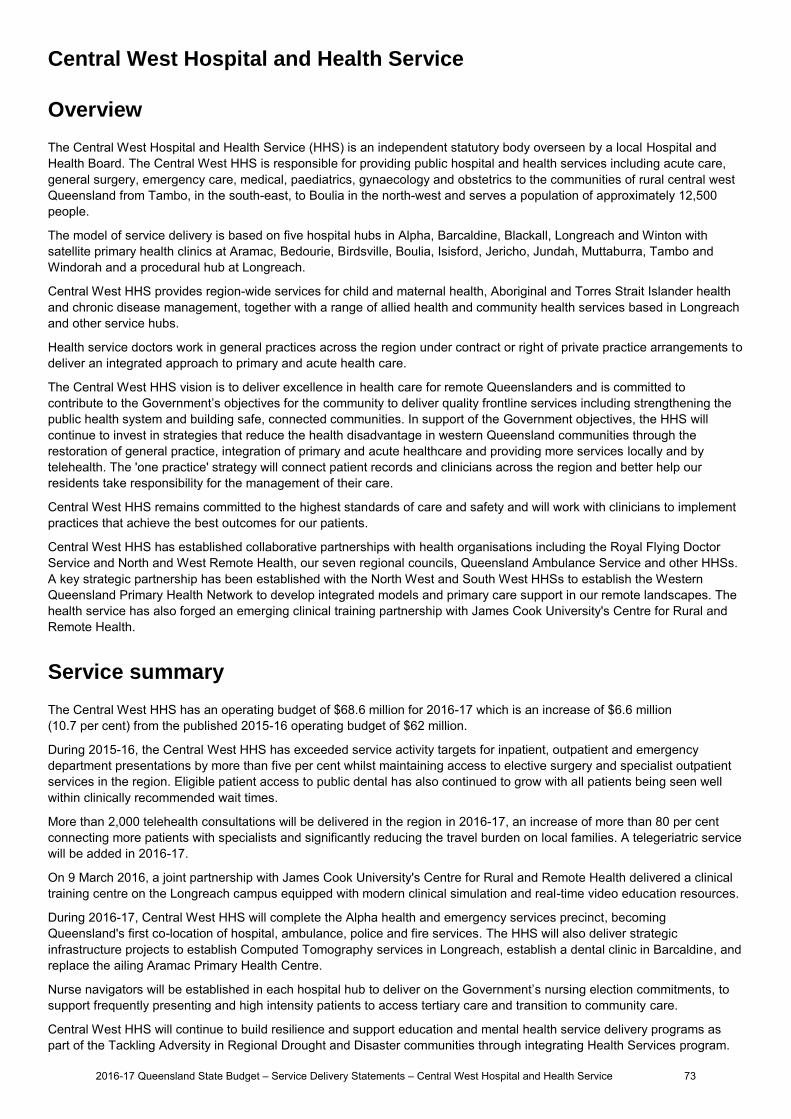
Central West Hospital and Health Service
Overview
The Central West Hospital and Health Service (HHS) is an independent statutory body overseen by a local Hospital and Health Board. The Central West HHS is responsible for providing public hospital and health services including acute care, general surgery, emergency care, medical, paediatrics, gynaecology and obstetrics to the communities of rural central west Queensland from Tambo, in the south-east, to Boulia in the north-west and serves a population of approximately 12,500 people.
The model of service delivery is based on five hospital hubs in Alpha, Barcaldine, Blackall, Longreach and Winton with satellite primary health clinics at Aramac, Bedourie, Birdsville, Boulia, Isisford, Jericho, Jundah, Muttaburra, Tambo and Windorah and a procedural hub at Longreach.
Central West HHS provides region-wide services for child and maternal health, Aboriginal and Torres Strait Islander health and chronic disease management, together with a range of allied health and community health services based in Longreach and other service hubs.
Health service doctors work in general practices across the region under contract or right of private practice arrangements to deliver an integrated approach to primary and acute health care.
The Central West HHS vision is to deliver excellence in health care for remote Queenslanders and is committed to contribute to the Government’s objectives for the community to deliver quality frontline services including strengthening the public health system and building safe, connected communities. In support of the Government objectives, the HHS will continue to invest in strategies that reduce the health disadvantage in western Queensland communities through the restoration of general practice, integration of primary and acute healthcare and providing more services locally and by telehealth. The 'one practice' strategy will connect patient records and clinicians across the region and better help our residents take responsibility for the management of their care.
Central West HHS remains committed to the highest standards of care and safety and will work with clinicians to implement practices that achieve the best outcomes for our patients.
Central West HHS has established collaborative partnerships with health organisations including the Royal Flying Doctor Service and North and West Remote Health, our seven regional councils, Queensland Ambulance Service and other HHSs. A key strategic partnership has been established with the North West and South West HHSs to establish the Western Queensland Primary Health Network to develop integrated models and primary care support in our remote landscapes. The health service has also forged an emerging clinical training partnership with James Cook University's Centre for Rural and Remote Health.
Service summary
The Central West HHS has an operating budget of $68.6 million for 2016-17 which is an increase of $6.6 million (10.7 per cent) from the published 2015-16 operating budget of $62 million.
During 2015-16, the Central West HHS has exceeded service activity targets for inpatient, outpatient and emergency department presentations by more than five per cent whilst maintaining access to elective surgery and specialist outpatient services in the region. Eligible patient access to public dental has also continued to grow with all patients being seen well within clinically recommended wait times.
More than 2,000 telehealth consultations will be delivered in the region in 2016-17, an increase of more than 80 per cent connecting more patients with specialists and significantly reducing the travel burden on local families. A telegeriatric service will be added in 2016-17.
On 9 March 2016, a joint partnership with James Cook University's Centre for Rural and Remote Health delivered a clinical training centre on the Longreach campus equipped with modern clinical simulation and real-time video education resources.
During 2016-17, Central West HHS will complete the Alpha health and emergency services precinct, becoming Queensland's first co-location of hospital, ambulance, police and fire services. The HHS will also deliver strategic infrastructure projects to establish Computed Tomography services in Longreach, establish a dental clinic in Barcaldine, and replace the ailing Aramac Primary Health Centre.
Nurse navigators will be established in each hospital hub to deliver on the Government’s nursing election commitments, to support frequently presenting and high intensity patients to access tertiary care and transition to community care.
Central West HHS will continue to build resilience and support education and mental health service delivery programs as part of the Tackling Adversity in Regional Drought and Disaster communities through integrating Health Services program.
2016-17 Queensland State Budget – Service Delivery Statements – Central West Hospital and Health Service 73
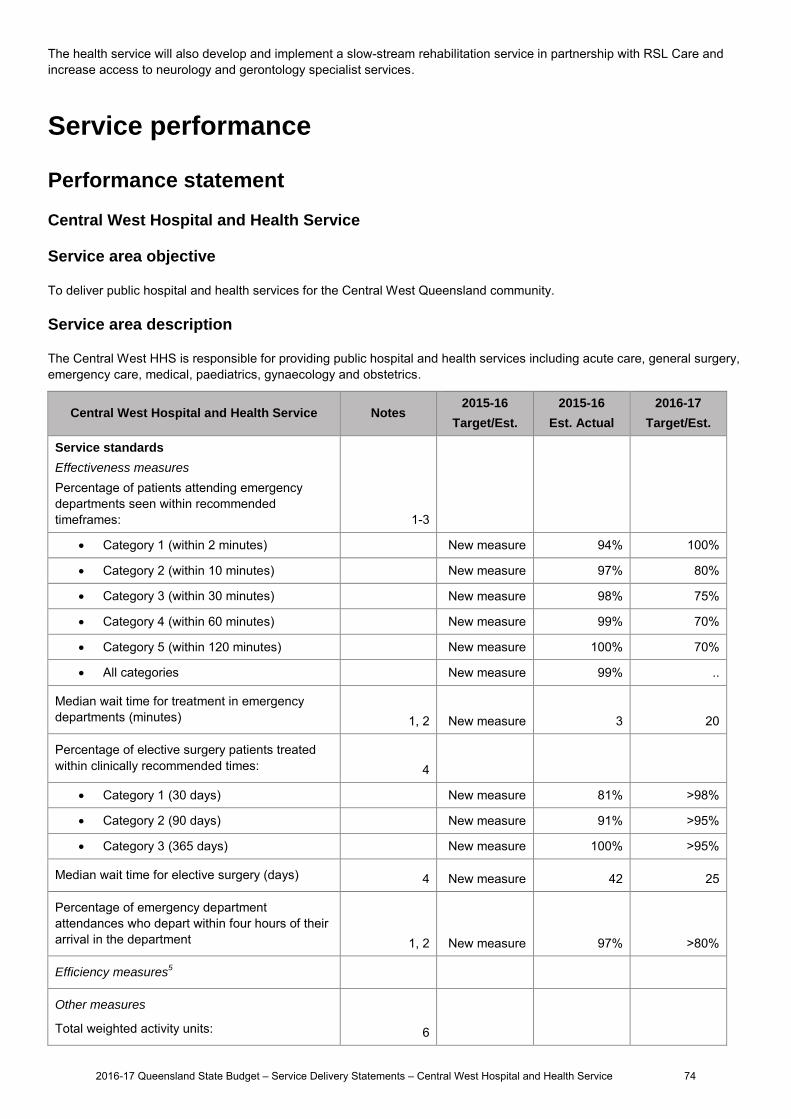
The health service will also develop and implement a slow-stream rehabilitation service in partnership with RSL Care and increase access to neurology and gerontology specialist services.
Service performance
Performance statement
Central West Hospital and Health Service
Service area objective
To deliver public hospital and health services for the Central West Queensland community.
Service area description
The Central West HHS is responsible for providing public hospital and health services including acute care, general surgery, emergency care, medical, paediatrics, gynaecology and obstetrics.
Central West Hospital and Health Service Notes 2015-16
Target/Est.
2015-16
Est. Actual
2016-17
Target/Est.
Service standards
Effectiveness measures
Percentage of patients attending emergency departments seen within recommended timeframes:
1-3
Category 1 (within 2 minutes) New measure 94% 100%
Category 2 (within 10 minutes) New measure 97% 80%
Category 3 (within 30 minutes) New measure 98% 75%
Category 4 (within 60 minutes) New measure 99% 70%
Category 5 (within 120 minutes) New measure 100% 70%
All categories New measure 99% ..
Median wait time for treatment in emergency departments (minutes) 1, 2 New measure 3 20
Percentage of elective surgery patients treated within clinically recommended times: 4
Category 1 (30 days) New measure 81% >98%
Category 2 (90 days) New measure 91% >95%
Category 3 (365 days) New measure 100% >95%
Median wait time for elective surgery (days) 4 New measure 42 25
Percentage of emergency department attendances who depart within four hours of their arrival in the department 1, 2 New measure 97% >80%
Efficiency measures5
Other measures
Total weighted activity units: 6
2016-17 Queensland State Budget – Service Delivery Statements – Central West Hospital and Health Service 74
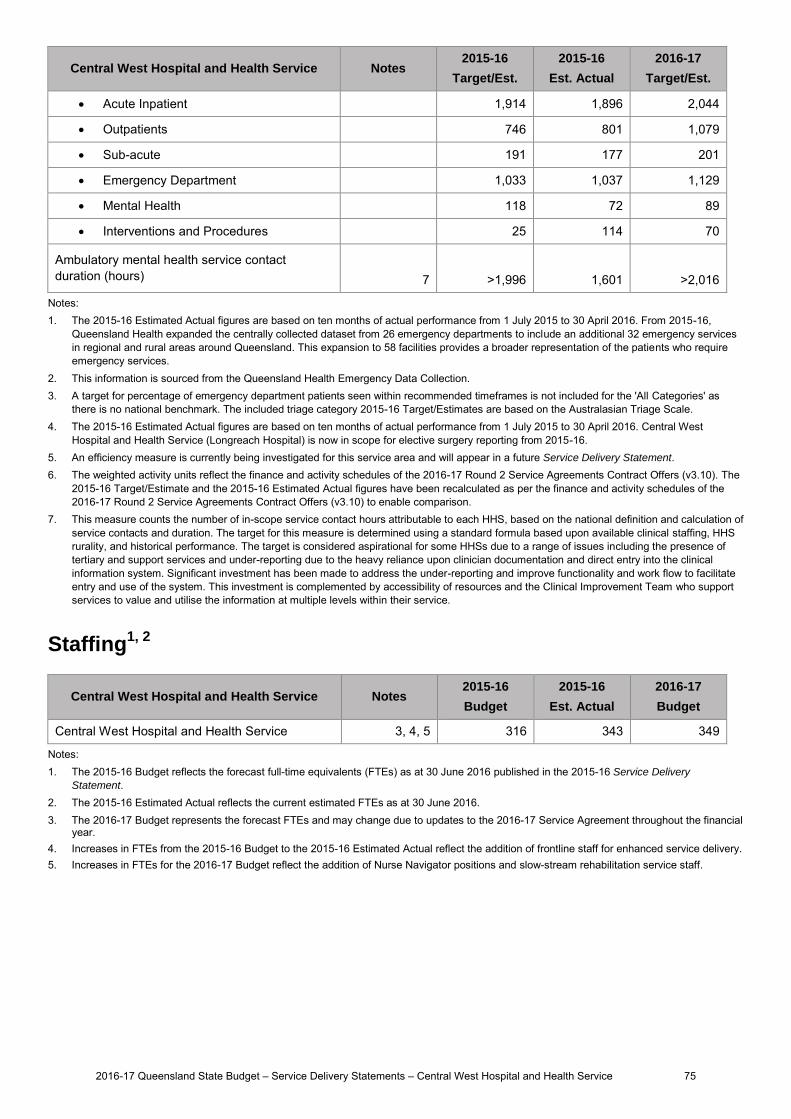
Central West Hospital and Health Service Notes 2015-16
Target/Est.
2015-16
Est. Actual
2016-17
Target/Est.
Acute Inpatient 1,914 1,896 2,044
Outpatients 746 801 1,079
Sub-acute 191 177 201
Emergency Department 1,033 1,037 1,129
Mental Health 118 72 89
Interventions and Procedures 25 114 70
Ambulatory mental health service contact duration (hours) 7 >1,996 1,601 >2,016
Notes: 1. The 2015-16 Estimated Actual figures are based on ten months of actual performance from 1 July 2015 to 30 April 2016. From 2015-16,
Queensland Health expanded the centrally collected dataset from 26 emergency departments to include an additional 32 emergency services in regional and rural areas around Queensland. This expansion to 58 facilities provides a broader representation of the patients who require emergency services.
2. This information is sourced from the Queensland Health Emergency Data Collection. 3. A target for percentage of emergency department patients seen within recommended timeframes is not included for the 'All Categories' as
there is no national benchmark. The included triage category 2015-16 Target/Estimates are based on the Australasian Triage Scale. 4. The 2015-16 Estimated Actual figures are based on ten months of actual performance from 1 July 2015 to 30 April 2016. Central West
Hospital and Health Service (Longreach Hospital) is now in scope for elective surgery reporting from 2015-16. 5. An efficiency measure is currently being investigated for this service area and will appear in a future Service Delivery Statement. 6. The weighted activity units reflect the finance and activity schedules of the 2016-17 Round 2 Service Agreements Contract Offers (v3.10). The
2015-16 Target/Estimate and the 2015-16 Estimated Actual figures have been recalculated as per the finance and activity schedules of the 2016-17 Round 2 Service Agreements Contract Offers (v3.10) to enable comparison.
7. This measure counts the number of in-scope service contact hours attributable to each HHS, based on the national definition and calculation of service contacts and duration. The target for this measure is determined using a standard formula based upon available clinical staffing, HHS rurality, and historical performance. The target is considered aspirational for some HHSs due to a range of issues including the presence of tertiary and support services and under-reporting due to the heavy reliance upon clinician documentation and direct entry into the clinical information system. Significant investment has been made to address the under-reporting and improve functionality and work flow to facilitate entry and use of the system. This investment is complemented by accessibility of resources and the Clinical Improvement Team who support services to value and utilise the information at multiple levels within their service.
Staffing1, 2
Central West Hospital and Health Service Notes 2015-16
Budget
2015-16
Est. Actual
2016-17
Budget
Central West Hospital and Health Service 3, 4, 5 316 343 349
Notes: 1. The 2015-16 Budget reflects the forecast full-time equivalents (FTEs) as at 30 June 2016 published in the 2015-16 Service Delivery
Statement. 2. The 2015-16 Estimated Actual reflects the current estimated FTEs as at 30 June 2016. 3. The 2016-17 Budget represents the forecast FTEs and may change due to updates to the 2016-17 Service Agreement throughout the financial
year. 4. Increases in FTEs from the 2015-16 Budget to the 2015-16 Estimated Actual reflect the addition of frontline staff for enhanced service delivery. 5. Increases in FTEs for the 2016-17 Budget reflect the addition of Nurse Navigator positions and slow-stream rehabilitation service staff.
2016-17 Queensland State Budget – Service Delivery Statements – Central West Hospital and Health Service 75

Income statement
Central West Hospital and Health Service Notes 2015-16 Budget
$'000
2015-16 Est. Act.
$'000
2016-17 Budget
$'000
INCOME
User charges and fees 4 59,754 65,103 66,651
Grants and other contributions 1,5 2,044 678 690
Interest 2 .. ..
Other revenue 2,6,8 171 1,081 1,250
Gains on sale/revaluation of assets .. .. ..
Total income 61,971 66,862 68,591
EXPENSES
Employee expenses 10,006 10,151 10,464
Supplies and Services:
Other supplies and services 26,857 18,928 18,749
Department of Health contract staff 3,7 21,118 33,975 35,053
Grants and subsidies .. .. ..
Depreciation and amortisation 9 3,846 3,664 4,179
Finance/borrowing costs .. .. ..
Other expenses 69 69 70
Losses on sale/revaluation of assets 75 75 76
Total expenses 61,971 66,862 68,591
OPERATING SURPLUS/(DEFICIT) .. .. ..
2016-17 Queensland State Budget – Service Delivery Statements – Central West Hospital and Health Service 76

Balance sheet
Central West Hospital and Health Service Notes 2015-16 Budget
$'000
2015-16 Est. Act.
$'000
2016-17 Budget
$'000
CURRENT ASSETS
Cash assets 10,13,18 2,401 1,804 1,288
Receivables 1,361 1,371 1,379
Other financial assets .. .. ..
Inventories 11,14 463 590 594
Other 52 56 64
Non-financial assets held for sale .. .. ..
Total current assets 4,277 3,821 3,325
NON-CURRENT ASSETS
Receivables .. .. ..
Other financial assets .. .. ..
Property, plant and equipment 15,19 58,754 61,505 69,537
Intangibles .. .. ..
Other .. .. ..
Total non-current assets 58,754 61,505 69,537
TOTAL ASSETS 63,031 65,326 72,862
CURRENT LIABILITIES
Payables 12,16,20 3,012 2,347 1,851
Accrued employee benefits 27 108 108
Interest bearing liabilities and derivatives .. .. ..
Provisions .. .. ..
Other .. .. ..
Total current liabilities 3,039 2,455 1,959
NON-CURRENT LIABILITIES
Payables .. .. ..
Accrued employee benefits .. .. ..
Interest bearing liabilities and derivatives .. .. ..
Provisions .. .. ..
Other .. .. ..
Total non-current liabilities .. .. ..
TOTAL LIABILITIES 3,039 2,455 1,959
NET ASSETS/(LIABILITIES) 59,992 62,871 70,903
EQUITY
TOTAL EQUITY 17,21 59,992 62,871 70,903
2016-17 Queensland State Budget – Service Delivery Statements – Central West Hospital and Health Service 77
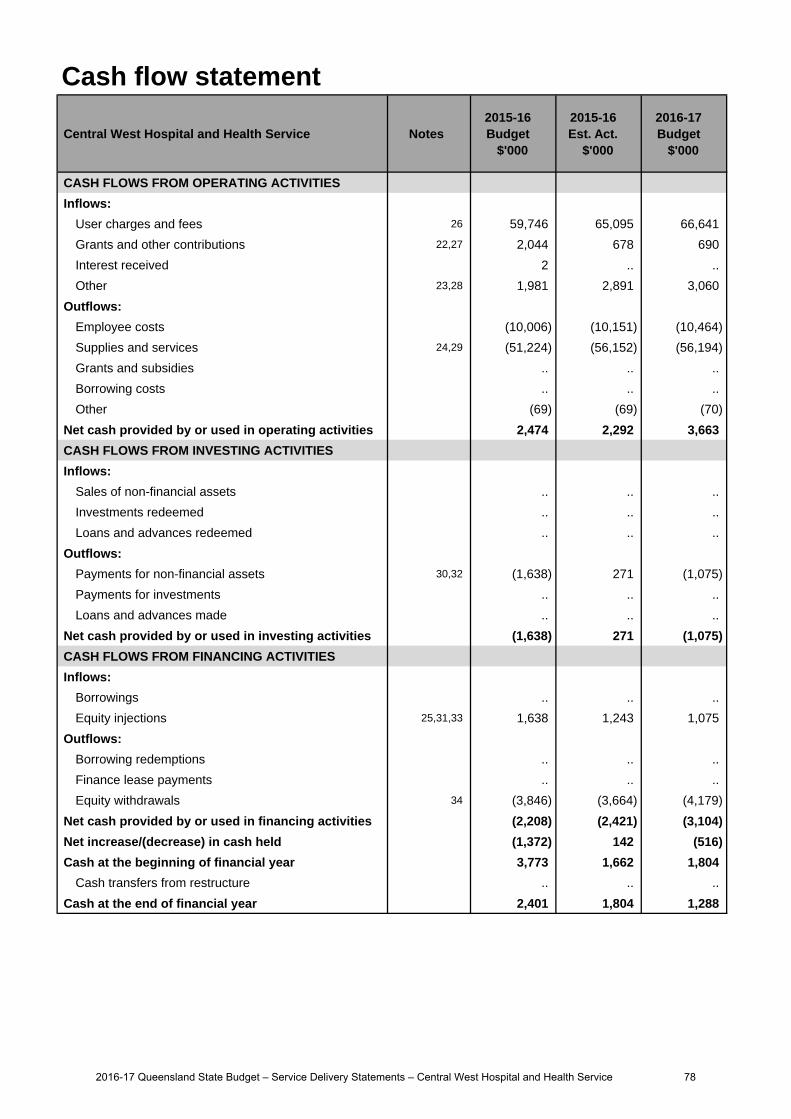
Cash flow statement
Central West Hospital and Health Service Notes 2015-16 Budget
$'000
2015-16 Est. Act.
$'000
2016-17 Budget
$'000
CASH FLOWS FROM OPERATING ACTIVITIES
Inflows:
User charges and fees 26 59,746 65,095 66,641
Grants and other contributions 22,27 2,044 678 690
Interest received 2 .. ..
Other 23,28 1,981 2,891 3,060
Outflows:
Employee costs (10,006) (10,151) (10,464)
Supplies and services 24,29 (51,224) (56,152) (56,194)
Grants and subsidies .. .. ..
Borrowing costs .. .. ..
Other (69) (69) (70)
Net cash provided by or used in operating activities 2,474 2,292 3,663
CASH FLOWS FROM INVESTING ACTIVITIES
Inflows:
Sales of non-financial assets .. .. ..
Investments redeemed .. .. ..
Loans and advances redeemed .. .. ..
Outflows:
Payments for non-financial assets 30,32 (1,638) 271 (1,075)
Payments for investments .. .. ..
Loans and advances made .. .. ..
Net cash provided by or used in investing activities (1,638) 271 (1,075)
CASH FLOWS FROM FINANCING ACTIVITIES
Inflows:
Borrowings .. .. ..
Equity injections 25,31,33 1,638 1,243 1,075
Outflows:
Borrowing redemptions .. .. ..
Finance lease payments .. .. ..
Equity withdrawals 34 (3,846) (3,664) (4,179)
Net cash provided by or used in financing activities (2,208) (2,421) (3,104)
Net increase/(decrease) in cash held (1,372) 142 (516)
Cash at the beginning of financial year 3,773 1,662 1,804
Cash transfers from restructure .. .. ..
Cash at the end of financial year 2,401 1,804 1,288
2016-17 Queensland State Budget – Service Delivery Statements – Central West Hospital and Health Service 78
Income statementMajor variations between 2015-16 Budget and 2015-16 Estimated Actual include:
1. The decrease is due to the reclassification of Multi Purpose Health Service (MPHS) funding which is now includedin funding from the department.
2. The increase is due to additional locally receipted own source revenue within the Hospitals for video equipmentand wage reimbursements.
3. The increase is largely due to the enterprise bargaining increases for department contract staff.
Major variations between 2015-16 Budget and 2016-17 Budget include:
4. The increase relates to additional funding provided through amendments to the Service Agreement betweenCentral West Hospital and Health Service and the department. Additional funding provided for patient transportand asset management cost increases, additional program funding, enterprise bargaining and depreciationexpenses.
5. The decrease is due to the reclassification of MPHS funding which is now included in funding from thedepartment.
6. The increase is due to additional locally receipted own source revenue within the Hospitals for video equipmentand wage reimbursements.
7. The increase is largely due to the enterprise bargaining increases for department contract staff.
Major variations between 2015-16 Estimated Actual and the 2016-17 Budget include:
8. The increase is due to additional locally receipted own source revenue within the Hospitals for video equipmentand wage reimbursements.
9. The increase is due to the capitalisation of major works in Alpha and Barcaldine Hospitals and Aramac PrimaryHealth Centre.
Balance sheetMajor variations between 2015-16 Budget and 2015-16 Estimated Actual include:
10. The decrease relates to earlier payment of payables due to the department.
11. The increase relates to the need for additional pharmacy drugs.
12. The decrease relates to earlier payment of payables due to the department.
Major variations between 2015-16 Budget and 2016-17 Budget include:
13. The decrease relates to earlier payment of payables due to the department.
14. The increase relates to the need for additional pharmacy drugs.
15. The increase relates to the transfer of non-current assets from the department.
16. The decrease relates to earlier payment of payables due to the department.
17. The increase is due to the transfer of non-current assets from the department.
Major variations between 2015-16 Estimated Actual and the 2016-17 Budget include:
18. The decrease relates to earlier payment of payables due to the department.
19. The increase relates to the transfer of non-current assets from the department.
20. The decrease relates to earlier payment of payables due to the department.
21. The increase is due to the transfer of non-current assets from the department.
Explanation of variances in the financial statements
2016-17 Queensland State Budget – Service Delivery Statements – Central West Hospital and Health Service 79
Cash flow statementMajor variations between 2015-16 Budget and 2015-16 Estimated Actual include:
22. The decrease is due to the reclassification of MPHS funding which is now included in funding from thedepartment.
23. The increase is due to additional locally receipted own source revenue within the hospitals for video equipmentand wage reimbursements.
24. The increase is largely due to the enterprise bargaining increases for department contract staff.
25. The decrease relates to a reduced commissioning of assets transferred from the department to Central WestHospital and Health Service via contributed equity.
Major variations between 2015-16 Budget and 2016-17 Budget include:
26. The increase relates to additional funding provided through amendments to the Service Agreement betweenCentral West Hospital and Health Service and the department. Additional funding provided for patient transportand asset management cost increases, additional program funding, enterprise bargaining and depreciationexpenses.
27. The decrease is due to the reclassification of MPHS funding which is now included in funding from thedepartment.
28. The increase is due to additional locally receipted own source revenue within the hospitals for video equipmentand wage reimbursements.
29. The increase is largely due to the enterprise bargaining increases for department contract staff.
30. The decrease is due to a reduction in Health Technology Equipment Replacement program spend.
31. The decrease relates to a reduced commissioning of assets transferred from department to Central WestHospital and Health Service via contributed equity.
Major variations between 2015-16 Estimated Actual and the 2016-17 Budget include:
32. The decrease is due to a reduction in Health Technology Equipment Replacement program spend.
33. The decrease relates to a reduced commissioning of assets transferred from department to Central WestHospital and Health Service via contributed equity.
34. The increase relates to an increase in depreciation levels for new hospital build in Alpha.
2016-17 Queensland State Budget – Service Delivery Statements – Central West Hospital and Health Service 80
Children's Health Queensland Hospital and Health Service
Overview
Children’s Health Queensland Hospital and Health Service (HHS) is an independent statutory body overseen by a Hospital and Health Board. Children's Health Queensland HHS is a specialist statewide Hospital and Health Service providing care to children and young people from across Queensland and Northern New South Wales. Children's Health Queensland HHS provides the following services:
secondary, tertiary and quaternary paediatric services at the Lady Cilento Children’s Hospital (LCCH) statewide paediatric service co-ordination and support child and youth community health services including child health, child development, and child protection services child and youth mental health services outreach children’s specialist services across Queensland paediatric education and research advocacy of children’s health service needs across the State, nationally, and internationally.
Children's Health Queensland HHS’s 2016-17 key priorities and objectives align with and support the Queensland Government’s objectives for the community to deliver quality frontline services including strengthening the public health system, and building safe caring and connected communities. Children’s Health Queensland HHS is focused on four overall key objectives: Child and Family Centred Care, Partnerships, People, and Performance. The strategies to achieve these objectives include:
implementing and evaluating the Family and Consumer Participation Strategy implementing the Excellence Framework and performance measures partnering with health sector providers locally and statewide to inform child health policy and enhance child and youth
health outcomes implementing an evaluation framework for prioritising investment in innovation and redesign enhancing financial stewardship and accountability to focus resources on frontline services and revitalise services for
patients developing a framework for transition to adult services leveraging the LCCH ICT infrastructure to enhance clinical care by implementing the LCCH Digital Hospital program.
Service summary
Children's Health Queensland HHS has an operating budget of $677.2 million for 2016-17 which is an increase of $64.9 million (10.6 per cent) from the published 2015-16 operating budget of $612.3 million.
The service agreement between Children's Health Queensland HHS and the department identifies the services to be provided, the funding arrangements for those services and defined performance indicators and targets to ensure outputs and outcomes are achieved.
The Children's Health Queensland HHS Strategic Plan reflects priorities for children’s health services in line with whole-of-government and statewide plans and commitments.
Children's Health Queensland HHS is the only statewide HHS, which provides a unique opportunity to work with other HHSs and healthcare providers to improve the healthcare of children across the State. Since establishment, with input from a wide range of key stakeholders, Children's Health Queensland HHS continues to define and progressively implement key initiatives in accordance with its statewide paediatric role. Children's Health Queensland HHS is committed to the ongoing implementation of, and enhancements to, key initiatives including improved complex care coordination, paediatric education and training and paediatric advice.
2016-17 Queensland State Budget – Service Delivery Statements Children's Health Queensland Hospital and Health Service
81
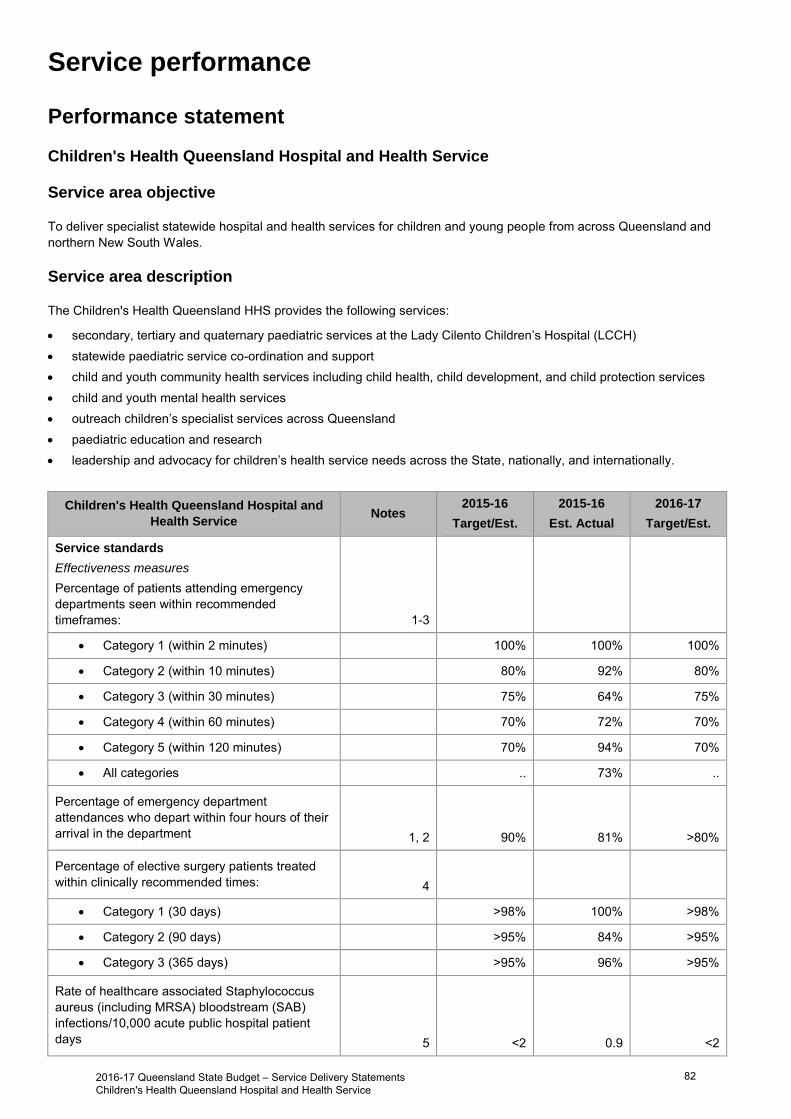
Service performance
Performance statement
Children's Health Queensland Hospital and Health Service
Service area objective
To deliver specialist statewide hospital and health services for children and young people from across Queensland and northern New South Wales.
Service area description
The Children's Health Queensland HHS provides the following services:
secondary, tertiary and quaternary paediatric services at the Lady Cilento Children’s Hospital (LCCH) statewide paediatric service co-ordination and support child and youth community health services including child health, child development, and child protection services child and youth mental health services outreach children’s specialist services across Queensland paediatric education and research leadership and advocacy for children’s health service needs across the State, nationally, and internationally.
Children's Health Queensland Hospital and
Health Service Notes
2015-16
Target/Est.
2015-16
Est. Actual
2016-17
Target/Est.
Service standards
Effectiveness measures
Percentage of patients attending emergency departments seen within recommended timeframes:
1-3
Category 1 (within 2 minutes) 100% 100% 100%
Category 2 (within 10 minutes) 80% 92% 80%
Category 3 (within 30 minutes) 75% 64% 75%
Category 4 (within 60 minutes) 70% 72% 70%
Category 5 (within 120 minutes) 70% 94% 70%
All categories .. 73% ..
Percentage of emergency department attendances who depart within four hours of their arrival in the department 1, 2 90% 81% >80%
Percentage of elective surgery patients treated within clinically recommended times: 4
Category 1 (30 days) >98% 100% >98%
Category 2 (90 days) >95% 84% >95%
Category 3 (365 days) >95% 96% >95%
Rate of healthcare associated Staphylococcus aureus (including MRSA) bloodstream (SAB) infections/10,000 acute public hospital patient days 5 <2 0.9 <2
2016-17 Queensland State Budget – Service Delivery Statements Children's Health Queensland Hospital and Health Service
82
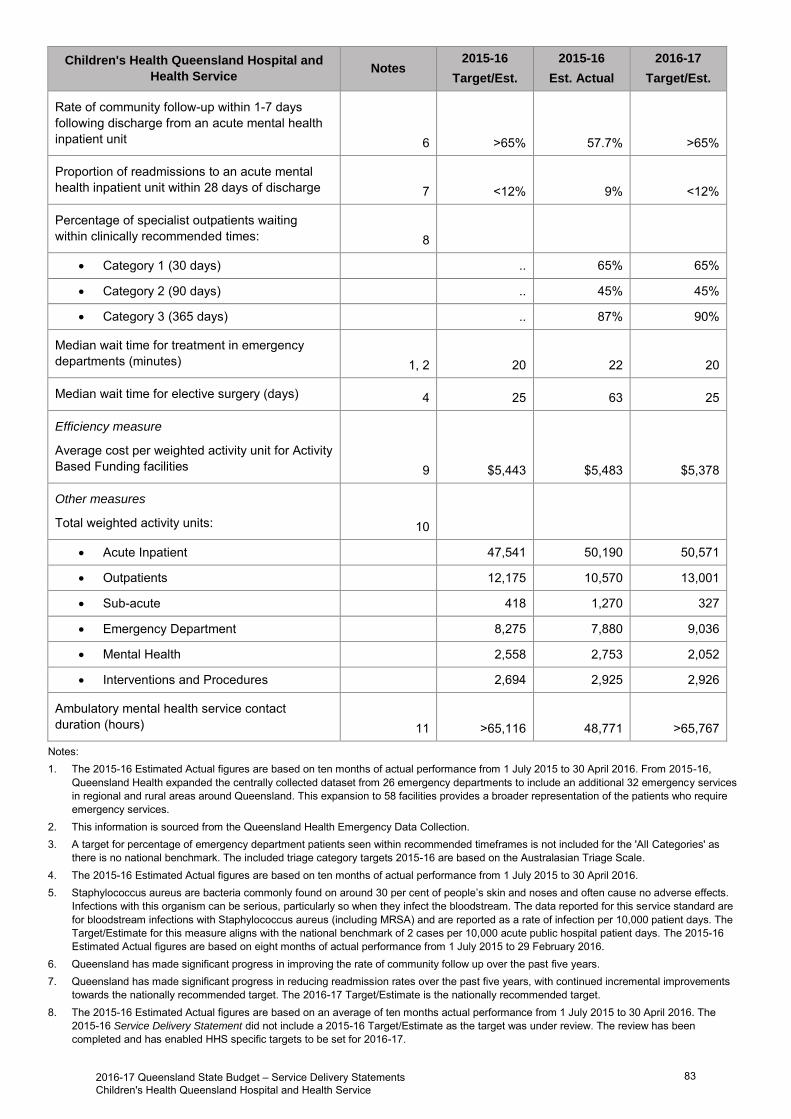
Children's Health Queensland Hospital and
Health Service Notes
2015-16
Target/Est.
2015-16
Est. Actual
2016-17
Target/Est.
Rate of community follow-up within 1-7 days following discharge from an acute mental health inpatient unit 6 >65% 57.7% >65%
Proportion of readmissions to an acute mental health inpatient unit within 28 days of discharge 7 <12% 9% <12%
Percentage of specialist outpatients waiting within clinically recommended times: 8
Category 1 (30 days) .. 65% 65%
Category 2 (90 days) .. 45% 45%
Category 3 (365 days) .. 87% 90%
Median wait time for treatment in emergency departments (minutes) 1, 2 20 22 20
Median wait time for elective surgery (days) 4 25 63 25
Efficiency measure
Average cost per weighted activity unit for Activity Based Funding facilities 9 $5,443 $5,483 $5,378
Other measures
Total weighted activity units: 10
Acute Inpatient 47,541 50,190 50,571
Outpatients 12,175 10,570 13,001
Sub-acute 418 1,270 327
Emergency Department 8,275 7,880 9,036
Mental Health 2,558 2,753 2,052
Interventions and Procedures 2,694 2,925 2,926
Ambulatory mental health service contact duration (hours) 11 >65,116 48,771 >65,767
Notes: 1. The 2015-16 Estimated Actual figures are based on ten months of actual performance from 1 July 2015 to 30 April 2016. From 2015-16,
Queensland Health expanded the centrally collected dataset from 26 emergency departments to include an additional 32 emergency services in regional and rural areas around Queensland. This expansion to 58 facilities provides a broader representation of the patients who require emergency services.
2. This information is sourced from the Queensland Health Emergency Data Collection. 3. A target for percentage of emergency department patients seen within recommended timeframes is not included for the 'All Categories' as
there is no national benchmark. The included triage category targets 2015-16 are based on the Australasian Triage Scale. 4. The 2015-16 Estimated Actual figures are based on ten months of actual performance from 1 July 2015 to 30 April 2016. 5. Staphylococcus aureus are bacteria commonly found on around 30 per cent of people’s skin and noses and often cause no adverse effects.
Infections with this organism can be serious, particularly so when they infect the bloodstream. The data reported for this service standard are for bloodstream infections with Staphylococcus aureus (including MRSA) and are reported as a rate of infection per 10,000 patient days. The Target/Estimate for this measure aligns with the national benchmark of 2 cases per 10,000 acute public hospital patient days. The 2015-16 Estimated Actual figures are based on eight months of actual performance from 1 July 2015 to 29 February 2016.
6. Queensland has made significant progress in improving the rate of community follow up over the past five years. 7. Queensland has made significant progress in reducing readmission rates over the past five years, with continued incremental improvements
towards the nationally recommended target. The 2016-17 Target/Estimate is the nationally recommended target. 8. The 2015-16 Estimated Actual figures are based on an average of ten months actual performance from 1 July 2015 to 30 April 2016. The
2015-16 Service Delivery Statement did not include a 2015-16 Target/Estimate as the target was under review. The review has been completed and has enabled HHS specific targets to be set for 2016-17.
2016-17 Queensland State Budget – Service Delivery Statements Children's Health Queensland Hospital and Health Service
83
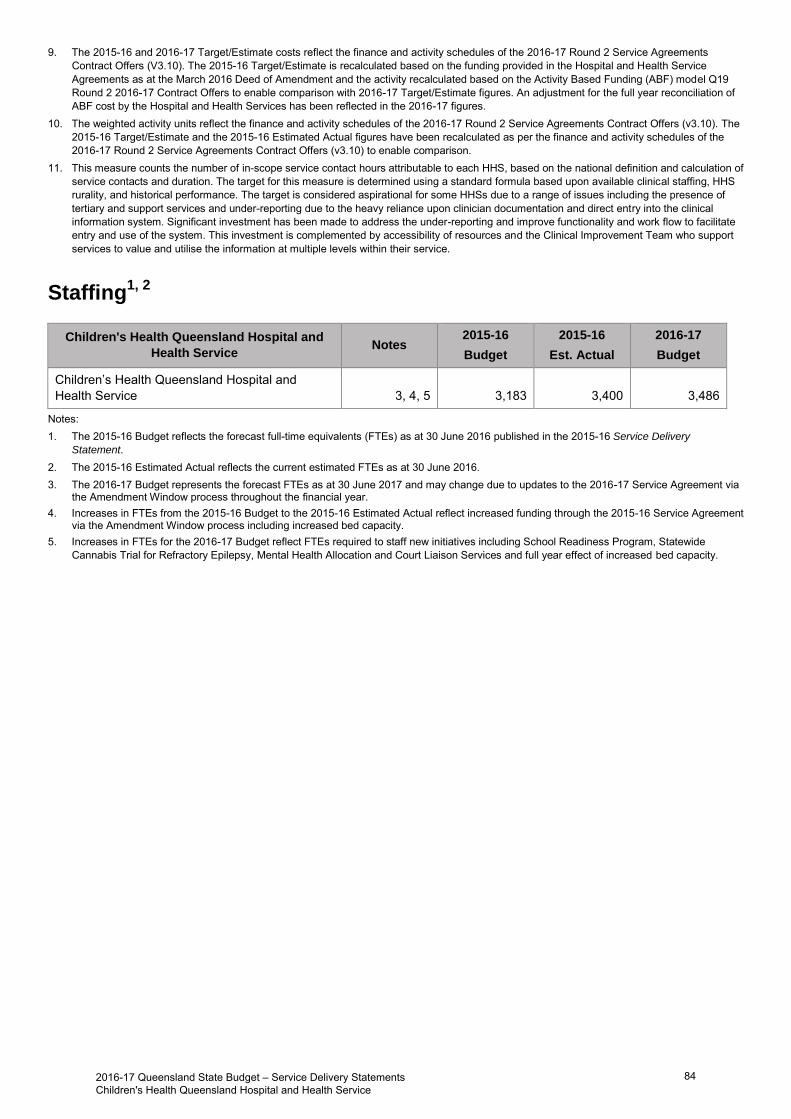
9. The 2015-16 and 2016-17 Target/Estimate costs reflect the finance and activity schedules of the 2016-17 Round 2 Service Agreements Contract Offers (V3.10). The 2015-16 Target/Estimate is recalculated based on the funding provided in the Hospital and Health Service Agreements as at the March 2016 Deed of Amendment and the activity recalculated based on the Activity Based Funding (ABF) model Q19 Round 2 2016-17 Contract Offers to enable comparison with 2016-17 Target/Estimate figures. An adjustment for the full year reconciliation of ABF cost by the Hospital and Health Services has been reflected in the 2016-17 figures.
10. The weighted activity units reflect the finance and activity schedules of the 2016-17 Round 2 Service Agreements Contract Offers (v3.10). The 2015-16 Target/Estimate and the 2015-16 Estimated Actual figures have been recalculated as per the finance and activity schedules of the 2016-17 Round 2 Service Agreements Contract Offers (v3.10) to enable comparison.
11. This measure counts the number of in-scope service contact hours attributable to each HHS, based on the national definition and calculation of service contacts and duration. The target for this measure is determined using a standard formula based upon available clinical staffing, HHS rurality, and historical performance. The target is considered aspirational for some HHSs due to a range of issues including the presence of tertiary and support services and under-reporting due to the heavy reliance upon clinician documentation and direct entry into the clinical information system. Significant investment has been made to address the under-reporting and improve functionality and work flow to facilitate entry and use of the system. This investment is complemented by accessibility of resources and the Clinical Improvement Team who support services to value and utilise the information at multiple levels within their service.
Staffing1, 2
Children's Health Queensland Hospital and
Health Service Notes
2015-16
Budget
2015-16
Est. Actual
2016-17
Budget
Children’s Health Queensland Hospital and Health Service 3, 4, 5 3,183 3,400 3,486
Notes: 1. The 2015-16 Budget reflects the forecast full-time equivalents (FTEs) as at 30 June 2016 published in the 2015-16 Service Delivery
Statement. 2. The 2015-16 Estimated Actual reflects the current estimated FTEs as at 30 June 2016. 3. The 2016-17 Budget represents the forecast FTEs as at 30 June 2017 and may change due to updates to the 2016-17 Service Agreement via
the Amendment Window process throughout the financial year. 4. Increases in FTEs from the 2015-16 Budget to the 2015-16 Estimated Actual reflect increased funding through the 2015-16 Service Agreement
via the Amendment Window process including increased bed capacity. 5. Increases in FTEs for the 2016-17 Budget reflect FTEs required to staff new initiatives including School Readiness Program, Statewide
Cannabis Trial for Refractory Epilepsy, Mental Health Allocation and Court Liaison Services and full year effect of increased bed capacity.
2016-17 Queensland State Budget – Service Delivery Statements Children's Health Queensland Hospital and Health Service
84
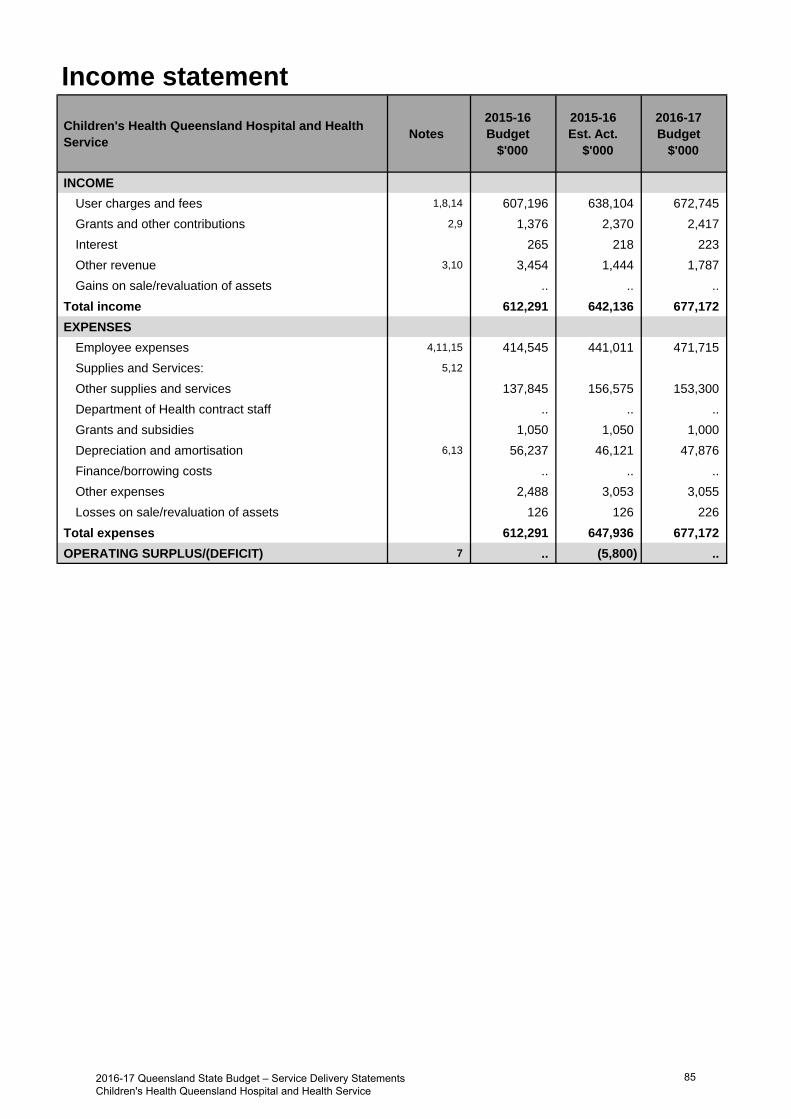
Income statement
Children's Health Queensland Hospital and Health Service
Notes 2015-16 Budget
$'000
2015-16 Est. Act.
$'000
2016-17 Budget
$'000
INCOME
User charges and fees 1,8,14 607,196 638,104 672,745
Grants and other contributions 2,9 1,376 2,370 2,417
Interest 265 218 223
Other revenue 3,10 3,454 1,444 1,787
Gains on sale/revaluation of assets .. .. ..
Total income 612,291 642,136 677,172
EXPENSES
Employee expenses 4,11,15 414,545 441,011 471,715
Supplies and Services: 5,12
Other supplies and services 137,845 156,575 153,300
Department of Health contract staff .. .. ..
Grants and subsidies 1,050 1,050 1,000
Depreciation and amortisation 6,13 56,237 46,121 47,876
Finance/borrowing costs .. .. ..
Other expenses 2,488 3,053 3,055
Losses on sale/revaluation of assets 126 126 226
Total expenses 612,291 647,936 677,172
OPERATING SURPLUS/(DEFICIT) 7 .. (5,800) ..
2016-17 Queensland State Budget – Service Delivery Statements Children's Health Queensland Hospital and Health Service
85

Balance sheet
Children's Health Queensland Hospital and Health Service
Notes 2015-16 Budget
$'000
2015-16 Est. Act.
$'000
2016-17 Budget
$'000
CURRENT ASSETS
Cash assets 16,19 51,159 31,739 32,991
Receivables 14,794 13,500 13,764
Other financial assets .. .. ..
Inventories 5,515 4,900 4,939
Other 152 404 420
Non-financial assets held for sale .. .. ..
Total current assets 71,620 50,543 52,114
NON-CURRENT ASSETS
Receivables .. .. ..
Other financial assets .. .. ..
Property, plant and equipment 17,20,22 1,254,827 1,280,150 1,236,438
Intangibles 606 1,034 1,034
Other .. .. ..
Total non-current assets 1,255,433 1,281,184 1,237,472
TOTAL ASSETS 1,327,053 1,331,727 1,289,586
CURRENT LIABILITIES
Payables 30,857 31,500 33,071
Accrued employee benefits 18,21 20,233 32,697 32,697
Interest bearing liabilities and derivatives .. .. ..
Provisions .. .. ..
Other 5,439 2,866 2,866
Total current liabilities 56,529 67,063 68,634
NON-CURRENT LIABILITIES
Payables .. .. ..
Accrued employee benefits .. .. ..
Interest bearing liabilities and derivatives .. .. ..
Provisions .. .. ..
Other .. .. ..
Total non-current liabilities .. .. ..
TOTAL LIABILITIES 56,529 67,063 68,634
NET ASSETS/(LIABILITIES) 1,270,524 1,264,664 1,220,952
EQUITY
TOTAL EQUITY 1,270,524 1,264,664 1,220,952
2016-17 Queensland State Budget – Service Delivery Statements Children's Health Queensland Hospital and Health Service
86

Cash flow statement
Children's Health Queensland Hospital and Health Service
Notes 2015-16 Budget
$'000
2015-16 Est. Act.
$'000
2016-17 Budget
$'000
CASH FLOWS FROM OPERATING ACTIVITIES
Inflows:
User charges and fees 23,28,32 606,839 658,000 672,358
Grants and other contributions 1,376 2,370 2,417
Interest received 265 218 223
Other 8,329 7,427 6,662
Outflows:
Employee costs 24,29,33 (414,545) (428,837) (471,715)
Supplies and services 25,30 (140,952) (160,869) (156,762)
Grants and subsidies (1,050) (1,050) (1,000)
Borrowing costs .. .. ..
Other (2,488) (3,102) (3,055)
Net cash provided by or used in operating activities 57,774 74,157 49,128
CASH FLOWS FROM INVESTING ACTIVITIES
Inflows:
Sales of non-financial assets .. .. ..
Investments redeemed .. .. ..
Loans and advances redeemed .. .. ..
Outflows:
Payments for non-financial assets (4,306) (5,713) (2,731)
Payments for investments .. .. ..
Loans and advances made .. .. ..
Net cash provided by or used in investing activities (4,306) (5,713) (2,731)
CASH FLOWS FROM FINANCING ACTIVITIES
Inflows:
Borrowings .. .. ..
Equity injections 26,34 4,306 (19,250) 2,731
Outflows:
Borrowing redemptions .. .. ..
Finance lease payments .. .. ..
Equity withdrawals 27,31,35 (56,237) (46,121) (47,876)
Net cash provided by or used in financing activities (51,931) (65,371) (45,145)
Net increase/(decrease) in cash held 1,537 3,073 1,252
Cash at the beginning of financial year 49,622 28,666 31,739
Cash transfers from restructure .. .. ..
Cash at the end of financial year 51,159 31,739 32,991
2016-17 Queensland State Budget – Service Delivery Statements Children's Health Queensland Hospital and Health Service
87
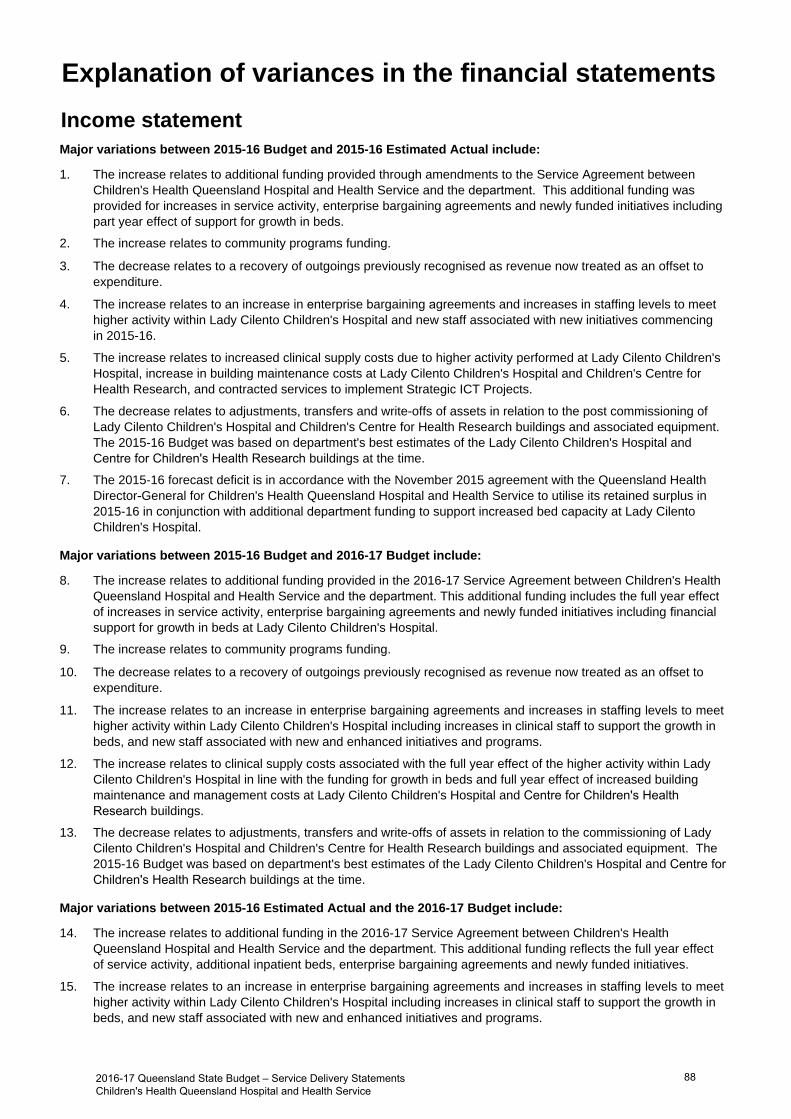
Income statementMajor variations between 2015-16 Budget and 2015-16 Estimated Actual include:
1. The increase relates to additional funding provided through amendments to the Service Agreement betweenChildren's Health Queensland Hospital and Health Service and the department. This additional funding wasprovided for increases in service activity, enterprise bargaining agreements and newly funded initiatives includingpart year effect of support for growth in beds.
2. The increase relates to community programs funding.
3. The decrease relates to a recovery of outgoings previously recognised as revenue now treated as an offset toexpenditure.
4. The increase relates to an increase in enterprise bargaining agreements and increases in staffing levels to meethigher activity within Lady Cilento Children's Hospital and new staff associated with new initiatives commencingin 2015-16.
5. The increase relates to increased clinical supply costs due to higher activity performed at Lady Cilento Children'sHospital, increase in building maintenance costs at Lady Cilento Children's Hospital and Children's Centre forHealth Research, and contracted services to implement Strategic ICT Projects.
6. The decrease relates to adjustments, transfers and write-offs of assets in relation to the post commissioning ofLady Cilento Children's Hospital and Children's Centre for Health Research buildings and associated equipment.The 2015-16 Budget was based on department's best estimates of the Lady Cilento Children's Hospital andCentre for Children's Health Research buildings at the time.
7. The 2015-16 forecast deficit is in accordance with the November 2015 agreement with the Queensland HealthDirector-General for Children's Health Queensland Hospital and Health Service to utilise its retained surplus in2015-16 in conjunction with additional department funding to support increased bed capacity at Lady CilentoChildren's Hospital.
Major variations between 2015-16 Budget and 2016-17 Budget include:
8. The increase relates to additional funding provided in the 2016-17 Service Agreement between Children's Health Queensland Hospital and Health Service and the department. This additional funding includes the full year effect of increases in service activity, enterprise bargaining agreements and newly funded initiatives including financial support for growth in beds at Lady Cilento Children's Hospital.
9. The increase relates to community programs funding.
10. The decrease relates to a recovery of outgoings previously recognised as revenue now treated as an offset toexpenditure.
11. The increase relates to an increase in enterprise bargaining agreements and increases in staffing levels to meethigher activity within Lady Cilento Children's Hospital including increases in clinical staff to support the growth inbeds, and new staff associated with new and enhanced initiatives and programs.
12. The increase relates to clinical supply costs associated with the full year effect of the higher activity within LadyCilento Children's Hospital in line with the funding for growth in beds and full year effect of increased buildingmaintenance and management costs at Lady Cilento Children's Hospital and Centre for Children's HealthResearch buildings.
13. The decrease relates to adjustments, transfers and write-offs of assets in relation to the commissioning of LadyCilento Children's Hospital and Children's Centre for Health Research buildings and associated equipment. The2015-16 Budget was based on department's best estimates of the Lady Cilento Children's Hospital and Centre forChildren's Health Research buildings at the time.
Major variations between 2015-16 Estimated Actual and the 2016-17 Budget include:
14. The increase relates to additional funding in the 2016-17 Service Agreement between Children's Health Queensland Hospital and Health Service and the department. This additional funding reflects the full year effect of service activity, additional inpatient beds, enterprise bargaining agreements and newly funded initiatives.
15. The increase relates to an increase in enterprise bargaining agreements and increases in staffing levels to meethigher activity within Lady Cilento Children's Hospital including increases in clinical staff to support the growth inbeds, and new staff associated with new and enhanced initiatives and programs.
Explanation of variances in the financial statements
2016-17 Queensland State Budget – Service Delivery Statements Children's Health Queensland Hospital and Health Service
88
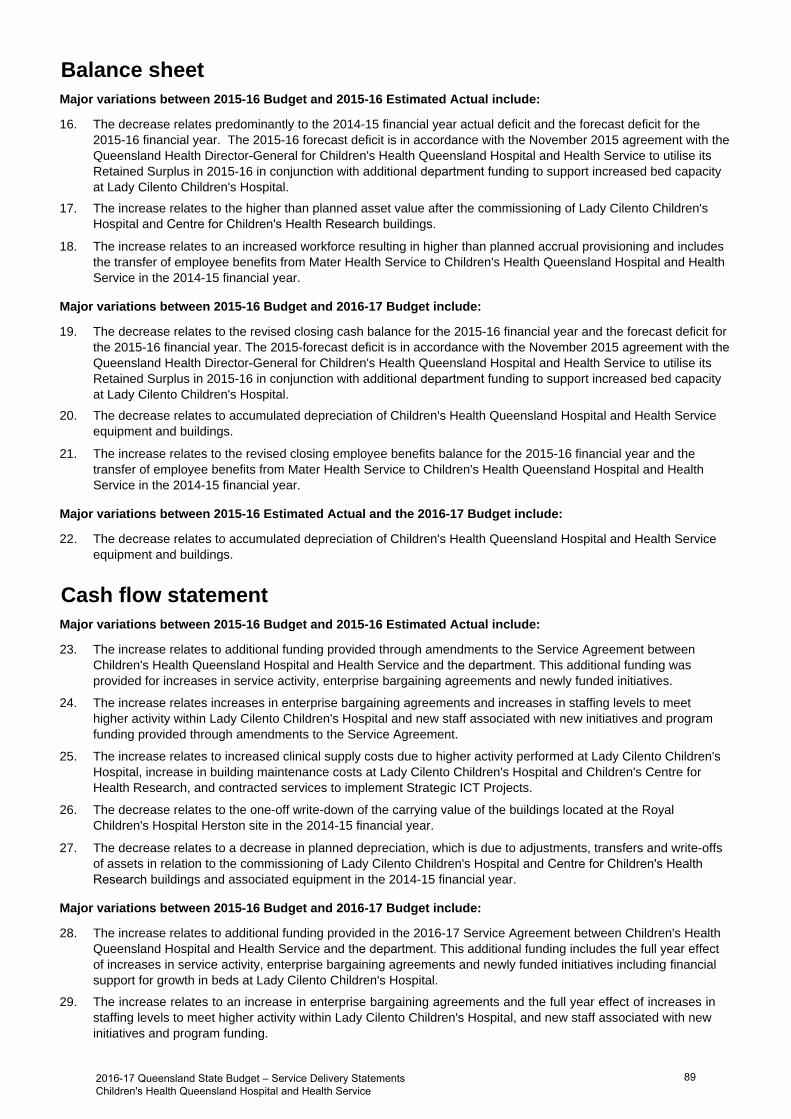
Balance sheetMajor variations between 2015-16 Budget and 2015-16 Estimated Actual include:
16. The decrease relates predominantly to the 2014-15 financial year actual deficit and the forecast deficit for the2015-16 financial year. The 2015-16 forecast deficit is in accordance with the November 2015 agreement with theQueensland Health Director-General for Children's Health Queensland Hospital and Health Service to utilise itsRetained Surplus in 2015-16 in conjunction with additional department funding to support increased bed capacityat Lady Cilento Children's Hospital.
17. The increase relates to the higher than planned asset value after the commissioning of Lady Cilento Children'sHospital and Centre for Children's Health Research buildings.
18. The increase relates to an increased workforce resulting in higher than planned accrual provisioning and includesthe transfer of employee benefits from Mater Health Service to Children's Health Queensland Hospital and HealthService in the 2014-15 financial year.
Major variations between 2015-16 Budget and 2016-17 Budget include:
19. The decrease relates to the revised closing cash balance for the 2015-16 financial year and the forecast deficit for the 2015-16 financial year. The 2015-forecast deficit is in accordance with the November 2015 agreement with the Queensland Health Director-General for Children's Health Queensland Hospital and Health Service to utilise its Retained Surplus in 2015-16 in conjunction with additional department funding to support increased bed capacity at Lady Cilento Children's Hospital.
20. The decrease relates to accumulated depreciation of Children's Health Queensland Hospital and Health Serviceequipment and buildings.
21. The increase relates to the revised closing employee benefits balance for the 2015-16 financial year and thetransfer of employee benefits from Mater Health Service to Children's Health Queensland Hospital and HealthService in the 2014-15 financial year.
Major variations between 2015-16 Estimated Actual and the 2016-17 Budget include:
22. The decrease relates to accumulated depreciation of Children's Health Queensland Hospital and Health Serviceequipment and buildings.
Cash flow statementMajor variations between 2015-16 Budget and 2015-16 Estimated Actual include:
23. The increase relates to additional funding provided through amendments to the Service Agreement betweenChildren's Health Queensland Hospital and Health Service and the department. This additional funding wasprovided for increases in service activity, enterprise bargaining agreements and newly funded initiatives.
24. The increase relates increases in enterprise bargaining agreements and increases in staffing levels to meethigher activity within Lady Cilento Children's Hospital and new staff associated with new initiatives and programfunding provided through amendments to the Service Agreement.
25. The increase relates to increased clinical supply costs due to higher activity performed at Lady Cilento Children'sHospital, increase in building maintenance costs at Lady Cilento Children's Hospital and Children's Centre forHealth Research, and contracted services to implement Strategic ICT Projects.
26. The decrease relates to the one-off write-down of the carrying value of the buildings located at the RoyalChildren's Hospital Herston site in the 2014-15 financial year.
27. The decrease relates to a decrease in planned depreciation, which is due to adjustments, transfers and write-offsof assets in relation to the commissioning of Lady Cilento Children's Hospital and Centre for Children's HealthResearch buildings and associated equipment in the 2014-15 financial year.
Major variations between 2015-16 Budget and 2016-17 Budget include:
28. The increase relates to additional funding provided in the 2016-17 Service Agreement between Children's Health Queensland Hospital and Health Service and the department. This additional funding includes the full year effect of increases in service activity, enterprise bargaining agreements and newly funded initiatives including financial support for growth in beds at Lady Cilento Children's Hospital.
29. The increase relates to an increase in enterprise bargaining agreements and the full year effect of increases instaffing levels to meet higher activity within Lady Cilento Children's Hospital, and new staff associated with newinitiatives and program funding.
2016-17 Queensland State Budget – Service Delivery Statements Children's Health Queensland Hospital and Health Service
89

30. The increase relates to clinical supply costs associated with the full year effect of the higher activity within LadyCilento Children's Hospital in line with the funding for growth in beds and full year effect of increased buildingmaintenance and management costs at Lady Cilento Children's Hospital and Centre for Children's HealthResearch buildings.
31. The decrease relates to a decrease in depreciation revenue, which is due to adjustments, transfers and write-offsof assets in relation to the commissioning of Lady Cilento Children's Hospital and Centre for Children's HealthResearch buildings and associated equipment in the 2014-15 financial year.
Major variations between 2015-16 Estimated Actual and the 2016-17 Budget include:
32. The increase relates to additional funding provided in the 2016-17 Service Agreement between Children's Health Queensland Hospital and Health Service and the department. This additional funding was provided for increases in service activity, enterprise bargaining agreements and newly funded initiatives.
33. The increase relates to an increase in enterprise bargaining agreements and the full year effect of increases instaffing levels to meet higher activity within Lady Cilento Children's Hospital, and new staff associated with newinitiatives and program funding.
34. The increase relates to the planned commissioning of assets to be transferred from the department toChildren's Health Queensland Hospital and Health Service.
35. The increase relates to additional depreciation revenue, which is subsequently returned to Queensland Treasury.
2016-17 Queensland State Budget – Service Delivery Statements Children's Health Queensland Hospital and Health Service
90
Darling Downs Hospital and Health Service
Overview
The Darling Downs Hospital and Health Service (HHS) is an independent statutory body overseen by a local Hospital and Health Board and provides public hospital and healthcare services as defined in a service agreement with the department.
The Darling Downs HHS delivers hospital and healthcare services to approximately 300,000 people across a large and diverse geographic area of approximately 90,000 square kilometres. This service-delivery area includes the local government areas of Toowoomba Regional Council, Western Downs Regional Council, Southern Downs Regional Council, South Burnett Regional Council, Goondiwindi Regional Council, Cherbourg Aboriginal Shire Council and part of the Banana Shire Council (community of Taroom).
The Darling Downs HHS delivers services from nine regional hospitals, eight rural community hospitals, six residential aged care facilities, three multipurpose health services and five community outpatient clinic facilities. From these facilities, the Darling Downs HHS aims to provide safe and sustainable health care services to rural and regional Queenslanders.
The Darling Downs HHS strategic plan considers and responds to the Government’s healthcare priorities and objectives for the community. The Darling Downs HHS is committed to deliver outcomes that strengthen the public health system, and provide patient-centred care. In this context, six strategic objectives have been developed and adopted:
delivering quality evidence-based healthcare for our patients and clients engaging, communicating and collaborating with our partners and communities to ensure we provide integrated,
patient-centred care demonstrating a commitment to learning, research, innovation and education in rural and regional healthcare ensuring sustainable resources through attentive financial and asset administration planning and maintaining clear and focused processes to facilitate effective corporate and clinical governance valuing, developing and engaging our workforce to promote professional and personal wellbeing, to ensure dedicated
delivery of services.
The Darling Downs HHS region is changing. A growing, ageing population and an increased incidence of chronic disease are among the greatest challenges. However, opportunities around new funding models, integration of care, innovative healthcare delivery mechanisms, workforce growth and professional development, and strengthening complementary healthcare partnerships provide for exciting areas of focus for the future.
Service summary
The Darling Downs HHS has an operating budget of $674.5 million for 2016-17 which is an increase of $36.7 million (5.8 per cent) from the published 2015-16 operating budget of $637.8 million.
During 2015-16, the Darling Downs HHS ensured elective surgery, endoscopy and outpatient waiting lists were maintained within clinically recommended timeframes. Accordingly, budgeted activity levels were exceeded in 2015-16.
The Darling Downs HHS performed favourably in the 2015-16 financial year with an anticipated $11 million surplus (based on March 2016 forecast). This has been achieved by developing and implementing more efficient models of service delivery. Efficiencies achieved by Darling Downs HHS in previous years are being reinvested to expand operating theatre capacity at Toowoomba Hospital, expand ophthalmology services, and upgrade clinical facilities at Warwick, Kingaroy and patient accommodation at Baillie Henderson Hospital.
During 2016-17 the priorities for Darling Downs HHS will include:
progressing works towards the establishment of a state-of-the-art MRI service and second CT (Computed Tomography) Scanner at Toowoomba Hospital
construction of a seventh operating theatre at the Toowoomba Hospital
expansion of the Emergency Department at the Toowoomba Hospital
continuing to implement the Government’s policies for nursing, focusing on safety, quality and patient centred care.
2016-17 Queensland State Budget – Service Delivery Statements – Darling Downs Hospital and Health Service 91
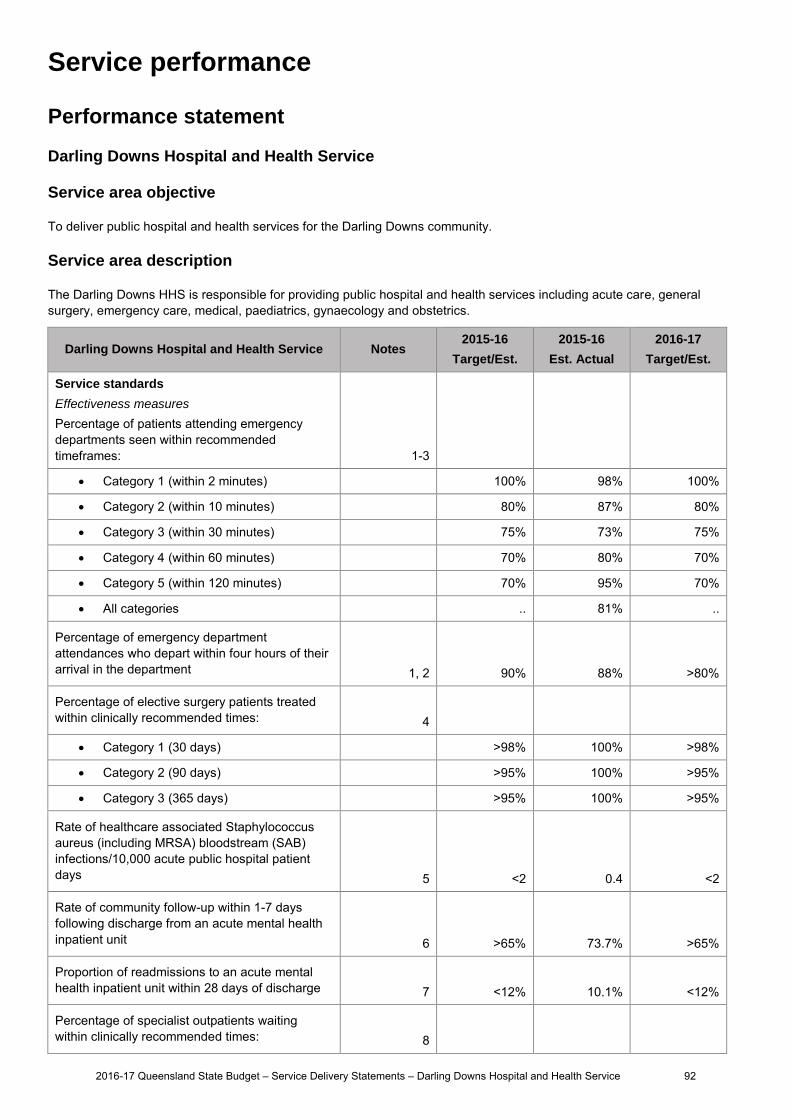
Service performance
Performance statement
Darling Downs Hospital and Health Service
Service area objective
To deliver public hospital and health services for the Darling Downs community.
Service area description
The Darling Downs HHS is responsible for providing public hospital and health services including acute care, general surgery, emergency care, medical, paediatrics, gynaecology and obstetrics.
Darling Downs Hospital and Health Service Notes 2015-16
Target/Est.
2015-16
Est. Actual
2016-17
Target/Est.
Service standards
Effectiveness measures
Percentage of patients attending emergency departments seen within recommended timeframes:
1-3
Category 1 (within 2 minutes) 100% 98% 100%
Category 2 (within 10 minutes) 80% 87% 80%
Category 3 (within 30 minutes) 75% 73% 75%
Category 4 (within 60 minutes) 70% 80% 70%
Category 5 (within 120 minutes) 70% 95% 70%
All categories .. 81% ..
Percentage of emergency department attendances who depart within four hours of their arrival in the department 1, 2 90% 88% >80%
Percentage of elective surgery patients treated within clinically recommended times: 4
Category 1 (30 days) >98% 100% >98%
Category 2 (90 days) >95% 100% >95%
Category 3 (365 days) >95% 100% >95%
Rate of healthcare associated Staphylococcus aureus (including MRSA) bloodstream (SAB) infections/10,000 acute public hospital patient days 5 <2 0.4 <2
Rate of community follow-up within 1-7 days following discharge from an acute mental health inpatient unit 6 >65% 73.7% >65%
Proportion of readmissions to an acute mental health inpatient unit within 28 days of discharge 7 <12% 10.1% <12%
Percentage of specialist outpatients waiting within clinically recommended times: 8
2016-17 Queensland State Budget – Service Delivery Statements – Darling Downs Hospital and Health Service 92
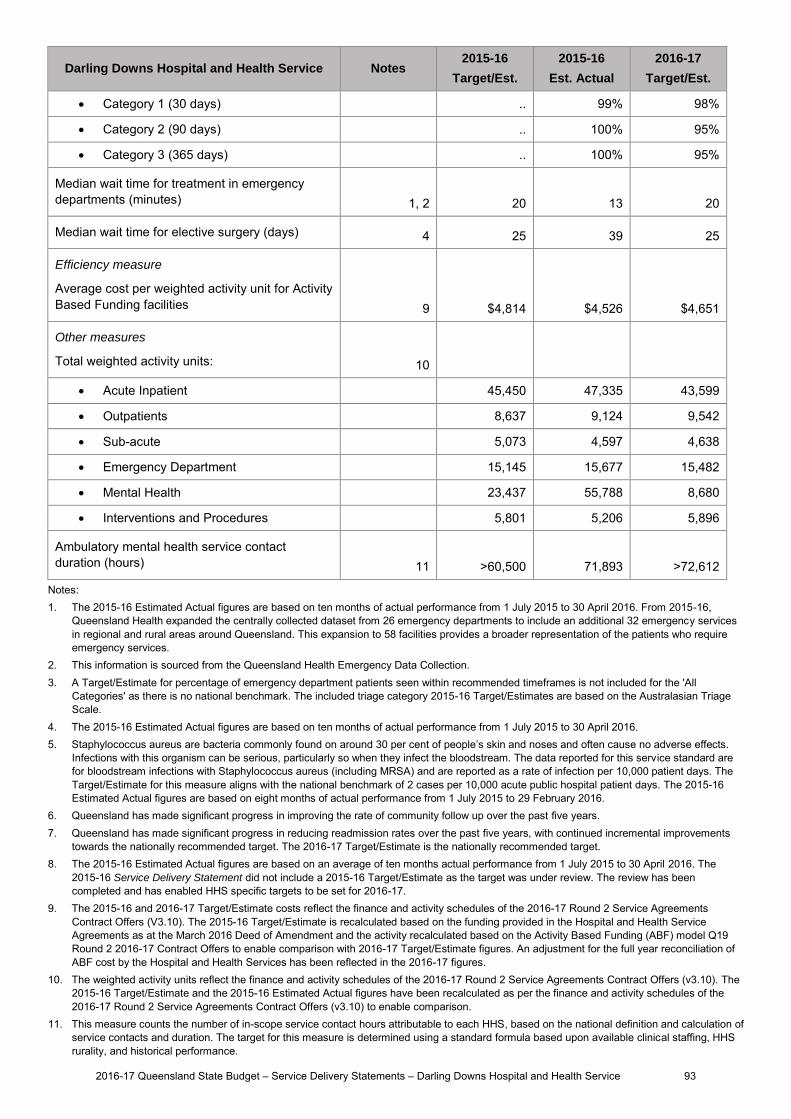
Darling Downs Hospital and Health Service Notes 2015-16
Target/Est.
2015-16
Est. Actual
2016-17
Target/Est.
Category 1 (30 days) .. 99% 98%
Category 2 (90 days) .. 100% 95%
Category 3 (365 days) .. 100% 95%
Median wait time for treatment in emergency departments (minutes) 1, 2 20 13 20
Median wait time for elective surgery (days) 4 25 39 25
Efficiency measure
Average cost per weighted activity unit for Activity Based Funding facilities 9 $4,814 $4,526 $4,651
Other measures
Total weighted activity units: 10
Acute Inpatient 45,450 47,335 43,599
Outpatients 8,637 9,124 9,542
Sub-acute 5,073 4,597 4,638
Emergency Department 15,145 15,677 15,482
Mental Health 23,437 55,788 8,680
Interventions and Procedures 5,801 5,206 5,896
Ambulatory mental health service contact duration (hours) 11 >60,500 71,893 >72,612
Notes: 1. The 2015-16 Estimated Actual figures are based on ten months of actual performance from 1 July 2015 to 30 April 2016. From 2015-16,
Queensland Health expanded the centrally collected dataset from 26 emergency departments to include an additional 32 emergency services in regional and rural areas around Queensland. This expansion to 58 facilities provides a broader representation of the patients who require emergency services.
2. This information is sourced from the Queensland Health Emergency Data Collection. 3. A Target/Estimate for percentage of emergency department patients seen within recommended timeframes is not included for the 'All
Categories' as there is no national benchmark. The included triage category 2015-16 Target/Estimates are based on the Australasian Triage Scale.
4. The 2015-16 Estimated Actual figures are based on ten months of actual performance from 1 July 2015 to 30 April 2016. 5. Staphylococcus aureus are bacteria commonly found on around 30 per cent of people’s skin and noses and often cause no adverse effects.
Infections with this organism can be serious, particularly so when they infect the bloodstream. The data reported for this service standard are for bloodstream infections with Staphylococcus aureus (including MRSA) and are reported as a rate of infection per 10,000 patient days. The Target/Estimate for this measure aligns with the national benchmark of 2 cases per 10,000 acute public hospital patient days. The 2015-16 Estimated Actual figures are based on eight months of actual performance from 1 July 2015 to 29 February 2016.
6. Queensland has made significant progress in improving the rate of community follow up over the past five years. 7. Queensland has made significant progress in reducing readmission rates over the past five years, with continued incremental improvements
towards the nationally recommended target. The 2016-17 Target/Estimate is the nationally recommended target. 8. The 2015-16 Estimated Actual figures are based on an average of ten months actual performance from 1 July 2015 to 30 April 2016. The
2015-16 Service Delivery Statement did not include a 2015-16 Target/Estimate as the target was under review. The review has been completed and has enabled HHS specific targets to be set for 2016-17.
9. The 2015-16 and 2016-17 Target/Estimate costs reflect the finance and activity schedules of the 2016-17 Round 2 Service Agreements Contract Offers (V3.10). The 2015-16 Target/Estimate is recalculated based on the funding provided in the Hospital and Health Service Agreements as at the March 2016 Deed of Amendment and the activity recalculated based on the Activity Based Funding (ABF) model Q19 Round 2 2016-17 Contract Offers to enable comparison with 2016-17 Target/Estimate figures. An adjustment for the full year reconciliation of ABF cost by the Hospital and Health Services has been reflected in the 2016-17 figures.
10. The weighted activity units reflect the finance and activity schedules of the 2016-17 Round 2 Service Agreements Contract Offers (v3.10). The 2015-16 Target/Estimate and the 2015-16 Estimated Actual figures have been recalculated as per the finance and activity schedules of the 2016-17 Round 2 Service Agreements Contract Offers (v3.10) to enable comparison.
11. This measure counts the number of in-scope service contact hours attributable to each HHS, based on the national definition and calculation of service contacts and duration. The target for this measure is determined using a standard formula based upon available clinical staffing, HHS rurality, and historical performance.
2016-17 Queensland State Budget – Service Delivery Statements – Darling Downs Hospital and Health Service 93
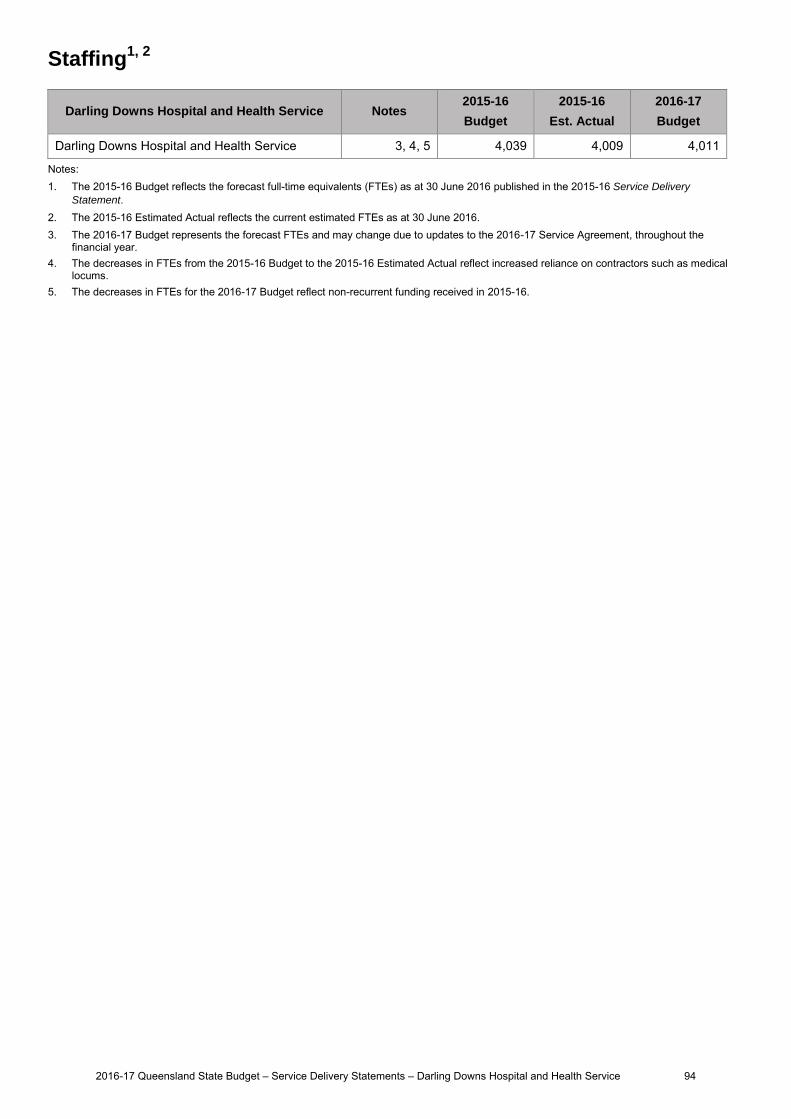
Staffing1, 2
Darling Downs Hospital and Health Service Notes 2015-16
Budget
2015-16
Est. Actual
2016-17
Budget
Darling Downs Hospital and Health Service 3, 4, 5 4,039 4,009 4,011
Notes: 1. The 2015-16 Budget reflects the forecast full-time equivalents (FTEs) as at 30 June 2016 published in the 2015-16 Service Delivery
Statement. 2. The 2015-16 Estimated Actual reflects the current estimated FTEs as at 30 June 2016. 3. The 2016-17 Budget represents the forecast FTEs and may change due to updates to the 2016-17 Service Agreement, throughout the
financial year. 4. The decreases in FTEs from the 2015-16 Budget to the 2015-16 Estimated Actual reflect increased reliance on contractors such as medical
locums. 5. The decreases in FTEs for the 2016-17 Budget reflect non-recurrent funding received in 2015-16.
2016-17 Queensland State Budget – Service Delivery Statements – Darling Downs Hospital and Health Service 94
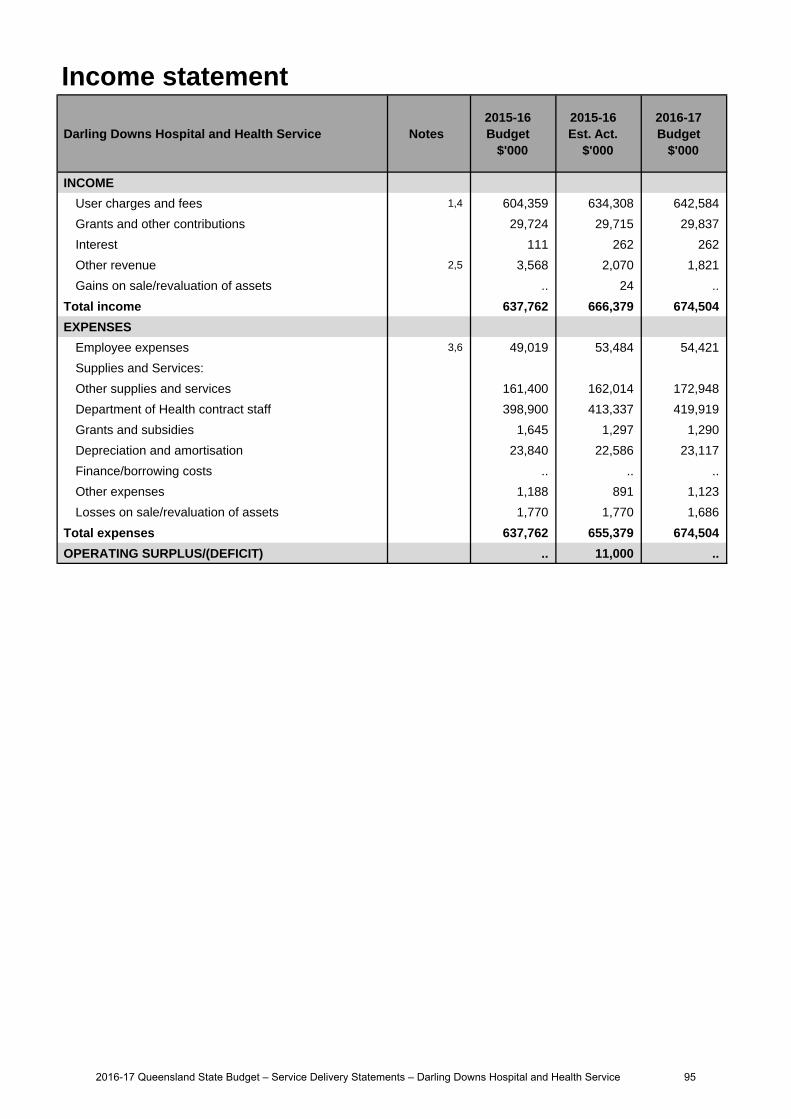
Income statement
Darling Downs Hospital and Health Service Notes 2015-16 Budget
$'000
2015-16 Est. Act.
$'000
2016-17 Budget
$'000
INCOME
User charges and fees 1,4 604,359 634,308 642,584
Grants and other contributions 29,724 29,715 29,837
Interest 111 262 262
Other revenue 2,5 3,568 2,070 1,821
Gains on sale/revaluation of assets .. 24 ..
Total income 637,762 666,379 674,504
EXPENSES
Employee expenses 3,6 49,019 53,484 54,421
Supplies and Services:
Other supplies and services 161,400 162,014 172,948
Department of Health contract staff 398,900 413,337 419,919
Grants and subsidies 1,645 1,297 1,290
Depreciation and amortisation 23,840 22,586 23,117
Finance/borrowing costs .. .. ..
Other expenses 1,188 891 1,123
Losses on sale/revaluation of assets 1,770 1,770 1,686
Total expenses 637,762 655,379 674,504
OPERATING SURPLUS/(DEFICIT) .. 11,000 ..
2016-17 Queensland State Budget – Service Delivery Statements – Darling Downs Hospital and Health Service 95
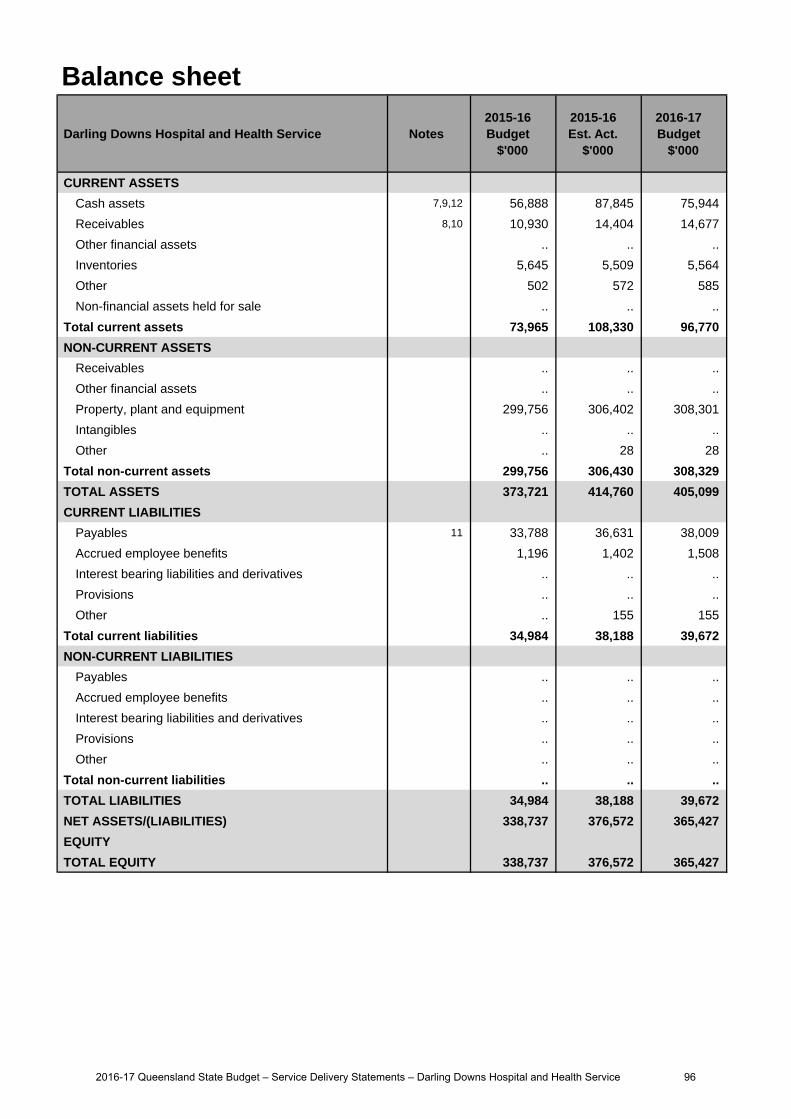
Balance sheet
Darling Downs Hospital and Health Service Notes 2015-16 Budget
$'000
2015-16 Est. Act.
$'000
2016-17 Budget
$'000
CURRENT ASSETS
Cash assets 7,9,12 56,888 87,845 75,944
Receivables 8,10 10,930 14,404 14,677
Other financial assets .. .. ..
Inventories 5,645 5,509 5,564
Other 502 572 585
Non-financial assets held for sale .. .. ..
Total current assets 73,965 108,330 96,770
NON-CURRENT ASSETS
Receivables .. .. ..
Other financial assets .. .. ..
Property, plant and equipment 299,756 306,402 308,301
Intangibles .. .. ..
Other .. 28 28
Total non-current assets 299,756 306,430 308,329
TOTAL ASSETS 373,721 414,760 405,099
CURRENT LIABILITIES
Payables 11 33,788 36,631 38,009
Accrued employee benefits 1,196 1,402 1,508
Interest bearing liabilities and derivatives .. .. ..
Provisions .. .. ..
Other .. 155 155
Total current liabilities 34,984 38,188 39,672
NON-CURRENT LIABILITIES
Payables .. .. ..
Accrued employee benefits .. .. ..
Interest bearing liabilities and derivatives .. .. ..
Provisions .. .. ..
Other .. .. ..
Total non-current liabilities .. .. ..
TOTAL LIABILITIES 34,984 38,188 39,672
NET ASSETS/(LIABILITIES) 338,737 376,572 365,427
EQUITY
TOTAL EQUITY 338,737 376,572 365,427
2016-17 Queensland State Budget – Service Delivery Statements – Darling Downs Hospital and Health Service 96
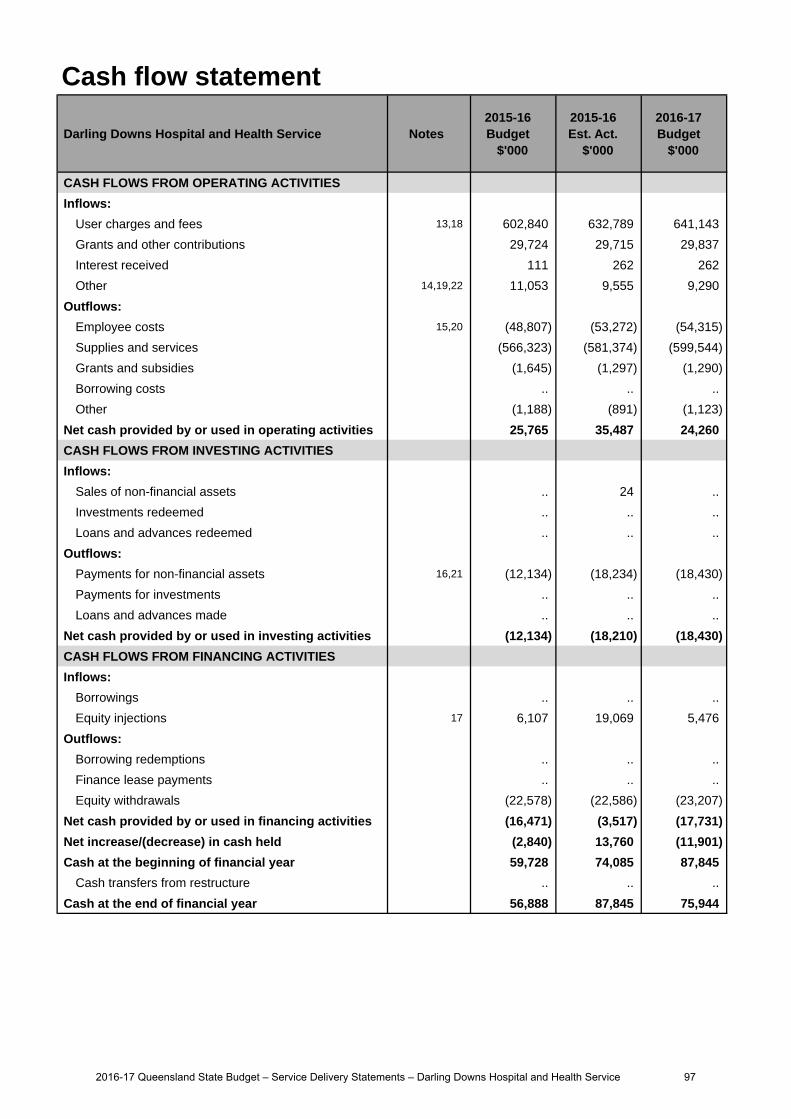
Cash flow statement
Darling Downs Hospital and Health Service Notes 2015-16 Budget
$'000
2015-16 Est. Act.
$'000
2016-17 Budget
$'000
CASH FLOWS FROM OPERATING ACTIVITIES
Inflows:
User charges and fees 13,18 602,840 632,789 641,143
Grants and other contributions 29,724 29,715 29,837
Interest received 111 262 262
Other 14,19,22 11,053 9,555 9,290
Outflows:
Employee costs 15,20 (48,807) (53,272) (54,315)
Supplies and services (566,323) (581,374) (599,544)
Grants and subsidies (1,645) (1,297) (1,290)
Borrowing costs .. .. ..
Other (1,188) (891) (1,123)
Net cash provided by or used in operating activities 25,765 35,487 24,260
CASH FLOWS FROM INVESTING ACTIVITIES
Inflows:
Sales of non-financial assets .. 24 ..
Investments redeemed .. .. ..
Loans and advances redeemed .. .. ..
Outflows:
Payments for non-financial assets 16,21 (12,134) (18,234) (18,430)
Payments for investments .. .. ..
Loans and advances made .. .. ..
Net cash provided by or used in investing activities (12,134) (18,210) (18,430)
CASH FLOWS FROM FINANCING ACTIVITIES
Inflows:
Borrowings .. .. ..
Equity injections 17 6,107 19,069 5,476
Outflows:
Borrowing redemptions .. .. ..
Finance lease payments .. .. ..
Equity withdrawals (22,578) (22,586) (23,207)
Net cash provided by or used in financing activities (16,471) (3,517) (17,731)
Net increase/(decrease) in cash held (2,840) 13,760 (11,901)
Cash at the beginning of financial year 59,728 74,085 87,845
Cash transfers from restructure .. .. ..
Cash at the end of financial year 56,888 87,845 75,944
2016-17 Queensland State Budget – Service Delivery Statements – Darling Downs Hospital and Health Service 97
Income statementMajor variations between 2015-16 Budget and 2015-16 Estimated Actual include:
1. The increase primarily reflects additional funding from amendments to the Service Agreement between Darling Downs Hospital and Health Service and the department. In 2015-16 the largest amendments were for the treatment of additional public patients at activity based funded facilities, specialist outpatient reduction strategies to manage hospital waiting lists and enterprise bargaining. The increase includes projected increases in own source revenue generation.
2. The decrease is attributed to the cessation of funding associated with medical officer training and changes in theaccounting treatment of funding from the University of Queensland Rural Medical School (now treated as grantrevenue).
3. The increase is due to enterprise bargaining agreements and filling vacant positions.
Major variations between 2015-16 Budget and 2016-17 Budget include:
4. Increase reflects additional funding provided for amendments in the Service Agreement between Darling DownsHospital and Health Service and the department, including enterprise bargaining agreements and non-labourescalation.
5. The decrease is attributed to the cessation of funding associated with medical officer training and changes in theaccounting treatment of funding from the University of Queensland Rural Medical School (now treated as grantrevenue)
6. The increase is due to enterprise bargaining agreements and filling vacant positions.
Balance sheetMajor variations between 2015-16 Budget and 2015-16 Estimated Actual include:
7. Increase reflects the forecast surplus and equity injections from the department for investment in non-currentassets.
8. Increase reflects increases in user charges and fees revenue.
Major variations between 2015-16 Budget and 2016-17 Budget include:
9. Increase reflects the forecast surplus and equity injections from the department for investment in non-currentassets.
10. Increase reflects increases in User charges and fees revenue.
11. Increase reflects expected increase in trade payables associated with additional outsourced service delivery.
Major variations between 2015-16 Estimated Actual and the 2016-17 Budget include:
12. The decrease reflects the planned investment in non-current assets
Cash flow statementMajor variations between 2015-16 Budget and 2015-16 Estimated Actual include:
13. The increase primarily reflects additional funding from amendments to the Service Agreement between Darling Downs Hospital and Health Service and the department. In 2015-16 the largest amendments were for the treatment of additional public patients at activity based funded facilities, specialist outpatient reduction strategies to manage hospital waiting lists and enterprise bargaining. The increase includes projected increases in own source revenue generation.
14. The decrease is attributed to the cessation of funding associated with medical officer training and changes in theaccounting treatment of funding from the University of Queensland Rural Medical School (now treated as grantrevenue)
15. The increase is due to enterprise bargaining agreements and filling vacant positions.
16. Increase reflects commissioning of non-current assets above budgeted levels.
Explanation of variances in the financial statements
2016-17 Queensland State Budget – Service Delivery Statements – Darling Downs Hospital and Health Service 98
17. Increase reflects additional funding for investment in non-current assets including magnetic resonance imagingcapability at Toowoomba Hospital.
Major variations between 2015-16 Budget and 2016-17 Budget include:
18. Increase reflects amendments to the Service Agreement between Darling Downs Hospital and Health Service andthe department.
19. The decrease is attributed to the cessation of funding associated with medical officer training and changes in theaccounting treatment of funding from the University of Queensland Rural Medical School (now treated as grantrevenue).
20. The increase in employee expenses is due to enterprise bargaining agreements and filling vacant positions.
21. Increase reflects future commissioning of non-current assets including MRI capabilities at Toowoomba Hospital.
Major variations between 2015-16 Estimated Actual and the 2016-17 Budget include:
22. The decrease is attributed to the cessation of funding associated with medical officer training and changes in theaccounting treatment of funding from the University of Queensland Rural Medical School (now treated as grantrevenue).
2016-17 Queensland State Budget – Service Delivery Statements – Darling Downs Hospital and Health Service 99

Gold Coast Hospital and Health Service
Overview
The Gold Coast Hospital and Health Service (HHS) is an independent statutory body overseen by a local Hospital and Health Board. The Gold Coast HHS delivers a broad range of secondary and tertiary health services through the Gold Coast University and Robina Hospitals, as well as a number of community settings throughout the region. Key primary health services are also offered such as community child health clinics and oral health services for adults and children.
The Gold Coast HHS’s vision is to be recognised as a centre of excellence for world class healthcare. Our purpose is to provide excellence in sustainable and evidence based healthcare that meets the needs of the community and is guided by local patient needs. The Gold Coast HHS supports the Queensland Government’s objectives for the community through its focus on the delivery of safe, effective and efficient quality of services, ensuring patients have access to health services to support a healthy Gold Coast community.
Key strategic enablers for achieving the vision include: fostering a positive work environment; developing capacity and capability in research, teaching and education; including simulation; promoting the use of data to inform decisions; and leveraging our infrastructure and strategic alliances.
An increasing population and demand for public health services on the Gold Coast requires the Gold Coast HHS to monitor its performance against key indicators and continually seek improvements to service delivery, including the consolidation and expansion of a range of tertiary services and an increase in self-sufficiency for services provided within the region.
The Gold Coast HHS has increased investment in the delivery of secondary and tertiary health services to the community, as well as expansion of services to match the local health needs. In addition, the Gold Coast HHS has continued to invest in strategies to improve integration of care, including partnerships with the Gold Coast Primary Health Networks and the non-government sector.
The Gold Coast Private Hospital commenced operations on the Gold Coast University Hospital (GCUH) site to improve access to health services for the community and to complement Gold Coast health service provision. The Gold Coast HHS has been working with Economic Development Queensland regarding the development of the Gold Coast Health and Knowledge Precinct and legacy aspects of the Gold Coast 2018 Commonwealth Games Village site which is adjacent to the GCUH.
Service summary
The Gold Coast HHS has an operating budget of $1.283 billion for 2016-17 which is an increase of $90.3 million (7.5 per cent) from the published 2015-16 operating budget of $1.193 billion.
In 2015-16, the Gold Coast HHS has continued to develop and implement the services at the GCUH to reflect its higher acuity status and the achievement of higher clinical service capabilities as per the Clinical Services Capability Framework in Cardiac Surgery, Children’s Critical Care, Neonatal Intensive Care, Level 1 Trauma, Cancer Centre and Maternal Fetal Medicine. In 2015-16 autologous stem cell transplantation services commenced in the Cancer Centre and the third linear accelerator will be commissioned in 2016-17 in this service area.
During 2015-16, the Gold Coast HHS used local healthcare infrastructure to support service delivery to the community including the completion of the Southport Health Precinct refurbishment, creating increased community based service delivery.
In 2016-17, a pharmacy robot will be commissioned at the GCUH similar to the robot installed at Robina Hospital in 2015-16. A Mother and Baby Unit in Mental Health Services will also be commissioned.
The Gold Coast HHS will continue to implement initiatives to ensure long waiting patients for outpatient and elective surgery are adequately seen and treated as necessary. In 2015-16 the Gold Coast HHS successfully met the National Elective Surgery Target and this will continue in 2016-17. In addition, the Gold Coast HHS continues to decrease the percentages of patients waiting outside clinically recommended timeframes for Categories 1, 2 and 3 outpatients, reflecting that the operational action plan for outpatients is improving performance and this will continue in 2016-17. Day surgical services are under review within the Gold Coast HHS and improvement strategies are to be implemented in 2016-17. During 2016-17 the Gold Coast HHS will continue to focus on improving integrated care services via the Gold Coast Integrated Care project and the engagement of our partners in healthcare provision to better manage chronic disease within our community. Initial indications are that the program has been successful and there has been significant national and international interest in the outcomes of this program.
2016-17 Queensland State Budget – Service Delivery Statements – Gold Coast Hospital and Health Service 100
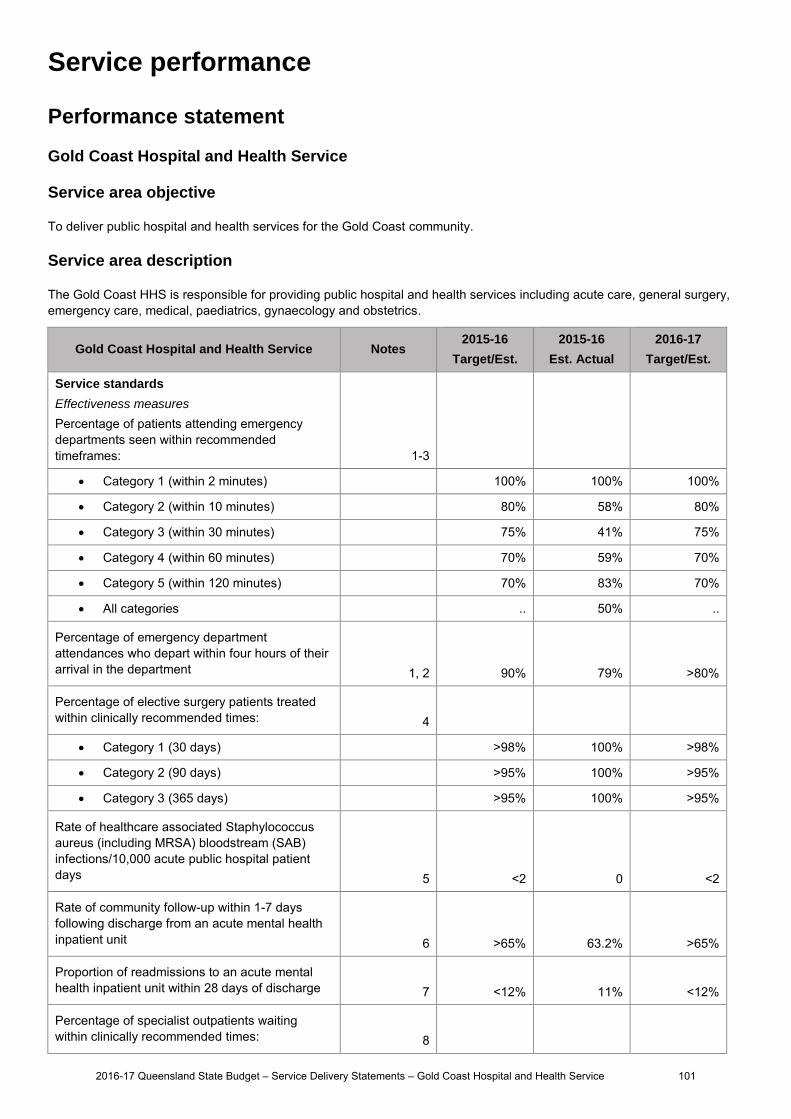
Service performance
Performance statement
Gold Coast Hospital and Health Service
Service area objective
To deliver public hospital and health services for the Gold Coast community.
Service area description
The Gold Coast HHS is responsible for providing public hospital and health services including acute care, general surgery, emergency care, medical, paediatrics, gynaecology and obstetrics.
Gold Coast Hospital and Health Service Notes 2015-16
Target/Est.
2015-16
Est. Actual
2016-17
Target/Est.
Service standards
Effectiveness measures
Percentage of patients attending emergency departments seen within recommended timeframes:
1-3
Category 1 (within 2 minutes) 100% 100% 100%
Category 2 (within 10 minutes) 80% 58% 80%
Category 3 (within 30 minutes) 75% 41% 75%
Category 4 (within 60 minutes) 70% 59% 70%
Category 5 (within 120 minutes) 70% 83% 70%
All categories .. 50% ..
Percentage of emergency department attendances who depart within four hours of their arrival in the department 1, 2 90% 79% >80%
Percentage of elective surgery patients treated within clinically recommended times: 4
Category 1 (30 days) >98% 100% >98%
Category 2 (90 days) >95% 100% >95%
Category 3 (365 days) >95% 100% >95%
Rate of healthcare associated Staphylococcus aureus (including MRSA) bloodstream (SAB) infections/10,000 acute public hospital patient days 5 <2 0 <2
Rate of community follow-up within 1-7 days following discharge from an acute mental health inpatient unit 6 >65% 63.2% >65%
Proportion of readmissions to an acute mental health inpatient unit within 28 days of discharge 7 <12% 11% <12%
Percentage of specialist outpatients waiting within clinically recommended times: 8
2016-17 Queensland State Budget – Service Delivery Statements – Gold Coast Hospital and Health Service 101

Gold Coast Hospital and Health Service Notes 2015-16
Target/Est.
2015-16
Est. Actual
2016-17
Target/Est.
Category 1 (30 days) .. 63% 65%
Category 2 (90 days) .. 51% 55%
Category 3 (365 days) .. 82% 85%
Median wait time for treatment in emergency departments (minutes) 1, 2 20 31 20
Median wait time for elective surgery (days) 4 25 31 25
Efficiency measure
Average cost per weighted activity unit for Activity Based Funding facilities 9 $4,780 $4,749 $4,763
Other measures
Total weighted activity units: 10
Acute Inpatient 111,022 110,472 110,020
Outpatients 21,235 24,169 24,661
Sub-acute 6,864 7,570 9,599
Emergency Department 20,438 23,139 21,187
Mental Health 12,223 14,313 10,549
Interventions and Procedures 19,103 15,513 18,066
Ambulatory mental health service contact duration (hours) 11 >86,601 83,963 >90,125
Notes: 1. The 2015-16 Estimated Actual figures are based on ten months of actual performance from 1 July 2015 to 30 April 2016. From 2015-16,
Queensland Health expanded the centrally collected dataset from 26 emergency departments to include an additional 32 emergency services in regional and rural areas around Queensland. This expansion to 58 facilities provides a broader representation of the patients who require emergency services.
2. This information is sourced from the Queensland Health Emergency Data Collection. 3. A Target/Estimate for percentage of emergency department patients seen within recommended timeframes is not included for the 'All
Categories' as there is no national benchmark. The included triage category 2015-16 Target/Estimates are based on the Australasian Triage Scale.
4. The 2015-16 Estimated Actual figures are based on ten months of actual performance from 1 July 2015 to 30 April 2016. 5. Staphylococcus aureus are bacteria commonly found on around 30 per cent of people’s skin and noses and often cause no adverse effects.
Infections with this organism can be serious, particularly so when they infect the bloodstream. The data reported for this service standard are for bloodstream infections with Staphylococcus aureus (including MRSA) and are reported as a rate of infection per 10,000 patient days. The Target/Estimate for this measure aligns with the national benchmark of 2 cases per 10,000 acute public hospital patient days. The 2015-16 Estimated Actual figures are based on eight months of actual performance from 1 July 2015 to 29 February 2016.
6. Whilst overall Queensland has made significant progress in improving the rate of community follow up over the past five years, the department continues to work with HHSs regarding improvements in this area.
7. Queensland has made significant progress in reducing readmission rates over the past five years, with continued incremental improvements towards the nationally recommended target. The 2016-17 Target/Estimate is the nationally recommended target.
8. The 2015-16 Estimated Actual figures are based on an average of ten months actual performance from 1 July 2015 to 30 April 2016. The 2015-16 Service Delivery Statement did not include a 2015-16 Target/Estimate as the target was under review. The review has been completed and has enabled HHS specific targets to be set for 2016-17.
9. The 2015-16 and 2016-17 Target/Estimate costs reflect the finance and activity schedules of the 2016-17 Round 2 Service Agreements Contract Offers (V3.10). The 2015-16 Target/Estimate is recalculated based on the funding provided in the Hospital and Health Service Agreements as at the March 2016 Deed of Amendment and the activity recalculated based on the Activity Based Funding (ABF) model Q19 Round 2 2016-17 Contract Offers to enable comparison with 2016-17 Target/Estimate figures. An adjustment for the full year reconciliation of ABF cost by the Hospital and Health Services has been reflected in the 2016-17 figures.
10. The weighted activity units reflect the finance and activity schedules of the 2016-17 Round 2 Service Agreements Contract Offers (v3.10). The 2015-16 Target/Estimate and the 2015-16 Estimated Actual figures have been recalculated as per the finance and activity schedules of the 2016-17 Round 2 Service Agreements Contract Offers (v3.10) to enable comparison.
11. This measure counts the number of in-scope service contact hours attributable to each HHS, based on the national definition and calculation of service contacts and duration. The target for this measure is determined using a standard formula based upon available clinical staffing, HHS
2016-17 Queensland State Budget – Service Delivery Statements – Gold Coast Hospital and Health Service 102
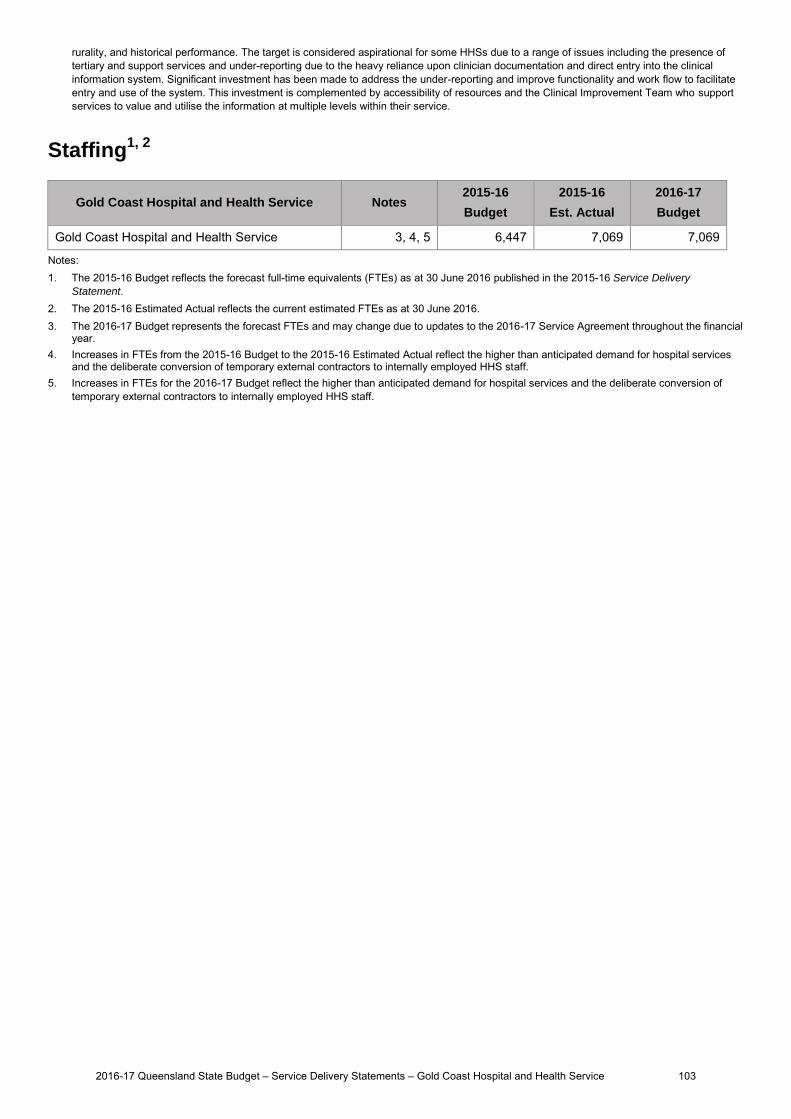
rurality, and historical performance. The target is considered aspirational for some HHSs due to a range of issues including the presence of tertiary and support services and under-reporting due to the heavy reliance upon clinician documentation and direct entry into the clinical information system. Significant investment has been made to address the under-reporting and improve functionality and work flow to facilitate entry and use of the system. This investment is complemented by accessibility of resources and the Clinical Improvement Team who support services to value and utilise the information at multiple levels within their service.
Staffing1, 2
Gold Coast Hospital and Health Service Notes 2015-16
Budget
2015-16
Est. Actual
2016-17
Budget
Gold Coast Hospital and Health Service 3, 4, 5 6,447 7,069 7,069
Notes: 1. The 2015-16 Budget reflects the forecast full-time equivalents (FTEs) as at 30 June 2016 published in the 2015-16 Service Delivery
Statement. 2. The 2015-16 Estimated Actual reflects the current estimated FTEs as at 30 June 2016. 3. The 2016-17 Budget represents the forecast FTEs and may change due to updates to the 2016-17 Service Agreement throughout the financial
year. 4. Increases in FTEs from the 2015-16 Budget to the 2015-16 Estimated Actual reflect the higher than anticipated demand for hospital services
and the deliberate conversion of temporary external contractors to internally employed HHS staff. 5. Increases in FTEs for the 2016-17 Budget reflect the higher than anticipated demand for hospital services and the deliberate conversion of
temporary external contractors to internally employed HHS staff.
2016-17 Queensland State Budget – Service Delivery Statements – Gold Coast Hospital and Health Service 103

Income statement
Gold Coast Hospital and Health Service Notes 2015-16 Budget
$'000
2015-16 Est. Act.
$'000
2016-17 Budget
$'000
INCOME
User charges and fees 1,4 1,168,903 1,240,028 1,270,041
Grants and other contributions 15,307 13,404 12,656
Interest 108 77 77
Other revenue 2,5 8,797 733 663
Gains on sale/revaluation of assets .. 17 ..
Total income 1,193,115 1,254,259 1,283,437
EXPENSES
Employee expenses 3,6 783,274 837,614 865,404
Supplies and Services:
Other supplies and services 319,901 330,122 332,939
Department of Health contract staff .. .. ..
Grants and subsidies 1,401 1,323 1,323
Depreciation and amortisation 81,248 78,924 79,458
Finance/borrowing costs .. .. ..
Other expenses 2,201 5,091 3,128
Losses on sale/revaluation of assets 5,090 1,185 1,185
Total expenses 1,193,115 1,254,259 1,283,437
OPERATING SURPLUS/(DEFICIT) .. .. ..
2016-17 Queensland State Budget – Service Delivery Statements – Gold Coast Hospital and Health Service 104

Balance sheet
Gold Coast Hospital and Health Service Notes 2015-16 Budget
$'000
2015-16 Est. Act.
$'000
2016-17 Budget
$'000
CURRENT ASSETS
Cash assets 7,12 54,825 18,477 20,309
Receivables 8,13 11,476 44,537 44,893
Other financial assets .. .. ..
Inventories 7,283 8,017 8,106
Other 1,060 1,270 1,537
Non-financial assets held for sale .. .. ..
Total current assets 74,644 72,301 74,845
NON-CURRENT ASSETS
Receivables .. .. ..
Other financial assets .. .. ..
Property, plant and equipment 9,14 1,859,907 1,781,453 1,761,957
Intangibles 890 1,289 727
Other .. .. ..
Total non-current assets 1,860,797 1,782,742 1,762,684
TOTAL ASSETS 1,935,441 1,855,043 1,837,529
CURRENT LIABILITIES
Payables 10,15 56,164 24,793 27,331
Accrued employee benefits 11,16 10 23,164 23,170
Interest bearing liabilities and derivatives .. .. ..
Provisions .. .. ..
Other 53 5,047 5,047
Total current liabilities 56,227 53,004 55,548
NON-CURRENT LIABILITIES
Payables .. .. ..
Accrued employee benefits .. .. ..
Interest bearing liabilities and derivatives .. .. ..
Provisions .. .. ..
Other .. .. ..
Total non-current liabilities .. .. ..
TOTAL LIABILITIES 56,227 53,004 55,548
NET ASSETS/(LIABILITIES) 1,879,214 1,802,039 1,781,981
EQUITY
TOTAL EQUITY 1,879,214 1,802,039 1,781,981
2016-17 Queensland State Budget – Service Delivery Statements – Gold Coast Hospital and Health Service 105

Cash flow statement
Gold Coast Hospital and Health Service Notes 2015-16 Budget
$'000
2015-16 Est. Act.
$'000
2016-17 Budget
$'000
CASH FLOWS FROM OPERATING ACTIVITIES
Inflows:
User charges and fees 17,20 1,163,823 1,238,767 1,268,740
Grants and other contributions 15,307 13,404 12,656
Interest received 108 77 77
Other 18,21 16,847 8,783 8,713
Outflows:
Employee costs 19,22 (783,320) (837,660) (865,398)
Supplies and services (350,877) (361,188) (338,962)
Grants and subsidies (1,401) (1,323) (1,323)
Borrowing costs .. .. ..
Other (2,201) (5,091) (3,128)
Net cash provided by or used in operating activities 58,286 55,769 81,375
CASH FLOWS FROM INVESTING ACTIVITIES
Inflows:
Sales of non-financial assets (261) (68) (85)
Investments redeemed .. .. ..
Loans and advances redeemed .. .. ..
Outflows:
Payments for non-financial assets (9,843) (12,189) (6,389)
Payments for investments .. .. ..
Loans and advances made .. .. ..
Net cash provided by or used in investing activities (10,104) (12,257) (6,474)
CASH FLOWS FROM FINANCING ACTIVITIES
Inflows:
Borrowings .. .. ..
Equity injections 9,843 9,943 6,389
Outflows:
Borrowing redemptions .. .. ..
Finance lease payments .. .. ..
Equity withdrawals (81,248) (78,924) (79,458)
Net cash provided by or used in financing activities (71,405) (68,981) (73,069)
Net increase/(decrease) in cash held (23,223) (25,469) 1,832
Cash at the beginning of financial year 78,048 43,946 18,477
Cash transfers from restructure .. .. ..
Cash at the end of financial year 54,825 18,477 20,309
2016-17 Queensland State Budget – Service Delivery Statements – Gold Coast Hospital and Health Service 106
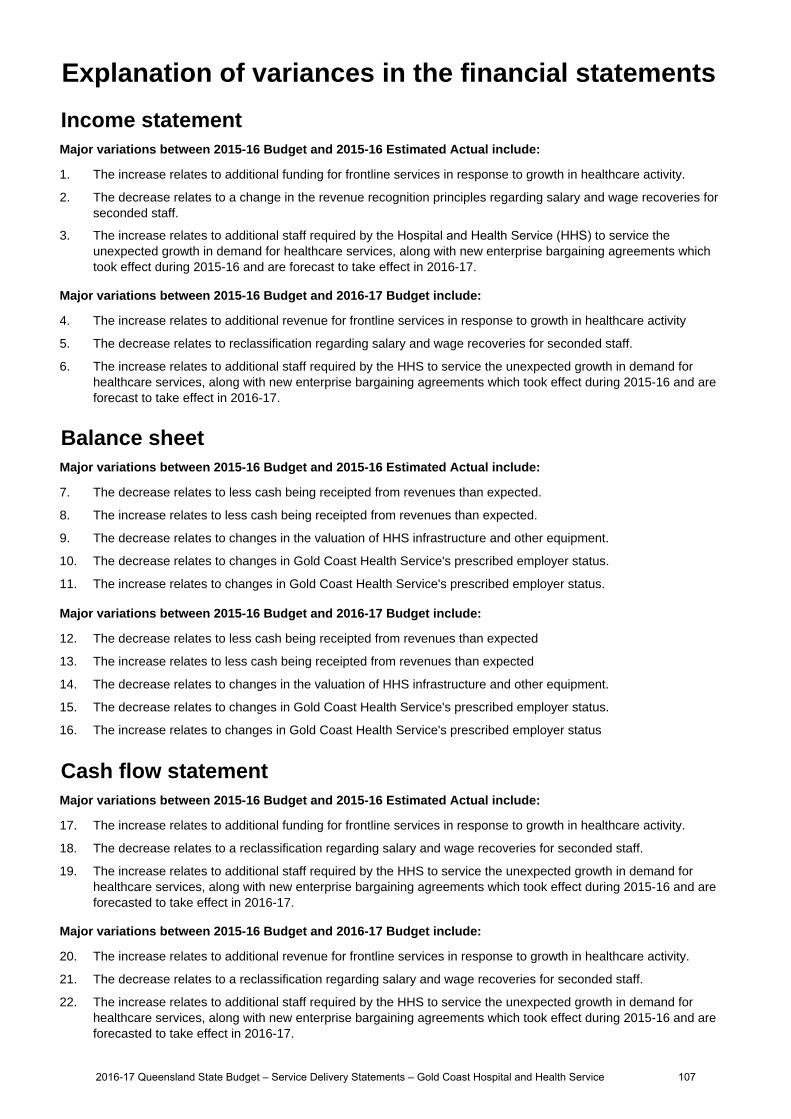
Income statementMajor variations between 2015-16 Budget and 2015-16 Estimated Actual include:
1. The increase relates to additional funding for frontline services in response to growth in healthcare activity.
2. The decrease relates to a change in the revenue recognition principles regarding salary and wage recoveries forseconded staff.
3. The increase relates to additional staff required by the Hospital and Health Service (HHS) to service theunexpected growth in demand for healthcare services, along with new enterprise bargaining agreements whichtook effect during 2015-16 and are forecast to take effect in 2016-17.
Major variations between 2015-16 Budget and 2016-17 Budget include:
4. The increase relates to additional revenue for frontline services in response to growth in healthcare activity
5. The decrease relates to reclassification regarding salary and wage recoveries for seconded staff.
6. The increase relates to additional staff required by the HHS to service the unexpected growth in demand forhealthcare services, along with new enterprise bargaining agreements which took effect during 2015-16 and areforecast to take effect in 2016-17.
Balance sheetMajor variations between 2015-16 Budget and 2015-16 Estimated Actual include:
7. The decrease relates to less cash being receipted from revenues than expected.
8. The increase relates to less cash being receipted from revenues than expected.
9. The decrease relates to changes in the valuation of HHS infrastructure and other equipment.
10. The decrease relates to changes in Gold Coast Health Service's prescribed employer status.
11. The increase relates to changes in Gold Coast Health Service's prescribed employer status.
Major variations between 2015-16 Budget and 2016-17 Budget include:
12. The decrease relates to less cash being receipted from revenues than expected
13. The increase relates to less cash being receipted from revenues than expected
14. The decrease relates to changes in the valuation of HHS infrastructure and other equipment.
15. The decrease relates to changes in Gold Coast Health Service's prescribed employer status.
16. The increase relates to changes in Gold Coast Health Service's prescribed employer status
Cash flow statementMajor variations between 2015-16 Budget and 2015-16 Estimated Actual include:
17. The increase relates to additional funding for frontline services in response to growth in healthcare activity.
18. The decrease relates to a reclassification regarding salary and wage recoveries for seconded staff.
19. The increase relates to additional staff required by the HHS to service the unexpected growth in demand forhealthcare services, along with new enterprise bargaining agreements which took effect during 2015-16 and areforecasted to take effect in 2016-17.
Major variations between 2015-16 Budget and 2016-17 Budget include:
20. The increase relates to additional revenue for frontline services in response to growth in healthcare activity.
21. The decrease relates to a reclassification regarding salary and wage recoveries for seconded staff.
22. The increase relates to additional staff required by the HHS to service the unexpected growth in demand forhealthcare services, along with new enterprise bargaining agreements which took effect during 2015-16 and areforecasted to take effect in 2016-17.
Explanation of variances in the financial statements
2016-17 Queensland State Budget – Service Delivery Statements – Gold Coast Hospital and Health Service 107
Mackay Hospital and Health Service
Overview
The Mackay Hospital and Health Service (HHS) is an independent statutory body overseen by a local Hospital and Health Board. The Mackay HHS is responsible for the delivery of public hospital and health services including medical, surgical, emergency, obstetrics, paediatrics, specialist outpatient clinics, mental health, critical care and clinical support services to a population of approximately 182,000 people. The geographical catchment of the Mackay HHS spans 90,364 square kilometres, extending from Bowen in the north to St Lawrence in the south, west to Clermont and northwest to Collinsville. Proserpine and the Whitsundays are also included in the region.
The Mackay HHS is responsible for the direct management of facilities within the HHS’s geographical boundaries, including eight hospitals and four community health facilities. Our hospitals include:
Mackay Base Hospital Dysart Hospital
Bowen Hospital Moranbah Hospital
Clermont Hospital Proserpine Hospital
Collinsville Hospital Sarina Hospital
The vision for Mackay HHS is Delivering Queensland's Best Rural and Regional Health Care, and is realised through our four strategic objectives:
inspired people exceptional patient experiences excellence in integrated care sustainable service delivery.
The actions under these strategic objectives will enable the HHS to achieve positive outcomes for the Mackay community including: better access to services; safe and excellent care; easier patient navigation of the system and ensuring our community and consumers are listened to.
The strategic objectives of the Mackay HHS contribute to the Queensland Government’s objectives of delivering quality frontline services; creating jobs and a diverse economy and building safe, caring and connected communities.
During 2015-16, the Mackay HHS, through its strong performance and prudent financial management, enabled the investment of surplus funds in key projects to deliver enhanced services for our community including:
reduced waiting times for specialist outpatient appointments ensuring elective surgery within clinically recommended timeframes preparations for enhanced clinical information technology systems - the Digital Hospital expansion of cardiac services to include permanent pacemakers so that patients can be treated closer to home infrastructure improvements including Carlyle Street to allow community child, youth and family health services to be
located under the one roof.
Service summary
The Mackay HHS has an operating budget of $357.9 million for 2016-17 which is an increase of $30.2 million (9.2 per cent) from the published 2015-16 operating budget of $327.7 million.
The Service Agreement between the Mackay HHS and the department identifies the health services to be provided, funding arrangements for those services and defined performance indicators and targets to ensure activity and outcomes are achieved.
In 2015-16, the Mackay HHS focused on striving to have patients seen within recommended clinical timeframes and helping patients spend less time in hospital by providing more options to receive care in the community. These key initiatives will continue to be a focus in 2016-17, as well as delivering key infrastructure and technology projects, such as refurbishments of the Emergency Departments at both Bowen and Proserpine Hospitals and expanding the telehealth service.
In 2016-17 the Mackay HHS expects to see a continued increase in demand for public health services, within a highly constrained fiscal environment. This means the HHS will focus on delivering the core services for its community and
2016-17 Queensland State Budget – Service Delivery Statements – Mackay Hospital and Health Service 108
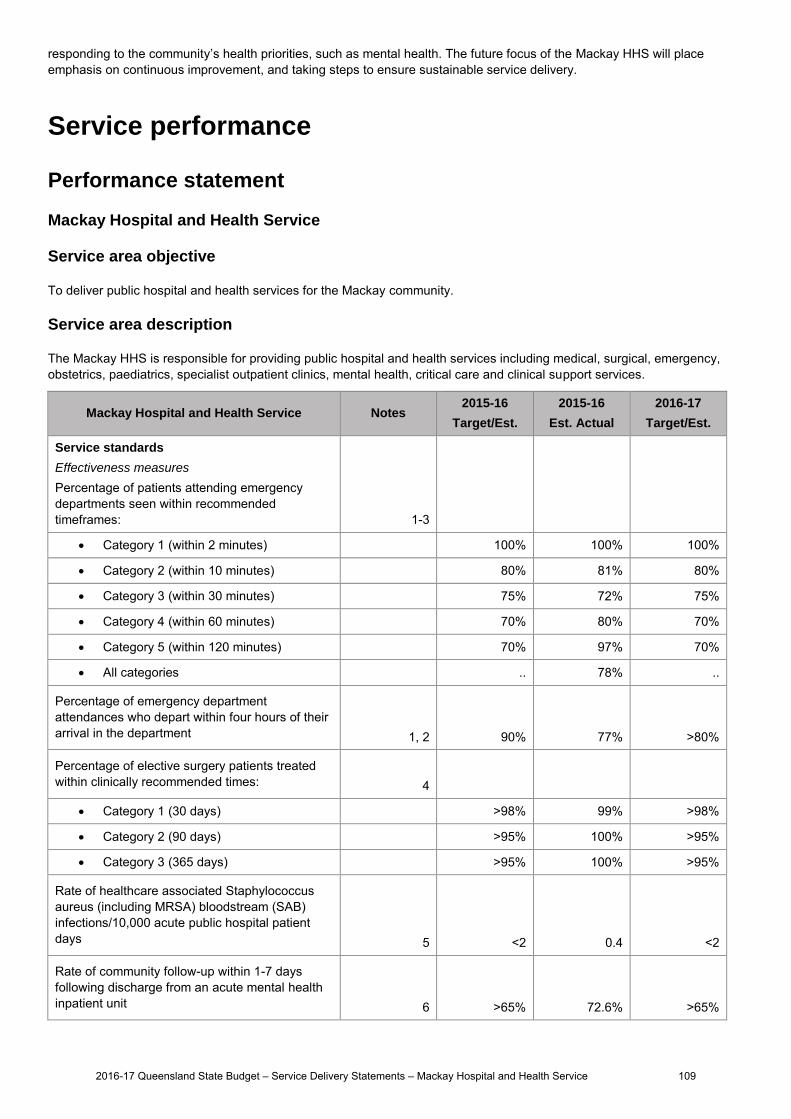
responding to the community’s health priorities, such as mental health. The future focus of the Mackay HHS will place emphasis on continuous improvement, and taking steps to ensure sustainable service delivery.
Service performance
Performance statement
Mackay Hospital and Health Service
Service area objective
To deliver public hospital and health services for the Mackay community.
Service area description
The Mackay HHS is responsible for providing public hospital and health services including medical, surgical, emergency, obstetrics, paediatrics, specialist outpatient clinics, mental health, critical care and clinical support services.
Mackay Hospital and Health Service Notes 2015-16
Target/Est.
2015-16
Est. Actual
2016-17
Target/Est.
Service standards
Effectiveness measures
Percentage of patients attending emergency departments seen within recommended timeframes:
1-3
Category 1 (within 2 minutes) 100% 100% 100%
Category 2 (within 10 minutes) 80% 81% 80%
Category 3 (within 30 minutes) 75% 72% 75%
Category 4 (within 60 minutes) 70% 80% 70%
Category 5 (within 120 minutes) 70% 97% 70%
All categories .. 78% ..
Percentage of emergency department attendances who depart within four hours of their arrival in the department 1, 2 90% 77% >80%
Percentage of elective surgery patients treated within clinically recommended times: 4
Category 1 (30 days) >98% 99% >98%
Category 2 (90 days) >95% 100% >95%
Category 3 (365 days) >95% 100% >95%
Rate of healthcare associated Staphylococcus aureus (including MRSA) bloodstream (SAB) infections/10,000 acute public hospital patient days 5 <2 0.4 <2
Rate of community follow-up within 1-7 days following discharge from an acute mental health inpatient unit 6 >65% 72.6% >65%
2016-17 Queensland State Budget – Service Delivery Statements – Mackay Hospital and Health Service 109

Mackay Hospital and Health Service Notes 2015-16
Target/Est.
2015-16
Est. Actual
2016-17
Target/Est.
Proportion of readmissions to an acute mental health inpatient unit within 28 days of discharge 7 <12% 10.1% <12%
Percentage of specialist outpatients waiting within clinically recommended times: 8
Category 1 (30 days) .. 67% 70%
Category 2 (90 days) .. 70% 70%
Category 3 (365 days) .. 87% 90%
Median wait time for treatment in emergency departments (minutes) 1, 2 20 15 20
Median wait time for elective surgery (days) 4 25 44 25
Efficiency measure
Average cost per weighted activity unit for Activity Based Funding facilities 9 $5,288 $4,871 $4,752
Other measures
Total weighted activity units: 10
Acute Inpatient 25,115 28,315 24,866
Outpatients 8,038 8,286 7,799
Sub-acute 1,724 1,357 1,972
Emergency Department 8,539 8,635 8,480
Mental Health 3,289 3,214 3,302
Interventions and Procedures 4,283 4,491 4,273
Ambulatory mental health service contact duration (hours) 11 >27,000 27,579 >27,854
Notes: 1. The 2015-16 Estimated Actual figures are based on ten months of actual performance from 1 July 2015 to 30 April 2016. From 2015-16,
Queensland Health expanded the centrally collected dataset from 26 emergency departments to include an additional 32 emergency services in regional and rural areas around Queensland. This expansion to 58 facilities provides a broader representation of the patients who require emergency services.
2. This information is sourced from the Queensland Health Emergency Data Collection. 3. A target for percentage of emergency department patients seen within recommended timeframes is not included for the 'All Categories' as
there is no national benchmark. The included triage category 2015-16 Target/Estimates are based on the Australasian Triage Scale. 4. The 2015-16 Estimated Actual figures are based on ten months of actual performance from 1 July 2015 to 30 April 2016. 5. Staphylococcus aureus are bacteria commonly found on around 30 per cent of people’s skin and noses and often cause no adverse effects.
Infections with this organism can be serious, particularly so when they infect the bloodstream. The data reported for this service standard are for bloodstream infections with Staphylococcus aureus (including MRSA) and are reported as a rate of infection per 10,000 patient days. The Target/Estimate for this measure aligns with the national benchmark of 2 cases per 10,000 acute public hospital patient days. The 2015-16 Estimated Actual figures are based on eight months of actual performance from 1 July 2015 to 29 February 2016.
6. Queensland has made significant progress in improving the rate of community follow up over the past five years. 7. Queensland has made significant progress in reducing readmission rates over the past five years, with continued incremental improvements
towards the nationally recommended target. The 2016-17 Target/Estimate is the nationally recommended target. 8. The 2015-16 Estimated Actual figures are based on an average of ten months actual performance from 1 July 2015 to 30 April 2016. The
2015-16 Service Delivery Statement did not include a 2015-16 Target/Estimate as the target was under review. The review has been completed and has enabled HHS specific targets to be set for 2016-17.
9. The 2015-16 and 2016-17 Target/Estimate costs reflect the finance and activity schedules of the 2016-17 Round 2 Service Agreements Contract Offers (V3.10). The 2015-16 Target/Estimate is recalculated based on the funding provided in the Hospital and Health Service Agreements as at the March 2016 Deed of Amendment and the activity recalculated based on the Activity Based Funding (ABF) model Q19 Round 2 2016-17 Contract Offers to enable comparison with 2016-17 Target/Estimate figures. An adjustment for the full year reconciliation of ABF cost by the Hospital and Health Services has been reflected in the 2016-17 figures.
2016-17 Queensland State Budget – Service Delivery Statements – Mackay Hospital and Health Service 110
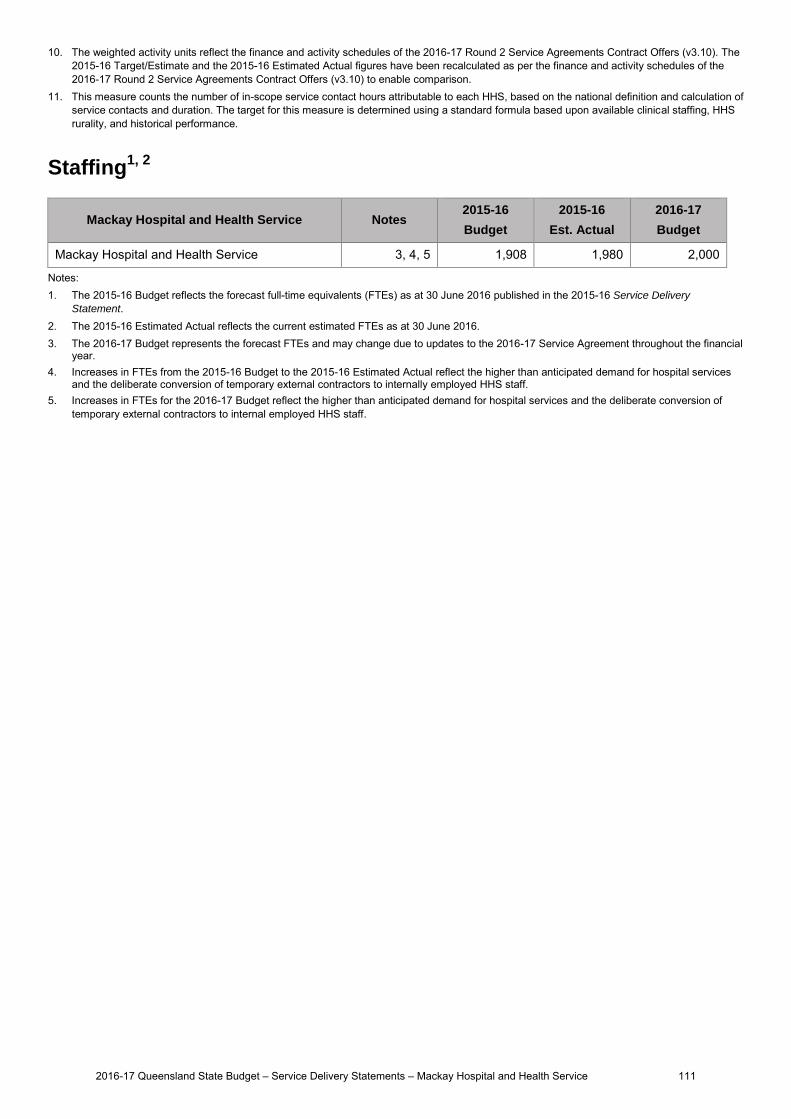
10. The weighted activity units reflect the finance and activity schedules of the 2016-17 Round 2 Service Agreements Contract Offers (v3.10). The 2015-16 Target/Estimate and the 2015-16 Estimated Actual figures have been recalculated as per the finance and activity schedules of the 2016-17 Round 2 Service Agreements Contract Offers (v3.10) to enable comparison.
11. This measure counts the number of in-scope service contact hours attributable to each HHS, based on the national definition and calculation of service contacts and duration. The target for this measure is determined using a standard formula based upon available clinical staffing, HHS rurality, and historical performance.
Staffing1, 2
Mackay Hospital and Health Service Notes 2015-16
Budget
2015-16
Est. Actual
2016-17
Budget
Mackay Hospital and Health Service 3, 4, 5 1,908 1,980 2,000
Notes: 1. The 2015-16 Budget reflects the forecast full-time equivalents (FTEs) as at 30 June 2016 published in the 2015-16 Service Delivery
Statement. 2. The 2015-16 Estimated Actual reflects the current estimated FTEs as at 30 June 2016. 3. The 2016-17 Budget represents the forecast FTEs and may change due to updates to the 2016-17 Service Agreement throughout the financial
year. 4. Increases in FTEs from the 2015-16 Budget to the 2015-16 Estimated Actual reflect the higher than anticipated demand for hospital services
and the deliberate conversion of temporary external contractors to internally employed HHS staff. 5. Increases in FTEs for the 2016-17 Budget reflect the higher than anticipated demand for hospital services and the deliberate conversion of
temporary external contractors to internal employed HHS staff.
2016-17 Queensland State Budget – Service Delivery Statements – Mackay Hospital and Health Service 111

Income statement
Mackay Hospital and Health Service Notes 2015-16 Budget
$'000
2015-16 Est. Act.
$'000
2016-17 Budget
$'000
INCOME
User charges and fees 1,9 319,070 337,734 342,026
Grants and other contributions 8,342 8,223 7,174
Interest 65 66 66
Other revenue 2,10,14 235 1,239 4,478
Gains on sale/revaluation of assets .. .. ..
Total income 327,712 347,262 353,744
EXPENSES
Employee expenses 33,912 33,912 34,538
Supplies and Services: 3,4,11
Other supplies and services 99,983 99,935 91,276
Department of Health contract staff 169,069 193,061 210,520
Grants and subsidies 5 14 912 14
Depreciation and amortisation 12,15 23,659 21,867 20,521
Finance/borrowing costs .. .. ..
Other expenses 6,16 857 2,357 857
Losses on sale/revaluation of assets 7,17 218 2,218 218
Total expenses 327,712 354,262 357,944
OPERATING SURPLUS/(DEFICIT) 8,13 .. (7,000) (4,200)
2016-17 Queensland State Budget – Service Delivery Statements – Mackay Hospital and Health Service 112
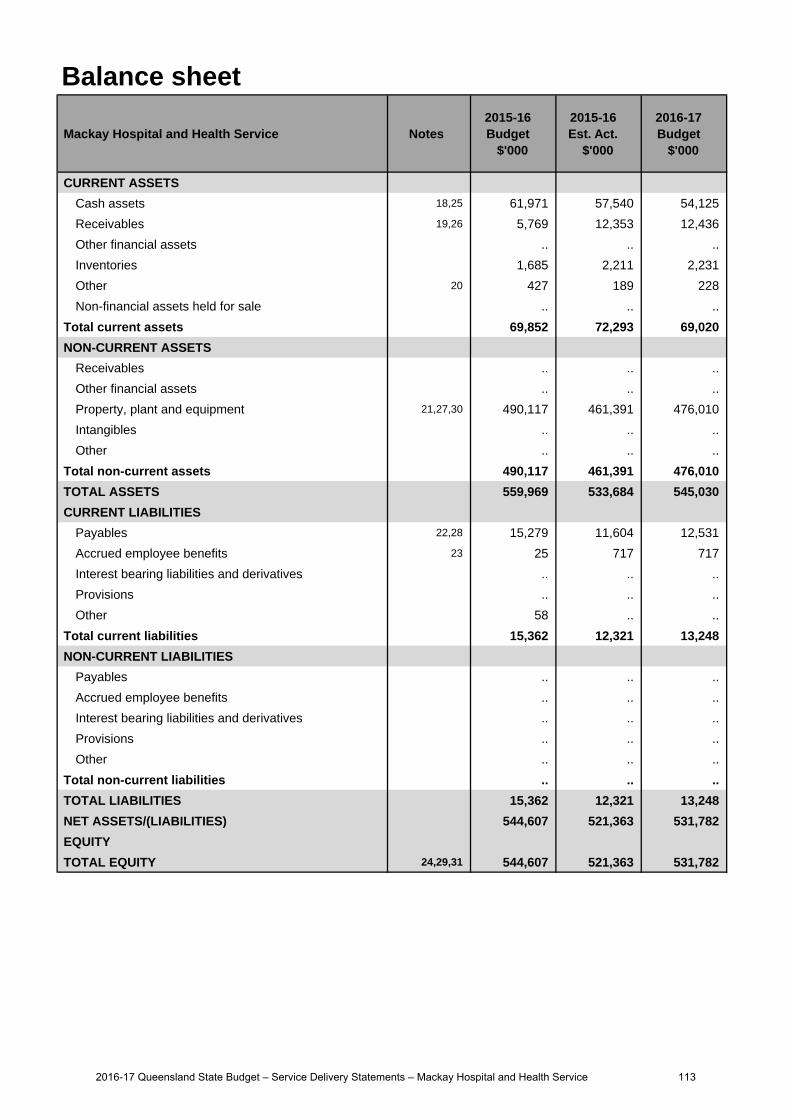
Balance sheet
Mackay Hospital and Health Service Notes 2015-16 Budget
$'000
2015-16 Est. Act.
$'000
2016-17 Budget
$'000
CURRENT ASSETS
Cash assets 18,25 61,971 57,540 54,125
Receivables 19,26 5,769 12,353 12,436
Other financial assets .. .. ..
Inventories 1,685 2,211 2,231
Other 20 427 189 228
Non-financial assets held for sale .. .. ..
Total current assets 69,852 72,293 69,020
NON-CURRENT ASSETS
Receivables .. .. ..
Other financial assets .. .. ..
Property, plant and equipment 21,27,30 490,117 461,391 476,010
Intangibles .. .. ..
Other .. .. ..
Total non-current assets 490,117 461,391 476,010
TOTAL ASSETS 559,969 533,684 545,030
CURRENT LIABILITIES
Payables 22,28 15,279 11,604 12,531
Accrued employee benefits 23 25 717 717
Interest bearing liabilities and derivatives .. .. ..
Provisions .. .. ..
Other 58 .. ..
Total current liabilities 15,362 12,321 13,248
NON-CURRENT LIABILITIES
Payables .. .. ..
Accrued employee benefits .. .. ..
Interest bearing liabilities and derivatives .. .. ..
Provisions .. .. ..
Other .. .. ..
Total non-current liabilities .. .. ..
TOTAL LIABILITIES 15,362 12,321 13,248
NET ASSETS/(LIABILITIES) 544,607 521,363 531,782
EQUITY
TOTAL EQUITY 24,29,31 544,607 521,363 531,782
2016-17 Queensland State Budget – Service Delivery Statements – Mackay Hospital and Health Service 113
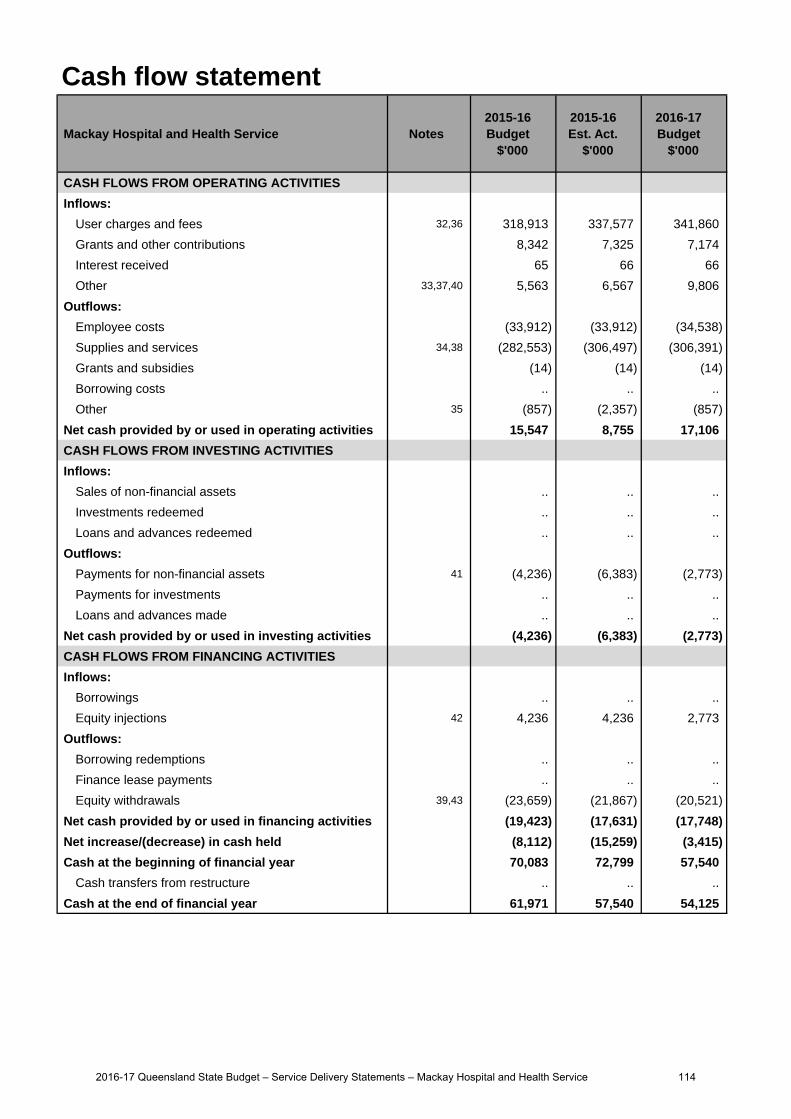
Cash flow statement
Mackay Hospital and Health Service Notes 2015-16 Budget
$'000
2015-16 Est. Act.
$'000
2016-17 Budget
$'000
CASH FLOWS FROM OPERATING ACTIVITIES
Inflows:
User charges and fees 32,36 318,913 337,577 341,860
Grants and other contributions 8,342 7,325 7,174
Interest received 65 66 66
Other 33,37,40 5,563 6,567 9,806
Outflows:
Employee costs (33,912) (33,912) (34,538)
Supplies and services 34,38 (282,553) (306,497) (306,391)
Grants and subsidies (14) (14) (14)
Borrowing costs .. .. ..
Other 35 (857) (2,357) (857)
Net cash provided by or used in operating activities 15,547 8,755 17,106
CASH FLOWS FROM INVESTING ACTIVITIES
Inflows:
Sales of non-financial assets .. .. ..
Investments redeemed .. .. ..
Loans and advances redeemed .. .. ..
Outflows:
Payments for non-financial assets 41 (4,236) (6,383) (2,773)
Payments for investments .. .. ..
Loans and advances made .. .. ..
Net cash provided by or used in investing activities (4,236) (6,383) (2,773)
CASH FLOWS FROM FINANCING ACTIVITIES
Inflows:
Borrowings .. .. ..
Equity injections 42 4,236 4,236 2,773
Outflows:
Borrowing redemptions .. .. ..
Finance lease payments .. .. ..
Equity withdrawals 39,43 (23,659) (21,867) (20,521)
Net cash provided by or used in financing activities (19,423) (17,631) (17,748)
Net increase/(decrease) in cash held (8,112) (15,259) (3,415)
Cash at the beginning of financial year 70,083 72,799 57,540
Cash transfers from restructure .. .. ..
Cash at the end of financial year 61,971 57,540 54,125
2016-17 Queensland State Budget – Service Delivery Statements – Mackay Hospital and Health Service 114
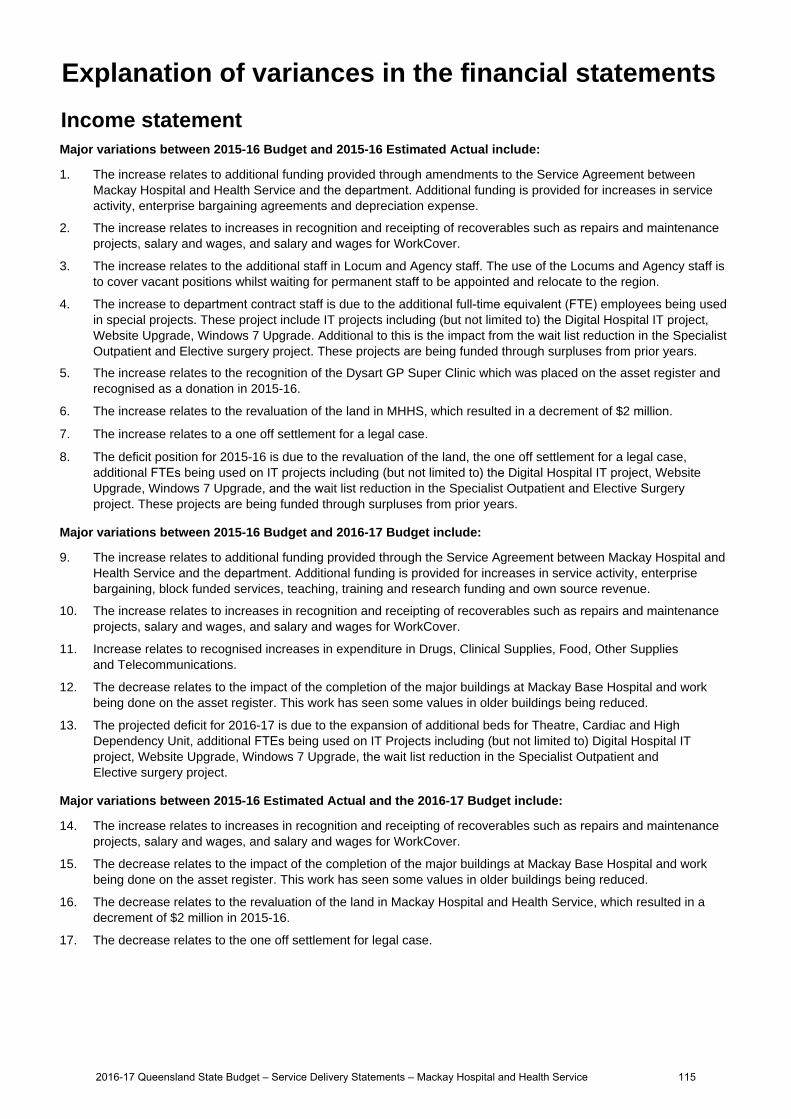
Income statementMajor variations between 2015-16 Budget and 2015-16 Estimated Actual include:
1. The increase relates to additional funding provided through amendments to the Service Agreement betweenMackay Hospital and Health Service and the department. Additional funding is provided for increases in serviceactivity, enterprise bargaining agreements and depreciation expense.
2. The increase relates to increases in recognition and receipting of recoverables such as repairs and maintenance projects, salary and wages, and salary and wages for WorkCover.
3. The increase relates to the additional staff in Locum and Agency staff. The use of the Locums and Agency staff isto cover vacant positions whilst waiting for permanent staff to be appointed and relocate to the region.
4. The increase to department contract staff is due to the additional full-time equivalent (FTE) employees being used in special projects. These project include IT projects including (but not limited to) the Digital Hospital IT project, Website Upgrade, Windows 7 Upgrade. Additional to this is the impact from the wait list reduction in the Specialist Outpatient and Elective surgery project. These projects are being funded through surpluses from prior years.
5. The increase relates to the recognition of the Dysart GP Super Clinic which was placed on the asset register andrecognised as a donation in 2015-16.
6. The increase relates to the revaluation of the land in MHHS, which resulted in a decrement of $2 million.
7. The increase relates to a one off settlement for a legal case.
8. The deficit position for 2015-16 is due to the revaluation of the land, the one off settlement for a legal case, additional FTEs being used on IT projects including (but not limited to) the Digital Hospital IT project, Website Upgrade, Windows 7 Upgrade, and the wait list reduction in the Specialist Outpatient and Elective Surgery project. These projects are being funded through surpluses from prior years.
Major variations between 2015-16 Budget and 2016-17 Budget include:
9. The increase relates to additional funding provided through the Service Agreement between Mackay Hospital andHealth Service and the department. Additional funding is provided for increases in service activity, enterprisebargaining, block funded services, teaching, training and research funding and own source revenue.
10. The increase relates to increases in recognition and receipting of recoverables such as repairs and maintenance projects, salary and wages, and salary and wages for WorkCover.
11. Increase relates to recognised increases in expenditure in Drugs, Clinical Supplies, Food, Other Supplies and Telecommunications.
12. The decrease relates to the impact of the completion of the major buildings at Mackay Base Hospital and workbeing done on the asset register. This work has seen some values in older buildings being reduced.
13. The projected deficit for 2016-17 is due to the expansion of additional beds for Theatre, Cardiac and High Dependency Unit, additional FTEs being used on IT Projects including (but not limited to) Digital Hospital IT project, Website Upgrade, Windows 7 Upgrade, the wait list reduction in the Specialist Outpatient and Elective surgery project.
Major variations between 2015-16 Estimated Actual and the 2016-17 Budget include:
14. The increase relates to increases in recognition and receipting of recoverables such as repairs and maintenance projects, salary and wages, and salary and wages for WorkCover.
15. The decrease relates to the impact of the completion of the major buildings at Mackay Base Hospital and workbeing done on the asset register. This work has seen some values in older buildings being reduced.
16. The decrease relates to the revaluation of the land in Mackay Hospital and Health Service, which resulted in adecrement of $2 million in 2015-16.
17. The decrease relates to the one off settlement for legal case.
Explanation of variances in the financial statements
2016-17 Queensland State Budget – Service Delivery Statements – Mackay Hospital and Health Service 115

Balance sheetMajor variations between 2015-16 Budget and 2015-16 Estimated Actual include:
18. The decrease relates to the projected deficit for 2015-16 due to the one off settlement for a legal case, additional FTEs being used on projects as outlined, IT Projects including (but not limited to) the Digital Hospital IT project, Website Upgrade and Windows 7 Upgrade, and the wait list reduction in the Specialist Outpatient and Elective surgery project. These projects are being funded through surpluses from prior years.
19. The increase relates to additional funding payable from the department to Mackay Hospital and Health Service.
20. The decrease relates to a reduction in prepaid expenditure.
21. The decrease relates to the completion of works at the Mackay Base Hospital compared to prior years. In prioryears when major buildings were completed there was a significant jump in the values against property, plant andequipment. 2014-15 saw the end of the major buildings to be commissioned; this would have initially beenrecognised in the 2015-16 Budget. There are some small buildings to be completed which will be in the financialyear 2015-16. Additional to this the Estimated Actual for 2015-16 will include the land valuation decrement.
22. Decrease from working capital timing issues and payments between periods.
23. The increase relates to the increase in FTEs as highlighted in Income Statement Note 4.
24. The decrease relates to the recognition of a deficit position for 2015-16 due to the revaluation of the land, the one off settlement for a legal case, additional FTEs being used on IT Projects including (but not limited to) the Digital Hospital IT project, Website Upgrade and Windows 7 Upgrade, and the wait list reduction in the Specialist Outpatient and Elective surgery project. These projects are being funded through surpluses from prior years.
Major variations between 2015-16 Budget and 2016-17 Budget include:
25. The decrease relates to the projected deficit for 2015-16 due the one off settlement for a legal case, additional FTEs being used on projects as outlined in Income Statement Note 4.
26. The increase relates to additional funding payable from the department to Mackay Hospital and Health Serviceas a result of Window 3 and of financial year technical adjustments.
27. The decrease relates to the completion of works at the Mackay Base Hospital compared to prior years. In prioryears when major buildings were completed there was a significant jump in the values against property, plant andequipment. 2014-15 saw the end of the major buildings to be commissioned; this would have initially beenrecognised in the 2015-16 Budget. There are some small buildings to be completed which will be in financial year2015-16. In addition, the 2015-16 Estimated Actual will include the land valuation decrement.
28. Decrease from working capital timing issues and payments between periods.
29. The decrease relates to the deficit for 2015-16 due to the revaluation of the land in MHHS, which resulted in a decrement of $2 million, the one off settlement for a legal case, additional FTEs being used on IT Projects including (but not limited to) the Digital Hospital IT project, Website Upgrade and Windows 7 Upgrade, and the wait list reduction in the Specialist Outpatient and Elective surgery project. This is addition to the projected deficit for 2016-17 due to ongoing projects as listed from financial year 2015-16 and the expansion of additional beds for the Theatre, Cardiac and High Dependency Unit.
Major variations between 2015-16 Estimated Actual and the 2016-17 Budget include:
30. The increase relates to finalisation of the Mackay Base Hospital redevelopment and as a result of the annualasset revaluation program.
31. The increase relates to increases in the asset revaluation reserve due to the annual revaluation program andincreases to contributed equity for the transfer of commissioned assets from the department.
Cash flow statementMajor variations between 2015-16 Budget and 2015-16 Estimated Actual include:
32. The increase relates to additional funding provided through amendments to the Service Agreement betweenMackay Hospital and Health Service and the department. Additional funding is provided for increases in serviceactivity, enterprise bargaining agreements and depreciation expense.
33. The increase relates to increases in recognition and receipting of recoverables such as Repairs and MaintenanceProjects, Salary and Wages and Salary and Wages for WorkCover.
2016-17 Queensland State Budget – Service Delivery Statements – Mackay Hospital and Health Service 116
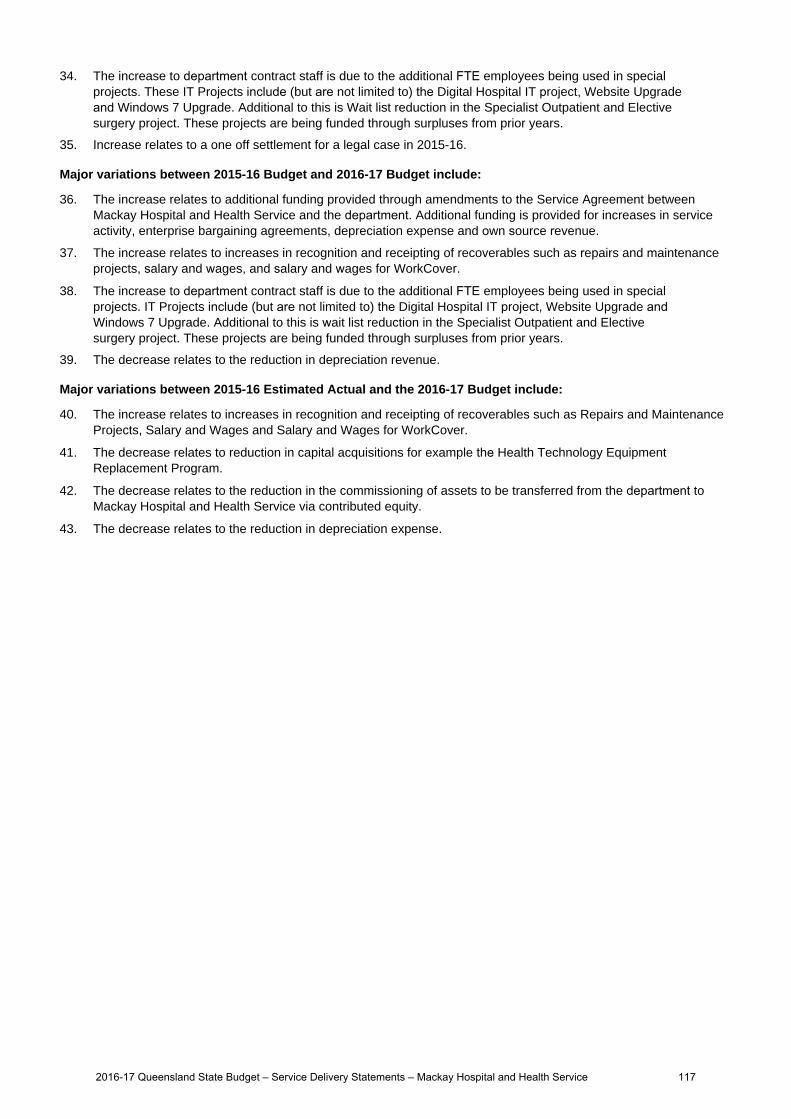
34. The increase to department contract staff is due to the additional FTE employees being used in specialprojects. These IT Projects include (but are not limited to) the Digital Hospital IT project, Website Upgradeand Windows 7 Upgrade. Additional to this is Wait list reduction in the Specialist Outpatient and Electivesurgery project. These projects are being funded through surpluses from prior years.
35. Increase relates to a one off settlement for a legal case in 2015-16.
Major variations between 2015-16 Budget and 2016-17 Budget include:
36. The increase relates to additional funding provided through amendments to the Service Agreement between Mackay Hospital and Health Service and the department. Additional funding is provided for increases in service activity, enterprise bargaining agreements, depreciation expense and own source revenue.
37. The increase relates to increases in recognition and receipting of recoverables such as repairs and maintenance projects, salary and wages, and salary and wages for WorkCover.
38. The increase to department contract staff is due to the additional FTE employees being used in special projects. IT Projects include (but are not limited to) the Digital Hospital IT project, Website Upgrade and Windows 7 Upgrade. Additional to this is wait list reduction in the Specialist Outpatient and Elective surgery project. These projects are being funded through surpluses from prior years.
39. The decrease relates to the reduction in depreciation revenue.
Major variations between 2015-16 Estimated Actual and the 2016-17 Budget include:
40. The increase relates to increases in recognition and receipting of recoverables such as Repairs and MaintenanceProjects, Salary and Wages and Salary and Wages for WorkCover.
41. The decrease relates to reduction in capital acquisitions for example the Health Technology EquipmentReplacement Program.
42. The decrease relates to the reduction in the commissioning of assets to be transferred from the department toMackay Hospital and Health Service via contributed equity.
43. The decrease relates to the reduction in depreciation expense.
2016-17 Queensland State Budget – Service Delivery Statements – Mackay Hospital and Health Service 117
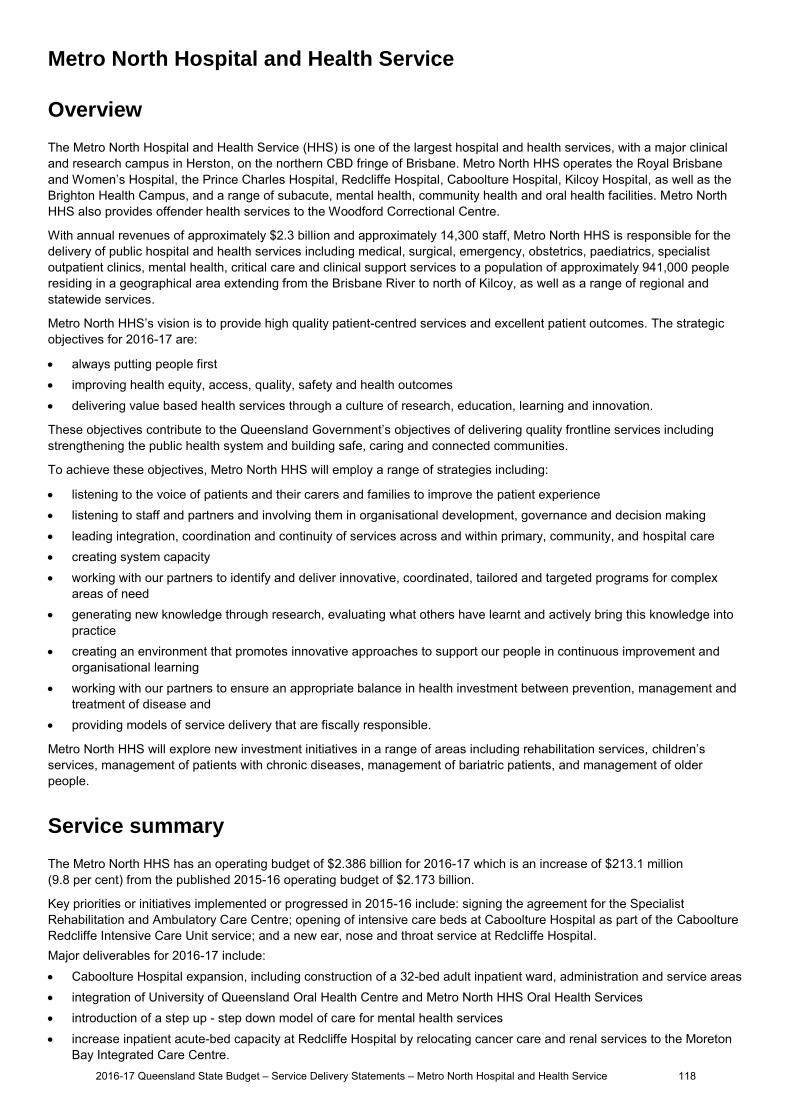
Metro North Hospital and Health Service
Overview
The Metro North Hospital and Health Service (HHS) is one of the largest hospital and health services, with a major clinical and research campus in Herston, on the northern CBD fringe of Brisbane. Metro North HHS operates the Royal Brisbane and Women’s Hospital, the Prince Charles Hospital, Redcliffe Hospital, Caboolture Hospital, Kilcoy Hospital, as well as the Brighton Health Campus, and a range of subacute, mental health, community health and oral health facilities. Metro North HHS also provides offender health services to the Woodford Correctional Centre.
With annual revenues of approximately $2.3 billion and approximately 14,300 staff, Metro North HHS is responsible for the delivery of public hospital and health services including medical, surgical, emergency, obstetrics, paediatrics, specialist outpatient clinics, mental health, critical care and clinical support services to a population of approximately 941,000 people residing in a geographical area extending from the Brisbane River to north of Kilcoy, as well as a range of regional and statewide services.
Metro North HHS’s vision is to provide high quality patient-centred services and excellent patient outcomes. The strategic objectives for 2016-17 are:
always putting people first improving health equity, access, quality, safety and health outcomes delivering value based health services through a culture of research, education, learning and innovation.
These objectives contribute to the Queensland Government’s objectives of delivering quality frontline services including strengthening the public health system and building safe, caring and connected communities.
To achieve these objectives, Metro North HHS will employ a range of strategies including:
listening to the voice of patients and their carers and families to improve the patient experience listening to staff and partners and involving them in organisational development, governance and decision making leading integration, coordination and continuity of services across and within primary, community, and hospital care creating system capacity working with our partners to identify and deliver innovative, coordinated, tailored and targeted programs for complex
areas of need generating new knowledge through research, evaluating what others have learnt and actively bring this knowledge into
practice creating an environment that promotes innovative approaches to support our people in continuous improvement and
organisational learning working with our partners to ensure an appropriate balance in health investment between prevention, management and
treatment of disease and providing models of service delivery that are fiscally responsible.
Metro North HHS will explore new investment initiatives in a range of areas including rehabilitation services, children’s services, management of patients with chronic diseases, management of bariatric patients, and management of older people.
Service summary
The Metro North HHS has an operating budget of $2.386 billion for 2016-17 which is an increase of $213.1 million (9.8 per cent) from the published 2015-16 operating budget of $2.173 billion.
Key priorities or initiatives implemented or progressed in 2015-16 include: signing the agreement for the Specialist Rehabilitation and Ambulatory Care Centre; opening of intensive care beds at Caboolture Hospital as part of the Caboolture Redcliffe Intensive Care Unit service; and a new ear, nose and throat service at Redcliffe Hospital. Major deliverables for 2016-17 include: Caboolture Hospital expansion, including construction of a 32-bed adult inpatient ward, administration and service areas integration of University of Queensland Oral Health Centre and Metro North HHS Oral Health Services introduction of a step up - step down model of care for mental health services increase inpatient acute-bed capacity at Redcliffe Hospital by relocating cancer care and renal services to the Moreton
Bay Integrated Care Centre. 2016-17 Queensland State Budget – Service Delivery Statements – Metro North Hospital and Health Service 118
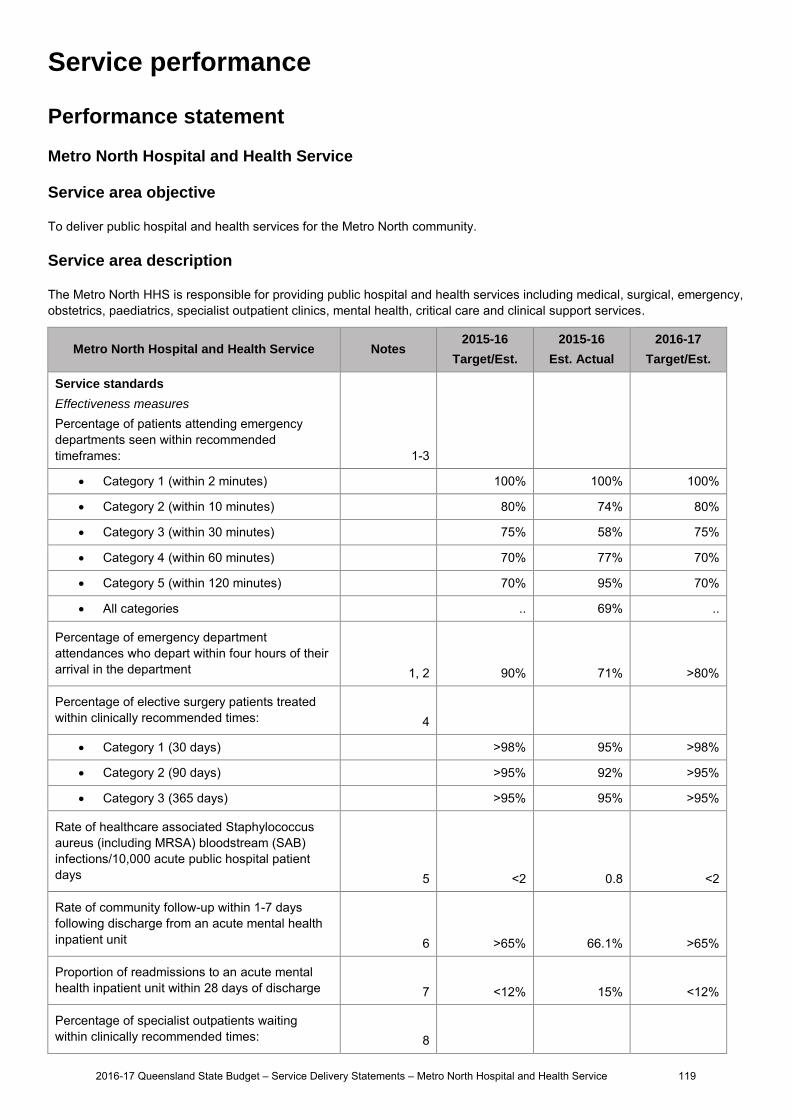
Service performance
Performance statement
Metro North Hospital and Health Service
Service area objective
To deliver public hospital and health services for the Metro North community.
Service area description
The Metro North HHS is responsible for providing public hospital and health services including medical, surgical, emergency, obstetrics, paediatrics, specialist outpatient clinics, mental health, critical care and clinical support services.
Metro North Hospital and Health Service Notes 2015-16
Target/Est.
2015-16
Est. Actual
2016-17
Target/Est.
Service standards
Effectiveness measures
Percentage of patients attending emergency departments seen within recommended timeframes:
1-3
Category 1 (within 2 minutes) 100% 100% 100%
Category 2 (within 10 minutes) 80% 74% 80%
Category 3 (within 30 minutes) 75% 58% 75%
Category 4 (within 60 minutes) 70% 77% 70%
Category 5 (within 120 minutes) 70% 95% 70%
All categories .. 69% ..
Percentage of emergency department attendances who depart within four hours of their arrival in the department 1, 2 90% 71% >80%
Percentage of elective surgery patients treated within clinically recommended times: 4
Category 1 (30 days) >98% 95% >98%
Category 2 (90 days) >95% 92% >95%
Category 3 (365 days) >95% 95% >95%
Rate of healthcare associated Staphylococcus aureus (including MRSA) bloodstream (SAB) infections/10,000 acute public hospital patient days 5 <2 0.8 <2
Rate of community follow-up within 1-7 days following discharge from an acute mental health inpatient unit 6 >65% 66.1% >65%
Proportion of readmissions to an acute mental health inpatient unit within 28 days of discharge 7 <12% 15% <12%
Percentage of specialist outpatients waiting within clinically recommended times: 8
2016-17 Queensland State Budget – Service Delivery Statements – Metro North Hospital and Health Service 119
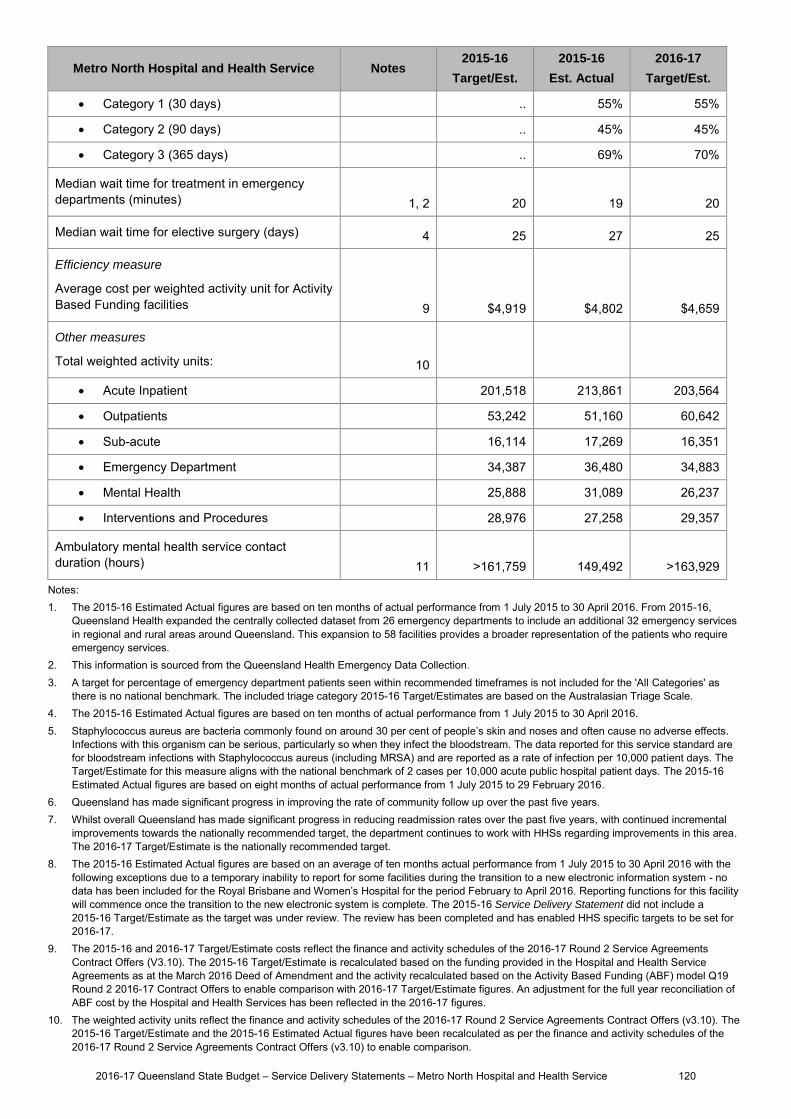
Metro North Hospital and Health Service Notes 2015-16
Target/Est.
2015-16
Est. Actual
2016-17
Target/Est.
Category 1 (30 days) .. 55% 55%
Category 2 (90 days) .. 45% 45%
Category 3 (365 days) .. 69% 70%
Median wait time for treatment in emergency departments (minutes) 1, 2 20 19 20
Median wait time for elective surgery (days) 4 25 27 25
Efficiency measure
Average cost per weighted activity unit for Activity Based Funding facilities 9 $4,919 $4,802 $4,659
Other measures
Total weighted activity units: 10
Acute Inpatient 201,518 213,861 203,564
Outpatients 53,242 51,160 60,642
Sub-acute 16,114 17,269 16,351
Emergency Department 34,387 36,480 34,883
Mental Health 25,888 31,089 26,237
Interventions and Procedures 28,976 27,258 29,357
Ambulatory mental health service contact duration (hours) 11 >161,759 149,492 >163,929
Notes: 1. The 2015-16 Estimated Actual figures are based on ten months of actual performance from 1 July 2015 to 30 April 2016. From 2015-16,
Queensland Health expanded the centrally collected dataset from 26 emergency departments to include an additional 32 emergency services in regional and rural areas around Queensland. This expansion to 58 facilities provides a broader representation of the patients who require emergency services.
2. This information is sourced from the Queensland Health Emergency Data Collection. 3. A target for percentage of emergency department patients seen within recommended timeframes is not included for the 'All Categories' as
there is no national benchmark. The included triage category 2015-16 Target/Estimates are based on the Australasian Triage Scale. 4. The 2015-16 Estimated Actual figures are based on ten months of actual performance from 1 July 2015 to 30 April 2016. 5. Staphylococcus aureus are bacteria commonly found on around 30 per cent of people’s skin and noses and often cause no adverse effects.
Infections with this organism can be serious, particularly so when they infect the bloodstream. The data reported for this service standard are for bloodstream infections with Staphylococcus aureus (including MRSA) and are reported as a rate of infection per 10,000 patient days. The Target/Estimate for this measure aligns with the national benchmark of 2 cases per 10,000 acute public hospital patient days. The 2015-16 Estimated Actual figures are based on eight months of actual performance from 1 July 2015 to 29 February 2016.
6. Queensland has made significant progress in improving the rate of community follow up over the past five years. 7. Whilst overall Queensland has made significant progress in reducing readmission rates over the past five years, with continued incremental
improvements towards the nationally recommended target, the department continues to work with HHSs regarding improvements in this area. The 2016-17 Target/Estimate is the nationally recommended target.
8. The 2015-16 Estimated Actual figures are based on an average of ten months actual performance from 1 July 2015 to 30 April 2016 with the following exceptions due to a temporary inability to report for some facilities during the transition to a new electronic information system - no data has been included for the Royal Brisbane and Women’s Hospital for the period February to April 2016. Reporting functions for this facility will commence once the transition to the new electronic system is complete. The 2015-16 Service Delivery Statement did not include a 2015-16 Target/Estimate as the target was under review. The review has been completed and has enabled HHS specific targets to be set for 2016-17.
9. The 2015-16 and 2016-17 Target/Estimate costs reflect the finance and activity schedules of the 2016-17 Round 2 Service Agreements Contract Offers (V3.10). The 2015-16 Target/Estimate is recalculated based on the funding provided in the Hospital and Health Service Agreements as at the March 2016 Deed of Amendment and the activity recalculated based on the Activity Based Funding (ABF) model Q19 Round 2 2016-17 Contract Offers to enable comparison with 2016-17 Target/Estimate figures. An adjustment for the full year reconciliation of ABF cost by the Hospital and Health Services has been reflected in the 2016-17 figures.
10. The weighted activity units reflect the finance and activity schedules of the 2016-17 Round 2 Service Agreements Contract Offers (v3.10). The 2015-16 Target/Estimate and the 2015-16 Estimated Actual figures have been recalculated as per the finance and activity schedules of the 2016-17 Round 2 Service Agreements Contract Offers (v3.10) to enable comparison.
2016-17 Queensland State Budget – Service Delivery Statements – Metro North Hospital and Health Service 120
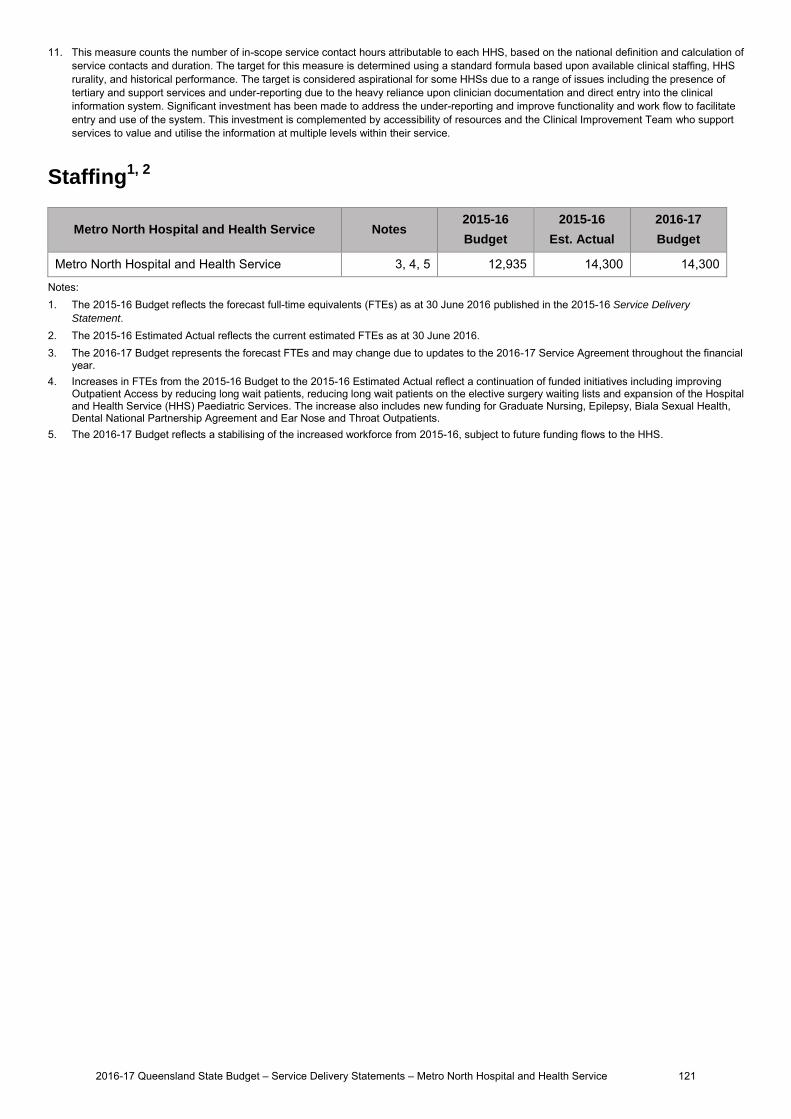
11. This measure counts the number of in-scope service contact hours attributable to each HHS, based on the national definition and calculation of service contacts and duration. The target for this measure is determined using a standard formula based upon available clinical staffing, HHS rurality, and historical performance. The target is considered aspirational for some HHSs due to a range of issues including the presence of tertiary and support services and under-reporting due to the heavy reliance upon clinician documentation and direct entry into the clinical information system. Significant investment has been made to address the under-reporting and improve functionality and work flow to facilitate entry and use of the system. This investment is complemented by accessibility of resources and the Clinical Improvement Team who support services to value and utilise the information at multiple levels within their service.
Staffing1, 2
Metro North Hospital and Health Service Notes 2015-16
Budget
2015-16
Est. Actual
2016-17
Budget
Metro North Hospital and Health Service 3, 4, 5 12,935 14,300 14,300
Notes: 1. The 2015-16 Budget reflects the forecast full-time equivalents (FTEs) as at 30 June 2016 published in the 2015-16 Service Delivery
Statement. 2. The 2015-16 Estimated Actual reflects the current estimated FTEs as at 30 June 2016. 3. The 2016-17 Budget represents the forecast FTEs and may change due to updates to the 2016-17 Service Agreement throughout the financial
year. 4. Increases in FTEs from the 2015-16 Budget to the 2015-16 Estimated Actual reflect a continuation of funded initiatives including improving
Outpatient Access by reducing long wait patients, reducing long wait patients on the elective surgery waiting lists and expansion of the Hospital and Health Service (HHS) Paediatric Services. The increase also includes new funding for Graduate Nursing, Epilepsy, Biala Sexual Health, Dental National Partnership Agreement and Ear Nose and Throat Outpatients.
5. The 2016-17 Budget reflects a stabilising of the increased workforce from 2015-16, subject to future funding flows to the HHS.
2016-17 Queensland State Budget – Service Delivery Statements – Metro North Hospital and Health Service 121
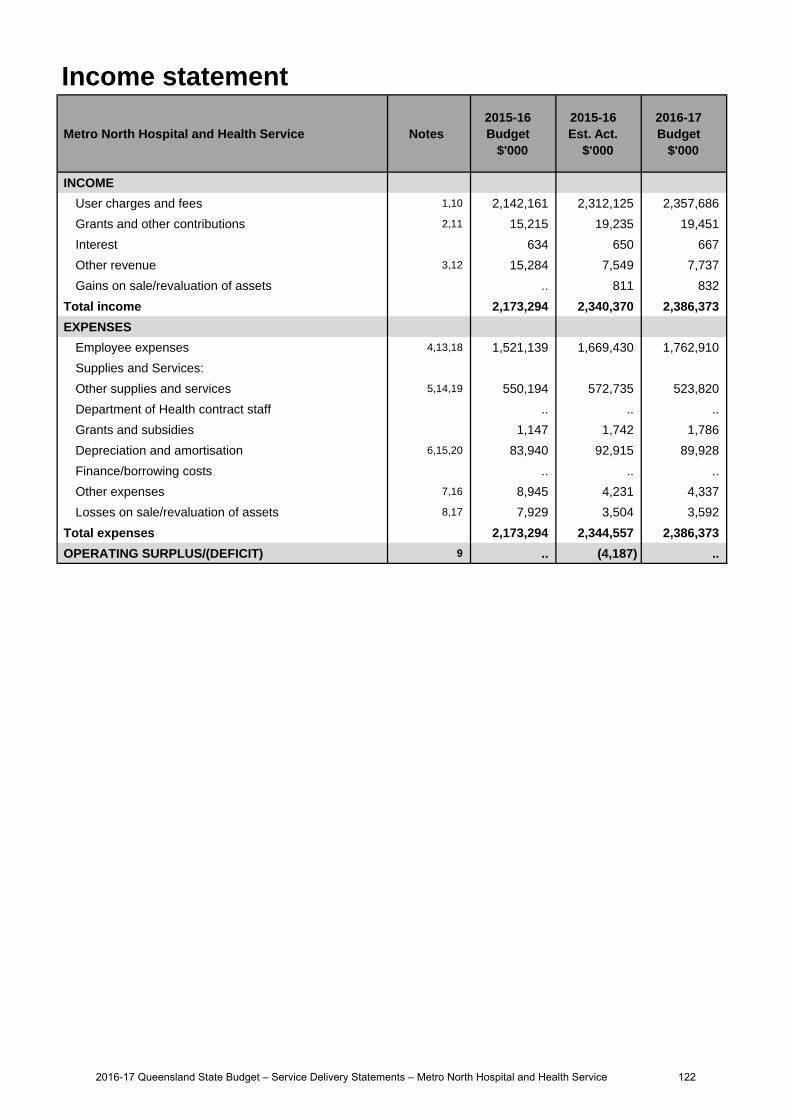
Income statement
Metro North Hospital and Health Service Notes 2015-16 Budget
$'000
2015-16 Est. Act.
$'000
2016-17 Budget
$'000
INCOME
User charges and fees 1,10 2,142,161 2,312,125 2,357,686
Grants and other contributions 2,11 15,215 19,235 19,451
Interest 634 650 667
Other revenue 3,12 15,284 7,549 7,737
Gains on sale/revaluation of assets .. 811 832
Total income 2,173,294 2,340,370 2,386,373
EXPENSES
Employee expenses 4,13,18 1,521,139 1,669,430 1,762,910
Supplies and Services:
Other supplies and services 5,14,19 550,194 572,735 523,820
Department of Health contract staff .. .. ..
Grants and subsidies 1,147 1,742 1,786
Depreciation and amortisation 6,15,20 83,940 92,915 89,928
Finance/borrowing costs .. .. ..
Other expenses 7,16 8,945 4,231 4,337
Losses on sale/revaluation of assets 8,17 7,929 3,504 3,592
Total expenses 2,173,294 2,344,557 2,386,373
OPERATING SURPLUS/(DEFICIT) 9 .. (4,187) ..
2016-17 Queensland State Budget – Service Delivery Statements – Metro North Hospital and Health Service 122
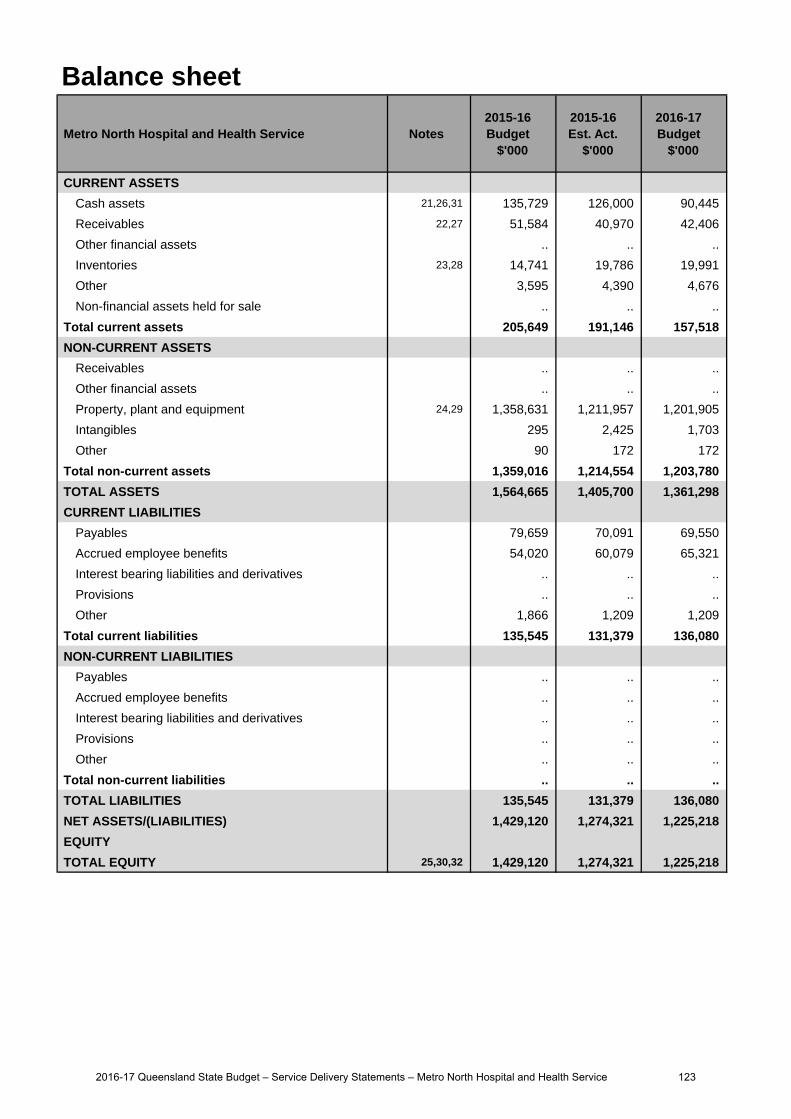
Balance sheet
Metro North Hospital and Health Service Notes 2015-16 Budget
$'000
2015-16 Est. Act.
$'000
2016-17 Budget
$'000
CURRENT ASSETS
Cash assets 21,26,31 135,729 126,000 90,445
Receivables 22,27 51,584 40,970 42,406
Other financial assets .. .. ..
Inventories 23,28 14,741 19,786 19,991
Other 3,595 4,390 4,676
Non-financial assets held for sale .. .. ..
Total current assets 205,649 191,146 157,518
NON-CURRENT ASSETS
Receivables .. .. ..
Other financial assets .. .. ..
Property, plant and equipment 24,29 1,358,631 1,211,957 1,201,905
Intangibles 295 2,425 1,703
Other 90 172 172
Total non-current assets 1,359,016 1,214,554 1,203,780
TOTAL ASSETS 1,564,665 1,405,700 1,361,298
CURRENT LIABILITIES
Payables 79,659 70,091 69,550
Accrued employee benefits 54,020 60,079 65,321
Interest bearing liabilities and derivatives .. .. ..
Provisions .. .. ..
Other 1,866 1,209 1,209
Total current liabilities 135,545 131,379 136,080
NON-CURRENT LIABILITIES
Payables .. .. ..
Accrued employee benefits .. .. ..
Interest bearing liabilities and derivatives .. .. ..
Provisions .. .. ..
Other .. .. ..
Total non-current liabilities .. .. ..
TOTAL LIABILITIES 135,545 131,379 136,080
NET ASSETS/(LIABILITIES) 1,429,120 1,274,321 1,225,218
EQUITY
TOTAL EQUITY 25,30,32 1,429,120 1,274,321 1,225,218
2016-17 Queensland State Budget – Service Delivery Statements – Metro North Hospital and Health Service 123

Cash flow statement
Metro North Hospital and Health Service Notes 2015-16 Budget
$'000
2015-16 Est. Act.
$'000
2016-17 Budget
$'000
CASH FLOWS FROM OPERATING ACTIVITIES
Inflows:
User charges and fees 33,39 2,133,907 2,328,372 2,352,684
Grants and other contributions 34,40 15,215 19,235 19,451
Interest received 634 650 667
Other 55,007 47,272 47,460
Outflows:
Employee costs 35,41,45 (1,512,257) (1,655,548) (1,757,668)
Supplies and services 36,42,46 (591,054) (621,595) (564,601)
Grants and subsidies (1,147) (1,742) (1,786)
Borrowing costs .. .. ..
Other (8,945) (4,231) (4,337)
Net cash provided by or used in operating activities 91,360 112,413 91,870
CASH FLOWS FROM INVESTING ACTIVITIES
Inflows:
Sales of non-financial assets (924) 811 832
Investments redeemed .. .. ..
Loans and advances redeemed .. .. ..
Outflows:
Payments for non-financial assets 37,43 (40,364) (72,640) (68,989)
Payments for investments .. .. ..
Loans and advances made .. .. ..
Net cash provided by or used in investing activities (41,288) (71,829) (68,157)
CASH FLOWS FROM FINANCING ACTIVITIES
Inflows:
Borrowings .. .. ..
Equity injections 44,47 40,364 47,964 23,144
Outflows:
Borrowing redemptions .. .. ..
Finance lease payments .. .. ..
Equity withdrawals 38,48 (83,940) (92,915) (82,412)
Net cash provided by or used in financing activities (43,576) (44,951) (59,268)
Net increase/(decrease) in cash held 6,496 (4,367) (35,555)
Cash at the beginning of financial year 129,233 130,367 126,000
Cash transfers from restructure .. .. ..
Cash at the end of financial year 135,729 126,000 90,445
2016-17 Queensland State Budget – Service Delivery Statements – Metro North Hospital and Health Service 124

Income statementMajor variations between 2015-16 Budget and 2015-16 Estimated Actual include:
1. Increase is due to a number of funding adjustments through the Service Agreement Amendment Windows. Themain items funded are enterprise bargaining of 2.5 per cent as part of the Government's State wage policy, growthfunding for additional public clinical activity, funding to reinvigorate Biala Sexual Health Clinic, Ear Nose Throat(ENT) Long Wait Outpatient reduction, additional graduate nursing positions and Comprehensive EpilepsyProgram.
2. Increase due to higher than expected Nursing Home occupancy and increased Transition Care placements due toincreased clinical activity for the Hospital and Health Service (HHS).
3. Decreased revenue as recovery of salaries for seconded employees is now treated as a credit to employeeexpenses.
4. Increase is due to enterprise bargaining of 2.5 per cent as part of the Government's State wage policy andadditional front line staff which has increased clinical throughput and enabled access to growth funding; as well asincreased employees to reinvigorate Biala Sexual Health Clinic, ENT Long Wait Outpatient reduction, additionalgraduate nursing positions, and the Comprehensive Epilepsy Program.
5. Increased supplies and services due to increased clinical consumables as a result of additional activity.
6. Depreciation increase relates primarily to accelerated depreciation on the Herston Quarter resulting from thetransfer of the former Royal Children's Hospital site to the HHS.
7. Decrease due to accounting reclassification of expenses to other supplies and services.
8. Reduction in bad debts due to improved debtor control practices.
9. The estimated deficit in 2015-16 is due to expenses associated with the implementation of a joint initiative with thedepartment to reduce the outpatient waiting list, which requires utilisation of retained surpluses.
Major variations between 2015-16 Budget and 2016-17 Budget include:
10. The increase is due to a number of funding adjustments through the Service Agreement Amendment Windows. The main items funded are enterprise bargaining of 2.5 per cent as part of the Government's State wage policy, funding to reinvigorate Biala Sexual Health Clinic, ENT Long Wait Outpatient reduction, additional graduate nursing positions, Comprehensive Epilepsy Program, UQ Dental and implementation of the Mental Health Bill.
11. Increase due to higher than expected nursing home occupancy and increased Transition Care placements due to increased clinical activity for the HHS.
12. Decreased revenue as recovery of salaries for seconded employees is now treated as a credit to employeeexpenses.
13. The increase from 2015-16 Budget is due to enterprise bargaining of 2.5 per cent as part of the Government'sState wage policy, additional front line staff which has increased clinical throughput and enabled access to growthfunding as well as an increase in employees to reinvigorate Biala Sexual Health Clinic, ENT Long Wait Outpatientreduction, additional graduate nursing positions and Comprehensive Epilepsy Program.
14. The decrease is due to a reduction in non-recurrent funding. It is expected that the majority of this funding will be re-provided through Service Agreement Amendment Window adjustments during 2016-17.
15. Depreciation increase relates primarily to increased depreciation relating to HHS Infrastructure investmentsincluding 32 bed expansion at Caboolture Hospital, Mental Health Step up Step Down Facility and Redcliffe acuteinpatient additional capacity.
16. Decrease due to accounting re-alignment reclassification of expenses to other supplies and services.
17. Reduction in bad debts due to improved debtor control practices.
Major variations between 2015-16 Estimated Actual and the 2016-17 Budget include:
18. The increase is for enterprise bargaining of 2.5 per cent as part of the Government's State wage policy.
19. The decrease is due to a reduction in non-recurrent funding. It is expected that the majority of this funding will be re-provided through Service Agreement Amendment Window adjustments during 2016-17.
Explanation of variances in the financial statements
2016-17 Queensland State Budget – Service Delivery Statements – Metro North Hospital and Health Service 125
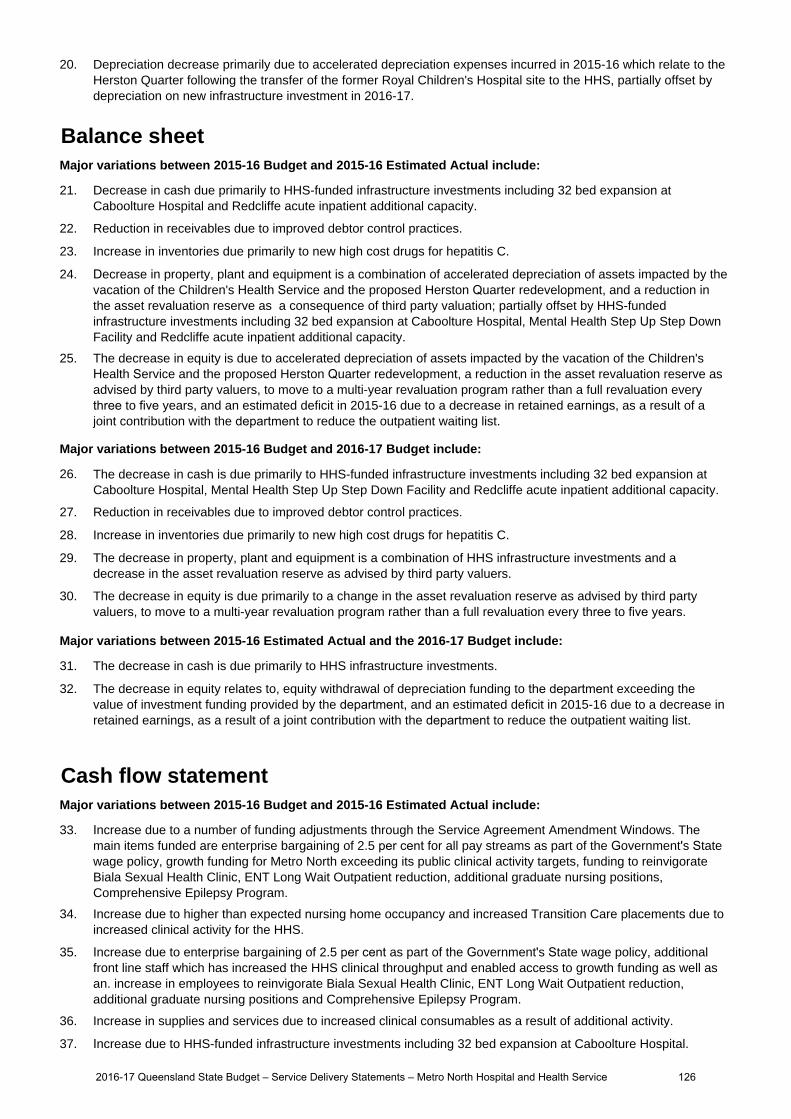
20. Depreciation decrease primarily due to accelerated depreciation expenses incurred in 2015-16 which relate to theHerston Quarter following the transfer of the former Royal Children's Hospital site to the HHS, partially offset bydepreciation on new infrastructure investment in 2016-17.
Balance sheetMajor variations between 2015-16 Budget and 2015-16 Estimated Actual include:
21. Decrease in cash due primarily to HHS-funded infrastructure investments including 32 bed expansion atCaboolture Hospital and Redcliffe acute inpatient additional capacity.
22. Reduction in receivables due to improved debtor control practices.
23. Increase in inventories due primarily to new high cost drugs for hepatitis C.
24. Decrease in property, plant and equipment is a combination of accelerated depreciation of assets impacted by thevacation of the Children's Health Service and the proposed Herston Quarter redevelopment, and a reduction inthe asset revaluation reserve as a consequence of third party valuation; partially offset by HHS-fundedinfrastructure investments including 32 bed expansion at Caboolture Hospital, Mental Health Step Up Step DownFacility and Redcliffe acute inpatient additional capacity.
25. The decrease in equity is due to accelerated depreciation of assets impacted by the vacation of the Children'sHealth Service and the proposed Herston Quarter redevelopment, a reduction in the asset revaluation reserve asadvised by third party valuers, to move to a multi-year revaluation program rather than a full revaluation everythree to five years, and an estimated deficit in 2015-16 due to a decrease in retained earnings, as a result of ajoint contribution with the department to reduce the outpatient waiting list.
Major variations between 2015-16 Budget and 2016-17 Budget include:
26. The decrease in cash is due primarily to HHS-funded infrastructure investments including 32 bed expansion atCaboolture Hospital, Mental Health Step Up Step Down Facility and Redcliffe acute inpatient additional capacity.
27. Reduction in receivables due to improved debtor control practices.
28. Increase in inventories due primarily to new high cost drugs for hepatitis C.
29. The decrease in property, plant and equipment is a combination of HHS infrastructure investments and adecrease in the asset revaluation reserve as advised by third party valuers.
30. The decrease in equity is due primarily to a change in the asset revaluation reserve as advised by third partyvaluers, to move to a multi-year revaluation program rather than a full revaluation every three to five years.
Major variations between 2015-16 Estimated Actual and the 2016-17 Budget include:
31. The decrease in cash is due primarily to HHS infrastructure investments.
32. The decrease in equity relates to, equity withdrawal of depreciation funding to the department exceeding thevalue of investment funding provided by the department, and an estimated deficit in 2015-16 due to a decrease inretained earnings, as a result of a joint contribution with the department to reduce the outpatient waiting list.
Cash flow statementMajor variations between 2015-16 Budget and 2015-16 Estimated Actual include:
33. Increase due to a number of funding adjustments through the Service Agreement Amendment Windows. Themain items funded are enterprise bargaining of 2.5 per cent for all pay streams as part of the Government's Statewage policy, growth funding for Metro North exceeding its public clinical activity targets, funding to reinvigorateBiala Sexual Health Clinic, ENT Long Wait Outpatient reduction, additional graduate nursing positions,Comprehensive Epilepsy Program.
34. Increase due to higher than expected nursing home occupancy and increased Transition Care placements due to increased clinical activity for the HHS.
35. Increase due to enterprise bargaining of 2.5 per cent as part of the Government's State wage policy, additionalfront line staff which has increased the HHS clinical throughput and enabled access to growth funding as well asan. increase in employees to reinvigorate Biala Sexual Health Clinic, ENT Long Wait Outpatient reduction,additional graduate nursing positions and Comprehensive Epilepsy Program.
36. Increase in supplies and services due to increased clinical consumables as a result of additional activity.
37. Increase due to HHS-funded infrastructure investments including 32 bed expansion at Caboolture Hospital.
2016-17 Queensland State Budget – Service Delivery Statements – Metro North Hospital and Health Service 126
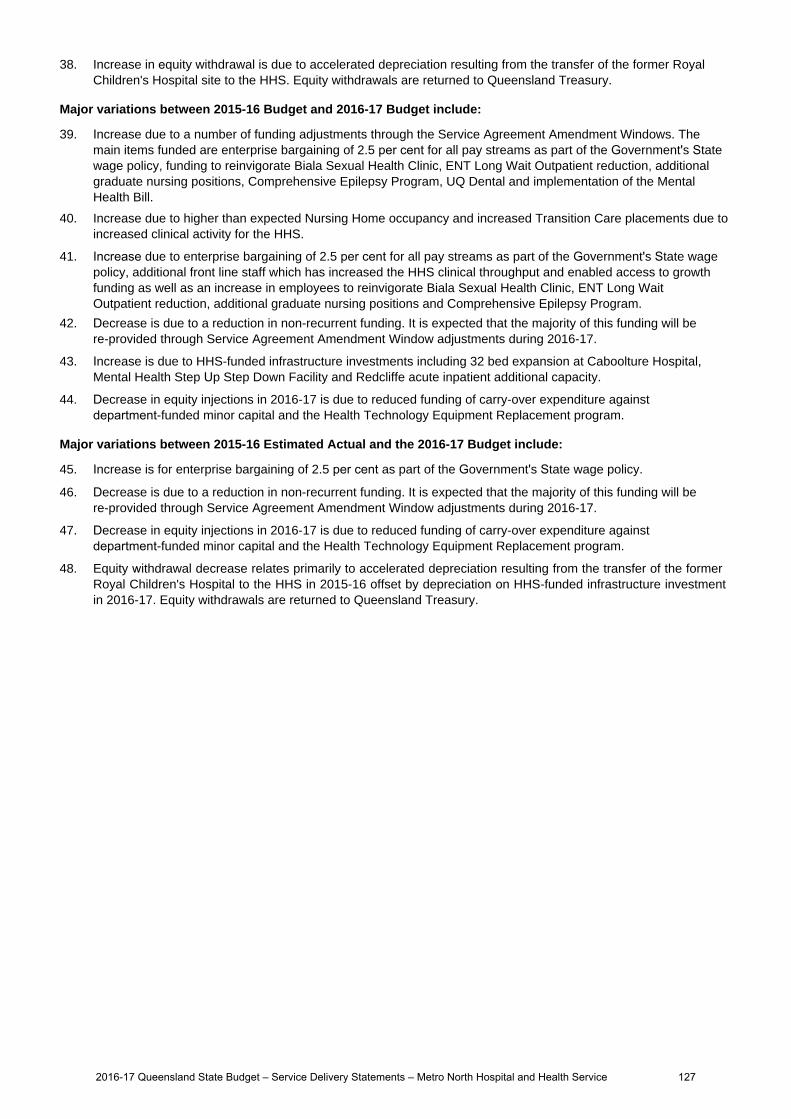
38. Increase in equity withdrawal is due to accelerated depreciation resulting from the transfer of the former Royal Children's Hospital site to the HHS. Equity withdrawals are returned to Queensland Treasury.
Major variations between 2015-16 Budget and 2016-17 Budget include:
39. Increase due to a number of funding adjustments through the Service Agreement Amendment Windows. The main items funded are enterprise bargaining of 2.5 per cent for all pay streams as part of the Government's State wage policy, funding to reinvigorate Biala Sexual Health Clinic, ENT Long Wait Outpatient reduction, additional graduate nursing positions, Comprehensive Epilepsy Program, UQ Dental and implementation of the Mental Health Bill.
40. Increase due to higher than expected Nursing Home occupancy and increased Transition Care placements due toincreased clinical activity for the HHS.
41. Increase due to enterprise bargaining of 2.5 per cent for all pay streams as part of the Government's State wagepolicy, additional front line staff which has increased the HHS clinical throughput and enabled access to growthfunding as well as an increase in employees to reinvigorate Biala Sexual Health Clinic, ENT Long WaitOutpatient reduction, additional graduate nursing positions and Comprehensive Epilepsy Program.
42. Decrease is due to a reduction in non-recurrent funding. It is expected that the majority of this funding will be re-provided through Service Agreement Amendment Window adjustments during 2016-17.
43. Increase is due to HHS-funded infrastructure investments including 32 bed expansion at Caboolture Hospital,Mental Health Step Up Step Down Facility and Redcliffe acute inpatient additional capacity.
44. Decrease in equity injections in 2016-17 is due to reduced funding of carry-over expenditure againstdepartment-funded minor capital and the Health Technology Equipment Replacement program.
Major variations between 2015-16 Estimated Actual and the 2016-17 Budget include:
45. Increase is for enterprise bargaining of 2.5 per cent as part of the Government's State wage policy.
46. Decrease is due to a reduction in non-recurrent funding. It is expected that the majority of this funding will be re-provided through Service Agreement Amendment Window adjustments during 2016-17.
47. Decrease in equity injections in 2016-17 is due to reduced funding of carry-over expenditure againstdepartment-funded minor capital and the Health Technology Equipment Replacement program.
48. Equity withdrawal decrease relates primarily to accelerated depreciation resulting from the transfer of the former Royal Children's Hospital to the HHS in 2015-16 offset by depreciation on HHS-funded infrastructure investment in 2016-17. Equity withdrawals are returned to Queensland Treasury.
2016-17 Queensland State Budget – Service Delivery Statements – Metro North Hospital and Health Service 127

Metro South Hospital and Health Service
Overview
The Metro South Hospital and Health Service (HHS) is an independent statutory body overseen by a local Hospital and Health Board. Metro South is the most populated HHS in Queensland with a resident population of over one million people. Metro South HHS covers 3,856 square kilometres and includes Brisbane City south of the Brisbane River, Redland City, Logan City, Beaudesert and the eastern portion of the Scenic Rim.
The Metro South HHS operates five hospitals (Princess Alexandra, Logan, Redland, Queen Elizabeth II Jubilee (QEII) and Beaudesert), the Wynnum Health Service, and an emergency clinic on North Stradbroke Island. It also comprises a number of residential care facilities, community health centres, mental health and oral health services, as well as outreach and home visiting services.
Through these facilities, the Metro South HHS delivers a full suite of specialities from eight clinical and five non-clinical streams.
The clinical streams are: Aged Care and Rehabilitation Services; Emergency and Clinical Support Services; Addiction and Mental Health Services; Metro South Health Patient Flow Program; Cancer Services; Medicine and Chronic Disease Services; Surgical Services and Women’s and Children’s Services.
The non-clinical streams are: Clinical Governance; Finance; Planning, Engagement and Reform; Corporate Services and Information Technology.
Metro South HHS’s vision is to be renowned worldwide for excellence in health care, teaching and research. Our purpose is to deliver high quality health care through innovation and evidence-based strategies, enabled by the efficient use of available resources, robust planning processes and stakeholder collaboration.
The Metro South HHS is committed to working closely across the Queensland Government to implement its objectives for the community and advance its priorities for health and ambulance delivery. This will be achieved by our three focus areas:
clinical excellence and better health care solutions for patients through redesign and innovation, efficiency and quality technology that supports best practice, next generation clinical care health system integration.
These focus areas are supported by:
resource management that supports health service delivery needs enabling and empowering our people ensuring the needs of our stakeholders influence our efforts.
Service summary
The Metro South HHS has an operating budget of $2.194 billion for 2016-17 which is an increase of $176 million (8.7 per cent) from the published 2015-16 operating budget of $2.018 billion.
The Service Agreement between the Metro South HHS and the department identifies the health services to be provided, funding arrangements for those services and defines performance indicators and targets to ensure outputs and outcomes are achieved.
The Metro South HHS's achievements in 2015-16 included: successful launch of the Digital Hospital Program (Phase 1); commencement of the Gamma Knife Centre of Queensland in November 2015, providing a Queensland first service for non-invasive alternative to neurosurgery; and completion of Logan Hospital's new Cardiac Catheter laboratory and day procedure unit.
Key deliverables for Metro South HHS in 2016-17 include: Digital Hospital Phase 2 launch including medication management, anaesthesia and research support commencement of the Wynnum Integrated Health Community Centre development implementation of nursing ratios across Metro South HHS optimisation of the Mater Health Services contract to improve patient flow and capacity management delivery of Stage 2 of the Southern Queensland Centre of Excellence.
2016-17 Queensland State Budget – Service Delivery Statements – Metro South Hospital and Health Service 128
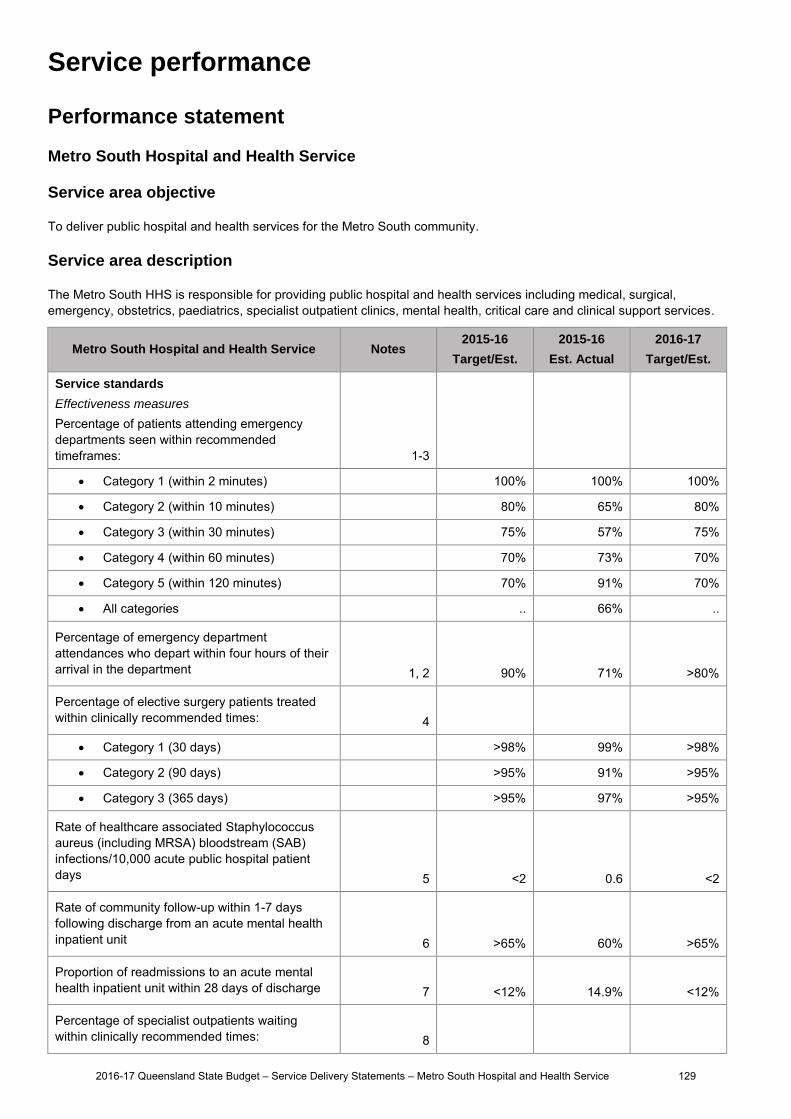
Service performance
Performance statement
Metro South Hospital and Health Service
Service area objective
To deliver public hospital and health services for the Metro South community.
Service area description
The Metro South HHS is responsible for providing public hospital and health services including medical, surgical, emergency, obstetrics, paediatrics, specialist outpatient clinics, mental health, critical care and clinical support services.
Metro South Hospital and Health Service Notes 2015-16
Target/Est.
2015-16
Est. Actual
2016-17
Target/Est.
Service standards
Effectiveness measures
Percentage of patients attending emergency departments seen within recommended timeframes:
1-3
Category 1 (within 2 minutes) 100% 100% 100%
Category 2 (within 10 minutes) 80% 65% 80%
Category 3 (within 30 minutes) 75% 57% 75%
Category 4 (within 60 minutes) 70% 73% 70%
Category 5 (within 120 minutes) 70% 91% 70%
All categories .. 66% ..
Percentage of emergency department attendances who depart within four hours of their arrival in the department 1, 2 90% 71% >80%
Percentage of elective surgery patients treated within clinically recommended times: 4
Category 1 (30 days) >98% 99% >98%
Category 2 (90 days) >95% 91% >95%
Category 3 (365 days) >95% 97% >95%
Rate of healthcare associated Staphylococcus aureus (including MRSA) bloodstream (SAB) infections/10,000 acute public hospital patient days 5 <2 0.6 <2
Rate of community follow-up within 1-7 days following discharge from an acute mental health inpatient unit 6 >65% 60% >65%
Proportion of readmissions to an acute mental health inpatient unit within 28 days of discharge 7 <12% 14.9% <12%
Percentage of specialist outpatients waiting within clinically recommended times: 8
2016-17 Queensland State Budget – Service Delivery Statements – Metro South Hospital and Health Service 129
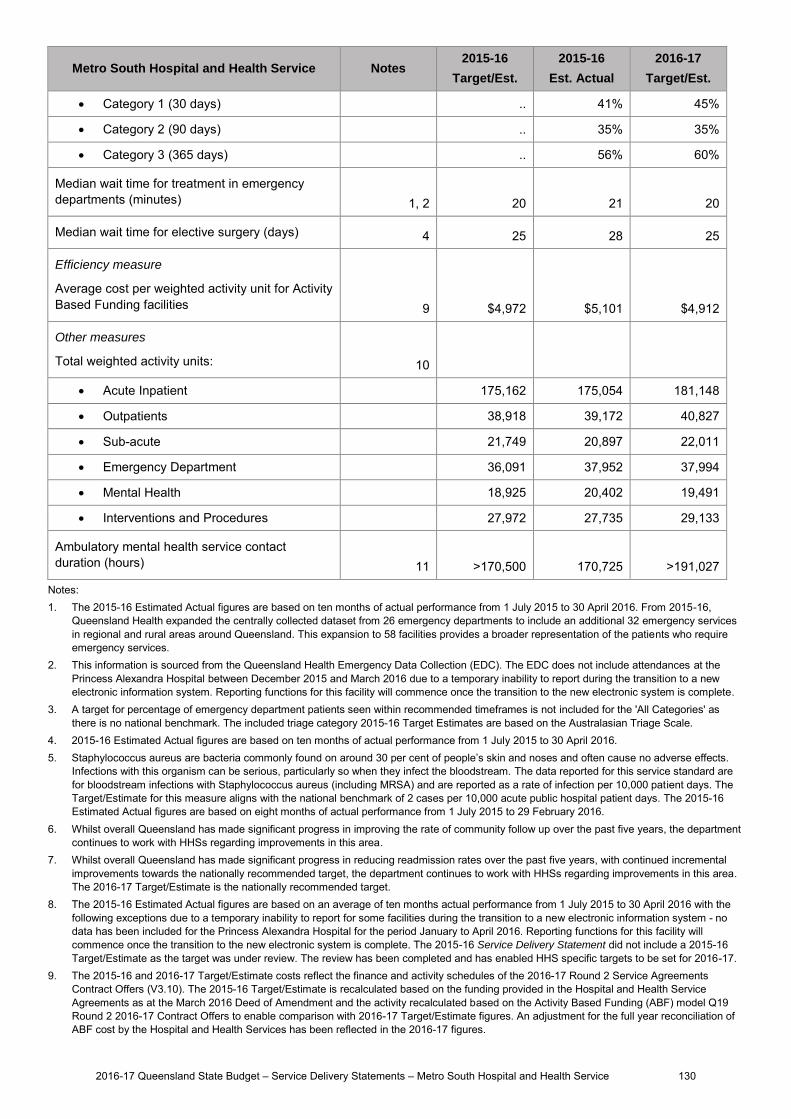
Metro South Hospital and Health Service Notes 2015-16
Target/Est.
2015-16
Est. Actual
2016-17
Target/Est.
Category 1 (30 days) .. 41% 45%
Category 2 (90 days) .. 35% 35%
Category 3 (365 days) .. 56% 60%
Median wait time for treatment in emergency departments (minutes) 1, 2 20 21 20
Median wait time for elective surgery (days) 4 25 28 25
Efficiency measure
Average cost per weighted activity unit for Activity Based Funding facilities 9 $4,972 $5,101 $4,912
Other measures
Total weighted activity units: 10
Acute Inpatient 175,162 175,054 181,148
Outpatients 38,918 39,172 40,827
Sub-acute 21,749 20,897 22,011
Emergency Department 36,091 37,952 37,994
Mental Health 18,925 20,402 19,491
Interventions and Procedures 27,972 27,735 29,133
Ambulatory mental health service contact duration (hours) 11 >170,500 170,725 >191,027
Notes: 1. The 2015-16 Estimated Actual figures are based on ten months of actual performance from 1 July 2015 to 30 April 2016. From 2015-16,
Queensland Health expanded the centrally collected dataset from 26 emergency departments to include an additional 32 emergency services in regional and rural areas around Queensland. This expansion to 58 facilities provides a broader representation of the patients who require emergency services.
2. This information is sourced from the Queensland Health Emergency Data Collection (EDC). The EDC does not include attendances at the Princess Alexandra Hospital between December 2015 and March 2016 due to a temporary inability to report during the transition to a new electronic information system. Reporting functions for this facility will commence once the transition to the new electronic system is complete.
3. A target for percentage of emergency department patients seen within recommended timeframes is not included for the 'All Categories' as there is no national benchmark. The included triage category 2015-16 Target Estimates are based on the Australasian Triage Scale.
4. 2015-16 Estimated Actual figures are based on ten months of actual performance from 1 July 2015 to 30 April 2016. 5. Staphylococcus aureus are bacteria commonly found on around 30 per cent of people’s skin and noses and often cause no adverse effects.
Infections with this organism can be serious, particularly so when they infect the bloodstream. The data reported for this service standard are for bloodstream infections with Staphylococcus aureus (including MRSA) and are reported as a rate of infection per 10,000 patient days. The Target/Estimate for this measure aligns with the national benchmark of 2 cases per 10,000 acute public hospital patient days. The 2015-16 Estimated Actual figures are based on eight months of actual performance from 1 July 2015 to 29 February 2016.
6. Whilst overall Queensland has made significant progress in improving the rate of community follow up over the past five years, the department continues to work with HHSs regarding improvements in this area.
7. Whilst overall Queensland has made significant progress in reducing readmission rates over the past five years, with continued incremental improvements towards the nationally recommended target, the department continues to work with HHSs regarding improvements in this area. The 2016-17 Target/Estimate is the nationally recommended target.
8. The 2015-16 Estimated Actual figures are based on an average of ten months actual performance from 1 July 2015 to 30 April 2016 with the following exceptions due to a temporary inability to report for some facilities during the transition to a new electronic information system - no data has been included for the Princess Alexandra Hospital for the period January to April 2016. Reporting functions for this facility will commence once the transition to the new electronic system is complete. The 2015-16 Service Delivery Statement did not include a 2015-16 Target/Estimate as the target was under review. The review has been completed and has enabled HHS specific targets to be set for 2016-17.
9. The 2015-16 and 2016-17 Target/Estimate costs reflect the finance and activity schedules of the 2016-17 Round 2 Service Agreements Contract Offers (V3.10). The 2015-16 Target/Estimate is recalculated based on the funding provided in the Hospital and Health Service Agreements as at the March 2016 Deed of Amendment and the activity recalculated based on the Activity Based Funding (ABF) model Q19 Round 2 2016-17 Contract Offers to enable comparison with 2016-17 Target/Estimate figures. An adjustment for the full year reconciliation of ABF cost by the Hospital and Health Services has been reflected in the 2016-17 figures.
2016-17 Queensland State Budget – Service Delivery Statements – Metro South Hospital and Health Service 130
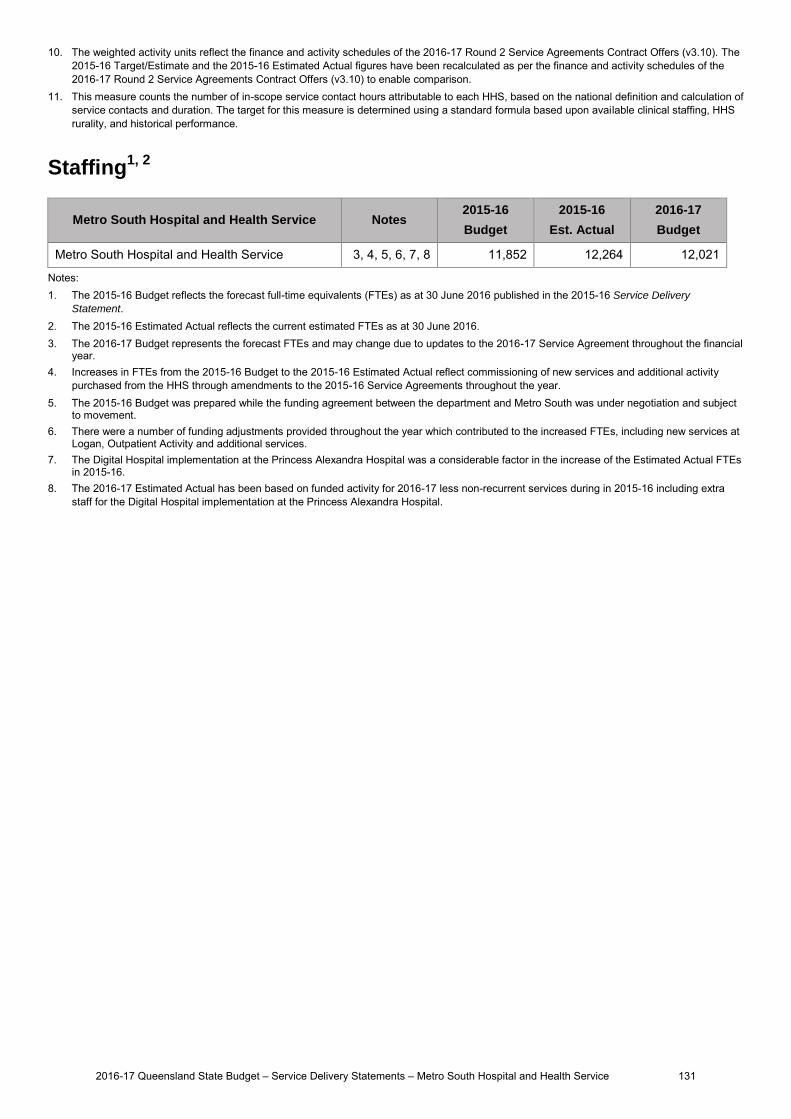
10. The weighted activity units reflect the finance and activity schedules of the 2016-17 Round 2 Service Agreements Contract Offers (v3.10). The 2015-16 Target/Estimate and the 2015-16 Estimated Actual figures have been recalculated as per the finance and activity schedules of the 2016-17 Round 2 Service Agreements Contract Offers (v3.10) to enable comparison.
11. This measure counts the number of in-scope service contact hours attributable to each HHS, based on the national definition and calculation of service contacts and duration. The target for this measure is determined using a standard formula based upon available clinical staffing, HHS rurality, and historical performance.
Staffing1, 2
Metro South Hospital and Health Service Notes 2015-16
Budget
2015-16
Est. Actual
2016-17
Budget
Metro South Hospital and Health Service 3, 4, 5, 6, 7, 8 11,852 12,264 12,021
Notes: 1. The 2015-16 Budget reflects the forecast full-time equivalents (FTEs) as at 30 June 2016 published in the 2015-16 Service Delivery
Statement. 2. The 2015-16 Estimated Actual reflects the current estimated FTEs as at 30 June 2016. 3. The 2016-17 Budget represents the forecast FTEs and may change due to updates to the 2016-17 Service Agreement throughout the financial
year. 4. Increases in FTEs from the 2015-16 Budget to the 2015-16 Estimated Actual reflect commissioning of new services and additional activity
purchased from the HHS through amendments to the 2015-16 Service Agreements throughout the year. 5. The 2015-16 Budget was prepared while the funding agreement between the department and Metro South was under negotiation and subject
to movement. 6. There were a number of funding adjustments provided throughout the year which contributed to the increased FTEs, including new services at
Logan, Outpatient Activity and additional services. 7. The Digital Hospital implementation at the Princess Alexandra Hospital was a considerable factor in the increase of the Estimated Actual FTEs
in 2015-16. 8. The 2016-17 Estimated Actual has been based on funded activity for 2016-17 less non-recurrent services during in 2015-16 including extra
staff for the Digital Hospital implementation at the Princess Alexandra Hospital.
2016-17 Queensland State Budget – Service Delivery Statements – Metro South Hospital and Health Service 131
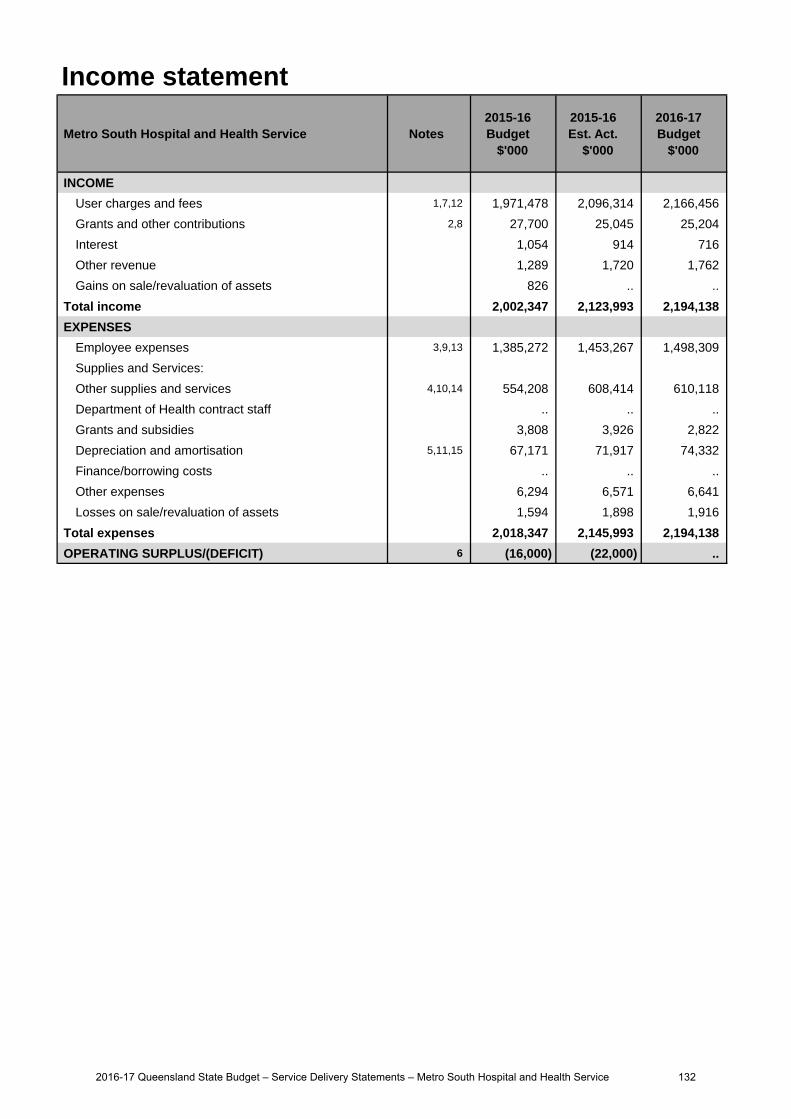
Income statement
Metro South Hospital and Health Service Notes 2015-16 Budget
$'000
2015-16 Est. Act.
$'000
2016-17 Budget
$'000
INCOME
User charges and fees 1,7,12 1,971,478 2,096,314 2,166,456
Grants and other contributions 2,8 27,700 25,045 25,204
Interest 1,054 914 716
Other revenue 1,289 1,720 1,762
Gains on sale/revaluation of assets 826 .. ..
Total income 2,002,347 2,123,993 2,194,138
EXPENSES
Employee expenses 3,9,13 1,385,272 1,453,267 1,498,309
Supplies and Services:
Other supplies and services 4,10,14 554,208 608,414 610,118
Department of Health contract staff .. .. ..
Grants and subsidies 3,808 3,926 2,822
Depreciation and amortisation 5,11,15 67,171 71,917 74,332
Finance/borrowing costs .. .. ..
Other expenses 6,294 6,571 6,641
Losses on sale/revaluation of assets 1,594 1,898 1,916
Total expenses 2,018,347 2,145,993 2,194,138
OPERATING SURPLUS/(DEFICIT) 6 (16,000) (22,000) ..
2016-17 Queensland State Budget – Service Delivery Statements – Metro South Hospital and Health Service 132
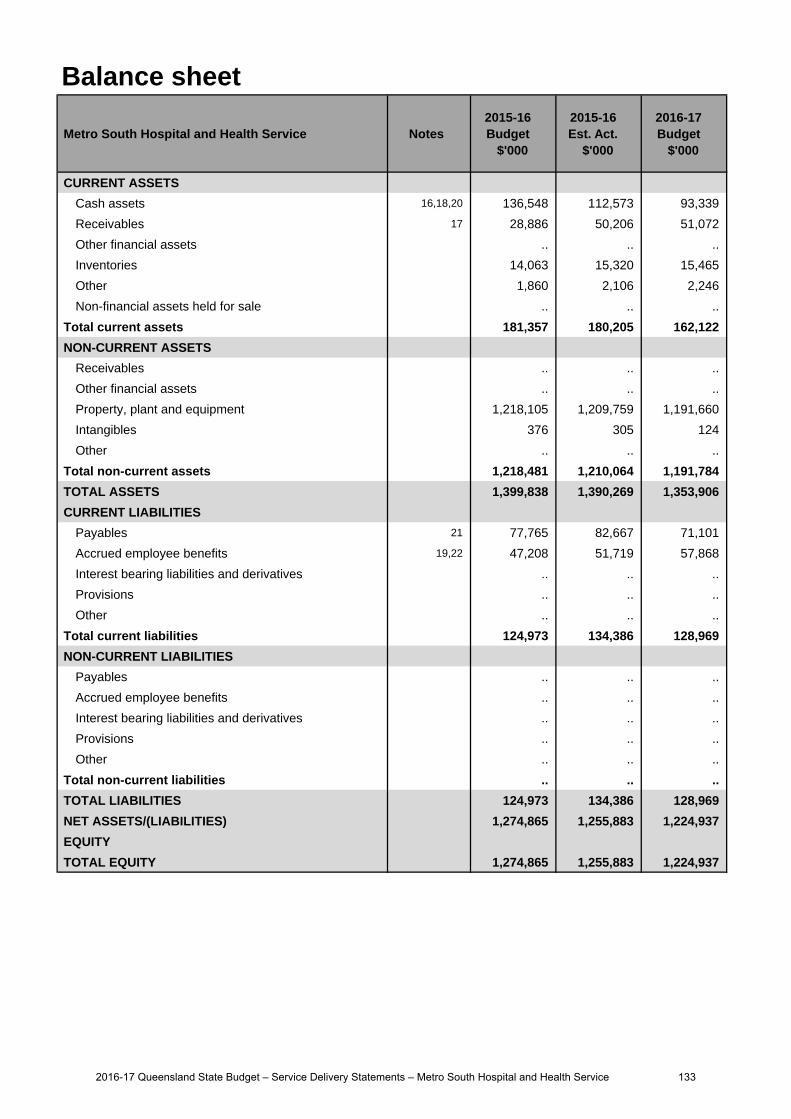
Balance sheet
Metro South Hospital and Health Service Notes 2015-16 Budget
$'000
2015-16 Est. Act.
$'000
2016-17 Budget
$'000
CURRENT ASSETS
Cash assets 16,18,20 136,548 112,573 93,339
Receivables 17 28,886 50,206 51,072
Other financial assets .. .. ..
Inventories 14,063 15,320 15,465
Other 1,860 2,106 2,246
Non-financial assets held for sale .. .. ..
Total current assets 181,357 180,205 162,122
NON-CURRENT ASSETS
Receivables .. .. ..
Other financial assets .. .. ..
Property, plant and equipment 1,218,105 1,209,759 1,191,660
Intangibles 376 305 124
Other .. .. ..
Total non-current assets 1,218,481 1,210,064 1,191,784
TOTAL ASSETS 1,399,838 1,390,269 1,353,906
CURRENT LIABILITIES
Payables 21 77,765 82,667 71,101
Accrued employee benefits 19,22 47,208 51,719 57,868
Interest bearing liabilities and derivatives .. .. ..
Provisions .. .. ..
Other .. .. ..
Total current liabilities 124,973 134,386 128,969
NON-CURRENT LIABILITIES
Payables .. .. ..
Accrued employee benefits .. .. ..
Interest bearing liabilities and derivatives .. .. ..
Provisions .. .. ..
Other .. .. ..
Total non-current liabilities .. .. ..
TOTAL LIABILITIES 124,973 134,386 128,969
NET ASSETS/(LIABILITIES) 1,274,865 1,255,883 1,224,937
EQUITY
TOTAL EQUITY 1,274,865 1,255,883 1,224,937
2016-17 Queensland State Budget – Service Delivery Statements – Metro South Hospital and Health Service 133

Cash flow statement
Metro South Hospital and Health Service Notes 2015-16 Budget
$'000
2015-16 Est. Act.
$'000
2016-17 Budget
$'000
CASH FLOWS FROM OPERATING ACTIVITIES
Inflows:
User charges and fees 23,29,34 1,969,693 2,108,028 2,169,238
Grants and other contributions 27,700 25,045 25,204
Interest received 1,054 914 716
Other 34,201 31,534 31,576
Outflows:
Employee costs 24,30 (1,375,564) (1,443,763) (1,492,160)
Supplies and services 25,31,35 (574,422) (639,700) (652,072)
Grants and subsidies (3,808) (3,919) (2,822)
Borrowing costs .. .. ..
Other 26,32 (6,294) (11,267) (11,337)
Net cash provided by or used in operating activities 72,560 66,872 68,343
CASH FLOWS FROM INVESTING ACTIVITIES
Inflows:
Sales of non-financial assets .. .. ..
Investments redeemed .. .. ..
Loans and advances redeemed .. .. ..
Outflows:
Payments for non-financial assets 27,33,36 (39,742) (49,470) (30,527)
Payments for investments .. .. ..
Loans and advances made .. .. ..
Net cash provided by or used in investing activities (39,742) (49,470) (30,527)
CASH FLOWS FROM FINANCING ACTIVITIES
Inflows:
Borrowings .. .. ..
Equity injections 28,37 39,742 34,787 17,282
Outflows:
Borrowing redemptions .. .. ..
Finance lease payments .. .. ..
Equity withdrawals (67,171) (71,917) (74,332)
Net cash provided by or used in financing activities (27,429) (37,130) (57,050)
Net increase/(decrease) in cash held 5,389 (19,728) (19,234)
Cash at the beginning of financial year 131,159 132,301 112,573
Cash transfers from restructure .. .. ..
Cash at the end of financial year 136,548 112,573 93,339
2016-17 Queensland State Budget – Service Delivery Statements – Metro South Hospital and Health Service 134
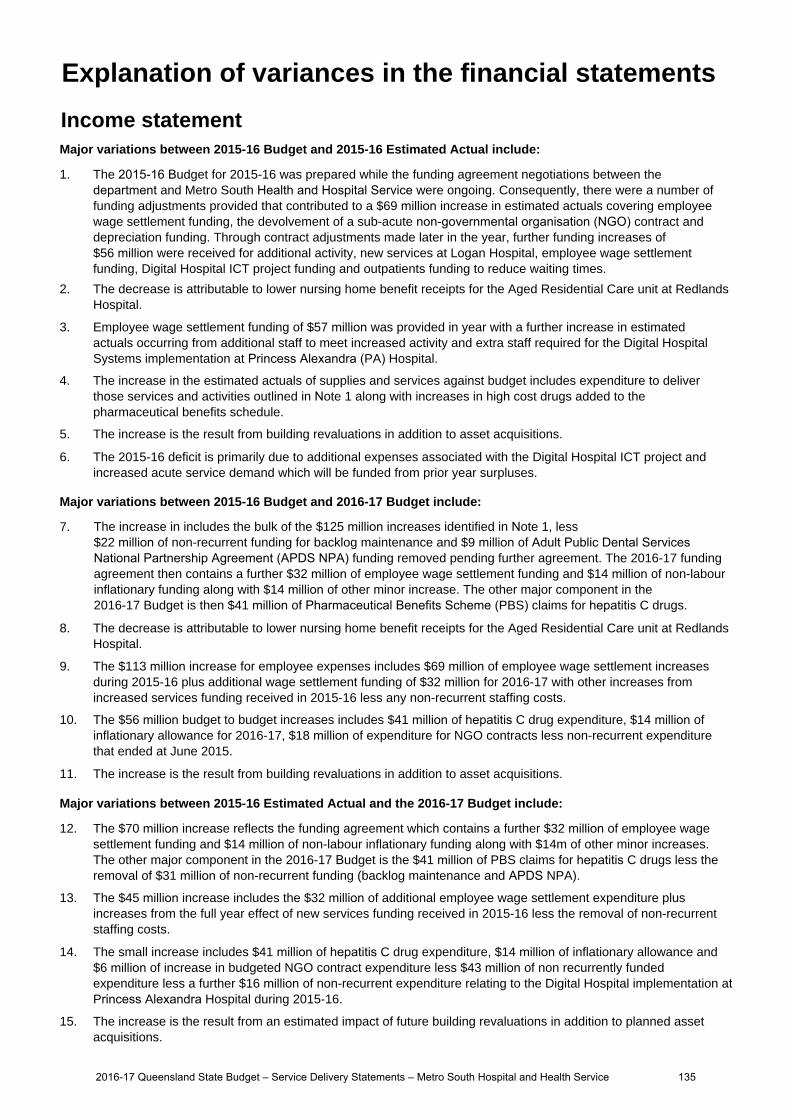
Income statementMajor variations between 2015-16 Budget and 2015-16 Estimated Actual include:
1. The 2015-16 Budget for 2015-16 was prepared while the funding agreement negotiations between the department and Metro South Health and Hospital Service were ongoing. Consequently, there were a number of funding adjustments provided that contributed to a $69 million increase in estimated actuals covering employee wage settlement funding, the devolvement of a sub-acute non-governmental organisation (NGO) contract and depreciation funding. Through contract adjustments made later in the year, further funding increases of $56 million were received for additional activity, new services at Logan Hospital, employee wage settlement funding, Digital Hospital ICT project funding and outpatients funding to reduce waiting times.
2. The decrease is attributable to lower nursing home benefit receipts for the Aged Residential Care unit at RedlandsHospital.
3. Employee wage settlement funding of $57 million was provided in year with a further increase in estimatedactuals occurring from additional staff to meet increased activity and extra staff required for the Digital HospitalSystems implementation at Princess Alexandra (PA) Hospital.
4. The increase in the estimated actuals of supplies and services against budget includes expenditure to deliver those services and activities outlined in Note 1 along with increases in high cost drugs added to the pharmaceutical benefits schedule.
5. The increase is the result from building revaluations in addition to asset acquisitions.
6. The 2015-16 deficit is primarily due to additional expenses associated with the Digital Hospital ICT project andincreased acute service demand which will be funded from prior year surpluses.
Major variations between 2015-16 Budget and 2016-17 Budget include:
7. The increase in includes the bulk of the $125 million increases identified in Note 1, less$22 million of non-recurrent funding for backlog maintenance and $9 million of Adult Public Dental Services National Partnership Agreement (APDS NPA) funding removed pending further agreement. The 2016-17 funding agreement then contains a further $32 million of employee wage settlement funding and $14 million of non-labour inflationary funding along with $14 million of other minor increase. The other major component in the 2016-17 Budget is then $41 million of Pharmaceutical Benefits Scheme (PBS) claims for hepatitis C drugs.
8. The decrease is attributable to lower nursing home benefit receipts for the Aged Residential Care unit at RedlandsHospital.
9. The $113 million increase for employee expenses includes $69 million of employee wage settlement increasesduring 2015-16 plus additional wage settlement funding of $32 million for 2016-17 with other increases fromincreased services funding received in 2015-16 less any non-recurrent staffing costs.
10. The $56 million budget to budget increases includes $41 million of hepatitis C drug expenditure, $14 million of inflationary allowance for 2016-17, $18 million of expenditure for NGO contracts less non-recurrent expenditure that ended at June 2015.
11. The increase is the result from building revaluations in addition to asset acquisitions.
Major variations between 2015-16 Estimated Actual and the 2016-17 Budget include:
12. The $70 million increase reflects the funding agreement which contains a further $32 million of employee wagesettlement funding and $14 million of non-labour inflationary funding along with $14m of other minor increases.The other major component in the 2016-17 Budget is the $41 million of PBS claims for hepatitis C drugs less theremoval of $31 million of non-recurrent funding (backlog maintenance and APDS NPA).
13. The $45 million increase includes the $32 million of additional employee wage settlement expenditure plusincreases from the full year effect of new services funding received in 2015-16 less the removal of non-recurrentstaffing costs.
14. The small increase includes $41 million of hepatitis C drug expenditure, $14 million of inflationary allowance and$6 million of increase in budgeted NGO contract expenditure less $43 million of non recurrently funded expenditure less a further $16 million of non-recurrent expenditure relating to the Digital Hospital implementation at Princess Alexandra Hospital during 2015-16.
15. The increase is the result from an estimated impact of future building revaluations in addition to planned assetacquisitions.
Explanation of variances in the financial statements
2016-17 Queensland State Budget – Service Delivery Statements – Metro South Hospital and Health Service 135
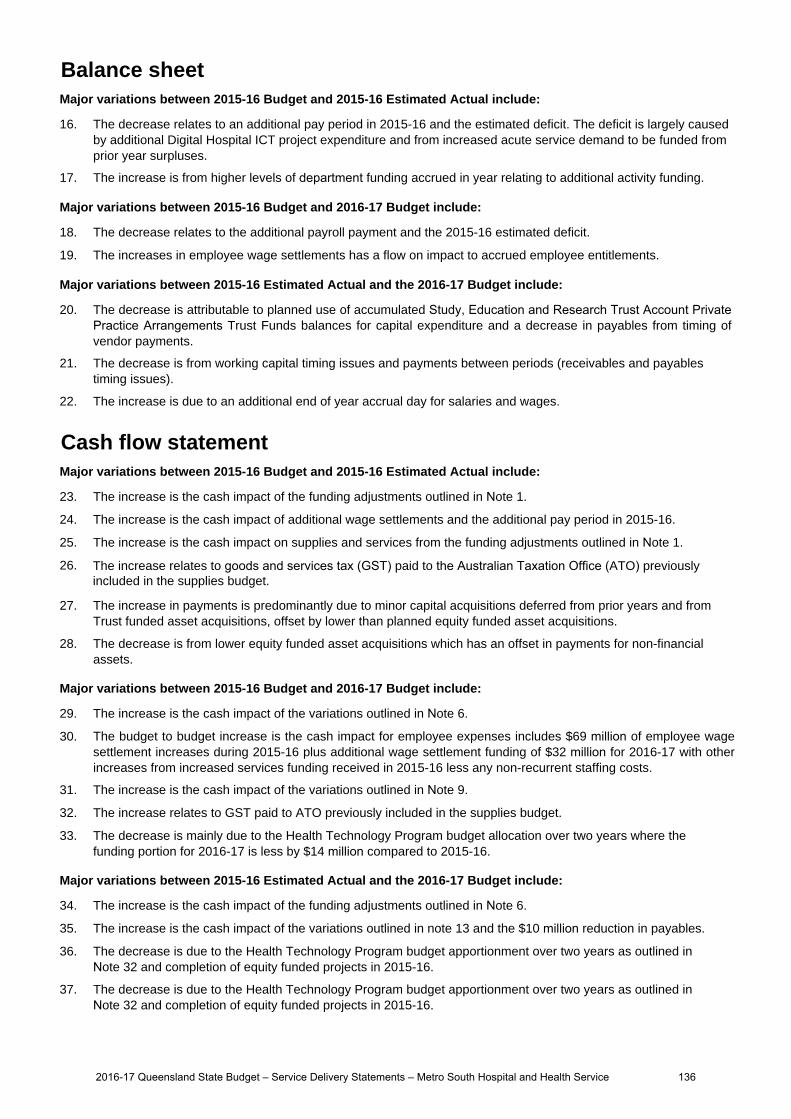
Balance sheetMajor variations between 2015-16 Budget and 2015-16 Estimated Actual include:
16. The decrease relates to an additional pay period in 2015-16 and the estimated deficit. The deficit is largely causedby additional Digital Hospital ICT project expenditure and from increased acute service demand to be funded fromprior year surpluses.
17. The increase is from higher levels of department funding accrued in year relating to additional activity funding.
Major variations between 2015-16 Budget and 2016-17 Budget include:
18. The decrease relates to the additional payroll payment and the 2015-16 estimated deficit.
19. The increases in employee wage settlements has a flow on impact to accrued employee entitlements.
Major variations between 2015-16 Estimated Actual and the 2016-17 Budget include:
20. The decrease is attributable to planned use of accumulated Study, Education and Research Trust Account Private Practice Arrangements Trust Funds balances for capital expenditure and a decrease in payables from timing of vendor payments.
21. The decrease is from working capital timing issues and payments between periods (receivables and payablestiming issues).
22. The increase is due to an additional end of year accrual day for salaries and wages.
Cash flow statementMajor variations between 2015-16 Budget and 2015-16 Estimated Actual include:
23. The increase is the cash impact of the funding adjustments outlined in Note 1.
24. The increase is the cash impact of additional wage settlements and the additional pay period in 2015-16.
25. The increase is the cash impact on supplies and services from the funding adjustments outlined in Note 1.
26. The increase relates to goods and services tax (GST) paid to the Australian Taxation Office (ATO) previouslyincluded in the supplies budget.
27. The increase in payments is predominantly due to minor capital acquisitions deferred from prior years and fromTrust funded asset acquisitions, offset by lower than planned equity funded asset acquisitions.
28. The decrease is from lower equity funded asset acquisitions which has an offset in payments for non-financialassets.
Major variations between 2015-16 Budget and 2016-17 Budget include:
29. The increase is the cash impact of the variations outlined in Note 6.
30. The budget to budget increase is the cash impact for employee expenses includes $69 million of employee wagesettlement increases during 2015-16 plus additional wage settlement funding of $32 million for 2016-17 with otherincreases from increased services funding received in 2015-16 less any non-recurrent staffing costs.
31. The increase is the cash impact of the variations outlined in Note 9.
32. The increase relates to GST paid to ATO previously included in the supplies budget.
33. The decrease is mainly due to the Health Technology Program budget allocation over two years where thefunding portion for 2016-17 is less by $14 million compared to 2015-16.
Major variations between 2015-16 Estimated Actual and the 2016-17 Budget include:
34. The increase is the cash impact of the funding adjustments outlined in Note 6.
35. The increase is the cash impact of the variations outlined in note 13 and the $10 million reduction in payables.
36. The decrease is due to the Health Technology Program budget apportionment over two years as outlined in Note 32 and completion of equity funded projects in 2015-16.
37. The decrease is due to the Health Technology Program budget apportionment over two years as outlined in Note 32 and completion of equity funded projects in 2015-16.
2016-17 Queensland State Budget – Service Delivery Statements – Metro South Hospital and Health Service 136
North West Hospital and Health Service
Overview
The North West Hospital and Health Service (HHS) is an independent statutory body overseen by a local Hospital and Health Board. The North West HHS is responsible for the delivery of public hospital and health services including medical, surgical, emergency, obstetrics, paediatrics, specialist outpatient clinics, mental health, critical care and clinical support services to a population of around 34,000 people residing in a geographical area within north western Queensland and the Gulf of Carpentaria including Mount Isa, Burketown, Camooweal, Cloncurry, Dajarra, Doomadgee, Julia Creek, Karumba, Mornington Island, Normanton and Urandangi. The North West HHS is responsible for the direct management of the facilities within the HHS’s geographical boundaries including its main referral centre, the Mount Isa Hospital:
Burketown Health Centre Karumba Hospital
Camooweal Health Centre Mornington Island Primary Health Care Centre
Cloncurry Hospital McKinlay Shire Multi Purpose Health Service
Dajarra Hospital Mount Isa Hospital
Doomadgee Hospital Normanton Hospital
Julia Creek Hospital
Due to the distances between North West HHS facilities and some communities within the area of responsibility, a number of service agreements exist with adjoining HHSs to provide services to these communities.
The North West HHS provides a comprehensive range of community and primary health services, including aged care assessment, Aboriginal and Torres Strait Islander health programs; child and maternal health services; alcohol, tobacco and other drug services; home care services; community health nursing, sexual health service, allied health, oral health and health promotion programs.
North West HHS has five strategic priorities, each mapped to service objectives, as outlined below:
Strategic Priority Objective
Safe, quality service delivery throughcontinuous improvement
We will provide excellent quality, evidence-based and safeservices that are well coordinated, efficient andsustainable
A highly skilled, motivated and engagedworkforce which continually strives to improvepatient care and HHS performance
We will support and develop our people to perform at theirbest
Strong partnerships which build betterintegrated and streamlined services
We will work with our service partners and localcommunities to ensure access to health services acrossthe spectrum with a focus on identified regional priorities
An environment that supports innovation,technology and research
We will support innovative thinking and ideas that supportus to achieve our vision
An accountable, responsible and stable HHS We will effectively meet our statutory requirements throughgood governance principles.
Service summary
The North West HHS has an operating budget of $156.3 million for 2016-17 which is an increase of $7.5 million (five per cent) from the published 2015-16 operating budget of $148.8 million.
The Service Agreement between the North West HHS and the department identifies the services to be provided, the funding arrangements for those services and defined performance indicators and targets to ensure outputs and outcomes are achieved.
North West HHS made considerable achievements against its strategic objectives in 2015-16 including:
achieving the Queensland Emergency Access Target with 90 per cent of patients treated and discharged within fourhours
2016-17 Queensland State Budget – Service Delivery Statements – North West Hospital and Health Service 137
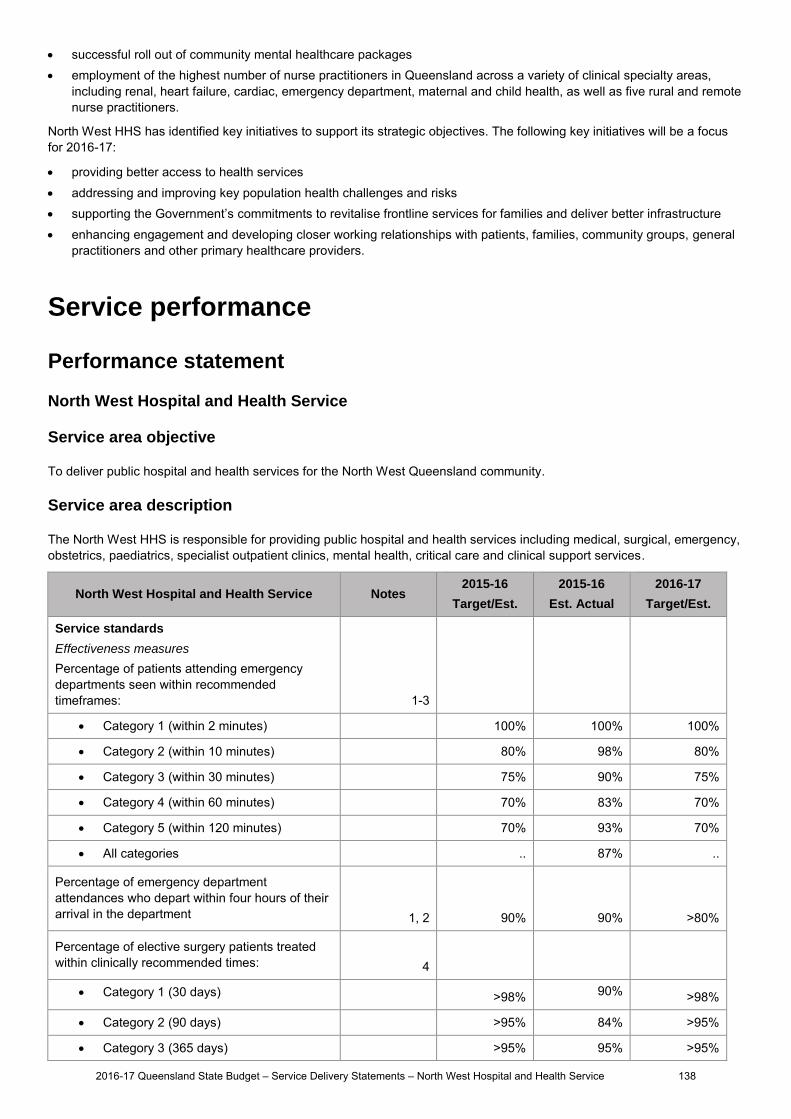
successful roll out of community mental healthcare packages employment of the highest number of nurse practitioners in Queensland across a variety of clinical specialty areas,
including renal, heart failure, cardiac, emergency department, maternal and child health, as well as five rural and remotenurse practitioners.
North West HHS has identified key initiatives to support its strategic objectives. The following key initiatives will be a focus for 2016-17:
providing better access to health services addressing and improving key population health challenges and risks supporting the Government’s commitments to revitalise frontline services for families and deliver better infrastructure enhancing engagement and developing closer working relationships with patients, families, community groups, general
practitioners and other primary healthcare providers.
Service performance
Performance statement
North West Hospital and Health Service
Service area objective
To deliver public hospital and health services for the North West Queensland community.
Service area description
The North West HHS is responsible for providing public hospital and health services including medical, surgical, emergency, obstetrics, paediatrics, specialist outpatient clinics, mental health, critical care and clinical support services.
North West Hospital and Health Service Notes 2015-16
Target/Est.
2015-16
Est. Actual
2016-17
Target/Est.
Service standards
Effectiveness measures
Percentage of patients attending emergency departments seen within recommended timeframes: 1-3
Category 1 (within 2 minutes) 100% 100% 100%
Category 2 (within 10 minutes) 80% 98% 80%
Category 3 (within 30 minutes) 75% 90% 75%
Category 4 (within 60 minutes) 70% 83% 70%
Category 5 (within 120 minutes) 70% 93% 70%
All categories .. 87% ..
Percentage of emergency department attendances who depart within four hours of their arrival in the department 1, 2 90% 90% >80%
Percentage of elective surgery patients treated within clinically recommended times: 4
Category 1 (30 days) >98% 90% >98%
Category 2 (90 days) >95% 84% >95%
Category 3 (365 days) >95% 95% >95%
2016-17 Queensland State Budget – Service Delivery Statements – North West Hospital and Health Service 138
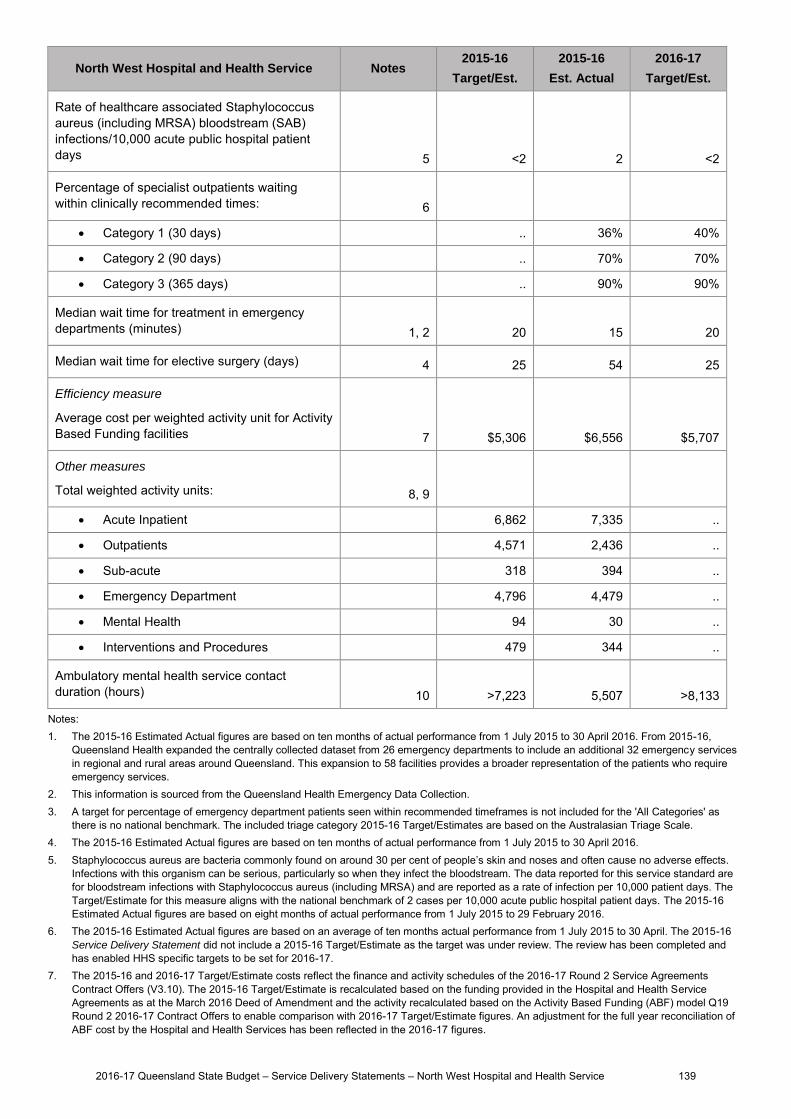
North West Hospital and Health Service Notes 2015-16
Target/Est.
2015-16
Est. Actual
2016-17
Target/Est.
Rate of healthcare associated Staphylococcus aureus (including MRSA) bloodstream (SAB) infections/10,000 acute public hospital patient days 5 <2 2 <2
Percentage of specialist outpatients waiting within clinically recommended times: 6
Category 1 (30 days) .. 36% 40%
Category 2 (90 days) .. 70% 70%
Category 3 (365 days) .. 90% 90%
Median wait time for treatment in emergency departments (minutes) 1, 2 20 15 20
Median wait time for elective surgery (days) 4 25 54 25
Efficiency measure
Average cost per weighted activity unit for Activity Based Funding facilities 7 $5,306 $6,556 $5,707
Other measures
Total weighted activity units: 8, 9
Acute Inpatient 6,862 7,335 ..
Outpatients 4,571 2,436 ..
Sub-acute 318 394 ..
Emergency Department 4,796 4,479 ..
Mental Health 94 30 ..
Interventions and Procedures 479 344 ..
Ambulatory mental health service contact duration (hours) 10 >7,223 5,507 >8,133
Notes: 1. The 2015-16 Estimated Actual figures are based on ten months of actual performance from 1 July 2015 to 30 April 2016. From 2015-16,
Queensland Health expanded the centrally collected dataset from 26 emergency departments to include an additional 32 emergency services in regional and rural areas around Queensland. This expansion to 58 facilities provides a broader representation of the patients who require emergency services.
2. This information is sourced from the Queensland Health Emergency Data Collection.3. A target for percentage of emergency department patients seen within recommended timeframes is not included for the 'All Categories' as
there is no national benchmark. The included triage category 2015-16 Target/Estimates are based on the Australasian Triage Scale.4. The 2015-16 Estimated Actual figures are based on ten months of actual performance from 1 July 2015 to 30 April 2016.5. Staphylococcus aureus are bacteria commonly found on around 30 per cent of people’s skin and noses and often cause no adverse effects.
Infections with this organism can be serious, particularly so when they infect the bloodstream. The data reported for this service standard arefor bloodstream infections with Staphylococcus aureus (including MRSA) and are reported as a rate of infection per 10,000 patient days. TheTarget/Estimate for this measure aligns with the national benchmark of 2 cases per 10,000 acute public hospital patient days. The 2015-16Estimated Actual figures are based on eight months of actual performance from 1 July 2015 to 29 February 2016.
6. The 2015-16 Estimated Actual figures are based on an average of ten months actual performance from 1 July 2015 to 30 April. The 2015-16Service Delivery Statement did not include a 2015-16 Target/Estimate as the target was under review. The review has been completed andhas enabled HHS specific targets to be set for 2016-17.
7. The 2015-16 and 2016-17 Target/Estimate costs reflect the finance and activity schedules of the 2016-17 Round 2 Service AgreementsContract Offers (V3.10). The 2015-16 Target/Estimate is recalculated based on the funding provided in the Hospital and Health ServiceAgreements as at the March 2016 Deed of Amendment and the activity recalculated based on the Activity Based Funding (ABF) model Q19Round 2 2016-17 Contract Offers to enable comparison with 2016-17 Target/Estimate figures. An adjustment for the full year reconciliation ofABF cost by the Hospital and Health Services has been reflected in the 2016-17 figures.
2016-17 Queensland State Budget – Service Delivery Statements – North West Hospital and Health Service 139
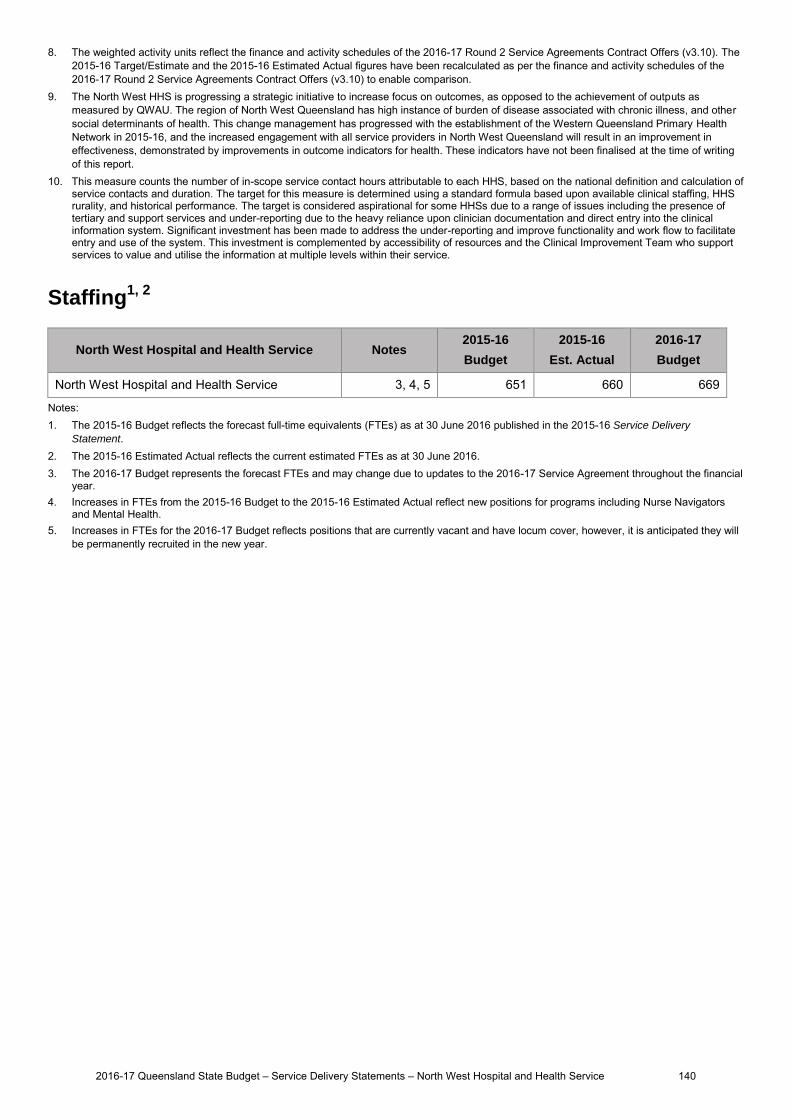
8. The weighted activity units reflect the finance and activity schedules of the 2016-17 Round 2 Service Agreements Contract Offers (v3.10). The2015-16 Target/Estimate and the 2015-16 Estimated Actual figures have been recalculated as per the finance and activity schedules of the2016-17 Round 2 Service Agreements Contract Offers (v3.10) to enable comparison.
9. The North West HHS is progressing a strategic initiative to increase focus on outcomes, as opposed to the achievement of outputs asmeasured by QWAU. The region of North West Queensland has high instance of burden of disease associated with chronic illness, and othersocial determinants of health. This change management has progressed with the establishment of the Western Queensland Primary HealthNetwork in 2015-16, and the increased engagement with all service providers in North West Queensland will result in an improvement ineffectiveness, demonstrated by improvements in outcome indicators for health. These indicators have not been finalised at the time of writingof this report.
10. This measure counts the number of in-scope service contact hours attributable to each HHS, based on the national definition and calculation ofservice contacts and duration. The target for this measure is determined using a standard formula based upon available clinical staffing, HHSrurality, and historical performance. The target is considered aspirational for some HHSs due to a range of issues including the presence oftertiary and support services and under-reporting due to the heavy reliance upon clinician documentation and direct entry into the clinicalinformation system. Significant investment has been made to address the under-reporting and improve functionality and work flow to facilitateentry and use of the system. This investment is complemented by accessibility of resources and the Clinical Improvement Team who supportservices to value and utilise the information at multiple levels within their service.
Staffing1, 2
North West Hospital and Health Service Notes 2015-16
Budget
2015-16
Est. Actual
2016-17
Budget
North West Hospital and Health Service 3, 4, 5 651 660 669
Notes: 1. The 2015-16 Budget reflects the forecast full-time equivalents (FTEs) as at 30 June 2016 published in the 2015-16 Service Delivery
Statement. 2. The 2015-16 Estimated Actual reflects the current estimated FTEs as at 30 June 2016.3. The 2016-17 Budget represents the forecast FTEs and may change due to updates to the 2016-17 Service Agreement throughout the financial
year.4. Increases in FTEs from the 2015-16 Budget to the 2015-16 Estimated Actual reflect new positions for programs including Nurse Navigators
and Mental Health.5. Increases in FTEs for the 2016-17 Budget reflects positions that are currently vacant and have locum cover, however, it is anticipated they will
be permanently recruited in the new year.
2016-17 Queensland State Budget – Service Delivery Statements – North West Hospital and Health Service 140
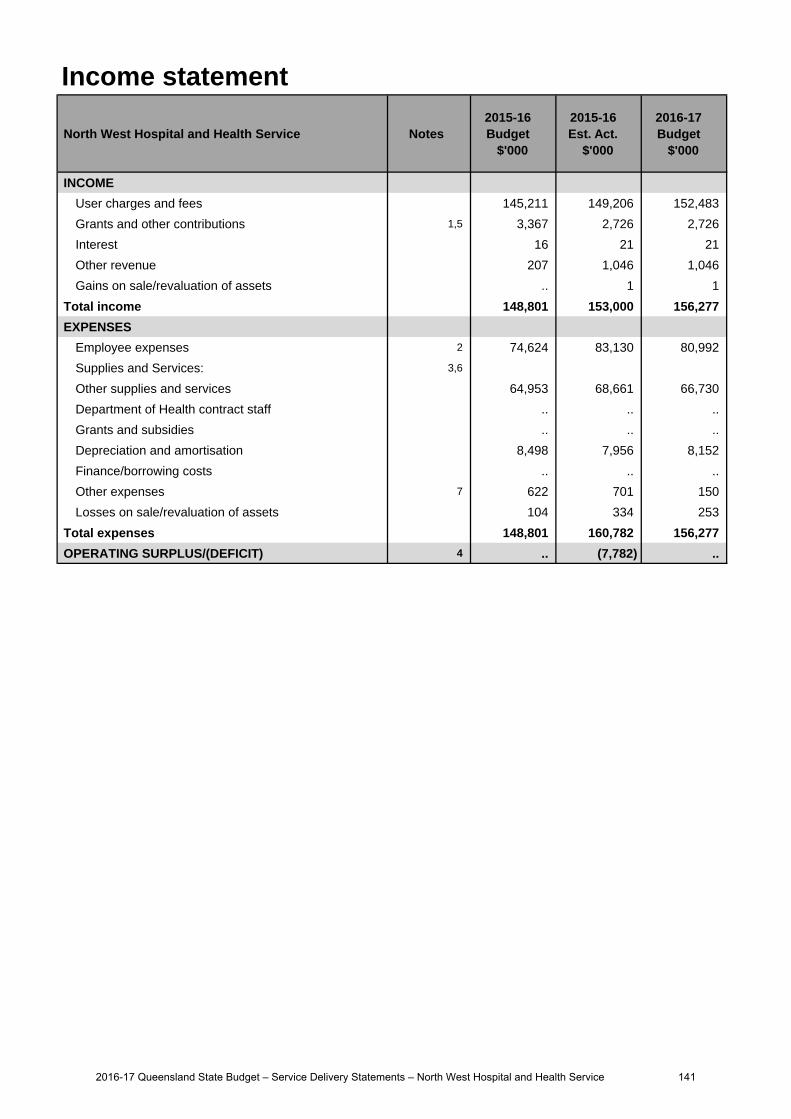
Income statement
North West Hospital and Health Service Notes 2015-16 Budget
$'000
2015-16 Est. Act.
$'000
2016-17 Budget
$'000
INCOME
User charges and fees 145,211 149,206 152,483
Grants and other contributions 1,5 3,367 2,726 2,726
Interest 16 21 21
Other revenue 207 1,046 1,046
Gains on sale/revaluation of assets .. 1 1
Total income 148,801 153,000 156,277
EXPENSES
Employee expenses 2 74,624 83,130 80,992
Supplies and Services: 3,6
Other supplies and services 64,953 68,661 66,730
Department of Health contract staff .. .. ..
Grants and subsidies .. .. ..
Depreciation and amortisation 8,498 7,956 8,152
Finance/borrowing costs .. .. ..
Other expenses 7 622 701 150
Losses on sale/revaluation of assets 104 334 253
Total expenses 148,801 160,782 156,277
OPERATING SURPLUS/(DEFICIT) 4 .. (7,782) ..
2016-17 Queensland State Budget – Service Delivery Statements – North West Hospital and Health Service 141
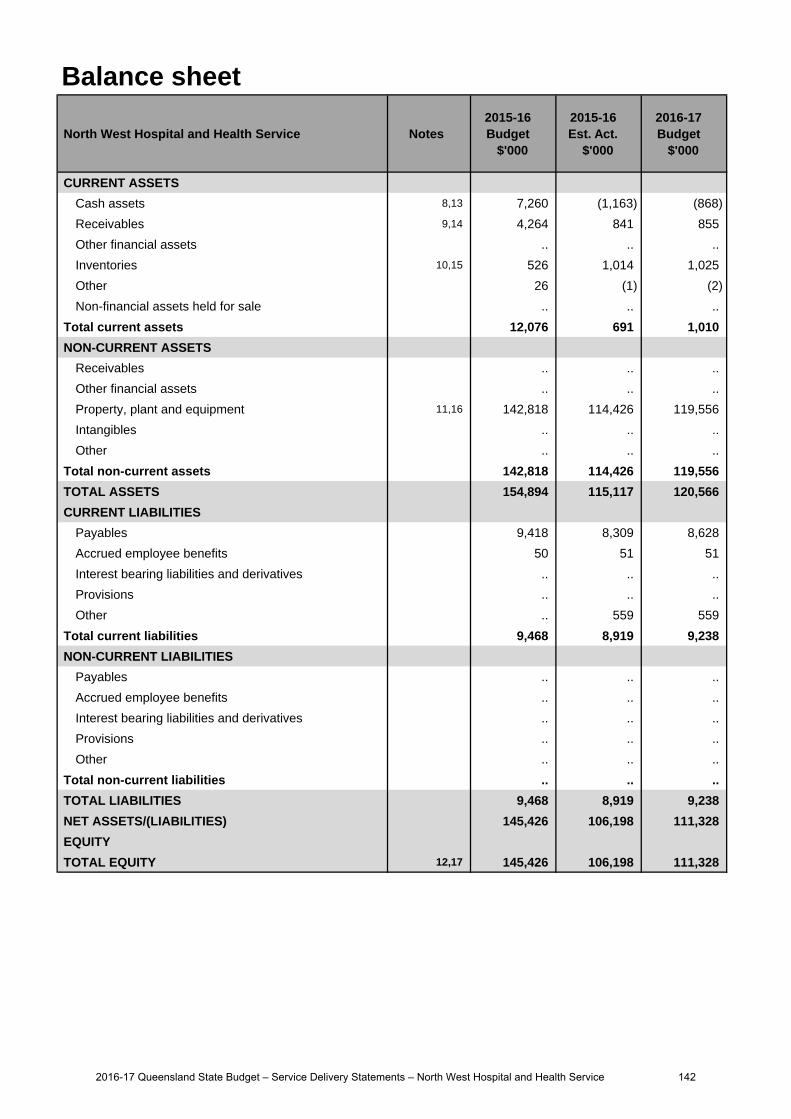
Balance sheet
North West Hospital and Health Service Notes 2015-16 Budget
$'000
2015-16 Est. Act.
$'000
2016-17 Budget
$'000
CURRENT ASSETS
Cash assets 8,13 7,260 (1,163) (868)
Receivables 9,14 4,264 841 855
Other financial assets .. .. ..
Inventories 10,15 526 1,014 1,025
Other 26 (1) (2)
Non-financial assets held for sale .. .. ..
Total current assets 12,076 691 1,010
NON-CURRENT ASSETS
Receivables .. .. ..
Other financial assets .. .. ..
Property, plant and equipment 11,16 142,818 114,426 119,556
Intangibles .. .. ..
Other .. .. ..
Total non-current assets 142,818 114,426 119,556
TOTAL ASSETS 154,894 115,117 120,566
CURRENT LIABILITIES
Payables 9,418 8,309 8,628
Accrued employee benefits 50 51 51
Interest bearing liabilities and derivatives .. .. ..
Provisions .. .. ..
Other .. 559 559
Total current liabilities 9,468 8,919 9,238
NON-CURRENT LIABILITIES
Payables .. .. ..
Accrued employee benefits .. .. ..
Interest bearing liabilities and derivatives .. .. ..
Provisions .. .. ..
Other .. .. ..
Total non-current liabilities .. .. ..
TOTAL LIABILITIES 9,468 8,919 9,238
NET ASSETS/(LIABILITIES) 145,426 106,198 111,328
EQUITY
TOTAL EQUITY 12,17 145,426 106,198 111,328
2016-17 Queensland State Budget – Service Delivery Statements – North West Hospital and Health Service 142

Cash flow statement
North West Hospital and Health Service Notes 2015-16 Budget
$'000
2015-16 Est. Act.
$'000
2016-17 Budget
$'000
CASH FLOWS FROM OPERATING ACTIVITIES
Inflows:
User charges and fees 145,160 150,086 152,284
Grants and other contributions 18,22 3,367 2,726 2,726
Interest received 16 21 21
Other 4,438 5,277 5,277
Outflows:
Employee costs 19 (74,624) (85,598) (80,992)
Supplies and services (71,998) (71,931) (70,720)
Grants and subsidies .. .. ..
Borrowing costs .. .. ..
Other 23,24 (622) (701) (150)
Net cash provided by or used in operating activities 5,737 (120) 8,446
CASH FLOWS FROM INVESTING ACTIVITIES
Inflows:
Sales of non-financial assets .. 1 1
Investments redeemed .. .. ..
Loans and advances redeemed .. .. ..
Outflows:
Payments for non-financial assets 20 (1,498) (14,524) (1,218)
Payments for investments .. .. ..
Loans and advances made .. .. ..
Net cash provided by or used in investing activities (1,498) (14,523) (1,217)
CASH FLOWS FROM FINANCING ACTIVITIES
Inflows:
Borrowings .. .. ..
Equity injections 21,25 1,498 13,589 1,218
Outflows:
Borrowing redemptions .. .. ..
Finance lease payments .. .. ..
Equity withdrawals (8,498) (7,956) (8,152)
Net cash provided by or used in financing activities (7,000) 5,633 (6,934)
Net increase/(decrease) in cash held (2,761) (9,010) 295
Cash at the beginning of financial year 10,021 7,847 (1,163)
Cash transfers from restructure .. .. ..
Cash at the end of financial year 7,260 (1,163) (868)
2016-17 Queensland State Budget – Service Delivery Statements – North West Hospital and Health Service 143
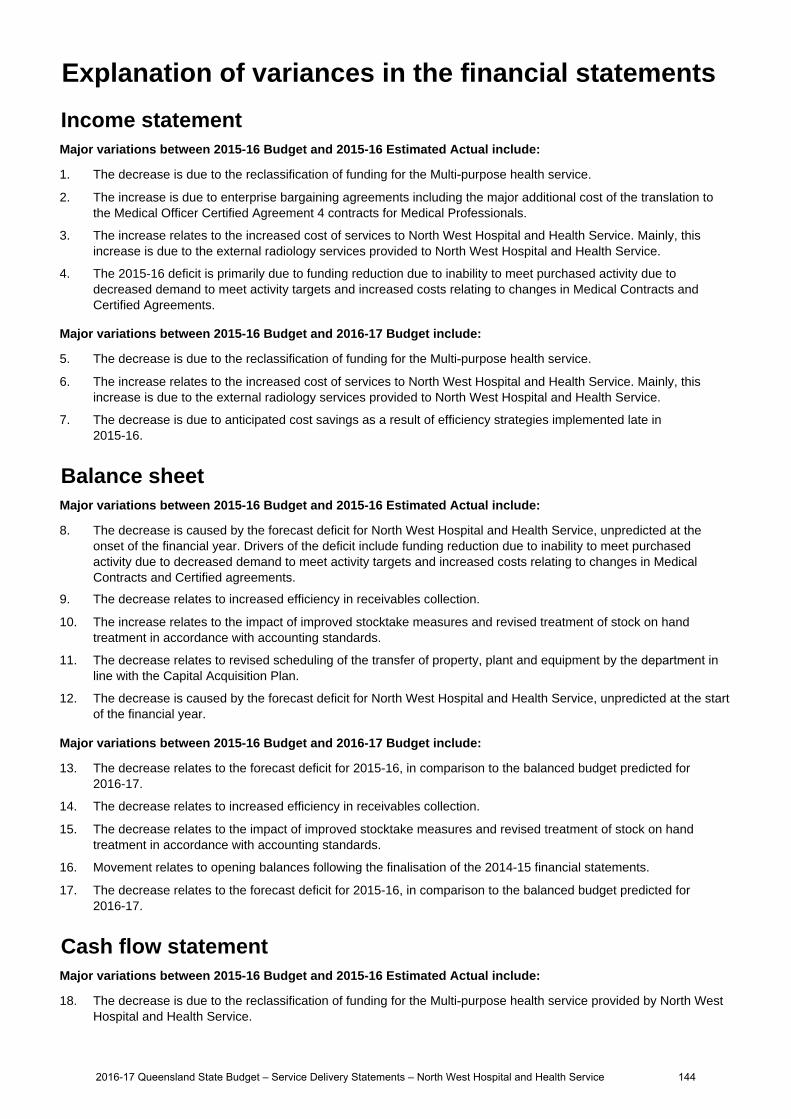
Income statementMajor variations between 2015-16 Budget and 2015-16 Estimated Actual include:
1. The decrease is due to the reclassification of funding for the Multi-purpose health service.
2. The increase is due to enterprise bargaining agreements including the major additional cost of the translation tothe Medical Officer Certified Agreement 4 contracts for Medical Professionals.
3. The increase relates to the increased cost of services to North West Hospital and Health Service. Mainly, thisincrease is due to the external radiology services provided to North West Hospital and Health Service.
4. The 2015-16 deficit is primarily due to funding reduction due to inability to meet purchased activity due todecreased demand to meet activity targets and increased costs relating to changes in Medical Contracts andCertified Agreements.
Major variations between 2015-16 Budget and 2016-17 Budget include:
5. The decrease is due to the reclassification of funding for the Multi-purpose health service.
6. The increase relates to the increased cost of services to North West Hospital and Health Service. Mainly, thisincrease is due to the external radiology services provided to North West Hospital and Health Service.
7. The decrease is due to anticipated cost savings as a result of efficiency strategies implemented late in 2015-16.
Balance sheetMajor variations between 2015-16 Budget and 2015-16 Estimated Actual include:
8. The decrease is caused by the forecast deficit for North West Hospital and Health Service, unpredicted at theonset of the financial year. Drivers of the deficit include funding reduction due to inability to meet purchasedactivity due to decreased demand to meet activity targets and increased costs relating to changes in MedicalContracts and Certified agreements.
9. The decrease relates to increased efficiency in receivables collection.
10. The increase relates to the impact of improved stocktake measures and revised treatment of stock on handtreatment in accordance with accounting standards.
11. The decrease relates to revised scheduling of the transfer of property, plant and equipment by the department inline with the Capital Acquisition Plan.
12. The decrease is caused by the forecast deficit for North West Hospital and Health Service, unpredicted at the startof the financial year.
Major variations between 2015-16 Budget and 2016-17 Budget include:
13. The decrease relates to the forecast deficit for 2015-16, in comparison to the balanced budget predicted for2016-17.
14. The decrease relates to increased efficiency in receivables collection.
15. The decrease relates to the impact of improved stocktake measures and revised treatment of stock on handtreatment in accordance with accounting standards.
16. Movement relates to opening balances following the finalisation of the 2014-15 financial statements.
17. The decrease relates to the forecast deficit for 2015-16, in comparison to the balanced budget predicted for2016-17.
Cash flow statementMajor variations between 2015-16 Budget and 2015-16 Estimated Actual include:
18. The decrease is due to the reclassification of funding for the Multi-purpose health service provided by North WestHospital and Health Service.
Explanation of variances in the financial statements
2016-17 Queensland State Budget – Service Delivery Statements – North West Hospital and Health Service 144
19. The increase is due to enterprise bargaining agreements including the major additional cost of the translation tothe Medical Officer Certified Agreement 4 contracts for Medical Professionals.
20. The increase is caused by the investment in the Mount Isa Campus Redevelopment.
21. The increase is caused by funding received for the Mount Isa Campus Redevelopment.
Major variations between 2015-16 Budget and 2016-17 Budget include:
22. The decrease is due to the reclassification of funding for the Multi purpose health service.
23. The decrease is due to anticipated cost savings as a result of efficiency strategies implemented late in 2015-16.
Major variations between 2015-16 Estimated Actual and the 2016-17 Budget include:
24. The decrease is due to anticipated cost savings as a result of efficiency strategies implemented late in 2015-16.
25. The decrease is due to non-current capital funding received in 2015-16 for the for the Mount IsaCampus Redevelopment capital project.
2016-17 Queensland State Budget – Service Delivery Statements – North West Hospital and Health Service 145

South West Hospital and Health Service
Overview
The South West Hospital and Health Service (HHS) is an independent statutory body overseen by a local Hospital and Health Board. The South West HHS is responsible for the delivery of public hospital and health services including medical, surgical, emergency, obstetrics, paediatrics, specialist outpatient clinics, mental health, critical care and clinical support services to a population of approximately 26,000 residing over 319,000 square kilometres including the three main centres, Roma, Charleville and St George, and the surrounding areas of Augathella, Bollon, Cunnamulla, Dirranbandi, Injune, Mitchell, Morven, Mungindi, Quilpie, Surat, Thargomindah and Wallumbilla.
The South West HHS is responsible for the direct management of the facilities and services within the HHS’s geographical boundaries including its four hospitals at Charleville, Cunnamulla, Roma and St George. It also manages Multi-Purpose Health Services (MPHSs), two aged care facilities and other health facilities including:
Augathella MPHS Quilpie MPHS
Bollon Community Clinic Surat MPHS
Dirranbandi MPHS Thargomindah Community Clinic
Injune MPHS Wallumbilla Community Clinic
Mitchell MPHS Waroona Aged Care Facility
Morven Community Clinic Westhaven Aged Care Facility
Mungindi MPHS
Service summary
The South West HHS has an operating budget of $135.8 million for 2016-17 which is an increase of $8.9 million (7 per cent) from the published 2015-16 operating budget of $126.9 million.
The South West HHS contributes to the Queensland Government’s objectives for the community to deliver quality frontline services including strengthening the public health system and building safe, caring and connected communities.
Key strategic directions for South West HHS include:
Strengthening the workforce through implementing: Nursing Recognition Program nurse navigator roles across the HHS participation in the Queensland Health Emerging Clinical Leaders Course Aboriginal and Torres Strait Islander Liaison Roles for Roma, Charleville and St George Learning on Line Program. Greater investment in Preventative Health through implementing: an Integrated Health System via strategic partnerships with the primary health care sector HOPE (Harmony Opportunity Potential and Empowerment) Projects for Cunnamulla and Charleville integrated primary care centre services in Cunnamulla between South West HHS and Cunnamulla Aboriginal
Corporation for health Tele-Stroke model of care at Roma Hospital a Paediatric Development model of care in partnership with the Lady Cilento Children’s Hospital. Improving Patient Safety through progressing: planning works for essential upgrades to Roma Hospital new public surgical services of ophthalmology, urology and orthopaedics.
2016-17 Queensland State Budget – Service Delivery Statements – South West Hospital and Health Service 146
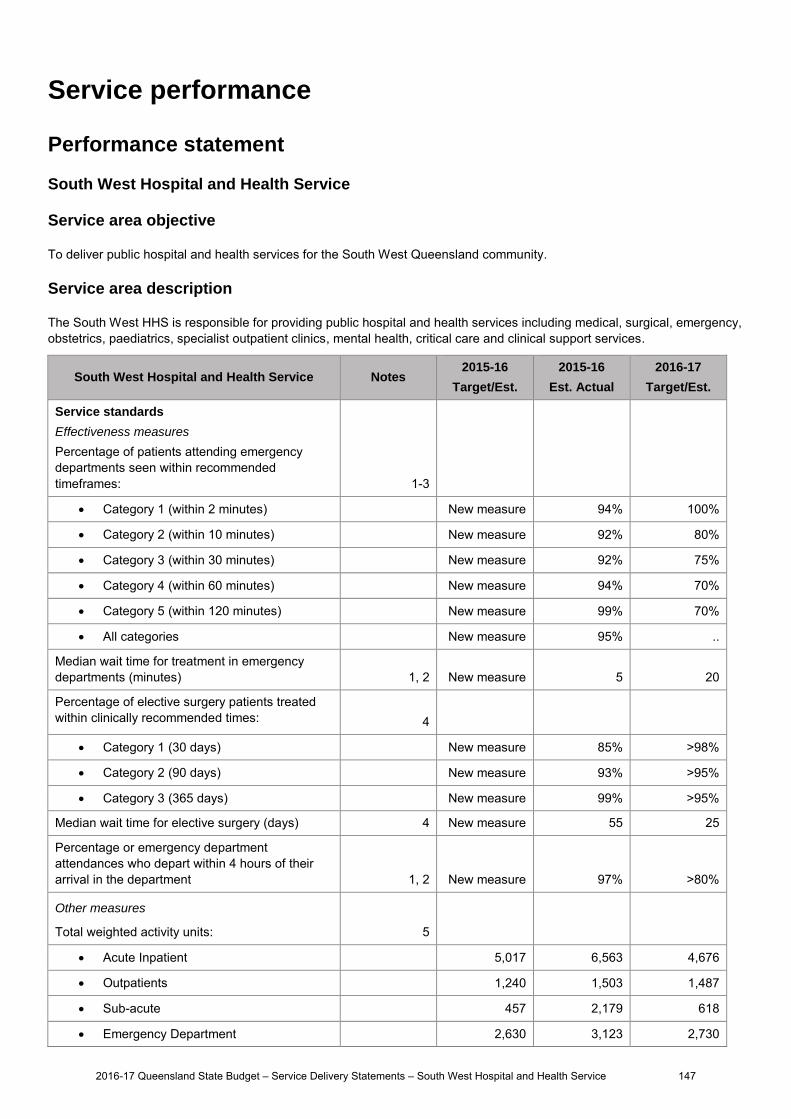
Service performance
Performance statement
South West Hospital and Health Service
Service area objective
To deliver public hospital and health services for the South West Queensland community.
Service area description
The South West HHS is responsible for providing public hospital and health services including medical, surgical, emergency, obstetrics, paediatrics, specialist outpatient clinics, mental health, critical care and clinical support services.
South West Hospital and Health Service Notes 2015-16
Target/Est.
2015-16
Est. Actual
2016-17
Target/Est.
Service standards
Effectiveness measures
Percentage of patients attending emergency departments seen within recommended timeframes:
1-3
Category 1 (within 2 minutes) New measure 94% 100%
Category 2 (within 10 minutes) New measure 92% 80%
Category 3 (within 30 minutes) New measure 92% 75%
Category 4 (within 60 minutes) New measure 94% 70%
Category 5 (within 120 minutes) New measure 99% 70%
All categories New measure 95% ..
Median wait time for treatment in emergency departments (minutes) 1, 2 New measure 5 20
Percentage of elective surgery patients treated within clinically recommended times:
4
Category 1 (30 days) New measure 85% >98%
Category 2 (90 days) New measure 93% >95%
Category 3 (365 days) New measure 99% >95%
Median wait time for elective surgery (days) 4 New measure 55 25
Percentage or emergency department attendances who depart within 4 hours of their arrival in the department 1, 2 New measure 97% >80%
Other measures
Total weighted activity units: 5
Acute Inpatient 5,017 6,563 4,676
Outpatients 1,240 1,503 1,487
Sub-acute 457 2,179 618
Emergency Department 2,630 3,123 2,730
2016-17 Queensland State Budget – Service Delivery Statements – South West Hospital and Health Service 147

South West Hospital and Health Service Notes 2015-16
Target/Est.
2015-16
Est. Actual
2016-17
Target/Est.
Mental Health 127 133 131
Interventions and Procedures 141 172 137
Ambulatory mental health service contact duration (hours) 6 >4,842 5,356 >5,410
Notes: 1. The 2015-16 Estimated Actual figures are based on ten months of actual performance from 1 July 2015 to 30 April 2016. From 2015-16,
Queensland Health expanded the centrally collected dataset from 26 emergency departments to include an additional 32 emergency services in regional and rural areas around Queensland. This expansion to 58 facilities provides a broader representation of the patients who require emergency services.
2. This information is sourced from the Queensland Health Emergency Data Collection. 3. A target for percentage of emergency department patients seen within recommended timeframes is not included for the 'All Categories' as
there is no national benchmark. The included triage category 2015-16 Target/Estimates are based on the Australasian Triage Scale. 4. The 2015-16 Estimated Actual figures are based on ten months of actual performance from 1 July 2015 to 30 April 2016. South West Hospital
and Health Service (Charleville, Roma & St George Hospitals) is now in scope for elective surgery reporting from 2015-16. 5. The weighted activity units reflect the finance and activity schedules of the 2016-17 Round 2 Service Agreements Contract Offers (v3.10). The
2015-16 Target/Estimate and the 2015-16 Estimated Actual figures have been recalculated as per the finance and activity schedules of the 2016-17 Round 2 Service Agreements Contract Offers (v3.10) to enable comparison.
6. This measure counts the number of in-scope service contact hours attributable to each HHS, based on the national definition and calculation of service contacts and duration. The target for this measure is determined using a standard formula based upon available clinical staffing, HHS rurality, and historical performance.
Staffing1, 2
South West Hospital and Health Service Notes 2015-16
Budget
2015-16
Est. Actual
2016-17
Budget
South West Hospital and Health Service 3, 4, 5 689 693 722
Notes: 1. The 2015-16 Budget reflects the forecast full-time equivalents (FTEs) as at 30 June 2016 published in the 2015-16 Service Delivery
Statement. 2. The 2015-16 Estimated Actual reflects the current estimated FTEs as at 30 June 2016. 3. The 2016-17 Budget represents the forecast FTEs and may change due to updates to the 2016-17 Service Agreement throughout the financial
year. 4. The 2016-17 Budget reflects the first stage of the internal budget process for FTEs at this point in the HHS budget cycle. This will be reviewed
internally and may change due to updates with the 2016-17 Service Agreement with the department throughout the financial year. 5. The increase of four FTEs from the 2015-16 Budget to the 2015-16 Estimated Actual was made in the Window adjustment process during the
2015-16 financial year.
2016-17 Queensland State Budget – Service Delivery Statements – South West Hospital and Health Service 148

Income statement
South West Hospital and Health Service Notes 2015-16 Budget
$'000
2015-16 Est. Act.
$'000
2016-17 Budget
$'000
INCOME
User charges and fees 1,6,11 114,797 123,205 127,952
Grants and other contributions 2,7 11,710 7,972 7,532
Interest 19 16 16
Other revenue 358 274 277
Gains on sale/revaluation of assets .. .. ..
Total income 126,884 131,467 135,777
EXPENSES
Employee expenses 7,388 7,931 8,118
Supplies and Services:
Other supplies and services 3,8,12 45,883 48,106 49,632
Department of Health contract staff 4,9,13 66,930 67,572 70,544
Grants and subsidies .. 49 ..
Depreciation and amortisation 5,10 5,595 6,536 6,319
Finance/borrowing costs .. .. ..
Other expenses 1,045 1,095 1,094
Losses on sale/revaluation of assets 43 178 70
Total expenses 126,884 131,467 135,777
OPERATING SURPLUS/(DEFICIT) .. .. ..
2016-17 Queensland State Budget – Service Delivery Statements – South West Hospital and Health Service 149
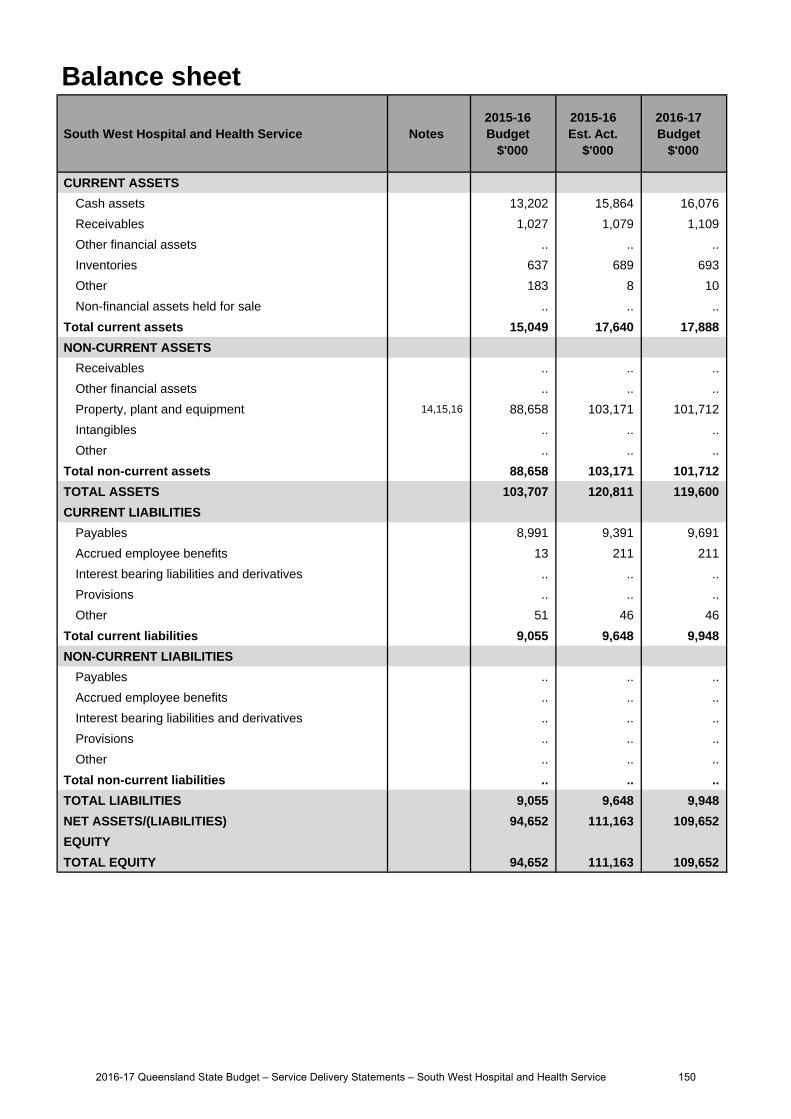
Balance sheet
South West Hospital and Health Service Notes 2015-16 Budget
$'000
2015-16 Est. Act.
$'000
2016-17 Budget
$'000
CURRENT ASSETS
Cash assets 13,202 15,864 16,076
Receivables 1,027 1,079 1,109
Other financial assets .. .. ..
Inventories 637 689 693
Other 183 8 10
Non-financial assets held for sale .. .. ..
Total current assets 15,049 17,640 17,888
NON-CURRENT ASSETS
Receivables .. .. ..
Other financial assets .. .. ..
Property, plant and equipment 14,15,16 88,658 103,171 101,712
Intangibles .. .. ..
Other .. .. ..
Total non-current assets 88,658 103,171 101,712
TOTAL ASSETS 103,707 120,811 119,600
CURRENT LIABILITIES
Payables 8,991 9,391 9,691
Accrued employee benefits 13 211 211
Interest bearing liabilities and derivatives .. .. ..
Provisions .. .. ..
Other 51 46 46
Total current liabilities 9,055 9,648 9,948
NON-CURRENT LIABILITIES
Payables .. .. ..
Accrued employee benefits .. .. ..
Interest bearing liabilities and derivatives .. .. ..
Provisions .. .. ..
Other .. .. ..
Total non-current liabilities .. .. ..
TOTAL LIABILITIES 9,055 9,648 9,948
NET ASSETS/(LIABILITIES) 94,652 111,163 109,652
EQUITY
TOTAL EQUITY 94,652 111,163 109,652
2016-17 Queensland State Budget – Service Delivery Statements – South West Hospital and Health Service 150
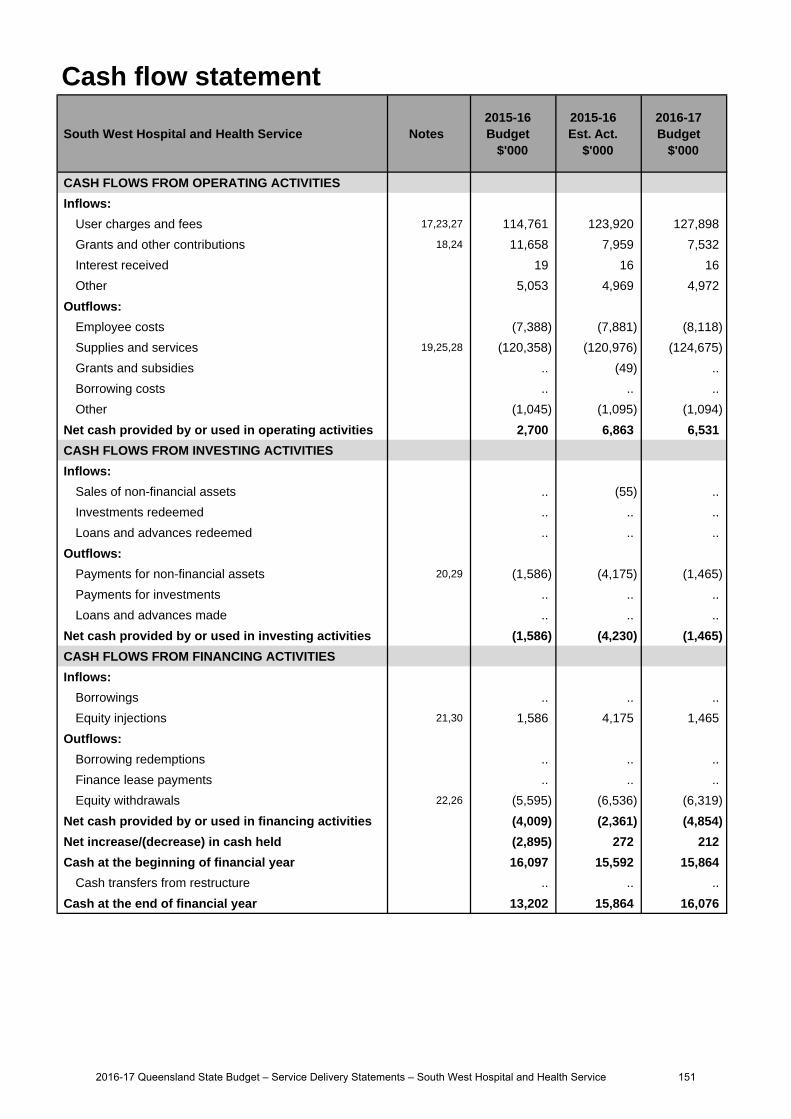
Cash flow statement
South West Hospital and Health Service Notes 2015-16 Budget
$'000
2015-16 Est. Act.
$'000
2016-17 Budget
$'000
CASH FLOWS FROM OPERATING ACTIVITIES
Inflows:
User charges and fees 17,23,27 114,761 123,920 127,898
Grants and other contributions 18,24 11,658 7,959 7,532
Interest received 19 16 16
Other 5,053 4,969 4,972
Outflows:
Employee costs (7,388) (7,881) (8,118)
Supplies and services 19,25,28 (120,358) (120,976) (124,675)
Grants and subsidies .. (49) ..
Borrowing costs .. .. ..
Other (1,045) (1,095) (1,094)
Net cash provided by or used in operating activities 2,700 6,863 6,531
CASH FLOWS FROM INVESTING ACTIVITIES
Inflows:
Sales of non-financial assets .. (55) ..
Investments redeemed .. .. ..
Loans and advances redeemed .. .. ..
Outflows:
Payments for non-financial assets 20,29 (1,586) (4,175) (1,465)
Payments for investments .. .. ..
Loans and advances made .. .. ..
Net cash provided by or used in investing activities (1,586) (4,230) (1,465)
CASH FLOWS FROM FINANCING ACTIVITIES
Inflows:
Borrowings .. .. ..
Equity injections 21,30 1,586 4,175 1,465
Outflows:
Borrowing redemptions .. .. ..
Finance lease payments .. .. ..
Equity withdrawals 22,26 (5,595) (6,536) (6,319)
Net cash provided by or used in financing activities (4,009) (2,361) (4,854)
Net increase/(decrease) in cash held (2,895) 272 212
Cash at the beginning of financial year 16,097 15,592 15,864
Cash transfers from restructure .. .. ..
Cash at the end of financial year 13,202 15,864 16,076
2016-17 Queensland State Budget – Service Delivery Statements – South West Hospital and Health Service 151
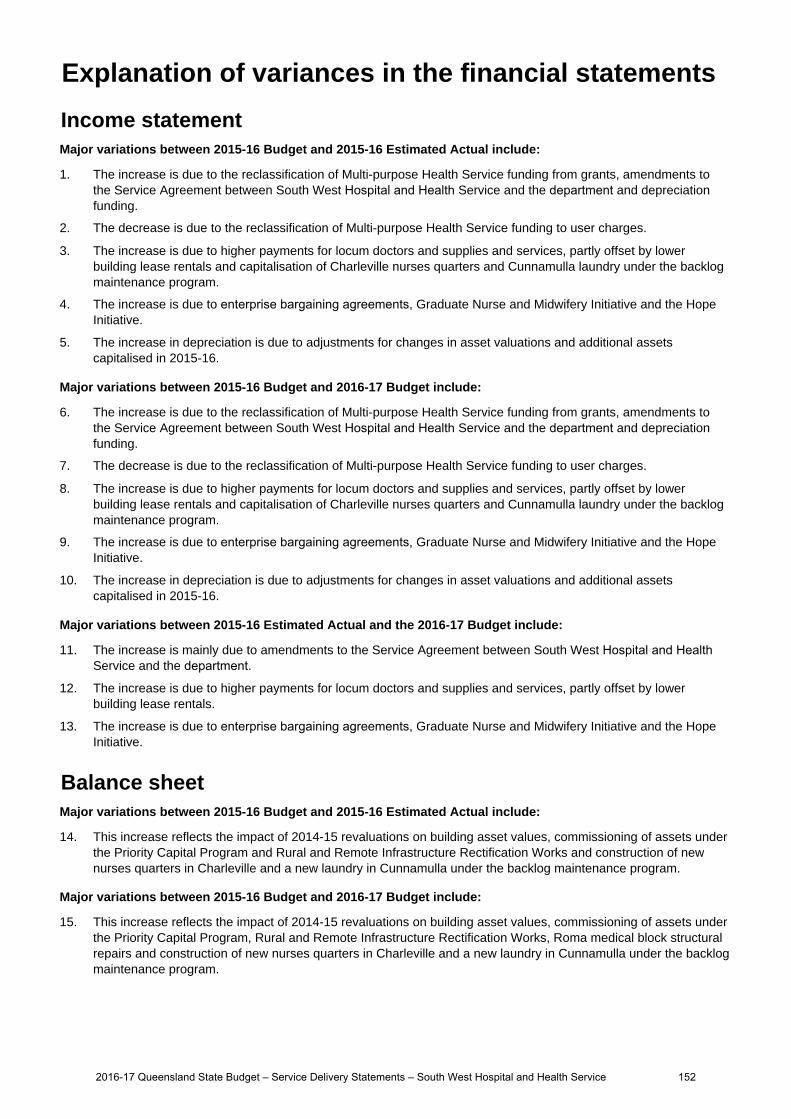
Income statementMajor variations between 2015-16 Budget and 2015-16 Estimated Actual include:
1. The increase is due to the reclassification of Multi-purpose Health Service funding from grants, amendments to the Service Agreement between South West Hospital and Health Service and the department and depreciation funding.
2. The decrease is due to the reclassification of Multi-purpose Health Service funding to user charges.
3. The increase is due to higher payments for locum doctors and supplies and services, partly offset by lowerbuilding lease rentals and capitalisation of Charleville nurses quarters and Cunnamulla laundry under the backlogmaintenance program.
4. The increase is due to enterprise bargaining agreements, Graduate Nurse and Midwifery Initiative and the HopeInitiative.
5. The increase in depreciation is due to adjustments for changes in asset valuations and additional assetscapitalised in 2015-16.
Major variations between 2015-16 Budget and 2016-17 Budget include:
6. The increase is due to the reclassification of Multi-purpose Health Service funding from grants, amendments to the Service Agreement between South West Hospital and Health Service and the department and depreciation funding.
7. The decrease is due to the reclassification of Multi-purpose Health Service funding to user charges.
8. The increase is due to higher payments for locum doctors and supplies and services, partly offset by lowerbuilding lease rentals and capitalisation of Charleville nurses quarters and Cunnamulla laundry under the backlogmaintenance program.
9. The increase is due to enterprise bargaining agreements, Graduate Nurse and Midwifery Initiative and the HopeInitiative.
10. The increase in depreciation is due to adjustments for changes in asset valuations and additional assetscapitalised in 2015-16.
Major variations between 2015-16 Estimated Actual and the 2016-17 Budget include:
11. The increase is mainly due to amendments to the Service Agreement between South West Hospital and HealthService and the department.
12. The increase is due to higher payments for locum doctors and supplies and services, partly offset by lowerbuilding lease rentals.
13. The increase is due to enterprise bargaining agreements, Graduate Nurse and Midwifery Initiative and the HopeInitiative.
Balance sheetMajor variations between 2015-16 Budget and 2015-16 Estimated Actual include:
14. This increase reflects the impact of 2014-15 revaluations on building asset values, commissioning of assets underthe Priority Capital Program and Rural and Remote Infrastructure Rectification Works and construction of newnurses quarters in Charleville and a new laundry in Cunnamulla under the backlog maintenance program.
Major variations between 2015-16 Budget and 2016-17 Budget include:
15. This increase reflects the impact of 2014-15 revaluations on building asset values, commissioning of assets underthe Priority Capital Program, Rural and Remote Infrastructure Rectification Works, Roma medical block structuralrepairs and construction of new nurses quarters in Charleville and a new laundry in Cunnamulla under the backlogmaintenance program.
Explanation of variances in the financial statements
2016-17 Queensland State Budget – Service Delivery Statements – South West Hospital and Health Service 152
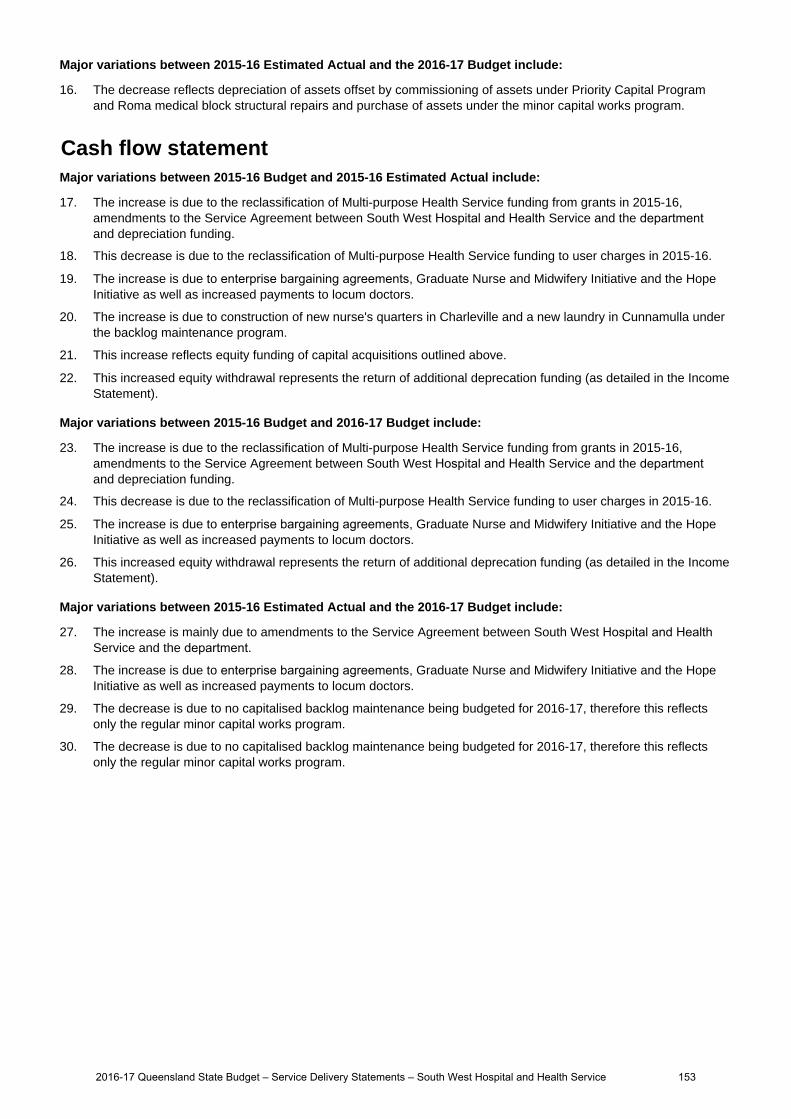
Major variations between 2015-16 Estimated Actual and the 2016-17 Budget include:
16. The decrease reflects depreciation of assets offset by commissioning of assets under Priority Capital Program and Roma medical block structural repairs and purchase of assets under the minor capital works program.
Cash flow statementMajor variations between 2015-16 Budget and 2015-16 Estimated Actual include:
17. The increase is due to the reclassification of Multi-purpose Health Service funding from grants in 2015-16, amendments to the Service Agreement between South West Hospital and Health Service and the department and depreciation funding.
18. This decrease is due to the reclassification of Multi-purpose Health Service funding to user charges in 2015-16.
19. The increase is due to enterprise bargaining agreements, Graduate Nurse and Midwifery Initiative and the HopeInitiative as well as increased payments to locum doctors.
20. The increase is due to construction of new nurse's quarters in Charleville and a new laundry in Cunnamulla underthe backlog maintenance program.
21. This increase reflects equity funding of capital acquisitions outlined above.
22. This increased equity withdrawal represents the return of additional deprecation funding (as detailed in the IncomeStatement).
Major variations between 2015-16 Budget and 2016-17 Budget include:
23. The increase is due to the reclassification of Multi-purpose Health Service funding from grants in 2015-16, amendments to the Service Agreement between South West Hospital and Health Service and the department and depreciation funding.
24. This decrease is due to the reclassification of Multi-purpose Health Service funding to user charges in 2015-16.
25. The increase is due to enterprise bargaining agreements, Graduate Nurse and Midwifery Initiative and the HopeInitiative as well as increased payments to locum doctors.
26. This increased equity withdrawal represents the return of additional deprecation funding (as detailed in the IncomeStatement).
Major variations between 2015-16 Estimated Actual and the 2016-17 Budget include:
27. The increase is mainly due to amendments to the Service Agreement between South West Hospital and HealthService and the department.
28. The increase is due to enterprise bargaining agreements, Graduate Nurse and Midwifery Initiative and the HopeInitiative as well as increased payments to locum doctors.
29. The decrease is due to no capitalised backlog maintenance being budgeted for 2016-17, therefore this reflectsonly the regular minor capital works program.
30. The decrease is due to no capitalised backlog maintenance being budgeted for 2016-17, therefore this reflectsonly the regular minor capital works program.
2016-17 Queensland State Budget – Service Delivery Statements – South West Hospital and Health Service 153
Sunshine Coast Hospital and Health Service
Overview
The Sunshine Coast Hospital and Health Service (HHS) is an independent statutory body overseen by a local Hospital and Health Board. The Sunshine Coast HHS provides public health services through the geographical area that extends from Caloundra in the south to Gympie in the north. The Sunshine Coast HHS operates the following facilities:
Caloundra Hospital Gympie Hospital Glenbrook Residential Aged Care Facility
Nambour General Hospital Maleny Soldiers Memorial Hospital
Public patients also have access to care at Noosa Hospital and the Sunshine Coast University Private Hospital under contractual arrangements.
The commissioning of the new Sunshine Coast University Hospital (SCUH) in 2017 will be the catalyst for the introduction of not only new services but innovation within our current services. The Sunshine Coast Hospital and Health Board is determined that the successful opening of the SCUH will occur in the context of integrated provision of health services across the Sunshine Coast HHS.
The Sunshine Coast HHS is committed to delivering the highest standards of safe, accessible, evidenced based healthcare with a highly skilled and valued workforce that optimises the wellbeing of our community.
The health status of the population within the Sunshine Coast HHS geographic area is influenced by diverse factors including the socio-demographic characteristics of our population, for example, rapid population growth and a high proportion of older people, greater burden of disease, in particular an increase in chronic diseases across all ages, which all require suitable models of care to effectively manage. The Sunshine Coast HHS has aligned its future planning to the four objectives the Queensland Government has for the community: creating jobs and a diverse economy; delivering quality frontline services; protecting the environment; and building safe, caring and connected communities. This will be achieved through: realising the benefits of building and commissioning of the $1.872 billion SCUH enhancing research and academic initiatives including the establishment of the Sunshine Coast Health Institute, a skills,
academic and research centre in partnership with two universities and TAFE Queensland developing and implementing models of care/service models that include workforce innovation, service redesign and
new technologies to improve access, safety and consistent care across all Sunshine Coast HHS services and locations engaging and involving staff and the community in the planning and preparing for the expanded range of services that
will be provided following the opening of the SCUH.
Service summary
The Sunshine Coast HHS has an operating budget of $996.8 million for 2016-17 which is an increase of $244.1 million (32.4 per cent) from the published 2015-16 operating budget of $752.7 million.
Construction of the SCUH is well advanced with the hospital scheduled to open in April 2017, with approximately 450 beds, and increasing to its built capacity of 738 beds by 2021. The hospital will offer a range of new and expanded health services. When fully commissioned, this will mean an estimated 10,000 patients who currently have to access services in Brisbane will receive their care locally.
Caloundra Health Service and Nambour General Hospital will undergo redevelopments after the opening of the SCUH in order to make them fit for purpose for their future roles. The Gympie Hospital will continue to provide services to its local community and has been at the forefront of the expanded use of telehealth within the Sunshine Coast HHS.
2016-17 Queensland State Budget – Service Delivery Statements – Sunshine Coast Hospital and Health Service 154

Service performance
Performance statement
Sunshine Coast Hospital and Health Service
Service area objective
To deliver public hospital and health services for the Sunshine Coast community.
Service area description
The Sunshine Coast HHS is responsible for providing public hospital and health services including medical, surgical, emergency, obstetrics, paediatrics, specialist outpatient clinics, mental health, critical care and clinical support services.
Sunshine Coast Hospital and Health Service Notes 2015-16
Target/Est.
2015-16
Est. Actual
2016-17
Target/Est.
Service standards
Effectiveness measures
Percentage of patients attending emergency departments seen within recommended timeframes:
1-3
Category 1 (within 2 minutes) 100% 100% 100%
Category 2 (within 10 minutes) 80% 80% 80%
Category 3 (within 30 minutes) 75% 63% 75%
Category 4 (within 60 minutes) 70% 66% 70%
Category 5 (within 120 minutes) 70% 86% 70%
All categories .. 68% ..
Percentage of emergency department attendances who depart within four hours of their arrival in the department 1, 2 90% 77% >80%
Percentage of elective surgery patients treated within clinically recommended times: 4
Category 1 (30 days) >98% 95% >98%
Category 2 (90 days) >95% 96% >95%
Category 3 (365 days) >95% 99% >95%
Rate of healthcare associated Staphylococcus aureus (including MRSA) bloodstream (SAB) infections/10,000 acute public hospital patient days 5 <2 0.4 <2
Rate of community follow-up within 1-7 days following discharge from an acute mental health inpatient unit 6 >65% 62.9% >65%
Proportion of readmissions to an acute mental health inpatient unit within 28 days of discharge 7 <12% 9% <12%
Percentage of specialist outpatients waiting within clinically recommended times: 8
2016-17 Queensland State Budget – Service Delivery Statements – Sunshine Coast Hospital and Health Service 155
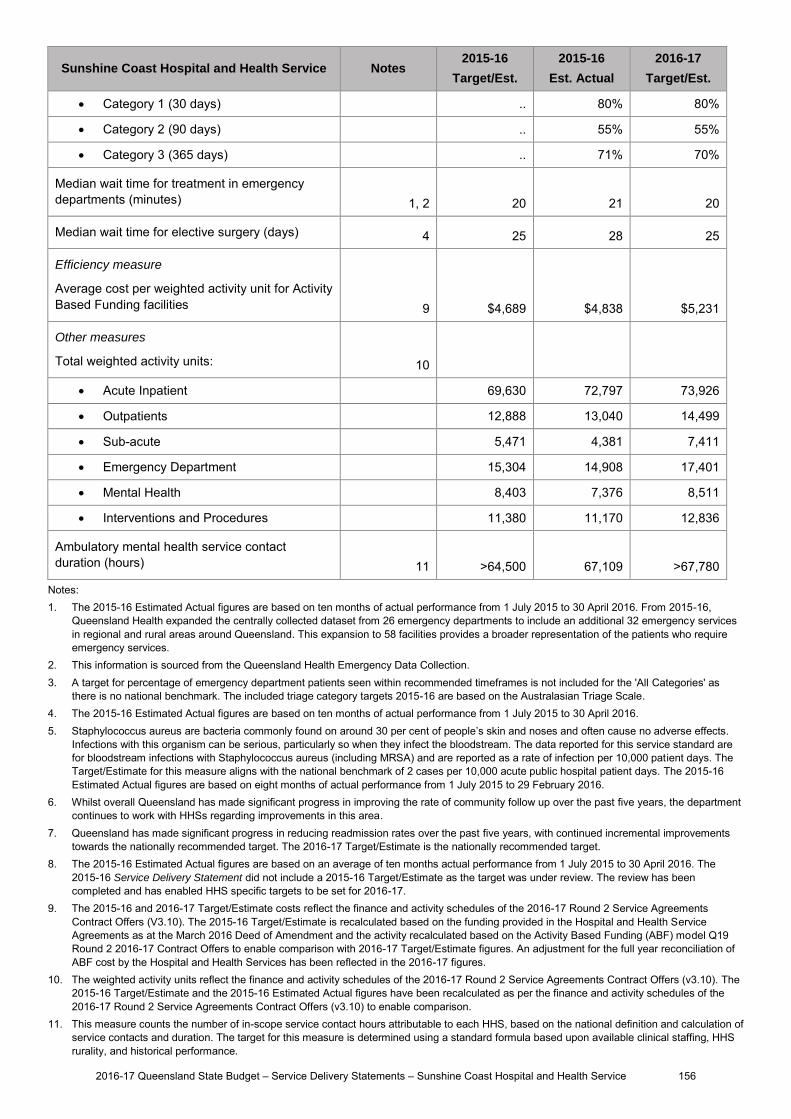
Sunshine Coast Hospital and Health Service Notes 2015-16
Target/Est.
2015-16
Est. Actual
2016-17
Target/Est.
Category 1 (30 days) .. 80% 80%
Category 2 (90 days) .. 55% 55%
Category 3 (365 days) .. 71% 70%
Median wait time for treatment in emergency departments (minutes) 1, 2 20 21 20
Median wait time for elective surgery (days) 4 25 28 25
Efficiency measure
Average cost per weighted activity unit for Activity Based Funding facilities 9 $4,689 $4,838 $5,231
Other measures
Total weighted activity units: 10
Acute Inpatient 69,630 72,797 73,926
Outpatients 12,888 13,040 14,499
Sub-acute 5,471 4,381 7,411
Emergency Department 15,304 14,908 17,401
Mental Health 8,403 7,376 8,511
Interventions and Procedures 11,380 11,170 12,836
Ambulatory mental health service contact duration (hours) 11 >64,500 67,109 >67,780
Notes: 1. The 2015-16 Estimated Actual figures are based on ten months of actual performance from 1 July 2015 to 30 April 2016. From 2015-16,
Queensland Health expanded the centrally collected dataset from 26 emergency departments to include an additional 32 emergency services in regional and rural areas around Queensland. This expansion to 58 facilities provides a broader representation of the patients who require emergency services.
2. This information is sourced from the Queensland Health Emergency Data Collection. 3. A target for percentage of emergency department patients seen within recommended timeframes is not included for the 'All Categories' as
there is no national benchmark. The included triage category targets 2015-16 are based on the Australasian Triage Scale. 4. The 2015-16 Estimated Actual figures are based on ten months of actual performance from 1 July 2015 to 30 April 2016. 5. Staphylococcus aureus are bacteria commonly found on around 30 per cent of people’s skin and noses and often cause no adverse effects.
Infections with this organism can be serious, particularly so when they infect the bloodstream. The data reported for this service standard are for bloodstream infections with Staphylococcus aureus (including MRSA) and are reported as a rate of infection per 10,000 patient days. The Target/Estimate for this measure aligns with the national benchmark of 2 cases per 10,000 acute public hospital patient days. The 2015-16 Estimated Actual figures are based on eight months of actual performance from 1 July 2015 to 29 February 2016.
6. Whilst overall Queensland has made significant progress in improving the rate of community follow up over the past five years, the department continues to work with HHSs regarding improvements in this area.
7. Queensland has made significant progress in reducing readmission rates over the past five years, with continued incremental improvements towards the nationally recommended target. The 2016-17 Target/Estimate is the nationally recommended target.
8. The 2015-16 Estimated Actual figures are based on an average of ten months actual performance from 1 July 2015 to 30 April 2016. The 2015-16 Service Delivery Statement did not include a 2015-16 Target/Estimate as the target was under review. The review has been completed and has enabled HHS specific targets to be set for 2016-17.
9. The 2015-16 and 2016-17 Target/Estimate costs reflect the finance and activity schedules of the 2016-17 Round 2 Service Agreements Contract Offers (V3.10). The 2015-16 Target/Estimate is recalculated based on the funding provided in the Hospital and Health Service Agreements as at the March 2016 Deed of Amendment and the activity recalculated based on the Activity Based Funding (ABF) model Q19 Round 2 2016-17 Contract Offers to enable comparison with 2016-17 Target/Estimate figures. An adjustment for the full year reconciliation of ABF cost by the Hospital and Health Services has been reflected in the 2016-17 figures.
10. The weighted activity units reflect the finance and activity schedules of the 2016-17 Round 2 Service Agreements Contract Offers (v3.10). The 2015-16 Target/Estimate and the 2015-16 Estimated Actual figures have been recalculated as per the finance and activity schedules of the 2016-17 Round 2 Service Agreements Contract Offers (v3.10) to enable comparison.
11. This measure counts the number of in-scope service contact hours attributable to each HHS, based on the national definition and calculation of service contacts and duration. The target for this measure is determined using a standard formula based upon available clinical staffing, HHS rurality, and historical performance.
2016-17 Queensland State Budget – Service Delivery Statements – Sunshine Coast Hospital and Health Service 156
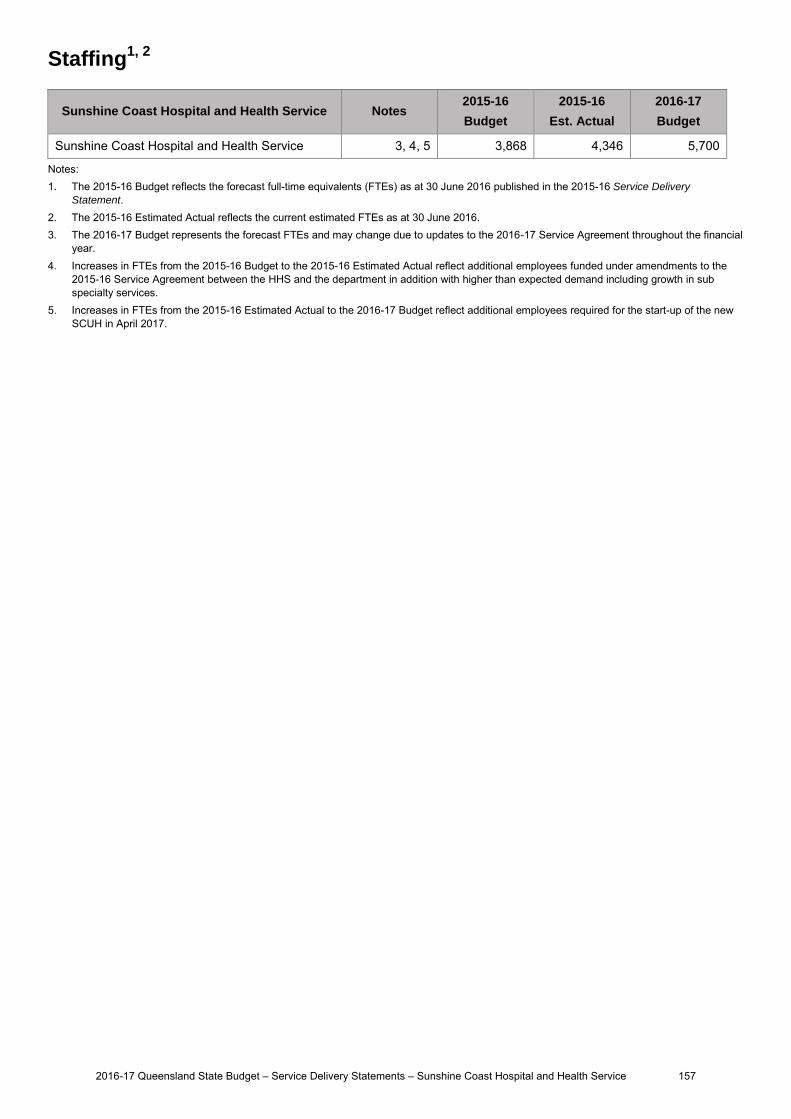
Staffing1, 2
Sunshine Coast Hospital and Health Service Notes 2015-16
Budget
2015-16
Est. Actual
2016-17
Budget
Sunshine Coast Hospital and Health Service 3, 4, 5 3,868 4,346 5,700
Notes: 1. The 2015-16 Budget reflects the forecast full-time equivalents (FTEs) as at 30 June 2016 published in the 2015-16 Service Delivery
Statement. 2. The 2015-16 Estimated Actual reflects the current estimated FTEs as at 30 June 2016. 3. The 2016-17 Budget represents the forecast FTEs and may change due to updates to the 2016-17 Service Agreement throughout the financial
year. 4. Increases in FTEs from the 2015-16 Budget to the 2015-16 Estimated Actual reflect additional employees funded under amendments to the
2015-16 Service Agreement between the HHS and the department in addition with higher than expected demand including growth in sub specialty services.
5. Increases in FTEs from the 2015-16 Estimated Actual to the 2016-17 Budget reflect additional employees required for the start-up of the new SCUH in April 2017.
2016-17 Queensland State Budget – Service Delivery Statements – Sunshine Coast Hospital and Health Service 157

Income statement
Sunshine Coast Hospital and Health Service Notes 2015-16 Budget
$'000
2015-16 Est. Act.
$'000
2016-17 Budget
$'000
INCOME
User charges and fees 1,5,12 733,718 768,374 976,283
Grants and other contributions 14,205 12,748 12,966
Interest 135 99 102
Other revenue 2,6 4,640 1,360 1,407
Gains on sale/revaluation of assets .. .. ..
Total income 752,698 782,581 990,758
EXPENSES
Employee expenses 3,7,13 468,478 503,439 637,185
Supplies and Services:
Other supplies and services 8,14 260,844 261,844 294,980
Department of Health contract staff .. .. ..
Grants and subsidies .. 107 120
Depreciation and amortisation 9,15 21,652 21,907 46,534
Finance/borrowing costs 10,16 .. .. 13,091
Other expenses 1,394 1,399 3,718
Losses on sale/revaluation of assets 330 985 1,130
Total expenses 752,698 789,681 996,758
OPERATING SURPLUS/(DEFICIT) 4,11 .. (7,100) (6,000)
2016-17 Queensland State Budget – Service Delivery Statements – Sunshine Coast Hospital and Health Service 158

Balance sheet
Sunshine Coast Hospital and Health Service Notes 2015-16 Budget
$'000
2015-16 Est. Act.
$'000
2016-17 Budget
$'000
CURRENT ASSETS
Cash assets 17,22,28 40,489 87,306 60,078
Receivables 14,358 12,466 12,831
Other financial assets .. .. ..
Inventories 4,229 4,229 4,335
Other 465 464 504
Non-financial assets held for sale .. .. ..
Total current assets 59,541 104,465 77,748
NON-CURRENT ASSETS
Receivables .. .. ..
Other financial assets .. .. ..
Property, plant and equipment 23,29 285,598 284,748 1,493,647
Intangibles 18,24,30 .. 21,838 44,512
Other .. .. ..
Total non-current assets 285,598 306,586 1,538,159
TOTAL ASSETS 345,139 411,051 1,615,907
CURRENT LIABILITIES
Payables 19,25,31 33,991 41,356 37,884
Accrued employee benefits 20,26,32 15,933 19,160 23,709
Interest bearing liabilities and derivatives .. .. ..
Provisions .. .. ..
Other .. .. ..
Total current liabilities 49,924 60,516 61,593
NON-CURRENT LIABILITIES
Payables .. .. ..
Accrued employee benefits .. .. ..
Interest bearing liabilities and derivatives .. .. ..
Provisions .. .. ..
Other .. .. ..
Total non-current liabilities .. .. ..
TOTAL LIABILITIES 49,924 60,516 61,593
NET ASSETS/(LIABILITIES) 295,215 350,535 1,554,314
EQUITY
TOTAL EQUITY 21,27,33 295,215 350,535 1,554,314
2016-17 Queensland State Budget – Service Delivery Statements – Sunshine Coast Hospital and Health Service 159

Cash flow statement
Sunshine Coast Hospital and Health Service Notes 2015-16 Budget
$'000
2015-16 Est. Act.
$'000
2016-17 Budget
$'000
CASH FLOWS FROM OPERATING ACTIVITIES
Inflows:
User charges and fees 34,38,44 733,199 780,689 975,004
Grants and other contributions 14,205 12,683 12,898
Interest received 135 99 102
Other 22,920 19,136 19,805
Outflows:
Employee costs 35,39,45 (465,962) (497,490) (632,636)
Supplies and services 40,46 (278,416) (280,309) (316,895)
Grants and subsidies .. (107) (120)
Borrowing costs 41,47 .. .. (13,091)
Other (1,394) (1,821) (3,828)
Net cash provided by or used in operating activities 24,687 32,880 41,239
CASH FLOWS FROM INVESTING ACTIVITIES
Inflows:
Sales of non-financial assets (80) (136) (139)
Investments redeemed .. .. ..
Loans and advances redeemed .. .. ..
Outflows:
Payments for non-financial assets 36,42,48 (8,197) (30,176) (27,939)
Payments for investments .. .. ..
Loans and advances made .. .. ..
Net cash provided by or used in investing activities (8,277) (30,312) (28,078)
CASH FLOWS FROM FINANCING ACTIVITIES
Inflows:
Borrowings .. .. ..
Equity injections 37,49 8,197 64,208 6,145
Outflows:
Borrowing redemptions .. .. ..
Finance lease payments .. .. ..
Equity withdrawals 43,50 (21,652) (21,907) (46,534)
Net cash provided by or used in financing activities (13,455) 42,301 (40,389)
Net increase/(decrease) in cash held 2,955 44,869 (27,228)
Cash at the beginning of financial year 37,534 42,437 87,306
Cash transfers from restructure .. .. ..
Cash at the end of financial year 40,489 87,306 60,078
2016-17 Queensland State Budget – Service Delivery Statements – Sunshine Coast Hospital and Health Service 160

Income statementMajor variations between 2015-16 Budget and 2015-16 Estimated Actual include:
1. The increase in user charges and fees relates to additional funding provided under amendments to the serviceagreement between the Sunshine Coast Hospital and Health Service and the department for the start-up of thenew Sunshine Coast University Hospital, increases in service activity and enterprise bargaining agreements, andprograms such as adult public dental services, the graduate nursing and midwifery initiative and the specialistoutpatient department reduction strategy.
2. The decrease in other revenue relates to a reduction in expenditure reimbursements from the departmentunder the Sunshine Coast University Hospital project.
3. The increase in employee expenses relates to additional expenditure funded under amendments to the serviceagreement between the Sunshine Coast Hospital and Health Service and the department for the transition tothe new Sunshine Coast University Hospital, increased service activity, enterprise bargaining agreements, andprograms such as the graduate nursing and midwifery initiative and the specialist outpatient departmentreduction strategy. The Sunshine Coast Hospital and Health Service is also forecasting higher than expecteddemand, including growth in sub speciality services, which has resulted in the appointment of a higher numberof employees than originally budgeted. This additional expenditure will be funded from prior year surpluses.
4. An operating deficit is forecast in 2015-16 due to higher than expected demand for hospital services, includinggrowth in sub specialty services, which has resulted in the appointment of a higher number of employees thanoriginally budgeted. The deficit will be funded from cash reserves accumulated from operating surpluses inprevious years.
Major variations between 2015-16 Budget and 2016-17 Budget include:
5. The increase in user charges and fees relates to additional funding provided under amendments to the serviceagreement between the Sunshine Coast Hospital and Health Service and the department for the start-up of thenew Sunshine Coast University Hospital in April 2017 and the impact of enterprise bargaining agreements.
6. The decrease in other revenue relates to a reduction in expenditure reimbursements from the departmentunder the Sunshine Coast University Hospital project.
7. The increase in employee expenses relates to additional expenditure funded under amendments to the serviceagreement between the Sunshine Coast Hospital and Health Service and the department for the start-up of thenew Sunshine Coast University Hospital in April 2017 and the impact of enterprise bargaining agreements.
8. The increase in other supplies and services relates to additional expenditure funded under amendments to theservice agreement between the Sunshine Coast Hospital and Health Service and the department for the start-upof the new Sunshine Coast University Hospital in April 2017.
9. The increase in depreciation and amortisation represents the additional expense to be incurred following thecompletion of the construction of the Sunshine Coast University Hospital during 2016-17.
10. The increase in finance/borrowing costs relates to interest expense for Sunshine Coast University Hospital assetswhich are partially funded under a finance lease. The underlying finance lease liability is held by the department.
11. A deficit is forecast in 2016-17 as part of the service agreement between the Sunshine Coast Hospital and HealthService and the department to fund non-recurrent expenditure associated with the start-up of the new SunshineCoast University Hospital. Similarly to the deficit reported in 2015-16, the deficit in 2016-17 will be funded fromcash reserves accumulated from operating surpluses in previous years.
Major variations between 2015-16 Estimated Actual and the 2016-17 Budget include:
12. The increase in user charges and fees relates to additional funding provided under amendments to the serviceagreement between the Sunshine Coast Hospital and Health Service and the department for the start-up of thenew Sunshine Coast University Hospital in April 2017 and the impact of enterprise bargaining agreements.
Explanation of variances in the financial statements
13. The increase in employee expenses relates to additional expenditure funded under amendments to the serviceagreement between the Sunshine Coast Hospital and Health Service and the department for the start-up of thenew Sunshine Coast University Hospital in April 2017 and the impact of enterprise bargaining agreements.
2016-17 Queensland State Budget – Service Delivery Statements – Sunshine Coast Hospital and Health Service 161
14. The increase in other supplies and services relates to additional expenditure funded under amendments to theservice agreement between the Sunshine Coast Hospital and Health Service and the department for the start-upof the new Sunshine Coast University Hospital in April 2017.
15. The increase in depreciation and amortisation represents the additional expense to be incurred following thecompletion of the construction of the Sunshine Coast University Hospital during 2016-17.
16. The increase in finance/borrowing costs relates to interest expense for Sunshine Coast University Hospital assetswhich are partially funded under a finance lease. The underlying finance lease liability is held by the department.
Balance sheetMajor variations between 2015-16 Budget and 2015-16 Estimated Actual include:
17. The increase in cash assets relates to the unspent portion of capital funding (equity) received during 2015-16 for information and communications technology assets as part of the start-up of the new Sunshine Coast University Hospital. This funding was not forecast by the Sunshine Coast Hospital and Health Service at the time the 2015-16 Budget was set.
18. The increase in intangibles relates to capital expenditure on information and communications technology assetsas part of the start-up of the new Sunshine Coast University Hospital. This expenditure was not forecast by theSunshine Coast Hospital and Health Service at the time the 2015-16 Budget was set.
19. The increase in payables relates to the movement in the forecast timing of payment of expenditure at year end.
20. The increase in accrued employee benefits relates to the movement in the forecast timing of payment ofexpenditure at year end.
21. The increase in total equity relates to capital funding received during 2015-16 for information and communicationstechnology assets as part of the start-up of the new Sunshine Coast University Hospital. This funding was notforecast by the Sunshine Coast Hospital and Health Service at the time the 2015-16 Budget was set.
Major variations between 2015-16 Budget and 2016-17 Budget include:
22. The increase in cash assets relates to the unspent portion of capital funding (equity) received during 2015-16 forinformation and communications technology assets as part of the start-up of the new Sunshine Coast UniversityHospital.
23. The increase in property, plant and equipment relates to the transfer of the Sunshine Coast University Hospitalproperty, plant and equipment from the department to the Sunshine Coast Hospital and Health Service during2016-17.
24. The increase in intangibles relates to capital expenditure on information and communications technology assetsas part of the start-up of the new Sunshine Coast University Hospital.
25. The increase in payables relates to the movement in the forecast timing of payment of expenditure at year end.
26. The increase in accrued employee benefits relates to the movement in the forecast timing of payment ofexpenditure at year end.
27. The increase in total equity relates to capital funding allocated during 2015-16 for information andcommunications technology assets as part of the start-up of the new Sunshine Coast University Hospital and forthe transfer of Sunshine Coast University Hospital property, plant and equipment from the departmentto theSunshine Coast Hospital and Health Service during 2016-17.
Major variations between 2015-16 Estimated Actual and the 2016-17 Budget include:
28. The decrease in cash assets relates to the spending of capital funding (equity) received during 2015-16 forinformation and communications technology assets as part of the start-up of the new Sunshine Coast UniversityHospital.
29. The increase in property, plant and equipment relates to the transfer of the Sunshine Coast University Hospitalproperty, plant and equipment from the department to the Sunshine Coast Hospital and Health Service during2016-17.
30. The increase in intangibles relates to capital expenditure on information and communications technology assetsas part of the start-up of the new Sunshine Coast University Hospital.
2016-17 Queensland State Budget – Service Delivery Statements – Sunshine Coast Hospital and Health Service 162
31. The decrease in payables relates to the movement in the forecast timing of payment of expenditure at year end.
32. The increase in accrued employee benefits relates to the movement in the forecast timing of payment ofexpenditure at year end.
33. The increase in total equity relates to the transfer of Sunshine Coast University Hospital property, plant andequipment from the department to the Sunshine Coast Hospital and Health Service during 2016-17.
Cash flow statementMajor variations between 2015-16 Budget and 2015-16 Estimated Actual include:
34. The increase in user charges and fees relates to additional funding provided under amendments to the serviceagreement between the Sunshine Coast Hospital and Health Service and the department for the transition to theSunshine Coast University Hospital, increases in service activity and enterprise bargaining agreements, andprograms such as adult public dental services, the graduate nursing and midwifery initiative and the specialistoutpatient department reduction strategy. Also contributing to the increase was the receipt of 2014-15 fundingfrom the department during 2015-16.
35. The increase in employee costs relates to additional expenditure funded under amendments to the serviceagreement between the Sunshine Coast Hospital and Health Service and the department for the start-up of thenew Sunshine Coast University Hospital, increased service activity, enterprise bargaining agreements, andprograms such as the graduate nursing and midwifery initiative and the specialist outpatient departmentreduction strategy. The Sunshine Coast Hospital and Health Service is also forecasting higher than expecteddemand, including growth in sub speciality services, which has resulted in the appointment of a higher number ofemployees than originally budgeted. This additional expenditure will be funded from prior year surpluses.
36. The increase in payments for non-financial assets relates to capital expenditure on information andcommunications technology assets as part of the start-up of the new Sunshine Coast University Hospital. Thisexpenditure was not forecast by the Sunshine Coast Hospital and Health Service at the time the 2015-16 Budgetwas set.
37. The increase in equity injections relates to capital funding received during 2015-16 for information andcommunications technology assets as part of the start-up of the new Sunshine Coast University Hospital. Thisfunding was not forecast by the Sunshine Coast Hospital and Health Service at the time the 2015-16 Budget wasset.
Major variations between 2015-16 Budget and 2016-17 Budget include:
38. The increase in user charges and fees relates to additional funding provided under amendments to the serviceagreement between the Sunshine Coast Hospital and Health Service and the department for the start-up of thenew Sunshine Coast University Hospital in April 2017 and the impact of enterprise bargaining agreements.
39. The increase in employee costs relates to additional expenditure funded under amendments to the serviceagreement between the Sunshine Coast Hospital and Health Service and the department for the start-up of thenew Sunshine Coast University Hospital in April 2017 and the impact of enterprise bargaining agreements.
40. The increase in supplies and services relates to additional expenditure funded under amendments to the serviceagreement between the Sunshine Coast Hospital and Health Service and the department for the start-up of thenew Sunshine Coast University Hospital in April 2017.
41. The increase in borrowing costs relates to interest expense for Sunshine Coast University Hospital assets whichare partially funded under a finance lease. The underlying finance lease liability is held by the department.
42. The increase in payments for non-financial assets relates to capital expenditure on information andcommunications technology assets as part of the start-up of the new Sunshine Coast University Hospital.
43. The increase in equity withdrawals relates to a corresponding increase in depreciation expense due to completionof the construction of the Sunshine Coast University Hospital. Under current arrangements the funding receivedfor depreciation expense is returned to the department as an equity withdrawal.
Major variations between 2015-16 Estimated Actual and the 2016-17 Budget include:
44. The increase in user charges and fees relates to additional funding provided under amendments to the serviceagreement between the Sunshine Coast Hospital and Health Service and the department for the start-up of thenew Sunshine Coast University Hospital in April 2017 and the impact of enterprise bargaining agreements.
2016-17 Queensland State Budget – Service Delivery Statements – Sunshine Coast Hospital and Health Service 163
45. The increase in employee costs relates to additional expenditure funded under amendments to the serviceagreement between the Sunshine Coast Hospital and Health Service and the departmentfor the start-up of thenew Sunshine Coast University Hospital in April 2017 and the impact of enterprise bargaining agreements.
46. The increase in supplies and services relates to additional expenditure funded under amendments to the serviceagreement between the Sunshine Coast Hospital and Health Service and the department for the start-up of thenew Sunshine Coast University Hospital in April 2017.
47. The increase in borrowing costs relates to interest expense for Sunshine Coast University Hospital assets whichare partially funded under a finance lease. The underlying finance lease liability is held by the department.
48. The decrease in payments for non-financial assets relates to lower relative capital expenditure in 2016-17compared to 2015-16 under the Health Technology Equipment Replacement program.
49. The decrease in equity injections is due to the receipt of lower relative funding in 2016-17 compared to 2015-16for expenditure on non-financial assets. This is due to the receipt of a one-off injection of funding in 2015-16 forinformation and communications technology assets as part of the start-up of the new Sunshine Coast UniversityHospital which is forecast to be spent progressively over the 2015-16 to 2018-19 years.
50. The increase in equity withdrawals relates to a corresponding increase in depreciation expense due to completionof the construction of the Sunshine Coast University Hospital. Under current arrangements the funding receivedfor depreciation expense is returned to the department as an equity withdrawal.
2016-17 Queensland State Budget – Service Delivery Statements – Sunshine Coast Hospital and Health Service 164
Torres and Cape Hospital and Health Service
Overview
The Torres and Cape Hospital and Health Service (HHS) is an independent statutory body overseen by a local Hospital and Health Board. The Torres and Cape HHS delivers health services to approximately 25,500 people across an area of close to 180,000 square kilometres, which includes 18 populated Torres Strait islands. Torres and Cape HHS is responsible for the direct management of the facilities and services within the HHS' geographical boundaries including:
Aurukun Primary Health Care Centre Mapoon Primary Health Care Centre
Badu Island Primary Health Care Centre Napranum Primary Health Care Centre
Bamaga Hospital Pormpuraaw Primary Health Care Centre
Bamaga Primary Health Care Centre Saibai Primary Health Care Centre
Coen Primary Health Care Centre Thursday Island Hospital
Cooktown Multipurpose Health Service Thursday Island Community Wellness Centre
Hopevale Primary Health Care Centre Thursday Island Primary Health Care Centre
Kowanyama Primary Health Care Centre Weipa Integrated Health Service
Laura Primary Health Care Centre Wujal Wujal Primary Health Centre
Lockhart River Primary Health Care Centre Yorke Island Primary Health Care Centre
Sixty-six per cent of the population in the region identify as Aboriginal and/or Torres Strait Islander. The health status of Aboriginal and Torres Strait Islander people is significantly poorer than that of other Queenslanders, and Torres and Cape HHS is committed to closing this health gap by ensuring the provision of health services that meet the cultural, social and health needs of individuals and communities in the region.
Torres and Cape HHS's overall strategic direction is to provide high quality health care delivering measurable improvements in the health of people in the communities of Torres Strait and Cape York. The Torres and Cape HHS continues to build organisational strength into the future with plans to improve performance on key issues such as service access and volumes, redevelopment and delivery of effective, culturally-appropriate models of care, workforce sustainability and financial management. In particular, Torres and Cape HHS is strengthening its nursing workforce through nurse navigator and graduate programs. Torres and Cape HHS also continues to work collaboratively with community representatives and groups, funders and other service providers to improve patient safety and build on current health services such as chronic disease prevention programs.
The strategic objectives of Torres and Cape HHS are to:
consistently deliver safe, patient centred, culturally appropriate, responsive and innovative health care in partnership with Torres Strait, Northern Peninsula Area and Cape York communities
grow partner relationships to enable integrated health service delivery
maintain and develop a capable and competent workforce to meet current and future requirements
deliver safe and accountable services through efficient, effective, responsible and innovative use of resources.
Service summary
The Torres and Cape HHS has an operating budget of $201.2 million for 2016-17 which is an increase of $21.6 million (12.1 per cent) from the published 2015-16 operating budget of $179.5 million.
The Service Agreement between the Torres and Cape HHS and the department identifies the services to be provided, the funding arrangements for those services and defines performance indicators and targets to ensure outputs and outcomes are achieved.
Torres and Cape HHS’s focus in 2015-16 was to pursue significant initiatives to expand on the strong foundation from its first year of operations. Priorities undertaken in 2015-16 include:
birthing service re-established at the Cooktown Multipurpose Health Service after an absence of more than 11 years revitalisation and expansion of dental services in the Torres Strait Islands and Northern Peninsula Area
2016-17 Queensland State Budget – Service Delivery Statements – Torres and Cape Hospital and Health Service 165
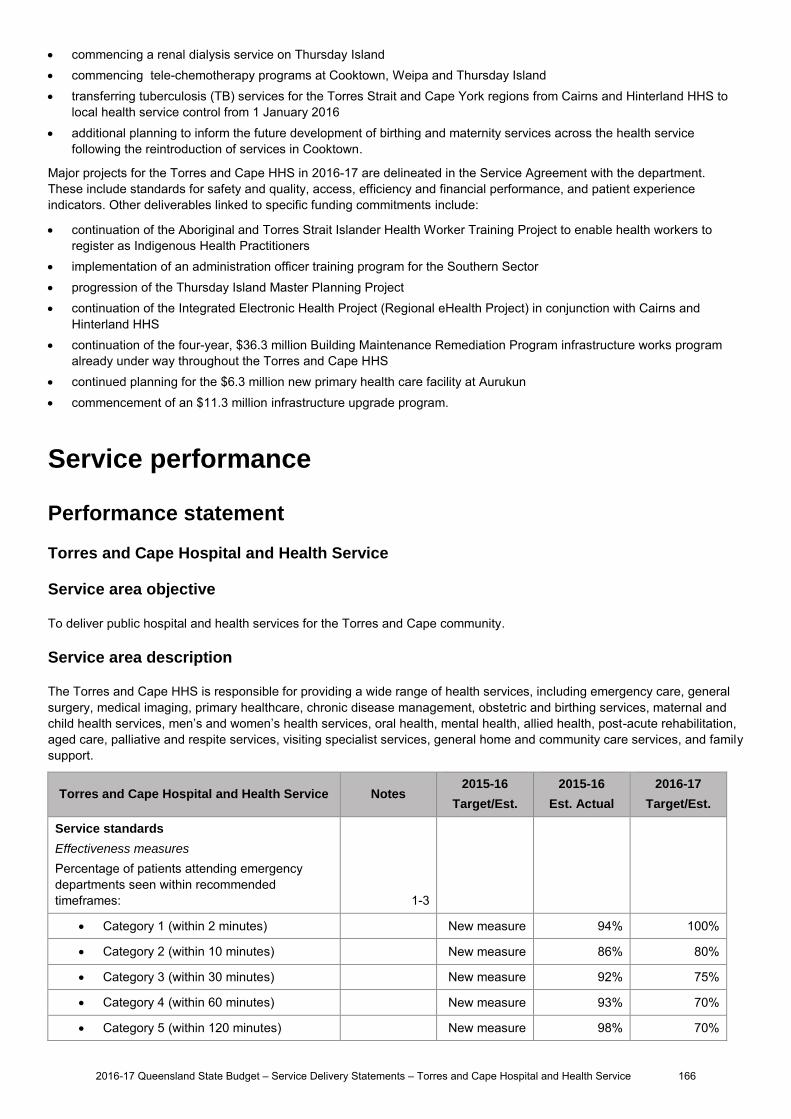
commencing a renal dialysis service on Thursday Island commencing tele-chemotherapy programs at Cooktown, Weipa and Thursday Island transferring tuberculosis (TB) services for the Torres Strait and Cape York regions from Cairns and Hinterland HHS to
local health service control from 1 January 2016 additional planning to inform the future development of birthing and maternity services across the health service
following the reintroduction of services in Cooktown.
Major projects for the Torres and Cape HHS in 2016-17 are delineated in the Service Agreement with the department. These include standards for safety and quality, access, efficiency and financial performance, and patient experience indicators. Other deliverables linked to specific funding commitments include:
continuation of the Aboriginal and Torres Strait Islander Health Worker Training Project to enable health workers to register as Indigenous Health Practitioners
implementation of an administration officer training program for the Southern Sector progression of the Thursday Island Master Planning Project continuation of the Integrated Electronic Health Project (Regional eHealth Project) in conjunction with Cairns and
Hinterland HHS continuation of the four-year, $36.3 million Building Maintenance Remediation Program infrastructure works program
already under way throughout the Torres and Cape HHS continued planning for the $6.3 million new primary health care facility at Aurukun commencement of an $11.3 million infrastructure upgrade program.
Service performance
Performance statement
Torres and Cape Hospital and Health Service
Service area objective
To deliver public hospital and health services for the Torres and Cape community.
Service area description
The Torres and Cape HHS is responsible for providing a wide range of health services, including emergency care, general surgery, medical imaging, primary healthcare, chronic disease management, obstetric and birthing services, maternal and child health services, men’s and women’s health services, oral health, mental health, allied health, post-acute rehabilitation, aged care, palliative and respite services, visiting specialist services, general home and community care services, and family support.
Torres and Cape Hospital and Health Service Notes 2015-16
Target/Est.
2015-16
Est. Actual
2016-17
Target/Est.
Service standards
Effectiveness measures
Percentage of patients attending emergency departments seen within recommended timeframes:
1-3
Category 1 (within 2 minutes) New measure 94% 100%
Category 2 (within 10 minutes) New measure 86% 80%
Category 3 (within 30 minutes) New measure 92% 75%
Category 4 (within 60 minutes) New measure 93% 70%
Category 5 (within 120 minutes) New measure 98% 70%
2016-17 Queensland State Budget – Service Delivery Statements – Torres and Cape Hospital and Health Service 166
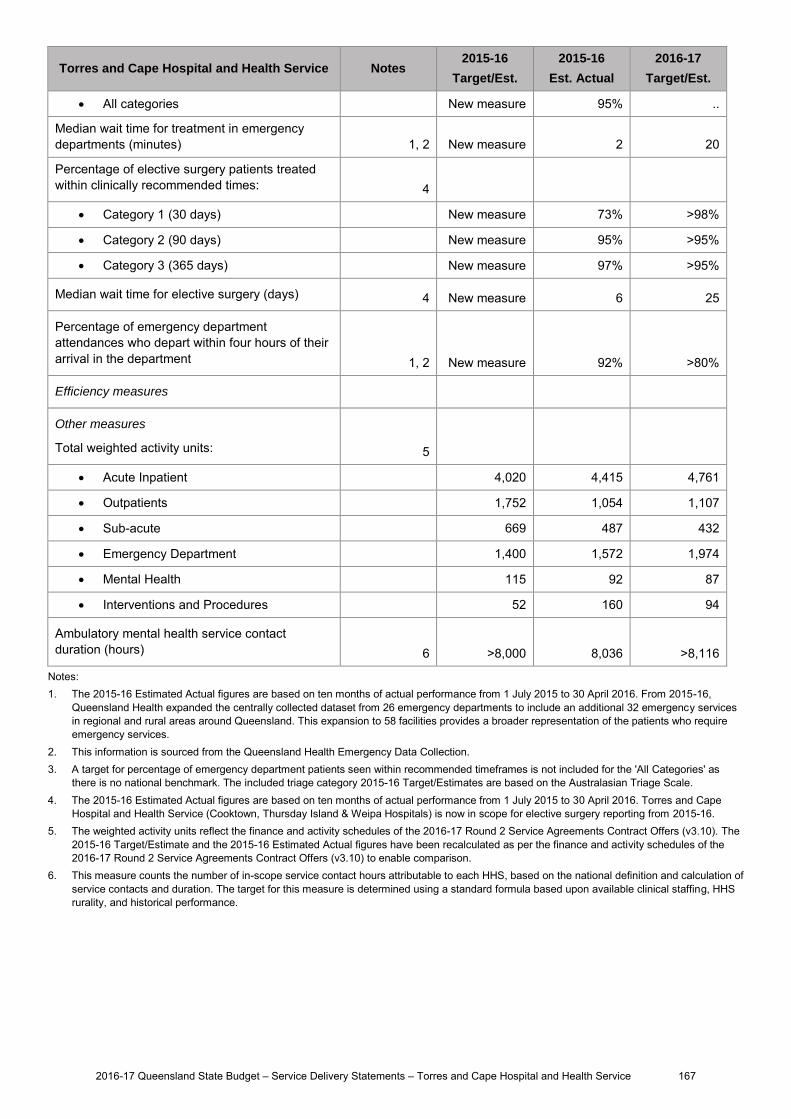
Torres and Cape Hospital and Health Service Notes 2015-16
Target/Est.
2015-16
Est. Actual
2016-17
Target/Est.
All categories New measure 95% ..
Median wait time for treatment in emergency departments (minutes) 1, 2 New measure 2 20
Percentage of elective surgery patients treated within clinically recommended times:
4
Category 1 (30 days) New measure 73% >98%
Category 2 (90 days) New measure 95% >95%
Category 3 (365 days) New measure 97% >95%
Median wait time for elective surgery (days) 4 New measure 6 25
Percentage of emergency department attendances who depart within four hours of their arrival in the department 1, 2 New measure 92% >80%
Efficiency measures
Other measures
Total weighted activity units: 5
Acute Inpatient 4,020 4,415 4,761
Outpatients 1,752 1,054 1,107
Sub-acute 669 487 432
Emergency Department 1,400 1,572 1,974
Mental Health 115 92 87
Interventions and Procedures 52 160 94
Ambulatory mental health service contact duration (hours) 6 >8,000 8,036 >8,116
Notes: 1. The 2015-16 Estimated Actual figures are based on ten months of actual performance from 1 July 2015 to 30 April 2016. From 2015-16,
Queensland Health expanded the centrally collected dataset from 26 emergency departments to include an additional 32 emergency services in regional and rural areas around Queensland. This expansion to 58 facilities provides a broader representation of the patients who require emergency services.
2. This information is sourced from the Queensland Health Emergency Data Collection. 3. A target for percentage of emergency department patients seen within recommended timeframes is not included for the 'All Categories' as
there is no national benchmark. The included triage category 2015-16 Target/Estimates are based on the Australasian Triage Scale. 4. The 2015-16 Estimated Actual figures are based on ten months of actual performance from 1 July 2015 to 30 April 2016. Torres and Cape
Hospital and Health Service (Cooktown, Thursday Island & Weipa Hospitals) is now in scope for elective surgery reporting from 2015-16. 5. The weighted activity units reflect the finance and activity schedules of the 2016-17 Round 2 Service Agreements Contract Offers (v3.10). The
2015-16 Target/Estimate and the 2015-16 Estimated Actual figures have been recalculated as per the finance and activity schedules of the 2016-17 Round 2 Service Agreements Contract Offers (v3.10) to enable comparison.
6. This measure counts the number of in-scope service contact hours attributable to each HHS, based on the national definition and calculation of service contacts and duration. The target for this measure is determined using a standard formula based upon available clinical staffing, HHS rurality, and historical performance.
2016-17 Queensland State Budget – Service Delivery Statements – Torres and Cape Hospital and Health Service 167
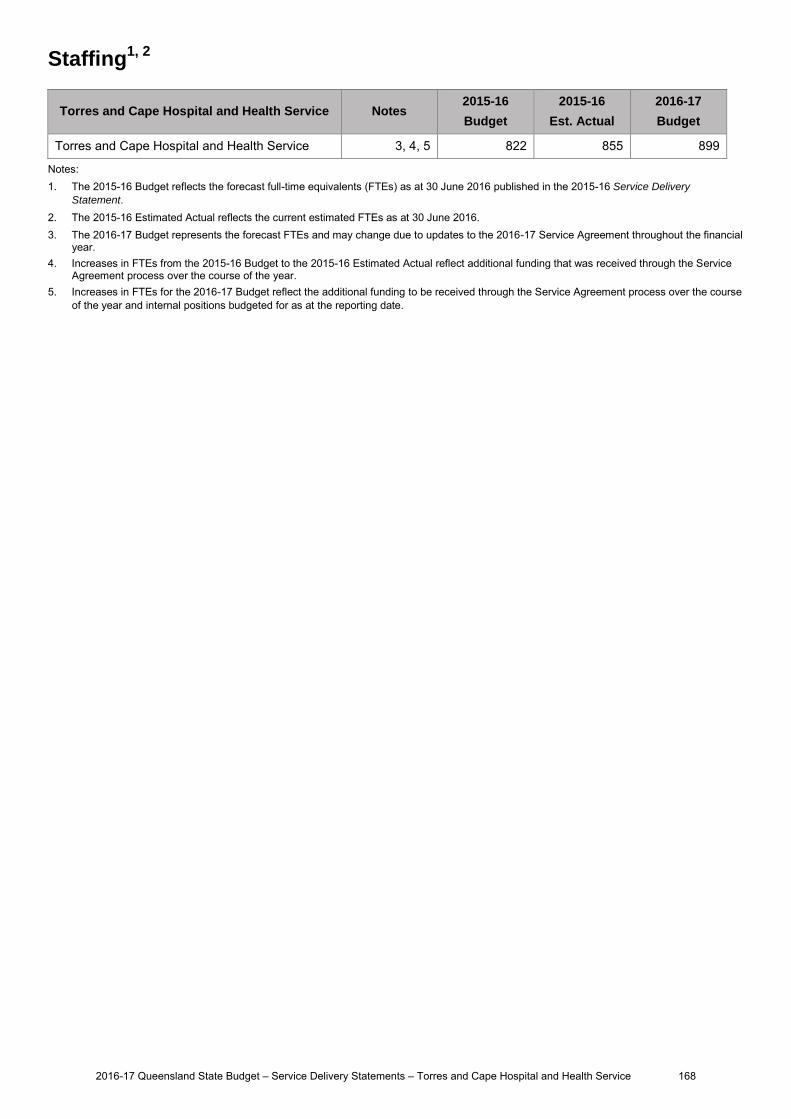
Staffing1, 2
Torres and Cape Hospital and Health Service Notes 2015-16
Budget
2015-16
Est. Actual
2016-17
Budget
Torres and Cape Hospital and Health Service 3, 4, 5 822 855 899
Notes: 1. The 2015-16 Budget reflects the forecast full-time equivalents (FTEs) as at 30 June 2016 published in the 2015-16 Service Delivery
Statement. 2. The 2015-16 Estimated Actual reflects the current estimated FTEs as at 30 June 2016. 3. The 2016-17 Budget represents the forecast FTEs and may change due to updates to the 2016-17 Service Agreement throughout the financial
year. 4. Increases in FTEs from the 2015-16 Budget to the 2015-16 Estimated Actual reflect additional funding that was received through the Service
Agreement process over the course of the year. 5. Increases in FTEs for the 2016-17 Budget reflect the additional funding to be received through the Service Agreement process over the course
of the year and internal positions budgeted for as at the reporting date.
2016-17 Queensland State Budget – Service Delivery Statements – Torres and Cape Hospital and Health Service 168

Income statement
Torres and Cape Hospital and Health Service Notes 2015-16 Budget
$'000
2015-16 Est. Act.
$'000
2016-17 Budget
$'000
INCOME
User charges and fees 1,8,16 170,496 180,009 189,304
Grants and other contributions 2,9,17 8,048 11,364 11,136
Interest 3,10 38 24 24
Other revenue 4,11 923 689 689
Gains on sale/revaluation of assets .. .. ..
Total income 179,505 192,086 201,153
EXPENSES
Employee expenses 5,12,18 8,086 9,180 9,200
Supplies and Services:
Other supplies and services 70,432 72,778 71,170
Department of Health contract staff 6,13,19 89,226 98,529 108,952
Grants and subsidies .. .. ..
Depreciation and amortisation 7,14,20 11,230 11,068 11,326
Finance/borrowing costs .. .. ..
Other expenses 15,21 526 526 500
Losses on sale/revaluation of assets 5 5 5
Total expenses 179,505 192,086 201,153
OPERATING SURPLUS/(DEFICIT) .. .. ..
2016-17 Queensland State Budget – Service Delivery Statements – Torres and Cape Hospital and Health Service 169

Balance sheet
Torres and Cape Hospital and Health Service Notes 2015-16 Budget
$'000
2015-16 Est. Act.
$'000
2016-17 Budget
$'000
CURRENT ASSETS
Cash assets 22,31,40 13,928 15,679 16,423
Receivables 23,32,41 (4,430) 2,731 2,897
Other financial assets .. .. ..
Inventories 24,33,42 400 561 568
Other 25,34 43 96 96
Non-financial assets held for sale .. .. ..
Total current assets 9,941 19,067 19,984
NON-CURRENT ASSETS
Receivables .. .. ..
Other financial assets .. .. ..
Property, plant and equipment 26,35,43 211,994 205,150 212,278
Intangibles .. .. ..
Other .. .. ..
Total non-current assets 211,994 205,150 212,278
TOTAL ASSETS 221,935 224,217 232,262
CURRENT LIABILITIES
Payables 27,36,44 11,369 8,883 9,204
Accrued employee benefits 28,37,45 18 1,208 1,804
Interest bearing liabilities and derivatives .. .. ..
Provisions .. .. ..
Other 29,38 680 1,426 1,426
Total current liabilities 12,067 11,517 12,434
NON-CURRENT LIABILITIES
Payables .. .. ..
Accrued employee benefits .. .. ..
Interest bearing liabilities and derivatives .. .. ..
Provisions .. .. ..
Other .. .. ..
Total non-current liabilities .. .. ..
TOTAL LIABILITIES 12,067 11,517 12,434
NET ASSETS/(LIABILITIES) 209,868 212,700 219,828
EQUITY
TOTAL EQUITY 30,39,46 209,868 212,700 219,828
2016-17 Queensland State Budget – Service Delivery Statements – Torres and Cape Hospital and Health Service 170

Cash flow statement
Torres and Cape Hospital and Health Service Notes 2015-16 Budget
$'000
2015-16 Est. Act.
$'000
2016-17 Budget
$'000
CASH FLOWS FROM OPERATING ACTIVITIES
Inflows:
User charges and fees 47,59,72 170,351 179,864 189,140
Grants and other contributions 48,60,73 8,048 11,364 11,136
Interest received 49,61 38 24 24
Other 50,62 4,826 4,592 4,592
Outflows:
Employee costs 51,63,74 (8,096) (8,595) (8,604)
Supplies and services 52,64 (166,865) (178,514) (183,718)
Grants and subsidies .. .. ..
Borrowing costs .. .. ..
Other 65,75 (526) (526) (500)
Net cash provided by or used in operating activities 7,776 8,209 12,070
CASH FLOWS FROM INVESTING ACTIVITIES
Inflows:
Sales of non-financial assets .. .. ..
Investments redeemed .. .. ..
Loans and advances redeemed .. .. ..
Outflows:
Payments for non-financial assets 53,66,76 (2,351) (5,687) (1,969)
Payments for investments .. .. ..
Loans and advances made .. .. ..
Net cash provided by or used in investing activities (2,351) (5,687) (1,969)
CASH FLOWS FROM FINANCING ACTIVITIES
Inflows:
Borrowings .. .. ..
Equity injections 54,67,77 2,351 3,176 1,969
Outflows:
Borrowing redemptions .. .. ..
Finance lease payments .. .. ..
Equity withdrawals 55,68,78 (11,230) (11,068) (11,326)
Net cash provided by or used in financing activities (8,879) (7,892) (9,357)
Net increase/(decrease) in cash held 56,69,79 (3,454) (5,370) 744
Cash at the beginning of financial year 57,70,80 17,382 21,049 15,679
Cash transfers from restructure .. .. ..
Cash at the end of financial year 58,71,81 13,928 15,679 16,423
2016-17 Queensland State Budget – Service Delivery Statements – Torres and Cape Hospital and Health Service 171
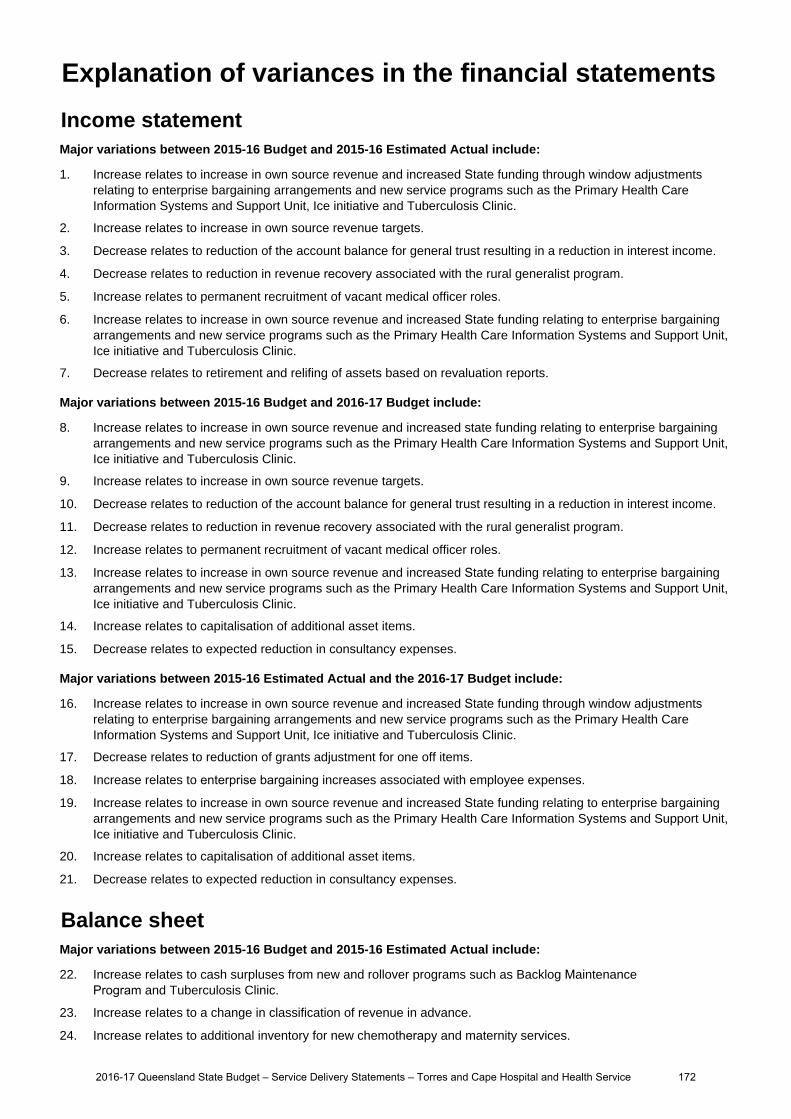
Income statementMajor variations between 2015-16 Budget and 2015-16 Estimated Actual include:
1. Increase relates to increase in own source revenue and increased State funding through window adjustmentsrelating to enterprise bargaining arrangements and new service programs such as the Primary Health CareInformation Systems and Support Unit, Ice initiative and Tuberculosis Clinic.
2. Increase relates to increase in own source revenue targets.
3. Decrease relates to reduction of the account balance for general trust resulting in a reduction in interest income.
4. Decrease relates to reduction in revenue recovery associated with the rural generalist program.
5. Increase relates to permanent recruitment of vacant medical officer roles.
6. Increase relates to increase in own source revenue and increased State funding relating to enterprise bargainingarrangements and new service programs such as the Primary Health Care Information Systems and Support Unit,Ice initiative and Tuberculosis Clinic.
7. Decrease relates to retirement and relifing of assets based on revaluation reports.
Major variations between 2015-16 Budget and 2016-17 Budget include:
8. Increase relates to increase in own source revenue and increased state funding relating to enterprise bargainingarrangements and new service programs such as the Primary Health Care Information Systems and Support Unit,Ice initiative and Tuberculosis Clinic.
9. Increase relates to increase in own source revenue targets.
10. Decrease relates to reduction of the account balance for general trust resulting in a reduction in interest income.
11. Decrease relates to reduction in revenue recovery associated with the rural generalist program.
12. Increase relates to permanent recruitment of vacant medical officer roles.
13. Increase relates to increase in own source revenue and increased State funding relating to enterprise bargainingarrangements and new service programs such as the Primary Health Care Information Systems and Support Unit,Ice initiative and Tuberculosis Clinic.
14. Increase relates to capitalisation of additional asset items.
15. Decrease relates to expected reduction in consultancy expenses.
Major variations between 2015-16 Estimated Actual and the 2016-17 Budget include:
16. Increase relates to increase in own source revenue and increased State funding through window adjustmentsrelating to enterprise bargaining arrangements and new service programs such as the Primary Health CareInformation Systems and Support Unit, Ice initiative and Tuberculosis Clinic.
17. Decrease relates to reduction of grants adjustment for one off items.
18. Increase relates to enterprise bargaining increases associated with employee expenses.
19. Increase relates to increase in own source revenue and increased State funding relating to enterprise bargainingarrangements and new service programs such as the Primary Health Care Information Systems and Support Unit,Ice initiative and Tuberculosis Clinic.
20. Increase relates to capitalisation of additional asset items.
21. Decrease relates to expected reduction in consultancy expenses.
Balance sheetMajor variations between 2015-16 Budget and 2015-16 Estimated Actual include:
22. Increase relates to cash surpluses from new and rollover programs such as Backlog MaintenanceProgram and Tuberculosis Clinic.
23. Increase relates to a change in classification of revenue in advance.
24. Increase relates to additional inventory for new chemotherapy and maternity services.
Explanation of variances in the financial statements
2016-17 Queensland State Budget – Service Delivery Statements – Torres and Cape Hospital and Health Service 172

25. Increase relates to additional prepayments, eg. leases and rates.
26. Decrease relates to adjustment for transfer of housing to Department of Housing and Public Works.
27. Decrease relates to settlement of payables and change in payable class due to a reclassification of QueenslandHealth employees as Torres and Cape Hospital and Health Service employees.
28. Increase relates to change in payable class due to a reclassification of Queensland Health employees asTorres and Cape Hospital and Health Service employees.
29. Increase relates to an expected increase in unearned revenue.
30. Increase relates to accumulated surpluses from 2014-15 financial performance.
Major variations between 2015-16 Budget and 2016-17 Budget include:
31. Increase relates to expected cash reserves from retained surplus position.
32. Increase relates to a change in classification of revenue in advance.
33. Increase relates to additional inventory for new chemotherapy and maternity services.
34. Increase relates to additional prepayments.
35. Increase relates to capitalisation of additional asset items.
36. Decrease relates to settlement of payables and change in payable class due to a reclassification of QueenslandHealth employees as Torres and Cape Hospital and Health Service employees.
37. Increase relates to change in payable class due to a reclassification of Queensland Health employees asTorres and Cape Hospital and Health Service employees.
38. Increase relates to an expected increase in unearned revenue.
39. Increase relates to asset revaluation surplus expected increase in value on conclusion of the BacklogMaintenance Program.
Major variations between 2015-16 Estimated Actual and the 2016-17 Budget include:
40. Increase relates to expected added cash from retained surplus position.
41. Increase relates to expected increased billings linked to increased own source revenue.
42. Increase relates to inventory price increases.
43. Increase relates to capitalisation of Backlog maintenance related items.
44. Increase relates to additional payables related to deferrals and new programs.
45. Increase relates to change in payable class due to a reclassification of Queensland Health employees asTorres and Cape Hospital and Health Service employees.
46. Increase relates to asset revaluation surplus expected increase in value on conclusion of the BacklogMaintenance Program.
Cash flow statementMajor variations between 2015-16 Budget and 2015-16 Estimated Actual include:
47. Increase relates to increase in own source revenue and increased State funding through window adjustmentsrelating to enterprise bargaining arrangements and new service programs such as the Primary Health CareInformation Systems and Support Unit, Ice initiative and Tuberculosis Clinic.
48. Increase relates to increase in own source revenue targets.
49. Decrease relates to reduction of the account balance for general trust resulting in a reduction in interest income.
50. Decrease relates to reduction in revenue recovery associated with the rural generalist program.
51. Increase relates to permanent recruitment of vacant medical officer roles.
52. Increase relates to deferral of programs such as the Backlog Maintenance Program and new service programssuch as the Primary Health Care Information Systems and Support Unit, Ice initiative and Tuberculosis Clinic.
53. Increase relates to increased minor capital expenditure.
54. Increase relates to increased minor capital expenditure.
2016-17 Queensland State Budget – Service Delivery Statements – Torres and Cape Hospital and Health Service 173
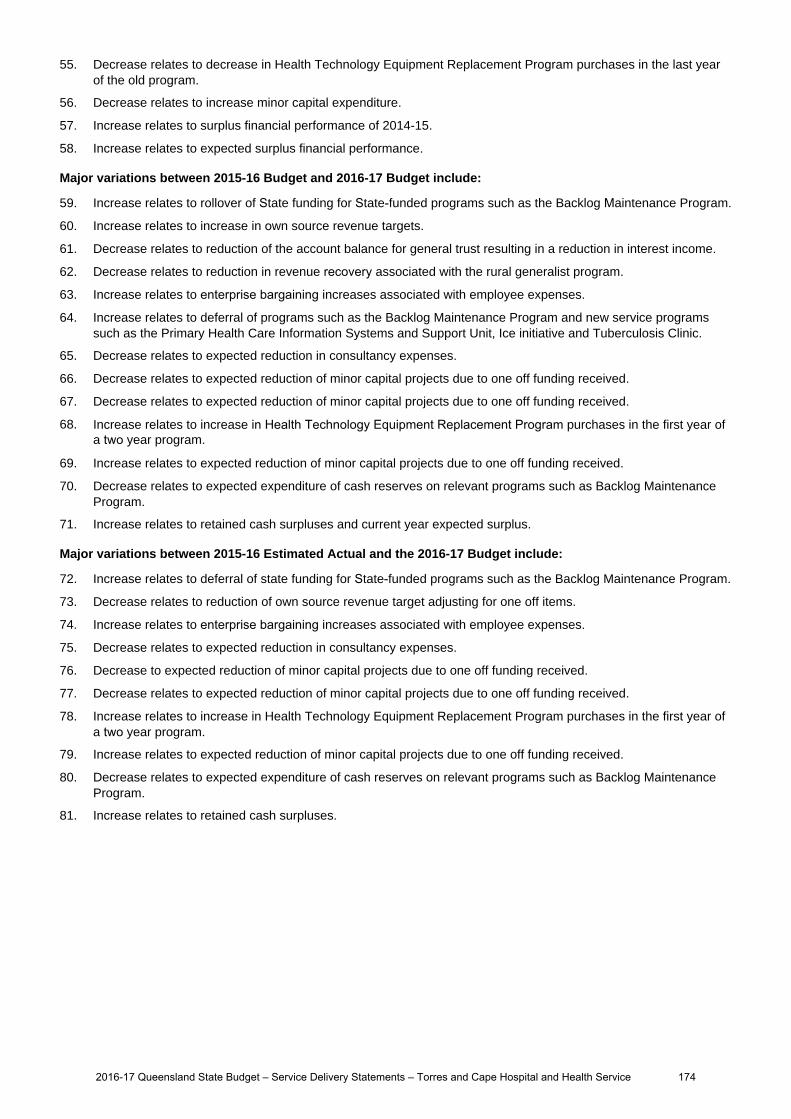
55. Decrease relates to decrease in Health Technology Equipment Replacement Program purchases in the last yearof the old program.
56. Decrease relates to increase minor capital expenditure.
57. Increase relates to surplus financial performance of 2014-15.
58. Increase relates to expected surplus financial performance.
Major variations between 2015-16 Budget and 2016-17 Budget include:
59. Increase relates to rollover of State funding for State-funded programs such as the Backlog Maintenance Program.
60. Increase relates to increase in own source revenue targets.
61. Decrease relates to reduction of the account balance for general trust resulting in a reduction in interest income.
62. Decrease relates to reduction in revenue recovery associated with the rural generalist program.
63. Increase relates to enterprise bargaining increases associated with employee expenses.
64. Increase relates to deferral of programs such as the Backlog Maintenance Program and new service programssuch as the Primary Health Care Information Systems and Support Unit, Ice initiative and Tuberculosis Clinic.
65. Decrease relates to expected reduction in consultancy expenses.
66. Decrease relates to expected reduction of minor capital projects due to one off funding received.
67. Decrease relates to expected reduction of minor capital projects due to one off funding received.
68. Increase relates to increase in Health Technology Equipment Replacement Program purchases in the first year ofa two year program.
69. Increase relates to expected reduction of minor capital projects due to one off funding received.
70. Decrease relates to expected expenditure of cash reserves on relevant programs such as Backlog MaintenanceProgram.
71. Increase relates to retained cash surpluses and current year expected surplus.
Major variations between 2015-16 Estimated Actual and the 2016-17 Budget include:
72. Increase relates to deferral of state funding for State-funded programs such as the Backlog Maintenance Program.
73. Decrease relates to reduction of own source revenue target adjusting for one off items.
74. Increase relates to enterprise bargaining increases associated with employee expenses.
75. Decrease relates to expected reduction in consultancy expenses.
76. Decrease to expected reduction of minor capital projects due to one off funding received.
77. Decrease relates to expected reduction of minor capital projects due to one off funding received.
78. Increase relates to increase in Health Technology Equipment Replacement Program purchases in the first year ofa two year program.
79. Increase relates to expected reduction of minor capital projects due to one off funding received.
80. Decrease relates to expected expenditure of cash reserves on relevant programs such as Backlog MaintenanceProgram.
81. Increase relates to retained cash surpluses.
2016-17 Queensland State Budget – Service Delivery Statements – Torres and Cape Hospital and Health Service 174
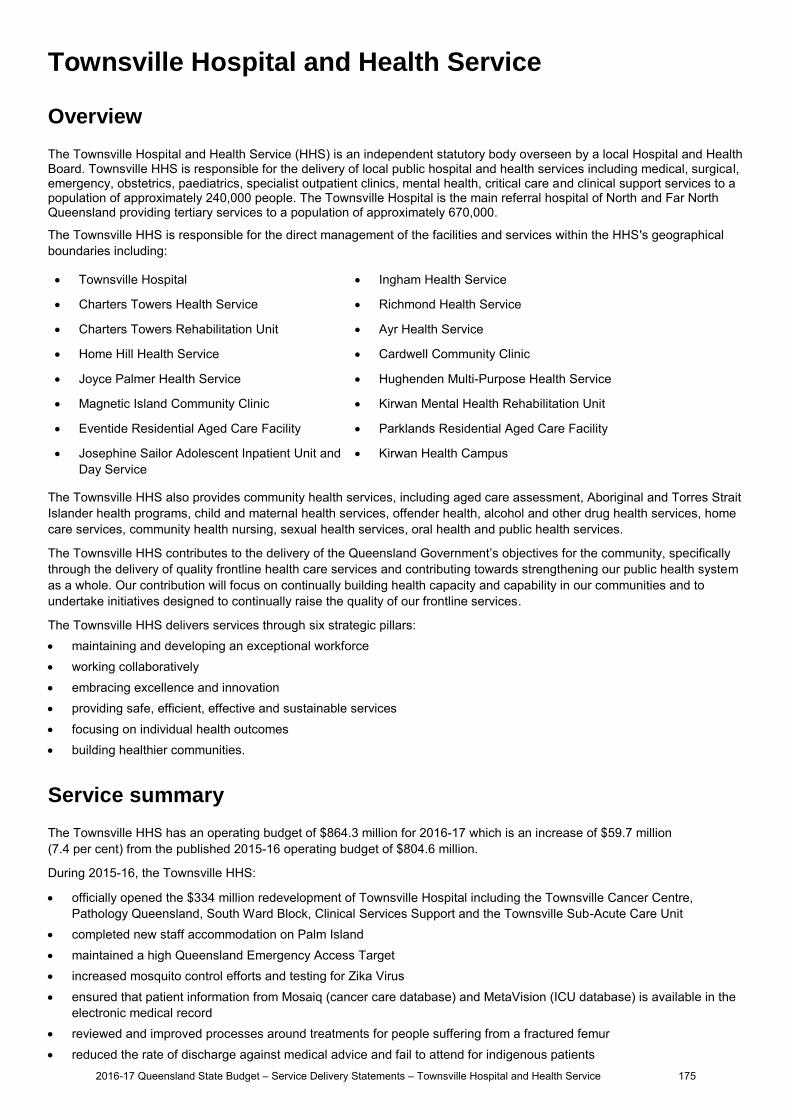
Townsville Hospital and Health Service
Overview
The Townsville Hospital and Health Service (HHS) is an independent statutory body overseen by a local Hospital and Health Board. Townsville HHS is responsible for the delivery of local public hospital and health services including medical, surgical, emergency, obstetrics, paediatrics, specialist outpatient clinics, mental health, critical care and clinical support services to a population of approximately 240,000 people. The Townsville Hospital is the main referral hospital of North and Far North Queensland providing tertiary services to a population of approximately 670,000.
The Townsville HHS is responsible for the direct management of the facilities and services within the HHS's geographical boundaries including:
Townsville Hospital Ingham Health Service
Charters Towers Health Service Richmond Health Service
Charters Towers Rehabilitation Unit Ayr Health Service
Home Hill Health Service Cardwell Community Clinic
Joyce Palmer Health Service Hughenden Multi-Purpose Health Service
Magnetic Island Community Clinic Kirwan Mental Health Rehabilitation Unit
Eventide Residential Aged Care Facility Parklands Residential Aged Care Facility
Josephine Sailor Adolescent Inpatient Unit and Day Service
Kirwan Health Campus
The Townsville HHS also provides community health services, including aged care assessment, Aboriginal and Torres Strait Islander health programs, child and maternal health services, offender health, alcohol and other drug health services, home care services, community health nursing, sexual health services, oral health and public health services.
The Townsville HHS contributes to the delivery of the Queensland Government’s objectives for the community, specifically through the delivery of quality frontline health care services and contributing towards strengthening our public health system as a whole. Our contribution will focus on continually building health capacity and capability in our communities and to undertake initiatives designed to continually raise the quality of our frontline services.
The Townsville HHS delivers services through six strategic pillars: maintaining and developing an exceptional workforce working collaboratively embracing excellence and innovation providing safe, efficient, effective and sustainable services focusing on individual health outcomes building healthier communities.
Service summary
The Townsville HHS has an operating budget of $864.3 million for 2016-17 which is an increase of $59.7 million (7.4 per cent) from the published 2015-16 operating budget of $804.6 million.
During 2015-16, the Townsville HHS:
officially opened the $334 million redevelopment of Townsville Hospital including the Townsville Cancer Centre, Pathology Queensland, South Ward Block, Clinical Services Support and the Townsville Sub-Acute Care Unit
completed new staff accommodation on Palm Island maintained a high Queensland Emergency Access Target increased mosquito control efforts and testing for Zika Virus ensured that patient information from Mosaiq (cancer care database) and MetaVision (ICU database) is available in the
electronic medical record reviewed and improved processes around treatments for people suffering from a fractured femur reduced the rate of discharge against medical advice and fail to attend for indigenous patients
2016-17 Queensland State Budget – Service Delivery Statements – Townsville Hospital and Health Service 175
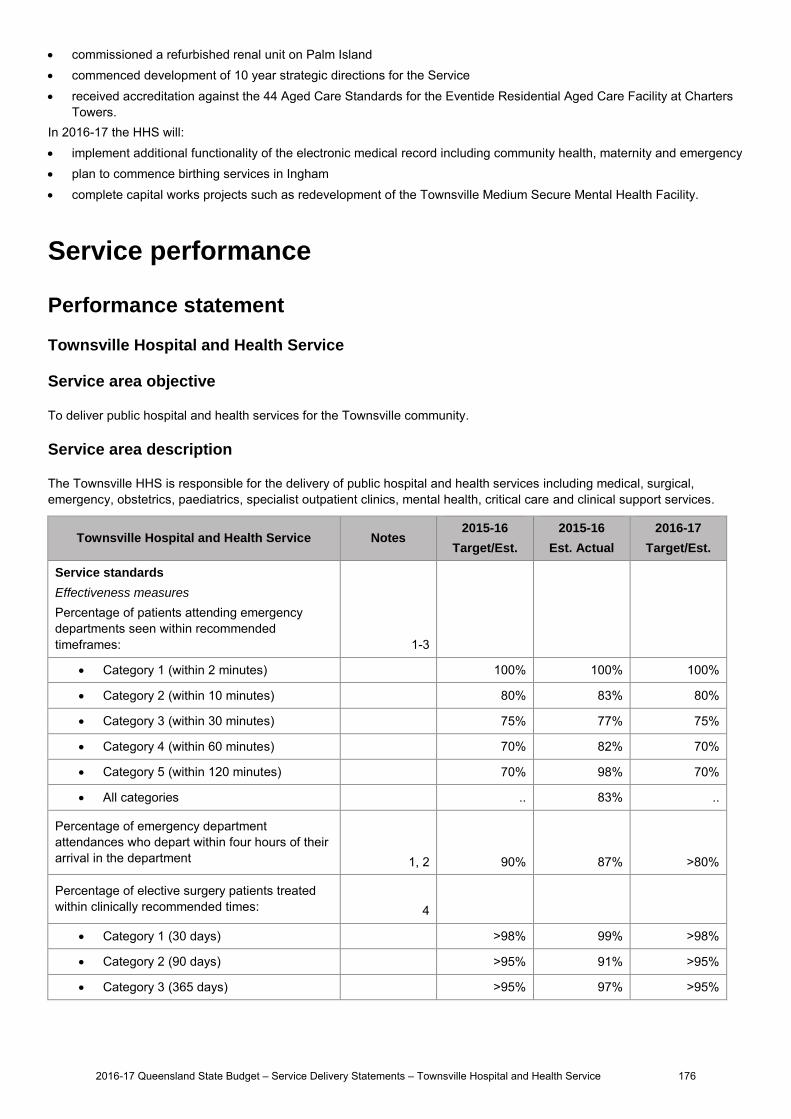
commissioned a refurbished renal unit on Palm Island commenced development of 10 year strategic directions for the Service received accreditation against the 44 Aged Care Standards for the Eventide Residential Aged Care Facility at Charters
Towers. In 2016-17 the HHS will: implement additional functionality of the electronic medical record including community health, maternity and emergency plan to commence birthing services in Ingham complete capital works projects such as redevelopment of the Townsville Medium Secure Mental Health Facility.
Service performance
Performance statement
Townsville Hospital and Health Service
Service area objective
To deliver public hospital and health services for the Townsville community.
Service area description
The Townsville HHS is responsible for the delivery of public hospital and health services including medical, surgical, emergency, obstetrics, paediatrics, specialist outpatient clinics, mental health, critical care and clinical support services.
Townsville Hospital and Health Service Notes 2015-16
Target/Est.
2015-16
Est. Actual
2016-17
Target/Est.
Service standards
Effectiveness measures
Percentage of patients attending emergency departments seen within recommended timeframes:
1-3
Category 1 (within 2 minutes) 100% 100% 100%
Category 2 (within 10 minutes) 80% 83% 80%
Category 3 (within 30 minutes) 75% 77% 75%
Category 4 (within 60 minutes) 70% 82% 70%
Category 5 (within 120 minutes) 70% 98% 70%
All categories .. 83% ..
Percentage of emergency department attendances who depart within four hours of their arrival in the department 1, 2 90% 87% >80%
Percentage of elective surgery patients treated within clinically recommended times: 4
Category 1 (30 days) >98% 99% >98%
Category 2 (90 days) >95% 91% >95%
Category 3 (365 days) >95% 97% >95%
2016-17 Queensland State Budget – Service Delivery Statements – Townsville Hospital and Health Service 176
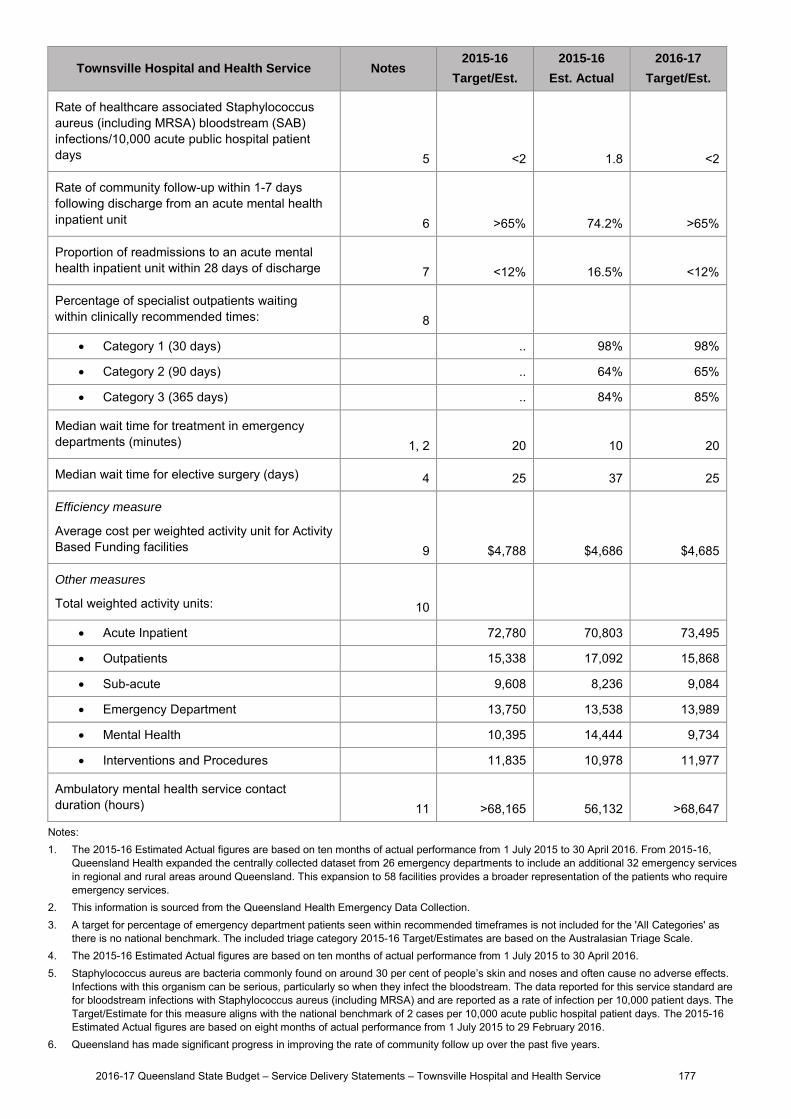
Townsville Hospital and Health Service Notes 2015-16
Target/Est.
2015-16
Est. Actual
2016-17
Target/Est.
Rate of healthcare associated Staphylococcus aureus (including MRSA) bloodstream (SAB) infections/10,000 acute public hospital patient days 5 <2 1.8 <2
Rate of community follow-up within 1-7 days following discharge from an acute mental health inpatient unit 6 >65% 74.2% >65%
Proportion of readmissions to an acute mental health inpatient unit within 28 days of discharge 7 <12% 16.5% <12%
Percentage of specialist outpatients waiting within clinically recommended times: 8
Category 1 (30 days) .. 98% 98%
Category 2 (90 days) .. 64% 65%
Category 3 (365 days) .. 84% 85%
Median wait time for treatment in emergency departments (minutes) 1, 2 20 10 20
Median wait time for elective surgery (days) 4 25 37 25
Efficiency measure
Average cost per weighted activity unit for Activity Based Funding facilities 9 $4,788 $4,686 $4,685
Other measures
Total weighted activity units: 10
Acute Inpatient 72,780 70,803 73,495
Outpatients 15,338 17,092 15,868
Sub-acute 9,608 8,236 9,084
Emergency Department 13,750 13,538 13,989
Mental Health 10,395 14,444 9,734
Interventions and Procedures 11,835 10,978 11,977
Ambulatory mental health service contact duration (hours) 11 >68,165 56,132 >68,647
Notes: 1. The 2015-16 Estimated Actual figures are based on ten months of actual performance from 1 July 2015 to 30 April 2016. From 2015-16,
Queensland Health expanded the centrally collected dataset from 26 emergency departments to include an additional 32 emergency services in regional and rural areas around Queensland. This expansion to 58 facilities provides a broader representation of the patients who require emergency services.
2. This information is sourced from the Queensland Health Emergency Data Collection. 3. A target for percentage of emergency department patients seen within recommended timeframes is not included for the 'All Categories' as
there is no national benchmark. The included triage category 2015-16 Target/Estimates are based on the Australasian Triage Scale. 4. The 2015-16 Estimated Actual figures are based on ten months of actual performance from 1 July 2015 to 30 April 2016. 5. Staphylococcus aureus are bacteria commonly found on around 30 per cent of people’s skin and noses and often cause no adverse effects.
Infections with this organism can be serious, particularly so when they infect the bloodstream. The data reported for this service standard are for bloodstream infections with Staphylococcus aureus (including MRSA) and are reported as a rate of infection per 10,000 patient days. The Target/Estimate for this measure aligns with the national benchmark of 2 cases per 10,000 acute public hospital patient days. The 2015-16 Estimated Actual figures are based on eight months of actual performance from 1 July 2015 to 29 February 2016.
6. Queensland has made significant progress in improving the rate of community follow up over the past five years.
2016-17 Queensland State Budget – Service Delivery Statements – Townsville Hospital and Health Service 177
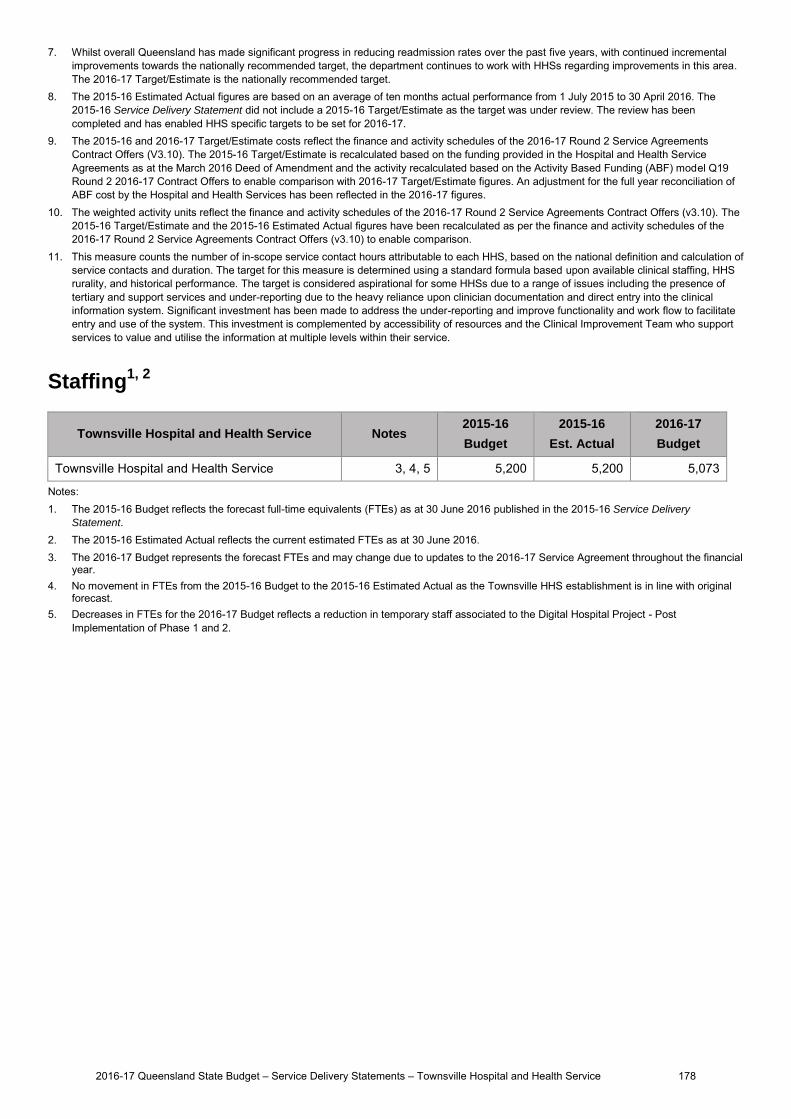
7. Whilst overall Queensland has made significant progress in reducing readmission rates over the past five years, with continued incremental improvements towards the nationally recommended target, the department continues to work with HHSs regarding improvements in this area. The 2016-17 Target/Estimate is the nationally recommended target.
8. The 2015-16 Estimated Actual figures are based on an average of ten months actual performance from 1 July 2015 to 30 April 2016. The 2015-16 Service Delivery Statement did not include a 2015-16 Target/Estimate as the target was under review. The review has been completed and has enabled HHS specific targets to be set for 2016-17.
9. The 2015-16 and 2016-17 Target/Estimate costs reflect the finance and activity schedules of the 2016-17 Round 2 Service Agreements Contract Offers (V3.10). The 2015-16 Target/Estimate is recalculated based on the funding provided in the Hospital and Health Service Agreements as at the March 2016 Deed of Amendment and the activity recalculated based on the Activity Based Funding (ABF) model Q19 Round 2 2016-17 Contract Offers to enable comparison with 2016-17 Target/Estimate figures. An adjustment for the full year reconciliation of ABF cost by the Hospital and Health Services has been reflected in the 2016-17 figures.
10. The weighted activity units reflect the finance and activity schedules of the 2016-17 Round 2 Service Agreements Contract Offers (v3.10). The 2015-16 Target/Estimate and the 2015-16 Estimated Actual figures have been recalculated as per the finance and activity schedules of the 2016-17 Round 2 Service Agreements Contract Offers (v3.10) to enable comparison.
11. This measure counts the number of in-scope service contact hours attributable to each HHS, based on the national definition and calculation of service contacts and duration. The target for this measure is determined using a standard formula based upon available clinical staffing, HHS rurality, and historical performance. The target is considered aspirational for some HHSs due to a range of issues including the presence of tertiary and support services and under-reporting due to the heavy reliance upon clinician documentation and direct entry into the clinical information system. Significant investment has been made to address the under-reporting and improve functionality and work flow to facilitate entry and use of the system. This investment is complemented by accessibility of resources and the Clinical Improvement Team who support services to value and utilise the information at multiple levels within their service.
Staffing1, 2
Townsville Hospital and Health Service Notes 2015-16
Budget
2015-16
Est. Actual
2016-17
Budget
Townsville Hospital and Health Service 3, 4, 5 5,200 5,200 5,073
Notes: 1. The 2015-16 Budget reflects the forecast full-time equivalents (FTEs) as at 30 June 2016 published in the 2015-16 Service Delivery
Statement. 2. The 2015-16 Estimated Actual reflects the current estimated FTEs as at 30 June 2016. 3. The 2016-17 Budget represents the forecast FTEs and may change due to updates to the 2016-17 Service Agreement throughout the financial
year. 4. No movement in FTEs from the 2015-16 Budget to the 2015-16 Estimated Actual as the Townsville HHS establishment is in line with original
forecast. 5. Decreases in FTEs for the 2016-17 Budget reflects a reduction in temporary staff associated to the Digital Hospital Project - Post
Implementation of Phase 1 and 2.
2016-17 Queensland State Budget – Service Delivery Statements – Townsville Hospital and Health Service 178
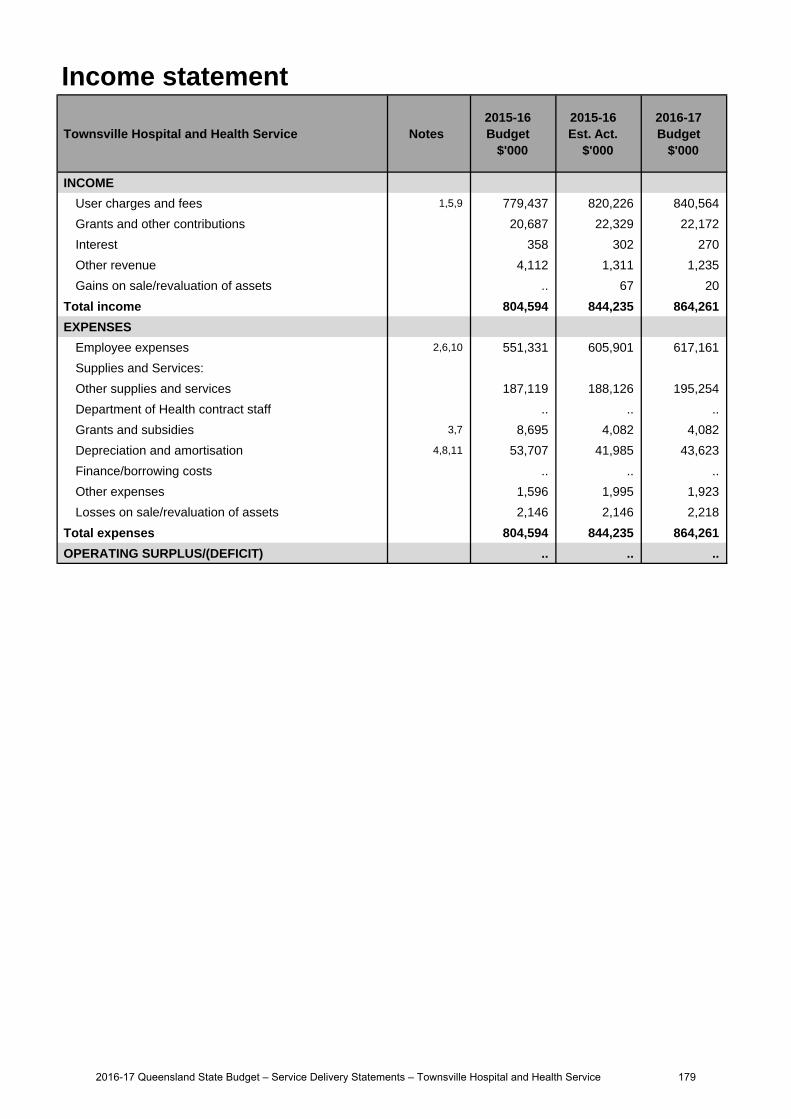
Income statement
Townsville Hospital and Health Service Notes 2015-16 Budget
$'000
2015-16 Est. Act.
$'000
2016-17 Budget
$'000
INCOME
User charges and fees 1,5,9 779,437 820,226 840,564
Grants and other contributions 20,687 22,329 22,172
Interest 358 302 270
Other revenue 4,112 1,311 1,235
Gains on sale/revaluation of assets .. 67 20
Total income 804,594 844,235 864,261
EXPENSES
Employee expenses 2,6,10 551,331 605,901 617,161
Supplies and Services:
Other supplies and services 187,119 188,126 195,254
Department of Health contract staff .. .. ..
Grants and subsidies 3,7 8,695 4,082 4,082
Depreciation and amortisation 4,8,11 53,707 41,985 43,623
Finance/borrowing costs .. .. ..
Other expenses 1,596 1,995 1,923
Losses on sale/revaluation of assets 2,146 2,146 2,218
Total expenses 804,594 844,235 864,261
OPERATING SURPLUS/(DEFICIT) .. .. ..
2016-17 Queensland State Budget – Service Delivery Statements – Townsville Hospital and Health Service 179
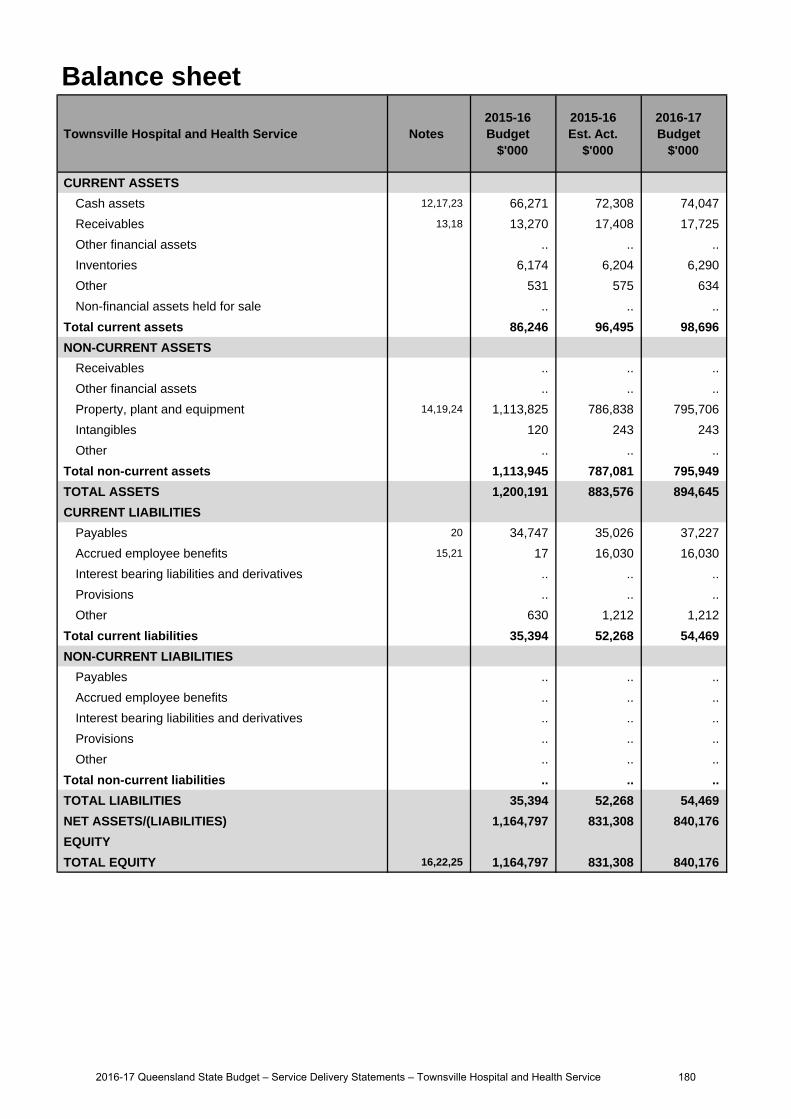
Balance sheet
Townsville Hospital and Health Service Notes 2015-16 Budget
$'000
2015-16 Est. Act.
$'000
2016-17 Budget
$'000
CURRENT ASSETS
Cash assets 12,17,23 66,271 72,308 74,047
Receivables 13,18 13,270 17,408 17,725
Other financial assets .. .. ..
Inventories 6,174 6,204 6,290
Other 531 575 634
Non-financial assets held for sale .. .. ..
Total current assets 86,246 96,495 98,696
NON-CURRENT ASSETS
Receivables .. .. ..
Other financial assets .. .. ..
Property, plant and equipment 14,19,24 1,113,825 786,838 795,706
Intangibles 120 243 243
Other .. .. ..
Total non-current assets 1,113,945 787,081 795,949
TOTAL ASSETS 1,200,191 883,576 894,645
CURRENT LIABILITIES
Payables 20 34,747 35,026 37,227
Accrued employee benefits 15,21 17 16,030 16,030
Interest bearing liabilities and derivatives .. .. ..
Provisions .. .. ..
Other 630 1,212 1,212
Total current liabilities 35,394 52,268 54,469
NON-CURRENT LIABILITIES
Payables .. .. ..
Accrued employee benefits .. .. ..
Interest bearing liabilities and derivatives .. .. ..
Provisions .. .. ..
Other .. .. ..
Total non-current liabilities .. .. ..
TOTAL LIABILITIES 35,394 52,268 54,469
NET ASSETS/(LIABILITIES) 1,164,797 831,308 840,176
EQUITY
TOTAL EQUITY 16,22,25 1,164,797 831,308 840,176
2016-17 Queensland State Budget – Service Delivery Statements – Townsville Hospital and Health Service 180

Cash flow statement
Townsville Hospital and Health Service Notes 2015-16 Budget
$'000
2015-16 Est. Act.
$'000
2016-17 Budget
$'000
CASH FLOWS FROM OPERATING ACTIVITIES
Inflows:
User charges and fees 26,30,33 777,130 817,919 838,150
Grants and other contributions 20,687 22,329 22,172
Interest received 358 302 270
Other 20,063 17,262 17,186
Outflows:
Employee costs 27,31,34 (551,331) (605,901) (617,161)
Supplies and services (223,283) (199,290) (209,270)
Grants and subsidies 28,32 (8,695) (4,082) (4,082)
Borrowing costs .. .. ..
Other (1,596) (1,995) (1,923)
Net cash provided by or used in operating activities 33,333 46,544 45,342
CASH FLOWS FROM INVESTING ACTIVITIES
Inflows:
Sales of non-financial assets .. 67 20
Investments redeemed .. .. ..
Loans and advances redeemed .. .. ..
Outflows:
Payments for non-financial assets 29 (11,886) (17,086) (8,270)
Payments for investments .. .. ..
Loans and advances made .. .. ..
Net cash provided by or used in investing activities (11,886) (17,019) (8,250)
CASH FLOWS FROM FINANCING ACTIVITIES
Inflows:
Borrowings .. .. ..
Equity injections 11,886 12,990 8,270
Outflows:
Borrowing redemptions .. .. ..
Finance lease payments .. .. ..
Equity withdrawals (53,707) (41,985) (43,623)
Net cash provided by or used in financing activities (41,821) (28,995) (35,353)
Net increase/(decrease) in cash held (20,374) 530 1,739
Cash at the beginning of financial year 86,645 71,778 72,308
Cash transfers from restructure .. .. ..
Cash at the end of financial year 66,271 72,308 74,047
2016-17 Queensland State Budget – Service Delivery Statements – Townsville Hospital and Health Service 181
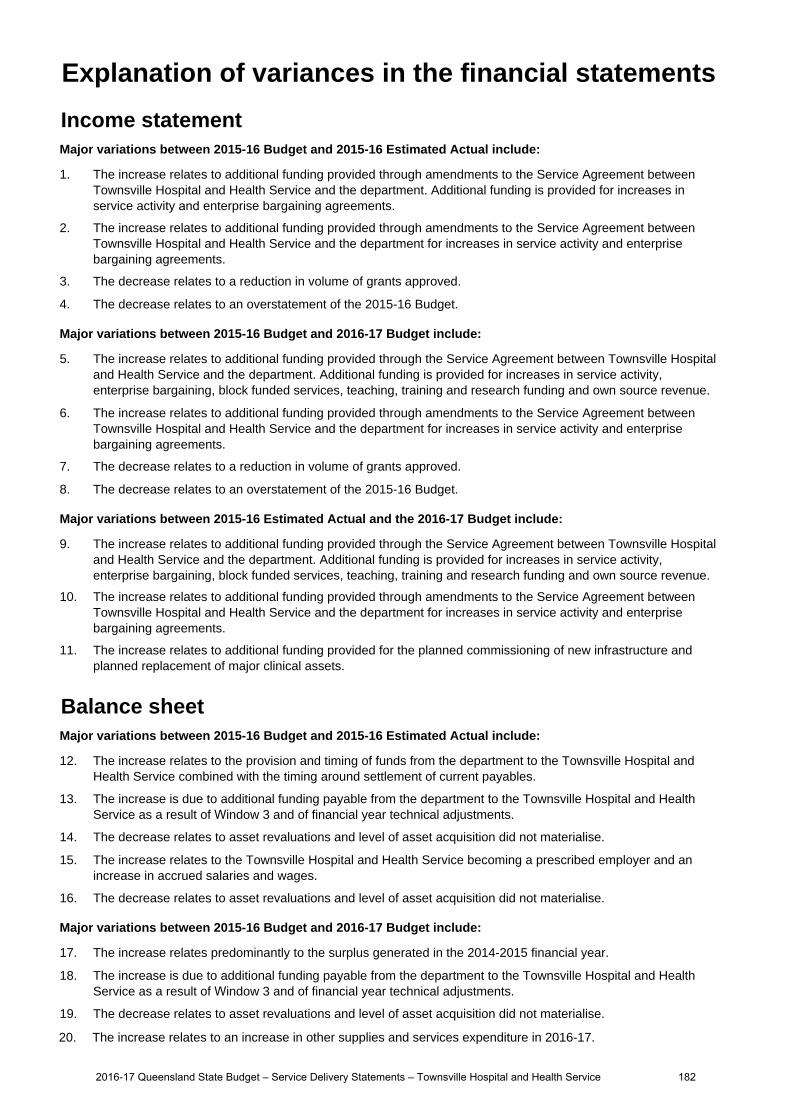
Income statementMajor variations between 2015-16 Budget and 2015-16 Estimated Actual include:
1. The increase relates to additional funding provided through amendments to the Service Agreement betweenTownsville Hospital and Health Service and the department. Additional funding is provided for increases inservice activity and enterprise bargaining agreements.
2. The increase relates to additional funding provided through amendments to the Service Agreement betweenTownsville Hospital and Health Service and the department for increases in service activity and enterprisebargaining agreements.
3. The decrease relates to a reduction in volume of grants approved.
4. The decrease relates to an overstatement of the 2015-16 Budget.
Major variations between 2015-16 Budget and 2016-17 Budget include:
5. The increase relates to additional funding provided through the Service Agreement between Townsville Hospitaland Health Service and the department. Additional funding is provided for increases in service activity,enterprise bargaining, block funded services, teaching, training and research funding and own source revenue.
6. The increase relates to additional funding provided through amendments to the Service Agreement betweenTownsville Hospital and Health Service and the department for increases in service activity and enterprisebargaining agreements.
7. The decrease relates to a reduction in volume of grants approved.
8. The decrease relates to an overstatement of the 2015-16 Budget.
Major variations between 2015-16 Estimated Actual and the 2016-17 Budget include:
9. The increase relates to additional funding provided through the Service Agreement between Townsville Hospitaland Health Service and the department. Additional funding is provided for increases in service activity,enterprise bargaining, block funded services, teaching, training and research funding and own source revenue.
10. The increase relates to additional funding provided through amendments to the Service Agreement betweenTownsville Hospital and Health Service and the department for increases in service activity and enterprisebargaining agreements.
11. The increase relates to additional funding provided for the planned commissioning of new infrastructure andplanned replacement of major clinical assets.
Balance sheetMajor variations between 2015-16 Budget and 2015-16 Estimated Actual include:
12. The increase relates to the provision and timing of funds from the department to the Townsville Hospital andHealth Service combined with the timing around settlement of current payables.
13. The increase is due to additional funding payable from the department to the Townsville Hospital and HealthService as a result of Window 3 and of financial year technical adjustments.
14. The decrease relates to asset revaluations and level of asset acquisition did not materialise.
15. The increase relates to the Townsville Hospital and Health Service becoming a prescribed employer and anincrease in accrued salaries and wages.
16. The decrease relates to asset revaluations and level of asset acquisition did not materialise.
Major variations between 2015-16 Budget and 2016-17 Budget include:
17. The increase relates predominantly to the surplus generated in the 2014-2015 financial year.
18. The increase is due to additional funding payable from the department to the Townsville Hospital and HealthService as a result of Window 3 and of financial year technical adjustments.
19. The decrease relates to asset revaluations and level of asset acquisition did not materialise.
Explanation of variances in the financial statements
20. The increase relates to an increase in other supplies and services expenditure in 2016-17.
2016-17 Queensland State Budget – Service Delivery Statements – Townsville Hospital and Health Service 182
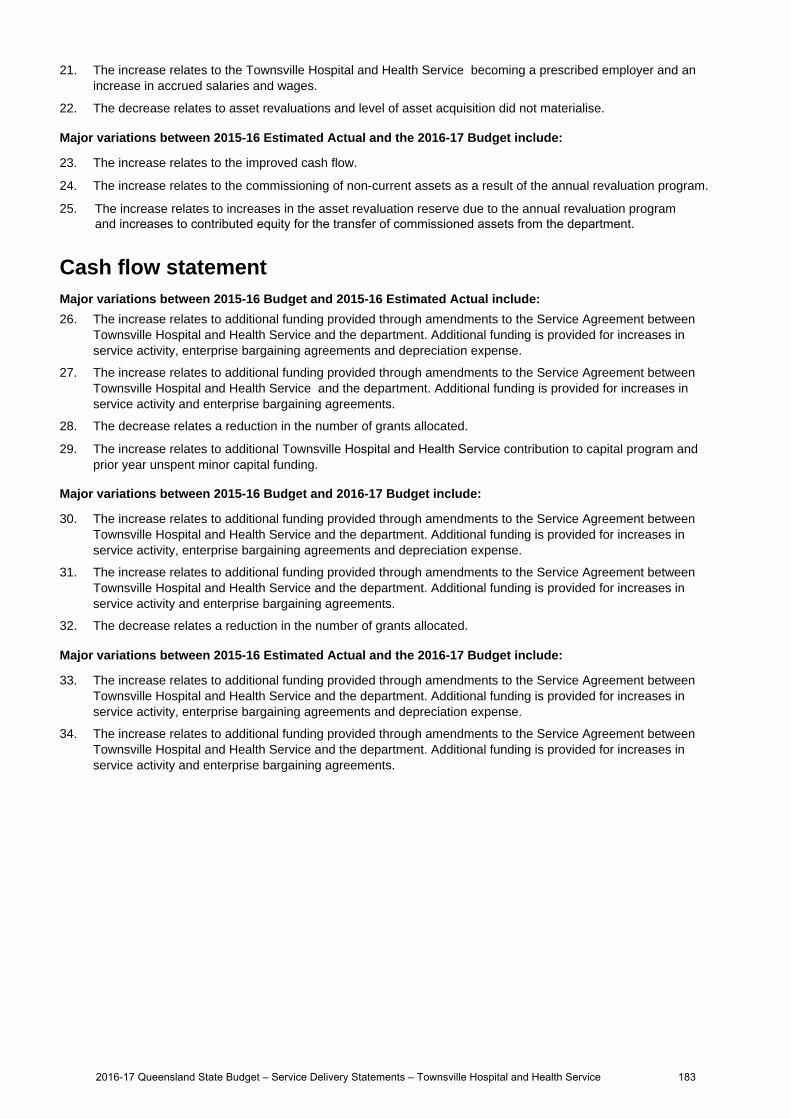
21. The increase relates to the Townsville Hospital and Health Service becoming a prescribed employer and anincrease in accrued salaries and wages.
22. The decrease relates to asset revaluations and level of asset acquisition did not materialise.
Major variations between 2015-16 Estimated Actual and the 2016-17 Budget include:
23. The increase relates to the improved cash flow.
24. The increase relates to the commissioning of non-current assets as a result of the annual revaluation program.
25. The increase relates to increases in the asset revaluation reserve due to the annual revaluation program and increases to contributed equity for the transfer of commissioned assets from the department.
Cash flow statementMajor variations between 2015-16 Budget and 2015-16 Estimated Actual include:
26. The increase relates to additional funding provided through amendments to the Service Agreement betweenTownsville Hospital and Health Service and the department. Additional funding is provided for increases inservice activity, enterprise bargaining agreements and depreciation expense.
27. The increase relates to additional funding provided through amendments to the Service Agreement betweenTownsville Hospital and Health Service and the department. Additional funding is provided for increases inservice activity and enterprise bargaining agreements.
28. The decrease relates a reduction in the number of grants allocated.
29. The increase relates to additional Townsville Hospital and Health Service contribution to capital program andprior year unspent minor capital funding.
Major variations between 2015-16 Budget and 2016-17 Budget include:
30. The increase relates to additional funding provided through amendments to the Service Agreement betweenTownsville Hospital and Health Service and the department. Additional funding is provided for increases inservice activity, enterprise bargaining agreements and depreciation expense.
31. The increase relates to additional funding provided through amendments to the Service Agreement betweenTownsville Hospital and Health Service and the department. Additional funding is provided for increases inservice activity and enterprise bargaining agreements.
32. The decrease relates a reduction in the number of grants allocated.
Major variations between 2015-16 Estimated Actual and the 2016-17 Budget include:
33. The increase relates to additional funding provided through amendments to the Service Agreement betweenTownsville Hospital and Health Service and the department. Additional funding is provided for increases inservice activity, enterprise bargaining agreements and depreciation expense.
34. The increase relates to additional funding provided through amendments to the Service Agreement betweenTownsville Hospital and Health Service and the department. Additional funding is provided for increases inservice activity and enterprise bargaining agreements.
2016-17 Queensland State Budget – Service Delivery Statements – Townsville Hospital and Health Service 183
West Moreton Hospital and Health Service
Overview
The West Moreton Hospital and Health Service (HHS) is an independent statutory body overseen by a local Hospital and Health Board. West Moreton HHS is responsible for the delivery of public hospital and health services, including medical, surgical, emergency, obstetrics, paediatrics, specialist outpatient clinics, mental health, critical care, sub-acute and clinical support services to a population of over approximately 252,000 people residing in a geographical area covering 9,521km which extends from Ipswich in the east, to Boonah in the south, north to Esk and west to Gatton.
West Moreton HHS will experience significant growth in the region with the population expected to increase to approximately 637,000 people by 2036. This equates to an increase in excess of 150 per cent on the current population, making West Moreton the fastest growing population in the State.
West Moreton is responsible for the direct management of the facilities within the health service’s geographical boundaries including:
Ipswich Hospital The Park – Centre for Mental Health
Boonah Health Service Goodna Community Health
Esk Health Service Ipswich Community Health
Gatton Health Service Gailes Community Care Unit
Laidley Health Service
West Moreton HHS also provides school-based primary oral health care services, community mental health services for all age groups and services for alcohol and other drug illnesses. Additionally, West Moreton HHS has a large range of responsibilities for prison health services and statewide services including the Queensland Centre for Mental Health Learning, the Queensland Centre for Mental Health Research and the Queensland Mental Health Benchmarking Unit.
In 2016-17, the West Moreton HHS's strategic objectives are to:
provide excellence in patient and family centred care enable staff to be their best and give their best provide an agile, resilient health service that anticipates and responds to need provide excellence in healthcare delivered through innovation, research and lifelong learning be commercially astute implement integrated systems to transform the delivery of healthcare now and into the future.
West Moreton HHS’s strategic objectives are aligned to the Queensland Government’s objectives of delivering quality frontline services, particularly strengthening our public health system and providing responsive and integrated government services.
Service summary
West Moreton HHS has an operating budget of $512.3 million for 2016-17 which is an increase of $42.5 million (9 per cent) from the published 2015-16 operating budget of $469.8 million.
West Moreton HHS has identified the following key initiatives for 2016-17 to support achievement of its strategic objectives:
define and embed patient and family centred care principles increase awareness about healthcare services available to the community and how they can be accessed implement systems that ensure patients and their families are supported to engage in their healthcare and make
informed decisions strengthen clinical governance develop patient and family co-design models increase self-sufficiency and service capability in line with the healthcare needs of our community invest in new physical infrastructure to meet future population growth develop robust financial management systems to meet current and future healthcare needs with agility
2016-17 Queensland State Budget – Service Delivery Statements – West Moreton Hospital and Health Service 184
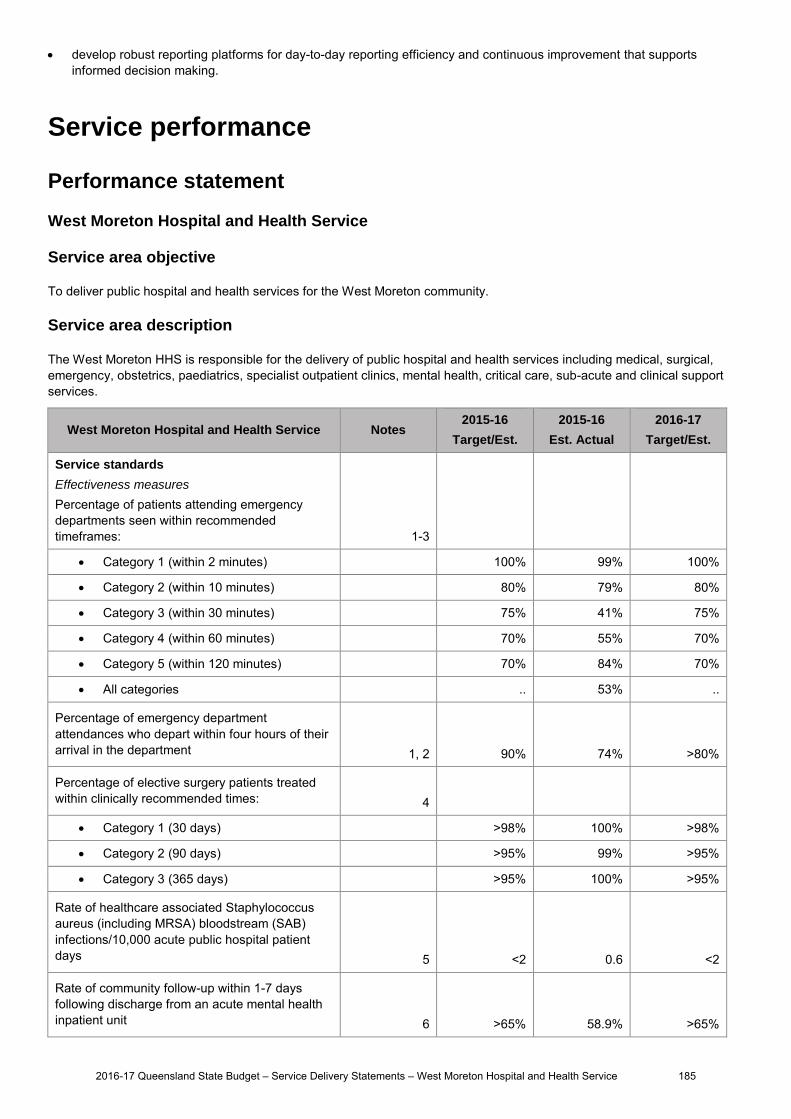
develop robust reporting platforms for day-to-day reporting efficiency and continuous improvement that supports informed decision making.
Service performance
Performance statement
West Moreton Hospital and Health Service
Service area objective
To deliver public hospital and health services for the West Moreton community.
Service area description
The West Moreton HHS is responsible for the delivery of public hospital and health services including medical, surgical, emergency, obstetrics, paediatrics, specialist outpatient clinics, mental health, critical care, sub-acute and clinical support services.
West Moreton Hospital and Health Service Notes 2015-16
Target/Est.
2015-16
Est. Actual
2016-17
Target/Est.
Service standards
Effectiveness measures
Percentage of patients attending emergency departments seen within recommended timeframes:
1-3
Category 1 (within 2 minutes) 100% 99% 100%
Category 2 (within 10 minutes) 80% 79% 80%
Category 3 (within 30 minutes) 75% 41% 75%
Category 4 (within 60 minutes) 70% 55% 70%
Category 5 (within 120 minutes) 70% 84% 70%
All categories .. 53% ..
Percentage of emergency department attendances who depart within four hours of their arrival in the department 1, 2 90% 74% >80%
Percentage of elective surgery patients treated within clinically recommended times: 4
Category 1 (30 days) >98% 100% >98%
Category 2 (90 days) >95% 99% >95%
Category 3 (365 days) >95% 100% >95%
Rate of healthcare associated Staphylococcus aureus (including MRSA) bloodstream (SAB) infections/10,000 acute public hospital patient days 5 <2 0.6 <2
Rate of community follow-up within 1-7 days following discharge from an acute mental health inpatient unit 6 >65% 58.9% >65%
2016-17 Queensland State Budget – Service Delivery Statements – West Moreton Hospital and Health Service 185
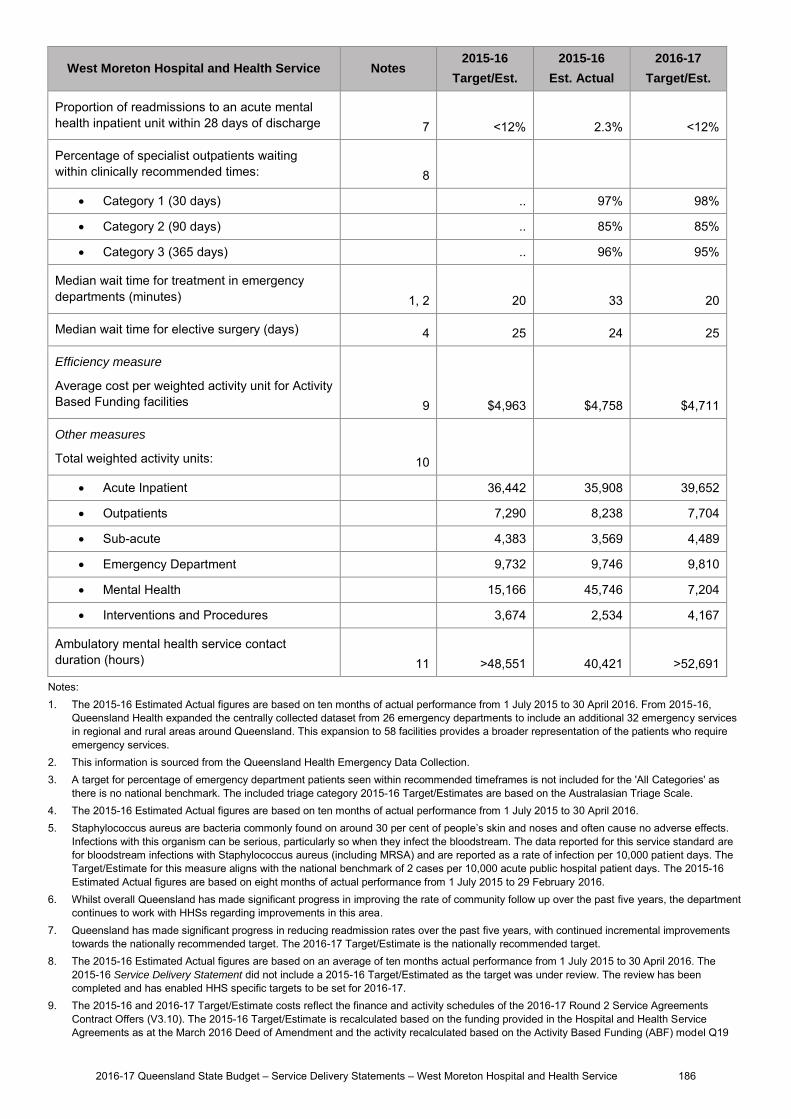
West Moreton Hospital and Health Service Notes 2015-16
Target/Est.
2015-16
Est. Actual
2016-17
Target/Est.
Proportion of readmissions to an acute mental health inpatient unit within 28 days of discharge 7 <12% 2.3% <12%
Percentage of specialist outpatients waiting within clinically recommended times: 8
Category 1 (30 days) .. 97% 98%
Category 2 (90 days) .. 85% 85%
Category 3 (365 days) .. 96% 95%
Median wait time for treatment in emergency departments (minutes) 1, 2 20 33 20
Median wait time for elective surgery (days) 4 25 24 25
Efficiency measure
Average cost per weighted activity unit for Activity Based Funding facilities 9 $4,963 $4,758 $4,711
Other measures
Total weighted activity units: 10
Acute Inpatient 36,442 35,908 39,652
Outpatients 7,290 8,238 7,704
Sub-acute 4,383 3,569 4,489
Emergency Department 9,732 9,746 9,810
Mental Health 15,166 45,746 7,204
Interventions and Procedures 3,674 2,534 4,167
Ambulatory mental health service contact duration (hours) 11 >48,551 40,421 >52,691
Notes: 1. The 2015-16 Estimated Actual figures are based on ten months of actual performance from 1 July 2015 to 30 April 2016. From 2015-16,
Queensland Health expanded the centrally collected dataset from 26 emergency departments to include an additional 32 emergency services in regional and rural areas around Queensland. This expansion to 58 facilities provides a broader representation of the patients who require emergency services.
2. This information is sourced from the Queensland Health Emergency Data Collection. 3. A target for percentage of emergency department patients seen within recommended timeframes is not included for the 'All Categories' as
there is no national benchmark. The included triage category 2015-16 Target/Estimates are based on the Australasian Triage Scale. 4. The 2015-16 Estimated Actual figures are based on ten months of actual performance from 1 July 2015 to 30 April 2016. 5. Staphylococcus aureus are bacteria commonly found on around 30 per cent of people’s skin and noses and often cause no adverse effects.
Infections with this organism can be serious, particularly so when they infect the bloodstream. The data reported for this service standard are for bloodstream infections with Staphylococcus aureus (including MRSA) and are reported as a rate of infection per 10,000 patient days. The Target/Estimate for this measure aligns with the national benchmark of 2 cases per 10,000 acute public hospital patient days. The 2015-16 Estimated Actual figures are based on eight months of actual performance from 1 July 2015 to 29 February 2016.
6. Whilst overall Queensland has made significant progress in improving the rate of community follow up over the past five years, the department continues to work with HHSs regarding improvements in this area.
7. Queensland has made significant progress in reducing readmission rates over the past five years, with continued incremental improvements towards the nationally recommended target. The 2016-17 Target/Estimate is the nationally recommended target.
8. The 2015-16 Estimated Actual figures are based on an average of ten months actual performance from 1 July 2015 to 30 April 2016. The 2015-16 Service Delivery Statement did not include a 2015-16 Target/Estimated as the target was under review. The review has been completed and has enabled HHS specific targets to be set for 2016-17.
9. The 2015-16 and 2016-17 Target/Estimate costs reflect the finance and activity schedules of the 2016-17 Round 2 Service Agreements Contract Offers (V3.10). The 2015-16 Target/Estimate is recalculated based on the funding provided in the Hospital and Health Service Agreements as at the March 2016 Deed of Amendment and the activity recalculated based on the Activity Based Funding (ABF) model Q19
2016-17 Queensland State Budget – Service Delivery Statements – West Moreton Hospital and Health Service 186

Round 2 2016-17 Contract Offers to enable comparison with 2016-17 Target/Estimate figures. An adjustment for the full year reconciliation of ABF cost by the Hospital and Health Services has been reflected in the 2016-17 figures.
10. The weighted activity units reflect the finance and activity schedules of the 2016-17 Round 2 Service Agreements Contract Offers (v3.10). The 2015-16 Target/Estimate and the 2015-16 Estimated Actual figures have been recalculated as per the finance and activity schedules of the 2016-17 Round 2 Service Agreements Contract Offers (v3.10) to enable comparison.
11. This measure counts the number of in-scope service contact hours attributable to each HHS, based on the national definition and calculation of service contacts and duration. The target for this measure is determined using a standard formula based upon available clinical staffing, HHS rurality, and historical performance. The target is considered aspirational for some HHSs due to a range of issues including the presence of tertiary and support services and under-reporting due to the heavy reliance upon clinician documentation and direct entry into the clinical information system. Significant investment has been made to address the under-reporting and improve functionality and work flow to facilitate entry and use of the system. This investment is complemented by accessibility of resources and the Clinical Improvement Team who support services to value and utilise the information at multiple levels within their service.
Staffing1, 2
West Moreton Hospital and Health Service Notes 2015-16
Budget
2015-16
Est. Actual
2016-17
Budget
West Moreton Hospital and Health Service 3, 4, 5 2,859 2,953 3,037
Notes: 1. The 2015-16 Budget reflects the forecast full-time equivalents (FTEs) as at 30 June 2016 published in the 2015-16 Service Delivery
Statement. 2. The 2015-16 Estimated Actual reflects the current estimated FTEs as at 30 June 2016. 3. The 2016-17 Budget represents the forecast FTEs and may change due to updates to the 2016-17 Service Agreement throughout the financial
year. 4. Increases in FTEs from the 2015-16 Budget to the 2015-16 Estimated Actual reflect the commissioning of new services and additional activity
purchased from West Moreton HHS through the Service Agreement Amendment Windows. 5. Increases in FTEs for the 2016-17 Budget reflect Increase in FTEs for the commissioning of new services and additional activity purchased
from West Moreton HHS through the Service Agreement Amendment Windows. FTE numbers have increased for various reasons including: the introduction of Nurse Navigators; nursing ratio implementation; increase in the nursing graduate intake; establishment of a Community Care Unit and Prison Mental Health Services; the reopening of the Borallon Training and Correctional Centre; and the introduction of the Senior Early Assessment Team in the Emergency Department.
2016-17 Queensland State Budget – Service Delivery Statements – West Moreton Hospital and Health Service 187
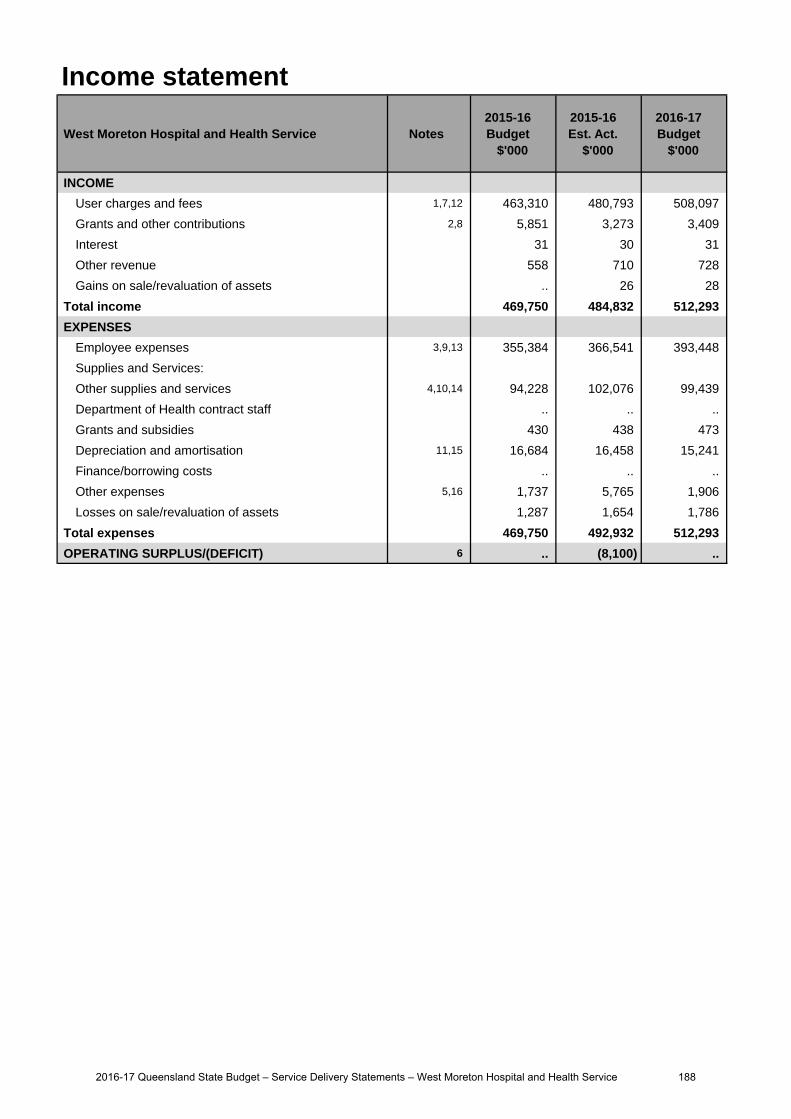
Income statement
West Moreton Hospital and Health Service Notes 2015-16 Budget
$'000
2015-16 Est. Act.
$'000
2016-17 Budget
$'000
INCOME
User charges and fees 1,7,12 463,310 480,793 508,097
Grants and other contributions 2,8 5,851 3,273 3,409
Interest 31 30 31
Other revenue 558 710 728
Gains on sale/revaluation of assets .. 26 28
Total income 469,750 484,832 512,293
EXPENSES
Employee expenses 3,9,13 355,384 366,541 393,448
Supplies and Services:
Other supplies and services 4,10,14 94,228 102,076 99,439
Department of Health contract staff .. .. ..
Grants and subsidies 430 438 473
Depreciation and amortisation 11,15 16,684 16,458 15,241
Finance/borrowing costs .. .. ..
Other expenses 5,16 1,737 5,765 1,906
Losses on sale/revaluation of assets 1,287 1,654 1,786
Total expenses 469,750 492,932 512,293
OPERATING SURPLUS/(DEFICIT) 6 .. (8,100) ..
2016-17 Queensland State Budget – Service Delivery Statements – West Moreton Hospital and Health Service 188
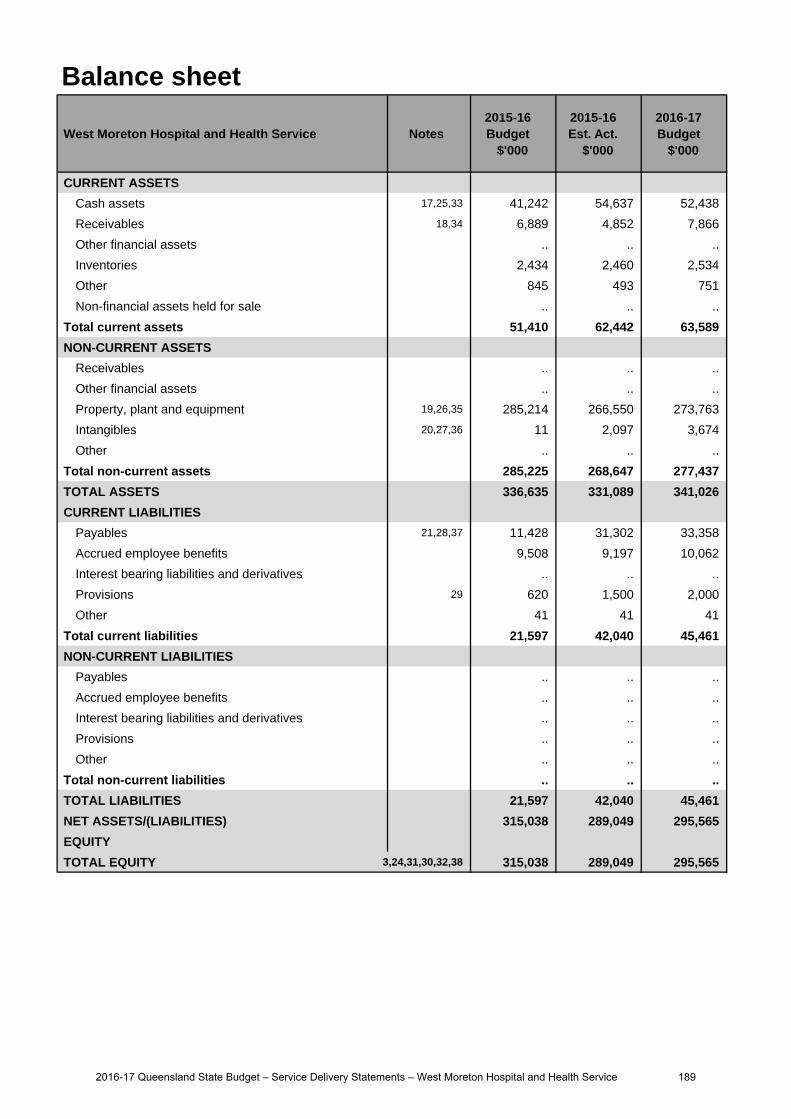
Balance sheet
West Moreton Hospital and Health Service Notes 2015-16 Budget
$'000
2015-16 Est. Act.
$'000
2016-17 Budget
$'000
CURRENT ASSETS
Cash assets 17,25,33 41,242 54,637 52,438
Receivables 18,34 6,889 4,852 7,866
Other financial assets .. .. ..
Inventories 2,434 2,460 2,534
Other 845 493 751
Non-financial assets held for sale .. .. ..
Total current assets 51,410 62,442 63,589
NON-CURRENT ASSETS
Receivables .. .. ..
Other financial assets .. .. ..
Property, plant and equipment 19,26,35 285,214 266,550 273,763
Intangibles 20,27,36 11 2,097 3,674
Other .. .. ..
Total non-current assets 285,225 268,647 277,437
TOTAL ASSETS 336,635 331,089 341,026
CURRENT LIABILITIES
Payables 21,28,37 11,428 31,302 33,358
Accrued employee benefits 9,508 9,197 10,062
Interest bearing liabilities and derivatives .. .. ..
Provisions 29 620 1,500 2,000
Other 41 41 41
Total current liabilities 21,597 42,040 45,461
NON-CURRENT LIABILITIES
Payables .. .. ..
Accrued employee benefits .. .. ..
Interest bearing liabilities and derivatives .. .. ..
Provisions .. .. ..
Other .. .. ..
Total non-current liabilities .. .. ..
TOTAL LIABILITIES 21,597 42,040 45,461
NET ASSETS/(LIABILITIES) 315,038 289,049 295,565
EQUITY
TOTAL EQUITY 3,24,31,30,32,38 315,038 289,049 295,565
2016-17 Queensland State Budget – Service Delivery Statements – West Moreton Hospital and Health Service 189

Cash flow statement
West Moreton Hospital and Health Service Notes 2015-16 Budget
$'000
2015-16 Est. Act.
$'000
2016-17 Budget
$'000
CASH FLOWS FROM OPERATING ACTIVITIES
Inflows:
User charges and fees 39,47,54 462,063 486,280 504,617
Grants and other contributions 40,48 5,851 3,273 3,409
Interest received 31 30 31
Other 41,55 10,069 8,572 10,632
Outflows:
Employee costs 42,49,56 (356,555) (367,022) (392,583)
Supplies and services (101,595) (101,148) (107,445)
Grants and subsidies (430) (438) (473)
Borrowing costs .. .. ..
Other 43,57 (1,737) (4,305) (826)
Net cash provided by or used in operating activities 17,697 25,242 17,362
CASH FLOWS FROM INVESTING ACTIVITIES
Inflows:
Sales of non-financial assets 44,50 181 2,360 3,033
Investments redeemed .. .. ..
Loans and advances redeemed .. .. ..
Outflows:
Payments for non-financial assets 45,51 (4,857) (11,196) (11,043)
Payments for investments .. .. ..
Loans and advances made .. .. ..
Net cash provided by or used in investing activities (4,676) (8,836) (8,010)
CASH FLOWS FROM FINANCING ACTIVITIES
Inflows:
Borrowings .. .. ..
Equity injections 46,52,58 4,857 10,051 3,690
Outflows:
Borrowing redemptions .. .. ..
Finance lease payments .. .. ..
Equity withdrawals 53,59 (16,955) (16,458) (15,241)
Net cash provided by or used in financing activities (12,098) (6,407) (11,551)
Net increase/(decrease) in cash held 923 9,999 (2,199)
Cash at the beginning of financial year 40,319 44,638 54,637
Cash transfers from restructure .. .. ..
Cash at the end of financial year 41,242 54,637 52,438
2016-17 Queensland State Budget – Service Delivery Statements – West Moreton Hospital and Health Service 190
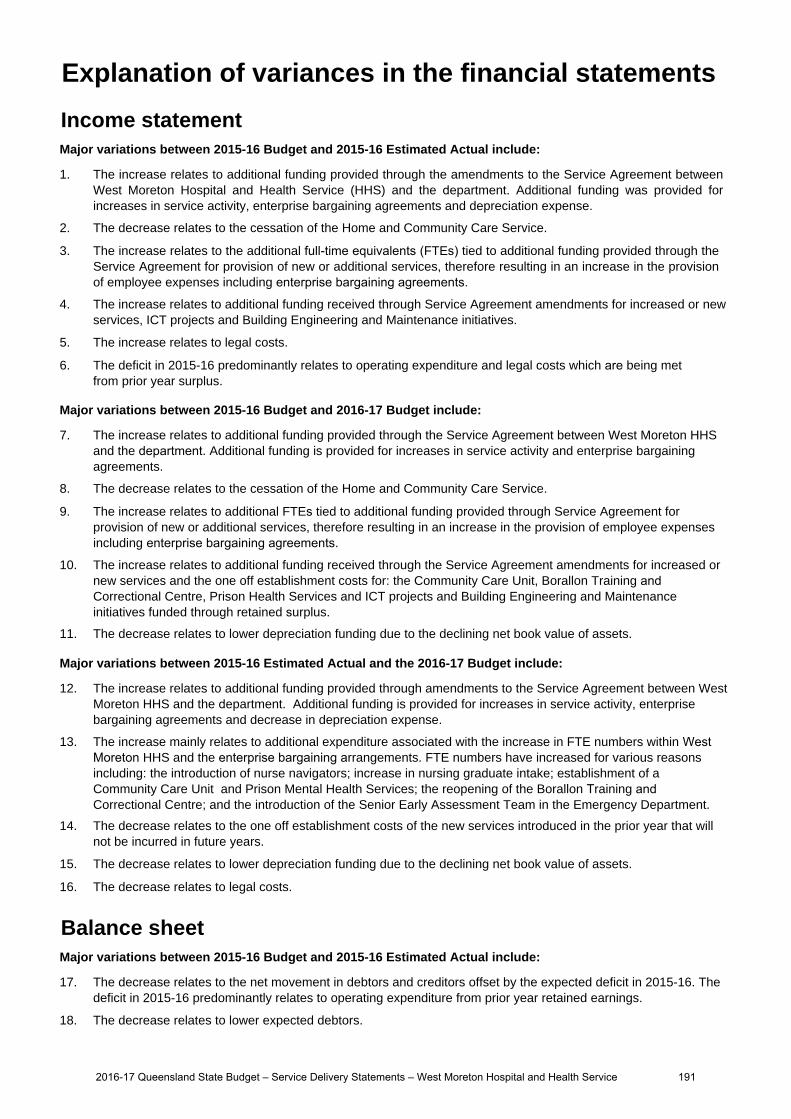
Income statementMajor variations between 2015-16 Budget and 2015-16 Estimated Actual include:
1. The increase relates to additional funding provided through the amendments to the Service Agreement between West Moreton Hospital and Health Service (HHS) and the department. Additional funding was provided for increases in service activity, enterprise bargaining agreements and depreciation expense.
2. The decrease relates to the cessation of the Home and Community Care Service.
3. The increase relates to the additional full-time equivalents (FTEs) tied to additional funding provided through theService Agreement for provision of new or additional services, therefore resulting in an increase in the provisionof employee expenses including enterprise bargaining agreements.
4. The increase relates to additional funding received through Service Agreement amendments for increased or newservices, ICT projects and Building Engineering and Maintenance initiatives.
5. The increase relates to legal costs.
6. The deficit in 2015-16 predominantly relates to operating expenditure and legal costs which are being metfrom prior year surplus.
Major variations between 2015-16 Budget and 2016-17 Budget include:
7. The increase relates to additional funding provided through the Service Agreement between West Moreton HHSand the department. Additional funding is provided for increases in service activity and enterprise bargainingagreements.
8. The decrease relates to the cessation of the Home and Community Care Service.
9. The increase relates to additional FTEs tied to additional funding provided through Service Agreement forprovision of new or additional services, therefore resulting in an increase in the provision of employee expensesincluding enterprise bargaining agreements.
10. The increase relates to additional funding received through the Service Agreement amendments for increased or new services and the one off establishment costs for: the Community Care Unit, Borallon Training and Correctional Centre, Prison Health Services and ICT projects and Building Engineering and Maintenance initiatives funded through retained surplus.
11. The decrease relates to lower depreciation funding due to the declining net book value of assets.
Major variations between 2015-16 Estimated Actual and the 2016-17 Budget include:
12. The increase relates to additional funding provided through amendments to the Service Agreement between West Moreton HHS and the department. Additional funding is provided for increases in service activity, enterprise bargaining agreements and decrease in depreciation expense.
13. The increase mainly relates to additional expenditure associated with the increase in FTE numbers within West Moreton HHS and the enterprise bargaining arrangements. FTE numbers have increased for various reasons including: the introduction of nurse navigators; increase in nursing graduate intake; establishment of a Community Care Unit and Prison Mental Health Services; the reopening of the Borallon Training and Correctional Centre; and the introduction of the Senior Early Assessment Team in the Emergency Department.
14. The decrease relates to the one off establishment costs of the new services introduced in the prior year that willnot be incurred in future years.
15. The decrease relates to lower depreciation funding due to the declining net book value of assets.
16. The decrease relates to legal costs.
Balance sheetMajor variations between 2015-16 Budget and 2015-16 Estimated Actual include:
17. The decrease relates to the net movement in debtors and creditors offset by the expected deficit in 2015-16. Thedeficit in 2015-16 predominantly relates to operating expenditure from prior year retained earnings.
18. The decrease relates to lower expected debtors.
Explanation of variances in the financial statements
2016-17 Queensland State Budget – Service Delivery Statements – West Moreton Hospital and Health Service 191
19. The decrease relates the one-off transfer of land and buildings to the department in 2015-16 and transfer ofassets from property, plant and equipment to intangibles.
20. The increase relates the transfer of assets from property plant and equipment to intangibles.
21. The increase relates to higher expected creditors.
22. The decrease relates to the one-off transfer of land and buildings to the department in 2015-16.
23. The decrease predominantly relates to the forecast deficit for the year.
24. The decrease relates to lower than expected increases in fair value of land and buildings.
Major variations between 2015-16 Budget and 2016-17 Budget include:
25. The increase relates to the net movement in debtors and creditors offset by the expected deficit in 2015-16.
26. The decrease relates the one-off transfer of land and buildings to the department in 2015-16.
27. The increase relates the transfer of assets from property plant and equipment to intangibles.
28. The increase relates to higher expected creditors.
29. The increase relates to higher expected provisions.
30. The decrease predominantly relates to the forecast deficit for the current year.
31. The decrease relates the one-off transfer of land and buildings to the department in 2015-16.
32. The increase relates to the expected increase in fair value of land and buildings.
Major variations between 2015-16 Estimated Actual and the 2016-17 Budget include:
33. The increase relates to the net movement in debtors and creditors offset by the expected deficit in 2015-16.
34. The increase relates to higher expected debtors.
35. The increase predominantly relates to the ongoing capital building works program, lift refurbishment and MentalHealth Unit ward modernisation.
36. The Increase relates to ICT projects.
37. The increase relates to higher expected creditors.
38. The increase relates to the expected increases in fair value of land and buildings.
Cash flow statementMajor variations between 2015-16 Budget and 2015-16 Estimated Actual include:
39. The increase relates to the additional funding provided through amendments to the Service Agreement betweenWest Moreton HHS and the department. Additional funding is provided for increases in service activity,enterprise bargaining agreements and depreciation expense.
40. The decrease relates to the cessation of the Home and Community Care Service
41. The decrease relates to a lower than expected goods and services tax (GST) payable on purchases.
42. The increase relates to the additional FTEs tied to additional funding provided through the Service Agreement forthe provision of new or additional services, therefore results in an increase in the provision of employee expensesincluding enterprise bargaining agreements.
43. The increase relates to legal costs.
44. The increase relates to additional disposals.
45. The increase predominantly relates to the ongoing capital building works program and Information,Communication and Technology projects.
46. The increase predominantly relates to a revenue to equity swap in relation to the capital building works programand the prisoner health medical records project.
2016-17 Queensland State Budget – Service Delivery Statements – West Moreton Hospital and Health Service 192
Major variations between 2015-16 Budget and 2016-17 Budget include:
47. The increase relates to additional funding provided through the Service Agreement between West Moreton HHSand the department. Additional funding is provided for increases in service activity and enterprise bargaining.
48. The decrease relates to the cessation of the Home and Community Care Service.
49. The increase relates to the additional FTEs tied to additional funding provided through the Service Agreement forthe provision of new or additional services, therefore results in an increase in the provision of employee expensesincluding enterprise bargaining agreements.
50. The increase relates to additional disposals.
51. The increase predominantly relates to the ongoing capital building works program and ICT projects.
52. The decrease relates to the expected lower expenditure under the Health Technology Equipment Replacementprogram in 2016-17.
53. The decrease relates to lower depreciation funding due to the declining net book value of assets.
Major variations between 2015-16 Estimated Actual and the 2016-17 Budget include:
54. The increase relates to additional funding provided through the Service Agreement between West MoretonHHS and the department. Additional funding is provided for increases in service activity, enterprisebargaining agreements and decrease in depreciation expense.
55. This increase relates to incremental increases in payment of GST.
56. The increase mainly relates to additional expenditure associated with the increase in FTE numbers within WestMoreton HHS and the enterprise bargaining arrangements. FTE numbers have increased for various reasonsincluding: the introduction of nurse navigators; increase in nursing graduate intake; establishment of aCommunity Care Unit and Prison Mental Health Services; the reopening of the Borallon Training andCorrectional Centre; and the introduction of the Senior Early Assessment Team in the Emergency Department.
57. The decrease relates to legal costs.
58. The decrease predominantly relates to a revenue to equity swap in 2015-16 plus lower Health TechnologyEquipment Replacement expenditure expected in 2016-17.
59. The decrease relates to lower depreciation funding due to the declining net book value of assets.
2016-17 Queensland State Budget – Service Delivery Statements – West Moreton Hospital and Health Service 193
Wide Bay Hospital and Health Service
Overview
The Wide Bay Hospital and Health Service (HHS) is an independent statutory body overseen by a local Hospital and Health Board. The Wide Bay HHS delivers health services to more than 221,000 people across Wide Bay.
The Wide Bay HHS is responsible for the delivery of public hospital and health services including medical, surgical, emergency, obstetrics, paediatrics, specialist outpatient clinics, mental health, critical care and clinical support services to people residing in a geographical area which incorporates the North Burnett, Bundaberg and Fraser Coast local government areas and part of Gladstone Regional Council (Miriam Vale).
The Wide Bay HHS is responsible for the direct management of the facilities and community health services based within the HHS’s geographical boundaries including:
Bundaberg Hospital Gin Gin Hospital
Maryborough Hospital Monto Hospital
Hervey Bay Hospital Biggenden MPHS
Childers Multi-Purpose Health Service (MPHS) Eidsvold MPHS
Mundubbera MPHS Mount Perry Health Centre
Gayndah Hospital
Wide Bay HHS's vision of improving health together, is strongly supported by our aspiration to be a provider of patient centred, high quality, innovative and cost effective healthcare by engaging with our community and developing our highly skilled workforce.
The detection of Legionella in the water supply in the Hervey Bay Hospital building resulted in the development of a Wide Bay HHS Public Health Water Quality and Risk Management Plan. Authorisation was given by the Chief Executive to use the Plan as the basis for a legislation of water quality in other Queensland Health facilities. Implementation of the Plan resulted in early detection of Legionella in the Hervey Bay Cancer Care building.
Coinciding with the completion of new Cancer Care and Oral Health Buildings in Hervey Bay and Bundaberg, the Wide Bay HHS’s Cancer Care Strategic Plan 2015-2018 was released.
Service summary
The Wide Bay HHS has an operating budget of $524.5 million for 2016-17 which is an increase of $35.6 million (7.3 per cent) from the published 2015-16 operating budget of $488.9 million.
The Wide Bay HHS has made considerable achievements against its strategic objectives in 2015-16, the highlights of which include:
installation of two new CT (Computed Tomography) scanners in Hervey Bay and Bundaberg to improve diagnosticcapability and capacity
achievement of the National Elective Surgery Target in all parts, including non-reportable diagnostic categories expansion of cardiology, radiation oncology and ophthalmology through public/private partnerships enhanced model of care supporting rural communities: Rural Midwifery Model of Care implemented to provide rural
women with more choice in ante and post natal care options; paediatric outreach services from Bundaberg Hospital toMonto Hospital; expansion of allied health services in North Burnett
re-commencement of pathology services at Maryborough Hospital newly refurbished 24-bed medical and palliative care ward at Maryborough Hospital fully resourced graduate and undergraduate support structure in place as per Ministerial commitment major infrastructure upgrades at Hervey Bay Hospital (water) and Bundaberg Hospital (helipad) Oral/Cancer Centres - Hervey Bay and Bundaberg new builds commissioned; expansion of medical oncology public
services increasing to four FTE medical officers.As well as delivering core health services, major initiatives for 2016-17 include: finalisation of planning for new Emergency Department at Hervey Bay Hospital
2016-17 Queensland State Budget – Service Delivery Statements – Wide Bay Hospital and Health Service 194
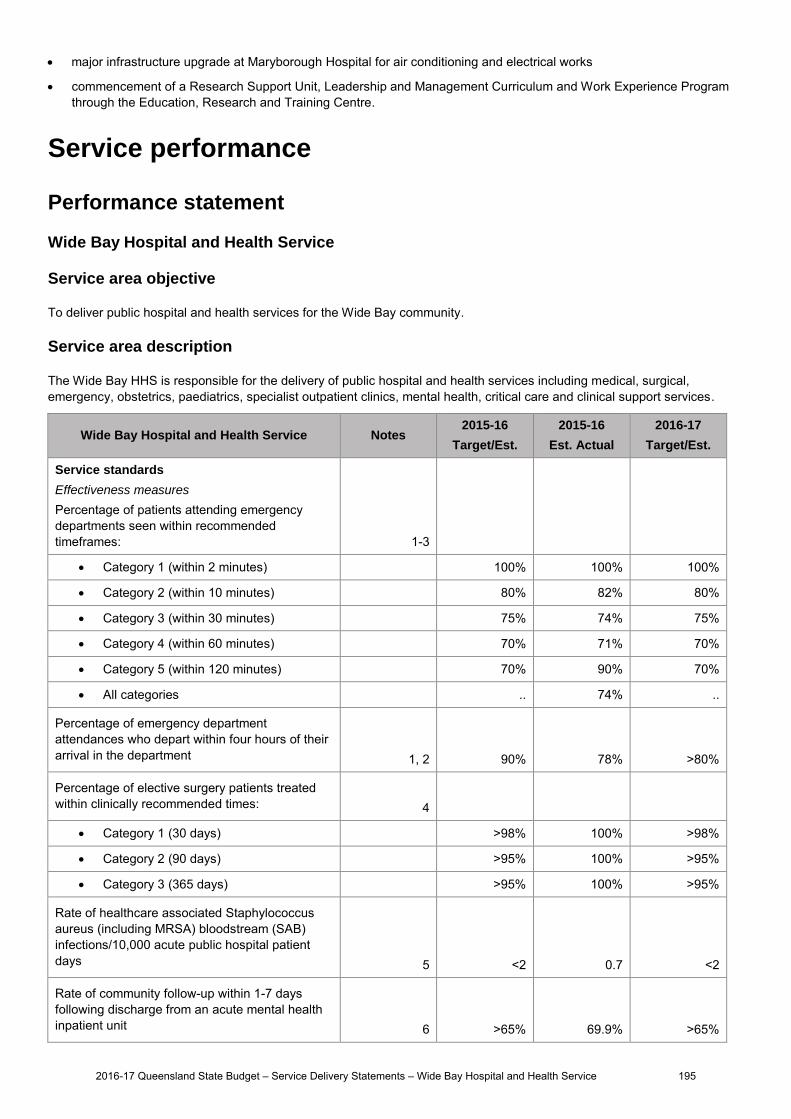
commencement of a Research Support Unit, Leadership and Management Curriculum and Work Experience Programthrough the Education, Research and Training Centre.
Service performance
Performance statement
Wide Bay Hospital and Health Service
Service area objective
To deliver public hospital and health services for the Wide Bay community.
Service area description
The Wide Bay HHS is responsible for the delivery of public hospital and health services including medical, surgical, emergency, obstetrics, paediatrics, specialist outpatient clinics, mental health, critical care and clinical support services.
Wide Bay Hospital and Health Service Notes 2015-16
Target/Est.
2015-16
Est. Actual
2016-17
Target/Est.
Service standards
Effectiveness measures
Percentage of patients attending emergency departments seen within recommended timeframes: 1-3
Category 1 (within 2 minutes) 100% 100% 100%
Category 2 (within 10 minutes) 80% 82% 80%
Category 3 (within 30 minutes) 75% 74% 75%
Category 4 (within 60 minutes) 70% 71% 70%
Category 5 (within 120 minutes) 70% 90% 70%
All categories .. 74% ..
Percentage of emergency department attendances who depart within four hours of their arrival in the department 1, 2 90% 78% >80%
Percentage of elective surgery patients treated within clinically recommended times: 4
Category 1 (30 days) >98% 100% >98%
Category 2 (90 days) >95% 100% >95%
Category 3 (365 days) >95% 100% >95%
Rate of healthcare associated Staphylococcus aureus (including MRSA) bloodstream (SAB) infections/10,000 acute public hospital patient days 5 <2 0.7 <2
Rate of community follow-up within 1-7 days following discharge from an acute mental health inpatient unit 6 >65% 69.9% >65%
2016-17 Queensland State Budget – Service Delivery Statements – Wide Bay Hospital and Health Service 195
major infrastructure upgrade at Maryborough Hospital for air conditioning and electrical works
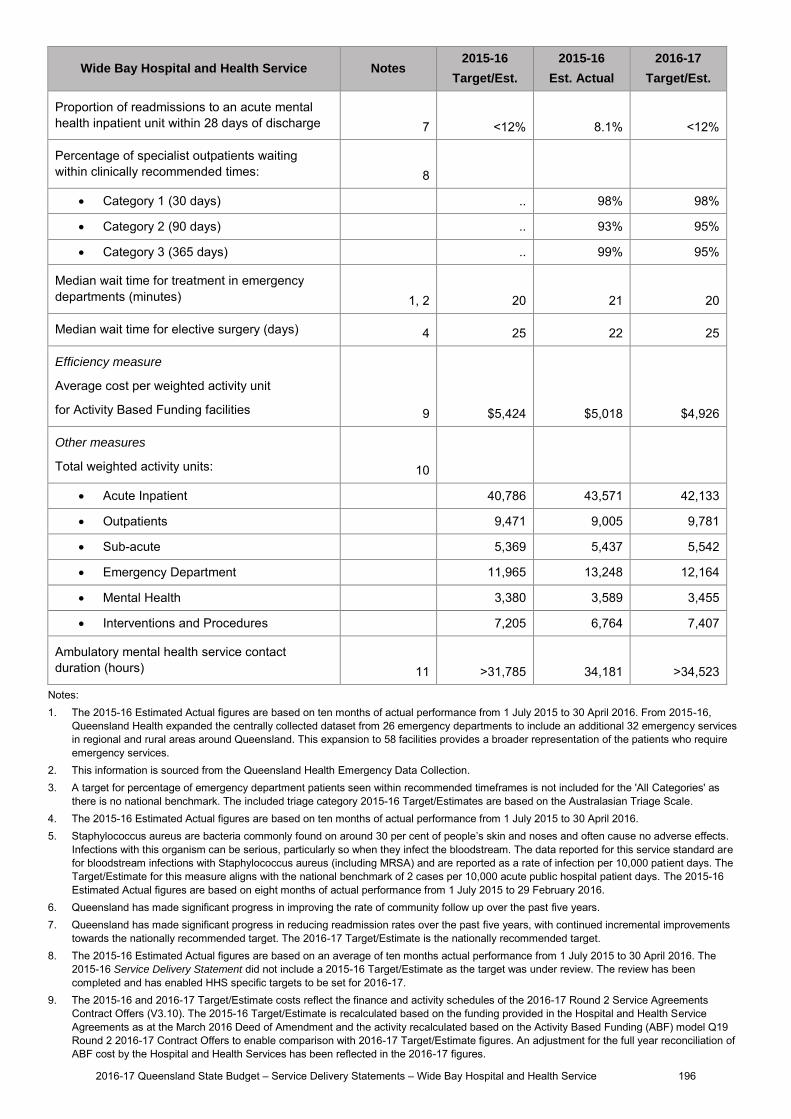
Wide Bay Hospital and Health Service Notes 2015-16
Target/Est.
2015-16
Est. Actual
2016-17
Target/Est.
Proportion of readmissions to an acute mental health inpatient unit within 28 days of discharge 7 <12% 8.1% <12%
Percentage of specialist outpatients waiting within clinically recommended times: 8
Category 1 (30 days) .. 98% 98%
Category 2 (90 days) .. 93% 95%
Category 3 (365 days) .. 99% 95%
Median wait time for treatment in emergency departments (minutes) 1, 2 20 21 20
Median wait time for elective surgery (days) 4 25 22 25
Efficiency measure
Average cost per weighted activity unit
for Activity Based Funding facilities 9 $5,424 $5,018 $4,926
Other measures
Total weighted activity units: 10
Acute Inpatient 40,786 43,571 42,133
Outpatients 9,471 9,005 9,781
Sub-acute 5,369 5,437 5,542
Emergency Department 11,965 13,248 12,164
Mental Health 3,380 3,589 3,455
Interventions and Procedures 7,205 6,764 7,407
Ambulatory mental health service contact duration (hours) 11 >31,785 34,181 >34,523
Notes: 1. The 2015-16 Estimated Actual figures are based on ten months of actual performance from 1 July 2015 to 30 April 2016. From 2015-16,
Queensland Health expanded the centrally collected dataset from 26 emergency departments to include an additional 32 emergency services in regional and rural areas around Queensland. This expansion to 58 facilities provides a broader representation of the patients who require emergency services.
2. This information is sourced from the Queensland Health Emergency Data Collection. 3. A target for percentage of emergency department patients seen within recommended timeframes is not included for the 'All Categories' as
there is no national benchmark. The included triage category 2015-16 Target/Estimates are based on the Australasian Triage Scale. 4. The 2015-16 Estimated Actual figures are based on ten months of actual performance from 1 July 2015 to 30 April 2016. 5. Staphylococcus aureus are bacteria commonly found on around 30 per cent of people’s skin and noses and often cause no adverse effects.
Infections with this organism can be serious, particularly so when they infect the bloodstream. The data reported for this service standard are for bloodstream infections with Staphylococcus aureus (including MRSA) and are reported as a rate of infection per 10,000 patient days. The Target/Estimate for this measure aligns with the national benchmark of 2 cases per 10,000 acute public hospital patient days. The 2015-16 Estimated Actual figures are based on eight months of actual performance from 1 July 2015 to 29 February 2016.
6. Queensland has made significant progress in improving the rate of community follow up over the past five years. 7. Queensland has made significant progress in reducing readmission rates over the past five years, with continued incremental improvements
towards the nationally recommended target. The 2016-17 Target/Estimate is the nationally recommended target. 8. The 2015-16 Estimated Actual figures are based on an average of ten months actual performance from 1 July 2015 to 30 April 2016. The
2015-16 Service Delivery Statement did not include a 2015-16 Target/Estimate as the target was under review. The review has been completed and has enabled HHS specific targets to be set for 2016-17.
9. The 2015-16 and 2016-17 Target/Estimate costs reflect the finance and activity schedules of the 2016-17 Round 2 Service Agreements Contract Offers (V3.10). The 2015-16 Target/Estimate is recalculated based on the funding provided in the Hospital and Health Service Agreements as at the March 2016 Deed of Amendment and the activity recalculated based on the Activity Based Funding (ABF) model Q19 Round 2 2016-17 Contract Offers to enable comparison with 2016-17 Target/Estimate figures. An adjustment for the full year reconciliation of ABF cost by the Hospital and Health Services has been reflected in the 2016-17 figures.
2016-17 Queensland State Budget – Service Delivery Statements – Wide Bay Hospital and Health Service 196
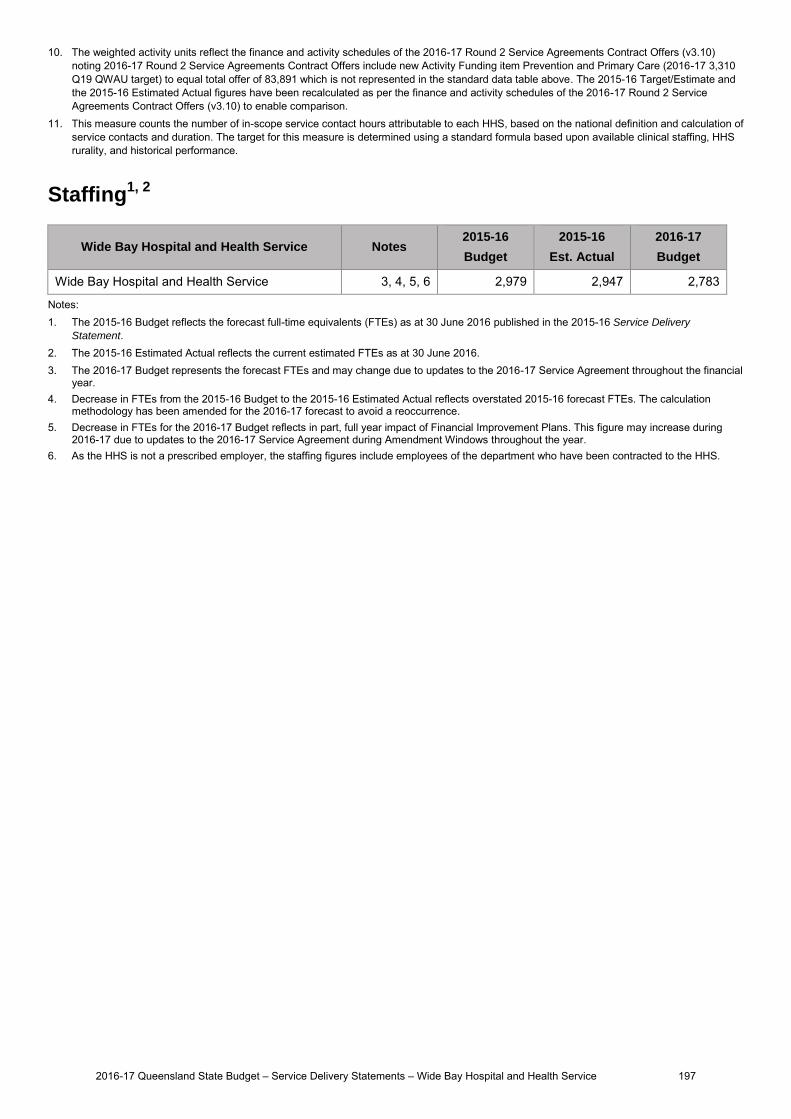
10. The weighted activity units reflect the finance and activity schedules of the 2016-17 Round 2 Service Agreements Contract Offers (v3.10) noting 2016-17 Round 2 Service Agreements Contract Offers include new Activity Funding item Prevention and Primary Care (2016-17 3,310 Q19 QWAU target) to equal total offer of 83,891 which is not represented in the standard data table above. The 2015-16 Target/Estimate and the 2015-16 Estimated Actual figures have been recalculated as per the finance and activity schedules of the 2016-17 Round 2 Service Agreements Contract Offers (v3.10) to enable comparison.
11. This measure counts the number of in-scope service contact hours attributable to each HHS, based on the national definition and calculation of service contacts and duration. The target for this measure is determined using a standard formula based upon available clinical staffing, HHS rurality, and historical performance.
Staffing1, 2
Wide Bay Hospital and Health Service Notes 2015-16
Budget
2015-16
Est. Actual
2016-17
Budget
Wide Bay Hospital and Health Service 3, 4, 5, 6 2,979 2,947 2,783
Notes: 1. The 2015-16 Budget reflects the forecast full-time equivalents (FTEs) as at 30 June 2016 published in the 2015-16 Service Delivery
Statement. 2. The 2015-16 Estimated Actual reflects the current estimated FTEs as at 30 June 2016. 3. The 2016-17 Budget represents the forecast FTEs and may change due to updates to the 2016-17 Service Agreement throughout the financial
year. 4. Decrease in FTEs from the 2015-16 Budget to the 2015-16 Estimated Actual reflects overstated 2015-16 forecast FTEs. The calculation
methodology has been amended for the 2016-17 forecast to avoid a reoccurrence. 5. Decrease in FTEs for the 2016-17 Budget reflects in part, full year impact of Financial Improvement Plans. This figure may increase during
2016-17 due to updates to the 2016-17 Service Agreement during Amendment Windows throughout the year. 6. As the HHS is not a prescribed employer, the staffing figures include employees of the department who have been contracted to the HHS.
2016-17 Queensland State Budget – Service Delivery Statements – Wide Bay Hospital and Health Service 197

Income statement
Wide Bay Hospital and Health Service Notes 2015-16 Budget
$'000
2015-16 Est. Act.
$'000
2016-17 Budget
$'000
INCOME
User charges and fees 1,7 479,776 507,992 516,090
Grants and other contributions 2,8 5,708 3,620 3,703
Interest 82 56 58
Other revenue 3,9 3,382 4,572 4,687
Gains on sale/revaluation of assets .. .. ..
Total income 488,948 516,240 524,538
EXPENSES
Employee expenses 4,10 18,783 56,435 57,347
Supplies and Services:
Other supplies and services 5,11 139,062 163,268 161,849
Department of Health contract staff 314,882 294,062 288,578
Grants and subsidies .. .. ..
Depreciation and amortisation 15,316 15,570 15,859
Finance/borrowing costs .. .. ..
Other expenses 733 733 733
Losses on sale/revaluation of assets 172 172 172
Total expenses 488,948 530,240 524,538
OPERATING SURPLUS/(DEFICIT) 6 .. (14,000) ..
2016-17 Queensland State Budget – Service Delivery Statements – Wide Bay Hospital and Health Service 198

Balance sheet
Wide Bay Hospital and Health Service Notes 2015-16 Budget
$'000
2015-16 Est. Act.
$'000
2016-17 Budget
$'000
CURRENT ASSETS
Cash assets 16,21 4,363 3,375 4,419
Receivables 12,17 11,958 6,850 6,992
Other financial assets .. .. ..
Inventories 3,456 4,168 4,202
Other 274 278 311
Non-financial assets held for sale .. .. ..
Total current assets 20,051 14,671 15,924
NON-CURRENT ASSETS
Receivables .. .. ..
Other financial assets .. .. ..
Property, plant and equipment 235,411 219,236 218,589
Intangibles .. 82 82
Other .. .. ..
Total non-current assets 235,411 219,318 218,671
TOTAL ASSETS 255,462 233,989 234,595
CURRENT LIABILITIES
Payables 13,18 19,939 27,000 28,253
Accrued employee benefits 14,19 17 981 981
Interest bearing liabilities and derivatives .. .. ..
Provisions .. .. ..
Other 132 82 82
Total current liabilities 20,088 28,063 29,316
NON-CURRENT LIABILITIES
Payables .. .. ..
Accrued employee benefits .. .. ..
Interest bearing liabilities and derivatives .. .. ..
Provisions .. .. ..
Other .. .. ..
Total non-current liabilities .. .. ..
TOTAL LIABILITIES 20,088 28,063 29,316
NET ASSETS/(LIABILITIES) 235,374 205,926 205,279
EQUITY
TOTAL EQUITY 15,20 235,374 205,926 205,279
2016-17 Queensland State Budget – Service Delivery Statements – Wide Bay Hospital and Health Service 199

Cash flow statement
Wide Bay Hospital and Health Service Notes 2015-16 Budget
$'000
2015-16 Est. Act.
$'000
2016-17 Budget
$'000
CASH FLOWS FROM OPERATING ACTIVITIES
Inflows:
User charges and fees 22,26 479,581 513,792 515,880
Grants and other contributions 23,27 5,708 3,620 3,703
Interest received 82 56 58
Other 17,373 18,565 18,678
Outflows:
Employee costs 24,28 (18,783) (56,435) (57,347)
Supplies and services (479,418) (465,055) (463,336)
Grants and subsidies .. .. ..
Borrowing costs .. .. ..
Other (733) (733) (733)
Net cash provided by or used in operating activities 3,810 13,810 16,903
CASH FLOWS FROM INVESTING ACTIVITIES
Inflows:
Sales of non-financial assets .. .. ..
Investments redeemed .. .. ..
Loans and advances redeemed .. .. ..
Outflows:
Payments for non-financial assets 25,29,31 (4,991) (5,961) (3,603)
Payments for investments .. .. ..
Loans and advances made .. (2) ..
Net cash provided by or used in investing activities (4,991) (5,963) (3,603)
CASH FLOWS FROM FINANCING ACTIVITIES
Inflows:
Borrowings .. .. ..
Equity injections 30,32 4,991 5,121 3,603
Outflows:
Borrowing redemptions .. .. ..
Finance lease payments .. .. ..
Equity withdrawals (15,316) (15,570) (15,859)
Net cash provided by or used in financing activities (10,325) (10,449) (12,256)
Net increase/(decrease) in cash held (11,506) (2,602) 1,044
Cash at the beginning of financial year 15,869 5,977 3,375
Cash transfers from restructure .. .. ..
Cash at the end of financial year 4,363 3,375 4,419
2016-17 Queensland State Budget – Service Delivery Statements – Wide Bay Hospital and Health Service 200
Income statementMajor variations between 2015-16 Budget and 2015-16 Estimated Actual include:
1. The increase relates to additional funding provided through amendments to the Service Agreement between WideBay Hospital and Health Service and the department. Additional funding is provided for increases in serviceactivity, enterprise bargaining agreements and depreciation expense.
2. Decrease relates to Commonwealth funding for Multi-purpose Health Services moving from locally receiptedgrants to corporately receipted funds which is included in user charges and fees.
3. Increase relates to additional third party funded public/private partnerships and increased reimbursement forWorkCover salaries.
4. Increase relates to reclassification of Senior Medical Officers Contracts previously reported under other suppliesand services.
5. Increase relates to reclassification of outsourced service delivery previously reported under other supplies andservices; and additional funding provided through the Service Agreement.
6. The 2015-16 deficit is primarily driven by additional costs associated with increased Emergency activity, whichhas required additional agency medical staff and other associated non-labour expenses.
Major variations between 2015-16 Budget and 2016-17 Budget include:
7. The increase relates to additional funding provided through amendments to the Service Agreement between WideBay Hospital and Health Service and the department. Additional funding is provided for increase in service activity,enterprise bargaining block funded services, teaching, training and research funding and own source revenue.
8. Decrease relates to Commonwealth Funding for Multi Purpose Health Services moving from locally receiptedgrants to corporately receipted funds which is included in user charges and fees.
9. Increase relates to additional third party funded public/private partnerships and increased reimbursement forWorkCover salaries.
10. Increase relates to reclassification of Senior Medical Officers Contracts previously reported under other suppliesand services.
11. Increase relates to reclassification of Outsourced Service Delivery previously reported under other supplies andservices; and additional funding provided through the Service Agreement.
Balance sheetMajor variations between 2015-16 Budget and 2015-16 Estimated Actual include:
12. The decrease is due to the reassessment of receivable levels within Wide Bay Hospital and Health Service.
13. The increase is due to the recognition of additional end of year payroll accrual days.
14. Increase due to the reclassification of Senior Medical Officers Contracts, previously reported as departmentalemployees.
15. The decrease in equity relates to the forecast deficit position offset by increases in the asset revaluation reservedue to the annual revaluation program and increases to contributed equity for the transfer of commissioned assetsfrom the department.
Major variations between 2015-16 Budget and 2016-17 Budget include:
16. The decrease is due to the forecast deficit position. Wide Bay Hospital and Health Service has seen increased activity and is currently forecasting to deliver more activity than planned. Wide Bay Hospital and Health Service will continue to work with the department around cash flow management.
17. The decrease is due to the reassessment of receivable levels within Wide Bay Hospital and Health Service.
18. The increase is due to the recognition of additional end of year payroll accrual days.
19. Increase due to the reclassification of Senior Medical Officers Contracts, previously reported as departmentalemployees.
Explanation of variances in the financial statements
2016-17 Queensland State Budget – Service Delivery Statements – Wide Bay Hospital and Health Service 201

20. The decrease in equity relates to forecast deficit position offset by increases in the asset revaluation reserve dueto the annual revaluation program and increases to contributed equity for the transfer of commissioned assetsfrom the department.
Major variations between 2015-16 Estimated Actual and the 2016-17 Budget include:
21. The increase is due to the forecast deficit position in 2015-16 and forecast balanced position in 2016-17.
Cash flow statementMajor variations between 2015-16 Budget and 2015-16 Estimated Actual include:
22. The increase relates to additional funding provided through amendments to the Service Agreement between WideBay Hospital and Health Service and the department. Additional funding is provided for increases in serviceactivity, enterprise bargaining agreements and depreciation expense.
23. Decrease relates to Commonwealth Funding for Multi-purpose Health Services moving from locally receiptedgrants to corporately receipted funds which is included in user charges and fees.
24. Increase relates to reclassification of Senior Medical Officers Contracts previously reported under other suppliesand services.
25. The increase relates to the anticipated spend of prior year Swap Capital Funding. Swap capital funding being, the reallocation of operating budget to minor capital.
Major variations between 2015-16 Budget and 2016-17 Budget include:
26. The increase relates to additional funding provided through amendments to the Service Agreement between WideBay Hospital and Health Service and the department. Additional funding is provided for increase in service activity,enterprise bargaining block funded services, teaching, training and research funding and own source revenue.
27. Decrease relates to Commonwealth Funding for Multi Purpose Health Services moving from locally receiptedgrants to corporately receipted funds which is included in User charges and fees.
28. Increase relates to reclassification of Senior Medical Officers Contracts previously reported under other supplies and services.
29. The decrease is due to the adjustment for the 2016-18 Health Technology Equipment Replacement program 2year window in line with Capital Infrastructure Delivery Unit anticipated expenditure timing.
30. The decrease is due to the adjustment for the 2016-18 Health Technology Equipment Replacement program 2year window in line with Capital Infrastructure Delivery Unit anticipated expenditure timing.
Major variations between 2015-16 Estimated Actual and the 2016-17 Budget include:
31. The decrease is due to the adjustment for the 2016-18 Health Technology Equipment Replacement program 2year window in line with Capital Infrastructure Delivery Unit anticipated expenditure timing.
32. The decrease is due to the adjustment for the 2016-18 Health Technology Equipment Replacement program 2year window in line with Capital Infrastructure Delivery Unit anticipated expenditure timing.
2016-17 Queensland State Budget – Service Delivery Statements – Wide Bay Hospital and Health Service 202

The Council of the Queensland Institute of Medical Research
Overview
The Council of the Queensland Institute of Medical Research, known as the QIMR Berghofer Medical Research Institute (QIMR Berghofer), is a world-leading translational research institute, established as a statutory body under the Queensland
Institute of Medical Research Act 1945. QIMR Berghofer’s research strategy focuses on four major areas: Cancer, Infectious Diseases, Mental Health and Chronic Disorders.
QIMR Berghofer aims to improve health by developing prevention strategies, new diagnostics and better health treatments. Its strategic objectives for 2016-20 are to:
foster scientific excellence, including training researchers of the future build scientific, institutional and international connectivity undertake research with economic, clinical and community consequences.
The realisation of QIMR Berghofer’s strategic objectives is dependent on its success in securing funding from both government and non-government sources, including community and philanthropic donations and income from commercialisation activities. In 2016–17, QIMR Berghofer will receive $18.9 million from the Queensland Government, representing approximately 16.8 per cent of total revenue. This, together with competitive peer-reviewed medical research grants, is QIMR Berghofer’s most significant source of funding. The State Government grant, and the support operations it finances, enables QIMR Berghofer to leverage this funding to secure competitive peer-reviewed medical research grants and other income.
Service summary
QIMR Berghofer contributes to the Queensland Government’s objective of creating jobs and a diverse economy. The Institute is experiencing a period of growth. We are actively recruiting researchers in areas of high importance to Queensland - including tropical diseases, vaccine development, cancer and genetics - to increase our capacity to approximately 1,000 staff, students and visiting scientists by the year 2020. Each of the four themes; Cancer, Infectious Diseases, Mental Health and Chronic Disorders - has been selected to align with the needs of Queensland.
QIMR Berghofer directly contributes to the Queensland Government’s objectives relating to a stronger public health system by translating the knowledge we produce and discoveries we make into improved clinical practice. By advancing medical knowledge and improving public health, we also contribute to the Queensland Government’s objective of building safe, caring and connected communities. Our research in cancer is particularly important given our ageing population. Our work in infectious diseases, especially tropical diseases, is vital for the people of northern Queensland, the tourism industry, and for the greater population given the pole-ward migration of species due to climate change bringing tropical diseases closer to major southern population centres. Our research into mental health, such as dementia, Alzheimer’s and depression, addresses rises in the incidence of these diseases. Our work in our newly established Chronic Disorders program will address many of the health impacts associated with changes in our demographics and lifestyles. Our work is helping to broaden and deepen Queensland’s economic base, especially in the high-value, high-growth health and medical sector.
QIMR Berghofer is a translational research facility, where research develops from the laboratory bench through to the patient’s bedside. In doing so we embrace the need to promote and develop links with industry in keeping with our understanding that the path from the bench to the bedside passes through a business phase; hence our mantra of 'Bench to Business to Bedside'. QIMR Berghofer’s research supports different Queensland scientific and medical sectors by researching and creating new and improved treatments and screening programs for various diseases and disorders.
QIMR Berghofer’s research focuses on improving the prevention, diagnosis and treatment of a range of diseases and conditions relevant to Queenslanders, which will help address pressures facing the public health care sector by lessening rates of disease, and improving quality of life and health care practices.
During 2015–16, QIMR Berghofer:
announced major research collaborations and licence agreements with US-based pharmaceutical company Bristol-Myers Squibb and US-based biopharmaceutical company Atara Biotherapeutics
opened the $2.6 million ACRF Centre for Comprehensive Biomedical Imaging embarked on a world-first immunotherapy clinical trial targeting the deadly brain cancer, glioblastoma multiforme launched an online tool to allow people aged 40 and over to assess their risk of developing skin cancer led an Australian-first study that found about 37,000 Australian cancer cases - or one in three cancers - could be
prevented each year through lifestyle change
2016-17 Queensland State Budget – Service Delivery Statements The Council of the Queensland Institute of Medical Research
203
secured industry backing from BioPharmaceuticals Australia to take the next step in developing a vaccine against cytomegalovirus, the leading infectious cause of abnormalities, including cerebral palsy and deafness, in newborn babies
co-led a major international study which identified 26 genetic variants that predispose women to developing different subtypes of breast cancer
led an international study that discovered five new gene regions which increase a person's risk of melanoma identified that a gene previously thought to have an anti-inflammatory effect, or no immune effect at all, is actually more
likely to increase inflammation in people with asthma and allergies initiated a collaboration with a major Indian company, including development of clinical trials performed first imaging studies at the newly opened Herston Imaging Research Facility (HIRF) continued to conduct multiple clinical trials as part of the Human Malaria Model Unit celebrated our 70th anniversary as Queensland's own medical research institute.
In the wider research community, QIMR Berghofer:
was ranked first in Australia and seventh in the world for patent citations in a new index measuring innovation and industry impact
entered into a partnership with the Queensland University of Technology's (QUT) Institute of Health and Biomedical Innovation that will eventually see up to 80 QUT researchers based at QIMR Berghofer
announced a collaboration with the Li Ka Shing Faculty of Medicine at the University of Hong Kong to provide patient access to ground-breaking T cell immunotherapies for head and neck cancers, and staff access to training in the production of these immunotherapies
received $10 million from the Bill and Melinda Gates Foundation via Medicines for Malaria Venture to develop more effective antimalarial drugs to combat a disease that kills about 600,000 people a year and causes suffering for millions more
received $35.9 million in National Health and Medical Research Council (NHMRC) funding, the second highest in Australian independent medical research institutes and the second overall in Queensland
received $6.5 million from the NHMRC to lead a major five-year international study to look for new ways to prevent and treat breast cancer
secured almost $6.5 million in NHMRC funding to lead a major collaborative investigation into the early detection of Alzheimer's disease
hosted the inaugural Immunotherapy@Brisbane conference, attracting around 250 delegates from across Australia and overseas
continued collaborating with partners Royal Brisbane and Women’s Hospital, University of Queensland, QUT and Siemens to launch the HIRF
has expanded its reach in research and clinical genomics by recruiting the analysis team responsible for the Australian International Cancer Genome Consortium project, which resulted in six papers in Nature, two in Nature Methods and two in Nature Communications.
QIMR Berghofer’s community engagement activities in 2015–16 included:
delivering the QIMR Berghofer education program, offering more than 2000 Queensland students from over 70 schools the opportunity to participate in the Institute’s High School Lecture Series, work experience program and hands-on laboratory experience in the state-of-the-art education laboratory
participating in the inaugural World Science Festival, hosting two sold-out Apprentice Programs for the Festival, providing expert panellists and staffing a Mosquito Control Lab display in the Street Science! precinct
hosting free public forums on the latest research in cancer, infectious diseases, mental health and complex disorders providing 103 tours and speaking engagements to over 3965 members of the public.
In 2016–17, QIMR Berghofer will:
further accelerate the use of bioinformatic skills in clinically linked genetic research and analysis continue to perform world-leading Genome Wide Association Studies to further identify genetic risk factors and therapy
targets for a range of cancers build on advances in imaging to identify targets amenable to treatment identify new immune-editing targets for treatment and move these toward the clinic develop expertise in health economics work with clinicians to trial an online tool which has been developed to predict the risk of people aged 40 and over
developing non-melanoma skin cancers in the next three years
2016-17 Queensland State Budget – Service Delivery Statements The Council of the Queensland Institute of Medical Research
204
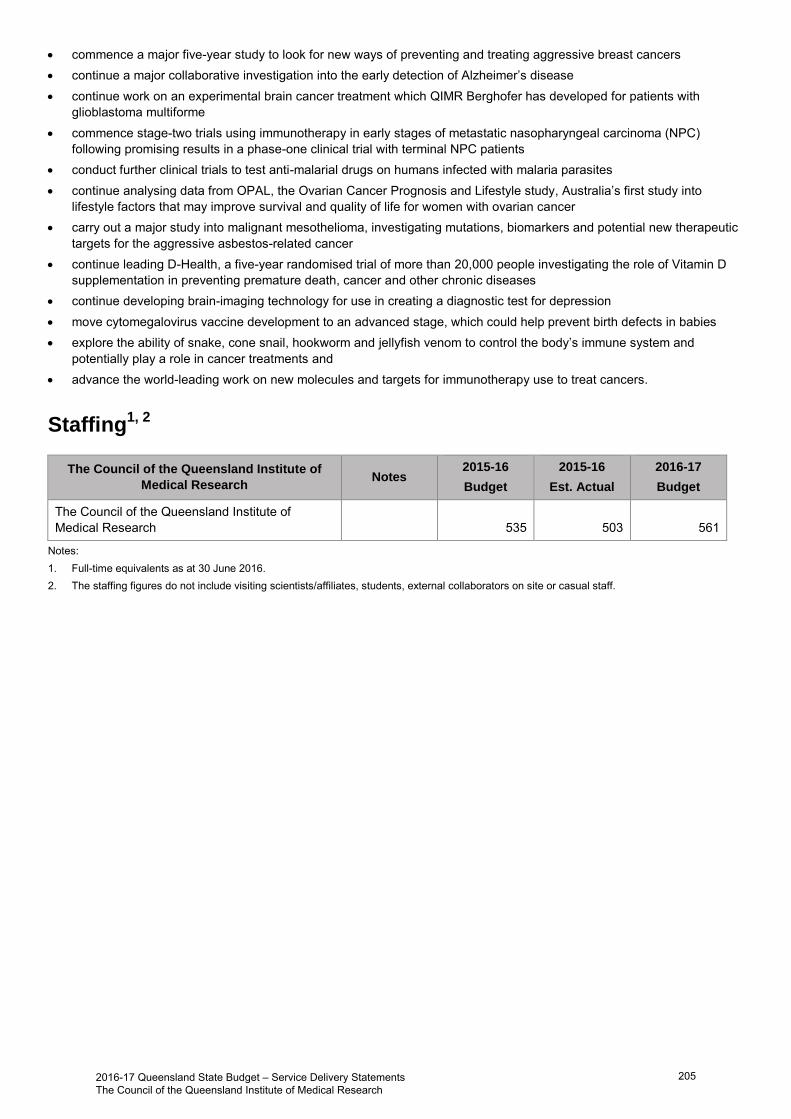
commence a major five-year study to look for new ways of preventing and treating aggressive breast cancers continue a major collaborative investigation into the early detection of Alzheimer’s disease continue work on an experimental brain cancer treatment which QIMR Berghofer has developed for patients with
glioblastoma multiforme commence stage-two trials using immunotherapy in early stages of metastatic nasopharyngeal carcinoma (NPC)
following promising results in a phase-one clinical trial with terminal NPC patients conduct further clinical trials to test anti-malarial drugs on humans infected with malaria parasites continue analysing data from OPAL, the Ovarian Cancer Prognosis and Lifestyle study, Australia’s first study into
lifestyle factors that may improve survival and quality of life for women with ovarian cancer carry out a major study into malignant mesothelioma, investigating mutations, biomarkers and potential new therapeutic
targets for the aggressive asbestos-related cancer continue leading D-Health, a five-year randomised trial of more than 20,000 people investigating the role of Vitamin D
supplementation in preventing premature death, cancer and other chronic diseases continue developing brain-imaging technology for use in creating a diagnostic test for depression move cytomegalovirus vaccine development to an advanced stage, which could help prevent birth defects in babies explore the ability of snake, cone snail, hookworm and jellyfish venom to control the body’s immune system and
potentially play a role in cancer treatments and advance the world-leading work on new molecules and targets for immunotherapy use to treat cancers.
Staffing1, 2
The Council of the Queensland Institute of
Medical Research Notes
2015-16
Budget
2015-16
Est. Actual
2016-17
Budget
The Council of the Queensland Institute of Medical Research 535 503 561
Notes: 1. Full-time equivalents as at 30 June 2016. 2. The staffing figures do not include visiting scientists/affiliates, students, external collaborators on site or casual staff.
2016-17 Queensland State Budget – Service Delivery Statements The Council of the Queensland Institute of Medical Research
205
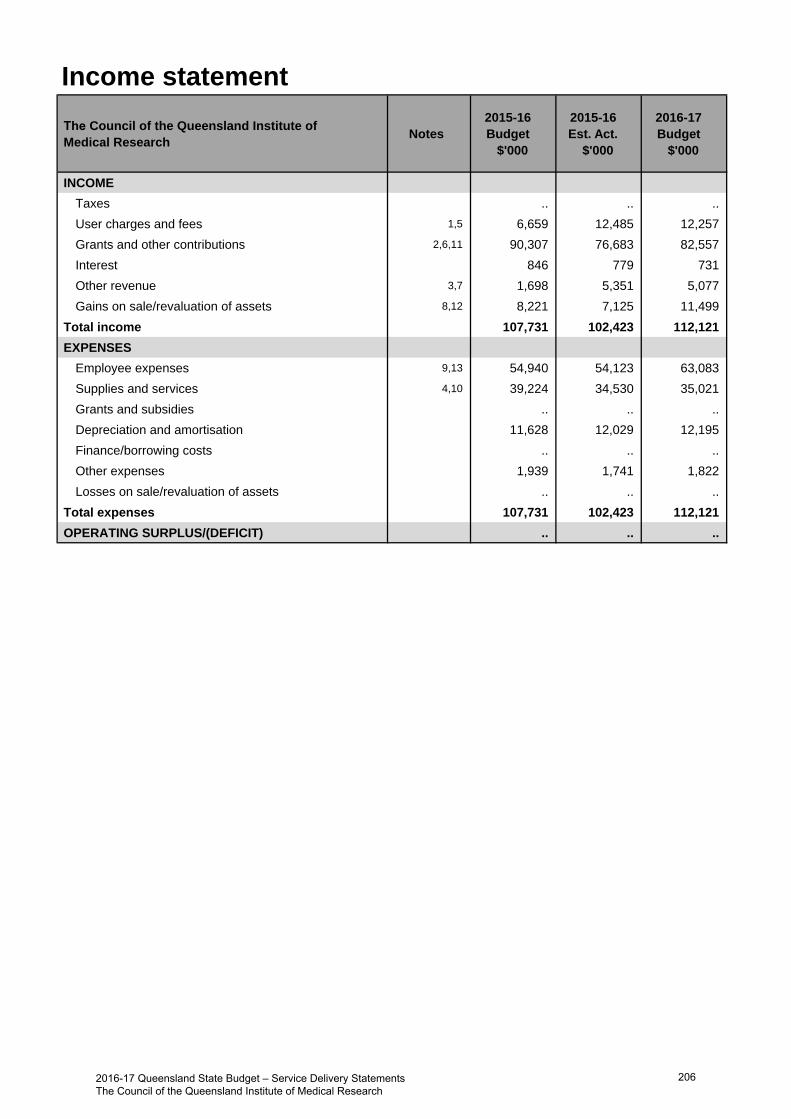
Income statement
The Council of the Queensland Institute of Medical Research
Notes 2015-16 Budget
$'000
2015-16 Est. Act.
$'000
2016-17 Budget
$'000
INCOME
Taxes .. .. ..
User charges and fees 1,5 6,659 12,485 12,257
Grants and other contributions 2,6,11 90,307 76,683 82,557
Interest 846 779 731
Other revenue 3,7 1,698 5,351 5,077
Gains on sale/revaluation of assets 8,12 8,221 7,125 11,499
Total income 107,731 102,423 112,121
EXPENSES
Employee expenses 9,13 54,940 54,123 63,083
Supplies and services 4,10 39,224 34,530 35,021
Grants and subsidies .. .. ..
Depreciation and amortisation 11,628 12,029 12,195
Finance/borrowing costs .. .. ..
Other expenses 1,939 1,741 1,822
Losses on sale/revaluation of assets .. .. ..
Total expenses 107,731 102,423 112,121
OPERATING SURPLUS/(DEFICIT) .. .. ..
2016-17 Queensland State Budget – Service Delivery Statements The Council of the Queensland Institute of Medical Research
206
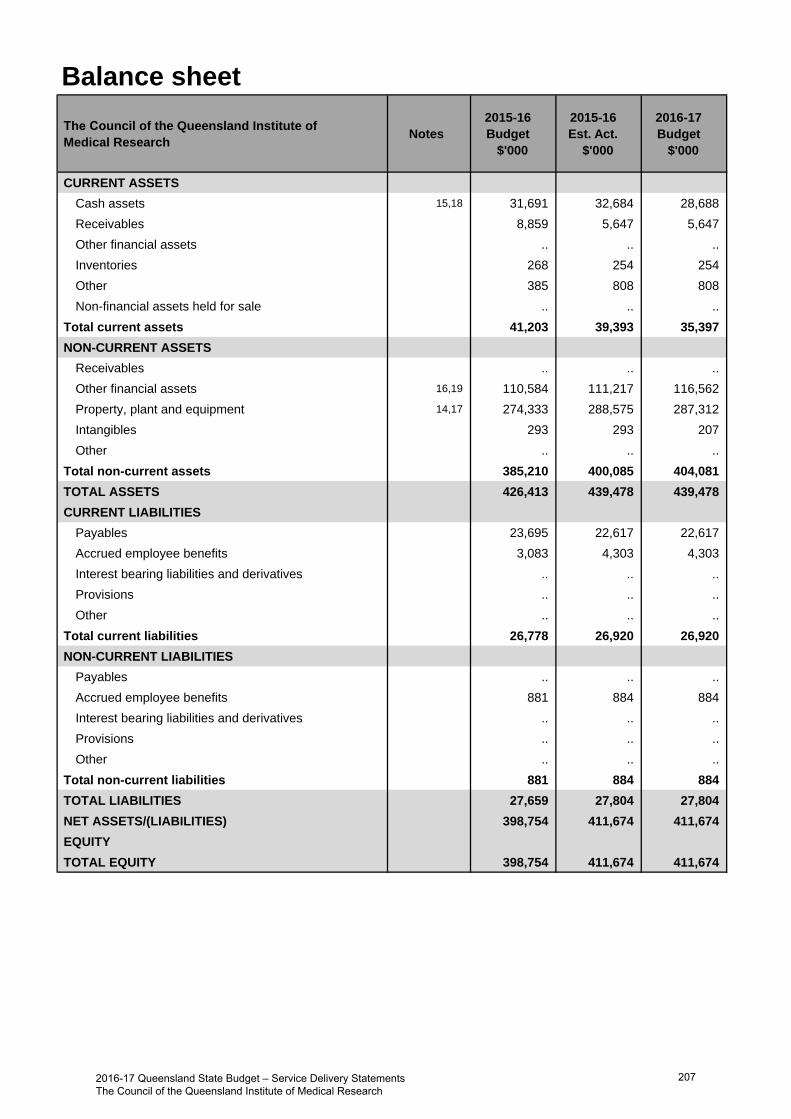
Balance sheet
The Council of the Queensland Institute of Medical Research
Notes 2015-16 Budget
$'000
2015-16 Est. Act.
$'000
2016-17 Budget
$'000
CURRENT ASSETS
Cash assets 15,18 31,691 32,684 28,688
Receivables 8,859 5,647 5,647
Other financial assets .. .. ..
Inventories 268 254 254
Other 385 808 808
Non-financial assets held for sale .. .. ..
Total current assets 41,203 39,393 35,397
NON-CURRENT ASSETS
Receivables .. .. ..
Other financial assets 16,19 110,584 111,217 116,562
Property, plant and equipment 14,17 274,333 288,575 287,312
Intangibles 293 293 207
Other .. .. ..
Total non-current assets 385,210 400,085 404,081
TOTAL ASSETS 426,413 439,478 439,478
CURRENT LIABILITIES
Payables 23,695 22,617 22,617
Accrued employee benefits 3,083 4,303 4,303
Interest bearing liabilities and derivatives .. .. ..
Provisions .. .. ..
Other .. .. ..
Total current liabilities 26,778 26,920 26,920
NON-CURRENT LIABILITIES
Payables .. .. ..
Accrued employee benefits 881 884 884
Interest bearing liabilities and derivatives .. .. ..
Provisions .. .. ..
Other .. .. ..
Total non-current liabilities 881 884 884
TOTAL LIABILITIES 27,659 27,804 27,804
NET ASSETS/(LIABILITIES) 398,754 411,674 411,674
EQUITY
TOTAL EQUITY 398,754 411,674 411,674
2016-17 Queensland State Budget – Service Delivery Statements The Council of the Queensland Institute of Medical Research
207
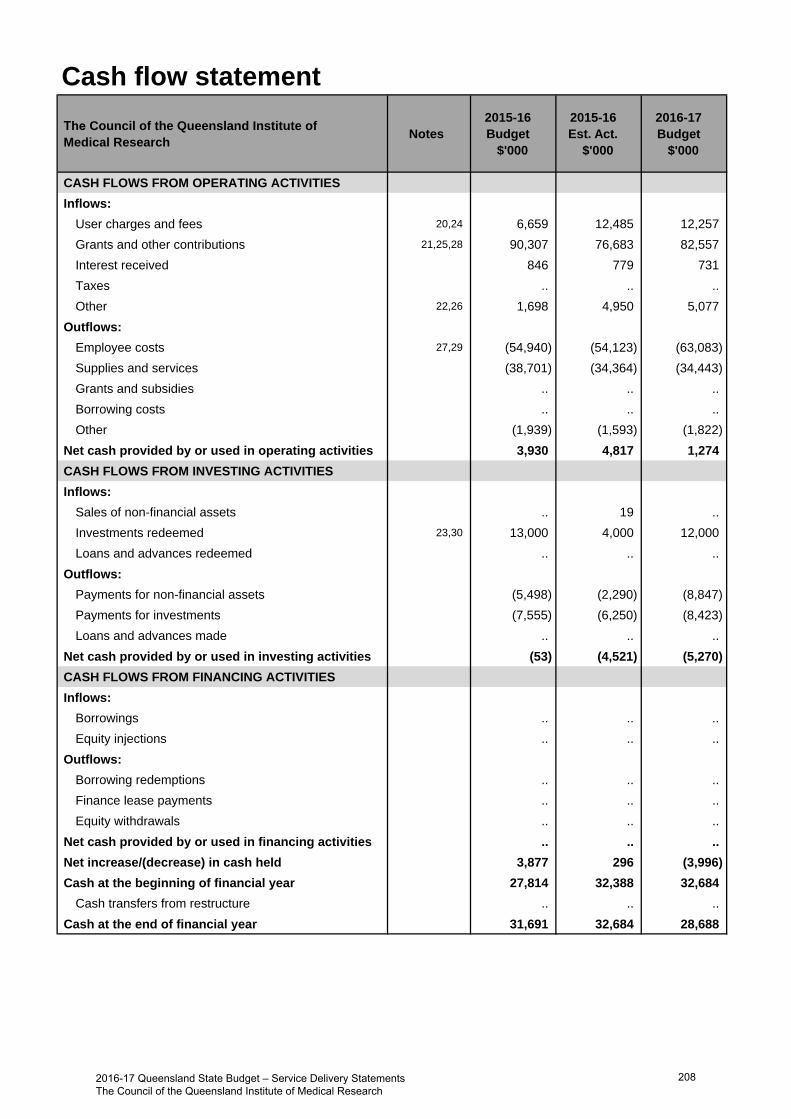
Cash flow statement
The Council of the Queensland Institute of Medical Research
Notes 2015-16 Budget
$'000
2015-16 Est. Act.
$'000
2016-17 Budget
$'000
CASH FLOWS FROM OPERATING ACTIVITIES
Inflows:
User charges and fees 20,24 6,659 12,485 12,257
Grants and other contributions 21,25,28 90,307 76,683 82,557
Interest received 846 779 731
Taxes .. .. ..
Other 22,26 1,698 4,950 5,077
Outflows:
Employee costs 27,29 (54,940) (54,123) (63,083)
Supplies and services (38,701) (34,364) (34,443)
Grants and subsidies .. .. ..
Borrowing costs .. .. ..
Other (1,939) (1,593) (1,822)
Net cash provided by or used in operating activities 3,930 4,817 1,274
CASH FLOWS FROM INVESTING ACTIVITIES
Inflows:
Sales of non-financial assets .. 19 ..
Investments redeemed 23,30 13,000 4,000 12,000
Loans and advances redeemed .. .. ..
Outflows:
Payments for non-financial assets (5,498) (2,290) (8,847)
Payments for investments (7,555) (6,250) (8,423)
Loans and advances made .. .. ..
Net cash provided by or used in investing activities (53) (4,521) (5,270)
CASH FLOWS FROM FINANCING ACTIVITIES
Inflows:
Borrowings .. .. ..
Equity injections .. .. ..
Outflows:
Borrowing redemptions .. .. ..
Finance lease payments .. .. ..
Equity withdrawals .. .. ..
Net cash provided by or used in financing activities .. .. ..
Net increase/(decrease) in cash held 3,877 296 (3,996)
Cash at the beginning of financial year 27,814 32,388 32,684
Cash transfers from restructure .. .. ..
Cash at the end of financial year 31,691 32,684 28,688
2016-17 Queensland State Budget – Service Delivery Statements The Council of the Queensland Institute of Medical Research
208

Income statementMajor variations between 2015-16 Budget and 2015-16 Estimated Actual include:
1. Increased contract research and commercialisation income in 2015-16 Estimated Actual compared to2015-16 Budget, due to success of initiatives in this area.
2. The 2015-16 Estimated Actual forecasts a reduction in grant and fundraising income compared to the2015-16 Budget, reflecting the competitive environment for both National Health and Medical ResearchCouncil (NHMRC) funding and community donations.
3. Additional collaborations with other organisations has maximised utilisation of laboratory space and generatedadditional income.
4. Lower spending on supplies in the 2015-2016 Estimated Actual in line with the reduction in research grant incomeand cost savings achieved compared to 2015-16 Budget.
Major variations between 2015-16 Budget and 2016-17 Budget include:
5. The 2016-17 Budget reflects an increase in contract research compared to the 2015-16 Budget due to increasedbusiness development activity securing an increase in commercial contracts.
6. The 2016-17 Budget includes reduced fundraising income compared to the 2015-16 Budget, reflecting thecompetitive environment for community donations.
7. Additional collaborations with other organisations has maximised utilisation of laboratory space and generatedadditional income compared to the 2015-16 Budget.
8. Increase in valuation of the Council of the Queensland Institute of Medical Research's (QIMR Berghofer's) buildings.
9. The 2016-17 Budget reflects salary increases in line with the current enterprise agreement as well as higherexpected recruitment costs and salary support for researchers due to reduced availability of NHMRC fellowships.
10. Lower spending on supplies in the 2016-17 Budget due to a lower number of reasearch projects as a result ofreduced donations.
Major variations between 2015-16 Estimated Actual and the 2016-17 Budget include:
11. Although the 2016-17 Budget for fundraising income is lower than previously expected in the 2015-16 Budget, there is an expected increase from the 2015-16 Estimated Actual. In addition, an increase in capital grants for scientific equipment is expected compared to the 2015-16 Estimated Actual.
12. Investment returns for 2016-17 are budgeted to return to long term trend levels compared to lower returninvestment environment experienced in 2015-16 Estimated Actual.
13. The 2016-17 Budget reflects salary increases in line with the current enterprise agreement as well as higherexpected recruitment costs and salary support for researchers due to reduced availability of NHMRC fellowships.
Balance sheetMajor variations between 2015-16 Budget and 2015-16 Estimated Actual include:
14. The higher 2015-16 Estimated Actual value of property, plant and equipment is due to a revaluation of QIMRBerghofer's buildings at the end of the 2014-15 financial year.
Major variations between 2015-16 Budget and 2016-17 Budget include:
15. The decrease in the 2016-17 Budget cash balance is mainly related to ongoing investment in new and/orreplacement equipment including state-of-the-art scientific equipment.
16. The expected higher market value of QIMR Berghofer's long term investments reflects an expected positivemarket performance in the 2016-17 Budget year.
17. The higher 2016-17 budgeted value of property, plant and equipment is based on the revaluation of QIMRBerghofer's buildings at the end of the 2014-15 financial year.
Explanation of variances in the financial statements
2016-17 Queensland State Budget – Service Delivery Statements The Council of the Queensland Institute of Medical Research
209

Major variations between 2015-16 Estimated Actual and the 2016-17 Budget include:
18. The decrease in the 2016-17 budgeted cash balance is mainly related to ongoing investment in new and/orreplacement equipment including state-of-the-art scientific equipment.
19. The market value of QIMR Berghofer's long term investments is budgeted to increase in the 2016-17 Budget asinvestment returns are expected to revert to long term trend rates compared to lower return investmentenvironment experienced in 2015-16 Estimated Actual.
Cash flow statementMajor variations between 2015-16 Budget and 2015-16 Estimated Actual include:
20. Increased contract research and commercialisation income in 2015-16 Estimated Actual, due to success ofinitiatives in this area.
21. The 2015-16 Estimated Actual forecasts a reduction in grant and fundraising income compared to the2015-16 Budget, reflecting the competitive environment for both NHMRC funding and community donations.
22. Additional collaborations with other organisations has maximised utilisation of laboratory space and generatedadditional income.
23. The 2015-16 Estimated Actual includes reduced redemptions from long term investments to fund QIMRBerghofer's operating and capital expenditure requirements, due to lower consumables required and cost savingsachieved.
Major variations between 2015-16 Budget and 2016-17 Budget include:
24. The 2016-17 Budget reflects an increase in contract research compared to the 2015-16 Budget due to increasedbusiness development activity securing an increase in commercial contracts.
25. The 2016-17 Budget includes reduced fundraising income compared to the 2015-16 Budget, reflecting thecompetitive environment for community donations.
26. Additional collaborations with other organisations has maximised utilisation of laboratory space and generatedadditional income compared to the 2015-16 Budget.
27. The 2016-17 Budget reflects salary increases in line with the current enterprise agreement as well as higherexpected recruitment costs and salary support for researchers due to reduced availability of NHMRC fellowships.
Major variations between 2015-16 Estimated Actual and the 2016-17 Budget include:
28. Fundraising income is expected to increase, coupled with an increase in capital grants for scientific equipment,compared to the 2015-16 Estimated Actual.
29. The 2016-17 Budget reflects salary increases in line with the current enterprise agreement as well as higherexpected recruitment costs and salary support for researchers due to reduced availability of NHMRC fellowships.
30. The 2015-16 Estimated Actual includes increased redemptions from long term investments to fund QIMRBerghofer's operating and capital expenditure requirements.
2016-17 Queensland State Budget – Service Delivery Statements The Council of the Queensland Institute of Medical Research
210
Queensland Mental Health Commission
Overview
The Queensland Mental Health Commission (the Commission) was established on 1 July 2013 as an independent statutory body under the Queensland Mental Health Commission Act 2013.
The Commission’s vision is a healthy and inclusive community, where people experiencing mental health difficulties or issues related to substance use have a life with purpose and access to quality care and support focused on wellness and recovery, in an understanding, empathic and compassionate society.
The Commission's purpose is to drive ongoing reform towards a more integrated, evidence-based, recovery-oriented mental health, alcohol and other drugs service system in Queensland, with a broad objective to achieve better outcomes for people in Queensland living with mental health difficulties, mental illness or problematic alcohol and other drug use by:
reaching consensus on and making progress towards achieving system wide reforms maximising the collective impact of lived experience and professional expertise.
The focus for the Commission's work is:
supporting the implementation and development in key priority areas of the whole-of-government Queensland Mental Health, Drug and Alcohol Strategic Plan 2014-2019
research and reporting on issues impacting people experiencing mental health difficulties, mental illness and problematic alcohol and other drug use and those affected by suicide
mental health promotion, awareness and early intervention supporting systemic governance including support for the Queensland Mental Health and Drug Advisory Council and
promoting engagement of people with lived experience in system reform.
This work contributes to the Queensland Government’s objectives for the community, delivering quality front line services, creating jobs and a diverse economy and building safe, caring and connected communities with a focus on mental health issues and drug and alcohol problems.
Service summary
The Commission has an operating budget of $8.8 million in 2016-17 reflecting minimal variation with the published 2015-16 operating budget of $8.3 million.
During 2015-16 the Commission continued its work in facilitating the implementation of the Queensland Mental Health, Drug and Alcohol Strategic Plan 2014-2019.
Key deliverables supporting this included the development and release of the:
Early Action: Queensland Mental Health Promotion, Prevention and Early Intervention Action Plan 2015–17 Queensland Suicide Prevention Action Plan 2015-17 Queensland Alcohol and other Drugs Action Plan 2015-17.
Together these action plans included almost 200 specific commitments from 18 public sector agencies.
The first report on the implementation of the Queensland Mental Health, Drug and Alcohol Strategic Plan 2014-2019 was publicly released in December 2015. The Commission also released the Performance Indicators report which outlined key performance indicators for Queensland against the Strategic Plan's six outcomes.
Other key achievements for the year included: delivery of the Stronger Community Mental Health and Wellbeing Grants program which provided $400,000 in grants to
implement projects statewide which support social inclusion and community participation publication of the Commission's first Ordinary Report Social housing, Systemic issues for tenants with complex needs,
which has influenced State Government actions to support social housing tenants experience mental health and alcohol and other drugs issues
submissions to inform the development of the new mental health legislation in Queensland with a focus on recovery, least restrictive practices and human rights protections
supporting the work of the Queensland Mental Health and Drug Advisory Council, including development of strategies to enhance the engagement of consumers, families and carers and to improve outcomes for Aboriginal and Torres Strait Islander peoples.
2016-17 Queensland State Budget – Service Delivery Statements – Queensland Mental Health Commission 211
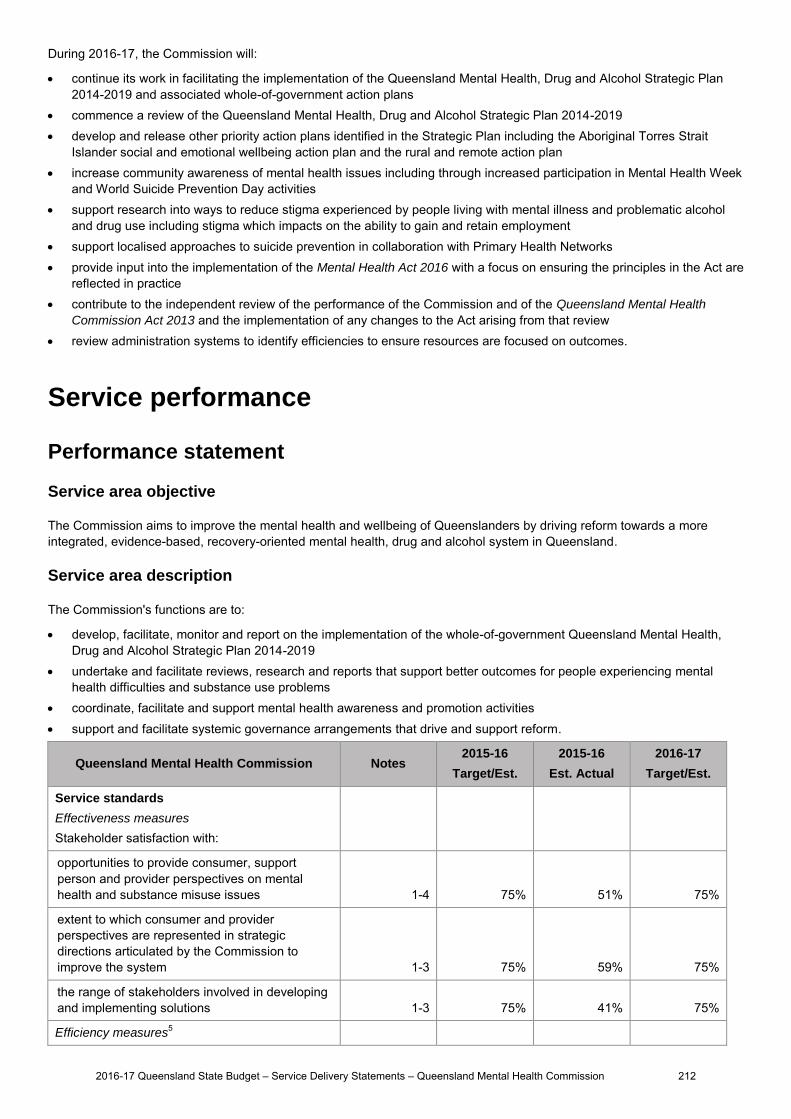
During 2016-17, the Commission will:
continue its work in facilitating the implementation of the Queensland Mental Health, Drug and Alcohol Strategic Plan 2014-2019 and associated whole-of-government action plans
commence a review of the Queensland Mental Health, Drug and Alcohol Strategic Plan 2014-2019 develop and release other priority action plans identified in the Strategic Plan including the Aboriginal Torres Strait
Islander social and emotional wellbeing action plan and the rural and remote action plan increase community awareness of mental health issues including through increased participation in Mental Health Week
and World Suicide Prevention Day activities support research into ways to reduce stigma experienced by people living with mental illness and problematic alcohol
and drug use including stigma which impacts on the ability to gain and retain employment support localised approaches to suicide prevention in collaboration with Primary Health Networks provide input into the implementation of the Mental Health Act 2016 with a focus on ensuring the principles in the Act are
reflected in practice contribute to the independent review of the performance of the Commission and of the Queensland Mental Health
Commission Act 2013 and the implementation of any changes to the Act arising from that review review administration systems to identify efficiencies to ensure resources are focused on outcomes.
Service performance
Performance statement
Service area objective
The Commission aims to improve the mental health and wellbeing of Queenslanders by driving reform towards a more integrated, evidence-based, recovery-oriented mental health, drug and alcohol system in Queensland.
Service area description
The Commission's functions are to:
develop, facilitate, monitor and report on the implementation of the whole-of-government Queensland Mental Health, Drug and Alcohol Strategic Plan 2014-2019
undertake and facilitate reviews, research and reports that support better outcomes for people experiencing mental health difficulties and substance use problems
coordinate, facilitate and support mental health awareness and promotion activities support and facilitate systemic governance arrangements that drive and support reform.
Queensland Mental Health Commission Notes 2015-16
Target/Est.
2015-16
Est. Actual
2016-17
Target/Est.
Service standards
Effectiveness measures
Stakeholder satisfaction with:
opportunities to provide consumer, support person and provider perspectives on mental health and substance misuse issues 1-4 75% 51% 75%
extent to which consumer and provider perspectives are represented in strategic directions articulated by the Commission to improve the system 1-3 75% 59% 75%
the range of stakeholders involved in developing and implementing solutions 1-3 75% 41% 75%
Efficiency measures5
2016-17 Queensland State Budget – Service Delivery Statements – Queensland Mental Health Commission 212
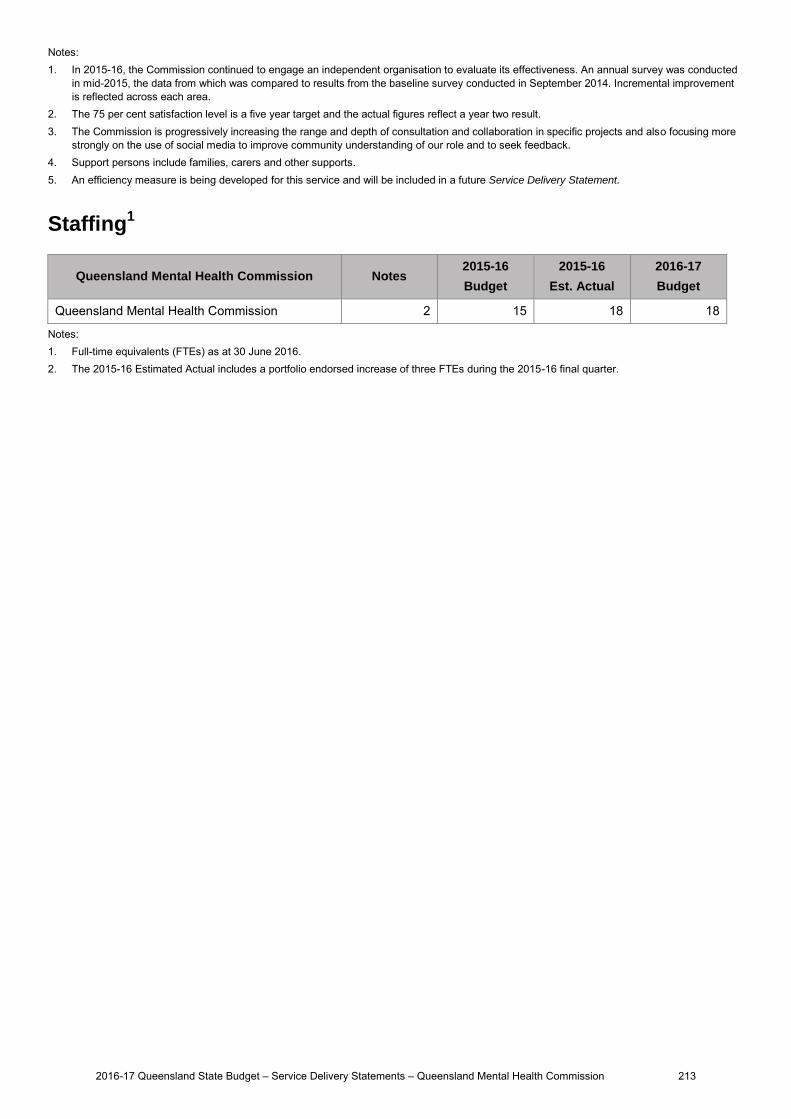
Notes: 1. In 2015-16, the Commission continued to engage an independent organisation to evaluate its effectiveness. An annual survey was conducted
in mid-2015, the data from which was compared to results from the baseline survey conducted in September 2014. Incremental improvement is reflected across each area.
2. The 75 per cent satisfaction level is a five year target and the actual figures reflect a year two result. 3. The Commission is progressively increasing the range and depth of consultation and collaboration in specific projects and also focusing more
strongly on the use of social media to improve community understanding of our role and to seek feedback. 4. Support persons include families, carers and other supports. 5. An efficiency measure is being developed for this service and will be included in a future Service Delivery Statement.
Staffing1
Queensland Mental Health Commission Notes 2015-16
Budget
2015-16
Est. Actual
2016-17
Budget
Queensland Mental Health Commission 2 15 18 18
Notes: 1. Full-time equivalents (FTEs) as at 30 June 2016. 2. The 2015-16 Estimated Actual includes a portfolio endorsed increase of three FTEs during the 2015-16 final quarter.
2016-17 Queensland State Budget – Service Delivery Statements – Queensland Mental Health Commission 213
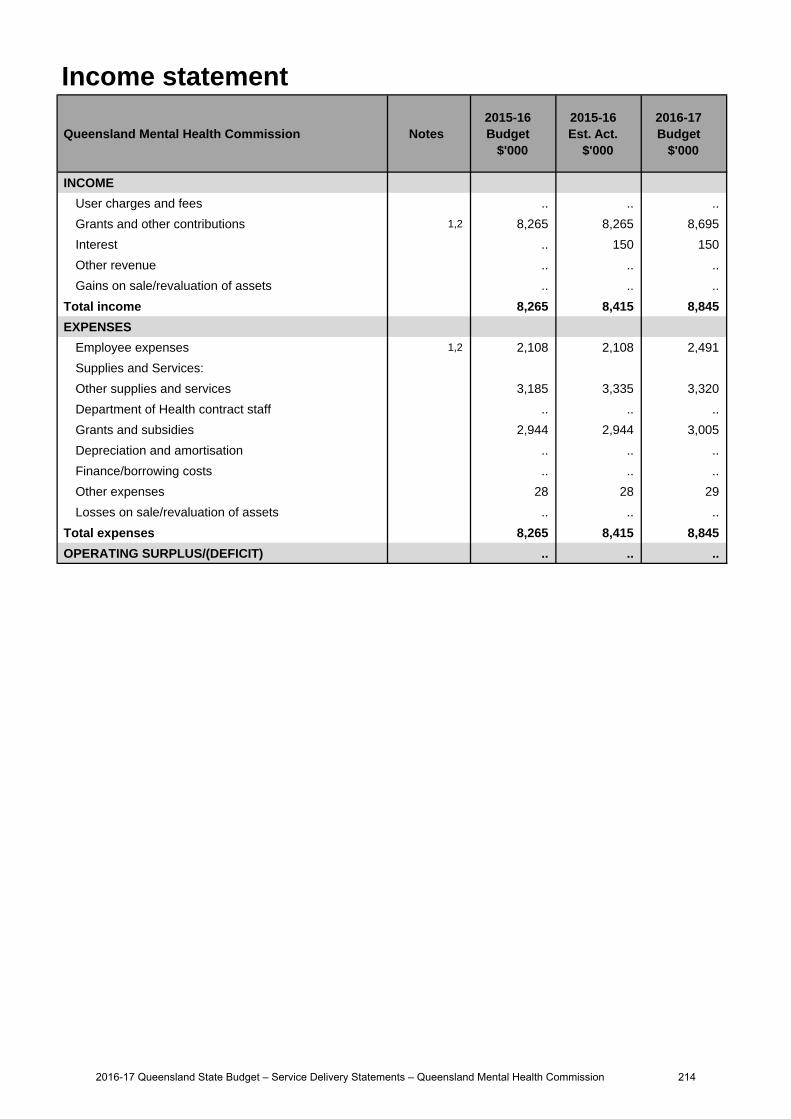
Income statement
Queensland Mental Health Commission Notes 2015-16 Budget
$'000
2015-16 Est. Act.
$'000
2016-17 Budget
$'000
INCOME
User charges and fees .. .. ..
Grants and other contributions 1,2 8,265 8,265 8,695
Interest .. 150 150
Other revenue .. .. ..
Gains on sale/revaluation of assets .. .. ..
Total income 8,265 8,415 8,845
EXPENSES
Employee expenses 1,2 2,108 2,108 2,491
Supplies and Services:
Other supplies and services 3,185 3,335 3,320
Department of Health contract staff .. .. ..
Grants and subsidies 2,944 2,944 3,005
Depreciation and amortisation .. .. ..
Finance/borrowing costs .. .. ..
Other expenses 28 28 29
Losses on sale/revaluation of assets .. .. ..
Total expenses 8,265 8,415 8,845
OPERATING SURPLUS/(DEFICIT) .. .. ..
2016-17 Queensland State Budget – Service Delivery Statements – Queensland Mental Health Commission 214
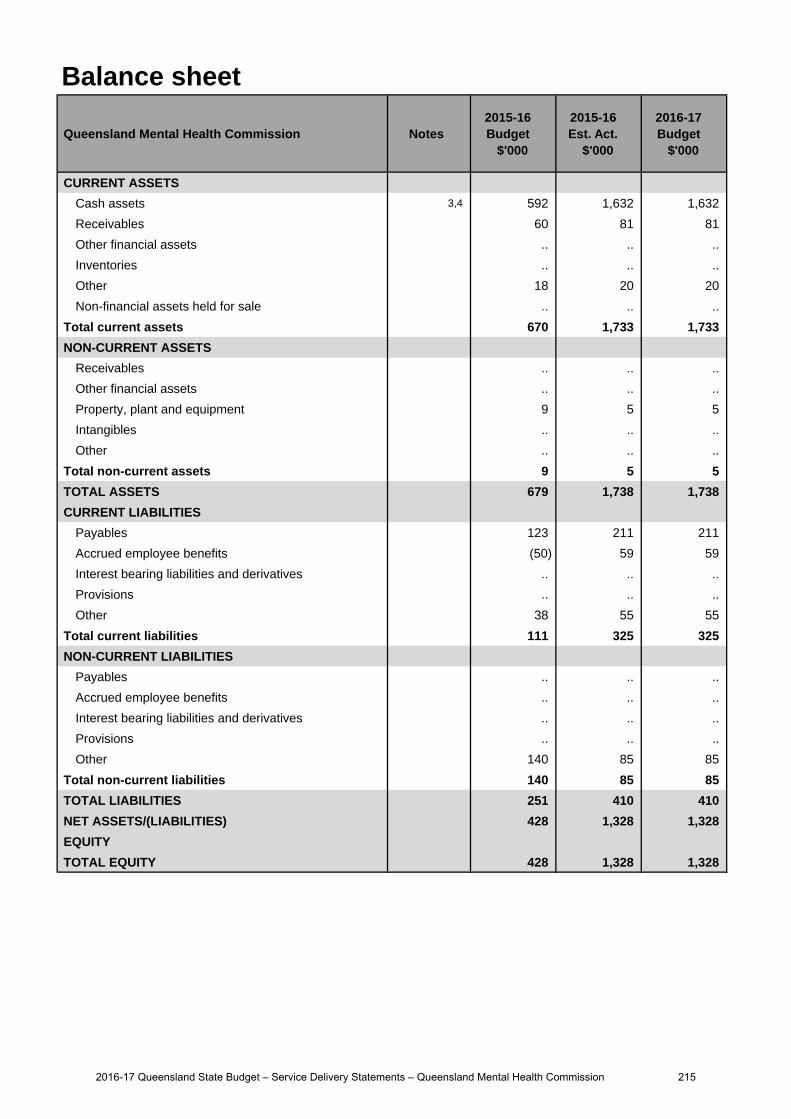
Balance sheet
Queensland Mental Health Commission Notes 2015-16 Budget
$'000
2015-16 Est. Act.
$'000
2016-17 Budget
$'000
CURRENT ASSETS
Cash assets 3,4 592 1,632 1,632
Receivables 60 81 81
Other financial assets .. .. ..
Inventories .. .. ..
Other 18 20 20
Non-financial assets held for sale .. .. ..
Total current assets 670 1,733 1,733
NON-CURRENT ASSETS
Receivables .. .. ..
Other financial assets .. .. ..
Property, plant and equipment 9 5 5
Intangibles .. .. ..
Other .. .. ..
Total non-current assets 9 5 5
TOTAL ASSETS 679 1,738 1,738
CURRENT LIABILITIES
Payables 123 211 211
Accrued employee benefits (50) 59 59
Interest bearing liabilities and derivatives .. .. ..
Provisions .. .. ..
Other 38 55 55
Total current liabilities 111 325 325
NON-CURRENT LIABILITIES
Payables .. .. ..
Accrued employee benefits .. .. ..
Interest bearing liabilities and derivatives .. .. ..
Provisions .. .. ..
Other 140 85 85
Total non-current liabilities 140 85 85
TOTAL LIABILITIES 251 410 410
NET ASSETS/(LIABILITIES) 428 1,328 1,328
EQUITY
TOTAL EQUITY 428 1,328 1,328
2016-17 Queensland State Budget – Service Delivery Statements – Queensland Mental Health Commission 215
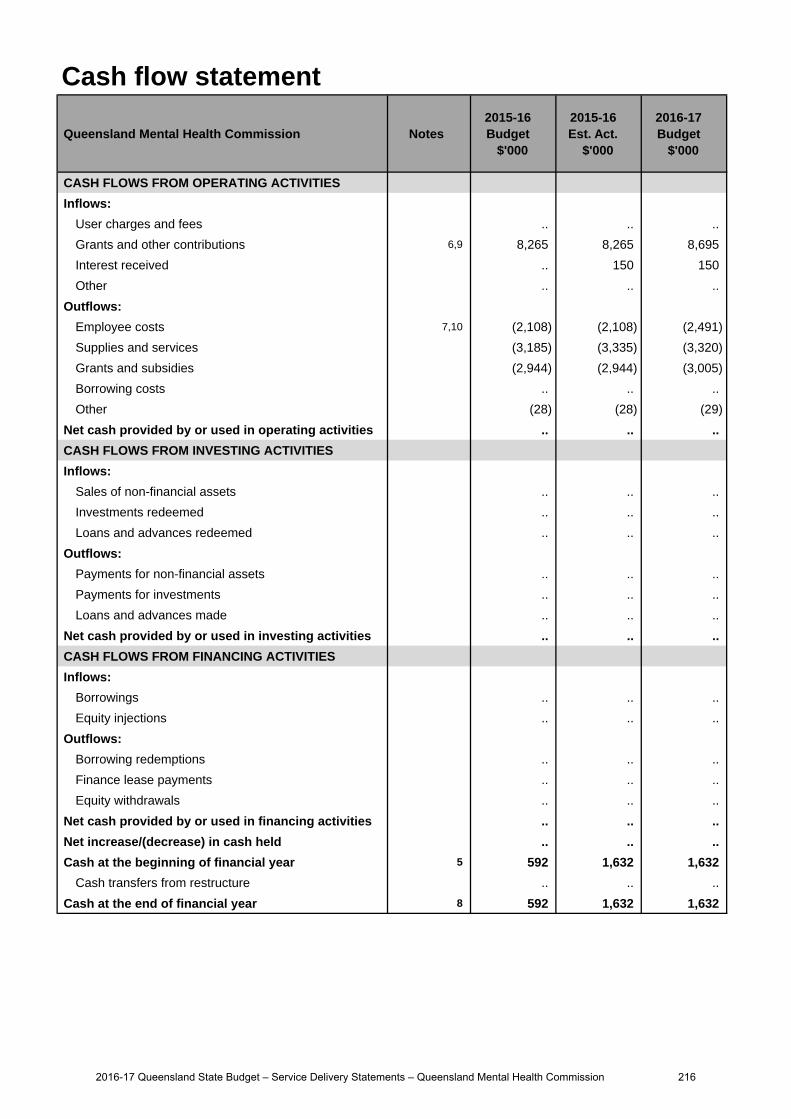
Cash flow statement
Queensland Mental Health Commission Notes 2015-16 Budget
$'000
2015-16 Est. Act.
$'000
2016-17 Budget
$'000
CASH FLOWS FROM OPERATING ACTIVITIES
Inflows:
User charges and fees .. .. ..
Grants and other contributions 6,9 8,265 8,265 8,695
Interest received .. 150 150
Other .. .. ..
Outflows:
Employee costs 7,10 (2,108) (2,108) (2,491)
Supplies and services (3,185) (3,335) (3,320)
Grants and subsidies (2,944) (2,944) (3,005)
Borrowing costs .. .. ..
Other (28) (28) (29)
Net cash provided by or used in operating activities .. .. ..
CASH FLOWS FROM INVESTING ACTIVITIES
Inflows:
Sales of non-financial assets .. .. ..
Investments redeemed .. .. ..
Loans and advances redeemed .. .. ..
Outflows:
Payments for non-financial assets .. .. ..
Payments for investments .. .. ..
Loans and advances made .. .. ..
Net cash provided by or used in investing activities .. .. ..
CASH FLOWS FROM FINANCING ACTIVITIES
Inflows:
Borrowings .. .. ..
Equity injections .. .. ..
Outflows:
Borrowing redemptions .. .. ..
Finance lease payments .. .. ..
Equity withdrawals .. .. ..
Net cash provided by or used in financing activities .. .. ..
Net increase/(decrease) in cash held .. .. ..
Cash at the beginning of financial year 5 592 1,632 1,632
Cash transfers from restructure .. .. ..
Cash at the end of financial year 8 592 1,632 1,632
2016-17 Queensland State Budget – Service Delivery Statements – Queensland Mental Health Commission 216
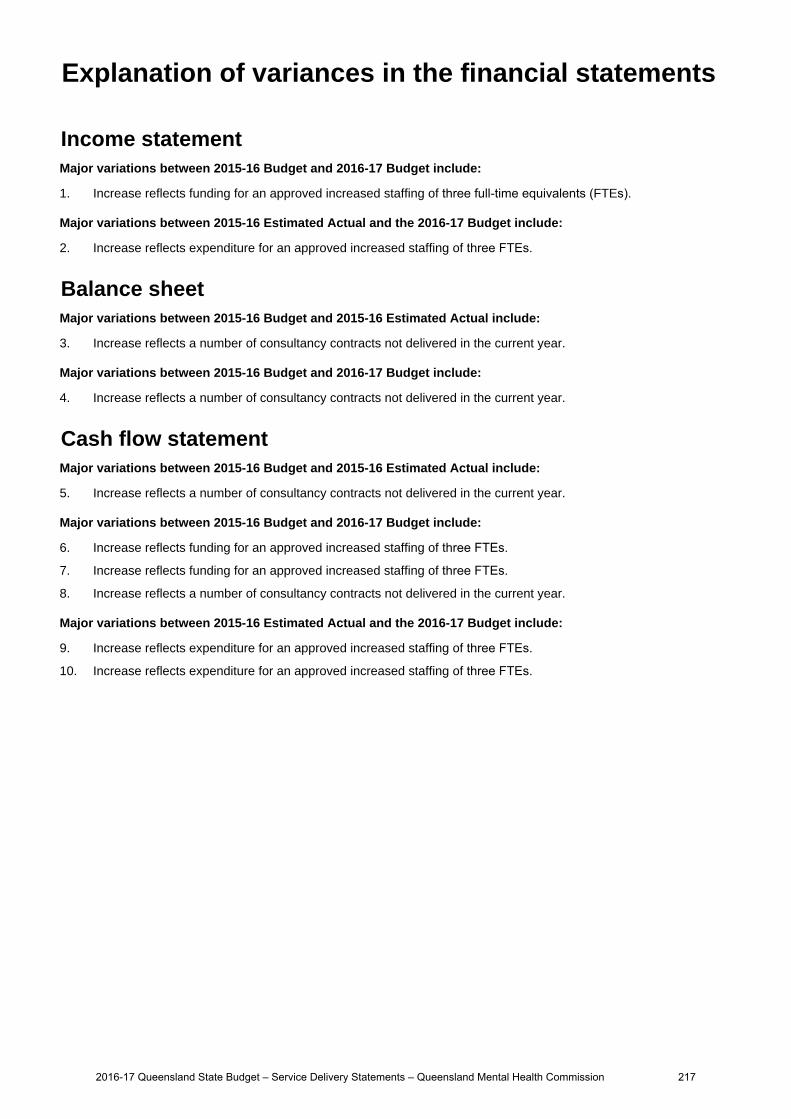
Income statementMajor variations between 2015-16 Budget and 2016-17 Budget include:
1. Increase reflects funding for an approved increased staffing of three full-time equivalents (FTEs).
Major variations between 2015-16 Estimated Actual and the 2016-17 Budget include:
2. Increase reflects expenditure for an approved increased staffing of three FTEs.
Balance sheetMajor variations between 2015-16 Budget and 2015-16 Estimated Actual include:
3. Increase reflects a number of consultancy contracts not delivered in the current year.
Major variations between 2015-16 Budget and 2016-17 Budget include:
4. Increase reflects a number of consultancy contracts not delivered in the current year.
Cash flow statementMajor variations between 2015-16 Budget and 2015-16 Estimated Actual include:
5. Increase reflects a number of consultancy contracts not delivered in the current year.
Major variations between 2015-16 Budget and 2016-17 Budget include:
6. Increase reflects funding for an approved increased staffing of three FTEs.
7. Increase reflects funding for an approved increased staffing of three FTEs.
8. Increase reflects a number of consultancy contracts not delivered in the current year.
Major variations between 2015-16 Estimated Actual and the 2016-17 Budget include:
9. Increase reflects expenditure for an approved increased staffing of three FTEs.
10. Increase reflects expenditure for an approved increased staffing of three FTEs.
Explanation of variances in the financial statements
2016-17 Queensland State Budget – Service Delivery Statements – Queensland Mental Health Commission 217
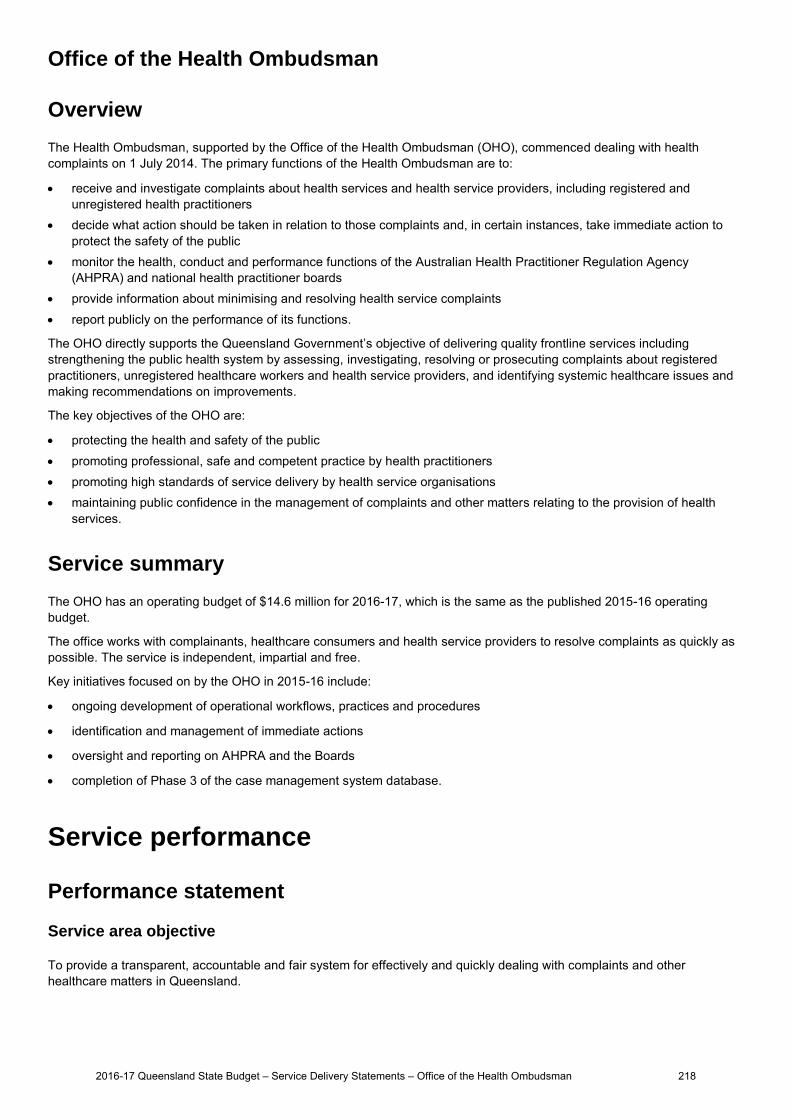
Office of the Health Ombudsman
Overview
The Health Ombudsman, supported by the Office of the Health Ombudsman (OHO), commenced dealing with health complaints on 1 July 2014. The primary functions of the Health Ombudsman are to:
receive and investigate complaints about health services and health service providers, including registered and unregistered health practitioners
decide what action should be taken in relation to those complaints and, in certain instances, take immediate action to protect the safety of the public
monitor the health, conduct and performance functions of the Australian Health Practitioner Regulation Agency (AHPRA) and national health practitioner boards
provide information about minimising and resolving health service complaints report publicly on the performance of its functions.
The OHO directly supports the Queensland Government’s objective of delivering quality frontline services including strengthening the public health system by assessing, investigating, resolving or prosecuting complaints about registered practitioners, unregistered healthcare workers and health service providers, and identifying systemic healthcare issues and making recommendations on improvements.
The key objectives of the OHO are:
protecting the health and safety of the public promoting professional, safe and competent practice by health practitioners promoting high standards of service delivery by health service organisations maintaining public confidence in the management of complaints and other matters relating to the provision of health
services.
Service summary
The OHO has an operating budget of $14.6 million for 2016-17, which is the same as the published 2015-16 operating budget.
The office works with complainants, healthcare consumers and health service providers to resolve complaints as quickly as possible. The service is independent, impartial and free.
Key initiatives focused on by the OHO in 2015-16 include:
ongoing development of operational workflows, practices and procedures
identification and management of immediate actions
oversight and reporting on AHPRA and the Boards
completion of Phase 3 of the case management system database.
Service performance
Performance statement
Service area objective
To provide a transparent, accountable and fair system for effectively and quickly dealing with complaints and other healthcare matters in Queensland.
2016-17 Queensland State Budget – Service Delivery Statements – Office of the Health Ombudsman 218
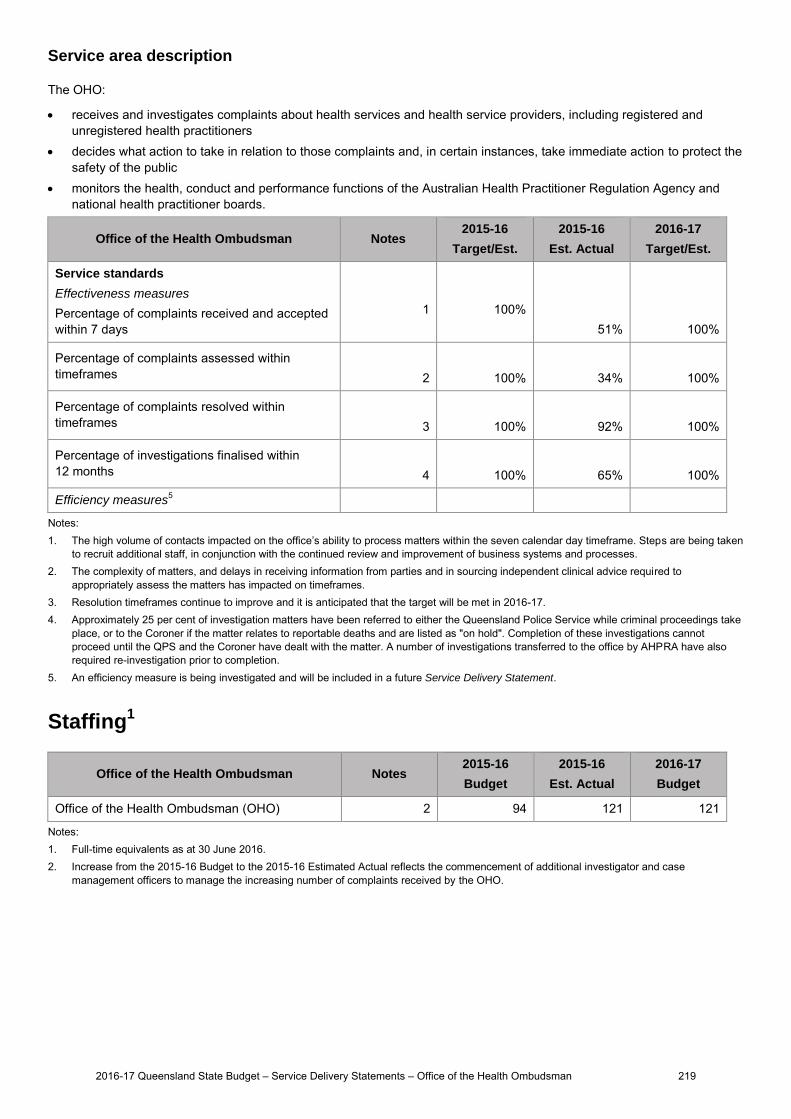
Service area description
The OHO:
receives and investigates complaints about health services and health service providers, including registered and unregistered health practitioners
decides what action to take in relation to those complaints and, in certain instances, take immediate action to protect the safety of the public
monitors the health, conduct and performance functions of the Australian Health Practitioner Regulation Agency and national health practitioner boards.
Office of the Health Ombudsman Notes 2015-16
Target/Est.
2015-16
Est. Actual
2016-17
Target/Est.
Service standards
Effectiveness measures
Percentage of complaints received and accepted within 7 days
1
100%
51% 100%
Percentage of complaints assessed within timeframes 2 100% 34% 100%
Percentage of complaints resolved within timeframes 3 100% 92% 100%
Percentage of investigations finalised within 12 months 4 100% 65% 100%
Efficiency measures5
Notes: 1. The high volume of contacts impacted on the office’s ability to process matters within the seven calendar day timeframe. Steps are being taken
to recruit additional staff, in conjunction with the continued review and improvement of business systems and processes. 2. The complexity of matters, and delays in receiving information from parties and in sourcing independent clinical advice required to
appropriately assess the matters has impacted on timeframes. 3. Resolution timeframes continue to improve and it is anticipated that the target will be met in 2016-17. 4. Approximately 25 per cent of investigation matters have been referred to either the Queensland Police Service while criminal proceedings take
place, or to the Coroner if the matter relates to reportable deaths and are listed as "on hold". Completion of these investigations cannot proceed until the QPS and the Coroner have dealt with the matter. A number of investigations transferred to the office by AHPRA have also required re-investigation prior to completion.
5. An efficiency measure is being investigated and will be included in a future Service Delivery Statement.
Staffing1
Office of the Health Ombudsman Notes 2015-16
Budget
2015-16
Est. Actual
2016-17
Budget
Office of the Health Ombudsman (OHO) 2 94 121 121
Notes: 1. Full-time equivalents as at 30 June 2016. 2. Increase from the 2015-16 Budget to the 2015-16 Estimated Actual reflects the commencement of additional investigator and case
management officers to manage the increasing number of complaints received by the OHO.
2016-17 Queensland State Budget – Service Delivery Statements – Office of the Health Ombudsman 219
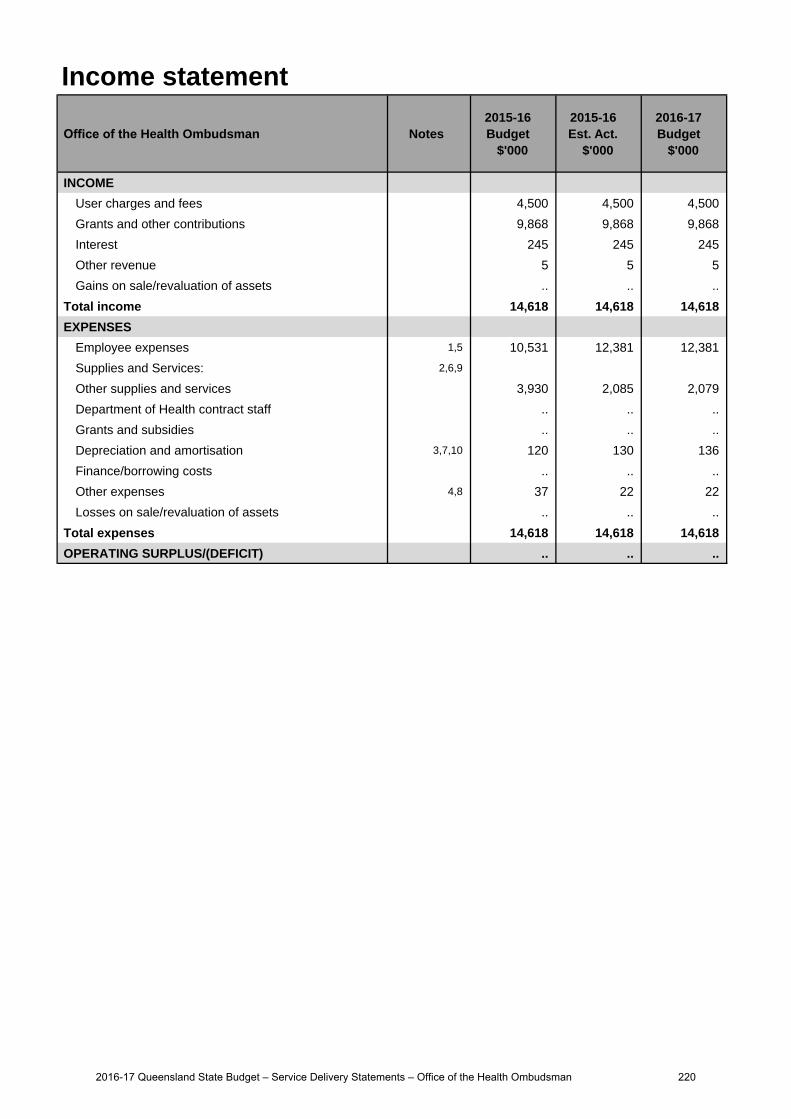
Income statement
Office of the Health Ombudsman Notes 2015-16 Budget
$'000
2015-16 Est. Act.
$'000
2016-17 Budget
$'000
INCOME
User charges and fees 4,500 4,500 4,500
Grants and other contributions 9,868 9,868 9,868
Interest 245 245 245
Other revenue 5 5 5
Gains on sale/revaluation of assets .. .. ..
Total income 14,618 14,618 14,618
EXPENSES
Employee expenses 1,5 10,531 12,381 12,381
Supplies and Services: 2,6,9
Other supplies and services 3,930 2,085 2,079
Department of Health contract staff .. .. ..
Grants and subsidies .. .. ..
Depreciation and amortisation 3,7,10 120 130 136
Finance/borrowing costs .. .. ..
Other expenses 4,8 37 22 22
Losses on sale/revaluation of assets .. .. ..
Total expenses 14,618 14,618 14,618
OPERATING SURPLUS/(DEFICIT) .. .. ..
2016-17 Queensland State Budget – Service Delivery Statements – Office of the Health Ombudsman 220
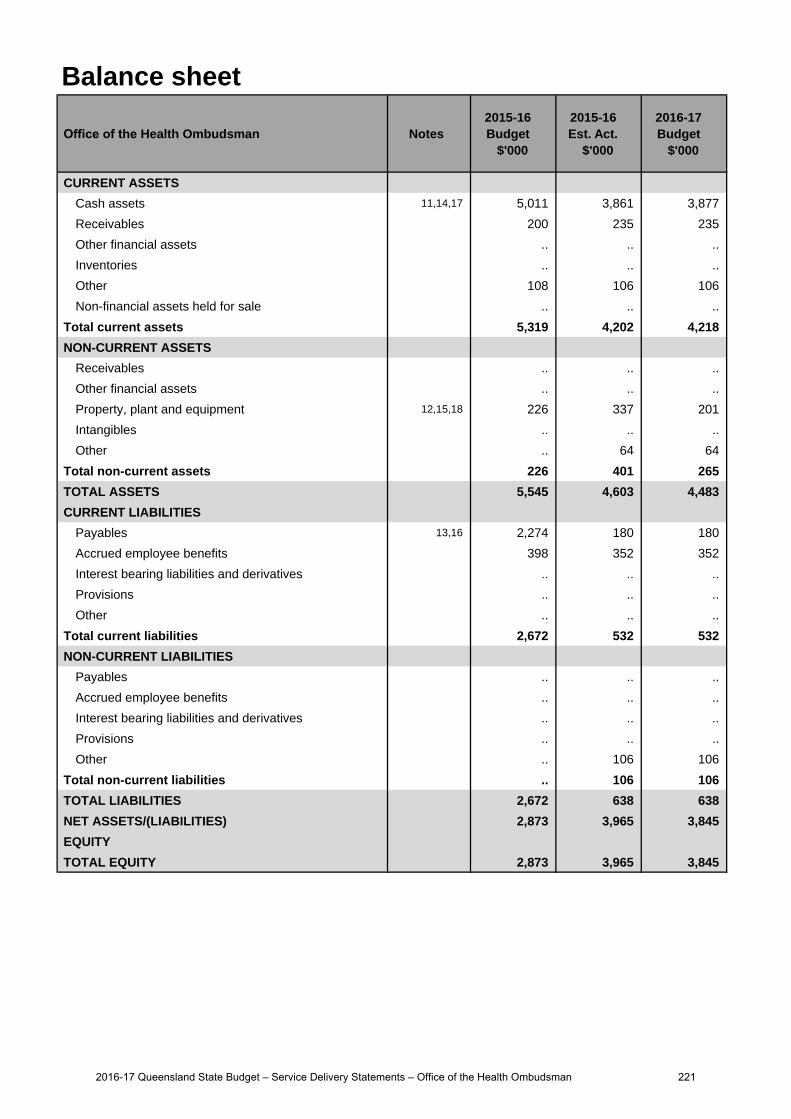
Balance sheet
Office of the Health Ombudsman Notes 2015-16 Budget
$'000
2015-16 Est. Act.
$'000
2016-17 Budget
$'000
CURRENT ASSETS
Cash assets 11,14,17 5,011 3,861 3,877
Receivables 200 235 235
Other financial assets .. .. ..
Inventories .. .. ..
Other 108 106 106
Non-financial assets held for sale .. .. ..
Total current assets 5,319 4,202 4,218
NON-CURRENT ASSETS
Receivables .. .. ..
Other financial assets .. .. ..
Property, plant and equipment 12,15,18 226 337 201
Intangibles .. .. ..
Other .. 64 64
Total non-current assets 226 401 265
TOTAL ASSETS 5,545 4,603 4,483
CURRENT LIABILITIES
Payables 13,16 2,274 180 180
Accrued employee benefits 398 352 352
Interest bearing liabilities and derivatives .. .. ..
Provisions .. .. ..
Other .. .. ..
Total current liabilities 2,672 532 532
NON-CURRENT LIABILITIES
Payables .. .. ..
Accrued employee benefits .. .. ..
Interest bearing liabilities and derivatives .. .. ..
Provisions .. .. ..
Other .. 106 106
Total non-current liabilities .. 106 106
TOTAL LIABILITIES 2,672 638 638
NET ASSETS/(LIABILITIES) 2,873 3,965 3,845
EQUITY
TOTAL EQUITY 2,873 3,965 3,845
2016-17 Queensland State Budget – Service Delivery Statements – Office of the Health Ombudsman 221
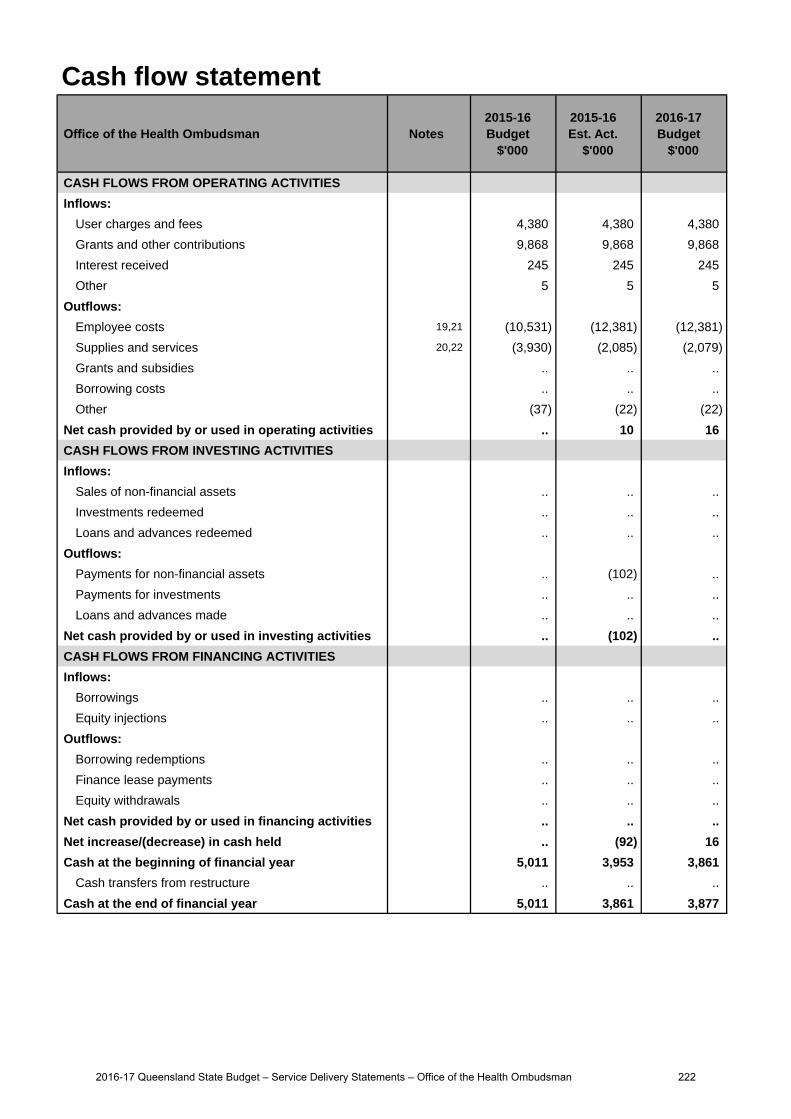
Cash flow statement
Office of the Health Ombudsman Notes 2015-16 Budget
$'000
2015-16 Est. Act.
$'000
2016-17 Budget
$'000
CASH FLOWS FROM OPERATING ACTIVITIES
Inflows:
User charges and fees 4,380 4,380 4,380
Grants and other contributions 9,868 9,868 9,868
Interest received 245 245 245
Other 5 5 5
Outflows:
Employee costs 19,21 (10,531) (12,381) (12,381)
Supplies and services 20,22 (3,930) (2,085) (2,079)
Grants and subsidies .. .. ..
Borrowing costs .. .. ..
Other (37) (22) (22)
Net cash provided by or used in operating activities .. 10 16
CASH FLOWS FROM INVESTING ACTIVITIES
Inflows:
Sales of non-financial assets .. .. ..
Investments redeemed .. .. ..
Loans and advances redeemed .. .. ..
Outflows:
Payments for non-financial assets .. (102) ..
Payments for investments .. .. ..
Loans and advances made .. .. ..
Net cash provided by or used in investing activities .. (102) ..
CASH FLOWS FROM FINANCING ACTIVITIES
Inflows:
Borrowings .. .. ..
Equity injections .. .. ..
Outflows:
Borrowing redemptions .. .. ..
Finance lease payments .. .. ..
Equity withdrawals .. .. ..
Net cash provided by or used in financing activities .. .. ..
Net increase/(decrease) in cash held .. (92) 16
Cash at the beginning of financial year 5,011 3,953 3,861
Cash transfers from restructure .. .. ..
Cash at the end of financial year 5,011 3,861 3,877
2016-17 Queensland State Budget – Service Delivery Statements – Office of the Health Ombudsman 222
Income statementMajor variations between 2015-16 Budget and 2015-16 Estimated Actual include:
1. Increase in employee expenses due to the commencement of additional investigator and casemanagement officers to manage the increasing number of complaints received.
2. Decrease in other supplies and services due to the ongoing efforts of the Office of the Health Ombudsman tominimise service support costs.
3. Increase in depreciation and amortisation due to plant and equipment and software purchases.
4. Decrease in other expenses due to the ongoing efforts of the Office of the Health Ombudsman to minimise costs.
Major variations between 2015-16 Budget and 2016-17 Budget include:
5. Increase in employee expenses due to the commencement of additional investigator and casemanagement officers to manage the increasing number of complaints received.
6. Decrease in other supplies and services is due to the ongoing efforts of the Office of the Health Ombudsmanto minimise service support costs.
7. Increase in depreciation and amortisation due to plant and equipment and software purchases.
8. Decrease in other expenses due to the ongoing efforts of the Office of the Health Ombudsman to minimise costs.
Major variations between 2015-16 Estimated Actual and the 2016-17 Budget include:
9. Decrease in other supplies and services due to the ongoing efforts of the Office of the Health Ombudsman tominimise service support costs.
10. Increase in depreciation and amortisation due to plant and equipment and software purchases.
Balance sheetMajor variations between 2015-16 Budget and 2015-16 Estimated Actual include:
11. Decrease in cash assets due to the outstanding amount owing from Australian Health Practitioner RegulationAgency (AHPRA) funding.
12. Decrease in property, plant and equipment due to the anticipated finalisation of the majority ofinfrastructure projects linked to the establishment of the office.
13. Decrease in payables due to the offset in the cash assets.
Major variations between 2015-16 Budget and 2016-17 Budget include:
14. Decrease in cash assets due to the outstanding amount owing from AHPRA funding.
15. Decrease in property, plant and equipment due to the anticipated finalisation of the majority ofinfrastructure projects linked to the establishment of the office.
16. Decrease in payables due to the offset in the cash assets.
Major variations between 2015-16 Estimated Actual and the 2016-17 Budget include:
17. Decrease in cash assets due to the outstanding amount owing from AHPRA funding.
18. Decrease in property, plant and equipment due to the anticipated finalisation of the majority ofinfrastructure projects linked to the establishment of the office.
Cash flow statementMajor variations between 2015-16 Budget and 2015-16 Estimated Actual include:
19. Increase in employee costs due to the commencement of additional investigator and case management officersto manage the increasing number of complaints received.
Explanation of variances in the financial statements
2016-17 Queensland State Budget – Service Delivery Statements – Office of the Health Ombudsman 223
20. Decrease in supplies and services due to the ongoing efforts of the Office of the Health Ombudsman to minimiseservice support costs.
Major variations between 2015-16 Budget and 2016-17 Budget include:
21. Increase in employee expenses due to the commencement of additional investigator and case managementofficers to manage the increasing number of complaints received.
22. Decrease in supplies and services due to the ongoing efforts of the Office of the Health Ombudsman to minimiseservice support costs.
2016-17 Queensland State Budget – Service Delivery Statements – Office of the Health Ombudsman 224
Glossary of terms
Accrual accounting Recognition of economic events and other financial transactions involving revenue, expenses, assets, liabilities and equity as they occur and reporting in financial statements in the period to which they relate, rather than when a flow of cash occurs.
Administered items Assets, liabilities, revenues and expenses an entity administers, without discretion, on behalf of the Government.
Agency/entity Used generically to refer to the various organisational units within Government that deliver services or otherwise service Government objectives. The term can include departments, commercialised business units, statutory bodies or other organisations established by Executive decision.
Appropriation Funds issued by the Treasurer, under Parliamentary authority, to agencies during a financial year for: delivery of agreed services administered items adjustment of the Government’s equity in agencies, including acquiring of
capital.
Balance sheet A financial statement that reports the assets, liabilities and equity of an entity as at a particular date.
Capital A term used to refer to an entity’s stock of assets and the capital grants it makes to other agencies. Assets include property, plant and equipment, intangible items and inventories that an entity owns/controls and uses in the delivery of services.
Cash Flow Statement A financial statement reporting the cash inflows and outflows for an entity’s operating, investing and financing activities in a particular period.
Controlled Items Assets, liabilities, revenues and expenses that are controlled by departments. These relate directly to the departmental operational objectives and arise at the discretion and direction of that department.
Depreciation The periodic allocation of the cost of physical assets, representing the amount of the asset consumed during a specified time.
Equity Equity is the residual interest in the assets of the entity after deduction of its liabilities. It usually comprises the entity’s accumulated surpluses/losses, capital injections and any reserves.
Equity injection An increase in the investment of the Government in a public sector agency.
Financial statements Collective description of the Income Statement, the Balance Sheet and the Cash Flow Statement for an entity’s controlled and administered activities.
2016-17 Queensland State Budget – Service Delivery Statements – Queensland Health 225
Income statement A financial statement highlighting the accounting surplus or deficit of an entity. It provides an indication of whether the entity has sufficient revenue to meet expenses in the current year, including non-cash costs such as depreciation.
Outcomes Whole-of-government outcomes are intended to cover all dimensions of community wellbeing. They express the current needs and future aspirations of communities, within a social, economic and environment context.
Own-source revenue Revenue that is generated by an agency, generally through the sale of goods and services, but it may also include some Commonwealth funding.
Priorities Key policy areas that will be the focus of Government activity.
Services The actions or activities (including policy development) of an agency which contribute to the achievement of the agency’s objectives.
Service area Related services grouped into a high level service area for communicating the broad types of services delivered by an agency.
Service standard Define a level of performance that is expected to be achieved appropriate for the service area or service. Service standards are measures of efficiency or effectiveness.
For a more detailed Glossary of Terms, please refer to the Reader’s Guide available on the Budget website at www.budget.qld.gov.au
2016-17 Queensland State Budget – Service Delivery Statements – Queensland Health 226

2016-17 Queensland Budget Papers1. Budget Speech
2. Budget Strategy and Outlook
3. Capital Statement
4. Budget Measures
5. Service Delivery Statements
Appropriation Bills
Budget Highlights
The Budget Papers are available online at
www.budget.qld.gov.au
© Crown copyright All rights reservedQueensland Government 2016
Excerpts from this publication may be reproduced, with appropriate acknowledgement, as permitted under the Copyright Act.
Service Delivery Statements
ISSN 1445-4890 (Print)ISSN 1445-4904 (Online) Queensland Budget 2016-17 Service Delivery Statements www.budget.qld.gov.au
16-066 2016-17 SDS covers A4 mono.indd 60 7/06/2016 10:23 AM

Queensland Budget 2016-17 Service Delivery Statements www.budget.qld.gov.au
Queensland HealthService Delivery Statements
Queensland Budget 2016-17
16-066 2016-17 SDS covers A4 mono.indd 58 7/06/2016 10:23 AM


![State Budget 2015-16 Service Delivery Statements [Department name] · PDF fileSERVICE DELIVERY STATEMENTS. 2017-18 Queensland Budg et Papers 1. Budget Speech 2. Budget Strategy and](https://static.fdocuments.net/doc/165x107/5aa06a947f8b9a89178e067f/state-budget-2015-16-service-delivery-statements-department-name-delivery-statements.jpg)


