Server room cooling report
22
1 SERVER ROOM COOLING A PROJECT REPORT Submitted by P S. OM MURUGA BACHELOR OF ENGINEERING IN MECHANICAL ENGINEERING & ANTO FELIX SOTVIK GS BACHELOR OF TECHNOLOGY IN CHEMICAL ENGINEERING Udvavisk Technologies Pvt Ltd. Chennai
-
Upload
ommuruga-ps -
Category
Documents
-
view
49 -
download
2
Transcript of Server room cooling report
1
SERVER ROOM COOLING
A PROJECT REPORT
Submitted by
P S. OM MURUGA
BACHELOR OF ENGINEERING
IN
MECHANICAL ENGINEERING
&
ANTO FELIX SOTVIK GS
BACHELOR OF TECHNOLOGY
IN
CHEMICAL ENGINEERING
Udvavisk Technologies Pvt Ltd. Chennai

2
SERVER ROOM COOLING
CONTENTS
1ABSTRACT
2.INTRODUCTION
3.LITRATURE REVIEW
4.PROBLEM DESCRIPTION
4.1 GOVERNING EQUATIONS
5.METHODOLOGY
5.1 GEOMETRY AND MESH
5.2 BOUNDARY CONDITIONS
5.3 SETUPS
6.NUMERICAL ANALYSIS
6.1 PRE PROCESSING
6.2 SOLVING
6.3 POST PROCESSING
6.3.1 LAMINAR MODEL
6.3.2 K EPSILON TURBULANCE MODEL
6.3.3 MESH INDEPENDENT STUD
6.4 MESH CONVERGENCE STUDY
7.CONCLUSION
8.REFERNCE

3
1.Abstract
The objective of this project is to develop CFD model of a server room at data centres that
accurately predict temperature and flow field. The potential of future investment in data
centre is prosperous, but sustainability is an increasingly important factor. Removing the heat
produced by the IT equipment inside the data centre is very high priority for the data centres,
and it was found that cooling the data centre uses nearly as much power as the IT equipment
itself. It is important to make sure that the data centres are sufficiently cooled while too much
forced convection cooling leads to economical loss and waste of energy. The performance of
the cooling system is increased by replacing raised floor configuration rather than dropped
floor configuration. However raised floor configuration with parallel row arrangement of the
server racks to be the setup that performed best to evaluate result in this. The air temperature
and the velocity of the air is analysed under different conditions.

4
2.Introduction
The cooling of the data centres is crucially depends on the flow field of the air. The
computational fluid dynamics (CFD) is an excellent tool to provide the detailed information
about the temperature and flow field in data centres. The main component of the air cooled
data centre is air conditioner unit and server racks. The server rack dissipate heat and needed
to be cooled in order to make sure that electronics operate under recommended temperature ,
otherwise overheat causes malfunction or shut down to prevent hardware damage. The
requirement of data centres to work twenty-four hours a day, seven days a week, shows that
power consumption is more.
Study has shown that over past five years there has been significant growth of number of
servers and double the power usage and cooling capacity. The cold air is supposed to send
through the bottom of back side of the rack face and the hot air is flow out through the top of
front side of the rack face. This shows that the cold air entering the server room is heated, so
the density of the air get decreased and capable to flow in upward direction and flows out at
high velocity rate.
Its important to make sure that date centres are sufficiently cold and not to go over cooling
leads economical loss and high power consumption. Experience has shows that cooling
requirement will increase continuously in future. The commercial open source CFD software
such as SALOME for creating geometry and meshing, CODE SATURNE for providing
conditions and PARAVIEW for post-processing result.

5
3. Literature review
The cooling system in an air-cooled data center might be based on a raised-floor or a
hardfloor configuration. When a raised-floor configuration is used, the AIR
CONDITIONING units supply cold air into an under-floor space and the cold air enters the
room through
tiles in the floor. The perforated tiles are removable and can be replaced by solid tiles
which makes the configuration flexible. Strategies for the design in data centers are often
based on hot/cold-aisles where the server racks are placed into a series of rows. Coldaisles
are formed between the front sides of two rows of server racks and hot-aisles are
formed on the other sides. This design strategy has become the standard when raised-floor
configurations are used. Perforated tiles are placed in the cold-aisles and solid tiles are
placed in the hot-aisles. An example of a cold-aisle with perforated tiles is illustrated in
Figure below The purpose of the design strategy is to prevent hot air exhausted by the back
of a server rack to enter the front of another server rack.
A comparison of raised-floor and hard-floor configurations in a data center has been
made. Room and ceiling return strategies were compared for both the cooling systems by
CFD modeling. A ceiling return strategy means that a ceiling void space is placed directly
above the hot-aisles. The purpose is to prevent the hot air from mixing with the cold air
before returning to the AIR CONDITIONING units. The room return strategy does not
isolate the hot air on its way back to the AIR CONDITIONING units, but it is still possible to
use panels to cover the coldaisles in order to minimise hot air recirculation. It was found that
a ceiling return strategy for the return of hot air to the AIR CONDITIONING units was
preferable for both raised-floor and hardfloor configurations. The raised-floor configuration
performed better than the hard-floor configuration when the same return strategy was used
for both the cooling systems. Cold-aisle
Figure 3.1: A cold-aisle with perforated tiles between two rows of server racks. The flow through the server racks is driven by internal fans with a constant volumetric

6
flow rate. The flow rate supplied by the AIR CONDITIONING units should be at least equal
to the flow rate demanded by the server racks. If the cold air available to the server racks is
insufficient,
warm air will enter through the front of the server racks instead. When a raised-floor
configuration is used and the cold air is supplied through perforated tiles, it is usually the
top of the server racks that might not be sufficiently cooled. When a hot/cold-aisle
configuration is used, hot air might be recirculated over the server racks or around them at
the end of each row. This is what is called hot air recirculation and should be avoided if
possible. The heat load can vary significantly across the server racks in a data center.
Therefore, just meeting the total flow rate requirement is not enough. Attention must also
be paid to the distribution of the cold air in order to make sure that all server racks are
sufficiently cooled. Recommended and maximum allowable air temperatures at the front
of the server racks are specified by ASHRAE’s thermal guidelines. These potential error
sources have been further investigated to various extent. It has been further investigated if the
simplified representation of the server racks in the CFD.
Model is likely to cause the deviations from measurements. The most simple approach is
to model a server rack as a "black box" in which the flow inside is not resolved. The flow
enters the front of the server rack and then reappears at the back of the server rack with the
appropriate increase of temperature included. This server rack model has been compared to
more detailed models in order to investigate the extent to which the temperature and flow
field in a data center is affected by the server rack model. It was found that there are no
significant differences in the results obtained by the different server rack models.
The pronounced hot and cold spots were still present. It indicates that the simplified
representation of the server racks in the CFD model is not likely to cause the deviations
from measurements.
The k epsilon model is well established as a suitable turbulence model to use in CFD
modeling of data centers. Inadequacy of the turbulence model has not been much
furter investigated. A potential error source that has been further investigated and might
have contributed to the hot and cold spots predicted by the CFD model is neglecting
buoyancy. It has been showed that buoyancy often should be included in the CFD model
and how the importance of including buoyancy can be evaluated. Most of the CFD
modeling of data centers has been made on relatively coarse meshes. The effect of mesh
size on CFD modeling of data centers has been investigated with respect to solution time
and relative accuracy. Hexahedral meshes were used and the distribution of the cells was
made as uniform as possible for each cell size. It was found that accuracy improved
significantly as the average cell size was reduced from 21 inches to about six inches. The
results were not mesh independent even for a mesh with cell size as small as one inch,
but only marginal improvements were found on accuracy when the cell size was reduced
from six inches to smaller cell sizes. However, the solution time increased a lot more than
the relative accuracy.

7
4. Problem Description
This project shows the simulation of server room with the cooling fan of server rack. The
simulation was set up by the analysis type of steady state, natural convection flow. Two
different simulation setup has been done: one is a laminar flow, rough estimation and another
one is the k-epsilon RANS turbulent model and also different boundary conditions for the
wall are applied: one is assuming wall as adiabatic and another is fixed temperature to it.
Also mesh independent study is done by increasing the mesh size from fine to coarse until the
result differs.
4.1. Governing Equations
There are three equation used for flow analysis they are:
1. Continuity and momentum equation for pressure and velocity
calculation.
2. Energy equation for temperature calculation.
In fluid mechanics the governing equations are conservation law of mass, momentum and
energy this equation can be in differential or integral by applying the conservation equation to
a point or extended region of the fluid. The fluid is consider to be continuum and all other
fluid properties considered to be function of space and time.
Mass of the fluid gives the continuity equation for the compressible fluid
𝝏𝝆
𝝏𝒕+
𝝏𝝆𝒖
𝝏𝒙+
𝝏𝝆𝒗
𝝏𝒚+
𝝏𝝆𝒘
𝝏𝒛 = o
The term represent the rate of change of mass and second term is rate of flow of mass out of
the volume.
The body surface and body force acting on the fluid gives the rate of change of momentum is
equal to the sum of forces which gives the momentum equation
The terms on the left side represent the rate of change of momentum and net flow of
momentum over the volume. The term right side of the equation represent the surface stress
and rate of change of momentum due to source. Both the pressure, normal stress, viscous
stress are included in the above equation that represent the surface stress.

8
For the turbulence modelling, the Reynolds number is the measure of inertia force and
viscous force. It is expressed as
Re= ρUL/µ
The governing equation for the steady mean flow is called as Reynolds Averaged Navier
Stokes (RANS). The RANS equation is
The Reynolds equation includes additional stress term called Reynolds stress.
ENERGY EQUATION
The fact that the rate of change of energy is equal to the sum of the rate of heat
addition to and the work done on the fluid gives the energy equation
The terms on the left hand side represent the rate of change of energy and the net rate of
flow of energy out of the volume, respectively. The terms on the first two rows on the
right hand side represent the total rate of work done by surface stresses. The last two
terms represent the rate of heat addition due to heat conduction across the boundaries of
the volume and the rate of change of energy due to source

9
5. Methodology
5.1 Geometry and mesh
The main component of the original setup in basic server room are one air-conditioning unit
and six server racks which are arranged in 3 parallel rows of two rack each, facing the same
direction and flow through them is positive x-direction. It’s assumed that the air-conditioning
unit and all server rack are rectangular shape. All other components in server room like
cables, wires are neglected and it also assumed that there is no space between the server rack
and the ground floor. Boundary conditions are applied to the sides of the wall were flow goes
out from and into the air-conditioning and the server racks. This sides represent the boundary
conditions for the computational domain.
Figure 5.1 geometry for the basic setup of server racks in server room
The mesh is generated in the CFD using the SALOME software. A Netgen 3D mesh is used
for the geometry simplicity. The computational domain box are divided into small
rectangular cells. The maximum cell size is set to generate mesh in different size in order to
do a mesh convergence study. The mesh with maximum and minimum size used is 0.1m for
fine meshing and increase in mesh size for the coarse one. During post processing the
unsteady effects seems to be present and captured by refining the mesh size.
figure 5.1.2 Netgen 3D mesh

10
5.2 Boundary conditions
The wall, ceiling and flooring are assumed to be adiabatic. The air-conditioning unit supply
air at the velocity of 0.25m/s and temperature of 293.15K. the mass flow rate is kept constant
between the inlet and outlet of the server room.
Figure 5.2 shows the inlet boundary condition
Figure 5.2.1 shows the outlet boundary condition
A Typical sever room generates about 50-60◦c of heat. So its assumed to generate 55◦c.The
internal fan in the server rack draw air through the front at a velocity of 0.5m/s. each server
rack generates the heat of 328K. The heat loss results in temperature difference between front
and back side of the server rack. The temperature difference is calculated by using the
equation,
∆𝑻 =𝑸
𝒎𝑪𝒑̇
In the original set up of server room, The hot air exhausted at the back of the server room
enters the front face of the another server rack. The mass flow rate will not be same for all
server racks but it should be kept constant from inlet to the outlet of all server room

11
Figure 5.2.2 shows the inlet boundary condition of the server rack
Similarly the boundary condition of wall is assumed to be adiabatic and in other the fixed
temperature is assumed.
Figure 5.2.3 shows the wall boundary condition
5.3. Setups
By placing the current cooling system and current placement of server racks in server room is
simulated. It is assumed that all server racks produce full heat load. The temperature
conditions is applied equally to all server racks. The temperature of the inlet cold air from the
air conditioning unit is assumed. The velocity of inlet air from the air conditioning unit is
assumed and also for the server rack inlet velocity
Its assumed that the inlet cold air flow from air conditioning unit flows from the side bottom
of the server room, so that after carrying the heat from server rack the air molecules reduce its
density and flow in upward direction through the outlet without the help of exhaust fan. The
mesh convergence study is also made on original set up.

12
6. Numerical Analysis
6.1 Pre-processing
6.1.1. 2D Geometry model of server rack
. Figure 6.1.1. 2D Geometry model of server rack (front view)
Figure 6.1.1. 2D Geometry model (side view)
13
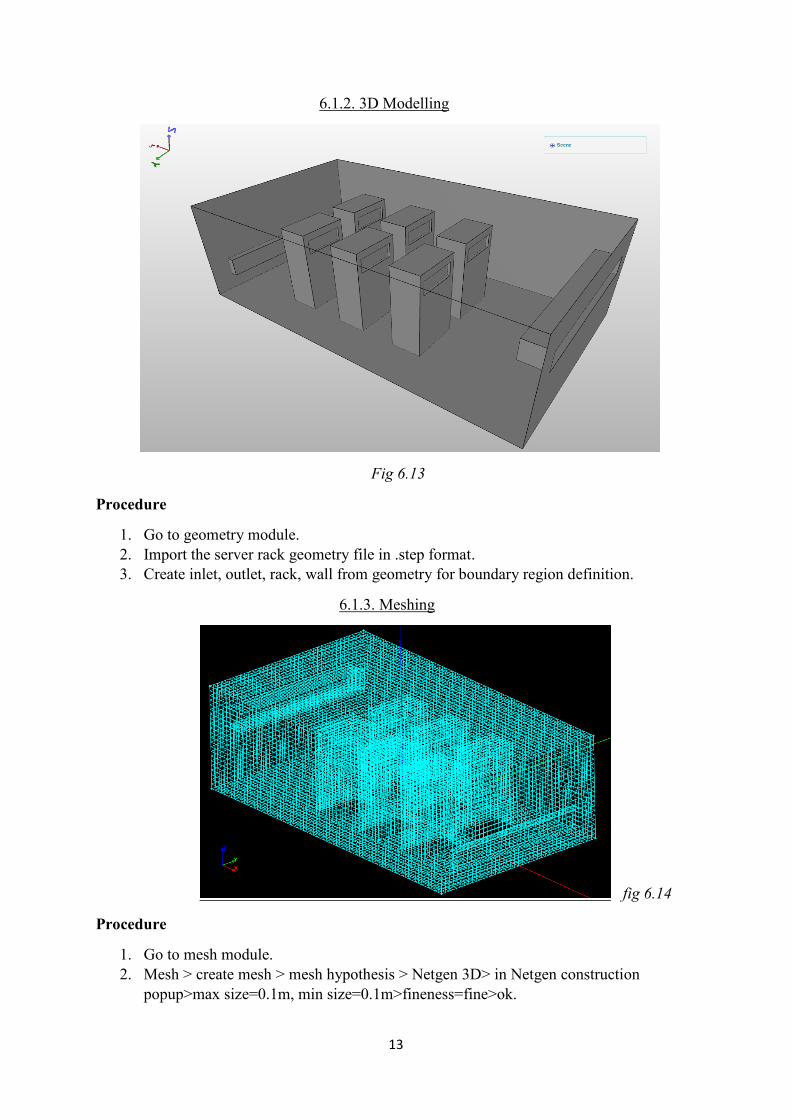
6.1.2. 3D Modelling
Fig 6.13
Procedure
1. Go to geometry module.
2. Import the server rack geometry file in .step format.
3. Create inlet, outlet, rack, wall from geometry for boundary region definition.
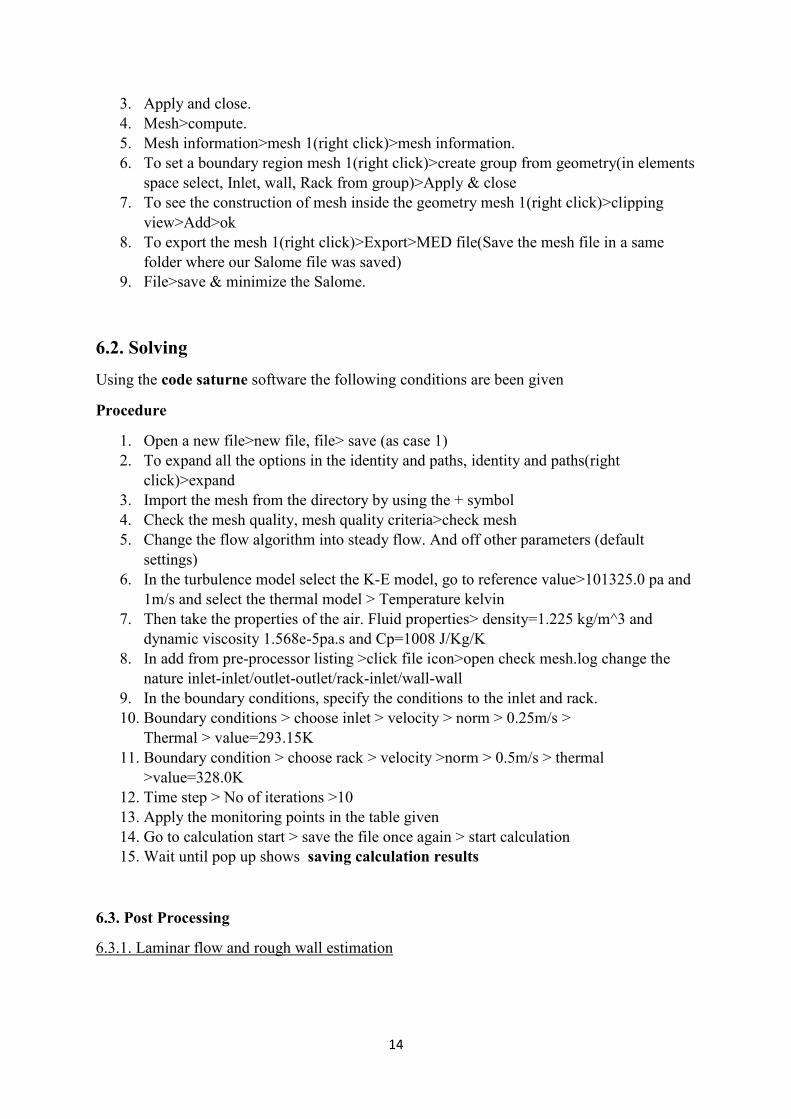
6.1.3. Meshing
fig 6.14
Procedure
1. Go to mesh module.
2. Mesh > create mesh > mesh hypothesis > Netgen 3D> in Netgen construction
popup>max size=0.1m, min size=0.1m>fineness=fine>ok.
14
3. Apply and close.
4. Mesh>compute.
5. Mesh information>mesh 1(right click)>mesh information.
6. To set a boundary region mesh 1(right click)>create group from geometry(in elements
space select, Inlet, wall, Rack from group)>Apply & close
7. To see the construction of mesh inside the geometry mesh 1(right click)>clipping
view>Add>ok
8. To export the mesh 1(right click)>Export>MED file(Save the mesh file in a same
folder where our Salome file was saved)
9. File>save & minimize the Salome.
6.2. Solving
Using the code saturne software the following conditions are been given
Procedure
1. Open a new file>new file, file> save (as case 1)
2. To expand all the options in the identity and paths, identity and paths(right
click)>expand
3. Import the mesh from the directory by using the + symbol
4. Check the mesh quality, mesh quality criteria>check mesh
5. Change the flow algorithm into steady flow. And off other parameters (default
settings)
6. In the turbulence model select the K-E model, go to reference value>101325.0 pa and
1m/s and select the thermal model > Temperature kelvin
7. Then take the properties of the air. Fluid properties> density=1.225 kg/m^3 and
dynamic viscosity 1.568e-5pa.s and Cp=1008 J/Kg/K
8. In add from pre-processor listing >click file icon>open check mesh.log change the
nature inlet-inlet/outlet-outlet/rack-inlet/wall-wall
9. In the boundary conditions, specify the conditions to the inlet and rack.
10. Boundary conditions > choose inlet > velocity > norm > 0.25m/s >
Thermal > value=293.15K
11. Boundary condition > choose rack > velocity >norm > 0.5m/s > thermal
>value=328.0K
12. Time step > No of iterations >10
13. Apply the monitoring points in the table given
14. Go to calculation start > save the file once again > start calculation
15. Wait until pop up shows saving calculation results
6.3. Post Processing
6.3.1. Laminar flow and rough wall estimation

15
Fig 6.3.1 the Stream lines of the temperature flow
In this with the parallel row, the flow direction through the server racks in the negative X
direction. It can be seen that all the air flow is from the back bottom air-conditioning unit of
the server room. Due to the presence of fan system in the face of the server rack, the cold air
from the air-conditioning unit get absorbed or flow through the server rack by means of
forced convection.
It clearly shows that the cool air enters through the last two servers, carries the heat which
enters the next two server and this continuous on to next. Therefore there must decrease in
the effectiveness of heat transfer while comparing the first two and last two servers. Then due
to the decrease in the density of air inside server room near the farther end of the flow
domain. The hot air will exit through the top outlet.
Fig 6.3.2 Stream lines of the temperature flow

16
Fig 6.3.3 stream lines velocity flow in laminar model
VELOCITY
As seen from the figure it is that the velocity of the cold air is maximum at the
exit as they rush toward the room exit, absorbing the heat from the server components. As the
density variation occurs nearly throughout the room the exit area is litrelly filled with hot and
less dense air. This can seen from 6.3.3
Fig 6.3.4 Velocity and pressure approximation for laminar model

17
6.3.2. K-epsilon RANS turbulence model:
It is the most commonly used turbulence model ,it determines the energy
and the dissipation factor of the energy, in a partial differential equation form.
APPLICATION :
Here we have used the k epsilon model to determine the entire energy model of the server in
this models cooling scenario and the derived results have been shown in a colour coded.
Temperature variation in K-epsilon RANS turbulence model:
RESULTS:
The obtained results suggests that the temperature from the server exhaust areas are higher
than the onrushing cold air and this causes the heat transfer near the server exhausts by forced
convection and also the fixed temperature walls of the server to undergo heat transfer ,which
results in the heat lost to the oncoming cold air and the server cools down efficiently.

18
Velocity variations in K-epsilon RANS turbulence model:
RESULTS:
As seen from the figure it clear that the velocity of the cool air is maximum at the exit as
they rush toward the exit room , because of the energy approximation a clearer picture of the
entire heat transfer has been presented .This is due to the density differences of the already
turbulent inlet cold air which greatly accelerates the onrushing air as a result the velocity gets
increased . This is evident when comparing velocity results of the previous laminar flow
(6.3.3).

19
APPROXIMATIONS:
According to the given conditions the variables are manipulated using the processor and the
results over the calculation period is represented in the two graphs above.
6.4 MESH CONVERGENCE STUDY
fig 6.4.1. fine mesh with more iteration value fig 6.4.2 normal mesh with less iteration value
20
In the above figure it is shown that by increasing iteration value for the finest mesh size to
obtain convergence and by giving normal mesh size with less number of iteration will
difficult to obtain convergence. Therefore it shows that for a constant mesh size the
convergence depends upon the number of iterations.
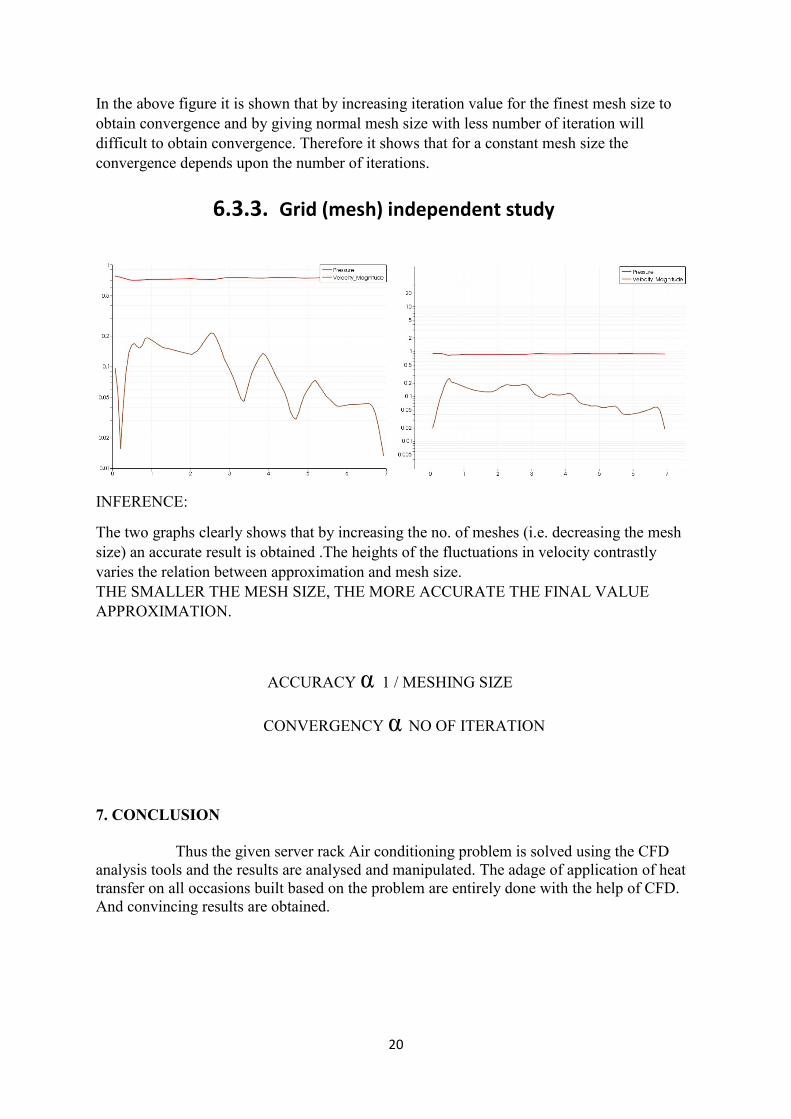
6.3.3. Grid (mesh) independent study
INFERENCE:
The two graphs clearly shows that by increasing the no. of meshes (i.e. decreasing the mesh
size) an accurate result is obtained .The heights of the fluctuations in velocity contrastly
varies the relation between approximation and mesh size.
THE SMALLER THE MESH SIZE, THE MORE ACCURATE THE FINAL VALUE
APPROXIMATION.
ACCURACY α 1 / MESHING SIZE
CONVERGENCY α NO OF ITERATION
7. CONCLUSION
Thus the given server rack Air conditioning problem is solved using the CFD
analysis tools and the results are analysed and manipulated. The adage of application of heat
transfer on all occasions built based on the problem are entirely done with the help of CFD.
And convincing results are obtained.

21
REFERNCES:
1. Patankar SV. Airflow and Cooling in a Data Centre. Journal of Heat Transfer.
2010;132(7):073001-01-073001-17.
2. Srinarayana N, Fakhim B, Behnia M, Armfield SW. A Comparative Study of Raised- Floor and Hard-Floor Configurations in an Air-Cooled Data Centre. Proceedings of the 13th IEEE ITHERM Conference; 2012 May 30- Jun 1; San Diego, USA.

22