APPENDIX 4E (Rule 4.3A) PRELIMINARY FINAL REPORT for the ...

SERVCORP LIMITED ABN 97 089 222 506
APPENDIX 4E
Preliminary Final Report
for the financial year ended 30 June 2010
The information in this document should be read in conjunction with the 2010 Financial Report and any public announcements made during the period in accordance with continuous disclosure obligations arising under Corporations
Act 2001 and ASX Listing Rules.

Servcorp Limited ABN 97 089 222 506
Financial Report 30 June 2010
Financial Report Page 1
Results for announcement to the market $A'000
Revenue and other income from ordinary activities
down 26% to 168,837
Profit from ordinary activities after tax attributable to members
down 94% to 2,006
Net profit for the period attributable to members down 94% to 2,006
Dividends Total amount
$’000
Amount per security
Franked amount per security
Current period
Final dividend declared
Interim dividend paid
4,922
4,922
5.00c
5.00c
5.00c
5.00c
Previous corresponding period
Final dividend paid
Interim dividend paid
Special dividend paid
7,847
8,047
4,023
10.00c
10.00c
5.00c
10.00c
10.00c
5.00c
Record date for determining entitlements to the dividend
20 September 2010
30 June 2010
$
30 June 2009
$ Net tangible asset backing
Net tangible asset backing per ordinary security $2.01 $1.65 Control over entities Control was not gained or lost over any entity during the financial year ended 30 June 2010 that had a material effect on the profit for the period. Material interest in entities There were no material interests in entities that were not controlled entities. Details of associates and Joint Venture entities There are no associates or joint venture entities.

Servcorp Limited ABN 97 089 222 506
Financial Report 30 June 2010
Financial Report Page 2
Management Discussion & Analysis
SERVCORP REPORTS MATURE FLOOR NPBT IN LINE WITH GUIDANCE
GLOBAL EXPANSION PROGRESSING WELL
Mature floor NPBT of $25,127,000 for FY 2010 NPBT of $2,875,000 for FY 2010 Virtual Office package growth of 20% for FY 2010 Virtual Office revenue growth of 9% in constant currency for FY 2010 Cash Balance (unencumbered) of $121,030,000 at 30 June 2010 Final dividend of 5.00 cents per share declared, fully franked Mature floor NPBT forecast of $30,000,000 for FY 2011 Immature floor loss forecast of $15,000,000 for FY 2011 Forecast dividend of 10.00 cents per share for FY 2011
Servcorp recorded a NPBT attributable to mature floors for the twelve months ended 30 June 2010 (FY 2010) of $25,127,000 (FY 2009: $54,360,000). Immature floor expansion costs for FY 2010 were $20,103,000 (FY 2009: $2,942,000). The loss for Office Squared for FY 2010 was $2,149,000 (FY 2009: $4,143,000). Consolidated group NPBT was $2,875,000 for FY 2010 (FY 2009: $47,275,000). Consolidated group NPAT decreased to $2,006,000 for FY 2010 (FY 2009: $34,097,000).
OPERATING SUMMARY The Business As previously advised, trading conditions in the Serviced Office business were very difficult in FY 2010. Depressed global business sentiment, particularly in the commercial real estate market, caused a drop in demand for Serviced Offices globally which impacted office pricing and occupancy of the mature Serviced Office business. This environment has created an opportunity for Servcorp to expand. Consolidated Serviced Office revenue was impacted by a strong AUD throughout FY 2010 recording a drop of 32% compared to FY 2009. When the effect of changes in foreign currency translation is stripped out, revenue dropped by 26% compared to FY 2009. Average mature floor occupancy for FY 2010 softened to 76% (FY 2009: 79%). Thirteen floors were opened during FY 2010. All were immature at 30 June 2010 and these were as follows:
1. Level 1, Lyra Building Hangzhou Opened July, 2009 2. Level 4, Al Mamoura Building, Abu Dhabi Opened September, 2009 3. Level 9, Jameel Square, Jeddah Opened December, 2009 4. Level 20, Marunouchi Tower Trust, Tokyo Opened December, 2009 5. Level 15, Da Vinci Building, Fukuoka Opened December, 2009 6. Level 17, Dashwood House, London Opened December, 2009 7. Level 19, 2 IFC, Hong Kong Opened January, 2010 8. Level 18, Sahab Tower, Kuwait Opened February, 2010 9. Level 42, 155 North Wacker, Chicago Opened March, 2010 10. Level 8, Nittochi Nishi-Shinjuku Building, Tokyo Opened March 2010 11. Level 12, 1 Peking Road, Hong Kong Opened April, 2010 12. Level 49, 300 LaSalle, Chicago Opened May 2010 13. Level 9, HK Club Building, Hong Kong Opened May 2010
The performance of all immature floors are tracking to expectations. As at 30 June 2010 Servcorp operated 77 floors in 29 cities in 17 countries.

Servcorp Limited ABN 97 089 222 506
Financial Report 30 June 2010
Financial Report Page 3
Management Discussion & Analysis (continued)
Virtual Office Virtual Office package memberships increased by 20% during FY 2010. Virtual Office revenue decreased by 1% YOY for FY 2010. However when the translation effect of changes in currency is stripped out, Virtual Office revenue increased by 9% YOY for FY 2010.
Expansion Thirteen floors were opened during FY 2010. At 30 June 2010 a further 31 leases had been executed for locations that are expected to open in the next six to nine months. Servcorp is on track to reach its floor opening target of 35 new locations in the eighteen months to 31 December 2010. As outlined at Servcorp’s Annual General Meeting in November 2009, we are focused on rapidly expanding the Servcorp footprint into a number of new markets, in particular in North America. We are happy with the progress of new centre rollouts and early indications are that sales are adhering to the business model projections. Our focus is to build scale in each geographic location to spread marketing and web optimisation costs. Immature floor expansion costs were $20.10M for FY 2010 (FY 2009: $2.94M). Included in the FY 2010 immature floor costs are Head Office costs associated with expansion in the amount of $8.57M (FY 2009: Nil).
Office Squared The Office Squared business has been significantly scaled back. Management is now focusing on our core business of Serviced and Virtual Offices. The Office Squared loss for FY 2010 was $2.15M (FY 2009: $4.14M). Operating Summary By Region Australia & New Zealand Mature floors Despite global economic market turmoil, Australia and New Zealand have performed well throughout FY 2010 and have not been impacted to the same extent as other markets. Mature floor revenue from ordinary activities decreased by 6% YOY to $45.47M during FY 2010. Mature floor NPBT decreased by 21% YOY to $10.77M for FY 2010. The closure cost associated with closing one floor in Australia had the effect of reducing the mature floor result by $0.63M. An additional three floors are scheduled to open in Australia and New Zealand in H1 FY 2011. Immature floors Two floors in Australia and New Zealand were immature during FY 2010. Immature floor losses were $0.63M.

Servcorp Limited ABN 97 089 222 506
Financial Report 30 June 2010
Financial Report Page 4
Management Discussion & Analysis (continued)
Japan Mature floors Japanese business sentiment continues to be depressed and as a result the commercial market and lease rates are now at cyclical lows. There is an opportunity to expand in this market and Servcorp has secured space in three new locations that will open in H1 FY 2011. Revenue from mature locations decreased by 24% YOY to $55.14M during FY 2010. NPBT decreased by 45% YOY to $5.34M for FY 2010.
Immature floors Four locations in Japan were immature during the period. The Net Loss Before Tax on immature floors was $2.17M for FY 2010. Middle East Mature floors The Dubai market which was in boom has suffered a material downturn with vacancy rates in this city now at ten year highs. Servcorp still operates a profitable business in this city, but nowhere near the profits of boom time. The Serviced Office markets in both Bahrain and Qatar remain challenging. Mature floor revenue from ordinary activities decreased by 37% YOY to $10.99M for FY 2010 when compared to FY 2009. Mature floor NPBT decreased by 65% YOY to $3.29M for FY 2010. Immature floors Locations were opened in Abu Dhabi, Jeddah and Kuwait during FY 2010 and the performance of these floors is encouraging. Six floors in the Middle East were immature during FY 2010 with losses for FY 2010 of $3.72M. Since the end of the financial year we have opened new locations in Beirut and Istanbul. A further location is expected to open in H1 2011 in Saudi Arabia. Greater China Mature floors During FY 2010, we experienced management problems in this region. Management has now been restructured in China and the region is on track to recovery. The Hong Kong market was significantly impacted by the global financial crisis but this market is now improving and we should return to profitability in FY 2011. Revenue from ordinary activities decreased by 54% YOY to $13.19M in FY 2010 and Net Loss Before Tax was $0.40M for FY 2010. Immature floors Four floors in Greater China were immature as at 30 June 2010 with a Net Loss Before Tax of $2.02M for FY 2010. Southeast Asia Mature floors During calendar year 2009 the Singapore and Kuala Lumpur markets saw dramatic falls in commercial property values and commercial leasing rates. A recovery in Singapore is now evident. Kuala Lumpur however remains challenging. The Bangkok market has suffered as a result of the civil upheaval in April and May 2010 but it has now stabilised.
Revenue from ordinary activities decreased by 39% YOY to $14.58M in FY 2010 and NPBT decreased by 52% YOY to $4.27M for FY 2010.
Immature floors There were no immature floors in Southeast Asia during this period.

Servcorp Limited ABN 97 089 222 506
Financial Report 30 June 2010
Financial Report Page 5
Management Discussion & Analysis (continued)
Europe Mature floors The European market continues to be very difficult. The Paris location continues to be impacted by pricing pressures as a result of heightened competition. The Brussels operation has now stabilised. Mature floor revenue from ordinary activities decreased by 33% YOY to $12.76M for FY 2010. The Net Loss Before Tax on mature floors was $3.29M for FY 2010. The loss before tax includes impairment of goodwill for the Paris operation of $1.16M. Immature floors A new location was opened in London during December 2009. This location is performing to expectations. Immature floor losses for Europe were $0.99M for FY 2010. USA Two floors were opened in Chicago in the USA during H2 FY 2010. An additional 19 leases have been executed in this market and these floors are expected to open during H1 FY 2011. Immature floors Immature floor losses of $2.05M for FY 2010 include the set-up of the USA Head Office infrastructure and the cost of sourcing and executing leases for new locations. India Franchise The India property market collapsed in calendar year 2009 but is now starting to improve. FINANCIAL SUMMARY Translation of foreign currency results to Australian Dollars Revenue from ordinary activities was down 26% YOY to $168.84M for FY 2010. During FY 2010 the AUD appreciated strongly against all major currencies. The AUD increased by an average of 17% against the USD, 17% against the EUR and 8% against the JPY. The appreciation in the AUD over the period has had a negative impact on the AUD consolidated revenues and profit for FY 2010. When expressed in constant currency terms, revenue decreased by 19% YOY for FY 2010. NPBT for FY 2010 was $2.88M, down 94% compared to FY 2009. When expressed in constant currency terms, NPBT decreased by 97% in FY 2010 compared to FY 2009. On a positive note the strong AUD has enabled management to change AUD to foreign currency at rates more favourable than budget estimates for the purpose of purchasing capex. In addition, initial trading losses from new locations are translated favourably on consolidation. The results for FY 2010 include realised and unrealised foreign currency gains in the amount of $0.49M (FY 2009 gain: $3.87M).

Servcorp Limited ABN 97 089 222 506
Financial Report 30 June 2010
Financial Report Page 6
Management Discussion & Analysis (continued)
Cash Balance Cash balances were $131.95M at 30 June 2010 (30 June 2009: $83.96M). Of this balance, $10.92M has been pledged with banks as collateral for bank guarantees, leaving an unencumbered cash balance of $121.03M in the business as at 30 June 2010 (30 June 2009: $71.49M).
DIVIDEND The directors of Servcorp Limited have declared a fully franked final dividend of 5.00 cents per share bringing the total dividend to 10.00 cents per share in relation to the 2010 financial year. It is anticipated that dividends will be 10.00 cents per share in relation to the 2011 financial year. OUTLOOK FY 2011 will be a major construction period for the company. It is anticipated that FY 2012 will be a year of consolidation. We reaffirm our intention to open no less than 35 new floors in the eighteen months to 31 December 2010 and to have 100 new floors open in the thirty-six months to 30 June 2013. Our initial guidance to have 29,000 Virtual Packages by 31 December 2010 was contingent on having at least ten floors open in the USA by 30 June 2010. We now anticipate that we are several months behind this target. We expect global trading conditions to remain difficult in FY 2011 but are optimistic about the new business model. We forecast mature floor NPBT for FY 2011 of approximately $30 million, $13 million for H1 FY 2011 and $17 million for H2 FY 2011. This forecast assumes currencies remain constant and global financial markets remain stable. Until they reach maturity, new floor openings will continue to have a material negative impact on group NPBT. Forecast immature floor losses will be approximately $15 million for FY 2011, significantly skewed towards the first half of FY 2011.
Key: FY 2009 Year ended 30 June 2009 FY 2010 Year ended 30 June 2010 FY 2011 Year ended 30 June 2011 YOY Year on Year NPBT Net Profit Before Tax NPAT Net Profit After Tax H1 First Half of Financial Year H2 Second Half of Financial Year

Servcorp Annual Report 2010
Servcorp Annual Report 2010
Contents
Corporate governance 2
Directors’ report 12
Financial report 29

Corporate Governance
2
Corporate governance
The Board has responsibility for the long-term health and
prosperity of Servcorp. The directors are responsible to the
shareholders for the performance of the Company and the
Consolidated Entity and to ensure that it is properly managed.
The Board is committed to the principles underpinning the ASX
Corporate Governance Council’s Corporate Governance Principles
and Recommendations (2nd edition) which became effective after
1 January 2008. The Board is continually working to improve
the Company’s governance policies and practices, where such
practices will bring benefi ts or effi ciencies to the Company. This
will include a review of the amended guidelines which will become
effective after 1 January 2011.
Details of Servcorp’s compliance are set out below, and in the
ASX principles compliance statement on pages 6 to 11 of this
annual report.
Role of the Board
The Board has adopted a formal statement of matters reserved
for the Board. The central role of the Board is to set the
Company’s strategic direction and to oversee the Company’s
management and business activities.
Responsibility for management of the Company’s business
activities is delegated to the CEO and management.
The Board’s primary responsibilities are:
the protection and enhancement of long-term shareholder ▪
value;
ensuring Servcorp has appropriate corporate governance ▪
structures in place;
providing strategic direction, including reviewing and ▪
determining goals for management;
monitoring management’s performance within that ▪
framework;
appointing the Chief Executive Offi cer and evaluating his ▪
performance and remuneration;
monitoring business performance and results; ▪
identifying areas of signifi cant risk and ensuring adequate ▪
controls are in place to manage those risks;
establishing appropriate standards of ethical behaviour and a ▪
culture of corporate and social responsibility;
approving executive remuneration policies; ▪
ratifying the appointment of the Chief Financial Offi cer and ▪
the Company Secretary;
ensuring compliance with continuous disclosure policy in ▪
accordance with the Corporations Act 2001 and the Listing
Rules of the Australian Securities Exchange;
reporting to shareholders; ▪
approval of the commitment to new locations; ▪
ensuring the Board is, and remains, appropriately skilled to ▪
meet the changing needs of the Company.
Composition of the Board
The size and composition of the Board is determined by the
Board, subject to the limits set out in Servcorp’s Constitution
which requires a minimum of three directors and a maximum of
twelve directors.
The Board comprises fi ve directors (two executive and three non-
executive). The non-executive directors are all independent.
There has been no change to the Board since the last annual
report.
The Chairman of the Board, Mr Bruce Corlett, is an independent
non-executive director.
The non-executive directors bring to the Board an appropriate
range of skills, experience and expertise to ensure that Servcorp
is run in the best interest of all stakeholders. The skills,
experience and expertise of each director in offi ce at the date of
this annual report is set out on pages 12 and 13 of this annual
report. The Board will continue to be made up of a majority of
independent non-executive directors. The performance of non-
executive directors was reviewed during the year.
The names of the directors of the Company in offi ce at the date of
this annual report are set out in the following table.
3
Servcorp Annual Report 2010
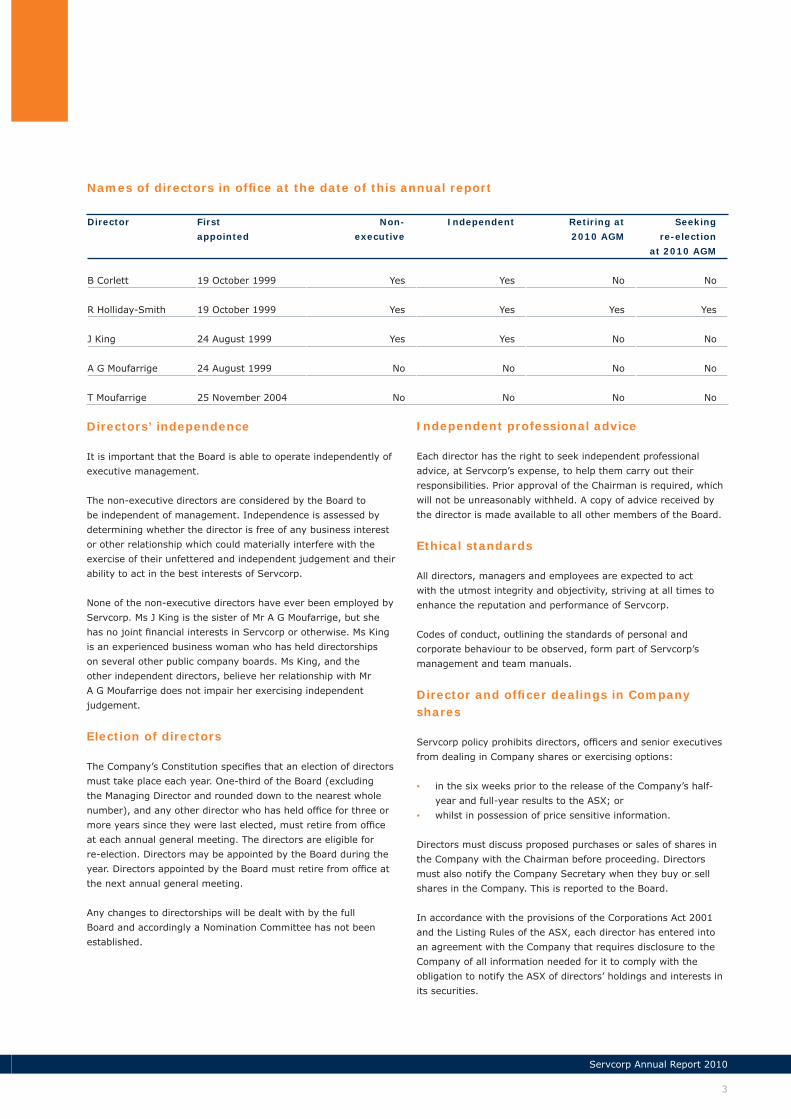
Names of directors in offi ce at the date of this annual report
Director First
appointed
Non-
executive
Independent Retiring at
2010 AGM
Seeking
re-election
at 2010 AGM
B Corlett 19 October 1999 Yes Yes No No
R Holliday-Smith 19 October 1999 Yes Yes Yes Yes
J King 24 August 1999 Yes Yes No No
A G Moufarrige 24 August 1999 No No No No
T Moufarrige 25 November 2004 No No No No
Directors’ independence
It is important that the Board is able to operate independently of
executive management.
The non-executive directors are considered by the Board to
be independent of management. Independence is assessed by
determining whether the director is free of any business interest
or other relationship which could materially interfere with the
exercise of their unfettered and independent judgement and their
ability to act in the best interests of Servcorp.
None of the non-executive directors have ever been employed by
Servcorp. Ms J King is the sister of Mr A G Moufarrige, but she
has no joint fi nancial interests in Servcorp or otherwise. Ms King
is an experienced business woman who has held directorships
on several other public company boards. Ms King, and the
other independent directors, believe her relationship with Mr
A G Moufarrige does not impair her exercising independent
judgement.
Election of directors
The Company’s Constitution specifi es that an election of directors
must take place each year. One-third of the Board (excluding
the Managing Director and rounded down to the nearest whole
number), and any other director who has held offi ce for three or
more years since they were last elected, must retire from offi ce
at each annual general meeting. The directors are eligible for
re-election. Directors may be appointed by the Board during the
year. Directors appointed by the Board must retire from offi ce at
the next annual general meeting.
Any changes to directorships will be dealt with by the full
Board and accordingly a Nomination Committee has not been
established.
Independent professional advice
Each director has the right to seek independent professional
advice, at Servcorp’s expense, to help them carry out their
responsibilities. Prior approval of the Chairman is required, which
will not be unreasonably withheld. A copy of advice received by
the director is made available to all other members of the Board.
Ethical standards
All directors, managers and employees are expected to act
with the utmost integrity and objectivity, striving at all times to
enhance the reputation and performance of Servcorp.
Codes of conduct, outlining the standards of personal and
corporate behaviour to be observed, form part of Servcorp’s
management and team manuals.
Director and offi cer dealings in Company shares
Servcorp policy prohibits directors, offi cers and senior executives
from dealing in Company shares or exercising options:
in the six weeks prior to the release of the Company’s half- ▪
year and full-year results to the ASX; or
whilst in possession of price sensitive information. ▪
Directors must discuss proposed purchases or sales of shares in
the Company with the Chairman before proceeding. Directors
must also notify the Company Secretary when they buy or sell
shares in the Company. This is reported to the Board.
In accordance with the provisions of the Corporations Act 2001
and the Listing Rules of the ASX, each director has entered into
an agreement with the Company that requires disclosure to the
Company of all information needed for it to comply with the
obligation to notify the ASX of directors’ holdings and interests in
its securities.

Corporate Governance
4
Confl ict of interest
In accordance with the Corporations Act 2001 and the Company’s
Constitution directors must keep the Board advised, on an
ongoing basis, of any interest that would potentially confl ict
with those of Servcorp. Where the Board believes that an actual
or potential signifi cant confl ict exists, the director concerned,
if appropriate, will not take part in any discussions or decision
making process on the matter and abstains from voting on
the item being considered. Details of director related entity
transactions with the Company and the Consolidated Entity are
set out in Note 26 to the fi nancial statements.
Continuous disclosure
Servcorp is committed to ensuring that all shareholders and
investors are provided with full and timely information and
that all stakeholders have equal and timely access to material
information concerning the company. Procedures are in place to
ensure that all price sensitive information is disclosed to the ASX
in accordance with the continuous disclosure requirements
of the Corporations Act 2001 and ASX Listing Rules.
The Company Secretary has been appointed as the person
responsible for communications with the ASX.
Auditor independence
The Company’s auditors Deloitte Touche Tohmatsu (Deloitte) were
appointed at the annual general meeting of the Company on 6
November 2003.
The Lead Partner at the time of Deloitte’s appointment, Mr
P Forrester, completed his fi ve year tenure upon signing the
fi nancial report for the year ended 30 June 2008. In accordance
with the mandatory requirements under the Corporations Law,
Mr Forrester rotated off the Servcorp audit engagement and was
replaced by Mr S Gustafson as Lead Partner. Mr S Gustafson will
be due for rotation following the completion of the audit for the
year ending 30 June 2013.
Deloitte have established policies and procedures designed
to ensure their independence, and provide the Audit and Risk
Committee with an annual confi rmation as to their independence.
Committees
The Board does not delegate major decisions to committees.
Committees are responsible for considering detailed issues
and making recommendations to the Board. The Board has
established two committees to assist in the implementation of its
corporate governance practices.
Audit and Risk Committee
The members of the Audit and Risk Committee during the year
were:
Mr R Holliday-Smith (Chair) ▪
Mr B Corlett ▪
Ms J King ▪
The members are all independent non-executive directors. The
chairman of the Audit and Risk Committee is independent and is
not the chairman of the Board.
The role of the Audit and Risk Committee is to assist the Board
to meet its oversight responsibilities in relation to the Company’s
fi nancial reporting, internal control structure, risk management
procedures and the external audit function. In doing so, it
is the committee’s responsibility to maintain free and open
communication between the committee and the external auditors
and the management of Servcorp.
The external auditors, the Chief Executive Offi cer, the Chief
Financial Offi cer and other senior management may attend
committee meetings by invitation.
The Audit and Risk Committee met three times during the
year. The committee meets with the external auditors without
management being present before signing off its reports each half
year. The committee Chairman also meets with the auditors at
regular intervals during the year.
5
Servcorp Annual Report 2010
The responsibilities of the Audit and Risk Committee as stated in
its charter include:
reviewing the fi nancial reports and other fi nancial information ▪
distributed externally;
improving the quality of the accounting function; ▪
reviewing external audit reports to ensure that where major ▪
defi ciencies or breakdown in controls or procedures have
been identifi ed appropriate and prompt remedial action is
taken by management;
reviewing the Company’s policies and procedures for ▪
compliance with Australian equivalents to International
Financial Reporting Standards;
reviewing the nomination, fees, independence and ▪
performance of the auditor;
liaising with the external auditors and ensuring that the ▪
statutory annual audit and half-yearly review are conducted
in an effective manner;
monitoring the internal control framework and compliance ▪
structures and considering enhancements;
monitoring the compliance with appropriate ethical standards; ▪
monitoring the procedures in place to ensure compliance with ▪
the Corporations Act 2001, ASX Listing Rules and all other
regulatory requirements;
addressing any matters outstanding with the auditors, ▪
taxation authorities, corporate regulators, Australian
Securities Exchange and fi nancial institutions;
reviewing reports on any major defalcations, frauds and ▪
thefts from the Company;
overseeing the risk management framework. ▪
Remuneration Committee
The Remuneration Committee members during the year were:
Ms J King (Chair, Non-Executive Director) ▪
Mr B Corlett (Non-Executive Director) ▪
Mr T Moufarrige (Executive Director) ▪
The role of the Remuneration Committee is to assist the Board by
adopting remuneration policy and practices that:
supports the Board’s overall strategy and objectives; ▪
attracts and retains key employees; ▪
links total remuneration to fi nancial performance and the ▪
attainment of strategic objectives.
Specifi cally this will include:
remuneration policy and its application to the Chief Executive ▪
Offi cer and those who report to the Chief Executive Offi cer;
adoption of short-term and long-term incentive plans; ▪
determination of levels of reward to the Chief Executive ▪
Offi cer and approval of rewards to those who report to the
Chief Executive Offi cer;
ensuring the total remuneration policy and practices are ▪
designed with full consideration of all tax, accounting, legal
and regulatory requirements.
The Remuneration Committee is committed to the principles of
accountability, transparency and to ensuring that remuneration
arrangements demonstrate a clear link between reward and
performance.
The Remuneration Committee met once during the year. The
Chief Executive Offi cer may attend committee meetings by
invitation to assist the committee in its deliberations.

Corporate Governance
6
Principle 1 Lay solid foundations for management and oversight
Establish and disclose the respective roles and responsibilities of board and management.
Recommendation 1.1 Establish the functions reserved to the board and those delegated to senior executives and
disclose those functions.
Servcorp Board Response The Board has adopted a charter that sets out the responsibilities reserved by the Board and
those delegated to the Managing Director and senior executives. Primary responsibilities are set
out on page 2. The Board charter is available on the Company’s website.
Recommendation 1.2 Disclose the process for evaluating the performance of senior executives.
Servcorp Board Response The process for evaluating the performance of senior executives is included in the remuneration
report on pages 20 to 26 of this annual report.
Recommendation 1.3 Provide the information indicated in the Guide to reporting on Principle 1.
Servcorp Board Response All relevant information is included in the corporate governance section on pages 2 to 11 of this
annual report.
Principle 2 Structure the board to add value
Have a board of an effective composition, size and commitment to adequately discharge its
responsibilities and duties.
Recommendation 2.1 A majority of the board should be independent directors.
Servcorp Board Response The Board has a majority of independent directors. All the currently serving non-executive
directors are independent.
Recommendation 2.2 The chair should be an independent director.
Servcorp Board Response The Chair is an independent director.
Recommendation 2.3 The roles of chair and chief executive offi cer should not be exercised by the same individual.
Servcorp Board Response The roles of Chair and Managing Director/CEO are separated.
Recommendation 2.4 The board should establish a nomination committee.
Servcorp Board Response The Board has not established a nomination committee. Given the size of the current Board,
effi ciencies are not forthcoming from a separate committee structure. Selection and appointment
of new directors is undertaken by consideration of the full Board.
A specifi c skills matrix has not been developed, however the current non-executive directors each
bring a mix of skills and experience to the Board. The Board would endeavour to retain this skills
mix if considering new appointments.
Any director appointed by the Board must retire from offi ce at the next annual general meeting
and seek re-election by shareholders.
This table provides a description of the manner in which Servcorp complies with the ASX Corporate Governance Principles and
Recommendations (2nd edition), or where applicable, an explanation of any departures from the Principles. Compliance has not been
measured against the amended guidelines which will be effective after 1 January 2011. The Board will undertake a transition to the
updated guidelines.
ASX principles compliance statement

7
Servcorp Annual Report 2010
Recommendation 2.5 Disclose the process for evaluating the performance of the board, its committees and individual
directors.
Servcorp Board Response The Board operates under a code of conduct which recognises that strong ethical values must be
at the heart of director and Board performance. The non-executive directors evaluate individual
director’s performance and also the Board’s performance. As a tool to evaluation, a questionnaire
is completed annually by the non-executive directors with the responses assessed and discussed
by the non-executive directors. There is good interaction between all directors and with senior
executives and it is considered that the non-executive directors have a solid understanding of the
culture and values of the Company.
Recommendation 2.6 Provide the information indicated in the Guide to reporting on Principle 2.
Servcorp Board Response All relevant information is included in the corporate governance section on pages 2 to 11 of this
annual report.
Principle 3 Promote ethical and responsible decision-making
Actively promote ethical and responsible decision-making.
Recommendation 3.1 Establish a code of conduct and disclose the code or a summary of the code as to:
the practices necessary to maintain confi dence in the company’s integrity; ▪
the practices necessary to take into account their legal obligations and the reasonable ▪
expectations of their stakeholders;
the responsibility and accountability of individuals for reporting and investigating reports of ▪
unethical practices.
Servcorp Board Response The Company has established codes of conduct and ethical standards which all directors,
executives and employees are expected to uphold and promote. They guide compliance with legal
requirements and ethical responsibilities, and also set a standard for employees and directors
dealing with Servcorp’s obligations to external stakeholders.
In regard to stakeholders, the Company:
reports its fi nancial performance twice a year to the Australian Securities Exchange; ▪
maintains a website; ▪
publishes external announcements to the website and maintains these announcements for at ▪
least two years;
at general meetings, shareholders are given a reasonable opportunity to ask questions; ▪
analyst briefi ngs are held following the release of the half-year and full-year fi nancial results. ▪
Recommendation 3.2 Establish a policy concerning trading in company securities by directors, senior executives and
employees, and disclose the policy or a summary of that policy.
Servcorp Board Response The Board has approved a policy concerning trading in company securities, the details of which are
disclosed in the corporate governance section on page 3 of this annual report.
Recommendation 3.3 Provide the information indicated in the Guide to reporting on Principle 3.
Servcorp Board Response The information is made publicly available by inclusion of the main provisions in the annual report.
Complete versions are not available on the Company’s website as they form part of manuals which
are proprietary and confi dential.
ASX principles compliance statement (continued)

Corporate Governance
8
Principle 4 Safeguard integrity in fi nancial reporting
Have a structure to independently verify and safeguard the integrity of the company’s fi nancial
reporting.
Recommendation 4.1 The board should establish an audit committee.
Servcorp Board Response The Board has established an Audit and Risk Committee.
Recommendation 4.2 The audit committee should be structured so that it:
consists only of non-executive directors; ▪
consists of a majority of independent directors; ▪
is chaired by an independent chair, who is not chair of the board; ▪
has at least three members. ▪
Servcorp Board Response All three members of the Audit and Risk Committee are independent non-executive directors, and
the Chair of the committee is not the Chair of the Board.
Recommendation 4.3 The audit committee should have a formal charter.
Servcorp Board Response The Audit and Risk Committee has a formal charter which sets out its specifi c roles and
responsibilities and composition requirements. The Audit and Risk Committee charter is available
on the Company’s website.
Recommendation 4.4 Provide the information indicated in the Guide to reporting on Principle 4.
the names and qualifi cations of those appointed to the audit committee, and their attendance ▪
at meetings of the committee;
the number of meetings of the audit committee. ▪
Servcorp Board Response This information is provided on pages 4, 12 and 13 of this annual report.
Recommendation 4.4
(continued)
procedures for the selection and appointment of the external auditor, and for the rotation of ▪
external audit engagement partners.
Servcorp Board Response The external auditor, Deloitte Touche Tohmatsu (Deloitte), under the scrutiny of the Audit and
Risk Committee, presently conducts the statutory audits in return for reasonable fees. Deloitte
were appointed at the annual general meeting of the Company held on 6 November 2003. The
committee also has specifi c responsibility for recommending the appointment or dismissal of
external auditors and monitoring any non-audit work carried out by the external audit fi rm. No
director has any association, past or present, with the external auditor. Deloitte rotate their audit
engagement partner every fi ve years.
ASX principles compliance statement (continued)

9
Servcorp Annual Report 2010
Principle 5 Make timely and balanced disclosure
Promote timely and balanced disclosure of all material matters concerning the company.
Recommendation 5.1 Establish written policies designed to ensure compliance with ASX Listing Rule disclosure
requirements and to ensure accountability at a senior executive level for that compliance and
disclose those policies or a summary of those policies.
Servcorp Board Response The Company has established a continuous disclosure compliance plan. The Board and
management continually monitor information and events and their obligation to report any
matters. Responsibility for communications to the ASX on all material matters rests with the
Company Secretary following consultation with the Chair and Managing Director.
Recommendation 5.2 Provide the information indicated in the Guide to reporting on Principle 5.
Servcorp Board Response There is no further information to be provided.
Principle 6 Respect the rights of shareholders
Respect the rights of shareholders and facilitate the effective exercise of those rights.
Recommendation 6.1 Design a communications policy for promoting effective communication with shareholders and
encouraging their participation at general meetings and disclose the policy or a summary of that
policy.
Servcorp Board Response Servcorp aims to communicate clearly and transparently with shareholders and the community.
Servcorp places company announcements on its website and also displays annual and half-year
reports.
Shareholders are given a reasonable opportunity to ask questions at the annual general meeting.
Briefi ngs are held following the release of annual and half-year results and the time and location of
these briefi ngs are notifi ed to the market.
Recommendation 6.2 Provide the information indicated in the Guide to reporting on Principle 6.
Servcorp Board Response The information has been provided in the response to recommendation 6.1.
ASX principles compliance statement (continued)

Corporate Governance
10
Principle 7 Recognise and manage risk
Establish a sound system of risk oversight and management and internal control.
Recommendation 7.1 Companies should establish policies for the oversight and management of material business risks
and disclose a summary of those policies.
Servcorp Board Response Management has a sound and comprehensive understanding of the inherent risks of the business
which have been identifi ed and managed through the experience of the Chief Executive Offi cer and
long serving executives.
Management have identifi ed and documented the key risks of the business across the spectrum of
strategic, information technology, human resources, operational, fi nancial and legal/ compliance.
The company does not have formal written policies for all aspects of its risk oversight and
management.
The company is a globally run business where senior executives have oversight through
the systems and reporting mechanisms of all activities in all global locations. The systems
infrastructure is centrally managed through a small group of senior executives. Management’s
objective is to create a culture for all executives to focus on risk as a natural part of their day to
day activities. The senior executives responsible for the day to day management of key risks have
been identifi ed.
Many processes are documented through the Company’s manuals which are proprietary and
confi dential, and these are being strengthened and improved with time.
Business processes are continually improved to reduce the potential for fi nancial loss.
Recommendation 7.2 The board should require management to design and implement the risk management and internal
control system to manage the company’s material business risks and report to it on whether those
risks are being managed effectively. The board should disclose that management has reported to it
as to the effectiveness of the company’s management of its material business risks.
Servcorp Board Response The Board has established an Audit and Risk Committee that is comprised only of non-executive
directors. The Committee reviews the Company’s risk management strategy, its adequacy and
effectiveness and the communication of risks to the Board.
The Committee is satisfi ed that the Company and management have a culture of risk control and
are in the early stages of formalising the infrastructure of this culture. Although not all policies
have been formally documented, the identifi ed risks are tightly controlled and being managed
effectively.
The Company is heavily reliant on fi nancial controls and senior executive controls. Day to day
responsibility is delegated to the Chief Executive Offi cer and senior management. The Chief
Executive Offi cer and senior management are responsible for:
identifi cation of risk; ▪
monitoring risk; ▪
communication of risk events to the Board; and ▪
responding to risk events, with Board authority. ▪
The Board defi nes risk to be any event that, if it occurs, will have a material impact on the ability
of the Company to achieve its objectives. Risk is considered across the fi nancial, operational and
organisational aspects of the Company’s affairs.
The Audit and Risk Committee are working with management to ensure continuous improvement
to the risk management and internal control systems.
ASX principles compliance statement (continued)

11
Servcorp Annual Report 2010
Recommendation 7.3 The board should disclose whether it has received assurance from the chief executive offi cer
(or equivalent) and the chief fi nancial offi cer (or equivalent) that the declaration provided in
accordance with section 295A of the Corporations Act is founded on a sound system of risk
management and internal control and that the system is operating effectively in all material
respects in relation to fi nancial reporting risks.
Servcorp Board Response The Chief Executive Offi cer and Chief Financial Offi cer provide such assurance.
Recommendation 7.4 Provide the information indicated in the Guide to reporting on Principle 7.
Servcorp Board Response This information is provided above.
Principle 8 Remunerate fairly and responsibly
Ensure that the level and composition of remuneration is suffi cient and reasonable and that its
relationship to performance is clear.
Recommendation 8.1 The board should establish a remuneration committee.
Servcorp Board Response The Board has established a Remuneration Committee. The Remuneration Committee consists
of three members, two of whom are independent non-executive directors. The Chair of the
Committee is an independent non-executive director.
Recommendation 8.2 Clearly distinguish the structure of non-executive directors’ remuneration from that of executive
directors and senior executives.
Servcorp Board Response This information is provided in the remuneration report on page 20 of this annual report.
Recommendation 8.3 Provide the information indicated in the Guide to reporting on Principle 8.
the names of the members of the remuneration committee and their attendance at meetings ▪
of the committee.
Servcorp Board Response This information is provided on pages 5 and 13 of this annual report.
Recommendation 8.3
(continued)
the existence and terms of any schemes for retirement benefi ts, other than superannuation, ▪
for non-executive directors.
Servcorp Board Response There are no such schemes in existence.
ASX principles compliance statement (continued)

Corporate Governance
12
Directors’ Report
12
The directors present their report together with the Financial
Report of Servcorp Limited (“the Company”) and the consolidated
Financial Report of the “Consolidated Entity”, being the Company
and its controlled entities, for the fi nancial year ended 30 June
2010.
Directors
The directors of the Company at any time during or since the end
of the fi nancial year are:
Alf Moufarrige
Managing director
Chief Executive Offi cer
Appointed August 1999
Alf is one of the global leaders in the serviced offi ce industry,
with 30 years of experience. Alf is primarily responsible for
Servcorp’s expansion, profi tability, cash generation and currency
management.
Directorships of listed entities in the last three years:
None. ▪
Bruce Corlett
Chair and independent non-executive director
BA, LLB
Member of Audit and Risk Committee
Member of Remuneration Committee
Appointed October 1999
Over the past 30 years Bruce has been a director of many publicly
listed companies. He has an extensive business background
involving a range of industries including banking, property and
maritime. His current directorships include Trust Company Limited
(Chair).
Bruce is also chair of the Mark Tonga Perpetual Relief Trust, a
Director of Lifestart Co-operative Limited and an Ambassador of
The Australian Indigenous Education Foundation.
Directorships of listed entities in the last three years:
Stockland Trust Group from October 1996 to October 2008; ▪
Tooth and Co. Limited since September 1999 (Tooth & Co was ▪
removed from the offi cial list of ASX on 12 February 2010);
Trust Company Limited since October 2000 (Chair). ▪
Rick Holliday-Smith
Independent non-executive director
BA (Hons), CA, FAICD
Chair of Audit and Risk Committee
Appointed October 1999
Rick spent over 11 years in Chicago in the roles of Divisional
President of global trading and sales for NationsBank, N.A. and,
prior to that, Chief Executive Offi cer of Chicago Research and
Trading Group Limited. Rick also spent over 4 years in London as
Managing Director of Hong Kong Bank Limited, a wholly owned
merchant banking subsidiary of HSBC Bank.
Rick is currently a director of ASX Limited and Cochlear Limited.
He became Chair of Cochlear in July 2010. He is also Chair of
Snowy Hydro Limited. Rick has a Bachelor of Arts (Hons) from
Macquarie University, is a Chartered Accountant and is a Fellow of
the Australian Institute of Company Directors.
Directorships of listed entities in the last three years:
ASX Limited since July 2006; ▪
Cochlear Limited since February 2005 (Chair since July 2010); ▪
St George Bank Limited from February 2007 to December ▪
2008.
Julia King
Independent non-executive director
Member of Audit and Risk Committee
Chair of Remuneration Committee
Appointed August 1999
Julia has had more than 30 years experience in strategic
marketing and advertising. She was Chief Executive of the LVMH
fashion group in Oceania and developed the business in this area.
Prior to joining LVMH Julia was Managing Director of Lintas, a
multinational advertising agency.
Julia was a non-executive director of Fairfax Media Limited,
retiring in November 2009, and of Opera Australia, retiring in
May 2010. She has been a director of Country Road and MMI
Insurance, on the Australian Government’s Task Force for the
restructure of the wool industry and a member of the Council of
the National Library.
Directorships of listed entities in the last three years:
Fairfax Media Limited from July 1995 to November 2009. ▪
Directors’ report

13
Servcorp Annual Report 2010
13
Servcorp Annual Report 2010
Directors (continued)
Taine Moufarrige
Executive director
BA, LLB
Member of Remuneration Committee
Appointed November 2004
Taine joined Servcorp in 1996 as a Trainee Manager. Taine is now
responsible for operations in Australia, New Zealand, India and
the Middle East and for the strategic growth of the Company in
these regions.
Taine played a key role in establishing Servcorp locations in
Europe, the Middle East, New Zealand, throughout Australia and
in India through the Company’s franchise venture.
Taine is also responsible for the philanthropic activities of
Servcorp.
Directorships of listed entities in the last three years:
None. ▪
Company Secretary
Greg Pearce
B Com, CA, ACIS
Appointed August 1999
Greg joined Servcorp in 1996 as Financial Controller and was
appointed to his current role of Company Secretary during the
Company’s IPO in 1999. Prior to joining Servcorp Greg spent ten
years working in the information technology business and the 11
years prior to that working in audit and business services.
Greg is a Chartered Accountant and is an Associate of Chartered
Secretaries Australia.
Directors’ meetings
The number of directors’ meetings held (including meetings of
committees of directors) and number of meetings attended by
each of the directors of the Company during the fi nancial year is
set out in the following table.
Director Board
meetings
Audit & Risk
committee
Remuneration
committee
Number of meetings held: 11 3 1
Number of meetings attended:
B Corlett 11 3 1
R Holliday-Smith 11 3
J King 11 3 1
A G Moufarrige 11
T Moufarrige 11 1
Directors’ attendances at meetings
The details of the function and membership of the committees are presented in the corporate governance statement on pages 4 and 5.
Corporate Governance
14
Directors’ Report
14
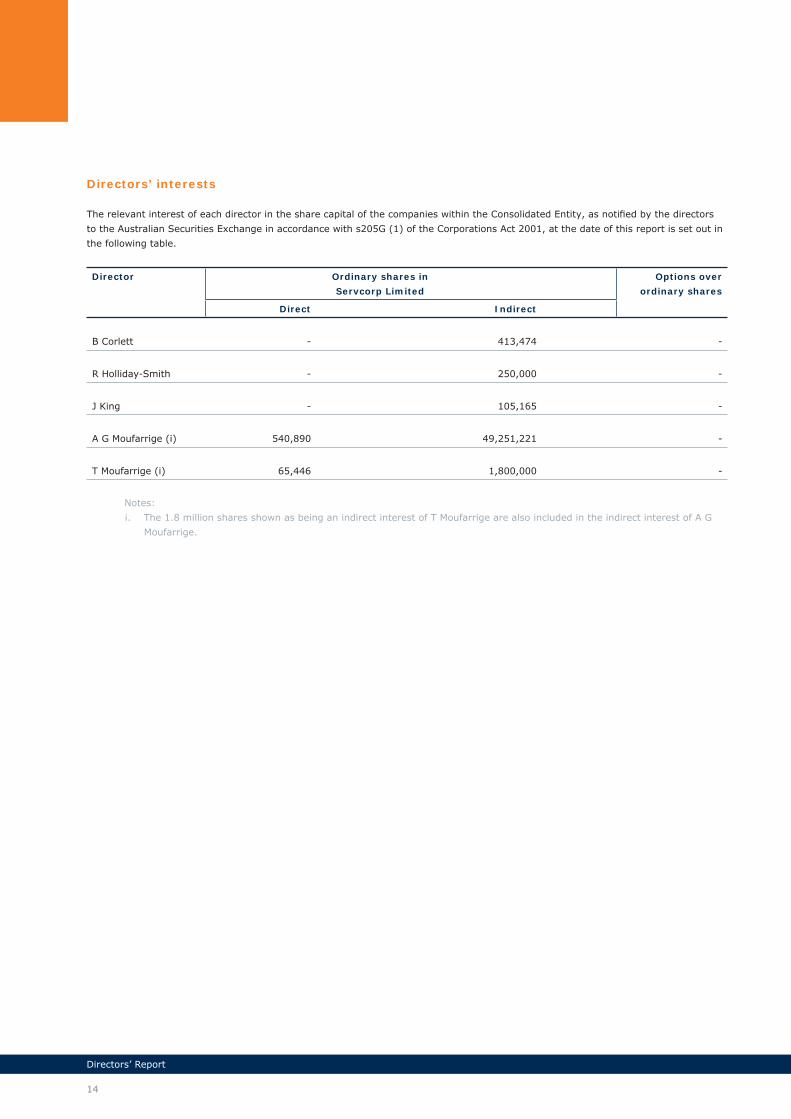
Notes:
The 1.8 million shares shown as being an indirect interest of T Moufarrige are also included in the indirect interest of A G i.
Moufarrige.
Directors’ interests
The relevant interest of each director in the share capital of the companies within the Consolidated Entity, as notifi ed by the directors
to the Australian Securities Exchange in accordance with s205G (1) of the Corporations Act 2001, at the date of this report is set out in
the following table.
Director Ordinary shares in
Servcorp Limited
Options over
ordinary shares
Direct Indirect
B Corlett - 413,474 -
R Holliday-Smith - 250,000 -
J King - 105,165 -
A G Moufarrige (i) 540,890 49,251,221 -
T Moufarrige (i) 65,446 1,800,000 -

15
Servcorp Annual Report 2010
15
Servcorp Annual Report 2010
Principal activities
The principal activities of the Consolidated Entity during the
course of the fi nancial year were the provision of executive
serviced and virtual offi ces and IT, communications and
secretarial services.
There were no signifi cant changes in the nature of the activities
of the Consolidated Entity during the year.
Consolidated results
Net profi t after tax for the fi nancial year was $2.01 million (2009:
$34.10 million). Operating revenue was $161.57 million
(2009: $219.39 million). Basic and diluted earnings per share
was 2.2 cents (2009: 42.7 cents).
Dividends
Dividends totalling $9.84 million have been paid or declared by
the Company in relation to the fi nancial year ended 30 June 2010
(2009: $19.92 million).
Information relating to dividends in respect of the prior and
current fi nancial year, including dividends paid or declared by
the Company since the end of the previous year is set out in the
following table.
Dividends paid and declared
Type Cents
per
share
Total
amount
$’000
Date of payment Franked
%
Tax rate
for
franking
credit
In respect of the previous fi nancial year:
2009
Special Ordinary shares 5.00 4,023 10 December 2008 100% 30%
Interim Ordinary shares 10.00 8,047 2 April 2009 100% 30%
Final Ordinary shares 10.00 7,847 1 October 2009 100% 30%
In respect of the current fi nancial year:
2010
Interim Ordinary shares 5.00 4,922 29 March 2010 100% 30%
Final Ordinary shares 5.00 4,922 6 October 2010 100% 30%

Corporate Governance
16
Directors’ Report
16
Review of operations
Revenue from ordinary activities for the twelve months ended
30 June 2010 was $168.84 million, down 26% from the twelve
months ended 30 June 2009. During the year the Australian
dollar appreciated strongly against all major currencies. The
Australian dolar increased by an average of 17% against the
US dollar, 17% against the Euro and 8% against the Japanese
yen. The appreciation in the Australian dollar over the year has
had a negative impact on the consolidated revenues and profi t
for the twelve months ended 30 June 2010. When expressed in
constant currency terms, revenue decreased by 19% compared
to the 2009 year.
Net profi t before tax for the twelve months to 30 June 2010
was $2.88 million, down 94% compared to the prior year. When
expressed in constant currency terms, net profi t before tax
decreased by 97% compared to the twelve months ended 30
June 2009.
The result for the twelve months ended 30 June 2010 included
realised and unrealised foreign currency gains in the amount
of $0.49 million (gain for the twelve months ended 30 June
2009: $3.87 million). On a positive note the strong Australian
dollar has enabled management to change Australian dollars
to foreign currency at rates more favourable than budget
estimates for the purpose of capital acquisitions.
Cash balances were $131.95 million at 30 June 2010 (30 June
2009: $83.96 million). Of this balance, $10.92 million has been
pledged with banks as collateral for bank guarantees, leaving
an unencumbered cash balance of $121.03 million in the
business as at 30 June 2010 (30 June 2009: $71.49 million).
Serviced Offi ces
As previously advised, trading conditions in the Serviced
Offi ce business were very diffi cult in the 2010 fi nancial year.
Depressed global business sentiment, particularly in the
commercial real estate market, caused a drop in demand
for Serviced Offi ces globally which impacted offi ce pricing
and occupancy of the mature Serviced Offi ce business. This
environment has created an opportunity for Servcorp to
expand.
Consolidated Serviced Offi ce revenue was impacted by a strong
Australian dollar throughout the year, recording a drop of 32%
compared to the year ended 30 June 2009. When the effect of
changes in foreign currency translation is stripped out revenue
dropped by 26% compared to the 2009 year.
Average mature fl oor occupancy for the twelve months softened
to 76% (twelve months ended 30 June 2009: 79%).
As at 30 June 2010 Servcorp operated 77 fl oors in 29 cities in
17 countries.
Virtual Offi ce
Virtual Offi ce package memberships increased by 20% during
the twelve months ended 30 June 2010. Virtual Offi ce revenue
decreased by 1% for the twelve months to 30 June 2010,
however when the translation effect of changes in currency is
stripped out, Virtual Offi ce revenue increased by 9% compared to
the 2009 year.
Expansion
Thirteen fl oors were opened in the year ended 30 June 2010. At
30 June 2010 a further 31 leases had been executed for locations
that are expected to open in the next six to nine months.
Servcorp is on track to reach its fl oor opening target of 35 new
locations in the eighteen months to 31 December 2010.
As outlined at Servcorp’s annual general meeting in November
2009, we are focussed on rapidly expanding the Servcorp
footprint into a number of new markets, in particular North
America.
We are happy with the progress of new centre rollouts and early
indications are that sales are adhering to the business model
projections. Our focus is to build scale in each geographic location
to spread marketing and web optimisation costs.
Immature fl oor expansion costs were $20.10 million for the year
ended 30 June 2010 (30 June 2009: $2.94 million). Included
in the current year immature fl oor costs are head offi ce costs
associated with expansion in the amount of $8.57 million (2009:
$Nil).
Offi ce Squared
The Offi ce Squared business has been signifi cantly scaled back.
Management is now focussing on our core business of Serviced
and Virtual Offi ces. The Offi ce Squared loss for the twelve months
ended 30 June 2010 was $2.15 million (30 June 2009: $4.14
million).

17
Servcorp Annual Report 2010
17
Servcorp Annual Report 2010
Review of operations (continued)
Australia & New Zealand
Mature fl oors
Despite global economic market turmoil, Australia and New
Zealand have performed well throughout the 2010 year and have
not been impacted to the same extent as other markets.
Mature fl oor revenue from ordinary activities decreased by 6% to
$45.47 million when compared to the 2009 year. Mature fl oor net
profi t before tax decreased by 21% to $10.77 million. The closure
cost associated with closing one fl oor in Australia had the effect of
reducing the mature fl oor result by $0.63 million.
An additional three fl oors are scheduled to open in Australia and
New Zealand by 31 December 2010.
Immature fl oors
Two fl oors in Australia and New Zealand were immature during
the year. Immature fl oor losses in the twelve months ended 30
June 2010 were $0.63 million.
Japan
Mature fl oors
Japanese business sentiment continues to be depressed and as a
result the commercial market and lease rates are now at cyclical
lows. There is an opportunity to expand in this market and
Servcorp has secured space in three new locations that will open
prior to 31 December 2010.
Revenue from mature locations decreased by 24% to $55.14
million and net profi t before tax decreased by 45% to $5.34
million for the twelve months ended 30 June 2010.
Immature fl oors
Four locations in Japan were immature during the year. The net
loss before tax on immature fl oors was $2.17 million.
Middle East
Mature fl oors
The Dubai market which was in boom has suffered a material
downturn with vacancy rates in this city now at ten year highs.
Servcorp still operates a profi table business in this city, but
nowhere near the profi ts of boom time.
The Serviced Offi ce markets in both Bahrain and Qatar remain
challenging.
Mature fl oor revenue from ordinary activities decreased by 37%
to $10.99 million when compared to the 2009 year. Mature fl oor
net profi t before tax decreased by 65% to $3.29 million.
Middle East (continued)
Immature fl oors
Locations were opened in Abu Dhabi, Jeddah and Kuwait during
the twelve months ended 30 June 2010 and the performance of
these fl oors is encouraging. Six fl oors in the Middle East were
immature during the year with losses in the twelve months ended
30 June 2010 of $3.72 million.
Since the end of the fi nancial year new locations have opened in
Beirut and Istanbul. A further location is expected to open by 31
December 2010 in Saudi Arabia.
Greater China
Mature fl oors
During the 2010 year, we experienced management problems in
this region. Management has now been restructured in China and
the region is on track to recovery. The Hong Kong market was
signifi cantly impacted by the global fi nancial crisis but this market
is now improving and we should return to profi tability in the 2011
fi nancial year.
Revenue from ordinary activities decreased by 54% to $13.19
million and net loss before tax was $0.4 million for the twelve
months ended 30 June 2010.
Immature fl oors
Four fl oors in Greater China were immature as at 30 June 2010,
with a net loss before tax of $2.02 million for the twelve months
ended 30 June 2010.
Southeast Asia
Mature fl oors
During calendar year 2009, the Singapore and Kuala Lumpur
markets saw dramatic falls in commercial property values and
commercial leasing rates. A recovery in Singapore is now evident,
however Kuala Lumpur remains challenging. The Bangkok market
has suffered as a result of the civil upheaval in April and May
2010 but it has now stabilised.
Revenue from ordinary activities decreased by 39% to $14.58
million and net profi t before tax decreased by 52% to $4.27
million for the twelve months ended 30 June 2010.
Immature fl oors
There were no immature fl oors in Southeast Asia during the
twelve months ended 30 June 2010.
Corporate Governance
18
Directors’ Report
18
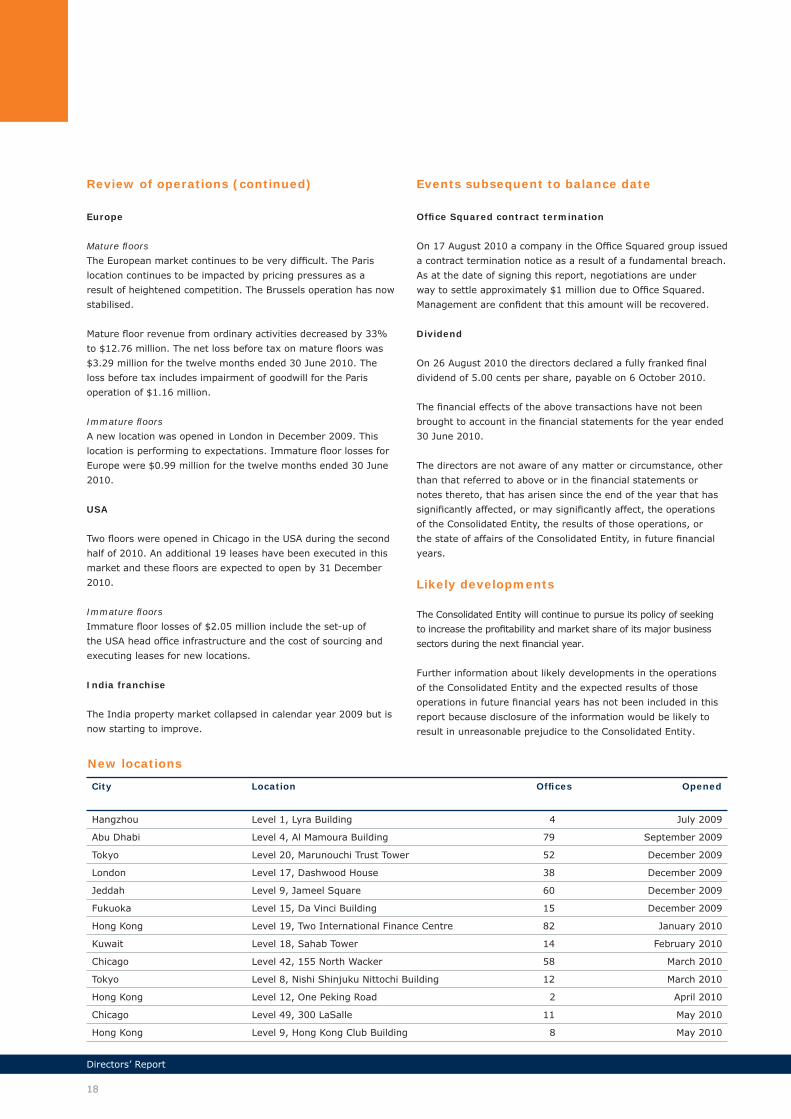
Review of operations (continued)
Europe
Mature fl oors
The European market continues to be very diffi cult. The Paris
location continues to be impacted by pricing pressures as a
result of heightened competition. The Brussels operation has now
stabilised.
Mature fl oor revenue from ordinary activities decreased by 33%
to $12.76 million. The net loss before tax on mature fl oors was
$3.29 million for the twelve months ended 30 June 2010. The
loss before tax includes impairment of goodwill for the Paris
operation of $1.16 million.
Immature fl oors
A new location was opened in London in December 2009. This
location is performing to expectations. Immature fl oor losses for
Europe were $0.99 million for the twelve months ended 30 June
2010.
USA
Two fl oors were opened in Chicago in the USA during the second
half of 2010. An additional 19 leases have been executed in this
market and these fl oors are expected to open by 31 December
2010.
Immature fl oors
Immature fl oor losses of $2.05 million include the set-up of
the USA head offi ce infrastructure and the cost of sourcing and
executing leases for new locations.
India franchise
The India property market collapsed in calendar year 2009 but is
now starting to improve.
Events subsequent to balance date
Offi ce Squared contract termination
On 17 August 2010 a company in the Offi ce Squared group issued
a contract termination notice as a result of a fundamental breach.
As at the date of signing this report, negotiations are under
way to settle approximately $1 million due to Offi ce Squared.
Management are confi dent that this amount will be recovered.
Dividend
On 26 August 2010 the directors declared a fully franked fi nal
dividend of 5.00 cents per share, payable on 6 October 2010.
The fi nancial effects of the above transactions have not been
brought to account in the fi nancial statements for the year ended
30 June 2010.
The directors are not aware of any matter or circumstance, other
than that referred to above or in the fi nancial statements or
notes thereto, that has arisen since the end of the year that has
signifi cantly affected, or may signifi cantly affect, the operations
of the Consolidated Entity, the results of those operations, or
the state of affairs of the Consolidated Entity, in future fi nancial
years.
Likely developments
The Consolidated Entity will continue to pursue its policy of seeking
to increase the profi tability and market share of its major business
sectors during the next fi nancial year.
Further information about likely developments in the operations
of the Consolidated Entity and the expected results of those
operations in future fi nancial years has not been included in this
report because disclosure of the information would be likely to
result in unreasonable prejudice to the Consolidated Entity.
New locations
City Location Offi ces Opened
Hangzhou Level 1, Lyra Building 4 July 2009
Abu Dhabi Level 4, Al Mamoura Building 79 September 2009
Tokyo Level 20, Marunouchi Trust Tower 52 December 2009
London Level 17, Dashwood House 38 December 2009
Jeddah Level 9, Jameel Square 60 December 2009
Fukuoka Level 15, Da Vinci Building 15 December 2009
Hong Kong Level 19, Two International Finance Centre 82 January 2010
Kuwait Level 18, Sahab Tower 14 February 2010
Chicago Level 42, 155 North Wacker 58 March 2010
Tokyo Level 8, Nishi Shinjuku Nittochi Building 12 March 2010
Hong Kong Level 12, One Peking Road 2 April 2010
Chicago Level 49, 300 LaSalle 11 May 2010
Hong Kong Level 9, Hong Kong Club Building 8 May 2010

19
Servcorp Annual Report 2010
19
Servcorp Annual Report 2010
Options granted
During the year or since the end of the fi nancial year, the Company has not granted options over unissued ordinary shares of the
Company.
Options on issue
At the date of this report unissued ordinary shares of the Company under option are:
Grant date Expiry date Exercise price Number of shares Earliest exercise date
22 February 2008 22 February 2013 $4.60 140,000
2 years from the
date of issue
The options expire on the earlier of:
5 years from the date of issue;a.
the date on which the optionholder ceases to be an employee of the Company or any of its subsidiaries other than as a result b.
of death of the optionholder or such later date as the Board in its absolute discretion determines on or before the date the
optionholder ceases to be an employee of the Company or any of its subsidiaries.
The options do not entitle the holder to participate in any share issue of the Company or any other body corporate.
Options granted on 22 September 2008 lapsed subsequent to the end of the 2009 fi nancial year as the vesting conditions were not
attained.
Shares issued on the exercise of options
No shares were issued by the Company during the year or since the end of the fi nancial year as a result of the exercise of an option
over unissued shares.

Corporate Governance
20
Directors’ Report
20
Remuneration report
Principles used to determine the nature and amount of remuneration
The Board recognises that the Consolidated Entity’s performance
is dependent on the quality of its people. To achieve its fi nancial
and operating objectives, Servcorp must be able to attract, retain
and motivate highly-skilled executives.
The objective of the Consolidated Entity’s executive reward
framework is to ensure reward for performance is competitive
and appropriate for the results delivered. The framework aligns
executive reward with achievement of strategic objectives and the
creation of value for shareholders.
Executive remuneration packages involve a balance between
fi xed and incentive pay. In determining the appropriate balance
an annual review is undertaken that involves cross referencing
position descriptions to reliable accessible remuneration surveys
and comparing current remuneration packages with the latest
survey information.
Servcorp’s executive remuneration policy and principles are
designed to ensure that the Consolidated Entity:
provides competitive rewards that attract, retain and motivate ▪
executives of the highest calibre;
encourages a strong and long term commitment to Servcorp; ▪
builds a structure for long term growth and succession ▪
planning;
structures remuneration at a level that refl ects the executive’s ▪
duties and accountabilities and is competitive within Australia
and, for certain roles, internationally;
aligns executive incentive rewards with the creation of value ▪
for shareholders;
complies with applicable legal requirements and appropriate ▪
standards of governance.
The framework may provide a mix of fi xed and variable pay, and
a blend of short and long term incentives.
The Board’s current policy regarding remuneration for key
management personnel is summarised on pages 21 to 26. Non-
executive directors are remunerated on a different basis to senior
executives as set out below.
Non-executive directors
Fees and payments to non-executive directors refl ect the demands
which are made on, and the responsibilities of, the directors. Non-
executive directors’ fees and payments are reviewed by the Board.
The Board ensures non-executive directors’ fees and payments are
appropriate and in line with the market. Non-executive directors
are not employed under a contract and do not receive share options
or other equity based remuneration.
Directors’ fees
Non-executive directors’ fees are determined within an aggregate
directors’ fee limit. The pool limit currently stands at $350,000
inclusive of payments for SGC superannuation. This was approved
at the time of Servcorp’s IPO in December 1999.
Non-executive directors’ fees were initially set in December 1999.
That level of fees did not vary until they were reviewed with effect
from 1 January 2005. Their remuneration was reviewed again with
effect from 1 October 2006 and as at 1 July 2008. Effective 1 July
2008, non-executive directors’ fees were as follows:
Chair - $131,890 per annum including superannuation; ▪
Non-executive - $76,300 per annum including superannuation. ▪
Effective 1 January 2010, non-executive directors’ fees have been
set as:
Chair - $150,000 per annum including superannuation; ▪
Non-executive - $80,000 per annum including superannuation. ▪
Also, from 1 January 2010 the Chair of the Audit and Risk
Committee receives an additional $10,000 per annum including
superannuation.
Additional fees are not paid for membership of Board committees.
An entity associated with Mr Holliday-Smith received consulting
fees in respect of services performed for Offi ce Squared. These
consulting fees ceased effective February 2009.
Since 2006 non-executive directors’ fees have increased by 39%.
Over the same period dividends have decreased by 5% and EPS by
93%.
Retirement allowances for directors
Non-executive directors are not entitled to retirement allowances
other than amounts previously contributed to complying
superannuation funds.
Details of remuneration
Details of the nature and amount of each element of the
remuneration of each director of Servcorp Limited for the year
ended 30 June 2010 is set out on page 24.

21
Servcorp Annual Report 2010
21
Servcorp Annual Report 2010
Principles used to determine the nature and amount of remuneration (continued)
Senior executives
The senior executive remuneration and reward framework has
three components:
Fixed remuneration; ▪
Short term incentives; ▪
Long term incentives. ▪
The combination of these comprises the executive’s total
remuneration. No senior executives are employed under a
contract.
In 2008 the Remuneration Committee undertook a review of the
Consolidated Entity’s remuneration practices. A policy is in place
which provides senior executives with a more structured scheme
for long term and short term incentives, based on earnings,
earnings growth and individual performance criteria. As part of
this years review, the Remuneration Committee identifi ed 10 key
management personnel.
The continued steady increase in the Consolidated Entity’s
earnings has resulted in reward for those executives who
have been essential to achieving this success. The success of
Servcorp’s current executives is evident in the Consolidated
Entity’s results over the previous four fi nancial years. Net profi t
after tax increased from $25.37 million in 2006 to $34.10 million
in 2009, an increase of 34%.
Shareholder wealth also increased. Dividends paid had increased
from 10.50 cents per share in 2006 to 25.0 cents per share in
the 2009 fi nancial year, an increase of 138%. The Consolidated
Entity’s strong performance and healthy cash fl ow and balance
sheet has been refl ected in its ability to pay ‘special’ dividends in
the previous three fi nancial years. Earnings per share increased
from 31.6 cents per share in 2006 to 42.7 cents per share in
2009, an increase of 35%.
Over the same four year period, the average total remuneration
paid to key management personnel including executive directors
has increased by 20%.
In the current fi nancial year, Servcorp has commenced an
aggressive expansion plan with the intention of doubling the
size of its operations by December 2013. Accordingly, the
Consolidated Entities results for the 2010 fi nancial year have not
continued the impressive growth of the previous 4 years.
The Directors are pleased with the results achieved and the
Consolidated Entity is on target with its growth plan.
The Consolidated Entity achieved its forecast net profi t before tax
on mature fl oors of $24 million.
Fixed remuneration
This is targeted to be reasonable and fair, taking into account
the Consolidated Entity’s legal and industrial obligations, labour
market conditions and the scale of the Consolidated Entity.
This fi xed remuneration component refl ects core performance
requirements and expectations.
Fixed remuneration is reviewed annually to ensure the executive’s
remuneration is competitive with the market. Remuneration
is also reviewed on promotion. There are no guaranteed fi xed
remuneration increases for any senior executives.
Short term incentives
The short term incentive component of executive remuneration
may comprise an annual cash incentive which is linked to the
performance of both the Consolidated Entity and the individual
executive.
Executives do not have a fi xed proportion of their total
remuneration that is performance related. The short term
incentive target is reviewed annually. Performance targets are
agreed with executives at the start of each year to ensure they
meet specifi c business objectives for which the individual is
responsible.
Cash incentives (bonuses) are payable following fi nalisation of
full-year results. Using a profi t target ensures variable reward is
only available when value has been created for shareholders and
when profi t is consistent with the business plan.
For the fi nancial year ended 30 June 2010, the Remuneration
Committee set the short term incentive component of
remuneration of the key management personnel in the form of
a cash bonus contingent upon attaining performance targets
for net profi t before tax for mature fl oors for their region of
responsibility.
Key management personnel who had responsibility for ▪
the Consolidated Entity overall were A G Moufarrige, T
Moufarrige, M Moufarrige and T Wallace. Short term incentive
components for these personnel were attainable as follows:
Consolidated Entity
NPBT on
mature fl oors
$m
Short term
incentive
%
of base salary
>$45 to <$47 Range from 20% to 25%
>$47 to <$49 Range from 25% to 30%
>$49 to <$51 Range from 30% to 35%
>$51 Range from 35% to 40%
Remuneration report (continued)

Corporate Governance
22
Directors’ Report
22
Remuneration report (continued)
Principles used to determine the nature and amount of remuneration (continued)
Senior executives (continued)
Short term incentives (continued)
Key management personnel who had responsibility for a ▪
region were S Martin (Australia and New Zealand), O Vlietstra
(Japan), B Barakat (Qatar) and L Lahdo (Middle East). Each
region was set a performance target for net profi t before tax
for mature fl oors. Short term incentive components for these
personnel were attainable as follows:
Attainment of
performance target (PT)
Short term incentive
%
of base salary
PT less $1m 20%
PT attained 30%
PT plus $1m 40%
PT plus $2m 50%
In addition, S Martin, O Vlietstra and L Lahdo were given ▪
short term incentive components based on the Consolidated
Entity’s overall performance, attainable as follows:
Consolidated Entity
NPBT on
mature fl oors
$m
Short term
incentive
%
of base salary
>$45 to <$47 Range from 10% to 15%
>$47 to <$49 Range from 15% to 20%
>$49 to <$51 Range from 20% to 30%
>$51 Range from 30% to 40%
If the Consolidated Entity and all specifi ed regions attained
their performance targets for the fi nancial year ended 30 June
2010, the total value of short term incentives payable to key
management personnel was $729,856 (2009: $773,800). The
range attainable was a minimum of $541,663 (2009: $572,959)
and a maximum of $1,178,443 (2009: $1,232,734).
Long term incentives
The Board may grant options to eligible executives in accordance
with the Servcorp Executive Share Option Scheme.
The purpose of the Scheme is to encourage participation in the
Company through share ownership. The Board believes that an
Executive Share Option Scheme is a cost effective and effi cient
means to attract, retain and further incentivise key executives
and encourage them to achieve superior returns for shareholders.
History of the Scheme
The Executive Share Option Scheme was fi rst approved by ▪
shareholders on 19 October 1999;
Amendments to the Scheme were approved by shareholders ▪
on 17 November 2000;
The Company afforded shareholders the opportunity to re- ▪
approve the Scheme at a general meeting of the Company in
May 2001. Shareholders re-approved the scheme on 24 May
2001;
In February 2008, in light of the age of the Scheme ▪
documentation, the Board conducted a review of the terms
and conditions of the Scheme and resolved to update
these terms and conditions to better facilitate the effective
operation of the Scheme. These amendments were approved
by shareholders on 26 May 2008;
In September 2008, in response to the views of some ▪
shareholders, the Board amended the exercise period
commencement date from 24 months after issue of Options
under the Scheme to 36 months after issue. Shareholders
approved this amendment at the annual general meeting held
on 12 November 2008.
The substantive amendment approved in May 2008 was the
introduction of an earnings per share performance hurdle for
the vesting of options. Pursuant to this amendment, options
will only vest (and hence be capable of being exercised) if the
Consolidated Entity meets specifi ed earnings per share hurdles.
The options will vest in increasing proportions, depending on the
level of growth in the Consolidated Entity’s earnings per share. No
options will vest unless the Consolidated Entity achieves earnings
per share growth of at least 10% in the specifi ed fi nancial year.
Pursuant to the terms and conditions of the Scheme, any person
who is employed on a full or part time basis by the Company and
any of its controlled entities in a management role and whom
the Board determines is eligible to participate in the Scheme is
entitled to participate in the Scheme. For the avoidance of doubt,
non-executive directors are therefore ineligible to participate in
the Scheme but executive directors are eligible to participate.
Options do not form a fi xed percentage of any executive’s
remuneration.

23
Servcorp Annual Report 2010
23
Servcorp Annual Report 2010
Remuneration report (continued)
Principles used to determine the nature and amount of remuneration (continued)
Senior executives (continued)
Long term incentives (continued)
In the current fi nancial year, following a recommendation by the
Remuneration Committee, the directors did not grant any options
under the Scheme.
The recommendation was on the basis of the uncertain taxation
implications which may have arisen if options had been issued.
Retirement benefi ts
Retirement benefi ts for senior executives are provided to the
extent required by the law of the country in which they reside.
Senior executives are not entitled to any other retirement
allowances.
Details of remuneration
Details of the nature and amount of each element of the
remuneration of each member of the key management personnel
and each of the fi ve named executives of the Company and the
Consolidated Entity receiving the highest remuneration for the
fi nancial year ended 30 June 2010 is set out in the table on pages
25 and 26.

Corporate Governance
24
Directors’ Report
24
Name Short term employee benefi ts Post
employment
Share
based
payments
Total
Salary
& fees
$
Bonus
(iv)
$
Non -
monetary
$
Other
$
Super
$
Equity
options
$
A G Moufarrige
(i)(v)
2010 465,083 - 144,167 - 27,000 - 636,250
2009 458,359 30,000 138,344 - 29,700 - 656,403
T Moufarrige (i)
2010 392,325 - 13,724 - 34,328 - 440,377
2009 356,596 70,000 7,517 - 37,800 - 471,913
B Corlett (ii)
2010 129,307 - - - 11,638 - 140,945
2009 121,000 - - - 10,890 - 131,890
R Holliday-Smith
(ii) (vi)
2010 76,284 - - - 6,866 - 83,150
2009 70,000 - - 33,333 6,300 - 109,633
J King (ii)
2010 73,950 - - - 4,200 - 78,150
2009 70,000 - - - 6,300 - 76,300
Aggregate
2010 1,136,949 - 157,891 - 84,032 - 1,378,872
2009 1,075,955 100,000 145,861 33,333 90,990 - 1,446,139
Note:
Executive directors. i.
Non-executive directors.ii.
Directors’ and offi cers’ indemnity insurance has not been included in the above fi gures since it is impractical to iii.
determine an appropriate allocation basis.
The short term bonus relates to performance targets for the current fi nancial year, payable in the following fi nancial iv.
year. The bonus is contingent upon attainment of performance targets, as detailed on page 21 of this report. Some
discretion may be applied before bonus amounts paid are fi nalised. The percentage of the maximum attainable bonus which
vested in respect of targets for the 2010 fi nancial year was as follows. The balance of the bonus was forfeited.
A G Moufarrige 0% (2009: 29%)
T Moufarrige 0% (2009: 50%)
The salary and fees of A G Moufarrige include a component paid in Yen. The increase in the 2010 year refl ects the change v.
in foreign currency exchange rate, not an increase in salary in base currency terms.
An entity associated with R Holliday-Smith received consulting fees in respect of services performed for Offi ce Squared. vi.
These consulting fees ceased effective February 2009. These fees are disclosed under Other in short term employee
benefi ts.
Directors’ remuneration
Remuneration report (continued)

25
Servcorp Annual Report 2010
25
Servcorp Annual Report 2010
Name Short term employee benefi ts Post
employment
Share
based
payments
Total
Salary
&
fees
$
Bonus
(v)
$
Non -
monetary
$
Other
$
Super
$
Equity
options
(vi)
$
M Moufarrige
CIO (i) (ii)
2010 394,087 15,000 13,724 - 35,678 - 458,489
2009 354,476 - 7,517 - 31,500 - 393,493
S Martin
GM Aust & NZ (i)
2010 205,667 - - - 18,000 13,487 237,154
2009 201,952 20,000 - - 19,800 20,772 262,524
O Vlietstra
GM Japan (i) (ii)
2010 346,251 - 52,147 - - 13,487 411,885
2009 323,915 77,160 34,626 - - 20,772 456,473
J Goodwyn
GM USA (i) (ii) (iii)
2010 351,989 - - - - - 351,989
B Barakat
GM Saudi Arabia
(i) (ii) (iii)
2010 246,693 80,000 - - 4,128 - 330,821
W Wu
GM Hong Kong (i)
2010 192,041 - - - - 10,115 202,156
2009 190,660 10,000 - - - 15,579 216,239
L Lahdo
GM UAE & Bahrain
(i)
2010 202,901 65,000 8,009 26,947 - - 302,857
2009 201,376 98,283 6,494 22,558 - - 328,711
T Wallace
CFO (i) (ii)
2010 270,302 - - - 23,798 10,115 304,215
2009 224,971 96,000 - - 29,865 15,579 366,415
Key management personnel and highly remunerated senior executive remuneration
Remuneration report (continued)

Corporate Governance
26
Directors’ Report
26
Notes:
Key management personnel other than directors.i.
Five relevant group executives who received the highest remuneration other than directors.ii.
J Goodwyn and B Barakat were key management personnel from 1 July 2009.iii.
L Gorman and N Billett were not key management personnel during the 2010 year.iv.
The short term bonus relates to performance targets for the current fi nancial year, payable in the following fi nancial year. v.
The bonus is contingent upon attainment of performance targets, as detailed on pages 21 and 22 of this report. Some
discretion may be applied before bonus amounts to be paid are fi nalised. The percentage of the maximum attainable bonus
which vested in respect of targets for the 2010 fi nancial year was as follows. The balance of the bonus was forfeited.
M Moufarrige 0% (2009: 0%)
S Martin 0% (2009: 13%)
O Vlietstra 0% (2009: 36%)
J Goodwyn n/a
B Barakat n/a
W Wu 0% (2009: 8%)
L Lahdo 0% (2009: 68%)
T Wallace 0% (2009: 108%)
N Billett n/a (2009: 39%)
L Gorman n/a (2009: 33%)
M Moufarrige received a discretionary bonus in recognition of his efforts during Servcorp’s equity capital raising in October
2009.
L Lahdo and B Barakat received discretionary bonuses based on their performance in their region during the year.
The amounts disclosed under ”Share based payments” relate to options issued on 22 February 2008. Based on the EPS vi.
performance of the Consolidated Entity for the 2008 fi nancial year the options vested 100%. No options were forfeited.
Options issued on 22 September 2008 did not vest as a result of the EPS performance of the Consolidated Entity for the
2009 fi nancial year not meeting minimum EPS performance hurdles. All options were forfeited. No amount has been
included in the remuneration of key management personnel with respect to these options. No options were issued in the
2010 fi nancial year.
Key management personnel and highly remunerated senior executive remuneration (continued)
Name Short term employee benefi ts Post
employment
Share
based
payments
Total
Salary
&
fees
$
Bonus
(v)
$
Non -
monetary
$
Other
$
Super
$
Equity
options
(vi)
$
N Billet
GM Sales (iv)
2009 190,572 28,000 - - 19,620 - 238,192
L Gorman
Intl Training &
Dev Mgr (iv)
2009 167,829 17,000 - - 16,830 - 201,659
Aggregate
2010 2,209,931 160,000 73,879 26,947 81,604 47,205 2,599,567
2009 1,855,751 346,443 48,637 22,558 117,615 72,702 2,463,703
Remuneration report (continued)


SERVCORP LIMITED and its controlled entities
Financial ReportFor the financial year ended
30 June 2010

Financial Report
30
Contents
Statement of comprehensive income 31
Statement of financial position 32
Statement of changes in equity 33
Statement of cash flows 34
Notes to Consolidated financial report 35
Directors’ declaration 85
Auditor’s report 86
2010 Financial Report
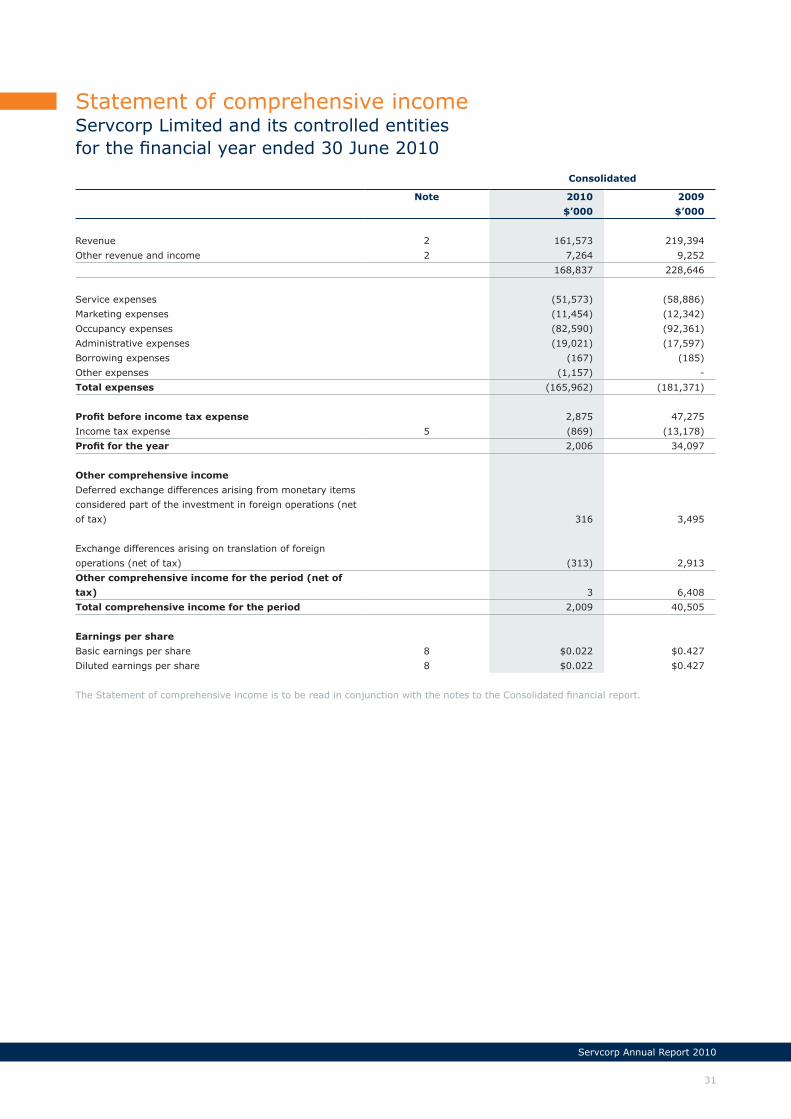
31
Servcorp Annual Report 2010
Consolidated
Note 2010
$’000
2009
$’000
Revenue 2 161,573 219,394
Other revenue and income 2 7,264 9,252
168,837 228,646
Service expenses (51,573) (58,886)
Marketing expenses (11,454) (12,342)
Occupancy expenses (82,590) (92,361)
Administrative expenses (19,021) (17,597)
Borrowing expenses (167) (185)
Other expenses (1,157) -
Total expenses (165,962) (181,371)
Profit before income tax expense 2,875 47,275
Income tax expense 5 (869) (13,178)
Profit for the year 2,006 34,097
Other comprehensive income
Deferred exchange differences arising from monetary items
considered part of the investment in foreign operations (net
of tax) 316 3,495
Exchange differences arising on translation of foreign
operations (net of tax) (313) 2,913
Other comprehensive income for the period (net of
tax) 3 6,408
Total comprehensive income for the period 2,009 40,505
Earnings per share
Basic earnings per share 8 $0.022 $0.427
Diluted earnings per share 8 $0.022 $0.427
The Statement of comprehensive income is to be read in conjunction with the notes to the Consolidated financial report.
Statement of comprehensive incomeServcorp Limited and its controlled entitiesfor the financial year ended 30 June 2010

Financial Report
32
Consolidated
Note 2010
$’000
2009
$’000
Current assets
Cash and cash equivalents 9 131,948 83,958
Trade and other receivables 10 17,160 16,916
Other financial assets 12 1,008 1,555
Current tax assets 5 2,695 193
Other 11 8,347 6,528
Total current assets 161,158 109,150
Non-current assets
Other financial assets 12 31,105 26,021
Property, plant and equipment 13 56,639 47,261
Deferred tax assets 5 14,544 10,741
Goodwill 14 14,805 15,962
Total non-current assets 117,093 99,985
Total assets 278,251 209,135
Current liabilities
Trade and other payables 15 29,742 24,454
Other financial liabilities 16 20,015 19,466
Current tax liabilities 5 1,588 3,889
Provisions 18 5,883 5,894
Total current liabilities 57,228 53,703
Non-current liabilities
Trade and other payables 15 6,904 7,708
Other financial liabilities 16 169 843
Provisions 18 869 796
Deferred tax liabilities 5 471 794
Total non-current liabilities 8,413 10,141
Total liabilities 65,641 63,844
Net assets 212,610 145,291
Equity
Issued capital 19 154,149 76,118
Reserves (8,417) (8,467)
Retained earnings 66,878 77,640
Equity attributable to equity holders of the parent 212,610 145,291
Total equity 212,610 145,291
The Statement of financial position is to be read in conjunction with the notes to the Consolidated financial report.
Statement of financial positionServcorp Limited and its controlled entitiesas at 30 June 2010

33
Servcorp Annual Report 2010
Consolidated Issued capital
$’000
Foreign
currency
translation
reserve
$’000
Employee
equity
settled
benefits
reserve
$’000
Retained
earnings
$’000
Total
$’000
Balance at 1 July 2008 80,948 (14,973) 29 61,648 127,652
Profit for the period - - - 34,097 34,097
Deferred exchange differences arising from
monetary items considered part of the investment
in foreign operations (net of tax)- 3,495 - - 3,495
Translation of foreign operations (net of tax) - 2,913 - - 2,913
Total comprehensive income for the period - 6,408 - 34,097 40,505
Share based payment - - 69 - 69
Share buy-back (4,830) - - - (4,830)
Payment of dividends - - - (18,105) (18,105)
Balance at 30 June 2009 76,118 (8,565) 98 77,640 145,291
Balance at 1 July 2009 76,118 (8,565) 98 77,640 145,291
Profit for the period - - - 2,006 2,006
Deferred exchange differences arising from
monetary items considered part of the investment
in foreign operations (net of tax) - 316 - - 316
Translation of foreign operations (net of tax) - (313) - - (313)
Total comprehensive income for the period - 3 - 2,006 2,009
Share based payment - - 47 - 47
Issue of shares 79,894 - - - 79,894
Cost of capital raising (2,662) - - - (2,662)
Tax effect of capital raising 799 - - - 799
Payment of dividends - - - (12,768) (12,768)
Balance at 30 June 2010 154,149 (8,562) 145 66,878 212,610
The Statement of changes in equity is to be read in conjunction with the notes to the Consolidated financial report.
Statement of changes in equityServcorp Limited and its controlled entitiesfor the financial year ended 30 June 2010

Financial Report
34
Consolidated
Note 2010
$’000
2009
$’000
Cash flows from operating activities
Receipts from customers 173,441 227,304
Payments to suppliers and employees (159,700) (175,004)
Dividends and royalties received 658 661
Income tax paid (9,140) (12,987)
Interest and other items of similar nature received 3,710 3,233
Interest and other costs of finance paid (171) (183)
Net operating cash flows 25(b) 8,798 43,024
Cash flows from investing activities
Payments for property, plant and equipment (25,200) (7,883)
Payments for lease deposits (6,467) (2,125)
Payments for licence fee - (1,068)
Proceeds from sale of property, plant and equipment 46 152
Proceeds from refund of lease deposits 3,405 2,925
Net investing cash flows (28,216) (7,999)
Cash flows from financing activities
Proceeds from issue of equity securities of the parent 79,894 -
Payments for share buy-back - (4,830)
Payments for share issue costs (2,662) -
Proceeds from borrowings - 122
Repayment of borrowings (119) (807)
Dividends paid (12,769) (18,105)
Net financing cash flows 64,344 (23,620)
Net increase in cash and cash equivalents 44,926 11,405
Cash and cash equivalents at the beginning of the
financial year 83,726 73,449
Effects of exchange rate changes on the balance of cash and
cash equivalents held in foreign currencies 2,679 (1,128)
Cash and cash equivalents at the end
of the financial year 25(a) 131,331 83,726
The Statement of cash flows is to be read in conjunction with the notes to the Consolidated financial report.
Statement of cash flows Servcorp Limited and its controlled entitiesfor the financial year ended 30 June 2010

35
Servcorp Annual Report 2010
Significant accounting policies1.
Statement of compliance
The financial report is a general purpose financial report which has been prepared in accordance with the Corporations Act
2001, Accounting Standards and Interpretations, and complies with other requirements of the law.
The financial report comprise the consolidated financial statements of the Group.
Accounting Standards include Australian equivalents to International Financial Reporting Standards (‘A-IFRS’). Compliance with
A-IFRS ensures that the financial statements and notes of the Group comply with International Financial Reporting Standards
(‘IFRS’).
The financial statements were authorised for issue by the directors on 26 August 2010.
Basis of preparation
The financial report has been prepared on the basis of historical cost, except for the revaluation of certain non-current assets
and financial instruments. Cost is based on the fair values of the consideration given in exchange for assets. All amounts are
presented in Australian dollars, unless otherwise noted.
The Company is a company of the kind referred to in ASIC Class Order 98/0100, dated 10 July 1998, and in accordance with
that Class Order, amounts in the financial report are rounded off to the nearest thousand dollars, unless otherwise indicated.
Adoption of new and revised Accounting Standards
In the current year, the Group has adopted all of the new and revised Standards and Interpretations issued by the Australian
Accounting Standards Board (AASB) that are relevant to its operations and effective for the current annual reporting period.
Details of the impact of the adoption of these new accounting standards are set out in the individual accounting policy notes.
At the date of authorisation of the financial report, the following Standards and Interpretations relevant to the Group were on
issue but not yet effective:
AASB9 ‘Financial Instruments’ AASB2009-11 Amendments to Australian Accounting Standards arising from AASB9. ▪
Effective for annual reporting periods beginning 1 January 2013.
The directors anticipate that the adoption of these Standards and Interpretations and any other Standards and Interpretations
on issue but not yet effective in future periods will have no material financial impact on the financial statements of the
Consolidated Entity.
Notes to Consolidated financial reportfor the financial year ended 30 June 2010

Financial Report
36
Significant accounting policies (continued)1.
The following significant accounting policies have been adopted in the preparation and presentation of the financial report:
Basis of consolidationa.
The consolidated financial statements incorporate the financial statements of the Company and entities controlled by the
Company (its subsidiaries). A list of subsidiaries appears in Note 23 to the financial statements. Consistent accounting policies
are employed in the preparation and presentation of the consolidated financial statements.
On acquisition, the assets, liabilities and contingent liabilities of a subsidiary are measured at their fair values at the date
of acquisition. Any excess in the cost of acquisition over the fair values of the identifiable net assets acquired is recognised
as goodwill. If after reassessment, the fair values of the identifiable net assets acquired exceeds the cost of acquisition the
difference is credited to the Statement of comprehensive income in the period of acquisition.
The consolidated financial statements include the information and results of each subsidiary from the date on which the
Company obtains control, and until such time as the Company ceases to control an entity.
In preparing the consolidated financial statements, all intercompany balances and transactions, and unrealised profits arising
within the Consolidated Entity are eliminated in full.
Minority interests in the net assets of consolidated subsidiaries are identified separately from the Group’s equity therein.
Goodwillb.
Goodwill arising on acquisition is recognised as an asset and initially recognised at cost, representing the excess of the
cost of acquisition over the net fair value of the identifiable assets, liabilities and contingent liabilities acquired. Goodwill is
not amortised, but is tested for impairment at each reporting date and whenever there is an indication that goodwill may
be impaired. Any impairment of goodwill is recognised immediately in the Statement of comprehensive income and is not
subsequently reversed.
For the purpose of impairment testing, goodwill is allocated to each of the Group’s cash-generating units (CGUs), or groups
of CGUs, expected to benefit from the synergies of the business combination. CGUs (or groups of CGUs) to which goodwill
has been allocated are tested for impairment annually, or more frequently if events or changes in circumstances indicate that
goodwill might be impaired.
If the recoverable amount of the CGU (or group of CGUs) is less than the carrying amount of the CGU, the impairment loss is
allocated to reduce the carrying amount of any goodwill allocated to the CGU (or groups of CGUs) and then to the other assets
of the CGUs pro-rata on the basis of the carrying amount of each asset in the CGU (or groups of CGUs). An impairment loss
for goodwill is immediately recognised in profit or loss and is not reversed in a subsequent period. On disposal of an operation
within a CGU, the attributable amount of goodwill is included in the determination of the profit or loss on disposal of the
operation.
Notes to Consolidated financial reportfor the financial year ended 30 June 2010

37
Servcorp Annual Report 2010
Significant accounting policies (continued)1.
Impairment of tangible and intangible assets excluding goodwillc.
At each reporting date, the Consolidated Entity reviews the carrying values of its tangible and intangible assets, to determine
whether there is any indication that those assets have suffered an impairment loss. If any such indication exists, the
recoverable amount of the asset is estimated in order to determine the extent of the impairment loss (if any). Where the asset
does not generate cash flows that are independent from other assets, the Consolidated Entity estimates the recoverable amount
of the cash generating unit to which the asset belongs.
Intangible assets with indefinite useful lives and intangible assets not yet available for use are tested for impairment at each
reporting date and whenever there is an indication that the asset may be impaired.
The recoverable amount is the higher of fair value, less costs to sell and value in use. In assessing the value in use, the
estimated future cash flows are discounted to their present value by using a pre-tax discount rate, that reflects the time value
of money and the risks specific to the asset for which the estimates of future cash flows have not been adjusted.
If the recoverable amount of an asset (or CGU) is estimated to be less than its carrying amount, the carrying amount of the
asset (or CGU) is reduced to its recoverable amount. An impairment loss is recognised in the Statement of comprehensive
income immediately, unless the relevant assets are carried at fair value, in which case the impairment loss is treated as a
revaluation decrease.
Where an impairment loss subsequently reverses, the carrying amount of the asset (or CGU) is increased to the revised
estimate of its recoverable amount, but only to the extent that the increased carrying amount does not exceed the carrying
amount that would have been determined had no impairment loss been recognised for the asset (or CGU) in prior years. A
reversal of the impairment loss is recognised in the Statement of comprehensive income immediately, unless the relevant asset
is carried at fair value, in which case the reversal of the impairment loss is treated as a revaluation increase.
Revenue recognitiond.
Sales revenue
Sales revenue comprises revenue earned net of the amount of consumption tax from the provision of services to entities
outside the Consolidated Entity. Rental, telephone and services revenue is typically invoiced in advance and is recognised in the
period in which the service is provided.
Other income / expensee.
Interest income
Interest revenue is accrued on a time basis, by reference to the principal outstanding and at the effective interest rate
applicable.
Disposal of assets
The profit and loss on disposal of assets is brought to account when the significant risks and rewards of ownership passes to a
party external to the Consolidated Entity.
Foreign currencyf.
Transactions
Foreign currency transactions are translated to Australian currency at the rates of exchange ruling at the dates of the
transactions. Amounts receivable and payable in foreign currencies at balance date are translated at the rates of exchange
ruling on that date.
Foreign currency monetary items at reporting date are translated at the exchange rates existing at reporting date. Non-
monetary assets and liabilities carried at fair value that are denominated in foreign currencies are translated at the rates
prevailing at the date when the fair value was determined. Non-monetary items that are measured in terms of historical cost in
a foreign currency are not re-translated.
Exchange differences are recognised in the profit and loss in the period in which they arise except exchange differences on
monetary items receivable from or payable to a foreign operation for which settlement is neither planned or likely to occur,
which form part of the net investment in a foreign operation. Such exchange differences are recognised in the foreign currency
translation reserve and in the profit and loss on disposal of the net investment.
Notes to Consolidated financial reportfor the financial year ended 30 June 2010

Financial Report
38
Significant accounting policies (continued)1.
f. Foreign currency (continued)
Translation of controlled foreign entities
The individual financial statements of each group entity are presented in its functional currency being the currency of the
primary economic environment in which the entity operates. For the purpose of the consolidated financial statements, the
results and financial position of each entity are expressed in Australian dollars, which is the functional currency of Servcorp
Limited and the presentation currency for the consolidated financial statements.
The assets and liabilities of overseas operations are translated at the rates of exchange ruling at the Balance sheet date.
Income and expense items are translated at the average exchange rate for the period. Exchange differences arising on
translation are taken directly to the foreign currency translation reserve.
The balance of the foreign currency translation reserve relating to an overseas operation that is disposed of is recognised in the
profit and loss in the period of disposal.
Goodwill and fair value adjustments arising on the acquisition of a foreign entity on or after the date of transition to A-IFRS are
treated as assets and liabilities of the foreign entity and translated at exchange rates prevailing at the reporting date. Goodwill
arising on acquisitions before the date of transition to A-IFRS is treated as an Australian dollar denominated asset.
Borrowing costsg.
Borrowing costs include interest, amortisation of discounts or premiums relating to borrowings, amortisation of ancillary costs
using the effective interest rate method in connection with the arrangement of borrowings. Borrowing costs are expensed to
the Statement of comprehensive income as incurred.
Taxation h.
Current tax
Current tax is calculated by reference to the amount of income tax payable or recoverable in respect of the taxable profit or
loss for the period. Income tax is calculated using tax rates and tax laws that have been enacted or substantively enacted by
the reporting date. Current tax for current and prior periods is recognised as a liability or asset to the extent that it is unpaid or
refundable.
Deferred tax
Deferred tax is accounted for using the comprehensive Balance sheet liability method in respect of temporary differences
arising from differences between the carrying amount of assets and liabilities in the financial statements and the corresponding
tax base of those items.
In principle, deferred tax liabilities are recognised for all taxable temporary differences. Deferred tax assets are recognised to
the extent that it is probable that sufficient taxable amounts will be available against which deductible temporary differences
or unused tax losses and tax offsets can be utilised. However, deferred tax assets and liabilities are not recognised if the
temporary differences giving rise to them arises from the initial recognition of assets and liabilities, other than as a result of a
business combination, which affects neither taxable income nor accounting profit. Furthermore, a deferred tax liability is not
recognised in relation to taxable temporary differences arising from goodwill.
Deferred tax liabilities are recognised for taxable temporary differences arising on investments in subsidiaries, branches
and associates except where the Consolidated Entity is able to control the reversal of the temporary differences and it is
probable that the temporary differences will not reverse in the foreseeable future. Deferred tax assets arising from deductible
temporary differences associated with these investments are only recognised to the extent that it is probable that there will be
sufficient taxable profits against which to utilise benefits of the temporary differences and they are expected to reverse in the
foreseeable future.
Deferred tax assets and liabilities are measured at the tax rates that are expected to apply in the period when the assets and
liabilities giving rise to them are realised or settled, based on tax rates and tax laws that have been enacted or substantially
enacted by the reporting date.
Notes to Consolidated financial reportfor the financial year ended 30 June 2010
39
Servcorp Annual Report 2010
Notes to Consolidated financial reportfor the financial year ended 30 June 2010
Significant accounting policies (continued)1.
h. Taxation (continued)
Deferred tax (continued)
The measurement of deferred tax liabilities and assets reflects the tax consequences that would follow from the manner
in which the Consolidated Entity expects, at the reporting date, to recover or settle the carrying amount of its assets and
liabilities.
Deferred tax assets and liabilities are offset when they relate to income taxes levied by the same taxation authority and the
Consolidated Entity intends to settle its current tax assets and liabilities on a net basis.
Current and deferred tax for the period
Current and deferred tax is recognised as an expense or income in the Statement of comprehensive income, except when it
relates to items credited or debited directly to equity, in which case the deferred tax is also recognised in equity.
Tax consolidation
The Company and all its wholly-owned Australian resident entities are part of a tax consolidated group under Australian
taxation law. Servcorp Limited is the head entity in the tax consolidated group. Tax expense/ income, deferred tax liabilities
and deferred tax assets arising from temporary differences of the members of the tax consolidated group are recognised in
the separate financial statements of the members of the tax consolidated group using the ‘separate tax payer within group’
approach. Current tax liabilities and assets and deferred tax assets arising from unused tax losses and tax credits of the
members of the tax consolidated group are recognised by the Company. Under this method, each entity is subject to tax as part
of the tax consolidated group.
Due to the existence of a tax funding arrangement between entities in the tax consolidated group, amounts are recognised as
payable to or receivable by the Company, and each member of the tax consolidated group in relation to the tax contribution
amounts paid or payable between the parent entity, and the other members of the tax consolidated group in accordance with
the arrangement. Where the tax contribution amount recognised by each member of the tax consolidated group for a particular
period is different to the aggregate of the current tax liability or asset and any deferred tax asset arising from unused tax
losses and tax credits in respect of that period, the difference is recognised as a contribution from (or distribution to) equity
participants.
Goods and services tax
Revenues, expenses and assets are recognised net of the amount of goods and services tax (GST), except where the amount of
GST incurred is not recoverable from the Australian Tax Office (ATO). In these circumstances the GST is recognised as part of
the cost of acquisition of the asset or as part of an item of expense.
Receivables and payables are stated inclusive of GST.
The net amount of GST recoverable from or payable to the ATO is included as a current asset or liability in the Statement of
financial position.
Cash flows are included in the Statement of cash flows on a gross basis. The GST components of cash flows arising from
investing and financing activities which are recoverable from or payable to the ATO are classified as operating cash flows.
Receivablesi.
Trade debtors to be settled within 30 days are carried at amounts due. The collectability of debts is assessed at balance date
and a specific allowance is made for any doubtful amounts.
Derivative financial instrumentsj.
The Consolidated Entity enters into derivative financial instruments to manage its exposure to fluctuations in foreign exchange
rates. Further details of derivative financial instruments are disclosed in Note 20 to the financial statements.
Derivatives are initially recognised at fair value on the date a derivative contract is entered into and are subsequently
remeasured to their fair value at each reporting date. The resulting gain or loss is recognised immediately in the Statement of
comprehensive income.

Financial Report
40
Significant accounting policies (continued)1.
Share based paymentsk.
Equity-settled share-based payments with employees are measured at the fair value of the equity instrument at the grant date.
Fair value is measured by use of a binomial tree model. The expected life used in the model has been adjusted, based on
management’s best estimate for the effects of non-transferability, exercise restrictions, and behavioural considerations. Further
details on how the fair value of equity-settled share-based transactions has been determined can be found in Note 21.
The fair value determined at the grant date of the equity-settled share-based payments is expensed on a straight line basis
over the vesting period, based on the Group’s estimate of equity instruments that will eventually vest.
At each reporting date, the Group revises its estimate of the number of equity instruments that are expected to vest. The
impact of the revision of the original estimates, if any, is recognised in profit or loss, with a corresponding adjustment to the
equity-settled employee benefits reserve.
Financial assetsl.
Subsequent to initial recognition, investments in subsidiaries are measured at cost.
Investments are recognised and derecognised on trade date where the purchase or sale of the investment is under a contract
whose terms require delivery of the investment within the time-frame established by the market concerned, and are initially
measured at fair value, plus transaction costs except for those financial assets classified as at fair value through profit or loss
which are initially measured at fair value.
The classification of financial assets depends on the nature and purpose of the financial assets and is determined at the time of
initial recognition. Other financial assets are classified into the following specified categories:
Financial assets at fair value through profit or loss
Financial assets are classified as financial assets at fair value through profit or loss where the financial asset:
has been acquired principally for the purpose of selling in the near future; ▪
is part of an identified portfolio of financial investments that the Group manages together and has a recent actual ▪
pattern of short-term profit taking; or
is a derivative that is not designated and effective as a hedging instrument. ▪
Loans and receivables
Trade receivables, loans and other receivables that have fixed or determinable payments that are not quoted in an active
market are classified as ‘Loans and receivables‘. Loans and receivables are measured at amortised costs using the effective
interest method less impairment.
Impairment of financial assets
Financial assets, other than those at fair value through profit or loss, are assessed for indicators of impairment at each balance
sheet date. Financial assets are impaired where there is objective evidence that as a result of one or more events that occurred
after the initial recognition of the financial asset the estimated future cash flow of the investment have been impacted. Further
details are disclosed in Note 14.
Effective interest method
The effective interest method is a method of calculating the amortised cost of a financial asset and of allocating interest
income over the relevant period. The effective interest rate is the rate that will exactly discount estimated future cash receipts
(including all fees paid or received that form an integral part of the effective interest rate, transaction costs and other premiums
or discounts) through the expected life of the financial asset, or, where appropriate, a shorter period.
Notes to Consolidated financial reportfor the financial year ended 30 June 2010
41
Servcorp Annual Report 2010
Significant accounting policies (continued)1.
Property, plant and equipmentm.
Acquisition
Items of property, plant and equipment acquired are capitalised when it is probable that the future economic benefits
associated with the item will flow to the entity and the cost can be measured reliably. Where these costs represent separate
components of a complex asset, they are accounted for as separate assets and are separately depreciated over their useful
lives.
Costs incurred on property, plant and equipment, which does not meet the criteria for capitalisation, are expensed as incurred.
Property, plant and equipment, leasehold improvements and equipment under finance lease are stated at cost less accumulated
depreciation, less impairment losses. Cost includes expenditure that is directly attributable to the acquisition of the item.
Depreciation
Items of property, plant and equipment, including buildings and leasehold property but excluding freehold land, are depreciated
using the straight line method over their estimated useful lives. Leasehold improvements are depreciated over the remaining
lease term or estimated useful life, whichever is the shorter, using the straight line method.
The estimated useful lives used for each class of asset are as follows:
Buildings 40 years
Leasehold improvements Shorter of the useful life of the asset or the remaining lease term
Office furniture and fittings 7.7 years
Office equipment 3-4 years
Motor vehicles 6.7 years
Depreciation rates and methods are reviewed annually and, where changed, are accounted for as a change in accounting
estimate. Where depreciation rates or methods are changed, the net written down value of the asset is depreciated from the
date of the change in accordance with the new depreciation rate or method.
Assets are depreciated from the date of acquisition or, in respect of internally constructed assets, from the time an asset is
completed and held ready for use.
Leased assetsn.
Finance leases
Leased plant and equipment
Leases of plant and equipment under which the Company or its controlled entities assume substantially all the risks and
benefits of ownership are classified as finance leases. Other leases are classified as operating leases.
Lease payments are apportioned between finance charges and reduction of the lease obligation so as to achieve a constant rate
of interest on the remaining balance of the liability.
Lease liabilities are reduced by repayments of principal. The interest components of the lease payments are charged to the
Statement of comprehensive income.
Operating leases
Operating lease payments are recognised as an expense on a straight line basis over the lease term, except where another
systematic basis is more representative of the time pattern in which economic benefits from the leased asset are consumed.
Lease incentives
Floor rental is expensed in the accounting period on a straight line basis over the period of the lease term in accordance with
lease agreements entered into with landlords. Where a rent free period or other lease incentives exist under the terms of a
lease agreement, the aggregate rent payable over the lease term is calculated and a charge is made to the profit and loss on a
straight line basis over the term of the lease. In the event that lease incentives are received to enter into operating leases, such
incentives are recognised as a liability.
Notes to Consolidated financial reportfor the financial year ended 30 June 2010

Financial Report
42
Significant accounting policies (continued)1.
Payableso.
Liabilities are recognised for amounts payable in the future for goods or services received, whether or not billed to the
Consolidated Entity. Trade accounts payable are normally settled within 60 days.
Borrowings costsp.
Borrowings are recorded initially at fair value, net of transaction costs. Any difference between the initial recognised amount
and the redemption value is recognised in the Statement of comprehensive income over the life of the borrowings using the
effective interest rate method.
Provisionsq.
Provisions are recognised when the Consolidated Entity has a present obligation (legal or constructive) as a result of a past
event, the future sacrifice of economic benefits is probable, and the amount of the provision can be measured reliably.
When some or all of the economic benefits required to settle a provision are expected to be recovered from a third party, the
receivable is recognised as an asset if it is virtually certain that recovery will be received and the amount of the receivable can
be measured reliably.
The amount recognised as a provision is the best estimate of the consideration required to settle the present obligation at the
reporting date, taking into account the risks and uncertainties surrounding the obligation. Where a provision is measured using
the cash flows estimated to settle the present obligation, its carrying amount is the present value of those cash flows.
Make good costs
A provision is made for make good costs on leases that are expected to terminate where those make good costs can be reliably
measured, and can be reasonably expected to occur.
Onerous contracts
An onerous contract is considered to exist where the Consolidated Entity has a contract under which the unavoidable cost of
meeting the contractual obligations exceed the economic benefits estimated to be received. Present obligations arising under
onerous contracts are recognised as a provision to the extent that the present obligation exceeds the economic benefits
estimated to be received.
Notes to Consolidated financial reportfor the financial year ended 30 June 2010

43
Servcorp Annual Report 2010
Notes to Consolidated financial reportfor the financial year ended 30 June 2010
Significant accounting policies (continued)1.
Employee benefitsr.
Wages, salaries and annual leave
The provisions for employee benefits in respect of wages, salaries and annual leave represents the amount which the
Consolidated Entity has a present obligation to pay resulting from employees’ services provided up to the reporting date.
Provisions made in respect of employee benefits expected to be settled within twelve months, are measured at their nominal
values using the remuneration rate expected to apply at the time of settlement.
Long service leave
The provision for employee benefits in respect of long service leave represents the present value of the estimated future cash
outflows to be made by the Consolidated Entity resulting from employees’ services provided up to the reporting date.
Provisions for employee benefits which are not expected to be settled within twelve months are discounted using the rates
attaching to national government securities at the balance sheet date, which most closely match the terms of maturity of the
related liabilities.
In determining the provision for employee benefits, consideration has been given to future increases in wage and salary rates,
and the Consolidated Entity’s experience with staff departures. Related on-costs have also been included in the liability.
Executive share option scheme
Servcorp Limited has granted options to certain executives under the Executive Share Option Scheme. Further information is
set out in Note 21 to the financial statements.
Defined contribution superannuation fund
The Company and other controlled entities contribute to defined contribution superannuation plans. Contributions are charged
to the Statement of comprehensive income as they are made. Further information is set out in Note 21. Contributions to
defined contribution superannuation plans are expensed as incurred.
Earnings per share (EPS)s.
Basic earnings per share
Basic EPS is calculated by dividing the net profit attributable to members of the Consolidated Entity for the reporting period, by
the weighted average number of ordinary shares of the Company.
Diluted earnings per share
Diluted EPS is calculated by adjusting the basic EPS earnings by the effect of conversion to ordinary shares of the associated
dilutive potential ordinary shares. The notional earnings on the funds that would have been received by the entity had the
potential ordinary shares been converted are not included.
The diluted EPS weighted average number of shares includes the number of shares assumed to be issued for no consideration
in relation to dilutive potential ordinary shares, rather than the total number of dilutive potential ordinary shares.
The identification of dilutive potential ordinary shares is based on net profit or loss from continuing ordinary operations and is
applied on a cumulative basis, taking into account the incremental earnings and incremental number of shares for each series
of potential ordinary share.
Debt and equity instrumentst.
Debt and equity instruments are classified as either liabilities or as equity in accordance with the substance of the contractual
arrangement.

Financial Report
44
Significant accounting policies (continued)1.
Cash and cash equivalentsu.
Cash comprises cash on hand and demand deposits. Cash equivalents are short-term, highly liquid investments that are readily
convertible to known amounts of cash, which are subject to an insignificant risk of changes in value and have a maturity of
three months or less.
Critical accounting issuesv.
In the application of the Group’s accounting policies, management is required to make judgments, estimates and assumptions
about carrying values of assets and liabilities that are not readily apparent from other sources. The estimates and associated
assumptions are based on historical experience and various other factors that are believed to be reasonable under the
circumstances, the results of which form the basis of making the judgments. Actual results may differ from these estimates.
These estimates and underlying assumptions are reviewed on an ongoing basis. Revisions to accounting estimates are
recognised in the period in which the estimate is revised if the revision affects only that period or in the period of the revision
and future periods if the revision affects both current and future periods.
The following are the critical judgments that management has made in the process of applying the Group’s accounting policies
and that have the most significant effect on the amounts recognised in the financial statements:
Impairment of goodwill
Determining whether goodwill is impaired requires an estimation of the value in use of the cash-generating units to which
goodwill has been allocated. The value in use calculation requires the entity to estimate the future cash flows expected to arise
from the cash-generating unit and a suitable discount rate in order to calculate present value. Further information on goodwill
impairment is set out in Note 14.
Useful lives of property, plant and equipment
As described in Note 1(m), the Group reviews the estimated useful lives of property, plant and equipment at each reporting
period.
Make good provisions
At each reporting date, management reviews leases that are expected to terminate to determine the present obligation in
relation to floor closure costs including make good.
Share options
As described in Note 21, management uses their judgment in selecting an appropriate valuation technique for share options.
Valuation techniques commonly used by market practitioners are applied. For share options, the Binomial Tree option valuation
technique was applied.
Tax losses
Deferred tax assets for the carry forward of unused tax losses are recognised to the extent that it is probable that future
taxable profits will be available against which the unused tax losses and unused tax credits can be utilised. This is assessed at
each reporting date. Further information is set out in Note 5.
Notes to Consolidated financial reportfor the financial year ended 30 June 2010

45
Servcorp Annual Report 2010
Notes to Consolidated financial reportfor the financial year ended 30 June 2010
Consolidated
2010
$’000
2009
$’000
a. Revenue
Revenue from continuing operations consisted of the following:
Revenue from the rendering of services 161,573 219,394
b. Other revenue and income
Interest income - bank deposits 4,502 3,199
Franchise fees 658 607
Net foreign exchange gains (realised and unrealised) 486 3,870
Other income 1,618 1,576
Total other income 7,264 9,252
c. Profit before income tax
Profit before income tax was arrived at after charging/(crediting) the following
from/(to) continuing operations:
Borrowing expenses:
Interest on bank overdrafts and loans 167 185
Depreciation of leasehold improvements 8,329 7,468
Depreciation of property, plant and equipment 5,044 5,202
Amortisation of licence fee 112 -
Loss on disposal of property, plant and equipment 874 1,566
Change in fair value of financial assets classified as fair value through the profit
and loss 1 (642)
Impairment of trade receivables arising from:
Third parties 658 782
Operating lease rental expense:
Minimum lease payments 67,865 76,237
Employee benefit expense:
Equity-settled share based payments 47 69
Profit from operations2.

Financial Report
46
Notes to Consolidated financial reportfor the financial year ended 30 June 2010
Consolidated
2010
$
2009
$
a. Auditor of the parent entity
(Deloitte Touche Tohmatsu Australia (DTT))
Audit and review of financial reports 451,653 368,560
Other services - tax 163,000 177,600
Other services 56,825 22,223
671,478 568,383
b. Other auditors
(DTT International Associates)
Audit and review of financial reports 536,032 548,437
Other services - tax 93,577 210,822
Other services 33,206 32,656
662,815 791,915
1,334,293 1,360,298
The auditor of Servcorp Limited is Deloitte Touche Tohmatsu.
Consolidated
2010
$’000
2009
$’000
Individually significant transactions included in profit from
ordinary activities before income tax expense:
Impairment of goodwill - France 1,157 -
Floor closure costs 1,977 4,617
3,134 4,617
Significant transactions3.
Remuneration of auditors4.

47
Servcorp Annual Report 2010
Consolidated
2010
$’000
2009
$’000
a. Income tax recognised in the profit and loss
Tax expense comprises:
Current tax expense 4,551 11,728
(Over)/under provision in prior years - current tax (136) 712
Under provision in prior years - deferred tax 35 1,324
Deferred tax income relating to the origination and reversal of temporary
differences and previously unrecognised tax losses (3,581) (586)
Income tax expense 869 13,178
The prima facie income tax expense on pre-tax accounting profit from
operations reconciles to the income tax expense
in the financial statements as follows:
Profit before income tax expense 2,875 47,275
Income tax expense calculated at 30% 863 14,183
Deductible local taxes (182) (149)
Effect of different tax rates of subsidiaries operating in other jurisdictions (1,638) (5,308)
Other non-deductible items 679 1,179
Tax losses of controlled entities recovered (40) (130)
Adjustment in deferred tax assets resulting from a change in accounting
estimates - 1,321
Income tax (over)/under provision in prior years (101) 715
Unused tax losses and tax offsets not recognised as deferred tax assets 1,288 1,367
Income tax expense 869 13,178
The tax rate used in the above reconciliation is the Australian corporate tax rate of 30% (2009: 30%).
b. Current tax assets and liabilities
Current tax assets
Tax refunds receivable 2,695 193
Current tax payables/(receivables)
Income tax attributable to:
Parent entity (2,303) 2,376
Subsidiaries 3,891 1,513
1,588 3,889
Notes to Consolidated financial reportfor the financial year ended 30 June 2010
Income taxes5.

Financial Report
48
Consolidated
2010
$’000
2009
$’000
c. Deferred tax balances
Deferred tax assets comprise:
Tax losses - revenue 5,025 2,626
Temporary differences 9,519 8,115
14,544 10,741
Deferred tax liabilities comprise:
Temporary differences 471 794
Net deferred tax assets 14,073 9,947
The gross movement of the deferred tax accounts are as follows:
Balance at the beginning of the financial year 9,947 9,212
Movements in foreign exchange rates (210) 1,472
Statement of comprehensive income credit/(charge) 4,336 (737)
Balance at the end of the financial year 14,073 9,947
Deferred tax assets
Movements in temporary differences:
Accruals not currently deductible 1,305 (291)
Doubtful debts 61 80
Depreciable and amortisable assets 414 1,350
Tax losses 2,399 (398)
Foreign exchange 158 (1,285)
Other (318) 169
Deferred tax assets 4,019 (375)
Balance at the beginning of the financial year 10,741 9,685
Movements in foreign exchange rates (216) 1,431
Statement of comprehensive income credit/(charge) 4,019 (375)
Balance at the end of the financial year 14,544 10,741
Deferred tax liabilities
Movements in temporary differences:
Depreciable and amortisable assets (95) 178
Accruals and provisions not currently deductible 6 -
Other (228) 102
Deferred tax liabilities (317) 280
Balance at the beginning of the financial year 794 473
Movements in foreign exchange (6) 41
Statement of comprehensive income (credit)/charge (317) 280
Balance at the end of the financial year 471 794
Notes to Consolidated financial reportfor the financial year ended 30 June 2010
Income taxes (continued)5.

49
Servcorp Annual Report 2010
Consolidated
2010
$’000
2009
$’000
d. Unrecognised deferred tax balances
The following deferred tax assets have not been brought to account as assets:
Temporary differences 15 -
Tax losses - capital 2,086 2,086
Tax losses - revenue 3,611 2,394
5,712 4,480
Tax losses carried forward
Deferred income tax assets are recognised for tax losses carried forward to the extent that the realisation of the related tax
benefit through future taxable profits is probable. The Consolidated Entity recognised deferred income tax assets of $5,024,890
(2009: $2,625,512) in respect to losses that can be carried forward against future taxable income.
Notes to Consolidated financial reportfor the financial year ended 30 June 2010
Income taxes (continued)5.

Financial Report
50
Segment information6.
The Group has adopted AASB 8 Operating Segments and AASB 2008-3 Amendments to Australian Accounting Standards arising
from AASB 8 with effect from 1 July 2009. AASB 8 requires operating segments to be identified on the basis of internal reports
about components of the Group that are regularly reviewed by the chief operating decision maker in order to allocate resources
to the segment and to assess its performance. In contrast, the predecessor Standard (AASB 114 Segment Reporting) required
an entity to identify two sets of segments (business and geographical), using a risks and rewards approach, with the entity’s
‘system of internal financial reporting to key management personnel’ serving only as the starting point for the identification of
the Group’s reportable segments.
Servcorp Serviced Offices are fully-managed, fully-furnished CBD office suites in a prime location, with a receptionist, meeting
rooms, IT infrastructure and support services available. Servcorp Virtual Office provides the services, facilities and IT to
business without the cost of a physical office.
In prior years, segment information reported externally was analysed on the basis of a primary and secondary segments. The
primary segment was the geographic location of assets and the secondary segment was the provision of executive serviced and
virtual offices and associated communications and secretarial services.
The Group’s information reported to the Board of Directors is based on each segment manager directly responsible for the
functioning of the operating segment. The segment manager has regular contact with members of the Board of Directors
to discuss operating activities, forecasts and financial results. Segment managers are also responsible for disseminating
management planning materials as directed by the Chief Operating Decision Maker. The segment manager motivates and
rewards team members who meet/exceed sales targets. Seven reportable operating segments have been identified: Australia
and New Zealand, Greater China, South East Asia, Japan, Europe, the Middle East and the United States of America which
reflected the segment requirements under AASB 8.
The Group’s reportable operating segments under AASB 8 are presented below. Amounts reported for the prior period have
been restated to conform with the requirements of AASB 8. The accounting policies of the new reportable operating segments
are the same as the Group’s accounting policies.
The following is an analysis of the Group’s revenue and results by reportable operating segment for the periods under audit:
Revenue Segment Profit/(Loss)
30 June 2010
$’000
30 June 2009
$’000
30 June 2010
$’000
30 June 2009
$’000
Continuing operations
Australia and New Zealand 46,578 51,913 10,143 11,843
Greater China 16,202 31,715 (2,434) 5,070
Southeast Asia 14,654 23,725 4,265 8,845
Japan 56,218 72,727 3,166 9,622
Europe 13,190 18,901 (4,279) 1,680
Middle East 14,770 21,195 (427) 8,666
USA 30 - (2,045) -
Other 912 617 (1,873) (4,192)
162,554 220,793 6,516 41,534
Finance costs - - (167) (185)
Interest revenue 4,502 3,199 4,502 3,199
Foreign exchange gains and losses 486 3,870 486 3,870
Unrecovered management fees - - (7,679) (1,064)
Franchise fees 658 607 658 607
Unallocated 637 177 (1,441) (686)
Profit before tax 2,875 47,275
Income tax expense (869) (13,178)
Consolidated segment revenue and profit for the period 168,837 228,646 2,006 34,097
Notes to Consolidated financial reportfor the financial year ended 30 June 2010

51
Servcorp Annual Report 2010
6. Segment information (continued)
The revenue reported above represents revenue generated from external customers. Intersegment sales were eliminated in full.
For the 12 months ended 30 June 2010, the Group’s Virtual Office revenue and Serviced Office revenue were $40,145,000 and
$121,428,000, respectively (2009: $40,710,000 and $178,684,000, respectively).
AASB 8 was amended in May 2009 by AASB 2009-5 ‘Further Amendments to Australian Accounting Standards arising from the
Annual Improvements Project’. The effect of this amendment is that the entities applying the revised standard are not required
to disclose information regarding segment assets and liabilities where that information is not required to the chief operating
decision maker. The directors resolved to early adopt the amendment in accordance with s.334(5) of the Corporations Act 2001.
The accounting policies of the reportable segments are the same as the Group’s accounting policies described in note 1.
Notes to Consolidated financial reportfor the financial year ended 30 June 2010

Financial Report
52
Notes to Consolidated financial reportfor the financial year ended 30 June 2010
Dividends7.
Dividends proposed (unrecognised) or paid (recognised) by the Company are:
Cents
per share
Total
amount
$’000
Date of
payment
Tax rate
for franking
credit
Percentage
franked
Recognised amounts
2009
Final Fully paid ordinary shares 7.50 6,035 2 Oct 2008 30% 100%
Special Fully paid ordinary shares 5.00 4,023 10 Dec 2008 30% 100%
Interim Fully paid ordinary shares 10.00 8,047 2 Apr 2009 30% 100%
2010
Final Fully paid ordinary shares 10.00 7,847 1 Oct 2009 30% 100%
Interim Fully paid ordinary shares 5.00 4,922 29 Mar 2010 30% 100%
Unrecognised amounts
Since the end of the financial year, the directors have declared the following dividend:
Final Fully paid ordinary shares 5.00 4,922 6 Oct 2010 30% 100%
In determining the level of future dividends, the directors will seek to balance growth objectives and rewarding shareholders
with income. This policy is subject to the cash flow requirements of the Company and its investment in new opportunities aimed
at growing earnings. The directors cannot give any assurances concerning the extent of future dividends, or the franking of
such dividends, as they are dependent on future profits, the financial and taxation position of the Company and the impact of
taxation legislation.
2010
$’000
2009
$’000
Dividend franking account
30% franking credits available 4,284 8,465
Impact on franking account balance of dividends not recognised 2,109 3,363
The balance of the franking account has been adjusted for franking credits that will arise from the payment of income tax
provided for in the financial statements, and for franking debits that will arise from the payment of dividends recognised as a
liability at reporting date.
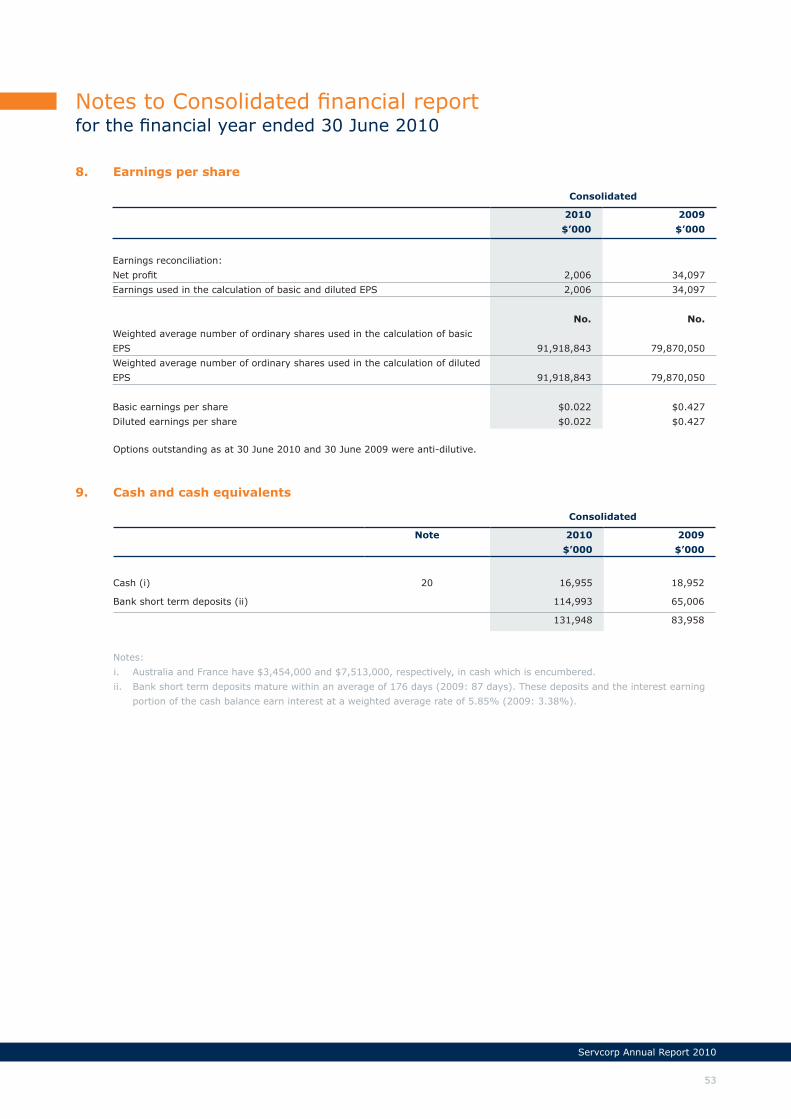
53
Servcorp Annual Report 2010
Cash and cash equivalents9.
Consolidated
Note 2010
$’000
2009
$’000
Cash (i) 20 16,955 18,952
Bank short term deposits (ii) 114,993 65,006
131,948 83,958
Notes:
Australia and France have $3,454,000 and $7,513,000, respectively, in cash which is encumbered.i.
Bank short term deposits mature within an average of 176 days (2009: 87 days). These deposits and the interest earning ii.
portion of the cash balance earn interest at a weighted average rate of 5.85% (2009: 3.38%).
Consolidated
2010
$’000
2009
$’000
Earnings reconciliation:
Net profit 2,006 34,097
Earnings used in the calculation of basic and diluted EPS 2,006 34,097
No. No.
Weighted average number of ordinary shares used in the calculation of basic
EPS 91,918,843 79,870,050
Weighted average number of ordinary shares used in the calculation of diluted
EPS 91,918,843 79,870,050
Basic earnings per share $0.022 $0.427
Diluted earnings per share $0.022 $0.427
Options outstanding as at 30 June 2010 and 30 June 2009 were anti-dilutive.
Earnings per share8.
Notes to Consolidated financial reportfor the financial year ended 30 June 2010

Financial Report
54
Aging of trade receivables past due but not
impaired
1 - 30 days 14,346 15,067
31 - 60 days 1,013 853
60 + days 756 698
Total 16,115 16,618
In determining the recoverability of a trade receivable, the Group considers any change in the credit quality of the trade
receivable from the date credit was initially granted up to the reporting date. The concentration of credit risk is limited due
to the customer base being large and unrelated. Accordingly, the directors believe that there is no further credit provision
required in excess of the allowance for doubtful debts.
Notes to Consolidated financial reportfor the financial year ended 30 June 2010
Consolidated
2010
$’000
2009
$’000
Current
At amortised cost
Trade receivables (i) 16,115 16,618
Less: allowance for doubtful debts held for trading (575) (697)
Other debtors 1,620 995
17,160 16,916
Notes:
The average credit period on rendering of services is 7 days. An allowance has been made for estimated i.
unrecoverable trade receivable amounts arising from the past rendering of services, determined by reference to
past default experience. The Group has fully reviewed all receivables over 90 days. Receivables are assessed for
impairment at each reporting date and where there is an indication of impairment, a provision is raised.
Trade and other receivables10.

55
Servcorp Annual Report 2010
Notes to Consolidated financial reportfor the financial year ended 30 June 2010
Current
At amortised cost
Lease deposits 1,008 1,555
1,008 1,555
Non-current
At amortised cost
Lease deposits 29,898 24,881
Licence fees 1,131 1,067
Other 76 73
31,105 26,021
Other assets11.
Other financial assets12.
Consolidated
2010
$’000
2009
$’000
Current
Prepayments 6,733 5,676
Other 1,614 852
8,347 6,528

Financial Report
56
Consolidated
Land and
buildings
at cost
$’000
Leasehold
improve-
ments
owned
at cost
$’000
Leasehold
improve-
ments
at cost
$’000
Office
furniture
& fittings
owned
at cost
$’000
Office
furniture
& fittings
leased
at cost
$’000
Office
equip-
ment
owned
at cost
$’000
Office
equip-
ment
leased
at cost
$’000
Motor
vehicles
owned
at cost
$’000
Total
$’000
Gross carrying
amounts
Balance at
30 June 2009 5,314 62,800 2,603 12,180 583 19,561 2,135 690 105,866
Additions - 18,704 - 2,425 - 4,019 - 52 25,200
Disposals - (2,565) (1,368) (595) - (870) - (57) (5,455)
Transfers - - - 12 (12) - - - -
Net foreign
currency
differences on
translation of
self-sustaining
operations 334 (2,365) 38 (331) 4 (275) 60 (14) (2,549)
Balance at
30 June 2010 5,648 76,574 1,273 13,691 575 22,435 2,195 671 123,062
Accumulated
depreciation
Balance at
30 June 2009 200 33,226 2,554 6,157 583 15,088 586 211 58,605
Depreciation
expense 126 8,329 - 1,493 - 2,800 524 101 13,373
Disposals - (1,643) (1,368) (370) - (672) - (40) (4,093)
Transfers - - - 12 (12) - - - -
Net foreign
currency
differences on
translation of
self-sustaining
operations 2 (988) 39 (259) 4 (275) 24 (9) (1,462)
Balance at
30 June 2010 328 38,924 1,225 7,033 575 16,941 1,134 263 66,423
Net book value
Balance at
30 June 2010 5,320 37,650 48 6,658 - 5,494 1,061 408 56,639
Balance at
30 June 2009 5,114 29,574 49 6,023 - 4,473 1,549 479 47,261
Aggregate depreciation expense allocated during the year is recognised as an expense and disclosed in Note 2 to the financial
statements.
Notes to Consolidated financial reportfor the financial year ended 30 June 2010
Property, plant and equipment13.

57
Servcorp Annual Report 2010
Consolidated
2010
$’000
2009
$’000
Gross carrying amount and net book value
Balance at the beginning of the financial year 15,962 15,962
Impairment of goodwill - France (1,157) -
Balance at the end of the financial year 14,805 15,962
At the reporting date, the Consolidated Entity assessed the recoverable amount of goodwill and determined that $1,157,000
goodwill was impaired for France. The impairment loss was included in the ‘other expenses’ line item in the Statement of
comprehensive income.
Allocation of goodwill to cash generating units
The following seventeen countries are cash generating units:
Japan, Australia, New Zealand, China, Hong Kong, Malaysia, Singapore, Thailand, Belgium, United Arab Emirates, Bahrain,
Qatar, Saudi Arabia, France, United States of America, Kuwait and United Kingdom.
Goodwill was allocated to the countries in which goodwill arose.
The carrying amounts of goodwill relating to each cash generating unit as at 30 June 2010 was as follows:
Consolidated
2010
$’000
2009
$’000
Japan 9,161 9,161
France 1,030 2,187
Australia 2,636 2,636
New Zealand 785 785
Singapore 706 706
Thailand 326 326
China 161 161
14,805 15,962
The recoverable amount of goodwill relating to each cash generating unit was determined based on value-in-use calculations,
which uses cash flow projections based on financial forecasts approved by management, covering a five year period and
terminal value. No growth factors were applied beyond year five of the forecast period. For the year ended 30 June 2010 the
discount rate applied to the above countries, inclusive of country risk premium was as follows: Japan 16.4%, France 15.5%,
Australia 15.5%, New Zealand 15.5%, Singapore 15.5%, Thailand 17.9% and China 16.9% (2009: Japan 15.9%, France
14.1%, Australia 14.1%, New Zealand 14.1%, Singapore 14.1%, Thailand 17.1% and China 16.2% ).
Management have applied assumptions to the future forecast cash flows based on historic performance and historic growth.
The assumptions did not include any acquisitions or capital expansions, but do include amounts relating to sustaining capital
expenditure.
Notes to Consolidated financial reportfor the financial year ended 30 June 2010
Goodwill14.

Financial Report
58
Consolidated
Note 2010
$’000
2009
$’000
Current
At amortised cost
Trade creditors 5,498 3,743
Deferred income 12,188 12,135
Deferred lease incentive 6,466 2,195
Other creditors and accruals 5,590 6,381
29,742 24,454
Non-current
At amortised cost
Deferred lease incentive 6,904 7,708
6,904 7,708
Notes to Consolidated financial reportfor the financial year ended 30 June 2010
Current
At amortised cost
Bank loans - secured (i) 121 117
Bank overdraft (ii) 496 -
Security deposits 17,925 18,533
Finance lease 20 1,373 702
At fair value through profit or loss
Forward foreign currency exchange contracts 100 114
20,015 19,466
Non-current
At amortised cost
Bank loans - secured (i) - 115
Finance lease 20 156 728
At fair value through profit or loss
Forward foreign currency exchange contract 13 -
169 843
Notes:
The bank loan is denominated in JPY and is secured by a mortgage over property, the current market value of i.
which exceeds the value of the bank loan. The interest rate on the loan is 1.79% (2009: 2.09%).
The bank overdraft in France is denominated in AUD and is secured. Interest at a rate of 4.70% is applicable to the ii.
outstanding balance.
Trade and other payables15.
Other financial liabilities16.

59
Servcorp Annual Report 2010
Consolidated
2010
$’000
2009
$’000
The Consolidated Entity has access to the following lines of credit:
Total facilities available:
Bank guarantees (i) 21,612 14,276
Bank overdrafts and loans (iii) 3,434 1,109
Bill acceptance / payroll / other facilities (ii) 4,125 3,975
29,171 19,360
Facilities utilised at balance sheet date:
Bank guarantees (i) 14,890 14,075
Bank overdrafts and loans (iii) 645 262
15,535 14,337
Facilities not utilised at balance sheet date:
Bank guarantees (i) 6,722 201
Bank overdrafts and loans (iii) 2,789 847
Bill acceptance / payroll / other facilities (ii) 4,125 3,975
13,636 5,023
The Group has access to financing facilities at reporting date as indicated above. The Group expects to meet its other
obligations from operating cash flows and proceeds.
Notes:
Bank guarantees have been issued to secure rental bonds over premises. i.
A guarantee has also been established to secure an overdraft limit in the form of a term deposit.
Bill acceptance, payroll and other facilities have been established to facilitate the encashment of cheques, to ii.
accommodate direct entry payroll and direct entry supplier payments.
Bank overdraft limits have been established to fund working capital as required. All bank overdraft facilities are iii.
unsecured and payable at call, including credit card facility utilised.
Notes to Consolidated financial reportfor the financial year ended 30 June 2010
Financing arrangements17.

Financial Report
60
Consolidated
2010
$’000
2009
$’000
Current
Employee benefits (i) 5,211 5,234
Other 672 660
5,883 5,894
Non-current
Employee benefits 428 367
Other 441 429
869 796
Notes:
The current provision for employee benefits includes $3,800,000 of annual leave and vested long service leave entitlements i.
accrued but not expected to be taken within 12 months (2009: $3,314,000).
Notes to Consolidated financial reportfor the financial year ended 30 June 2010
Provisions18.

61
Servcorp Annual Report 2010
Consolidated
2010
$’000
2009
$’000
Fully paid ordinary shares 98,440,807
(2009: 78,467,310) 154,149 76,118
Movements in issued capital
Balance at the beginning of the financial year 76,118 80,948
Share buy-back (i) - (4,830)
Issue of shares (ii) 79,894 -
Cost of capital raising (2,662) -
Tax effect of capital raising 799 -
Balance at the end of the financial year 154,149 76,118
(i) Share buy-back
On 20 April 2009, Servcorp Limited completed the on market buy-back of 2,000,000 ordinary shares, representing
approximately 2.5% of ordinary shares on issue at that date. These shares were subsequently cancelled.
(ii) Equity capital raising
Servcorp Limited completed an equity capital raising of $79,893,988 to fund global expansion. Capital raising costs amounted
to $2,662,000 for the six months ended 31 December 2009. A total of 19,973,497 shares were issued.
The components of the capital raising were as follows:
Institutional component - during October 2009 $75,390,324 was raised from institutional investors following completion of the
institutional offer including $51,360,420 under the institutional placement and $24,029,904 under the institutional entitlement
offer.
Retail component - during November 2009, $4,503,664 was raised under the retail entitlement offer.
Notes to Consolidated financial reportfor the financial year ended 30 June 2010
Issued capital19.

Financial Report
62
Financial instruments20.
Servcorp’s Audit and Risk Committee oversees the establishment of the capital and financial risk management system which
identifies, evaluates, classifies, monitors, qualifies and reports significant risks to the Servcorp Board. All controlled entities in
the Servcorp Group apply this risk management system to manage their own risks.
Financial risk management objectivesa.
The financial risks that result from Servcorp’s activities are credit risk and market risk (interest rate risk and foreign exchange
risk).
The Consolidated Entity’s corporate treasury function provides services to the business, co-ordinates access to domestic and
international financial markets, and manages the financial risks relating to the operations of the Consolidated Entity.
The Consolidated Entity does not enter into or trade financial instruments for speculative purposes. The Consolidated Entity
does not apply hedge accounting. The use of financial derivatives is governed by the Consolidated Entity’s policies approved by
the Board of Directors.
The Consolidated Entity’s corporate treasury function reports to the Group’s Audit and Risk Committee, an independent body
that monitors risks and policies implemented to mitigate risk exposures.
Capital managementb.
Servcorp’s objective when managing capital is to ensure that entities within the Group will be able to continue as a going
concern while maximising the return to stakeholders.
The Group’s overall strategy remains unchanged from 2009. The capital structure of Servcorp consists of equity attributable to
equity holders of the parent, company issued capital, reserves and retained earnings.
Servcorp operates globally, primarily through subsidiary companies established in the markets in which Servcorp operates.
Operating cash flows are used to maintain and expand Servcorp, as well as to make routine outflows of tax and dividend
payments.
Market riskc.
Servcorp’s activities expose it primarily to the financial risks of changes in foreign currency exchange rates. The Group enters
into forward foreign currency exchange contracts to economically hedge anticipated transactions.
Foreign exchange riski.
Servcorp operates internationally and is exposed to foreign exchange risk arising from various currency exposures.
Servcorp’s foreign exchange risk arises primarily from:
borrowings denominated in Japanese JPY; ▪
firm commitments of receipts and payments settled in foreign currencies or with prices dependent on foreign ▪
currencies;
investments in foreign operations; and ▪
loans and trading accounts to foreign operations. ▪
Foreign currency assets and liabilities
Servcorp manages its foreign exchange risk for its assets and liabilities denominated in foreign currency by borrowing in the
same functional currency of its investment to form a natural economic hedge.
For accounting purposes, net foreign operations are re-valued at the end of each reporting period with the movement
reflected as a movement in the foreign currency translation reserve. Borrowings and forward exchange contracts not forming
part of the net investment in foreign operations are re-valued at the end of each reporting period with the fair value movement
reflected in the Statement of comprehensive income as exchange gains or losses.
Notes to Consolidated financial reportfor the financial year ended 30 June 2010

63
Servcorp Annual Report 2010
Financial instruments (continued)20.
Market risk (continued)c.
Foreign exchange risk (continued)i.
Foreign currency sensitivity analysis
The following table summarises the material sensitivity of financial instruments held at balance date to movements in the
exchange rate of the Australian dollar to foreign exchange rates, with all other variables held constant. The sensitivity is based
on reasonably possible changes, over a financial year, using the observed range of actual historical rates for the preceding 5
year period.
Impact on profit Impact on equity
Consolidated Consolidated
2010
$’000
2009
$’000
2010
$’000
2009
$’000
Pre-tax gain/(loss)
AUD/USD (i) +10% (2009: +10%) 525 353 (80) (82)
AUD/USD (i) -10% (2009: -10%) (559) (433) 97 101
AUD/JPY +10% (2009: +11%)
AUD/JPY -10% (2009: -11%)
(23)
(57)
(9)
6
(1,126)
1,368
(1,136)
1,417
AUD/EUR +8% (2009: +5%)
AUD/EUR -8% (2009: -5%)
(3)
4
(264)
292
26
(31)
5
(5)
AUD/RMB +7% (2009: +7%)
AUD/RMB -7% (2009: -7%)
(139)
159
(449)
519
-
-
-
-
Notes:
Servcorp is exposed to Dirhams (Dubai), Dinars (Bahrain), Rials (Qatar) and Riyals (Saudi Arabia). These currencies are i.
pegged to the USD.
Notes to Consolidated financial reportfor the financial year ended 30 June 2010

Financial Report
64
Financial instruments (continued)20.
Market risk (continued)c.
Forward foreign currency exchange contracts
The following table sets out the details of forward foreign currency exchange contracts in place as at 30 June 2010. These are
level 2 fair value measurements derived from quoted prices in active markets.
Average
exchange rate
Foreign
currency
Fair
value
2010 2009 2010
million
2009
million
2010
$’000
2009
$’000
Outstanding contracts
Consolidated
Sell JPY
Not later than one year
Later than one year and not later than
five years
Sell USD
Not later than one year
74.29
66.46
0.83
76.89
-
-
200
50
2
500
-
-
(84)
(13)
(16)
(114)
-
-
Interest rate riskii.
Interest rate risk on cash or short term deposits is not considered to be a material risk due to the short term nature of these
financial instruments. Risk is managed by maintaining an appropriate mix between fixed and floating rate for secured and
unsecured debt.
The following table summarises the sensitivity of the financial instruments held at balance date, following a movement to
interest rates, with all other variables held constant. The sensitivity is based on reasonably possible changes over a financial
year, using the observed range of actual historical rates.
Impact on profit
Consolidated
2010
$’000
2009
$’000
Pre tax gain/(loss)
AUD balances
125 basis point increase 1,484 820
125 basis point decrease (1,437) (810)
Other balances
250 basis point increase 92 51
250 basis point decrease (62) (40)
Notes to Consolidated financial reportfor the financial year ended 30 June 2010

65
Servcorp Annual Report 2010
Financial instruments (continued)20.
Market risk (continued)c.
Liquidity riskiii.
Ultimate responsibility for liquidity risk management rests with the board of directors, who have built an appropriate liquidity
risk management framework for the management of the Consolidated Entity’s short, medium and long-term funding. The
Consolidated Entity manages liquidity risk by maintaining adequate reserves, banking facilities and borrowing facilities.
The following table details the Consolidated Entity’s expected maturity for its financial assets. The table below was drawn up
based on the undiscounted contractual maturities of the financial assets including interest that will be earned.
Less
than
1 month
$’000
1 to 3
months
$’000
3
months
to
1 year
$’000
1 to 5
years
$’000
5 +
years
$’000
Total
$’000
Weighted
average
effective
interest
rate
%
Consolidated
2010
Non-interest bearing
Cash and cash equivalents 16,955 - - - - 16,955
Receivables 17,160 - - - - 17,160
Lease deposits 859 1,163 3,483 19,852 4,849 30,206
Forward foreign currency exchange
contracts - - 5,100 752 - 5,852
Interest bearing
Cash and cash equivalents (i) 7,418 8,793 100,495 - - 116,706 5.85%
42,392 9,956 109,078 20,604 4,849 186,879
2009
Non-interest bearing
Cash and cash equivalents 18,952 - - - - 18,952
Receivables 16,916 - - - - 16,916
Lease deposits 1,109 4,189 9,115 9,610 2,295 26,318
Forward foreign currency exchange
contracts - - 6,503 - - 6,503
Interest bearing
Cash and cash equivalents (i) 17,252 47,560 533 - - 65,345 3.38%
54,229 51,749 16,151 9,610 2,295 134,034
Notes to Consolidated financial reportfor the financial year ended 30 June 2010
Notes:
Fixed interest rate instruments.i.

Financial Report
66
Financial instruments (continued)20.
Market risk (continued)c.
Liquidity risk (continued)iii.
The following table details the Consolidated Entity’s remaining contractual maturity for its financial liabilities. The table was
based on the earliest date on which undiscounted cash flows of financial liabilities are contractually to be paid. The table
includes both principal and interest cash flows.
Less
than
1 month
$’000
1-3
months
$’000
3
months
to
1 year
$’000
1-5
years
$’000
5+
years
$’000
Total
$’000
Weighted
average
effective
interest
rate
%
Consolidated
2010
Non-interest bearing
Payables - 12,993 - - - 12,993
Security deposits (i) - - 17,975 - - 17,975
Forward foreign currency exchange
contracts - - 5,190 775 - 5,965
Interest bearing
Finance lease 871 34 467 156 1 1,529 5.84%
Bank overdrafts and loans (ii) 526 - 2 89 - 617 1.79%
1,397 13,027 23,634 1,020 1 39,079
2009
Non-interest bearing
Payables 5 12,039 - - - 12,044
Security deposits (i) - - 18,411 - - 18,411
Forward foreign currency exchange
contracts - - 6,617 - - 6,617
Interest bearing
Finance lease 116 33 454 756 - 1,359 5.84%
Bank overdrafts and loans (ii) 29 1 91 120 - 241 2.17%
150 12,073 25,573 876 - 38,672
Notes:
Fixed interest rate instruments.i.
Variable interest rate instruments.ii.
Notes to Consolidated financial reportfor the financial year ended 30 June 2010

67
Servcorp Annual Report 2010
Financial instruments (continued)20.
Credit riskd.
The maximum credit risk on financial assets, excluding investments, of the Consolidated Entity which have been recognised on
the Statement of financial position, is the carrying amount, net of any allowances for losses.
Credit risk refers to the risk that the counterparty will default on its contractual obligations resulting in financial loss to the
Consolidated Entity. The Group has adopted a policy of only dealing with creditworthy counterparties and obtaining sufficient
collateral where appropriate, as a means of mitigating the risk of financial loss from defaults.
Trade receivables consist of a large number of customers, spread across diverse industries and geographical areas. Ongoing
credit evaluation is performed on the financial condition of accounts receivable. The Group does not have any significant credit
risk exposure to any single counterparty or any group of any counterparties having similar characteristics. Details of credit
enhancements in the form of serviced office security deposits retained from customers are further disclosed in Note 16.
Fair value of financial instrumentse.
The directors consider that the carrying amount of financial assets and financial liabilities approximate their fair value other
than investment in subsidiaries.
Financial instruments are measured subsequent to initial recognition at fair value, grouped into levels 1 to 3 based on the
degree to which fair value is observable:
Level 1 fair value measurements are those derived from quoted prices (unadjusted) in active markets for identical assets or ▪
liabilities.
Level 2 fair value measurements are those derived from inputs other than quoted prices included within Level 1 that are ▪
observable for the asset or liability, either directly (i.e as prices) or indirectly (i.e derived from prices).
Level 3 fair value measurements are those derived from valuation techniques that include inputs for the asset or liability ▪
that are not based on observable market data (unobservable inputs).
I-City Malaysia - Incorporated JVf.
Under the joint venture agreement, a subsidiary has a ‘call option’ giving it the right but not the obligation to require the
minority holder to sell to it all of its subscription capital for the exercise price (as defined) and the minority holder has a ‘put
option’ giving it the right but not the obligation to sell to a subsidiary its subscription capital for the exercise price.
The exercise price cannot be less than $1 and is calculated as USD350,000 less the aggregate amount of dividends paid by the
subsidiary to the minority holder prior to the commencement of the option exercise period. The option exercise period is defined
as being between the period 1 July 2012 to 31 December 2012, provided USD350,000 in dividends has not been paid to the
minority holder prior to the commencement of the option period (as the option ceases to exist once dividends to this value have
been paid).
Further, a subsidiary has provided a bank guarantee to the minority holder with a face value of USD350,000 as security for the
exercising of the put option noted above.
The consolidated entity has guaranteed the subscription capital paid by the minority shareholder and therefore has recorded a
liability of USD350,000 as at 30 June 2010 in relation to the put option and guarantee. As such, no separate fair value has been
attributed to the put option.
As the venture commenced in August 2007 and is an investment in a private company which is a start-up in nature, the fair
value of the call option cannot be reliably measured as at 30 June 2010.
Notes to Consolidated financial reportfor the financial year ended 30 June 2010

Financial Report
68
21. Employee benefits
Defined contribution fund
Contributions to defined contribution superannuation plans are expensed when employees have rendered services entitling
them to the contributions. The Company’s controlled entities are legally obliged to contribute to employee nominated defined
contribution superannuation plans.
Details of contributions to funds during the year ended 30 June 2010 are as follows:
Consolidated
2010
$’000
2009
$’000
Employer contributions 1,653 1,982
As at 30 June 2010, there were no outstanding employer contributions payable to other funds.
Options granted to employees
Share option scheme
Consolidated
2010
No.
2009
No.
Balance at the beginning of the financial year 140,000 160,000
Forfeited during the financial year - (260,000)
Granted during the financial year - 240,000
Balance at the end of the financial year 140,000 140,000
The Consolidated Entity has an ownership based remuneration scheme for key management personnel (including executive
directors).
Each key management personnel’s share option converts into one ordinary share of Servcorp Limited when exercised. No
amounts are paid or payable by the recipient of the option. The options carry neither rights to dividends or voting rights.
Further details on option conditions are included later in this Note.
Notes to Consolidated financial reportfor the financial year ended 30 June 2010

69
Servcorp Annual Report 2010
Options granted to employees (continued)
Executive share options issued by Servcorp Limited
Balance at
1/7/09
No.
Granted
No.
Forfeited
No.
Exercised
No.
Balance at
30/06/10
No.
Vested and
exercisable
No.
Net
vested
No.
T Wallace 30,000 - - - 30,000 - 30,000
O Vlietstra 40,000 - - - 40,000 - 40,000
S Martin 40,000 - - - 40,000 - 40,000
W Wu 30,000 - - - 30,000 - 30,000
140,000 - - - 140,000 - 140,000
Options granted during the financial year
Nil options were issued during the financial year ended 30 June 2010.
Options issued under the Executive Share Option Scheme carry no rights to dividends and have no voting rights.
Options exercised during the financial year
Nil (2009: Nil) options were exercised into ordinary shares in Servcorp Limited during the financial year ended 30 June 2010.
Options lapsed during the financial year
Nil (2009: 260,000) options were forfeited under the Executive Share Option Scheme during the financial year ended 30 June
2010.
Notes to Consolidated financial reportfor the financial year ended 30 June 2010
21. Employee benefits (continued)

Financial Report
70
21. Employee benefits (continued)
Options granted to employees (continued)
Balance at the end of the financial year
Grant date Expiry date Vested Exercise price Number of options
outstanding
2010 2009
22 February 2008 22 February 2013 Yes $4.60 140,000 140,000
140,000 140,000
The fair value of the services received is measured by the fair value of the equity instruments granted.
Nil options were granted during the financial year. Options were valued using the Binomial Tree option pricing model. Where
relevant, the expected life used in the model has been adjusted based on management’s best estimate for the effects of non-
transferability, exercise restrictions and behavioural considerations. Expected volatility is based on the historical market price of
the Company’s share.
Inputs into the options model
Award type Options
Grant date 22/2/08
Expiry date 22/2/13
Share price at grant date $4.60
Exercise price $4.60
Expected life 3.5 years
Volatility 25%
Risk free interest rate 6.66%
Dividend yield 2.6%
Vesting Conditions
The options will vest in the proportions detailed in the following table:
EPSperformance
Percentage ofoptions that
will vest<10% 0%
>10% to <15%50% to 100%determined onpro-rata basis
>15% 100%
Notes to Consolidated financial reportfor the financial year ended 30 June 2010

71
Servcorp Annual Report 2010
Notes to Consolidated financial reportfor the financial year ended 30 June 2010
22. Commitments for expenditure
Consolidated
2010
$’000
2009
$’000
Capital expenditure commitments - property, plant and equipment
Contracted but not provided for and payable:
Not later than one year 16,251 1,096
Later than one year but not later than five years - -
Later than five years - -
16,251 1,096
Non-cancellable operating lease commitments
Future operating lease rentals not provided for in the financial statements and
payable:
Not later than one year 78,396 50,713
Later than one year but not later than five years 194,570 108,398
Later than five years 68,350 28,715
341,316 187,826
The Consolidated Entity leases property under operating leases expiring from one to 14 years. Liabilities in respect of lease
incentives are disclosed in Note 15 to the financial statements.
Operating leases
Leasing arrangements
Operating leases have been entered into to operate serviced office floors. The average lease term is seven years with market
review clauses and options to renew. The Consolidated Entity does not have an option to purchase the leased asset at the
expiry of the lease period.
Finance lease liabilities
During the financial year ended 30 June 2009, the Group acquired $2,241,000 of equipment under a finance lease. This
acquisition is reflected in the cash flow statement over the term of the finance lease via lease repayments.

Financial Report
72
Minimum future lease
payments
Present value of
minimum future
lease payments
Consolidated Consolidated
2010
$’000
2009
$’000
2010
$’000
2009
$’000
Not later than one year 1,380 735 1,380 699
Later than one year and not later than five years 149 760 149 731
Later than five years - - - -
Minimum lease payments (i) 1,529 1,495 1,529 1,430
Less future finance charges (67) (65) - -
Present value of minimum lease payments 1,462 1,430 1,529 1,430
Included in the financial statements as Note 16:
Current borrowings 1,373 702
Non current borrowings 156 728
1,529 1,430
Notes:
Minimum future lease payments includes the aggregate of all lease payments and any guaranteed residual.i.
22. Commitments for expenditure (continued)
Notes to Consolidated financial reportfor the financial year ended 30 June 2010

73
Servcorp Annual Report 2010
23. Subsidiaries
Notes to Consolidated financial reportfor the financial year ended 30 June 2010
Ownership interest
Name of entity Country of incorporation 2010
%
2009
%
Parent entity
Servcorp Limited (i) Australia
Controlled entities
Servcorp Australian Holdings Pty Ltd Australia 100 100
Servcorp Offshore Holdings Pty Ltd Australia 100 100
Servcorp Exchange Square Pty Ltd Australia 100 100
Servcorp (Miller Street) Pty Ltd Australia 100 100
Servcorp (North Ryde) Pty Ltd Australia 100 100
Servcorp Smart Office Pty Ltd Australia 100 100
Servcorp Smart Homes Pty Ltd Australia 100 100
Servcorp Business Service (Beijing) Pty Ltd Australia 100 100
Servcorp Virtual Pty Ltd Australia 100 100
Servcorp Holdings Pty Ltd Australia 100 100
Servcorp Administration Pty Ltd Australia 100 100
Servcorp Adelaide Pty Ltd Australia 100 100
Servcorp Bridge Street Pty Ltd Australia 100 100
Servcorp Brisbane Pty Ltd Australia 100 100
Servcorp Castlereagh Street Pty Ltd Australia 100 100
Servcorp Chifley 25 Pty Ltd Australia 100 100
Servcorp Chifley 29 Pty Ltd Australia 100 100
Servcorp Communications Pty Ltd Australia 100 100
Servcorp IT Pty Ltd Australia 100 100
Servcorp Melbourne Virtual Pty Ltd Australia 100 100
Servcorp MLC Centre Pty Ltd Australia 100 100
Servcorp Melbourne 27 Pty Ltd Australia 100 100
Servcorp Sydney Virtual Pty Ltd Australia 100 100
Servcorp William Street Pty Ltd Australia 100 100
Servcorp Melbourne 50 Pty Ltd Australia 100 100
Servcorp Perth Pty Ltd Australia 100 100
Servcorp Brisbane Riverside Pty Ltd Australia 100 100
Servcorp Market Street Pty Ltd Australia 100 100
Office Squared Pty Ltd Australia 100 100
Servcorp WA Pty Ltd Australia 100 100
Servcorp Parramatta Pty Ltd (iii) Australia 100 100
Servcorp Sydney 56 Pty Ltd Australia 100 100
Servcorp Norwest Pty Ltd Australia 100 100
Servcorp Level 12 Pty Ltd Australia 100 100
Servcorp Western Australia Pty Ltd Australia 100 100
Office Squared (Nexus) Pty Ltd Australia 100 100
Servcorp SA 30 Pty Ltd Australia 100 100
Servcorp Gold Coast Pty Ltd Australia 100 100
Servcorp North Sydney 32 Pty Ltd Australia 100 100
Servcorp Docklands Pty Ltd Australia 100 -
Servcorp Sydney 22 Pty Ltd Australia 100 -
Servcorp Hobart Pty Ltd Australia 100 -
Beechreef (New Zealand) Limited New Zealand 100 100
Servcorp New Zealand Limited New Zealand 100 100
Company Headquarters Limited New Zealand 100 100
Servcorp Wellington Limited New Zealand 100 100
Servcorp Christchurch Limited New Zealand 100 -

Financial Report
74
23. Subsidiaries (continued)
Ownership interest
Name of entity Country of
incorporation
2010
%
2009
%
Controlled entities (continued)
Servcorp Serviced Offices Pte Ltd Singapore 100 100
Servcorp Battery Road Pte Ltd Singapore 100 100
Servcorp Marina Pte Ltd Singapore 100 100
Servcorp Franchising Pte Ltd Singapore 100 100
Servcorp Singapore Holdings Pte Ltd Singapore 100 100
Office Squared Pte Ltd Singapore 100 100
Servcorp Hottdesk Singapore Pte Ltd Singapore 100 100
Servcorp Jeddah Pte Ltd (v) Singapore - 100
Servcorp Square Pte Ltd Singapore 100 100
Servcorp SR Pte. Ltd. Singapore 100 -
Servcorp Hong Kong Limited Hong Kong 100 100
Servcorp Communications Limited Hong Kong 100 100
Servcorp HK Central Limited Hong Kong 100 100
Servcorp Business Services (Shanghai) Co. Ltd China 100 100
Servcorp Business Service (Beijing) Co. Ltd China 100 100
Servcorp Business Service (Chengdu) Co. Ltd China 100 100
Servcorp Business Service (Sihui) Co. Ltd China 100 100
Office Squared Network Technology Services (Hangzhou) Co. Ltd China 100 100
Amalthea Nominees (Malaysia) Sdn Bhd Malaysia 100 100
Office Squared Malaysia Sdn Bhd Malaysia 100 100
I-Office2 Sdn Bhd Malaysia 65 65
Servcorp Thai Holdings Limited Thailand 100 100
Servcorp Company Limited Thailand 100 100
Headquarters Co. Limited Thailand 100 100
Servcorp Japan KK Japan 100 100
Servcorp Tokyo KK Japan 100 100
Servcorp Nippon International KK Japan 100 100
Servcorp Marunouchi KK (iv) Japan 100 100
Servcorp Ginza KK Japan 100 100
Servcorp Shinagawa KK Japan 100 100
Servcorp Nagoya KK Japan 100 100
Servcorp Fukuoka KK Japan 100 100
Servcorp Seoul LLC Korea 100 -
Servcorp Paris SARL France 100 100
Servcorp Edouard VII SARL France 100 100
Servcorp Brussels SPRL Belgium 100 100
Servcorp UK Limited United Kingdom 100 100
Servcorp LLC (ii) UAE 49 49
Servcorp Administration Services WLL (ii) UAE 49 49
Servcorp Business Centres Operation Limited Liability Partnership Turkey 100 -
Servcorp BFH WLL Bahrain 100 100
Servcorp Qatar LLC (ii) Qatar 49 49
Servcorp Aswad Company WLL (ii) Kuwait 49 -
Servcorp Phoenicia SAL Lebanon 100 -
Servcorp US Holdings, Inc. United States 100 100
Notes to Consolidated financial reportfor the financial year ended 30 June 2010

75
Servcorp Annual Report 2010
Notes to Consolidated financial reportfor the financial year ended 30 June 2010
Name of entity Country of
incorporation
2010
%
2009
%
Servcorp America LLC United States 100 -
Servcorp Atlanta LLC United States 100 -
Servcorp Boston LLC United States 100 -
Servcorp New York LLC United States 100 -
Servcorp Washington LLC United States 100 -
Servcorp Philadelphia LLC United States 100 -
Servcorp Dallas LLC United States 100 -
Servcorp Houston LLC United States 100 -
Servcorp Los Angeles LLC United States 100 -
Servcorp Denver LLC United States 100 -
Servcorp Miami LLC United States 100 -
Servcorp San Francisco LLC United States 100 -
Notes:
Servcorp Limited is the head entity within the Australian tax consolidated group.i.
A Company in the Consolidated Entity exercises control over Servcorp LLC, Servcorp Qatar LLC, Servcorp Aswad Company ii.
WLL and Servcorp Administration Services WLL despite owning 49% of the issued capital. Arrangements are in place that
entitle the Company or its controlled entities to all the benefits and risks of ownership notwithstanding that the majority
shareholding may be vested in another party.
Servcorp Parramatta Pty Ltd changed its name from Servcorp Melbourne 36 Pty Ltd on 18 December 2009.iii.
Servcorp Marunouchi KK changed its name from Management International KK on 29 September 2009. iv.
Servcorp Jeddah Pte Ltd was incorporated on 24 September 2008 and subsequently deregistered on 7 August 2009.v.
23. Subsidiaries (continued)

Financial Report
76
Consideration
$’000
The Consolidated
Entity’s interest
%
Formations
2010
Servcorp America LLC
The entity was formed on 8 July 2009
Servcorp New York LLC
The entity was formed on 8 July 2009
Servcorp SR Pte. Ltd
The entity was formed on 14 July 2009
Servcorp Atlanta LLC
The entity was formed on 17 November 2009
Servcorp Washington LLC
The entity was formed on 17 November 2009
Servcorp Boston LLC
The entity was formed on 23 November 2009
Servcorp Docklands Pty Ltd
The entity was formed on 13 January 2010
Servcorp Philadelphia LLC
The entity was formed on 13 January 2010
Servcorp Sydney 22 Pty Ltd
The entity was formed on 14 January 2010
Servcorp Seoul LLC
The entity was formed on 22 February 2010
Servcorp Dallas LLC
The entity was formed on 22 February 2010
Servcorp Houston LLC
The entity was formed on 22 February 2010
Servcorp Los Angeles LLC
The entity was formed on 14 April 2010
-
-
-
-
-
-
-
-
-
-
-
-
-
100
100
100
100
100
100
100
100
100
100
100
100
100
24. Formation/deregistration of controlled entities
Notes to Consolidated financial reportfor the financial year ended 30 June 2010

77
Servcorp Annual Report 2010
Notes to Consolidated financial report for the financial year ended 30 June 2010
Consideration
$’000
The Consolidated
Entity’s interest
%
Formations (continued)
2010
Servcorp Denver LLC
The entity was formed on 14 April 2010
Servcorp Miami LLC
The entity was formed on 14 April 2010
Servcorp San Francisco LLC
The entity was formed on 14 April 2010
Servcorp Phoenicia SAL
The entity was formed on 21 April 2010
Servcorp Hobart Pty Ltd
The enitity was formed on 21 April 2010
Servcorp Aswad Company WLL
The entity was formed on 4 May 2010
Servcorp Business Centres Operation Limited Liability
Partnership
The entity was formed on 14 May 2010
Servcorp Christchurch Limited
The entity was formed on 20 May 2010
-
-
-
-
-
-
-
-
100
100
100
100
100
49
100
100
24. Formation/deregistration of controlled entities (continued)
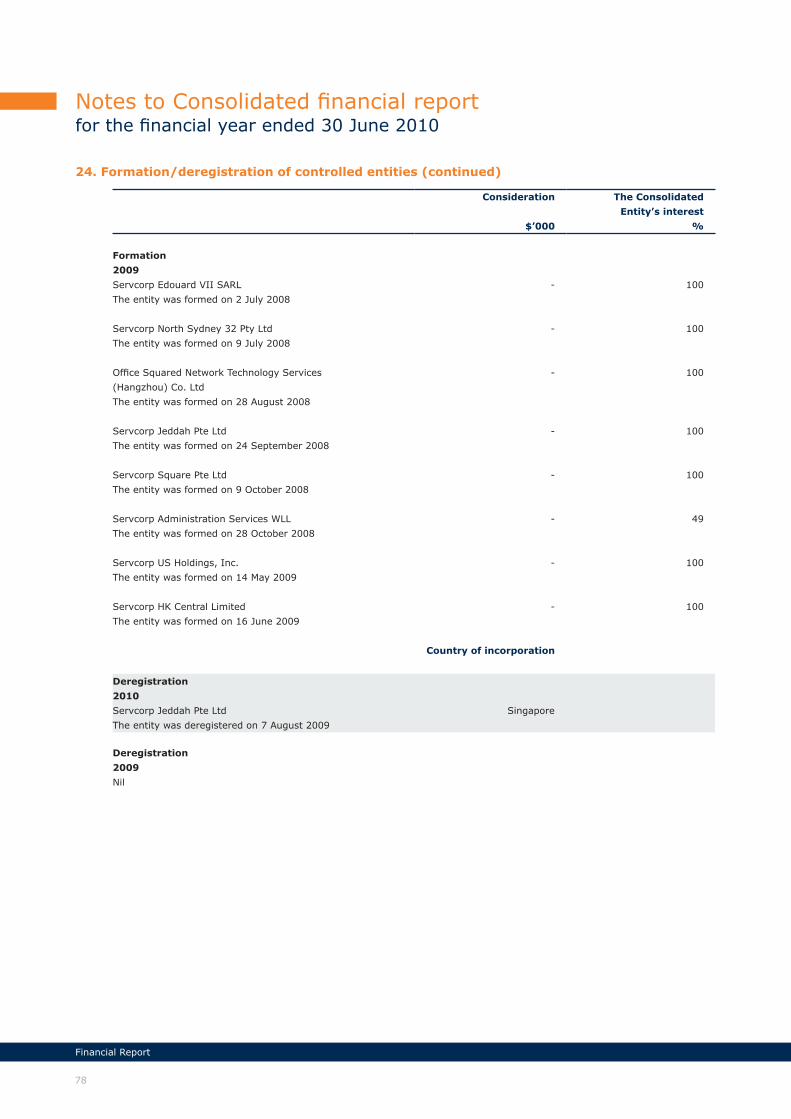
Financial Report
78
Notes to Consolidated financial reportfor the financial year ended 30 June 2010
24. Formation/deregistration of controlled entities (continued)
Consideration
$’000
The Consolidated
Entity’s interest
%
Formation
2009
Servcorp Edouard VII SARL
The entity was formed on 2 July 2008
Servcorp North Sydney 32 Pty Ltd
The entity was formed on 9 July 2008
Office Squared Network Technology Services
(Hangzhou) Co. Ltd
The entity was formed on 28 August 2008
Servcorp Jeddah Pte Ltd
The entity was formed on 24 September 2008
Servcorp Square Pte Ltd
The entity was formed on 9 October 2008
Servcorp Administration Services WLL
The entity was formed on 28 October 2008
Servcorp US Holdings, Inc.
The entity was formed on 14 May 2009
Servcorp HK Central Limited
The entity was formed on 16 June 2009
Deregistration
2010
Servcorp Jeddah Pte Ltd
The entity was deregistered on 7 August 2009
Singapore
Deregistration
2009
Nil
-
-
-
-
-
-
-
-
Country of incorporation
100
100
100
100
100
49
100
100

79
Servcorp Annual Report 2010
Consolidated
2010
$’000
2009
$’000
a. Reconciliation of cash and cash equivalents
For the purpose of the statement of cash flows, cash and cash equivalents
includes cash on hand and at bank, short-term deposits at call, net of
outstanding bank overdrafts. Cash and cash equivalents at the end of the
financial year as shown in the Cash flow statement are reconciled to the related
items in the Statement of financial position as follows:
Cash 16,955 18,952
Short term deposits 114,993 65,006
Bank overdraft and bank loans (617) (232)
131,331 83,726
b. Reconciliation of profit for the period to net cash flows from operating
activities
Profit after income tax 2,006 34,097
Add/(less) non-cash items:
Movements in provisions 232 (736)
Depreciation of non-current assets 12,625 13,018
Amortisation of licence fees 112 -
Goodwill impairment 1,157 -
Loss on disposal of non-current assets 874 1,566
(Decrease)/increase in current tax liability (4,723) 129
(Decrease)/increase in deferred tax balances (6,435) 541
Unrealised foreign exchange loss 874 60
Equity-settled share based payment 47 69
Changes in net assets and liabilities during the financial period:
Increase in prepayments and receivables (1,308) (1,427)
Decrease in trade debtors 214 2,204
(Increase)/decrease in current assets (1,801) 1,162
Increase/(decrease) in deferred income 190 (2,393)
(Decrease) in client security deposits (137) (1,823)
Increase/(decrease) in accounts payable 4,871 (3,443)
Net cash provided from operating activities 8,798 43,024
c. Non-cash financing and investing activities
During the financial year ended 30 June 2009, the Group acquired $2,241,000 of equipment under a finance lease. This
acquisition will be reflected in the cash flow statement over the term of the finance lease via lease repayments.
Notes to Consolidated financial reportfor the financial year ended 30 June 2010
25. Notes to statement of cash flows

Financial Report
80
26. Related party disclosures
Other than the details disclosed in this note, no key management personnel have entered into any other material contracts
with the Consolidated Entity or the Company during the financial year, and no material contracts involving directors’ interests or
specified executives existed at balance sheet date.
Key management personnel holdings of shares
Fully paid ordinary shares of Servcorp Limited
Balance at
01/07/09
No.
Received on
exercise of
options
No.
Net
change
No.
Balance at
30/06/10
No.
Specified directors
B Corlett 413,474 - - 413,474
R Holliday-Smith 250,000 - - 250,000
J King 96,400 - 8,765 105,165
A G Moufarrige (i) 48,502,935 - 1,287,161 49,790,096
T Moufarrige (i) 1,859,992 - 5,454 1,865,446
Specified executives
M Moufarrige (i) 1,928,842 - - 1,928,842
S Martin 27,000 - - 27,000
O Vlietstra 30,000 - - 30,000
L Lahdo 5,000 - - 5,000
T Wallace 10,000 - (10,000) -
L Gorman 11,000 - - 11,000
53,134,643 - 1,291,380 54,426,023
Notes:
T Moufarrige and M Moufarrige have a relevant interest in 1.8 million shares each in the Company. The total of 3.6 million i.
shares is also included as a relevant interest of A G Moufarrige.
Key management personnel benefits
The aggregate compensation of the key management personnel of the Consolidated Entity, are as follows:
Consolidated
2010
$’000
2009
$’000
Salary and fees, bonus and non-monetary benefits 3,766 3,629
Post employment benefits - superannuation 166 209
Share based payment - equity options and shares 47 73
Notes to Consolidated financial reportfor the financial year ended 30 June 2010

81
Servcorp Annual Report 2010
26. Related party disclosures (continued)
Loans to key management personnel
The following loan balances are in respect of loans made to key management personnel of the Group.
Balance at the
beginning of
financial year
$
Loan
repayment
$
Interest
charged/paid
$
Balance at the
end of
financial year
$
Number in
group
2010 31,995 (32,000) 5 - 1
2009 34,739 (5,448) 2,704 31,995 1
Key management personnel are charged interest on loans provided by the Group at 8.05% p.a., which is comparable to the
average commercial rate of interest.
Equity interests in subsidiaries
Details of the percentage of ordinary shares held in subsidiaries are disclosed in Note 23 to the financial statements.
Other transactions with the Company and its controlled entities
From time to time directors of the Company and its controlled entities, or their director related entities, may purchase goods
from or provide services to the Consolidated Entity. These purchases or sales are on the same terms and conditions as those
entered into by other employees, suppliers or customers of the Consolidated Entity and are trivial or domestic in nature.
The Consolidated Entity has a lease with Tekfon Pty Ltd for the use of Tekfon’s premises for storage. A director of the Company,
Mr A G Moufarrige, has an interest in and is a director of Tekfon Pty Ltd.
Enideb Pty Ltd operates the Servcorp franchise in Canberra. A relative of a director of the Company, Mr A G Moufarrige, has an
interest in Enideb Pty Ltd. Mr A G Moufarrige has no interest in the affairs of Enideb Pty Ltd.
Rumble Australia Pty Ltd provided consulting services for the development of proprietary software to a company in the
Consolidated Entity on arms length terms. A director of the Company, Mr A G Moufarrige, has an interest in and is a director of
Rumble Australia Pty Ltd.
A director of the Company, Mr A G Moufarrige, has an interest in and is a director of Sovori Pty Ltd. Mr T Moufarrige, a director
of the Company, is also a director of Sovori Pty Ltd.
A director of the Company, Mr A G Moufarrige, has an interest in and is a director of MRC Biotech Pty Ltd.
Aegis Partners Pty Ltd provided consulting services to Office Squared Pty Ltd. Consulting fees of Nil (2009: $33,336) were paid
on arms length terms. A director of the Company, Mr R Holliday-Smith has an interest in and is a director of Aegis Partners Pty
Ltd.
The terms and conditions of the transactions with directors and their director related entities were no more favourable than
those available, or which might reasonably be expected to be available, on similar transactions to non-director related entities
on an arm’s length basis.
Notes to Consolidated financial reportfor the financial year ended 30 June 2010

Financial Report
82
Notes to Consolidated financial reportfor the financial year ended 30 June 2010
26. Related party disclosures (continued)
Other transactions with the Company and its controlled entities (continued)
The value of the transactions during the year with directors and their director-related entities were as follows:
Consolidated
Director Director-related
entity
Transaction 2010
$’000
2009
$’000
A G Moufarrige Tekfon Pty Ltd Premises rental 68 66
A G Moufarrige Enideb Pty Ltd Franchisee 677 966
A G Moufarrige Rumble Australia
Pty Limited
Consulting 21 15
A G Moufarrige,
T Moufarrige
Sovori Pty Ltd Reimbursements 76 24
A G Moufarrige MRC Biotech
Pty Ltd
Reimbursements 202 370
R Holliday-Smith Aegis Partners Pty
Ltd
Consulting - 33
Amounts receivable from and payable to directors and their director-related entities at balance sheet date arising from these
transactions were as follows:
Current receivable
Enideb Pty Ltd 66 83
Current payable
Enideb Pty Ltd 11 -
Tekfon Pty Ltd 6 -

83
Servcorp Annual Report 2010
Notes to Consolidated financial reportfor the financial year ended 30 June 2010
27. Parent entity disclosures
Financial Position
The Company
2010
$’000
2009
$’000
Assets
Current assets 165,321 80,712
Non-current assets 19,817 29,590
185,138 110,302
Liabilities
Current liabilities 13,898 18,347
13,898 18,347
Equity
Issued capital 154,147 76,118
Retained earnings 16,947 15,739
Reserves
Equity settled employee benefits 146 98
171,240 91,955
Financial performance
Profit for the year 13,980 21,747
Total comprehensive income 13,980 21,747
As at 30 June 2010:
Servcorp Limited guaranteed Company Headquarters Limited (a subsidiary) as part of a New Zealand lease negotiated in i.
2002;
On 4 February 2010 Servcorp Limited renewed a Corporate Guarantee and Indemnity with the Australian and New ii.
Zealand Banking Group Limited, pursuant to which the bank agreed to make available to the Australian and New Zealand
companies a $16,406,000 interchangable facility for general corporate purposes. The liability under the deed by and
between the Australian and New Zealand companies is limited to $30,000,000. As at 30 June 2010 the fair value of the
these committments was Nil (2009:Nil).
There were no contigent liabilities of the parent entity;iii.
There were no commitments for the acquisition of property, plant and equipment by the parent entity.iv.

Financial Report
84
Other than the matters noted below, there has not arisen in the interval between reporting date and the date of this Financial
Report, any item, transaction or event of a material and unusual nature likely, in the opinion of the Directors of the Company,
to affect significantly the operations of the Consolidated Entity, the results of those operations, or the state of affairs of the
Consolidated Entity in future financial years.
Office Squared contract termination
On 17 August 2010 a company in the Office Squared group issued a contract termination notice as a result of a fundamental
breach. As at the date of signing this report, negotiations are under way to settle approximately $1Million due to Office
Squared. Management are confident that this amount will be recovered.
Dividend
On 26 August 2010 the directors declared a fully franked final dividend of 5.00 cents per share, payable on 6 October 2010.
The financial effect of the above transactions have not been brought to account in the financial statements for the year ended
30 June 2010.
Notes to Consolidated financial reportfor the financial year ended 30 June 2010
28. Subsequent events