Serum Potassium and the Electrocardiogram in Hypokalemia
18
Serum Potassium and the Electrocardiogram in Hypokalemia By WALT F. WEAVER, M.D., AND HOWARD B. BURCHELL, M.D. THE purpose of this study is to correlate changes observed in the electrocardio- gram with varying concentrations of serum potassium in commonly encountered clinical conditions. There has been much discussion and some disagreement in the literature concerning electrocardiographic criteria for hypokalemia. Many studies have dealt with the combination of 2 decidedly different aspects of hypoka- lemic states, namely the acute and the chronic. The electrocardiographic change may be re- lated to the myocardial intracellular potas- sium, the myocardial extracellular potassium, the serum potassium, the transmembranous gradient of potassium, the rate of trau-smem- branous diffusion of potassium, or the trans- membranlous gradient of hydrogen ion. It is not the purpose of this paper to present the merits or details of these various theories. Many of these phenomena would necessarily be affected by other factors such as the con- centration of other electrolytes and the en- vironmental pH. Until more is known of the physiologic and biochemical mechanisms of body potassium and their relationship to total acid-base and electrolyte balance it may be difficult to use patients with acute transient hypokalemia who have a rapid alteration of their internal and external environment for the enunciation of electrocardiographic crite- ria for hypokalemia. From the Mayo Clinic and the Mayo Founidation, Rochester, Minn. The Mayo Foundation is a part of the Graduate School of the University of Minnesota. Based, in part, on the thesis submitted by Dr. Weaver to the Faculty of the Graduate School of the University of Minnesota in partial fulfillment of the requirements for the degree of Master of Science in Medicine. Circulation, Volume XXI, April 1960 Although of interest in cases of suspected or proved electrolyte imbalance, the electro- cardiogram is often valuable in those clinical conditions in which hypokalemia often is not clinically apparent. Such states would in- clude primary aldosteronism,1 familial peri- odic paralvsis, chronic diarrhea, gastroileal anastomoses, potassium-losing nephritis, and hypokalemia secondary to diuretic therapy. The electrocardiogram is useful also when fa- cilities for potassium determinations are not readily accessible or estimation of serum po- tassium is needed immediately. Materials and Methods A study was made of 1,800 patients who had concentrations of serum potassium of less than 4.0 mEq. per liter. Of these 1,800 patients, 850 had had an electrocardiogram recorded near the time that blood was withdrawn for determination of potassium. In an attempt to minimize the nuin- ber of variables in the study, the following types of cases were discarded from the study: (1) those in which unsteady clinical states, such as diabetic acidosis, hemodialysis, and postoperative periods were indicated; (2) those in which the electro- cardiogram showed evidence of myocardial ische- mia, ventricular rates in excess of 100, ventricular conduction defects, or rhythm disturbances; and (3) those of patients treated with digitalis or quinidine. Thus 130 patients who had one or more values for serum potassium of less than 4.0 mEq. were selected. Several patients had serial deter- minations and in 152 instances the serum potas- sium was determined with nearly simultaneous recording of the electrocardiogram. Other serum electrolytes also were determined in the majority of instances. Various observations were made on the electrocardiogram including rate, P-R interval, Q-T interval, amplitude of QRS complexes, deviations of S-T segment, ampli- tudes of T and U waves, and the incidence of ventricular and atrial premature contractions. Other abnormalities, such as left ventricular hyper- 505 by guest on February 4, 2018 http://circ.ahajournals.org/ Downloaded from
Transcript of Serum Potassium and the Electrocardiogram in Hypokalemia
Serum Potassium and the Electrocardiogramin Hypokalemia
By WALT F. WEAVER, M.D., AND HOWARD B. BURCHELL, M.D.
THE purpose of this study is to correlatechanges observed in the electrocardio-
gram with varying concentrations of serumpotassium in commonly encountered clinicalconditions.
There has been much discussion and somedisagreement in the literature concerningelectrocardiographic criteria for hypokalemia.Many studies have dealt with the combinationof 2 decidedly different aspects of hypoka-lemic states, namely the acute and the chronic.The electrocardiographic change may be re-lated to the myocardial intracellular potas-sium, the myocardial extracellular potassium,the serum potassium, the transmembranousgradient of potassium, the rate of trau-smem-branous diffusion of potassium, or the trans-membranlous gradient of hydrogen ion. It isnot the purpose of this paper to present themerits or details of these various theories.Many of these phenomena would necessarilybe affected by other factors such as the con-centration of other electrolytes and the en-vironmental pH. Until more is known of thephysiologic and biochemical mechanisms ofbody potassium and their relationship to totalacid-base and electrolyte balance it may bedifficult to use patients with acute transienthypokalemia who have a rapid alteration oftheir internal and external environment forthe enunciation of electrocardiographic crite-ria for hypokalemia.From the Mayo Clinic and the Mayo Founidation,
Rochester, Minn. The Mayo Foundation is a part ofthe Graduate School of the University of Minnesota.
Based, in part, on the thesis submitted by Dr.Weaver to the Faculty of the Graduate School of theUniversity of Minnesota in partial fulfillment of therequirements for the degree of Master of Science inMedicine.
Circulation, Volume XXI, April 1960
Although of interest in cases of suspectedor proved electrolyte imbalance, the electro-cardiogram is often valuable in those clinicalconditions in which hypokalemia often is notclinically apparent. Such states would in-clude primary aldosteronism,1 familial peri-odic paralvsis, chronic diarrhea, gastroilealanastomoses, potassium-losing nephritis, andhypokalemia secondary to diuretic therapy.The electrocardiogram is useful also when fa-cilities for potassium determinations are notreadily accessible or estimation of serum po-tassium is needed immediately.
Materials and MethodsA study was made of 1,800 patients who had
concentrations of serum potassium of less than4.0 mEq. per liter. Of these 1,800 patients, 850had had an electrocardiogram recorded near thetime that blood was withdrawn for determinationof potassium. In an attempt to minimize the nuin-ber of variables in the study, the following types ofcases were discarded from the study: (1) those inwhich unsteady clinical states, such as diabeticacidosis, hemodialysis, and postoperative periodswere indicated; (2) those in which the electro-cardiogram showed evidence of myocardial ische-mia, ventricular rates in excess of 100, ventricularconduction defects, or rhythm disturbances; and(3) those of patients treated with digitalis orquinidine. Thus 130 patients who had one or morevalues for serum potassium of less than 4.0 mEq.were selected. Several patients had serial deter-minations and in 152 instances the serum potas-sium was determined with nearly simultaneousrecording of the electrocardiogram.
Other serum electrolytes also were determinedin the majority of instances. Various observationswere made on the electrocardiogram includingrate, P-R interval, Q-T interval, amplitude ofQRS complexes, deviations of S-T segment, ampli-tudes of T and U waves, and the incidence ofventricular and atrial premature contractions.Other abnormalities, such as left ventricular hyper-
505
by guest on February 4, 2018http://circ.ahajournals.org/
Dow
nloaded from
5 0WAVERR BUIRCIIEI,l
8 21 8A9P.m. 10-45p.mz Bw22-5
,.-.............. iosde _i_i_S~~~~~~~~~~~~~~~2190...'.......
v
Efet0!itl 8(08( (((t,in 0;:0i!iai(of poaSil'0
ofTani Uf wats wihUbagoanraltmlAmitt 4of pEo i8 D sulted in e
ofS-Tsegment,tt. ( oeri
Etire81 (p.^ itil-l adoitillitj 11( bt )(ti tc
ik8lemlt upaer/ca 888th8 Sl8T deto-,siottil parUtiaf'3 05(t
8of JItait tI ((((('s8 (i8h titigotlinlotheSTma s88888t J tvtil 1.nd tilt t( it Utif tt10.'EL)t.ha1 -.stos 1 t he tast-t 9 T tf isoetoft z .,;vatio-*i
QJIS icon pitto iUtttttt it) of lit s/totetau
M/g1 (h(Ilt rl,Tm'tl s8o(,s trit U (v((I at ivsol
m18 itti Lea1 tIi' jnii. Ift 8tC p 88. t.eelr8pol(letl (li lrh8 4)T1ciim8t(Vat 888ftI be 0t
whi chmthevalue Tfor serum s.oudium wshoavallal)le.Tile t. Q Tine a aclted by nicairs nof tue
BXtaz)ledtthf(anma /Q-T obsedrvedoffi e ..
ti-phyAere,iso otd. heRAtiineras).ui Theiiinoraorl Q Tindex xW iti],zC1cltinsiPaiula iistIaitt) 44
awlihtude v181(u1 fortIerunav todithe wxavsanv}il',i-bTude Qxx indxwscalculatediby81~(c in cats of ati
V3 Teprsec (I rice fhc TeIiOlexaornioted and thdexpatiets tee ix idcdu int 35 gro4psTbe pratensivofttnTswv ainloneud18 ratothnie ptwiv
ti)iets loe , ando1(1th Tp~,;iticrttsol ithe 3w, groupsiwase then subdivided on t,ire l)s1s5i5o seruds J)0t1d
AddiTionapeliecmtrocarieograhic Obeseraionsrited 9ui 1epintiervaxvs meeasuriediuto al bittp
innchoplexens)ve 1Intll e alti instancesitewsv i'c-.essarv $8)na iasitt-ill tiell TEacir ofroemthero1).
onsetoftcoi-ettofrinii t itheisolterbeeu
5fE hJis(J,tam--es (in whic ilierew9{lasi)}*fiiiioftSTse
comp>lexe),li<flV t severa iristaticesi({'ft was iiee).
essarx-S t-oa tmeasmf/fv?ctei Q-T in?terva'(l (froni tetO
oR(Ci'ist o't e Q PS(.,ompt.<}{)ex totheI'liit ttli)) be'-}
v-
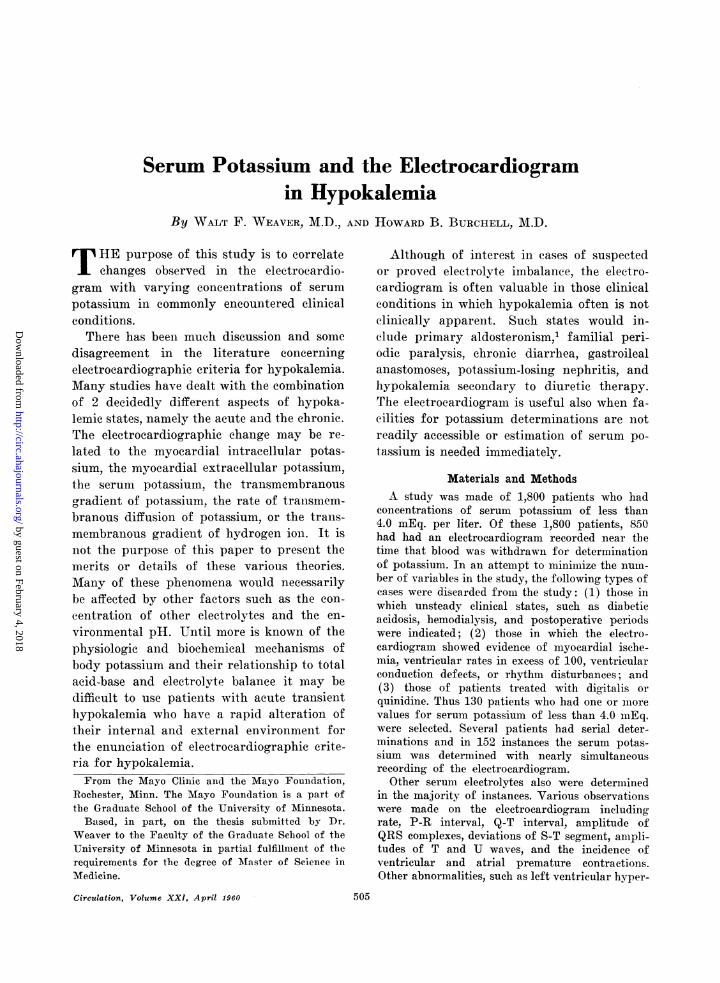
Figure 2I/he (tI/itte fori .serfutt pot15(iium wo((iS 3.1 tEg. ()it/ 22)-5)7 anti 3.s mnEg. on 12-.235-?-)-. The in,verted Tecaves iltf?et(dsXV3 ("'(t8 tV beca(me upright wtithtleoration of seru2m pottss:i(t 888. AllSo tite prominentU '1w(8(T8 088 7-22--57 b)etitltc btiret!J pereeptible on/ 23-5?.
tweeit. tire T arMd U waves as suggested byLei)eselhkiri crd Suniwiez.3 This manaeuverwould of course te1nd t(( mrake the mnecasuredQ-T interval shorter tMnitan e true Q T inter-v\al (fig. 1 Q-1T valuies (orrected forX rate allndsex were1 obtained froin ljepe-,s-c liukir,'s dt:at.aAs a nearrs (ot corpll)arlisol, other norrrtal vaI-nIes friKo'III arl azel tt 's formula0, also
ATeasurenieit of arIpr)litlltues of F arid 1')w ax-es wcas frequiertly (lithdult eltie to lack ofisoeleetr-ie (base-liie) periods ill the electro-canidiogralrr. AVirler this octurre(1 thle IPt g
1ntert was used8 as a referernee point.f'xwo sets of Tpl/R values were calculated
ote fromn the precordial lead wilere tthe higb-est T wave wvas commn'only f'oluidi (uisually1e(id(A and(1 thle other- froilr tfhe left ventric-uil.ar (crnl)lexeS -whiech gavNe thei lairgest T/Rxalnres as1 suggrested by ReynTolds ar1(i assoei-
ResultsApproximatlely lalf of the patients ni the
stundy w,et, 'e clirnically hypertenisive eventttliouoli the initial Select.iMlin Cs oni the basis of'a low coricentetrrtion of serurnt potassiumn. After(ltreftl rev\-iew of the records, it -was nioted1liat ini all. irnstances the abnornmalities onllsist-tart witli liypolklemial eould he observed instnndaudrtl I ea(1 If 11(1d re-ord it1 lead V3.Q-T Abnormalities
'Plhere is grood ex-ideiee that the Q-T indexIs aIt the upper linmits of norirual (table 1). As
Circulation, Volume XXI, April 1,960
5-06
7-22-57 7-23-57
v-3 V-3.
V-51
by guest on February 4, 2018http://circ.ahajournals.org/
Dow
nloaded from
ELECTROCARDIOGRAM IN HYPOKALEMIA
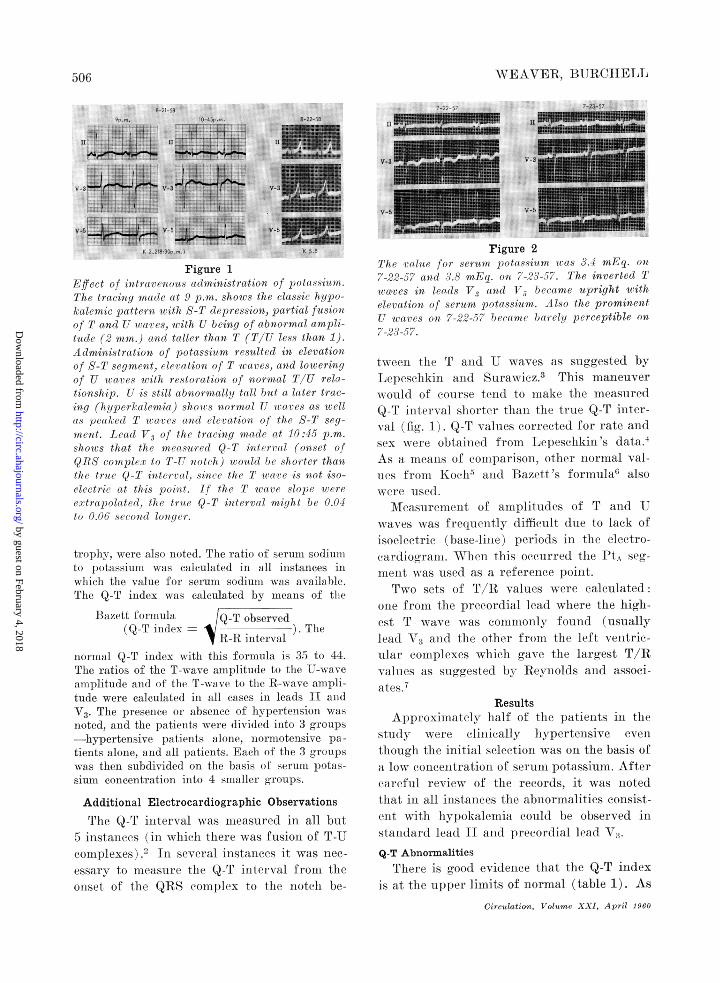
ElectrocardiographicTable 1
Measurements at Varied Serum Potassium Concentrations
Mean values
Ev ^
S EES Q-T intlex T wave (mm.) U wave (mm.) '; cD O = E ; };Mean S.D.* Lead II Lead VI Lead II Lead i:~ (4>
<2.6 16 40.8 5.21 0.6 1.1 1.5 2.0 0.5 0.182.6-3.0 26 44.8 4.38 1.1 3.3 0.6 1.3 -0.06 0.18All 3.1-3.5 65 43.6 3.11 1.2 2.8 0.3 0.7 -0.06 0.17
>3.5 45 42.5 2.91 1.3 3.5 0.2 0.5 0.09 0.17
<3.0 15 46.8 2.66 0.7 2.9 0.6 1.8 0.4 0.17Hyper- 3.0-3.3 19 44.6 3.65 1.0 3.2 0.3 0.9 0 0.16tensive 3.4-3.6 25 43.6 2.67 0.8 4.4 0.3 0.8 -0.1 0.17
>3.6 19 42.8 3.65 1.3 2.8 0.2 0.6 -0.1 0.17
<2.6 12 38.7 4.74 0.6 1.5 1.6 1.9 -0.4 0.19Normo- 2.6-3.0 14 43.3 4.70 1.5 2.8 0.8 1.2 0.04 0.18tensive 3.1-3.5 29 42.7 2.54 1.5 2.1 0.3 0.6 -0.03 0.17
>3.5 19 42.0 2.61 1.7 3.1 0.2 0.3 -0.1 0.17
*Standard deviation.
has been noted, the Q-T index contains a rate-correction factor. If observed Q-T intervalsare to be compared to other normals it isreadily seen that they must be evaluated indi-vidually or expressed as normal, greater thannormal, or less than normal, as seen in table 2.
T-Wave Changes
The voltage of the T waves in leads II andV3 varied as shown in table 1. Inverted Twaves were present in lead II in 13 per centand in lead V3 in 11 per cent of our patientshaving hypokalemia (potassium less than 3.6mEq.) (table 3). There was a paucity ofchronically hypokalenmie patients who hadserial electrocardiograms with simultaneousdeterminations for serum potassium. How-ever, in 2 cases an upright T wave became in-verted as the concentration of potassiumdecreased, and in 3 cases an inverted T wavebecame upright as the conieentration of potas-sium decreased (figs. 2, 3, and 4). The latterphenomenon also may occur as a result of fu-sion of the U wave with the inverted T wave
(fig. 4).Circutlation, Volume XXI, April 1960
U-Wave Changes
U waves were noted in 90 per cent of theelectrocardiograms in this study. U-wavevoltage in leads II and V3 increased as theconcentration of serum potassium decreased(table 1; fig. 1).T-U fusion of all degrees occurred with hy-
pokalemia (figs. 1, and 3 to 6). Some authors3have devised methods for differentiatingnotched T waves from T-U fusion by means ofcomparisons between " QaT and QaU inter-vals. " These measurements were performed inall cases in which they were applicable, but wefound that this is not an infallible method ofdifferentiating a T wave from a U wave. Boththe intravenous administration of calciumand the simultaneous recording of heartsounds are especially helpful technics in de-lineating U waves but they are not availablein retrospective studies such as this.
Relationship of T and U Waves
More important than the actual amplitudeof the U wave is the relationship between theamplitudes of T and U waves. When the T/U
507
by guest on February 4, 2018http://circ.ahajournals.org/
Dow
nloaded from
A0TEANVER, BURCIIE4LL
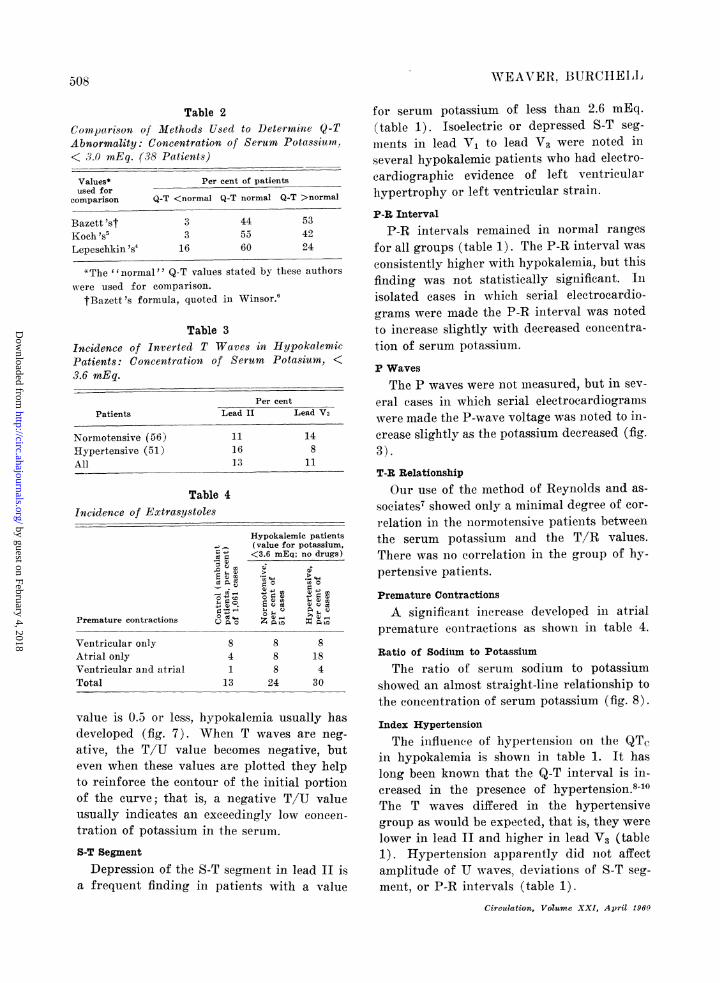
Table 2Compatrison of Methods Used to Determine Q-TAbnormality: Concentration of Serum Potassium.< 3.0( mEq. (38 Patients)
Values* Per cent of patientsused for
comparison Q-T <normal Q-T normal Q-T >normal
Bazett 'st 3 44 53Koch's5 3 53 42Lepeschkin Is4 16 60 24
*The ''normal'' Q-T values stated by these authorswere used for comparison.
1Bazett 's formula, quoted in Winsor.6
Table 3Incidence of Inverted T Waves in HypokalemicPatients: Concentration of Serum Potasiun, <3.6 mEq.
Per cent
Patients Lead II Lead V3
Normotensive (56) 11 14Hypertensive (51) 16 8All 13 11
Table 4Incidence of Extrasystoles
Hypokalemic patients(value for potassium,
; = <3.6 mEq; no drugs)
gIV In 4 *> o0
-
o 41 ~~~~~'-4C
Premature contractions V A z
Ventricular only 8 8 8Atrial only 4 8 18Ventricular anid atrial 1 8 4Total 13 24 30
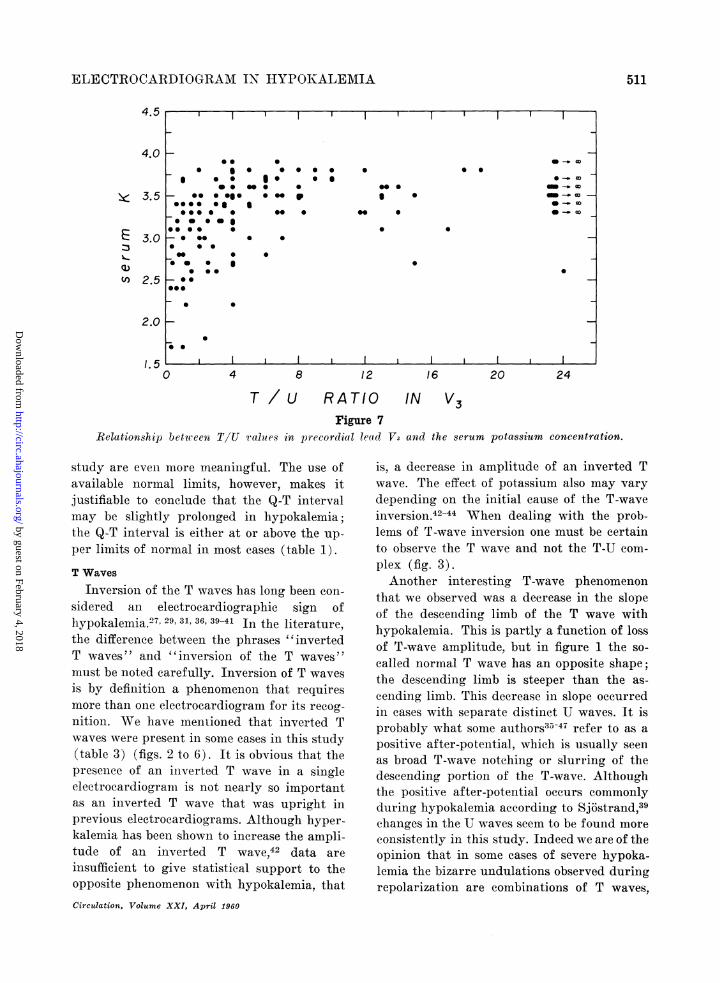
value is 0.5 or less, hypokalemia usually has
developed (fig. 7). When T waves are neg-
ative, the T/U value becomes negative, but
even when these values are plotted they help
to reinforce the contour of the initial portion
of the curve; that is, a negative T/U value
usually indicates an exceedingly low concen-
tration of potassium in the serum.
S-T Segment
Depression of the S-T segment in lead II is
a frequent finding in patients with a value
for serum potassium of less than 2.6 mEq.(table 1). Isoelectric or depressed S-T seg-inents in lead V1 to lead V3 were noted inseveral hypokalemic patients who had electro-cardiographic evidence of left ventricularhypertrophy or left ventricular strain.
P-R IntervalP-R intervals remained in normal ranges
for all groups (table 1). The P-R interval was
consistently higher with hypokalemia, but thisfinding was not statistically significant. Inisolated cases in which serial electrocardio-grams were made the P-R interval was notedto increase slightly with decreased coneentra-tion of serum potassium.P WavesThe P waves were not measured, but in sev-
eral cases in which serial electrocardiograniswere made the P-wave voltage was noted to in-crease slightly as the potassium decreased (fig.3).T-R RelationshipOur use of the method of Reynolds and as-
sociates7 showed only a minimal degree of cor-relation in the normotensive patients betweenthe serum potassium and the T/R values.There was no correlation in the group of hy-pertensive patients.
Premature Contractions
A significant increase developed in atrialpremature contractions as shown in table 4.
Ratio of Sodium to Potassium
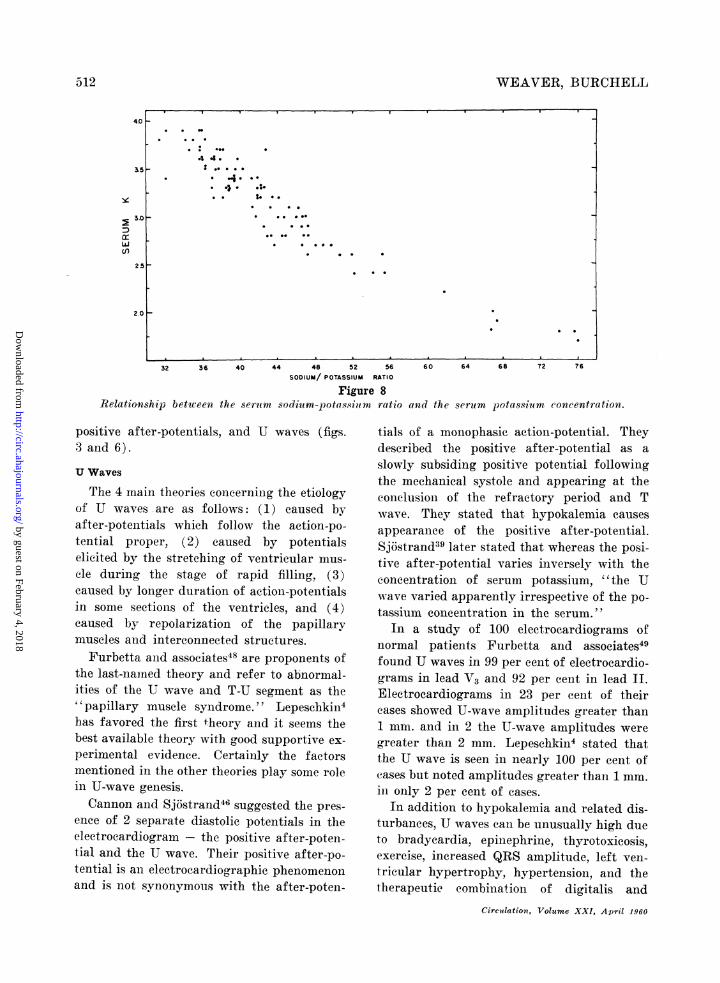
The ratio of serum sodium to potassiumshowed an almost straight-line relationship tothe coneentration of serum potassium (fig. 8).
Index Hypertension
The influenee of hypertension on the QTcin hypokalemia is shown in table 1. It haslong been known that the Q-T interval is in-creased in the presence of hypertension.8-l0The T waves differed in the hypertensivegroup as would be expected, that is, they werelower in lead II and higher in lead V3 (table1). Hypertension apparently did not affectamplitude of U waves, deviationis of S-T seg-ment, or P-R intervals (table 1).
Circulation, Volume XXI, April 1960
50'O8
by guest on February 4, 2018http://circ.ahajournals.org/
Dow
nloaded from
ELECTROCADiI) I( RAM -IN IYPO()KALEM 1 A
3-29-57K 3.3
4-9-57
F! thfV - 5 V 5 ~ ~~ $
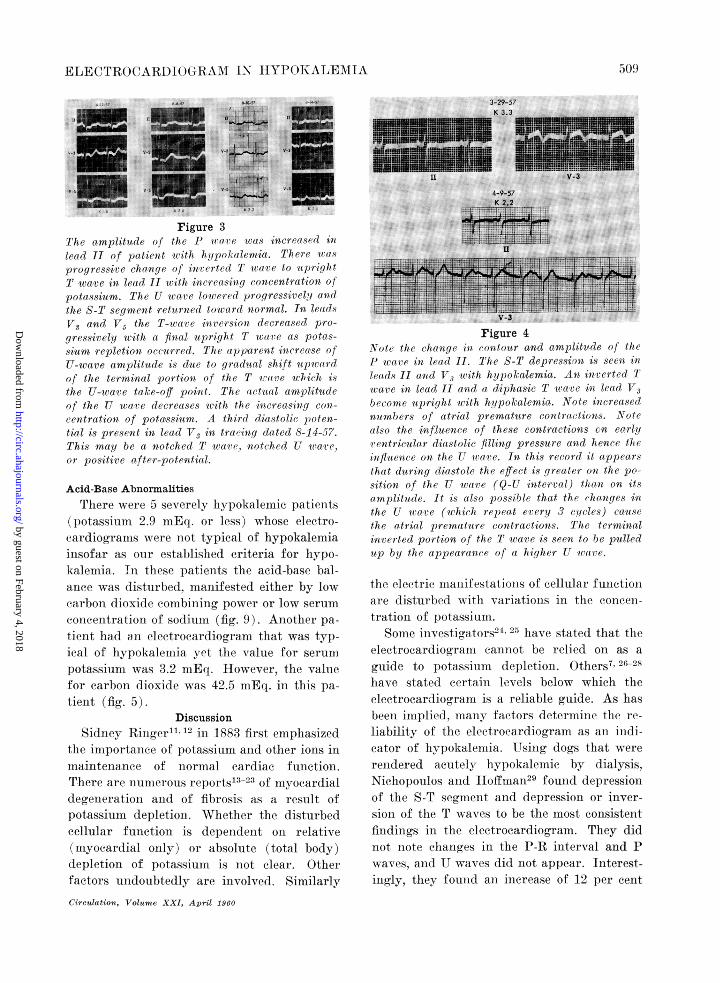
Figure 37r7he (implituvde of' the 7' iraile was increausedl i?zlead 11 of pazticit 1u iih h!ipok.alenwlia. Thzere intsX.progressiv-e chirigce of iwri r tIed T wuare to itpriglitT wave in leac If iithi increaesinqg concentration oa!
potassium. T/ie U awreiculucred progressivelyj a id
the S T segnient returnted tow,ard normal. In leads
VT and V, the T-w'nac in r ersion decreased pro-
gressively urith a fina] uprig/it woare as potas-
s tiu replctioai acr cvi'd. 7Ther upp)vjri'(IWt increase rif
U-weare anipijlitule is du(e to gr-adual shift utpicardfcof the terrniiial pJortioai (f thfe T r rc u/hiich isthe U-warae tacke-aJJ pointt. T'he itfual amplittudeof the U war e decrerises wv.ith thec increascingl con-
centratiotn of pota,ssiuvi. A third diastolic poten-tial is present in lead V, in traciig datedi 8-11-5- 7.
This mnal be a notchedc T ware,i)iotchcd U cre,or. positir C aftcr-pateltiril.
Acid-Base Abnormalities
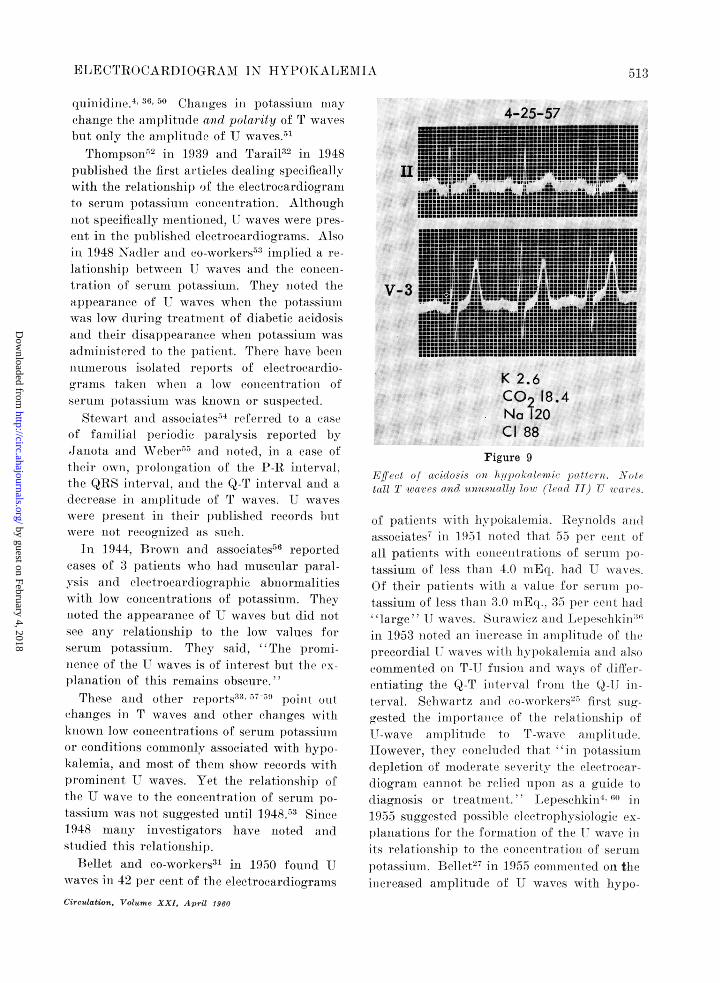
There were 5 severely hiypoka1emiri patients
(potassium 2'.9 mlEq. or less) rwhose eleetro-cardiogramns were niot typical of hypokalemiainsofar as onir established criteria for hypo-kalemia. TIl these patients the acid-base bal-anee was distu.rbed, manifested either by low
carbon-0 dlioxidc ronmbll)ing powerI or low serum
coiieentrationi of sodiumin (fig. 9) Another pa-
-ien;t had an e]ectroca rdiogram that was typ-iral of hy pokalhnida yet the vaisie for serum
potassiulml was 3.2 mnEt. Ilowever, the valuefor carbon dioxidc was 42.5 mEq. in this pa-
tienIIt (fig, 5)Discussion
Sidniey Ringer112 in 1-883 first, emphasized
the importance of p?otassium ani(d other ions in
maintenance of iiorinal cardiac fu-nction.There are numerons re)(rts'1323 ()if i1vocardialdecgeneration and of fibrosis as result ofpotassiunsi depletioni. WVhether tle ldisturbedcellular function is dependent o0t relative
(ns1yocardial only) or- absolute (total body)
dlepletionl of l)otassiumi is Iot clear. Other
factors undoubtedly are inv\,olv,ed. Similarly
Circulation, Volumnte XXI, April 1960
Figure 4N ate the ch/iiige ii con)tour and amplitfude a] t/heP' iora ivi lcod II. The S-T depression is seen iiiP rids 11 rind V" with /iijpoacalemia. An iucerted Tware in lead I tand a diphasic T t .ccve in lea( V1become upright wiith hypokalemtia. Note increasedunumbers of atrial premature contractionsts. Notc
ailso thte influence of these contractions cn earlyen? tricular dicstolic filling pressure and hence 1/ic
influence an thc U ware. In th1s recor-d it cipptcirsth-at diiring (diastole the effect is greater on t1ie pa--sition of the U wrare (9-U innterva1l) than on itsamplitnd.e. It is cilso possible that the changes in'the U wart,e (wchich rcpeat ereriy 3 cilcles) causethe oitriol premiature contractions. 7T/e terminalin vcrtcd portion of the T nia-ve is seen to be pulledup by the appearance of ai higher UT ware.
tthe eleett ie mitanifestations of cellular funetion1are disturledl with variationts irn thie coneet-tration of J)otassimll.
Somjje injvestig(atrs-'4 have stated that theeleetrocar(liogriatn cannot be relied on as aguide to potassium depletion. Others7' 2 -28
lhave statedl certaini levels below which theelectrocardiogramn is a reliable guide. As hasbeen irmplie(ld. mlanyil- facltors, dletermiiine the 1'e'
liabilitv of thc eleetrocardiogramn as ant iid(li-eator of hypokalecnia. Using (logs that wererendered acutely liypokalemie by (lialysis,Niebhopoulos anid Iloffinai12'. foulnd depressionof the S-T segmlient aid depressioni or inver-sionI of the T waves to be the most conisistenitfitndin-gs inl the electrocardiogram. They didntot note chang( es in the 1}-R interval and Pwaves, antIJUwaves didl niot appear. Initerest-ingcrly, they found ani incerease of 12 per cenit
509)
IL
by guest on February 4, 2018http://circ.ahajournals.org/
Dow
nloaded from
0WEAVE-R, IWTBIIELI4
4-4-57.Em_.v...*,,+dF, ,t|t....._..$.
H+ LS[i -+F - +.P-
V-3 rzz- i=itLIt L+mrF7es 1m74T
Ltj= j j=__:_,.....' t'K 3.2meq.CO2 42.5Na 135Cl 76
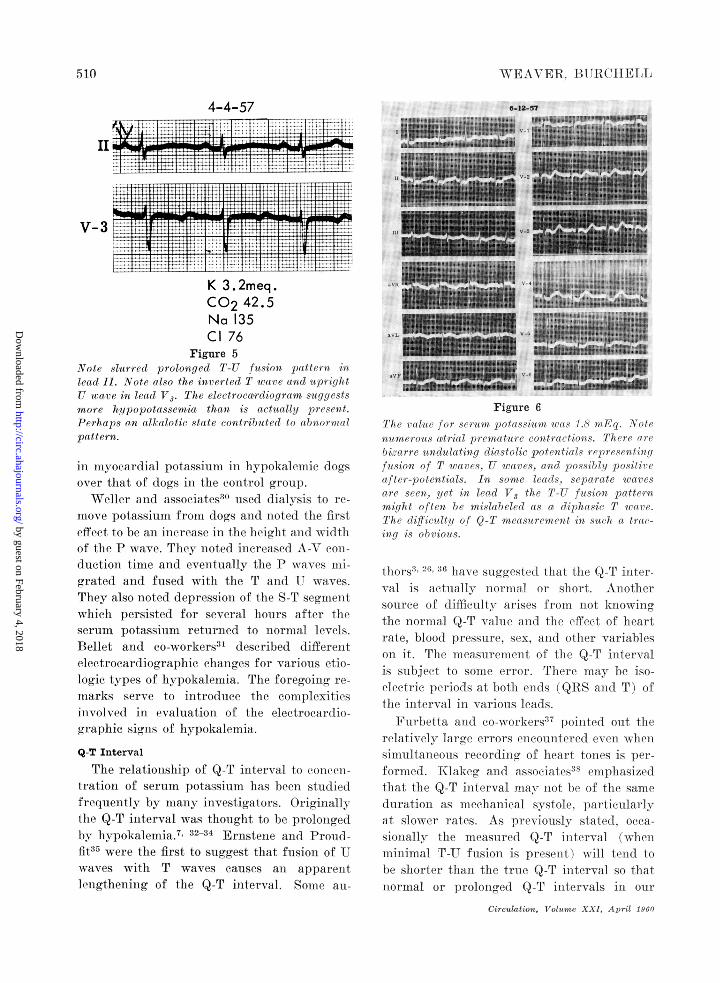
Figure 5Note slurrc4 proloniged T-11 futsionil pattern inh(a?ad 11. Note also the i;mrerredtt T ware and uprightU wave in lead V3. 7The elect rocacrdiogram suggtlestsmor e h7qpopotasseriaM thanm is ctuailly prefsrf.Perhaps an alkvalotie state eoni tributcd to abnor-1malpattern.
iaImyocardial potassium inM_ hvpokaldennle dog,sover that of dogs in the coIntrol gr'oup.
Weller and assoeiateS30 nised dildvsis to re-mo1(ve potassmniin from (logs and ilote1 thle firsteRfect to le an increase iMl the leltalt, lz iItwithof the P wave. Thiey notedI incereaised A-'V onidtletioii time andi eventually the P wtav('s mi.-
grated aindi fused with the T andI 1U waves.Thhey also noted depresslon of the S-T segmenltwhiehl persisted for sev\eral houirs after t1heserum potassi;um returned to niormnal levels.Bell-et anti co-nworkersn d eseri b)ed (llfferei-itei ee rocard io)grJlLr ie ehaiiges for various etio-logie types of hypokalemiia. The foregoingC re-marks serve to introduec the- complexitiesinvolved in evaluation of the eleetroealrdio--rraphic sihutis of hypokalemnia.
Q-T IntervalThe relationishlilp of Q-T intervatl to c.,otccii-
tration of serumn potassium lhas been studie(ffrequently by many inivestigators. Originally-thle Q-T inlterval was thiouight to be prolonlgedbvy hvpokaletnia. 32 34 Ernstene and Proudilt:35 were the first to suggest that fusioni of Uwaves witlh T waves causes ani apparentlejngtheningcr of tlhe Q-T interval. Somiie au-
0-12-57
tl v z9 E~~~~~m'~tlo"~'~49Vr ~AP,I.Egg
;L 9V4 qAi
aVL v-5>
Figure 67'/l r0l,c for 1/)serpottissitwn :w(s 1.,5 ttl t. Noteo tMerioos atriul prlntaturtconr(is.Lrcr
)i, arre undulating (diastolic pottti'als'rtprrseiitin(fusion of T arts,s, UJ a ters, (111 possibly post/iljot(aftr -poteutials. In Sonic ISetlsCparate wavrtsarc scenli, ilet in. lead V3 the 7T U-1 fusion pattern",might often beIn' 7niltld)C(Is ad(ij)71i'ip sie 7" wa(r.The difliculty of 9 T /nCasuren/tt in sutli a tr -;il/f zlsj5h 0obriont.
tioiQ'; it>iave stiggestei tliat t-hie Q-T ittel -
val is atlnaflxl nornetl o1 shiort. Anotherso11cle of diffilcltltx arise's; from not knowinathe norm]al (QQT value aild 11)e- effect of heartiate. blo)0(1 l)1essire1i, 5(sx, and oftlhtr vatvsriableson, it. Ilic measurem.ent of thie QrT int ervlAT1is slibije'et to 50l/' (1r101'. 'I'lltei 111aibi isoielct''ric petiods at 1)011ll enls (QRS anEmd T) oftlhe interval in vairious leads.Fu rhetta and p(oworkcr' pointed ouit tt1
relavtiveirIn1gc er'r'ors eneouitrtedel ('vei l e
simuiltaneous recordingr of hcart ton-ies is per-formned. 1R lakegr and associalt eQ (1(lIl)asiz(dthlat thie Q-T interval romar niot 1/ (of the same(Itiration as miechianical svstole, j)al't i('ularlvat slowver rates. As previously sttatedl o0caef-sionallv the i-easiured Q-T intc-ti'al (whienmin,;imial T- T fusioi is present-) AN-ill 1(11(1 toh)e shiorter titan- thie tril/ Q-r itinterval so thatnormal or prolonged Q ll intervals in our
Circulatin, T'oluvm XXIA, tpril 1960
F-F-
51-0
by guest on February 4, 2018http://circ.ahajournals.org/
Dow
nloaded from
ELECTROCARDIOGRAM IN HYPOKALEMIA
4.5
4.0 F
3.5
Q)
(I)
3.0
2.5
2.0
/.50 4 8 12 16 20 24
T / U RATIO IN V3Figure 7
Relationship between TIU values in precordial leacd V3 and the serum pota,ssium concentration.
study are even more meaningful. The use ofavailable normal limits, however, makes itjustifiable to conclude that the Q-T intervalmay be slightly prolonged in hypokalemia;the Q-T interval is either at or above the up-
per limits of normal in most eases (table 1).
T Waves
Inversion of the T waves has long been con-
sidered an electrocardiographic sign ofhypokalemiaY7' 29 31 6 3941In the literature,the differenee between the phrases "invertedT waves " and " inversion of the T waves "must be noted carefully. Inversion of T waves
is by defin-ition a phenomenon that requiresmore than one electrocardiogram for its recog-
nition. We have mentioned that inverted Twaves were present in some cases in this study(table 3) (figs. 2 to 6). It is obvious that thepresenee of an inverted T wave in a singleelectrocardiogram is not nearly so importantas an inverted T wave that was upright inprevious electrocardiograms. Although hyper-kalemia has been shown to increase the ampli-tude of an inverted T wave,42 data are
insufficient to give statistical support to theopposite phenomenon with hypokalemia, that
Circulation, Volume XXI, April 1960
is, a decrease in amplitude of an inverted Twave. The effect of potassium also may varydepending on the initial cause of the T-waveinversion.42 44 When dealing with the prob-lems of T-wave inversion one must be certainto observe the T wave and not the T-U com-
plex (fig. 3).Another interesting T-wave phenomenon
that we observed was a decrease in the slopeof the descending limb of the T wave withhypokalemia. This is partly a function of lossof T-wave amplitude, but in figure 1 the so-
called normal T wave has an opposite shape;the descending limb is steeper than the as-
cending linmb. This decrease in slope occurredin cases with separate distinct U waves. It isprobably what some authors35 47 refer to as a
positive after-potential, which is usually seenas broad T-wave notching or slurring of thedescending portion of the T-wave. Althoughthe positive after-potential occurs commonlyduring hypokalemia according to Sjdstrand,39changes in the U waves seem to be found more
consistently in this study. Indeed we are of theopinion that in some cases of severe hypoka-lemia the bizarre undulations observed duringrepolarization are combinations of T waves,
l l K 1
S. .0 0 005- * e.g * e * * *
S@ 0 *5 _
*... 0. 0 . 0
* 00*@
0 @0 0
- 0@
* 0
0
l0 l
511
by guest on February 4, 2018http://circ.ahajournals.org/
Dow
nloaded from
WEAVER, BURCHELL
(.0
cr
n
32 36 40 44 48 52 56 60 64 68 72 76SODIUM/ POTASSIUM RATIO
Figure 8Relationship betwveei the serum sodium-potassiuim ratio anrld the serum potassiuim concentration.
positive after-potentials, and U waves (figs.3 and 6).
U Waves
The 4 main theories concerning the etiologyof U waves are as follows: (1) caused byafter-potentials which follow the action-po-tential proper, (2) caused by potentialselicited by the stretching of ventricular mus-cle during the stage of rapid filling, (3)caused by longer duration of action-potentialsin some sections of the ventricles, and (4)caused by repolarization of the papillarymuscles and interconnected structures.
Furbetta and associates48 are proponents ofthe last-namned theory and refer to abnormal-ities of the U wave and T-U segment as the" papillary muscle syndrome." Lepeschkin4has favored the first theory and it seems thebest available theory with good supportive ex-perimental evidence. Certainly the factorsmentioned in the other theories play some rolein U-wave genesis.Cannon and Sj6strand46 suggested the pres-
ence of 2 separate diastolic potentials in theelectrocardiogram -the positive after-poten-tial and the U wave. Their positive after-po-tential is an electrocardiographic phenomenonand is not synonymous with the after-poten-
tials of a monophasic action-potential. Theydescribed the positive after-potential as aslowly subsiding positive potential followingthe mechanical systole and appearing at theconclusion of the refractory period and Twave. They stated that hypokalemia causesappearanee of the positive after-potential.Sjostrand39 later stated that whereas the posi-tive after-potential varies inversely with theeoncentration of serum potassium, "the Uwave varied apparently irrespective of the po-tassium concentration in the serum."
In a study of 100 electrocardiograms ofnormal patients Furbetta and associates49found U waves in 99 per cent of electrocardio-grams in lead V3 and 92 per cent in lead II.Electrocardiograms in 23 per cent of theircases showed U-wave amplitudes greater than1 mm. and in 2 the U-wave amplitudes weregreater than 2 mm. Lepeschkin4 stated thatthe U wave is seen in nearly 100 per eent ofcases but noted amplitudes greater than 1 mm.in only 2 per cent of cases.
In addition to hypokalemia and related dis-turbances, U waves can be unusually high dueto bradyeardia, epilnephrine, thyrotoxicosis,exercise, increased QRS amplitude, left ven-tricular hypertrophy, hypertension, and thetherapeutic combination of digitalis and
Circulation, Volume XXI, April 1960
5-12
by guest on February 4, 2018http://circ.ahajournals.org/
Dow
nloaded from
IE(CITRo(C'ARI)10Of-'I A1 IN ITYPl)IFALEIAl51
quiniidiuej' ' * Changres inl p)otassiullm ]II(IV7change the amlplitli(le 011(1 polarity of j wX\l(eSbut oinly the amiiplitulde of J17 waves.ThoprLpSO,1n52 ill 1-939 anld Tarail32 in 1948
1)ublished the first arti(els dealinig specifle all,with the relationshil) of the electroeardiograimto seruImI Jotassium(in o(ncentration. Althoiuglini-ot; speclficallv 1t11tettotined,-I waves were p)l'es-en:t i1 thlle published eleetroeardiowrams. Alsoin 1.948 NaIler anid o-workerS'3 implied( a rc-lationTship ltt-{t'ettll I. waV\''es atl(l the (ollcetll-tration of serum potassium. 1'liev itoted( thea)ppearance of V' Nwaves when the ])otassilutttwvas low (lur-ing treatm111ent of diabetic a(cido,;isanid their disappear'an(e(, wheit p)otassil-uml wavzsadmttitiistere(l to the juttietit. I'liert iaxve beenmittt)erous iSolat('i IepJ)ot s of electir(oadio()-gtlcals tatkent wheti a low eoneentrl-ation of-serum potassiniti was kniowIn or1 sus1)ected.
Stewa-rt at associates'- r-eferred to a (cst'of familial ieriolic ])aralvsis reported Lv.ianola}tcl andl(l Wcber51 att((l toited. in-i a case oftheir. oxit,1p1tololtgatioll of the [- 11 interval,the QIIS intterval, aid the Q-T initerval andadilectas-e iii amlf)litude of T waves. TJ ivavesNiv?ere presetit iii tltei r' /ml)listhel recortIs 1/litwere nlot r-ecog)nized as Sitch.
In 1 944, Brtowni ani associates5"1i3 reportedleases of' 3 Iatients whio had muscular paral
ysis aitil etroca(hiiogra pic abnormalitie-sxx ith1 l(W concentratir]fons of )otassium. Theytioted the alp)(earatcee of U wave;s 1but didi itotsee anty relationship to the low values forserim potassiumti. They said, ''The, proi-tuceice of thle 1 wvess of initeres't but the ex-
p)1anatioit of this remi.a1ins obscure.TJhes aitiul othei-r tejrs '- T'pilnt oit
chalt(aes inl ' wx-aves and)(1 othler chatiges -withkIi oxvn low v'onoetitratioius of s0runu l)otassi nunor eonditiotS ( 101monlyass,11,oe(-iated witlh hiy)o)kalemia, and mnost of them show recordis withpromiute.ttt IT waves. Yet the relationshi;) ofthe TJ wave to the coi-teettration of serum p)o-tIassimn was niot suggestedl urntil 1948 Sin(c(e1948 man- investigators hav\7e tioted aidstudied this; relation1ship.
Iellet and eo-workers" in 1950 foun11d IJwvaves uti 42 per eeiit of thte ehectroeardiogramusCirculation, Volume XXI, April 1960
4-25-57
II
V-3
K 2.6Co2 18.4Na 120Cl 88
Figure 9ICI/ect of aocidosi /)i/ hYp /Hjo/ltc))tall1 7' waves.|tc anwd m?.?(S?I,?hfloaJ1Me ,1 11) IT7r@ {ivs.
of p/alietits xw ithl hlpoka'lelttia. Rextollds attdasSc iates7 itI 1 951 itoled t Itat 5-) per ( () f
all patiettts with coitteett ratiotus of serum I)(1)tassiuni of h'ss tfliat 4.0 It/. Itd1-I wiaes.Of their patitits wNitlt a value i')r se1n111t1 /()-tassiuiim of less than 31) ml]q.. 8?5 p)ei' cent fia/lare'e I ayeAS. S Irawi oz antI I tlp)/s/'h kittI
in 1953 notedl atn itt(erease ill atttllititl/' of' It'precordial. 1wxv/xith. lx pokalcutia41 atid alo,commented ott T-lr fusioXtl ait(o waxs /f differet]tiating ti/ Q-T it/vval fromo ith (Q-17 ill-ter'val.. Seltilxrtz aitoh c()-workn"'ts first sug1-gIoested thle itllm)ot'tai'e (of the ielat i/finsip (/1I-wave atiplithIdle to l1'wave antpt111.[ld.Ifiowever, tlt'v (-on/ltl( ed thiatf 'in potassIIIItdlepletion oh tboderlat/ s/v/'vt'itx Ilit (le/tit//t'at(liograii canttot be r/liedI tipoi as, a grilde f/)tliaguiosis 01' treatiutett. L'e'1peseltin- in1955 suggro'sto'd possible, elecoxyslgiplatations for0 the forutiatiotn of the V wa V/ illits relation-slii) to the eotcnt ration of sent topotassium. l3ellet-2 ill 19)55 eoit/nted oil tlt'uttereascol amplitude of UJ wva-ves with h-YPO-
.5, ,3
by guest on February 4, 2018http://circ.ahajournals.org/
Dow
nloaded from
WEAVER, BURCHELL
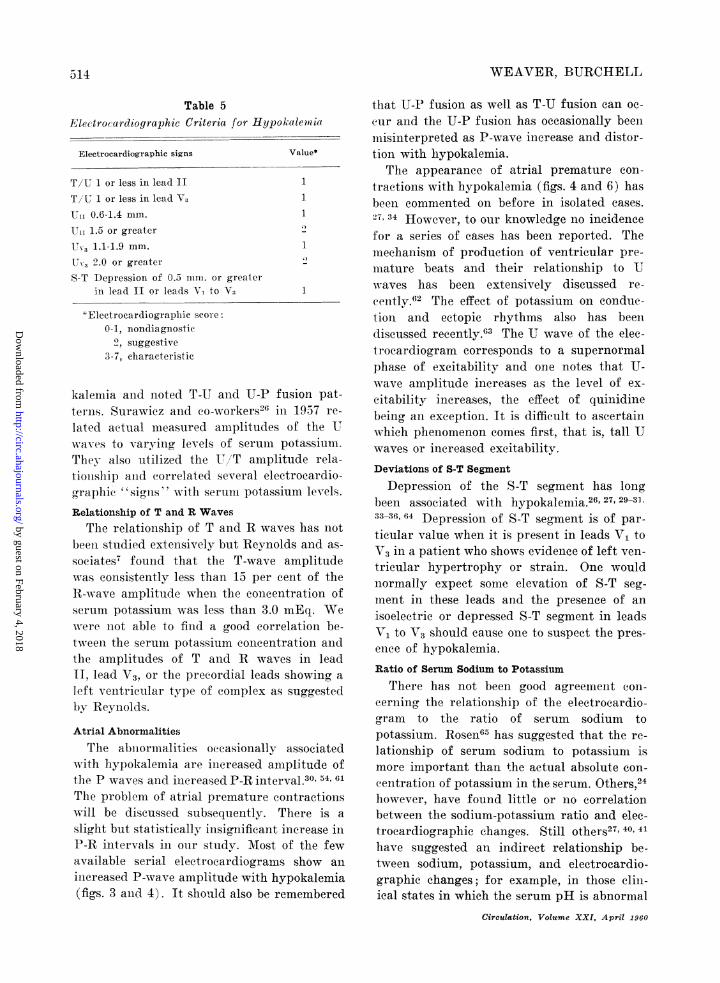
Table 5Electrocardiographic Criteria for Hypol
Electrocardiographic signs
T/U 1 or less in lead II
T/U 1 or less in lead V3
UII 0.6-1.4 nim.
U1, 1.5 or greater
UlV. 1.1-1.9 mm.
U-v 2.0 or greaterS-T Depression of 0.55 nim. or greater
in lead II or leads V, to V3
*Electrocardiographic score:0-1, nondiaglnostic
2, suggestive3-7, characteristic
kalenmia and noted T-U and U-P f-uterns. Surawiez and co-workers26 inlated actual mieasured amplitudeswaves to varying levels of seruin pThey also utilized the U/T amplittionship anid correlated several eleegraphic "signs"' with serum potassiiRelationship of T and R Waves
The relationship of T and R wavebeeni studied extensively but Reynol(sociates7 found that the T-wave <was consistently less than 15 per CER-wave amplitude when the eoncenserum potassium was less than 3.0 i
were not able to find a good corretween the serun potassium cooneentrthe amplitudes of T and R waverII, lead V3, or the precordial leadsleft ventricular type of comnplex asby Reynolds.
Atrial Abnormalities
The abniormalities occasionallywith hypokalemia are increased amthe P waves and inereased P-R internThe problem of atrial premature co:will be diseussed subsequently. Tslight but statistieally insignrifieant iP-R intervals in our study. Most aavailable serial electrocardiogramsinereased P-wave amplitude with hy(figs. 3 anid 4). It should also be re
that U-P fusion as well as T-U fusion can oc-walecmi(i cur and the U-P fusion has occasionally beeni
muisinterpreted as P-wave increase and distor-Value* tion with hypokalemia.
The appearance of atrial premature con-1 tractions with hypokalemia (figs. 4 and 6) has1- been commented on before in isolated cases.1 27, 34 However, to our -knowledge no incidence
for a series of cases has been reported. The1 muechanism of production of ventricular pre-
mature beats and their relationship to U
1 waves has been extensively discussed re-
cenltly.62 The effect of potassium on conduc-tion and ectopic rhythms also has beendiscussed recently.63 The U wave of the elee-trocardiogram corresponds to a supernormalphase of excitability and one notes that U-wave amplitude increases as the level of ex-
ision pat- citability increases, the effect of quinidine
o1937 re- being an exception. It is difficult to aseertain
of the U which phenomenon comes first, that is, tall U
)otassiune l waves or increased excitability.tude rela-trocardio- Deviations of S-T Segmentum levels. Depression of the S-T segment has long
been associated with hypokalenmia.26 27 29 3133-36, 64 Depression of S-T segment is of par-
es has not ticular value when it is present in leads V1 to
sanpliudea 3 in a patient who shows evidence of left ven-mpltudfthe trieular hypertrophy or strain. One wouldtraont ofte normally expect some elevation of S-T seg-
ment in these leads and the presence of anmEq. We isoelectric or depressed S-T segment in leadslation be- V1 to V3 should cause one to suspect the pres-ation and ence of hypokalemia.s in lead
Ratio of Serum Sodium to Potassiumshowingr a
suggestel There has not been good agreement con-cerning the relationship of the electrocardio-gram to the ratio of serum sodium topotassium. Rosen65 has suggested that the re-
associated lationship of serum sodium to potassium isplitude of more important than +he actual absolute con-val.30' 34, 61 centration of potassium in the serum. Others,24ntractions however, have found little or no correlation'here is a between the sodium-potassium ratio and elec-nerease in trocardiographic changes. Still others27 40, 41)f the few have suggested an indirect relationship be-show an tween sodium, potassium, and electrocardio-
pokalemia graphic changes; for example, in those cliii-membered ical states in which the serum pH is abnormal
Circulation, Volume XXI, April 1960
514
by guest on February 4, 2018http://circ.ahajournals.org/
Dow
nloaded from
ELECTROCARDIOGRAM IN HYPOKALEMIA
HYPEkTENS1VE PATIENTS
0 1 2 3 4 5 6 7
NU?1BER 0F POSITIVE SIGNS (E.C.G.)rigure 10
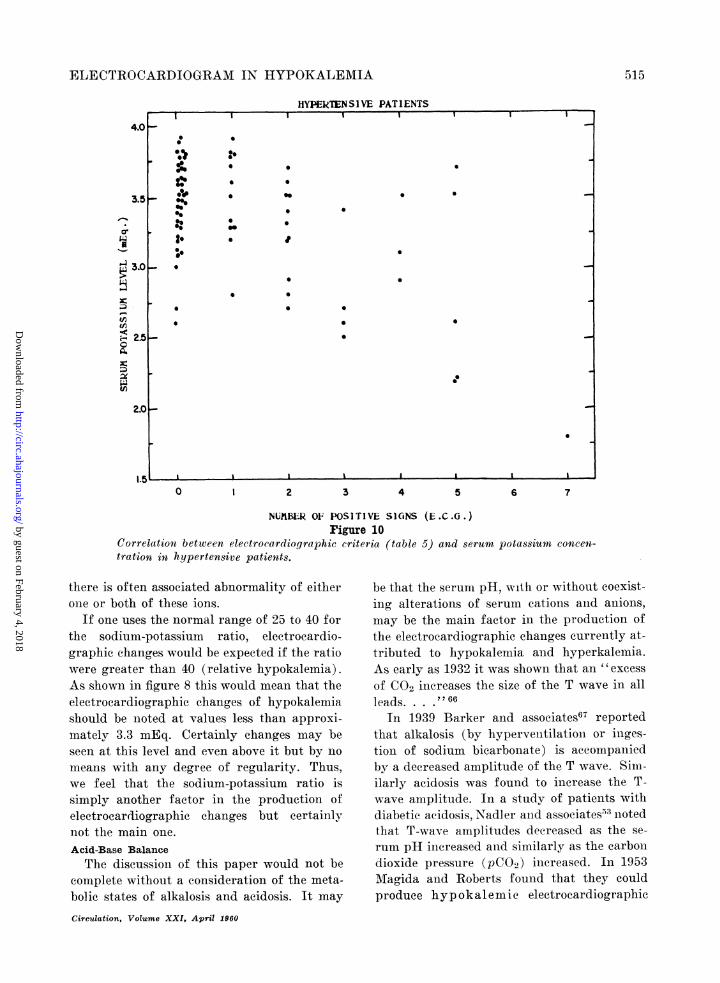
Correlation between electrocardiographic criteria (table 5) and serumn potassium concen-tration in hypertensive patients.
there is often associated abnormality of eitherone or both of these ions.
If one uses the normal range of 25 to 40 forthe sodium-potassium ratio, electrocardio-graphic changes would be expeeted if the ratiowere greater than 40 (relative hypokalemia).As shown in figure 8 this would mean that theelectrocardiographic changes of hypokalemiashould be noted at values less than approxi-mately 3.3 mEq. Certainly changes may beseen at this level and even above it but by nomeans with any degree of regularity. Thus,we feel that the sodium-potassium ratio issimply another factor in the production ofelectrocardiographic changes but certainlynot the main one.Acid-Base BalanceThe discussioni of this paper would not be
complete without a consideration of the meta-bolic states of alkalosis and acidosis. It may
Circulation, Volume XXI, April 1960
be that the serum pH, with or without coexist-ing alterations of serum cations aind anions,may be the main factor in the production ofthe electrocardiographic changes currently at-tributed to hypokalemia and hyperkalemia.As early as 1932 it was shown that an "excessof CO2 increases the size of the T wave in allleads. . . .'2 66
In 1939 Barker and associates67 reportedthat alkalosis (by hypervenitilationi or inges-tion of sodium bicarbonate) is accompaniedby a decreased amplitude of the T wave. Sim-ilarly acidosis was found to inerease the T-wave amplitude. In a study of patients withdiabetic acidosis, Nadler and associates53 niotedthat T-wave amplitudes decreased as the se-rum pH increased and similarly as the carbondioxide pressure (pCO2) increased. In 1953Magida and Roberts found that they couldproduce hyp okalemic electrocardiographic
5515
by guest on February 4, 2018http://circ.ahajournals.org/
Dow
nloaded from
WEAVER, BURCHELL
NORkfOTENSI VE PATIENTSI I I
0 1 2 3 4 5 6 7
NU3BEIk 0F POSITIVE SIGNS (L.C.G.)
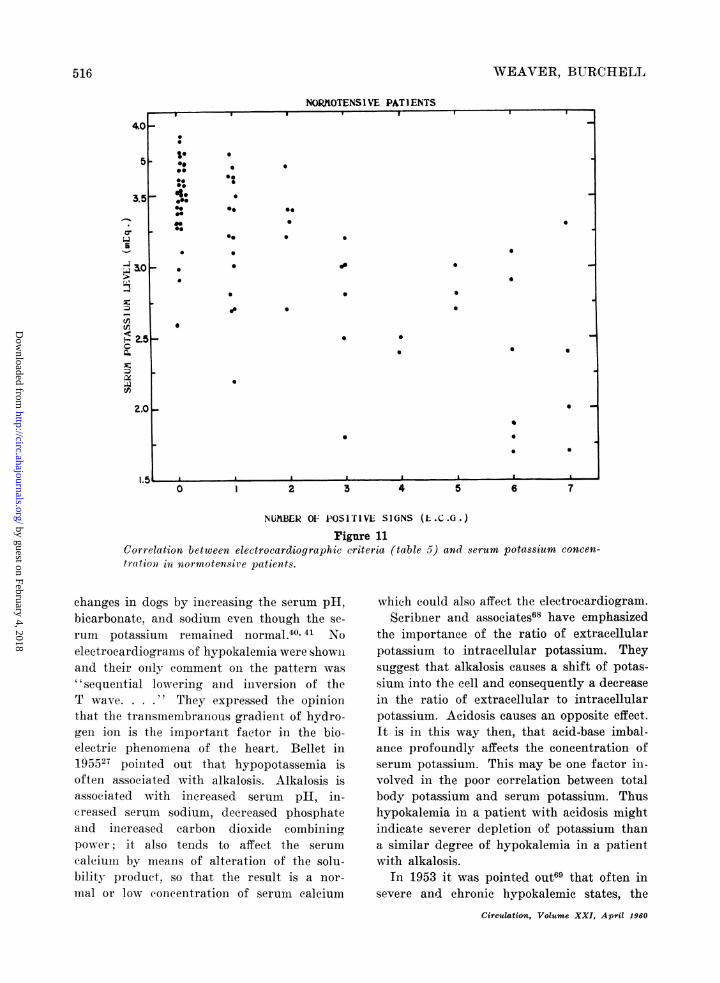
rigure 11Correlation between electrocardiographic criteria (table 5) and serum potassium concen-
tration in normotensive patients.
changes in dogs by inereasinig the serum pH,bicarbonate, and sodium even though the se-
rum potassium remained normal.40' 41 Noelectrocardiograms of hypokalemia were shownand their only comment on the pattern was
" sequential lowering and inversion of theT wave. They expressed the opinionthat the transmembranous gradient of hydro-gen ioln is the important factor in the bio-electric phenomena of the heart. Bellet in195527 pointed out that hypopotassemia isoften associated with alkalosis. Alkalosis isassociated with increased serum pH, in-creased serurn sodium, decreased phosphateaind inereased carbon dioxide combiningpower; it also tends to affect the serum
calciuin by means of alteration of the solu-bility product, so that the result is a nor-
mal or low concentration of serum calcium
which could also affect the electrocardiogram.Scribner and associates68 have emphasized
the importance of the ratio of extracellularpotassium to intracellular potassium. Theysuggest that alkalosis causes a shift of potas-sium into the cell and consequently a decreasein the ratio of extracellular to intracellularpotassium. Acidosis causes an opposite effect.It is in this way then, that acid-base imbal-ance profoundly affects the concentration ofserum potassium. This may be one factor in-volved in the poor correlation between totalbody potassium and serum potassium. Thushypokalemia in a patient with acidosis mightindicate severer depletion of potassium thana similar degree of hypokalemia in a patientwith alkalosis.
In 1953 it was pointed out69 that often insevere and chronic hypokalemic states, the
Circul4tion, Volume XXI, April 1960
516
4~0
5
C-1
-A
2.5c
;XjaZ.
2.0
1* *00@00
_ 4..00
*.
00
*0 0 0
0.
*. * 0
*00* 0
* 0 0
000~~ ~ ~ ~
00
0 * *
00~~~~~~~~~~~
* 0
* 0
. ._LFS, I
IF
by guest on February 4, 2018http://circ.ahajournals.org/
Dow
nloaded from
ELECTROCARDIOGRAM IN HYPOKALEMIA
electrocardiogram may not return to normalfor more than a week, even though the reple-tion of potassium seems to have been wellmanaged. At that time it was suggested thatperhaps this was due to some organic changein the myocardial cells - perhaps similar toorganic changes produced by experimentalpotassium deficiency.
In a report of a case of primary aldoster-oniism van Buchem70 noted that after removalof hyperplastic adrenal glands the serum po-tassiumn returned to normal in several days.However, the electrocardiogram showed typ-ical hypokalemic changes for 5 weeks. It wasthen mentioned (without implying a relation-ship to the electrocardiogram) that acid-basebalance and carbohydrate metabolism did notreturn to normal for "several weeks." In ourown series the marked electrocardiographiceffects of acid-base equilibrium are clearlyshown in a few cases in which carbon dioxidedeterminations were available (figs. 5 and 9).
In the past it has not been clear why dif-ferent patients with the same concentrationlevel of serum potassium show different elec-trocardiographic changes. Bellet27 has sug-gested that because the normal concentrationof serum potassium71 of patients varies from3.6 to 5.6 mEq., a patient with a normal valuefor potassium of 5.5 mEq. would, in a relativesense, be more deficient at a level of 3.4 mEq.than would a patient with a normal value forserum potassium of 3.7 mEq. Such an explan-ation does not obtain, however, when one con-siders electrocardiograms and serial serumpotassium changes solely in the hypokalemicranges.
It has also been suggested that the rate ofchange of serum potassium is important, but,as was indicated in our method of procedure,this factor was minimized in our study.Ringer'2 in 1883 showed similar effects of ru-bidium and potassium on the heart. Tarail72recently suggested the importance of this andother trace elemenits as possible additionalfactors in electrocardiographic changes seenwith hypokalemia. Young and Daugherty,73usinlg hemodialysis to accomplish acute potas-sium depletion, showed that S-T depressionCirculation, Volume XXI, April 1960
NORMOTENSIVE PATIENTS
1000ooTO
GROUPS OF HYPOKALEMIC PATIENTS
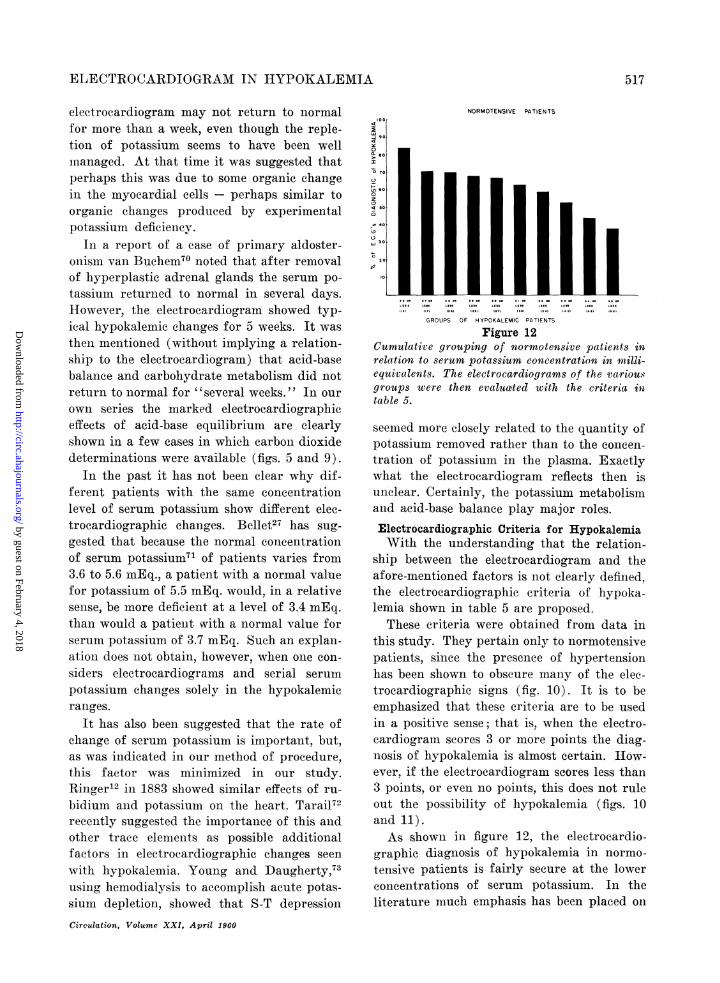
rigure 12CumulativXe grouxping of normotensive jpat-ienis inrelaxtion to serum potassiumn concentration in meilli-equlivalents. The electrocardiograms of the vatriou.sgroujps were then evaluatted with the criterial intable 5.
seemed more closely related to the quantity ofpotassium removed rather than to the concen-tration of potassium in the plasma. Exactlywhat the electrocardiogram reflects then isunclear. Certainly, the potassium metabolismand acid-base balance play major roles.
Electrocardiographic Criteria for HypokalemiaWith the understanding that the relation-
ship between the electrocardiogram and theafore-mentioned factors is not clearly defined,the electrocardiographic criteria of hypoka-lemia shown in table 5 are proposed.
These criteria were obtained from data inthis study. They pertain only to normotensivepatients, since the presence of hypertensionhas been shown to obscure many of the elec-trocardiographic signs (fig. 10). It is to beemphasized that these criteria are to be usedin a positive sense; that is, when the electro-cardiogramn scores 3 or more points the diag-nosis of hypokalemia is almost certain. How-ever, if the electrocardiogram scores less than3 points, or even no points, this does not ruleout the possibility of hypokalemia (figs. 10and 11).As shown in figure 12, the electrocardio-
graphic diagnosis of hypokalemia in normo-tensive patients is fairly secure at the lowerconcentrations of serum potassium. In theliterature much emphasis has been placed on
517
by guest on February 4, 2018http://circ.ahajournals.org/
Dow
nloaded from
5WEAVER, BURCHELL
certaini levels below which the electrocardio-gram will be diagnostic of hypokalemia. Ithas been one of the purposes of this paper toshow the multiple factors that affect the elec-trocardiogram in hypokalemic and normoka-lemic states.
SummaryA definite correlation cani be established
between the electrocardiogram and the serumpotassium level at hypokalemic levels. Astudy was made at the Mayo Clinic of 130 hy-pokalemic patients with relatively stable clin-ical states. Variations in Q-T intervals, P-Rintervals, atrial rhythm, P waves, T/R values,and T-wave aiid U-wave contour in hypokale-mia were noted as were the relationships be-tween the T-U complex, eleetrical repolariza-tion pheiionoena and potassium metabolism.Since modifying factors such as drugs, certainelectrolyte disturbanees, variations in cardiacrate, conduction defects, and myocardialischemia were eliminated by careful selectionof patients, only the influenee of acid-base im-balance, sodium-potassium ratio, and hyper-tension on the electrocardiogram was studied.Acid-base imbalance anid hypertension oftensimulated or obscured electrocardiographicevidence of hypokalemia.
Electrocardiographic criteria of hypokale-mia include various combinations of the fol-lowing signs: (1) T/U value of 1 or less inlead II or V3, (2) U-wave amplitudes ofgreater than 0.5 mm. in lead II or greaterthan 1 mm. in V3, and (3) S-T depressioni of0.5 mm. or more in lead II or leads V1, V2,and V3. It must be remembered that a normalelectrocardiogram does not exclude hypokale-mia and that an electrocardiogram which ful-fills the established criteria does not neces-sarily indicate hypokalemia unless the factorsdiscussed have been eliminated or minimized.
Summario in InterlinguaUn definite correlation pote esser establite inter
le electrocardiogramma e le nivello seral de kaliumquando le cifras pro isto representa valores hypoka-liemic. Esseva effectuate al Clinica Mayo un studiode 130 patientes hypokaliemic in relativemente stabilestatos clinic. Variationes in le intervallos Q-T, inle iintervallos P-R, in le rhythmo atrial, in le undas
P, in le valores T/R, e in le conitorinos del undas Te U esseva notate, si ben como etianm le relationes iiiterle complexo T-U, le phenomienos de repolarisationelectric, e le metabolisnio de kalium. Le meticuloseselection del patientes garantiva le exclusioni de fac-tores in-odificatori como drogas, certe disturbationeselectrolytic, variationes del frequentia cardiac, de-fectos de conduction, e ischemia myocardial, (lemnaniera que solmenite le influeLntia del iiibalancia deacido e base, del proportioin de natritri a kaliniii, edle hypertension esseva includite in le stuidio del elee-trocardiogrammna. ImbMdancia de acido a base e ly-pertensioin frequentemente siniulava o obscurava leevidentia electrocardiographic de lhypokalieimia.Le criterios electrocardiographic de hypokalieimiia
include varie coimbinationes del sequente signos: (1)Valores pro T/U de 1 o minus in derivation II oderivation V3, (2) amplitudes del unnda U de plus que0,5 mm in derivation II o de plus que 1 imm in der-ivation V3 e (3) depression de S-T de 0,5 mnm oplus in derivation II o in le derivationes Yi, V2, e V..On debe rememorar se que un electrocardiogranmianormal noni exclude hypokaliemnia e que un electio-cardiogranmma que satisface le establite criterios noniindica lnecessarimente le presentia de hypokaliemiiia,excepte si le supra-discutite factores lha essite eliiii-nlate, o si lor signification ha essite redlucite a: isniinilno.
References1. WEAVER, W. F., SALASSA, R. M., AND BURCHELL,
H. B.: An evaluation of the electrocardiogramand the acidity of the urine as a screeningtest for primary aldosteronism. Am. J. M. Sc.238: 162, 1959.
2. HOLZMANN, M.: rI. Various types of fusion be-tween T and U waves. Circulation 15: 70, 1957.
3. LEPESCHKIN, E., AND SURAWICZ, B.: The meas-urement of the Q-T interval of the electro-cardiogram. Circulation 6: 378, 1952.
4. : The U wave of the electrocardiogram. Areh.Int. Med. 96: 600, 1955.
5. KOCH, E.: Allgemeinie Elektrokardiographie.Verlag Von Theodor Steinkopif, Dresden andLeipzig, 1943, 15 pp.
6. WiNsoR, T.: Electrocardiographic Test Book.New York, The American Heart Association,Inc., 1956, vol. 1, 167 pp.
7. REYNOLDS, T. B., MARTIN, H., AND HOMANN,R. E.: Serum electrolytes and the electrocar-diogram. Am. Heart J. 42: 671, 1951.
8. FEIL, H. S., AND KATZ, L. N.: Clinical observa-tions on the dy) anaics of ventricular systole.II. Hypertension. Arch. Int. Med. 33: 321,1924.
9. FENN, G. K.: Studies in the variation of thelength of the Q-R-S-T interval. Arch. IJit. Med.29: 441, 1992.
Circulation, Volume XXI, April 1960
518
by guest on February 4, 2018http://circ.ahajournals.org/
Dow
nloaded from
ELECTROCARDIOGRAM IN HYPOKALEMIi
10. BELLET, S., AND FINKELSTEIN, D.: Significanceof QT prolongation in the electrocardiogram:Based on the study of 168 cases. Am. J. M.
Sc. 222: 263, 1951.11. RINGER, S.: A further contribution regarding the
influence of the different constituents of theblood on the contraction of the heart. J. Phys-iol. 4: 29, 1882.
12. -: AIn investigation regarding the action ofrubidium and caesium salts compared with theaction of potassium salts on the ventricle ofthe frog's heart. J. Physiol. 4: 370, 1883.
13. FOLLIS, R. H., JR., ORENT KEILES, E., AND MC-COLLUM., E. V.: The production of cardiac andrenal lesions in rats by a diet extremely de-ficient in potassium. Ani. J. Path. 18: 29, 1942.
14. PERKINS, J. G., PETERSON, A. B., AND RILEY,J. A.: Renal and cardiac lesions in potassiumdeficiency due to chronic diarrhea. Am. J. Med.8: 115, 1950.
15. SCHR.ADER, G. A., PRICKETT, C. O., AND SALMON,W. D.: Symptomatology and pathology of po-tassium and magnesium deficiencies in the rat.J. Nutrition 14: 85, 1937.
16. THOMAS, R. M., MYLON, E., AND WINTERNITZ,M. C.: Myocar dial lesions resulting from di-etary deficiency. Yale J. Biol. & Med. 12: 345,1940.
17. DARROW, D. C., AND MILLER, H. C.: The pro-ductioii of cardiac lesions by repeated injec-tions of desoxycorticosteronie acetate. J. Cliii.Invest. 21: 601, 1942.
18. KORNBERG, A., AND ENDICOTT, K. M.: Potassiumdeficiency in the rat. Am. J. Physiol. 145:291, 1946.
19. SMITH, S. G., BLACK-SCHAFFER, B., AND LASATER,T. E.: Potassium deficiency syndrome in therat and the dog: A description of the musclechanges in the potassium-depleted dog. Arch.Path. 49: 185, 1950.
20. RODRIGUEZ, C. E., WOLFE, A. L., AND BERGSTROM,V. W.: Hypokalemic myocarditis: Report oftwo cases. Am. J. Cliii. Path. 20: 1050, 1950.
21. KEYE, J. D., JR.: Death in potassium deficiency:Report of a case including morphologic find-ings. Circulation 5: 766, 1952.
22. MCALLEN, P. M.: Myocardial changes occurriingin potassium deficiency. Brit. Heart J. 17: 5,1955.
23. ROBINSON, J. G., EDWARDS, J. E., HIGGINS, G. M.,AND BURCHELL, H. B.: Effect of digitalis on
incidence of myocardial lesions in potassium-deficient rats. Arch. Path. 64: 228, 1957.
24. WESTLAKE, R. E., AND CHIU, G.-C.: The signifi-cance of a single electrocardiogram in the inter-pretation of serum potassium. New York J.Med. 54: 239, 1954.
Circulation, Volume XXI, April 1960
519
25. SCHWARTZ, W. B., LEVINE, H. D., AND RELMAN,A. S.: The electrocardiogram in potassium de-pletion: Its relation to the total potassiundeficit and the serum concentration. Am. J.Med. 16: 395, 1954.
26. SURAWICZ, B., BRAUN, H. A., CRUM, W. B.,KEMP, R. L., WAGNER, S., AND BELLET, S.:Quantitative analysis of the electrocardio-graphic pattern of hypopotassemia. Circula-tion 16: 750, 1957.
27. BELLET, S.: The electrocardiogram in electrolyteimbalance. Arch. Int. Med. 96: 618, 1955.
28. DRIEFUS, L. S., AND PICK, A.: A clinical cor-relative study of the electrocardiogram in elec-trolyte imbalance. Circulation 14: 815, 1956.
29. NICHOPOULOS, G. C., AND HOFFMAN, W. K.: Ef-fect of acute hypopotassemia on myocardialpotassium and the lelectrocardiogram. Ab-stracted, Circulationi 14: 978, 1956.
30. WELLER, J. M., LOWN, B., HOIGNE, R. V., WY-ATT, N. F., CRISCITIELLO, M., MERRILL, J. P.,AND LEVINE, S. A.: Effects of acute removalof potassium from dogs: Changes in the elec-trocardiogram. Circulation 11: 44, 1955.
31. BELLET, S., STEIGER, W. A., NADLER, C. S., AND
GAZES, P. C.: Electrocardiographic patterns inhypopotassemia: Observations oni 79 patients.Am. J. M. Se. 219: 542, 1950.
32. TARAIL, R.: Relation of abnormalities in con-centration of serum potassium to electrocar-diographic disturbances. Am. J. Med. 5: 828,1948.
33. MARTIN, H. E., AND WERTMAN, M.: Electrolytechanges and the electrocardiogram in diabeticacidosis. Am. Heart J. 34: 646, 1947.
34. BELLET, S., NADLER, C. S., GAZES, P. C., ANDLANNING, M.: The effect of vomiting due tointestinal obstruction on the serum potassium.Gastroenterology 12: 49, 1949.
35. ERNSTENE, A. C., AND PROUDFIT, W. L.: Dif-ferentiation of the changes in the Q-T intervalin hypocaleemia anid hypopotassemia. Am.Heart J. 38: 260, 1949.
36. SURAWICZ, B., AND LEPESCHKIN, E.: The elec-trocardiographic pattern of hypopotassemiawith and without hypocalcenia. Circulation 8:801, 1953.
37. FURBETTA, D., BUFALARI, A., AND SANTUCCI, F.:Rapporti cronologici tra l'onda U dell'elettro-cardiogramma e i momenti del ciclo meecanieodel cuore ad essa contemporanei. Folia cardiol.14: 457, 1955.
38. KLAKEG, C. H., BERRY, A. A., AND BURCHELL, H.B.: Duration of the QT interval at slow ven-tricular rates. Am. J. Physiol. 179: 159, 1954.
39. SJOSTRAND, T.: The electrocardiogram in hypo-potassemia. Acta med. scandinav. 151: 73, 1955.
by guest on February 4, 2018http://circ.ahajournals.org/
Dow
nloaded from
WEAVER, BURCHELL
40. MAGIDA, M. G., AND ROBERTS, K. E.: Electrocar-diographic alterations produced by an increasein plasma pH, bicarbonate, and sodium aseompared with those seen with a decrease inpotassium. Circulation Research 1: 214, 1953.
41. ROBERTS, K. E., AND MAGIDAY M. G.: Electrocar-diographic alterations produced by a decreasein plasma pH, bicarbonate and sodium as com-pared with those produced by an incriease inpotassium. Circulation Research 1: 206, 1953.
42. SHARPEY-SCHAFER, E. P.: Potassium effects on Twave inversion in myocardial infarction andpreponderance of a ventricle. Brit. Heart J. 5:80, 1943.
43. -: Potassium effects on the electrocardiogramof thyroid deficiency. Brit. Heart J. 5: 85, 1943.
44. DODGE, H. T., GRANT, R. P., AND SEAVEY, P. W.:The effect of induced hyperkalemia on the nor-mal and abnormal electrocardiogram. Am.Heart J. 45: 725, 1953.
45. CARLSTEN,, A.: Experimentally provoked varia-tions of the positive after-potential in thehuman electrocardiogram. Acta med. scandinav.146: 424, 1953.
46. CANNON, P., AND SJ6STRAND, T.: The occurreniceof a positive after-potential in ECG in differ-ent physiological and pathological conditions.Acta med. seandinav. 146: 191, 1953.
47. CARLSTEN, A.: Choice of indifferent electrode inthe study of the electrocardiographic after-potentials. Acta nmed. scandinav. 145: 72, 1953.
48. FURBETTA, D., BUFALARI, A., SANTUCCI, F., ANDSOLINAS, P.: Abnormality of the U wave andof the T-U segment of the electrocardiogram:The syndrome of the papillary muscles. Cir-culation 14: 1129, 1956.
49. FURBETTA, D., BUFALARi, A., AND SANTUCCI, F.:Precisazioni e limiti delle caratteristiche elet-trocardiografiche della onda U in condizioninormali. Folia cardiol. 14: 339, 1955.
50. SURAWICZ, B., AND LEPESCHKIN, E.: Effect ofhypopotassemia and certain other factors onthe amplitude of the U wave in the electro-cardiogram. Abstracted, Circulation 14: 1007,1956.
51. -, KEMP, R. L., AND BELLET, S.: XII. Polarityand amplitude of the U wave of the electro-cardiogram in relation to that of the T wave.Circulation 15: 90, 1957.
52. THOMSON, W. A. R.: Potassium and the T waveof tlhe electrocardiogram. Lancet 1: 808, 1939.
53. NADLER, C. S., PELLET, S., AND LANNING, rM.:Influence of the serum potassium and otherelectrolytes on the electrocardiogram in dia-betic acidosis. Am. J. Med. 5: 838, 1948.
54. STEWART, H. J., SAIITH, J. J., AND MILHORAT,A. T.: Electrocardiographic and serum potas-
sium changes in fainilial periodic paralysis.Am. J. M. Sc. 199: 789, 1940.
55. JANOTA, O., AND WEBER, K.: Die paroxysinaleLiihmung: Eine Studie uiber ihre Klinik undPathogeniese. Abhanklungen aus der Neurologie,Psychiatrie, Psychologie und ihren Grenzge-bieten 46: 1-118, 1928.
56. BROWN, M. R., CURREaNS, J. H., AND MARCHAND,J. F.: Muscular paralysis and electrocardio-graphic abnormalities: Resulting from potas-sium loss in chronic nephritis. J.A.M.A. 124:545, 1944.
57. BELLET, S., AND DYER, WV. W.: The electrocar-diogram during anid after emergence from dia-betic coma. Am. Heart J. 13: 72, 1937.
58. STOLL, B., AND NISNEWITZ, S.: Electrocardio-graphic studies in a case of periodic paralysis.Arch. Int. Med. 67: 755, 1941.
59. CURRENS, J. H., AND CRAWFORD,J. D.: TImeelectrocardiogram and disturbance of potas-sium metabolismi. New England J. Med. 243:843, 1950.
60. LEPESCHKIN, E.: An electrophysiologic explana-tioni of the electrocardiographic hypo- andhiyperpotassemia patterns. Abstracted, Circu-lation 12: 738, 1955.
61. CHA.MBERLAIN, F. L., SCUDDER, J., AND ZWEMER,R. L.: Electrocardiographic changes associatedwith experimileintal alterations in blood potas-siuni in cats. Am. Heart J. 18: 458, 1939.
62'. LEPESCHKIN, E., AND ROSENBAUM, M. B.: XI.Coupling initervals of ventricular extrasystolesin relation to the heart rate, the U wave, amndthe superniormal phase of excitability. Circula-tion 15: 82, 1957.
63. FiSCHm, C., SHIELDS, J. P., RIDOLFO, S. A., AND
FEIGENBAUM, H.: Effect of potassiumi oll coit-duction and ectopic rhythms in atrial fibril-lation treated with digitalis. Circulation 18:98, 1958.
64. HUTH, E. J., AND SQUIRES, R. D.: The relationiof cardiovascular phenomena to metabolicchanges in a patient with chronic hypokalemia.Circulation 14: 60, 1956.
65. ROSEN, I. L.: D)rugs, electrolyte anid im1etabolismdisturbaniees. In Gardberg, Manuel: ClinicalElectrocardiography: Interpretation on a Phys-iologic Basis, New York, Hoeber-Harper, 1957,315 pp.
66. KOUNTZ, W. B., AND HA-MIMOUDA, M.: Effect ofasphyxia aind of anoxenhia on the electrocardio-gram. Am. Heart J. 8: 259, 1932.
67. BARKER, P. S., SHRADER, E. L., AND RONZONI, E.:The effects of alkalosis and of acidosis uponthe humani electrocardiogram. Am. Heart J.17: 169, 1939.
68. SCRIBNER, B. HT., FREMONT-SMITH, K., AND
Circulation, Volume XXI, April 1960
5-20
by guest on February 4, 2018http://circ.ahajournals.org/
Dow
nloaded from
ELECTROCARDIOGRAM IN HYPOKALEMIIA
BURNELL, J. M.: The effect of acute respira-tory acidosis on the internal equilibrium ofpotassium. J. Clin. Invest. 34: 1276, 1955.
69. BURCHELL, H. B.: Electrocardiographic chanigesrelated to disturbances in potassium mletabo-lism. J. Lancet 73: 235, 1953.
70. VAN BUCHEM, F. S. P.: The electrocardiogramand potassium metabolism: Electrocardio-graphic abnormalities in primary aldosteron-ism and familial periodic paralysis. Am. J.Med. 23: 376, 1957.
71. FARBER, S. J., PELLEGRINO, E. D., CONAN, N. J.,AND EARLE, D. P.: Observations on the plasmapotassium level of man. Am. J. M. Sc. 221:678, 1951.
72. TARAIL, R.: The relation of potassium metabo-lism to cardiac function. J. Lancet 73: 238,1953.
73. YOUNG, J. V., AND DAUGHERTY, G. W.: Use ofthe artificial kidniey in the; production and studyof experimental hypokalemia. Proc. Staff Meet.,Mayo Clin. 31: 357, 1956.
A
On Cardiac MurmursBy AuSTIx FLINT, MK.D.
The significance of organic murmurs is limited to the poinlts of inforlilation alreadystated in the introductory remarks. viz., the existence of lesions, their localization, andthe fact of valvular insufficieney or regurgitation. Whether the lesions involve imme-diate danger to life, or, on the contrary, are compatible with many years of comfortablehealth, the murmurs do not inform us, nor do they teach us howv- far existing symptomsare referable to the lesions, and how- far to functional disorder induced by other morbidconditions. Neither the intensity nor the quality of sound in the murmurs furnish anycriteria by which the gravity of the lesions or their innocuousness can be determined. Aloud murmur is even more likelv to be produced in connection with comparativelyunimportant lesions than with those of a grave character, because in the former, ratherthan in the latter case, is the action of the heart likely to be strong, and the intensityof the murmur, other things being equal, will depend on the force with which the currentsof blood are moved. Whether the murmur be soft, or rough, or musical, depends not onthe amount of damage which the lesions have occasioned, but on physical circumstancesalike consistent with trivial and grave affections.-Am. J. Mll. Sc. n.s. 44: 29, 1862.
Circulation, Volume XXI, April 1960
521
by guest on February 4, 2018http://circ.ahajournals.org/
Dow
nloaded from
WALT F. WEAVER and HOWARD B. BURCHELLSerum Potassium and the Electrocardiogram in Hypokalemia
Print ISSN: 0009-7322. Online ISSN: 1524-4539 Copyright © 1960 American Heart Association, Inc. All rights reserved.
is published by the American Heart Association, 7272 Greenville Avenue, Dallas, TX 75231Circulation doi: 10.1161/01.CIR.21.4.505
1960;21:505-521Circulation.
http://circ.ahajournals.org/content/21/4/505located on the World Wide Web at:
The online version of this article, along with updated information and services, is
http://circ.ahajournals.org//subscriptions/
is online at: Circulation Information about subscribing to Subscriptions:
http://www.lww.com/reprints Information about reprints can be found online at: Reprints:
document. and Rights Question and Answer
Permissionsthe Web page under Services. Further information about this process is available in thewhich permission is being requested is located, click Request Permissions in the middle column ofClearance Center, not the Editorial Office. Once the online version of the published article for
can be obtained via RightsLink, a service of the CopyrightCirculationoriginally published in Requests for permissions to reproduce figures, tables, or portions of articlesPermissions:
by guest on February 4, 2018http://circ.ahajournals.org/
Dow
nloaded from

![Disorders of Potassium Metabolism · ered [3–8]. Hypokalemia and Liddle’s syndrome [3] and hyper-kalemia and pseudohypoaldosteronism type I [4] result from muta-tions at different](https://static.fdocuments.net/doc/165x107/602dc87b713a543efd181147/disorders-of-potassium-metabolism-ered-3a8-hypokalemia-and-liddleas-syndrome.jpg)


![Disorders of Potassium Metabolismanemia is associated with potassium uptake by newly formed cells, which is occasionally of sufficient magnitude to cause hypokalemia [13]. FIGURE 3-8](https://static.fdocuments.net/doc/165x107/5e5313ac9e88f738f0525316/disorders-of-potassium-metabolism-anemia-is-associated-with-potassium-uptake-by.jpg)