SERIES TITLE OPTIONAL Lessons from the Lunchroom · Don Anair Amine Mahmassani July 2013 SERIES...
20
Lessons from the Lunchroom Childhood Obesity, School Lunch, and the Way to a Healthier Future Lindsey Haynes-Maslow, PhD, MHA Jeffrey K. O’Hara, PhD February 2015
-
Upload
hoangnguyet -
Category
Documents
-
view
214 -
download
0
Transcript of SERIES TITLE OPTIONAL Lessons from the Lunchroom · Don Anair Amine Mahmassani July 2013 SERIES...

Don AnairAmine Mahmassani
July 2013
series title optional
Lessons from the LunchroomChildhood Obesity, School Lunch, andthe Way to a Healthier Future
Lindsey Haynes-Maslow, PhD, MHA Jeffrey K. O’Hara, PhD
February 2015

2 union of concerned scientists
Executive Summary
America’s children are bombarded daily with junk foods full of sugar, salt, and fat. On average, U.S. children consume five times the amount of sugar recommended by the Dietary Guidelines for Americans, but only about one-third the recom-mended amount of fruits and vegetables. Unhealthy diets have contributed to nearly 30 percent of our nation’s children being overweight or obese, with lower-income and racial or ethnic minority children at the greatest risk.
Children with obesity are as much as 10 times more likely than healthy-weight children to become obese adults. This, in turn, increases their risk of developing serious chronic diseases later on in life—including type II diabetes, cardiovascular disease, and some cancers. This is not only tragic for those suffering from obesity, but expensive for us all, as taxpayers and consumers cover some of the costs of treating these illnesses through public and military health insurance programs and higher private health insurance premiums. It is estimated that obesity-related healthcare costs in the United States account for $210 billion annually, or 16.5 percent of the country’s total healthcare costs.
Parents and policymakers alike have employed a variety of strategies to improve children’s diets and their health. One strategy that shows particular promise for reaching a broad swath of the nation’s children—especially lower-income children with the greatest nutritional needs—is improving the quality of foods served in schools. Children consume approximately half of their daily calories in school, and for lower-income children, a school meal may be their only meal of the day. The foods children eat at school influence their lifelong eating habits, so it is essential that school foods are healthy and built around fruits, vegetables, and whole grains.
The U.S. Department of Agriculture (USDA) administers a number of school meal programs and provides schools with funding for free and reduced-price (FRP) meals. In recent decades, those subsidized meals have tilted toward processed foods high in fat, sugar, and sodium. In the midst of the child-hood obesity crisis, Congress passed bipartisan legislation—the Healthy, Hunger-Free Kids Act of 2010 (HHFKA)—to shift public investments in school food toward a stronger focus on healthy foods. The law required the USDA to develop rules to bring school food into accord with the Dietary Guidelines for Americans for fruits and vegetables, whole grains, and salt. Schools nationwide began implementing the updated nutrition standards in 2012.
With this report, the Union of Concerned Scientists (UCS) seeks to: (1) quantify obesity’s impact on individual healthcare costs—particularly for young adults emerging from the school system, (2) evaluate the effectiveness of
taxpayer-supported school food programs in influencing children’s overall diets and weight, and (3) identify where school food programs are falling short and should be strengthened. For this, we reviewed a number of existing studies and analyzed two publicly available datasets con- taining survey data on dietary patterns, weight and health status, and healthcare expenditures.
Obesity-related healthcare costs in the United States account for $210 billion annually, or 16.5 percent of the country’s total healthcare costs.
Key Findings
Increased healthcare costs due to poor diets and obesity are a reality, even for young Americans just out of the school system. Our analysis of survey data from the U.S. Department of Health and Human Services shows the asso-ciations between diet, obesity, and individuals’ medical expenditures. We found that among 18- to 25-year-old respondents, those who were cautioned by a doctor to reduce their consumption of fatty foods (a proxy for having a diet too high in fat and cholesterol) were 20 percent more likely than their peers to be obese, and they had annual medical expenses nearly one-third higher. The situation only worsens with advancing age. Among respondents aged 18 to 85, the average annual medical expenditures among those who were cautioned about their diets were 90 percent higher than those who were not cautioned about their diets.
Taxpayer-supported school food programs have improved the diets of socioeconomically disadvantaged children who otherwise might not have access to healthy food. We analyzed data from a U.S. Department of Education survey that tracked the eating habits of a nationally repre-sentative cohort of children during fifth grade (in 2004) and again in the eighth grade (in 2007). Our analysis of the dietary behaviors of children both inside and outside of school prior to the HHFKA demonstrates that participation in FRP meal programs can have a positive impact on dietary patterns of socioeconomically disadvantaged children.
In particular, our analysis revealed that students who received FRP lunches at school ate fruits and vegetables more often than students not in the program (both lower-income children not enrolled in the program and higher-income
Cover Photo: © USDA

3Lessons from the Lunchroom
children who were ineligible). Comparing the two groups, our analysis shows that:
• Fifth-gradeFRPmealparticipantsconsumedfruits and vegetables three more times per week than non-participants.
• Eighth-gradeFRPmealparticipantsconsumedfruits and vegetables 1.5 more times per week than non-participants.
At the same time, school food programs are not strong enough to overcome other unhealthy influences on children’s diets and prevent obesity. Our further analysis of the U.S. Department of Education data uncovered a worri-some trend in the type of drinks and fast foods that FRP meal participants were consuming inside or outside of school:
• FRPmealparticipantsconsumedsugarybeverages and fast food more often than non-participants—on average, one more time per week each in comparison to non-FRP participants.
While it may not seem like a substantial difference, low- income children can least afford this additional junk food
consumption—which may represent as many as 460 added calories per week. To determine the impact of FRP meal participants eating both the healthiest foods and the unhealthiest foods more frequently than non-FRP meal participants, we examined whether their weight status differed. We found that FRP-lunch participants were more likely to be overweight or obese than non-participants. More specifically, we reveal that:
• Approximatelyhalfoftheeighthgradersinthe FRP meal program were overweight or obese, as measured by body mass index (BMI), compared with only 30 percent of non-participants.
• Accesstounhealthyfoodsinvendingmachinesatschoolled to weight gain in Hispanic boys, an effect that was magnified for those from lower-income families.
We also reviewed a number of early studies that examined the impacts of the updated nutrition standards that were implemented in 2012. These studies reveal a largely positive impact on children’s consumption of healthy food at school. Offering children a larger quantity and variety of fruits and
High school students in Arlington, Virginia, enjoy salads and fresh fruit at lunch. Researchers studying the impact of updated federal school lunch standards found that students have, on average, selected and consumed significantly more fruits and vegetables since the standards took effect.
© U
SDA

4 union of concerned scientists
vegetables in school cafeterias has led to increased consump-tion, which researchers have attributed in part to stronger fruit and vegetable requirements. Studies also show that when offered new vegetables at school, children are more likely to try them.
Overall, our analysis demonstrates that stronger nutrition standards for all school food—breakfast, lunch, and snacks bought from vending machines—can improve children’s dietary choices. Healthy school foods serve as a lifeline for children, particularly those from socioeconomically disad-vantaged families, who are surrounded by unhealthy food everywhere else. But the data also suggest that school food programs alone are not yet strong enough to prevent child-hood obesity and its lifelong impacts. Therefore, the HHFKA needs to be further strengthened to ensure that school food is as healthy as possible, and to instill healthy eating habits in children that will carry beyond the schoolhouse door.
Offering children a larger quantity and variety of fruits and vegetables in school cafeterias has led to increased consumption.
Policy Recommendations to imPRove childRen’s diets and theiR FutuRes
In 2010, the HHFKA took a significant step toward improving nutritional standards for school food by requiring that school meals comply with federal dietary guidelines. In the next reauthorization of the law, expected during 2015, Congress should build on this progress by strengthening standards fur-ther, particularly for fruits and vegetables. UCS recommends that Congress enact a series of measures to build upon earlier progress and further improve the health prospects of school children.
Specifically, we recommend that Congress:
• Protect the gains made in 2010. The vast majority of schools are in compliance with the 2010 law, and support is available for those who are struggling. Retreating from our commitment to healthier school food is not an option in the face of the childhood obesity crisis.
• Prioritize fruits and vegetables. Fruits and vegetables are critically under-consumed by children. More can and should be done to reverse this trend.
– Congress can further encourage fruit and vegetable consumption by offering funding and other incentives for schools to go beyond the minimum fruit and vegetable servings required by HHFKA and to offer these healthy foods as snacks between meals.
– Additional funding for research initiatives to mea-sure changes in fruit and vegetable consumption and track related health outcomes would help to assess program efficacy.
• Increase the federal reimbursement rate for healthy school meals. Schools have encountered the same reality already known to most Americans—less-healthy processed foods are often cheaper than whole-food ingredients like fresh fruits and vegetables and unpro-cessed meats. We recommend raising the reimbursement rate for meals in compliance with nutrition standards to allow schools more flexibility to buy the healthiest foods possible.
At Washington-Lee High School in Arlington, VA, kiwi is added to fruit cups. Increasing variety and attractiveness are two ways to get students interested in eating more fruits and vegetables.
© U
SDA

5Lessons from the Lunchroom
SourceS: NatioNal HealtH aNd NutritioN examiNatioN SurveyS (NHaNeS) i–iv; aNd NHaNeS, 1999–2000, 2001–2002, 2003–2004, 2005–2006, 2007–2008, 2009–2010, 2011–2012
Figure 1. Prevalence of Obesity among Children Ages 2 to 19 Years in the United States, 1971 to 2012
consequences as they age, and health experts estimate that this generation of American children will become the first generation in history to die younger than their parents— due to obesity-related complications (Olshansky et al. 2005).
Childhood obesity is most easily measured by body mass index (BMI), the ratio of weight (in kilograms) divided by height (in meters) squared. A child is considered obese if his or her BMI is at or above the 95th percentile on sex- and age-specific growth charts as issued by the Centers for Disease Control and Prevention (Table 1, p. 6).
Socioeconomically disadvantaged children are at the greatest risk for being overweight and obese, and rates of childhood obesity among some racial and ethnic minority groups are rising (Ogden et al. 2014; Singh, Siahpush, and Kogan 2010; Skelton et al. 2009). From 2001 to 2012 the increase in obesity prevalence for white children was fairly small, increasing just slightly, from 13.9 percent to 14.1 per-cent; the increase over the same period was greater for African-American children (from 17.5 percent to 20.2 percent) and for Hispanic children (from 19.5 percent to 22.4 percent) (NCHS 2013).
Not only is childhood obesity partially caused by socioeconomic inequities, but it perpetuates them, bringing about negative academic, social, psychological, and health
Perc
ent O
bese
181614121086420
2011–
2012
2009–2
010
2007–
2008
2005–
2006
1971
–1974
1976
–1980
1988
–1994
1999–2
000
2001–
2002
2003–
2004
• Finance school cafeteria kitchen equipment. Outdated kitchen equipment creates barriers for cafeteria staff trying to prepare healthy, tasty meals on a large scale. Decades of underinvestment in school kitchens have left many schools with little capacity beyond heating and serving prepared, processed meals. Congress should expand the availability of grants and loans to help schools outfit and update their kitchens.
• Improve nutrition education for children. Improving nutrition education in schools can complement efforts to provide children with healthier food by giving them the information they need to make healthier choices. We urge Congress to fund nutrition education programs that engage all school staff—from cafeteria workers to teachers—to help children understand the basics of food, nutrition, cooking, and healthy choices. Such efforts can improve children’s understanding and acceptance of healthier meals at school and elsewhere.
• Increase funding for the Farm to School Grant Program. This program supports educational initiatives related to food production and nutrition. Examples include establishing school gardens that allow students to obtain firsthand experience with growing food, and providing financial support so schools can source meal ingredients from local farms. Such initiatives have been shown to increase fruit and vegetable consumption. Given the overwhelming popularity and demonstrated success of the Farm to School Grant Program, we recommend increasing its funding.
• Not allow politics to trump science. Medical and nutri-tion experts are the best sources for setting nutritional standards for school lunches. Congress should continue to look to these experts for guidance on these standards.
Children spend more time at school than any other place outside the home. Investments in healthier school food today will yield better health, greater productivity, and lower healthcare costs tomorrow.
Introduction
Obesity rates among children and adolescents nearly tripled from 1970 to 2000, with approximately 16 percent of America’s youth currently classified as obese (Figure 1). In adults, obesity is often accompanied by a variety of chronic diseases, includ-ing cardiovascular diseases, type II diabetes, and some types of cancers. Factors that contribute to the development of these diseases are at work before a person’s birth and continue into adolescence. Therefore, today’s children face dire health
In adults, obesity is often accompanied by a variety of chronic diseases.

6 union of concerned scientists
barriers to maintaining a healthy lifestyle, which results in poorer health outcomes and lower academic performance. As these children grow into adults, low educational attainment leads to lower-paying jobs, and lower-paying jobs make it more difficult to maintain healthy lifestyles.
To begin to put an end to the cycle, we must improve the diets of young children, thereby enabling them to maintain healthy eating habits through adolescence and adulthood. In this report, we review the health and economic consequences of poor diets that begin in childhood, evaluate the track record and potential for the National School Lunch Program and other taxpayer-supported school food programs to improve children’s diets and health, and offer policy recommendations to bolster the capacity of these programs.
Body Mass Index Weight Status
Less than 5th percentile Underweight
5th to 84th percentile Healthy weight
At or above 85th percentile Overweight or obese
At or above 95th percentile Obese
table 1. Body Mass Index and Weight Status of Children and Adolescents Ages 2 to 19
Source: ceNterS For diSeaSe coNtrol aNd PreveNtioN.
Figure 2. Change in Obesity Prevalence among Children Ages 2 to 19 Years from 2001 to 2012, by Race/Ethnicity
SourceS: NatioNal HealtH aNd NutritioN examiNatioN SurveyS (NHaNeS): 2001–2002, 2003–2004, 2005–2006, 2007–2008, 2009–2010, 2011–2012.
consequences. Children who are obese are more likely than healthy-weight children to miss school due to illness, have lower academic achievement, and experience slower skill development (Trudeau and Shepherd 2010; Taras and Potts-Datema 2005). Obesity is also a highly stigmatizing condi- tion associated with low self-esteem (Strauss 2000). And obesity is associated with health issues for children, such as increased risk for type II diabetes, asthma, and high blood pressure (CDC 2009). Since some of these illnesses may limit children’s ability to be physically active, this further rein- forces the problem by making it more difficult for them to adopt healthy behaviors.
Many American children are trapped in a cycle that must be stopped: children in lower-income households have greater
Obese children between the ages of six and eight years were 10 times more likely to become obese adults than were children with healthy weights.
The Impacts of Children’s Diets Can Last a Lifetime
Foods that are high in fiber, vitamins, and minerals—such as whole grains, fresh fruits and vegetables, and lean meats—contain essential nutrients for supporting children’s growth and development, maintaining a healthy weight, and protec-ting against chronic diseases (CDC 2009). Conversely, when children consume too many unhealthy foods high in fat, sugar, and sodium, and not enough healthy foods, they are more likely to become obese and to develop diet-related health conditions.
While these diet-related conditions can have serious adverse health impacts while children are still young (see Box 1, p. 7), other consequences of poor diet and obesity can persist into adulthood. According to one study, obese children between the ages of six and eight years were 10 times more likely to become obese adults than were children with healthy weights (Freedman et al. 2005). Obesity, in addition to having detrimental effects on quality of life and life expectancy, has negative economic impacts. Perhaps the most obvious are the direct costs, those associated with medical care including health services, diagnostic tests, and medication. In 2008, medical expenditures to treat obesity in the United States
White African-American Hispanic
Obe
sity
Pre
vale
nce
26
24
22
20
18
16
14
12
2011–
2012
2009–2
010
2007–
2008
2005–
2006
2001–
2002
2003–
2004

7Lessons from the Lunchroom
In addition to obesity, other diet-related health conditions in children include:
• Type II diabetes: Historically, type II diabetes was known as “adult-onset” diabetes since it primarily affected adults aged 30 and older, but this term is no longer used because so many children and young adults are now being diagnosed (Glazier et al. 2006). Left untreated or poorly managed, diabetes can cause kidney damage, blindness, and poor blood circulation leading to lower-limb amputations (Hux 2003).
• Low bone density: Calcium and vitamin D are impor-tant for bone development and support healthy bone growth in children. Low bone density in childhood can track into adulthood and cause osteoporosis, the leading cause of fractures among adults (Whitney and Rolfes 1999).
• Iron deficiency: Iron enables oxygen to be transported through the blood. Children with iron deficiency have decreased academic productivity and weaker immune systems (CDC 1998).
• Dental cavities: Cavities are associated with sugar and sugary drinks, such as sodas, juices, and sports drinks. Left untreated, cavities can be very painful and affect children’s school performance, eating habits, and growth and development (Marshall et al. 2003).
box 1.
Leading Diet-Related Health Conditions in Children
were estimated at $147 billion (Finkelstein et al. 2009). Seen from a different angle, obesity accounts for an estimated 16.5 percent of U.S. medical expenditures ($210 billion in 2008 dollars) (Cawley and Meyerhoefer 2012).
There are also indirect costs of obesity. Cawley, Rizzo, and Haas (2007) found that increased weight was correlated with lower wages for white women, a link that may be due to a variety of factors. Obese employees miss more workdays than non-obese employees (Trogdon et al. 2008; Finkelstein et al. 2005). Additionally, employers with employer-sponsored health insurance plans may pay higher rates for obese employees, and some may pass along these costs through wage reductions (Bhattacharya and Sood 2011; Bhattacharya and Bundorf 2009). Lastly, obese employees may have lower self-esteem than non-obese employees, resulting in decreased confidence in the workplace (Mocan and Tekin 2009). Finally, even if some obese employees have high workplace attendance and low healthcare costs, they still can suffer from weight stigma in the workplace, which can affect wages, promotion, and potential termination (Puhl and Brownell 2011).
Not only do individuals with obesity incur costs, but society does as well. Some of these costs are borne by private health insurance consumers, who pay higher healthcare premiums to cover increasing obesity-related chronic condi-tions. Other costs are paid by taxpayers through public health insurance programs like Medicare and Medicaid, as well as military health insurance programs such as TRICARE for active military and the Department of Veterans Affairs for veterans and their families. A recent study using a nationally representative sample of U.S. adults found that if the obesity rate remained at the 1970 level (13 percent)—before the surge in obesity—savings to public health insurance programs in 2009 alone would have been $137 billion (MacEwan, Alston, and Okrent 2014). The cumulative savings over the past three decades could have been trillions of dollars.
analysis: diet, obesity, and healthcaRe costs in individual ameRicans
The Union of Concerned Scientists (UCS) reviewed data from the Medical Expenditure Panel Survey (MEPS), which was also used by MacEwan and colleagues, the authors cited above. MEPS is administered by the Agency for Healthcare Research and Quality, a part of the U.S. Department of Health and Human Services, and contains data on respondents’ age, health status, access to healthcare, and medical expenditures. While MEPS does not contain detailed data on food consump-tion patterns, it does ask survey participants whether a doctor has identified them as someone who should reduce their con-sumption of foods high in fat and cholesterol. We considered
A recent study of U.S. adults found that if the obesity rate remained at the 1970 level (13 percent)—before the surge in obesity —savings to public health insurance programs in 2009 alone would have been $137 billion.

8 union of concerned scientists
a “yes” response to be a proxy for a diet high in fat and cholesterol.
Our analysis of young adults ages 18 to 25 reinforced the connection between unhealthy diets and excess weight. We found that respondents who were identified by their doctors as having unhealthy diets had an average BMI of 30, compared to 25 for those not thus identified. (Adults are considered overweight if their BMI is 25 or more and obese if 30 or more.) Average medical expenditures in 2012 for respondents identified as having unhealthy diets were nearly one-third higher—$1,785 compared to $1,355 for those not identified.
Since the prevalence and treatment costs of diet-related chronic diseases increase with age, we examined data for all MEPS respondents, ages 18 to 85, to determine the relation-ship between unhealthy diet, BMI, and medical expenditures. Among this group including middle-aged and older adults, average medical expenditures for those identified as having poor diets were $5,828 per year and $3,055 for those not iden-tified. Participants with unhealthy diets had BMIs that were similarly higher—31 compared to 27 for respondents with healthier diets. These findings further affirm the link between diet, BMI, and medical expenditures, as well as the likelihood for children with obesity to continue incurring obesity-relat-ed healthcare costs as they age. In the context of childhood obesity, focusing on diet is one way to begin reducing higher than average BMIs and future healthcare costs that are largely paid for by taxpayers.
Improving School Food Would Set Children on a Healthier Path to Adulthood
Schools are a critical place to introduce and reinforce healthy behaviors that serve as a strong foundation for childhood de-velopment and increase children’s chances of living healthier lives. The school food environment consists of the meals chil-dren eat there as well as foods available in vending machines, student stores, and concession stands. Since children’s eating habits are formed early on and can influence taste preferences later in life (Forestell and Mennella 2007), it is essential that healthier foods are introduced to them at school. Our analysis of data on individual Americans’ diets, BMI, and medical expenditures suggests that creating healthy eating habits early in childhood could prevent higher healthcare costs in adulthood.
Authorized by Congress, the U.S. Department of Agri-culture (USDA) operates several school meal programs that provide food assistance to schools and childcare institutions. The most prominent of these are the National School Lunch
Unhealthy food access can have negative dietary effects on children from low socioeconomic backgrounds.
programs. (Non-profit programs require a profit to operate; however, any profits must be reinvested in the school meal program.) Schools are allowed to sell “competitive” foods, that is, foods sold in competition with the federal meal pro-gram, through vending machines, student stores, fundraisers, and as á-la-carte items in the cafeteria. Schools often use revenue from competitive foods to help offset losses from low federal reimbursements for meals (Guthrie et al 2013).
Schools choosing to participate in the national school lunch and breakfast programs (nearly all public schools) offer free meals to children from families with incomes at or below 130 percent of the federal poverty level and reduced-price meals to children at or below 185 percent of the federal poverty level. Children from families with incomes greater than 185 per-cent of the federal poverty level can purchase school lunches at the full price. The amount per meal that schools are reimbursed varies based on the percentage of students re-ceiving free, reduced-price, and full-priced meals. In FY 2012, 31.6 million children received lunch through the National School Lunch Program, with approximately 60 percent of these children receiving free and reduced-price (FRP) lunches (FNS 2012).
Schools are particularly important venues for increasing healthy food access among children from low socioeconomic backgrounds. Studies have shown that the FRP meal program increases fruit and vegetable intake among participants
Program and the School Breakfast Program, created to feed “nutritionally needy” children (FNS 2013). The National School Lunch Program, the first federally funded school meal program, was founded in 1946 in response to military needs seen during World War II in which 40 percent of recruits were too malnourished to enlist (FNS 2013). Ironically, many of today’s recruits are no longer too underweight to enlist; rather, they are too overweight (Mission Readiness 2012).
Schools participating in federal meal programs plan meal menus and set prices, while receiving cash subsidies and commodity foods, such as meat, dairy, and grains, from the USDA for use in the programs. School meals must meet nutri-tional standards consistent with the Dietary Guidelines for Americans, and meal programs must operate as non-profit

9Lessons from the Lunchroom
(Ishdorj, Crepinsek, and Jensen 2013; Howard and Prakash 2012). Conversely, unhealthy food access can have negative dietary effects on children from low socioeconomic back-grounds. For example, students from these backgrounds are more likely to consume sugar-sweetened beverages or pur-chase snacks from school vending machines instead of pur-chasing school lunch (Park et al. 2010; Briefel, Wilson, and Gleason 2009; Fernandes 2008). To take a closer look at the importance of school meals for lower-income and racial or ethnic minority children, UCS performed our own analyses.
analysis: school Food’s imPact on childRen’s diets
To date, research focusing on the impact of school food on children’s diets has produced mixed findings. The extent of these findings has been limited due to studies focusing on one point in time, rather than multiple points over time. To add to the existing research aiming to characterize the relationship between school food and children’s diets, we analyzed a
nationally representative dataset to compare the diets of FRP meal participants and non-FRP meal participants.1 Children entering the FRP meal program are already at a socioeconomic disadvantage when they enter the program, and as a consequence are most in need of dietary interven-tion, so understanding how the program affects their consumption patterns is particularly important.
The Early Childhood Longitudinal Study, Kindergarten Class of 1998–99 through 8th Grade is a longitudinal study administered by the National Center for Education Statistics at the U.S. Department of Education. Researchers collected data on the same cohort of children from kindergarten through eighth grade from the children themselves and from parents, teachers, and school administrators. The data in-clude information on children’s demographics, diet, physical activity, weight, and educational experiences. The Depart-ment of Education also administered food frequency surveys to children in the fifth and eighth grade, which occurred in the spring of 2004 and 2007, respectively. Table 2 (p. 10)
1 Non-FRP meal participants include children who were (1) eligible for the FRP meal program and not enrolled, and (2) not eligible (due to income disqualifications) and not enrolled. Approximately 7 percent of children who were eligible for FRP meals were not enrolled.
Behavioral research indicates that attractive presentation of healthy foods increases children’s willingness to try them. Here, elementary school students in Manassas, Virginia, choose among colorful fruit and vegetable offerings.
© U
SDA

10 union of concerned scientists
CharacteristicsFifth-Grade Mean (%)
Eighth-Grade Mean (%)
Children Child weight
Healthy weight (BMI 5th—85th percentile) 64.6 59.6
Overweight (BMI ≥ 85th percentile) 26.4 39.2
Obese (BMI ≥ 95th percentile) 11.8 22.0
Female 47.6 47.6
Male 52.4 52.4
White 63.8 63.8
African-American 11.0 11.0
Hispanic 17.3 17.3
Child has a disability 17.4 17.0
Number of hours per week the child spends watching TV (#) 7.4 7.5
Number of days per week the child exercises 20 minutes (#) 3.8 5.4
Households
Child lives with biological parents 63.1 60.1
Child lives with single mom 19.9 20.4
Child lives with single dad 2.4 2.3
Child lives with non-biological parents 14.6 17.1
Number of family members in household (#) 4.5 4.4
Family receives Supplemental Nutrition Assistance Program benefits 13.8 13.6
Poverty to income ratio (#) 2.7 2.7
Number of days per week the child eats breakfast with family (#) 3.4 3.0
Number of days per week the child eats dinner with family (#) 5.5 5.2
Schools Urban school 27.6 26.7
Rural school 35.7 34.8
Percentage minority students 32.6 33.5
table 2. Description of Fifth- and Eighth-Grade Students Included in the Early Childhood Longitudinal Study, Study Size=2,263
includes a description of the 2,263 students included in our study.
Using data from the Department of Education’s longi-tudinal study, we identified enrollment patterns of students in FRP meal programs. We looked at differences between FRP participants in fifth and eighth grade and found that FRP meal program participation declined from 44 percent
in fifth grade to 36 percent in eighth grade. Additionally, we compared various racial/ethnic and socioeconomic groups enrolled in FRP meal programs with those that were not. The racial/ethnic group with the greatest participation in FRP meal programs in both the fifth and eighth grades was Hispanic. Approximately 77 percent of Hispanic children were enrolled in the FRP meal program, followed by African-

11Lessons from the Lunchroom
Americans (76 percent), and whites (28 percent). Since obesity disproportionately affects Hispanic and African-American children, improving the healthfulness of school meals is an important opportunity for schools to help prevent further gaps in racial/ethnic disparities.
Recognizing that the FRP meal program is designed to benefit many lower-income children, we compared the food intake between FRP meal participants and non-FRP meal participants to determine how well the program was working. As shown in Table 3, after examining the diets of children in and out of school we found that:
• FRP participants ate more fruits and vegetables than non-participants. Fifth-grade FRP meal participants consumed fruits and vegetables more frequently than non-participants (22.2 versus 18.9 times per week). As students aged, children in both groups consumed fruits and vegetables less frequently. However, eighth-grade FRP meal participants continued to eat fruits and vegetables more frequently (19.2 times per week) than non-FRP meal participants (17.6 times per week).
• FRP participants ate more unhealthy foods than non-participants. Fifth-grade FRP meal participants ate fast food more frequently than non-FRP meal participants (3.6 versus 2.6 times per week). They also drank sugary beverages such as soda, sports drinks, fruit drinks, and 100-percent fruit juice more frequently than non-FRP meal participants—13.2 versus 10.6 times per week. In eighth grade, children in both groups consumed sugary bever-ages less frequently (10.6 times per week) than in fifth grade (12.2 times per week).
As students aged, children in both groups consumed fruits and vegetables less frequently.
table 3. Food Frequency Intake of Different Foods for FRP Participants and non-FRP Participants in Fifth and Eighth Grades
The difference between FRP participants and non-FRP participants is statistically significant (at p<.01) for all foods listed except milk.
Food Group
Fifth Grade Eighth Grade
FRP Participants # Servings/Week
Non-FRP Participants
# Servings/Week FRP Participants # Servings/Week
Non-FRP Participants
# Servings/Week
Milk 9.84 12.78 7.85 10.37
Fruit Juice 6.16 4.40 5.65 5.16
Sugar-sweetened Beverages 7.07 6.23 6.41 5.46
Fast Food 3.61 2.60 2.85 2.20
Fruits 9.19 6.73 7.28 6.46 Vegetables 12.58 11.39 12.89 12.16
Total Fruits and Vegetables 22.20 18.98 19.22 17.60
At first glance, it may not seem that one additional fast food meal and sugary drink per week is a significant difference. However, each fast food meal is associated with consuming as many as 310 extra calories for adolescents (Powell and Nguyen 2013), and each sugary beverage is associated with 150 calories. Together, that is approximately 460 added calories per week.
Since FRP meal participants ate more healthy and un-healthy foods than non-FRP meal participants, we examined whether their BMIs differed. Among all children (both FRP and non-FRP participants), from fifth to eighth grade, the percentage of overweight students (BMI ≥ 85th percentile) increased from 25 percent to 35 percent and the percentage of obese students (BMI ≥ 95th percentile) increased from 12 percent to 19 percent. Examining only FRP meal participants, we found that they were more likely to be overweight and obese than non-participants (see Table 4). During the fifth grade, 32 percent of FRP meal participants were overweight and 16 percent were obese, whereas only 23 percent of non-participants were overweight and 10 percent were obese. This disparity only widened by the eighth grade: nearly 50 percent of FRP meal participants were overweight

12 union of concerned scientists
Weight Status
Fifth Grade Eighth Grade
FRP Participants Mean (%)
Non-FRP Participants Mean
(%)FRP Participants
Mean (%)
Non-FRP ParticipantsMean
(%)
Healthy Weight 62.0 66.6 52.2 65.1
Overweight* 30.4 23.3 47.2 33.3
Obese* 14.3 10.0 27.3 17.0
table 4. Weight Status for FRP Participants and non-FRP Participants in Fifth and Eighth Grades
*Difference between FRP participants and non-FRP participants is statistically significant at p<.05 value.
and 30 percent were obese, compared to 30 percent and 17 percent of non-participants, respectively.
In addition to school meals in the cafeteria, students often have access to vending machines, student stores, or con-cession stands that sell food and beverages. Researchers have investigated the influence of these other food options, but previous studies reported mixed findings and did not report differences among subgroups of children classified by their gender, race/ethnicity, and socioeconomic status (Datar and Nicosia 2012, Van Hook and Altman 2012; Anderson and Butcher 2006). In order to better understand the influence of unhealthy food access, we examined the impact of vending machines in schools on BMI by subgroup of children. We calculated changes in BMI and vending machine access for children in the fifth grade and then again in the eighth grade to determine the effects of vending machines on their BMI. By following the same group of children, we were able to attribute changes in BMI specifically to vending machines.
Major findings follow (technical details are provided in an online appendix at www.ucsusa.org/lunchroomlessons):
• Inthefifthgrade,approximately30percentofstudentshad access to vending machines in school. This access increased to 60 percent by eighth grade.
• Amongtheentireschoolpopulation,BMIwasnotaffectedby access to vending machines in school. However, in examining these impacts for children of specific races and ethnicities, we found that access to vending machines led to an increase in the BMI of Hispanic boys by almost 0.5 units, or approximately a 5 percent increase in a child’s body-mass-index-for-age percentile (refer to Table 1 (p. 6) for percentile ranges and weight status). This increase in BMI was even greater among Hispanic boys who were from families with incomes of less than
185 percent of the federal poverty level (0.8 units or approximately a 7.5 percent increase in a child’s body- mass-index-for-age percentile).
The reasons that Hispanic children from lower-income families might be more likely to experience increased BMI due to their use of school vending machines are numerous, including challenges their parents confront preparing healthy meals, likely in part due to a shortage of time for purchasing and preparing food (Lindsay et al. 2009), and language barriers
Access to vending machines led to an increase in the BMI of Hispanic boys by almost 0.5 units.
that impede both children’s and parents’ dietary education (Gray et al. 2005). Since Hispanic children already have the highest incidence of obesity (Ogden 2014), it is imperative that we understand how vending machine access among these children can reinforce existing weight disparities.
Increased investment in healthy school foods can serve as a lifeline for children swimming in a sea of junk food. Overall, our results underscore the importance of providing healthy school food beyond cafeteria walls.
Recent shiFts in nutRition standaRds FoR the FedeRal school meal PRogRam
Prior to 2010, federal standards for schools meals required schools to serve a minimum of one-half to one cup of fruits and vegetables (type not specified), one cup of any type of

13Lessons from the Lunchroom
fruits, vegetables, and whole grains, and fewer calories, less sodium, and no trans-fats. The HHFKA also required that all foods sold at school—even “competitive” foods—be in accor-dance with the Dietary Guidelines for Americans. Under the law, school lunches meeting the new standards were entitled to an additional reimbursement of six cents per meal served (U.S. Congress 2010). More details about the changes to school nutrition standards are shown in Tables 5 and 6 (p. 14).
In 2012, schools began implementing the updated stan-dards in phases. For the 2012–2013 school year, schools were required to meet the fruit and vegetable requirement for lunches and the dairy requirements for both lunch and break-fast. Additionally, half of all grains served during lunch had to consist of at least 50 percent whole grains; for breakfast, this standard was not required until the 2013–2014 school year. As of July 1, 2014, all foods sold in schools participating in the program had to meet the updated nutrition standards, with the exception of more stringent sodium limits, which are slated to be phased in beginning 2017 and finalized in 2022.3
milk (full fat, flavored, etc.), and at least one ounce of grain (whole grains were encouraged but not required), and there were no restrictions on the types of foods sold in vending machines, students stores, and concession stands. Addition-ally, meals had no maximum calorie limits, sodium standards, or trans-fat limits. This absence of restrictions meant that a meal consisting of french fries (considered a vegetable), sugar-sweetened chocolate milk (dairy), and a grilled cheese sandwich on white bread (grain) met the nutrition standard for a taxpayer-subsidized school lunch.
Recognizing the important role that schools played in rising childhood obesity rates, in 2010, Congress sought to bring school meals and snacks into accord with federal dietary guidelines through passage of the Healthy, Hunger-Free Kids Act (HHFKA). The act required the USDA to update nutrition standards for foods sold at school based on recommendations from the Institute of Medicine and in consultation with a variety of stakeholders. Updated stan-dards for school meals and snacks included more servings of
Food Group Pre-2010 Federal School Food Standards Current Federal School Food StandardsFruits Schools were required to offer students ½ to 1 cup
of fruit or vegetable (no specific type required) but students were not required to take fruits or vegetables
• Schools are required to offer each student ½ to 1 cup fruit per student; and
• For reimbursable meals, students are required to take ½ cup serving of fruits or vegetables
Vegetables Schools were required to offer students ½ to 1 cup of fruit or vegetable (no specific type required), but students were not required to take fruits or vegetables
• Schools are required to offer each student ¾ to 1 cup vegetables; and
• For reimbursable meals, students are required to take ½ cup serving of fruits or vegetables; and
• School are required to offer students specific types over the week2
Grains No requirements; schools were encouraged to serve whole-grain products
All grain-based foods must be whole grain-rich (at least 50 percent of the grain content is whole grain)
Milk No requirements Milk must be lower fat, such as fat free or low fat
Water No requirements Water must be readily available at no cost
Competitive Foods Bought from Vending Machines, School Stores, Concession Stands
School could not sell foods of minimal nutritional value such as hard candy and regular soda, or items where the first ingredient was sugar
Items must comply with one of the following:• have 50% whole grains• have the first ingredient be whole grains, fruits,
vegetables, dairy, or a protein contain at least ¼ cup fruit and/or vegetable
table 5. Pre-2010 and Current Federal School Nutrition Standards
Source: adaPted From tHe u.S. goverNmeNt accouNtability oFFice.
2 Schools are required to serve dark green vegetables, red or orange vegetables, beans or peas, starchy vegetables, and “other vegetables” during lunch to students.

14 union of concerned scientists
table 6. Dietary Specifications (To be Met on Average over a Week)
Pre-2010 Federal School Nutrition
Standards
Current Federal School Nutrition
StandardsCalories Minimum requirements
vary by children’s year in school
Minimum and maximum vary by children’s year in school
Fat Less than 10% of total calories could be saturated fat
• Less than 10% of total calories can be saturated fat
• Zero grams of trans-fat are allowed per serving
Sodium Schools were encouraged to serve low-sodium meals
Sodium limits have three-stage targets to be phased in 2014, 2017,
and 2022
3 In December 2014, during the writing of this report, Congress passed legislation allowing schools demonstrating hardship in meeting the “whole grain–rich” standard not to be penalized for failing to meet this standard. Congress also froze the current sodium limits until the USDA demonstrates that further, scheduled reductions in sodium (2017 and 2022) are beneficial to children’s health.
Source: adaPted From tHe u.S. goverNmeNt accouNtability oFFice.
Recent studies show uPdated standaRds aRe imPRoving childRen’s eating habits
The updated school meal standards were only fully imple-mented in the 2014–2015 school year; therefore, researchers are still in the early stages of evaluating their effectiveness at improving children’s diets. But the early evidence is promis-ing. One study analyzed national data from 2005 for schools that had voluntarily adopted nutrition standards that match the updated federal fruit and vegetable requirements for school meals. Results from this study showed that the avail-ability of a greater quantity and wider variety of fruits and vegetables in the cafeteria led to their increased consumption by students. Students were also more likely to try vegetables that were new to them. However, many students did not sample any fruits and vegetables, suggesting that additional strategies, such as nutrition education, are needed to achieve
recommended levels of fruit and vegetable consumption for all children (Newman 2013).
In 2014, the Harvard School of Public Health published one of the first comparisons of schools before and after the updated standards went into effect (Cohen et al. 2014). Researchers measured food selection (students choosing the food) and consumption for 1,030 students in four low-income schools in 2011 (pre-updated standards) and 2012 (post- updated standards). Researchers found that after the updated standards went into effect, students selected on average 23 percent more fruits and consumed 16.2 percent more vegetables. Researchers attributed the increase in part to the new requirement that students had to select at least one-half cup of a fruit or vegetable. These early findings suggest that the impact of the updated nutrition standards on children’s school diets has been mostly positive to date.
In addition to stronger nutrition standards, other strategies to increase the quantity of healthy foods consumed by students include providing behavioral cues in the lunchroom. These simple and affordable strategies can be financially beneficial for schools, many of which operate meal programs on slim margins. Recent studies focusing on healthy food intake among students reveal that strategic placement of healthy
Example o school lunch under the pre-2010 federal school food standards.
© B
en+S
am/C
reat
ive
Com
mon
s (Fl
ickr
)

15Lessons from the Lunchroom
Wansink 2013); and labeling produce with fun, descriptive names such as “creamy corn” and “x-ray vision carrots.” One school labeling produce with fun names increased its fruit and vegetable sales by 30 percent during the first week (Hanks et al. 2012). Combined with updated school nutrition standards, smarter lunchroom designs can help increase the consumption of healthy foods and can increase food sales.
UCS found that before the passage of the HHFKA in 2010, FRP meals had a positive impact on children’s diets, especially among children who were socioeconomically dis-advantaged, but there was room for improvement. FRP meal participants were eating more junk food, had higher obesity rates, and often turned to vending machines (previously untouched by school meal nutrition standards) for their food and beverage purchases. After the passage of HHFKA, school standards were strengthened, and early research findings have shown continued improvement in the foods children consume at school. However, more can and should be done to support schools to continue on the path of improving children’s health. By preserving the updated nutrition standards and implementing easy, cost-effective strategies to nudge children in a healthy direction, we can ensure that everybody wins—children will eat more healthy foods, schools will cover the
food in the cafeteria can increase consumption and sales. In one middle school, the salad bar was moved from against the wall to the center of the cafeteria, and within the first week salad bar sales tripled (Just and Wansink 2009). Other cost-effective changes that have been found to increase children’s consumption of fruits and vegetables include serving salad in clear containers, closing the lid of freezers containing desserts, and placing fresh fruit in baskets near the cash register (Hanks, Just, and Wansink 2013); placing fruit in attractive bowls rather than stainless steel pans (Hanks, Just, and
Researchers found that after the updated standards went into effect, students selected on average 23 percent more fruits and consumed 16.2 percent more vegetables.
Two boys in Washington, DC, discover the great taste of locally sourced strawberries at school. The USDA’s Farm to School Program provides resources to pair school districts and local farmers to create flavorful, healthy school meals.
© U
SDA
16 union of concerned scientists
costs of the school meal programs, and society will be off the hook for covering billions in obesity-related healthcare costs down the road.
Policy Recommendations to Improve Children’s Diets and Their Futures
Research performed by UCS and others underscores the power of schools to improve the daily diets of children, especially those from the most economically disadvantaged backgrounds. Our analysis has demonstrated that healthy school foods can serve as a lifeline for children swimming in a sea of junk food. And our findings suggest that investing in healthier school lunches today could produce economic benefits in the form of billions of dollars in healthcare cost savings tomorrow.
In 2010, the HHFKA took a significant step toward improving nutritional standards for school food by requiring that school meals comply with federal dietary guidelines. Since then, some of the law’s biggest supporters have
changed their position and now oppose many of the law’s key provisions. Their criticisms focus on the challenges some schools have encountered in implementing the new provi-sions, with some reporting higher meal costs, lost revenue, increased plate-waste, and student dissatisfaction with the taste of healthier meals (SNA 2014). But independent analysis has disputed some of these claims (Cohen et al. 2014) and has found that students’ consumption of fruits and vegetables has increased since the law took effect. And while the vast
Investing in healthier school lunches today could produce economic benefits in the form of billions of dollars in healthcare cost savings tomorrow.
© U
SDA
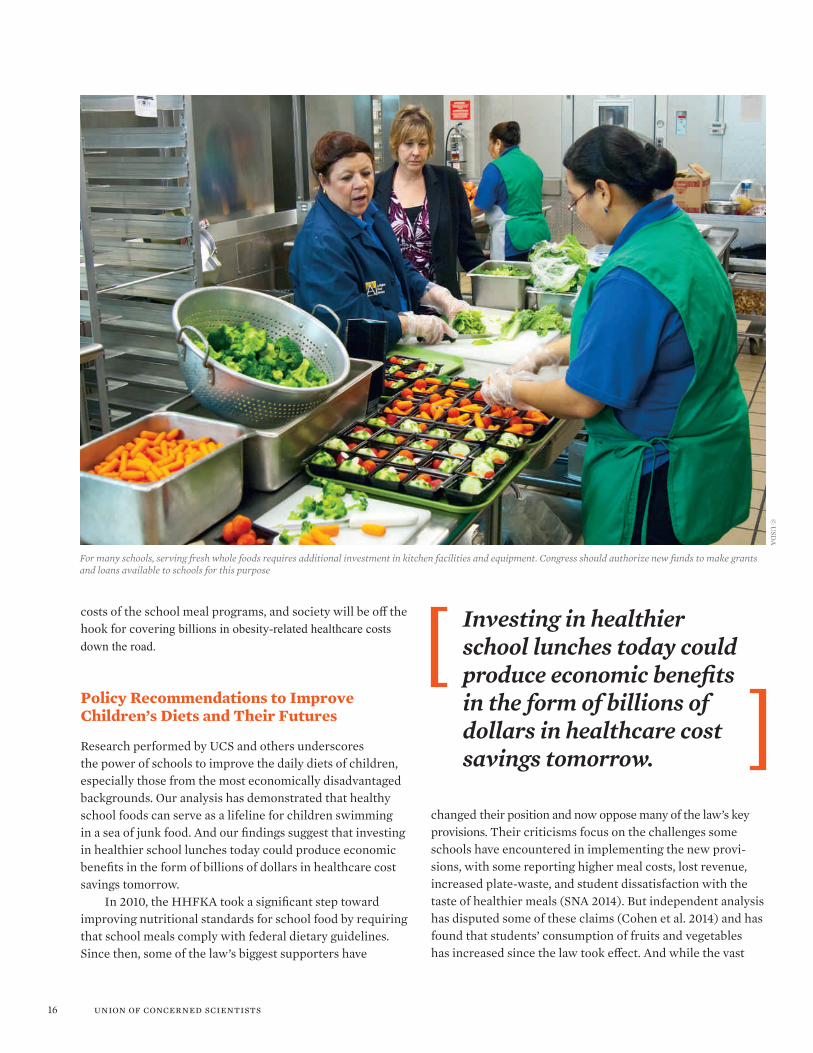
For many schools, serving fresh whole foods requires additional investment in kitchen facilities and equipment. Congress should authorize new funds to make grants and loans available to schools for this purpose

17Lessons from the Lunchroom
box 2.
Improving School Meals with a Farm to School Program in Northeast Iowa
The USDA’s Farm to School Program funds school garden projects that teach children to love vegetables by growing them.
with the goal of increasing their local food purchases by 200 percent.
The Farm to School Grant Program has also enabled schools to create gardens in which children learn to grow some of the produce that they eat in their cafeteria. In several school districts, schools started unlimited “veggie bars” in cafeterias. They also set up a cafeteria mentorship program where middle-school students distribute food samples of produce that they grew in the school garden and encourage younger children to eat more fruit and vegetables.
During the first year of funding from the Farm to School Grant Program, local produce, dairy, and meat purchases by the participating schools in northeastern Iowa increased sharply. From August 2014 to November 2014, participating schools served $33,000 worth of local foods, equivalent to the total cafeteria sales for the previous full year. Emily Anne Neal, director of school outreach for NEIFFI says, “Teachers, students, and food service staff see food not only as source of energy, but also a display of values, for our health, economy, environment, and our communities.” Children are now enjoying their vegetables and even encouraging their parents to buy produce they have learned about in school.
Increased funding for this program would allow more school districts across the country to share in this success. NEIFFI’s experience in just one year demonstrates the potential for the USDA’s Farm to School Grant Program to contribute to thriving local food systems at the same time that it improves child nutrition.
© Io
wa
Food
& F
itnes
s
Across Iowa, corn fields and signs of the meat-packing industry dominate large swaths of the landscape. Access to fresh, local, healthy food can often be a challenge for schools in part due to transportation logistics and high produce prices. This is especially true in the northeastern corner of the state, where a population of roughly 100,000 people— many of whom are lower income—is spread out far and wide geographically.
The Northeast Iowa Food and Fitness Initiative (NEIFFI), established in 2007 with funding from the W. K. Kellogg Foun-dation, works across six rural counties to improve conditions to support healthy lifestyles for residents through active living and nutritious food. Specifically, NEIFFI works to make the region a place where healthy, locally grown foods are abundant and available to all. In consultation with community members, NEIFFI concluded early on that transforming school food in the region would have an important positive impact on children, families, local farmers, and the community.
In 2013, NEIFFI received two years of funding from the USDA’s Farm to School Grant Program. Authorized by Congress in the HHFKA, these grants support schools’ efforts to build connections with farmers and educate children about healthy eating and the origins of their food. With this grant, NEIFFI is collaborating with local farmers and a new “food hub” that will allow farmers to increase production and aggregate their products to meet the purchasing needs of local schools. NEIFFI is working with four rural school districts to expand their farm-to-school programming

18 union of concerned scientists
majority of schools have successfully met implementation targets (GAO 2014), struggling schools have been offered a variety of resources from public and private entities to help them come into compliance with the law.
In the next reauthorization of the law, expected during 2015, UCS recommends that Congress build upon earlier progress and further improve the health prospects of school children. Specifically, we recommend that Congress:
• Protect the gains made in 2010. The vast majority of schools are in compliance with the 2010 law, and support is available for those who are struggling. Retreating from our commitment to healthier school food is not an option in the face of the childhood obesity crisis.
• Prioritize fruits and vegetables. Fruits and vegetables are critically under-consumed by children. More can and should be done to reverse this trend.
– Congress can further encourage fruit and vegetable consumption by offering funding and other incentives for schools to go beyond the minimum fruit and vegetable servings required by HHFKA and to offer these healthy foods as snacks between meals.
– Additional funding for research initiatives to measure changes in fruit and vegetable consumption and track related health outcomes would help to assess program efficacy.
• Increase the federal reimbursement rate for healthy school meals. Our commitment to healthier meals should be backed up with additional funding. Schools have encountered the same reality already known to most Americans—less-healthy processed foods are often cheaper than whole-food ingredients like fresh fruits and vegetables and unprocessed meats. We recommend raising the reimbursement rate for meals in compliance with nutrition standards to allow schools more flexibility to buy the healthiest foods possible.
• Finance kitchen equipment for school cafeterias. Some of the difficulties encountered in implementing new standards are due to a lack of appropriate kitchen equipment. Decades of underinvestment in school kitchens have left many schools with little capacity beyond heat-ing and serving prepared, processed meals. Cooking with whole foods requires food workers to have suitable kitchen equipment such as refrigerators and large-scale slicers to prepare meals from fresh ingredients (PCT and RWJF 2013). Congress should expand the avail- abil-ity of grants and loans to help schools outfit and update their kitchens.
• Improve nutrition education for children. Improving nutrition education in schools can complement efforts to provide children with healthier food by giving them the information they need to make healthier choices (Prelip et al. 2012). We urge Congress to fund nutrition education programs that engage all school staff—from cafeteria workers to teachers—to help children understand the basics of food, nutrition, cooking, and healthy choices.
• Increase funding for the Farm to School Grant Program. This program’s support of educational initia-tives related to food production and nutrition has had documented success in increasing fruit and vegetable consumption among schoolchildren (Bontrager-Yoder et al. 2014). Grants have helped schools establish gardens that allow students to obtain firsthand experience with growing food and have provided financial support to allow schools to source ingredients from local farms. The Farm to School Grant Program has been overwhelmingly popular with schools and their students, and we recom-mend increased funding to leverage its success.
• Not allow politics to trump science. Medical and nutri-tion experts are the best sources for setting nutritional standards for school lunches. Congress should continue to look to these experts for guidance, and push back on any attempts by the food industry and others to roll back these standards.
The Farm to School Grant Program has been overwhelmingly popular with schools and their students.
In only 30 years, childhood obesity rates nearly tripled, disproportionately affecting children from disadvantaged backgrounds and further widening health disparities. Encouragingly, research has shown that initiatives targeting what food is made available to children in schools can help reverse this trend. While away from home, children spend more time in schools than any other place. This gives schools the unique opportunity to positively influence children’s dietary behaviors, but if schools are to play the positive role, they need the resources to purchase, prepare, and serve fresh, nutritious meals and to educate children about their ability to make healthy choices. By investing in healthier school foods today, we can benefit from billions of cost savings tomorrow.

19Lessons from the Lunchroom
acknowledgmentsThis report was was made possible in part through the generous support of the Claneil Foundation, Inc., the Clif Bar Family Foundation, the Bernard F. and Alva B. Gimbel Foundation, the David B. Gold Foundation, the W.K. Kellogg Foundation, the Stephen C. Leuthold Family Foundation, The Martin Foundation, the Tomchin Family Charitable Foundation, and UCS members.
For their reviews of the report, the authors would like to thank Helen Dombalis, MPH, MSW, Policy and Strategic Partnerships Director, National Farm to School Network; Tracy Fox, MPH, RD, Food, Nutrition and Policy Con-sultants, LLC; and Lucia Leone, PhD, Assistant Professor of Community Health and Health Behavior, University at Buffalo. The time they spent reviewing the manuscript was considerable, and their comments and suggestions greatly im-proved it. The authors also wish to acknowledge G. Mark Holmes, PhD, Associate Professor, Department of Health Policy and Management at the University of North Carolina at Chapel Hill, who graciously reviewed this report’s online tech-nical appendix (available at www.ucsusa.org/lunchroomlessons) and provided valuable feedback on the analytic methods. At UCS, the authors thank Sarah Goldberg, Amelia Moore, Pallavi Phartiyal, Ricardo Salvador, Karen Stillerman, and Jenn Yates for their help in developing and refining this report.
The information contained in this report is the sole responsibility of the authors and does not necessarily reflect the opinions of the foundations that sup-ported it or the individuals who reviewed and commented on any portion of it.
referencesAnderson, P.M., and K.F. Butcher. 2006. Reading, writing and
refreshments—are school finances contributing to children’s obesity? Journal of Human Resources 63(3):467–495.
Bhattacharya, J., and M.K. Bundorf. 2009. The incidence of the healthcare costs of obesity. Journal of Health Economics (28):649–658.
Bhattacharya, J., and N. Sood. 2011. Who pays for obesity? Journal of Economic Perspectives 5(1):139–158.
Bontrager Yoder, A.B., J.L. Liebhar, D.J. McCarty, A. Meinen, D. Schoeller, C. Vargas, and T. LaRowe. 2014. Farm to elementary school programming increases access to fruits and vegetables and increases their consumption among those with low intake. Journal of Nutrition Education and Behavior 46(5):341–349.
Briefel, R.R., A. Wilson, and P. Gleason. 2009. Consumption of low-nutrient, energy-dense foods and beverages at school, home, and other locations among school lunch participants and non-participants. Journal of the American Dietetic Association 109(Suppl 2):S79–90.
Cawley, J., and C. Meyerhoefer. 2012. The medical care costs of obesity: An instrumental variables approach. Journal of Healthcare Economics 31:219–230.
Cawley, J., J.A. Rizzo, and K. Haas. 2007. Occupation-specific absen-teeism costs associated with obesity and morbid obesity. Journal of Occupational and Environmental Medicine 49(12):1317–1324.
Centers for Disease Control and Prevention (CDC). 2009. Chronic diseases: The power to prevent, the call to control: At a glance. Online at www.cdc.gov/chronicdisease/resources/publications/AAG/pdf/chronic.pdf, accessed January 20, 2015.
Centers for Disease Control and Prevention (CDC). 1998. Recommendations to prevent and control iron deficiency in the United States. Morbidity and Mortality Weekly Report 47(RR-3):1–28.
Cohen, J.F.,W.S. Richardson, E. Parker, P.J. Catalon, and E.B. Rimm. 2014. Impact of the new U.S. Department of Agriculture school meal standards on food selection, consumption, and waste. American Journal of Preventive Medicine 46(4):388–394.
Datar, A., and N. Nicosia. 2012. Junk food in schools and childhood obesity. Journal of Policy Analysis and Management 31(2):312–337.
Fernandes, M.M. 2008. The effect of soft drink availability in elemen-tary schools on consumption. Journal of the American Dietetic Association 108:1445–1452.
Finkelstein, E.A., I.C. Fiebelkorn, and G. Wang. 2005. The costs of obesity among full-time employees. American Journal of Health Promotion 20(1):45–51.
Finkelstein, E.A., J.G. Trogdon, J.W. Cohen, and W. Dietz. 2009. Annual medical spending attributable to obesity: payer-and service-specific estimates. Health Affairs 28(5):w822–w831.
Food and Nutrition Service (FNS). 2013. School Breakfast Program. Washington, DC: U.S. Department of Agriculture. Online at www.fns.usda.gov/sbp/program-history, accessed January 18, 2015.
Food and Nutrition Service (FNS). 2012. National School Lunch Program: Participation and lunches served. Washington, DC: U.S. Department of Agriculture.
Forestell, C.A., and J.A. Mennella. 2007. Early determinants of fruit and vegetable acceptance. Pediatrics 120(6):1247–1254.
Freedman, D.S., L.K. Khan, M.K. Serdula, W.H. Dietz, S.R. Srinivasan, and G.S. Berenson. 2005. The relation of childhood BMI to adult adiposity: The Bogalusa heart study. Pediatrics 115(1):22–27.
Glazier, R.H., J. Bajcar, N.R. Kennie, and K. Willson. 2006. A system-atic review of interventions to improve diabetes care in socially disadvantaged populations. Diabetes Care 29(7):1675–1688.
Government Accountability Office (GAO). 2014. School lunch: Implementing nutrition changes was challenging and clarification of oversight requirements is needed. Washington, DC.
Gray, V.B., J.S. Cossman, W.L. Dodson, and S.H. Byrd. 2005. Dietary acculturation of Hispanic immigrants in Mississippi. Salud Pública de Mexico. 47(5):351–360.
Guthrie, J.F., C. Newman, K. Ralston, M. Prell, and M. Ollinger. 2013. Competitive foods in schools: Implications for foodservice revenues. Report Number 114 Washington, DC: U.S. Department of Agri-culture, Economic Research Service.
Hanks, A.S., D.R. Just, L.E. Smith, and B. Wansink. 2012. Healthy convenience: Nudging students toward healthier choices in the lunchroom. Journal of Public Health 34:1–7.
Hanks, A.S., D.R. Just, and B. Wansink. 2013. Smarter lunchroom can address new school lunchroom guidelines and childhood obesity. Pediatrics 162:879–869.
Howard, L.L., and N. Prakash. 2012. Do school lunch subsidies change the dietary patterns of children from low-income households? Contemporary Economic Policy 30(3):362–381.
Hux, J.E., and T. Mei. 2003. Patterns of prevalence and incidence of diabetes. In Diabetes in Ontario: An ICES practice atlas, edited by J.E. Hux, G.L. Booth, P.M. Slaughter, and A. Laupacis. Toronto, Canada: Institute for Clinical Evaluative Sciences.
Ishdorj, A., M.K. Crepinsek, and H.H. Jensen. 2013. Children’s consumption of fruits and vegetables: Do school environment and policies affect choices at school and away from school? Applied Economic Perspectives and Policy 35(2):341–359.
Just, D.R., and B. Wansink. 2009. Smarter lunchrooms: Using behav-ioral economics to improve meal selection. Choices 24(3):1–7.
Lindsey Haynes-Maslow, PhD, MHA, is a food systems and health analyst in the UCS Food and Environment Program. Jeffrey K. O’Hara, PhD, is an agricultural economist in the program.
web: www.ucsusa.org printed on recycled paper using vegetable-based inks © FEBuRaRy 2015 union of concerned scientists
NatioNal Headquarters Two Brattle SquareCambridge, MA 02138-3780Phone: (617) 547-5552Fax: (617) 864-9405
WasHiNgtoN, dC, offiCe1825 K St. NW, Suite 800Washington, DC 20006-1232Phone: (202) 223-6133Fax: (202) 223-6162
West Coast offiCe500 12th St., Suite 340Oakland, CA 94607-4087Phone: (510) 843-1872Fax: (510) 843-3785
MidWest offiCeOne N. LaSalle St., Suite 1904Chicago, IL 60602-4064Phone: (312) 578-1750Fax: (312) 578-1751
The Union of Concerned Scientists puts rigorous, independent science to work to solve our planet’s most pressing problems. Joining with citizens across the country, we combine technical analysis and effective advocacy to create innovative, practical solutions for a healthy, safe, and sustainable future.
find this document online: www.ucsusa.org/lunchroomlessons
Lindsay, A.C., K.M. Sussner, M.L. Greaney, and K.E. Peterson. 2009. Influence of social context on eating, physical activity, and sedentary behaviors of Latina mothers and their preschool-aged children. Health Education and Behavior 36(1):81–96.
MacEwan, J.P., J.M. Alston, and A.M. Okrent. 2014. The consequences of obesity for the external costs of public health insurance in the United States. Applied Economic Perspectives and Policy 36(4):1–21.
Marshall, T.A., S.M. Levy, B.A. Broffitt, J.J. Warren, J.M. Eichenberger-Gilmore, T.L. Burns, and P.J. Stumbo. 2003. Dental caries and beverage consumption in young children. Pediatrics 112:e184–e191.
Mission: Readiness: Military Leaders for Kids. 2012. Still too fat to fight. Washington, DC. Online at http://cdn.missionreadiness.org/MR_ Too_Fat_to_Fight-1.pdf, accessed January 4, 2015.
Mocan, N.H., and E. Tekin. 2009. Obesity, self-esteem, and wages. Working paper no. 15101. Cambridge, MA: National Bureau of Economic Research.
National Center for Health Statistics (NCHS). 2013. NHANES response rates. Atlanta, GA: Centers for Disease Control and Prevention. Online at www.cdc.gov/nchs/nhanes/response_rates_CPS.htm. 2011, accessed January 20, 2015.
Newman, C. 2013. Fruit and vegetable consumption by school lunch participants. Report Number 154. Washington, DC: U.S. Department of Agriculture, Economic Research Service.
Ogden, C.L., M.D. Carroll, B.K. Kit, and K.M. Flegal. 2014. Prevalence of childhood and adult obesity in the United States, 2011-2012. Journal of the American Medical Association 311(8):806–814.
Olshansky, S.J., D.J. Passaro, R.C. Hershow, J. Layden, B.A. Carnes, J. Brody, L. Hayflick, R.N. Butler, D.B. Allison, and D.S. Ludwig. 2005. Potential decline in the life expectancy in the United States in the 21st century. New England Journal of Medicine 352:1138–1145.
Park, S., W.M. Sappenfield, Y. Huang, B. Sherry, and D.M. Bens. 2010. The impact of the availability of school vending machines on eating behavior during lunch: The youth physical activity and nutrition survey. Journal of the American Dietetic Association 110:1532–1536.
The Pew Charitable Trusts and the Robert Wood Johnson Foundation (PCT and RWJF). 2013. Serving healthy school meals: U.S. schools need updated kitchen equipment. Online at www.pewtrusts. org/~/media/Assets/2013/12/KITS_Equipment_Report.pdf.
Powell, L.M., and B.T. Nguyen. 2013. Fast-food and full-service restau-rant consumption among children and adolescents: Effect on energy, beverage, and nutrient intake. Archives of Pediatric and Adolescent Medicine 167(1):14–20.
Prelip, M., J. Kinsler, C.L. Thai, J.T. Erausquin, and W. Slusser. 2012. Evaluation of a school-based multicomponent nutrition education program to improve young children’s fruit and vegetable consump-tion. Journal of Nutrition Education and Behavior 44(4):310–318.
Puhl, R., and K.D. Brownell. 2011. Bias, discrimination, and obesity. Obesity Research 9(12):788–805.
Singh, G.K., M. Siahpush, and M.D. Kogan. 2010. Rising social inequalities in U.S. childhood obesity, 2003-2007. American Education Journal 20(1):40–52.
Skelton, J.A., S.R. Cook, P. Auinger, J.D. Klein, and S.E. Barlow. 2009. Prevalence and trends of severe obesity among U.S. children and adolescents. Academy of Pediatrics 9(5):322–329.
School Nutrition Association (SNA). 2014. 2014 position paper talking points. Online at http://www.schoolnutrition.org/uploadedFiles/Legislation_and_Policy/SNA_Policy_Resources/2014PositionPaper.pdf. accessed December 19, 2014.
Strauss, R.S. 2000. Childhood obesity and self-esteem. Pediatrics 105(1):e15.
Taras, H., and W. Potts-Datema. 2005. Obesity and student performance at school. Journal of School Health 75(8):291–295.
Trogdon, J.G., E.A. Finkelstein, P.S. Dellea, and S.J. Kaamal-Bahl. 2008. Indirect costs of obesity: A review of the current literature. Obesity Reviews 9:489–500.
Trudeau, F., and R.J. Shephard. 2010. Relationships of physical activity to brain health and the academic performance of school children. American Journal of Lifestyle Medicine 4:138–150.
U.S. Congress. 2010. Healthy-Hunger Free Act. Public law 111-296, 111th Congress, December 13, 2010.
Van Hook, J., and C.E. Altman. 2012. Competitive food sales in schools and childhood obesity: A longitudinal study. Sociology of Education 85(1):23–29.
Whitney, E., and S. Rolfes. 1999. Understanding nutrition, 8th edition. Belmont, CA: Wadsworth Publishing Company.
![multilingual.mpls.k12.mn.usmultilingual.mpls.k12.mn.us/uploads/newcomerguidefor... · Web view(Lunchroom, Bilingual AE, ESL teacher) [SEC for lunchroom, AE, ESL] Introduce Student](https://static.fdocuments.net/doc/165x107/5ade9a367f8b9a8f298bce2b/viewlunchroom-bilingual-ae-esl-teacher-sec-for-lunchroom-ae-esl-introduce.jpg)