SERIES TITLE OPTIONAL Automaker Rankings 2018 · Market Segmentation Used by UCS, Compared to...
50
Automaker Rankings 2018 The Environmental Performance of Car Companies
Transcript of SERIES TITLE OPTIONAL Automaker Rankings 2018 · Market Segmentation Used by UCS, Compared to...
series title optional
Automaker Rankings 2018The Environmental Performance of Car Companies

Automaker Rankings 2018The Environmental Performance of Car Companies
Dave Cooke
June 2018
ii union of concerned scientists
© 2018 Union of Concerned ScientistsAll Rights Reserved
Dave Cooke is an analyst in the Clean Vehicles Program at UCS, specializing in both light- and heavy-duty vehicle fuel economy. He conducts research on fuel efficiency technologies and the implications for oil consumption and global warming emissions across the transportation sector.
The Union of Concerned Scientists puts rigorous, independent science to work to solve our planet’s most pressing problems. Joining with people across the country, we combine technical analysis and effective advocacy to create innovative, practical solutions for a healthy, safe, and sustainable future.
More information about UCS and the Clean Vehicles Program is available on the UCS website: www.ucsusa.org.
This report is available online (in PDF format) at www.ucsusa.org/autorankings2018.
Designed by:David Gerratt, Acton, MAwww.NonprofitDesign.com
Cover photo: RainerPlendl/iStockphotoPrinted on recycled paper
iiiAutomaker Rankings 2018
v Figures, Tables, and Boxes
vii Acknowledgments
1 executive summary
chapter 1
5 Introduction
5 Brief Description of the Methodology
chapter 2
7 Automaker Performance
7 A Historical Look at Emissions from Passenger Vehicles
8 Automaker Performance Overall
9 Automaker Performance by Vehicle Class
11 Historical Performance and Trends by Vehicle Class
chapter 3
12 Technology
12 Gasoline Direct Injection
13 Cylinder Deactivation
13 Boosted Engines
14 Advanced Transmissions
15 Stop-Start Systems
16 Hybrids and Electric Vehicles
17 Reducing Vehicle Load
18 Reducing Smog-Forming Emissions
20 Summary
[ contents ]
iv union of concerned scientists
chapter 4
21 Consumer Choice
21 Small Cars: Chevrolet Cruze
22 Midsize Cars: Hyundai Sonata
22 Small SUVs: Honda CR-V
23 Standard SUVs: Volvo XC90
23 Pickups: Ford F-150
24 Consumer Savings
chapter 5
25 Looking to the Future
25 Coming Soon to a Dealership Near You
29 Automaker Leadership?
31 Conclusions
32 References
35 Appendix: Methodology
vAutomaker Rankings 2018
[ figures, tables, and boxes ]
figures
2 Figure ES-1. Average Emissions from Light-Duty Vehicles Sold
by the Top Eight Automakers, 1998–2017
4 Figure ES-2. Penetration of an Assortment of Technologies to Reduce
Emissions from the 2008 and 2017 New Vehicle Fleets
4 Figure ES-3. Average Fuel Economy over Time, by Vehicle Segment
8 Figure 1. Average Emissions from Light-Duty Vehicles Sold by the
Top Eight Automakers, 1998–2017
11 Figure 2. Average Fuel Economy over Time, by Vehicle Segment
12 Figure 3. Penetration of Gasoline Direct Injection for the 2008 and
2017 New Vehicle Fleets
13 Figure 4. Penetration of Cylinder Deactivation for the 2008 and
2017 New Vehicle Fleets
14 Figure 5. Penetration of Boosted Engines for the 2008 and
2017 New Vehicle Fleets
15 Figure 6. Penetration of Advanced Transmissions for the 2008 and
2017 New Vehicle Fleets
15 Figure 7. Penetration of Stop-Start Systems in the 2008 and 2017
New Vehicle Fleets
16 Figure 8. Fraction of Electric Vehicles Sold in Model Years 2008
and 2017
18 Figure 9. Penetration of Active Aerodynamic Technology in the 2008
and 2017 New Vehicle Fleets
19 Figure 10. Penetration of Advanced Emissions Controls in the 2008
and 2017 New Vehicle Fleets
20 Figure 11. Penetration of an Assortment of Technologies to
Reduce Emissions from the 2008 and 2017 New Vehicle Fleets
vi union of concerned scientists
tables
3 Table ES-1. Environmental Impact of Vehicles Sold in MY2017
9 Table 1. Global Warming and Smog-Forming Emissions and Scores
for Vehicles Sold in MY2017
10 Table 2. Environmental Performance in Each Vehicle Class,
by Full-Line Manufacturer
11 Table 3. Change in Fuel Consumption and Market Share since
Modern Fuel Economy and Emissions Standards Went into Effect,
by Vehicle Class
14 Table 4. Engine Size Distribution in 2008 and 2017
37 Table A-1. Market Segmentation Used by UCS, Compared
to European and EPA Standards
38 Table A-2. Weighting of Sources of Electricity for Electric Vehicles,
by eGRID Subgrid
boxes
3 Box ES-1. The Union of Concerned Scientists Is No Longer Awarding
a Greenest Automaker Title
6 Box 1. The Union of Concerned Scientists Is No Longer Awarding
a Greenest Automaker Title
27 Box 2. Are Automakers Going “All-Electric”?
viiAutomaker Rankings 2018
This work was made possible by support from The Energy Foundation, Foundation M, The Bernard F. and Alva B. Gimbel Foundation, The William and Flora Hewlett Foundation, NoraLee and Jon Sedmak, and UCS members.
The author would like to thank Don Anair and Michelle Robinson for their always insightful comments, and also thanks to Katherine Catalano, Alyssa Tsuchiya, Seth Michaels, and Dave Reichmuth for their perceptive feedback. Many thanks also to Cynthia Williams for editing, David Gerratt for layout and design, and Heather Tuttle for production oversight.
We would like to thank peer reviewers Tom Cackette and Razno Breznay for their input on this report. Although the reviewers provided many constructive comments and suggestions, they were not asked to endorse our conclusions.
Organizational affiliations are listed for identification purposes only. The opinions expressed herein do not necessarily reflect those of the organizations that funded the work or the individuals who reviewed it. The Union of Concerned Scientists bears sole responsibility for the report’s content.
[ acknowledgments ]

viii union of concerned scientists
1Automaker Rankings 2018
Automaker Rankings 2018 measures environmental performance based on the global warming and smog-forming emissions of new vehicles sold in the United States. This analysis, our seventh such report since 2000, looks at automakers’ levels of emissions, the technologies deployed to reduce these emissions, and ways to ensure continued progress.
[ executive summary ]
Viktor Hanacek/picjumbo
Historical Perspective
Manufacturers have achieved a record low in emissions from the average new vehicle (Figure ES-1, p. 2). However, the pace of reductions is slowing. Toyota exemplifies this trend—the average vehicle it sold in 2017 emits more global warming emissions than those it sold in 2013, when we last assessed the fleet. Ford and Hyundai-Kia showed similar difficulty in improving their fleets, with average global warming emissions from their vehicles flatlining compared with the previous report. This slowed pace indicates the need to step up efforts to reduce emissions.
Some of this slowdown is a result of the industry-wide shift in sales from cars to SUVs. However, a closer analysis shows that not all manufacturers invest equally to reduce emissions from the vehicles they sell, regardless of the fleet mix. Some automakers have been able to continue to ratchet down their average emissions, even as SUVs make up a great-er share of their sales. Honda, for example, has shifted 15 per-cent of its sales from cars to SUVs since 2008, on par with the industry as a whole, even as the company has shown steady progress at reducing emissions (81 g/mile, or 18 percent). On the other hand, while Toyota has seen a slightly larger-than-average chunk of its sales move from cars to SUVs (an increase of 22 percent), it has seen less than half the reductions in the average emissions of its vehicles compared with Honda
(36 g/mile, or 8 percent)—the least of any major manufacturer. This outsized lack of progress is only explained by Toyota’s stagnation in improving the efficiency of the very vehicles in which it is increasing sales, its SUVs.
Federal vehicle standards were designed in consultation with the industry to push manufacturers to provide more efficient vehicles in every class, but not all manufacturers are striving equally to live up to their end of the deal. With manufacturers’ efforts to lobby for weaker fuel economy and emissions standards, the industry is entering a period of tremendous uncertainty—how automakers emerge depends on the level of leadership they show in providing consumers with more efficient vehicles of all types.
Industry Perspective
Honda finds itself the major manufacturer with the lowest average emissions, but that position places the company well behind Tesla in overall performance (Table ES-1, p. 3). Innovation by smaller manufacturers constitutes one of the key reasons that the Union of Concerned Scientists will no longer recognize the title of Greenest Automaker (Box ES-1, p. 3): bold leadership toward a more sustainable future is not limited to innovation from large, full-line automakers.
When it comes to industry laggards, the Detroit Three continue to fall well behind the pack. To give a sense of scale,
2 union of concerned scientists
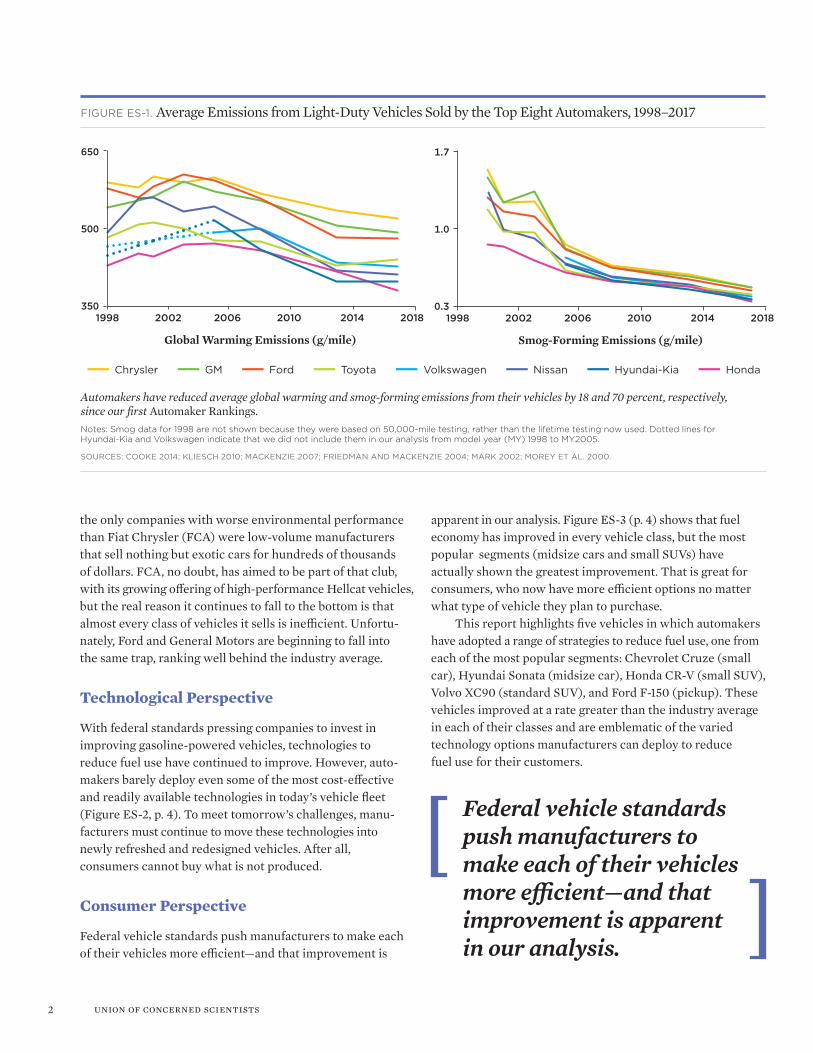
figure eS-1. Average Emissions from Light-Duty Vehicles Sold by the Top Eight Automakers, 1998–2017
—— Chrysler —— gM —— ford —— Toyota —— Volkswagen —— Nissan —— Hyundai-Kia —— Honda
1998 2002 2006 2010 2014 2018
650
500
350
Global Warming Emissions (g/mile)
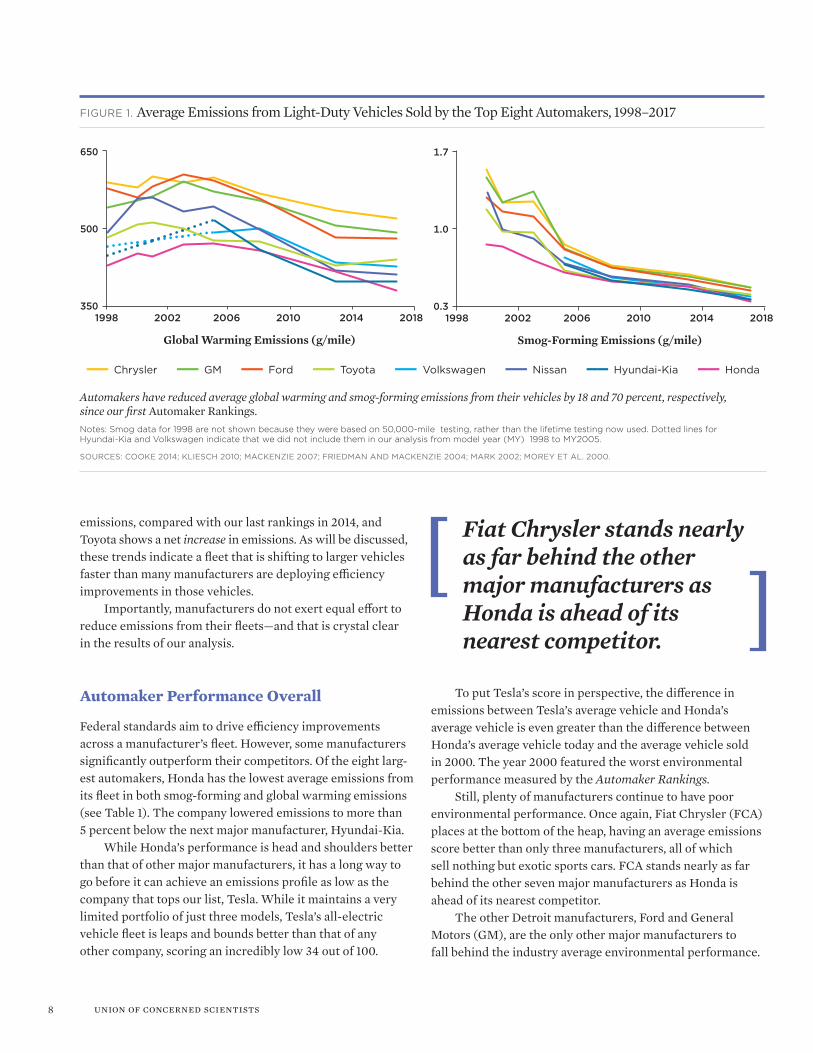
Automakers have reduced average global warming and smog-forming emissions from their vehicles by 18 and 70 percent, respectively, since our first Automaker Rankings. Notes: Smog data for 1998 are not shown because they were based on 50,000-mile testing, rather than the lifetime testing now used. Dotted lines for Hyundai-Kia and Volkswagen indicate that we did not include them in our analysis from model year (MY) 1998 to MY2005.
SOurCeS: COOKe 2014; KlieSCH 2010; MaCKeNzie 2007; friedMaN aNd MaCKeNzie 2004; MarK 2002; MOrey eT al. 2000.
1998 2002 2006 2010 2014 2018
1.7
1.0
0.3
Smog-Forming Emissions (g/mile)
the only companies with worse environmental performance than Fiat Chrysler (FCA) were low-volume manufacturers that sell nothing but exotic cars for hundreds of thousands of dollars. FCA, no doubt, has aimed to be part of that club, with its growing offering of high-performance Hellcat vehicles, but the real reason it continues to fall to the bottom is that almost every class of vehicles it sells is inefficient. Unfortu-nately, Ford and General Motors are beginning to fall into the same trap, ranking well behind the industry average.
Technological Perspective
With federal standards pressing companies to invest in improving gasoline-powered vehicles, technologies to reduce fuel use have continued to improve. However, auto-makers barely deploy even some of the most cost-effective and readily available technologies in today’s vehicle fleet (Figure ES-2, p. 4). To meet tomorrow’s challenges, manu-facturers must continue to move these technologies into newly refreshed and redesigned vehicles. After all, consumers cannot buy what is not produced.
Consumer Perspective
Federal vehicle standards push manufacturers to make each of their vehicles more efficient—and that improvement is
apparent in our analysis. Figure ES-3 (p. 4) shows that fuel economy has improved in every vehicle class, but the most popular segments (midsize cars and small SUVs) have actually shown the greatest improvement. That is great for consumers, who now have more efficient options no matter what type of vehicle they plan to purchase.
This report highlights five vehicles in which automakers have adopted a range of strategies to reduce fuel use, one from each of the most popular segments: Chevrolet Cruze (small car), Hyundai Sonata (midsize car), Honda CR-V (small SUV), Volvo XC90 (standard SUV), and Ford F-150 (pickup). These vehicles improved at a rate greater than the industry average in each of their classes and are emblematic of the varied technology options manufacturers can deploy to reduce fuel use for their customers.
Federal vehicle standards push manufacturers to make each of their vehicles more efficient—and that improvement is apparent in our analysis.
3Automaker Rankings 2018
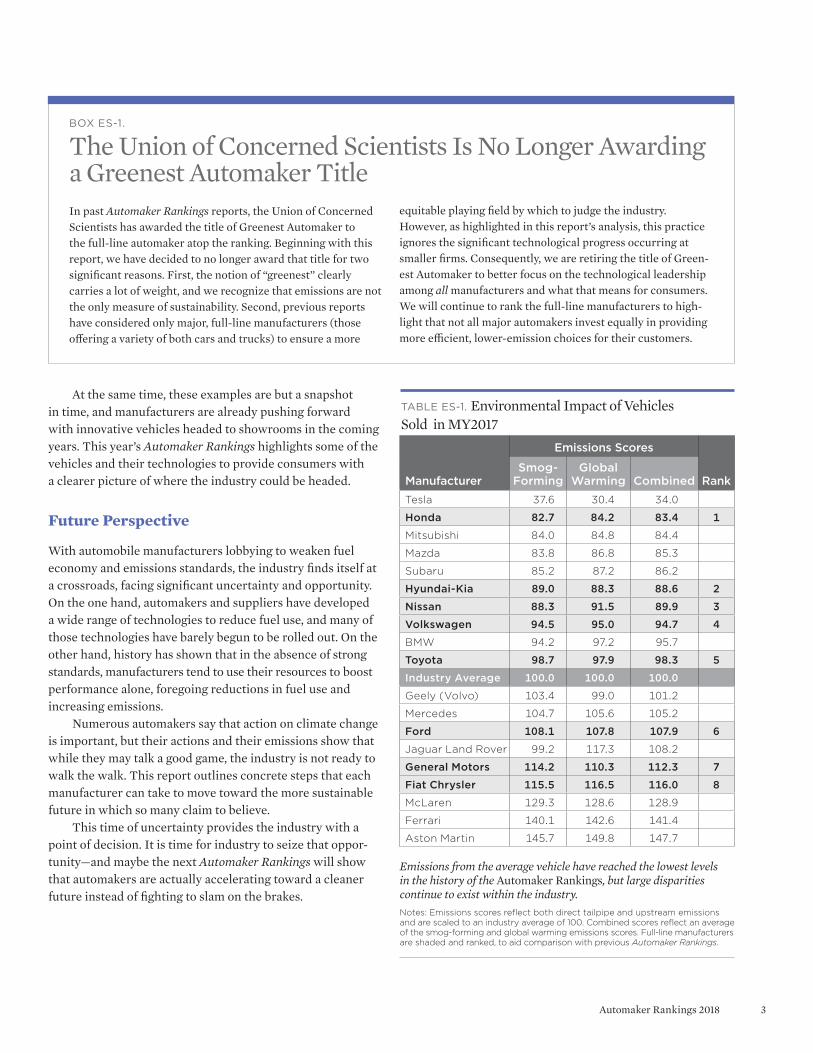
Table eS-1. Environmental Impact of Vehicles Sold in MY2017
At the same time, these examples are but a snapshot in time, and manufacturers are already pushing forward with innovative vehicles headed to showrooms in the coming years. This year’s Automaker Rankings highlights some of the vehicles and their technologies to provide consumers with a clearer picture of where the industry could be headed.
Future Perspective
With automobile manufacturers lobbying to weaken fuel economy and emissions standards, the industry finds itself at a crossroads, facing significant uncertainty and opportunity. On the one hand, automakers and suppliers have developed a wide range of technologies to reduce fuel use, and many of those technologies have barely begun to be rolled out. On the other hand, history has shown that in the absence of strong standards, manufacturers tend to use their resources to boost performance alone, foregoing reductions in fuel use and increasing emissions.
Numerous automakers say that action on climate change is important, but their actions and their emissions show that while they may talk a good game, the industry is not ready to walk the walk. This report outlines concrete steps that each manufacturer can take to move toward the more sustainable future in which so many claim to believe.
This time of uncertainty provides the industry with a point of decision. It is time for industry to seize that oppor-tunity—and maybe the next Automaker Rankings will show that automakers are actually accelerating toward a cleaner future instead of fighting to slam on the brakes.
In past Automaker Rankings reports, the Union of Concerned Scientists has awarded the title of Greenest Automaker to the full-line automaker atop the ranking. Beginning with this report, we have decided to no longer award that title for two significant reasons. First, the notion of “greenest” clearly carries a lot of weight, and we recognize that emissions are not the only measure of sustainability. Second, previous reports have considered only major, full-line manufacturers (those offering a variety of both cars and trucks) to ensure a more
bOx eS-1.
The Union of Concerned Scientists Is No Longer Awarding a Greenest Automaker Title
equitable playing field by which to judge the industry. However, as highlighted in this report’s analysis, this practice ignores the significant technological progress occurring at smaller firms. Consequently, we are retiring the title of Green-est Automaker to better focus on the technological leadership among all manufacturers and what that means for consumers. We will continue to rank the full-line manufacturers to high-light that not all major automakers invest equally in providing more efficient, lower-emission choices for their customers.
Manufacturer
Emissions Scores
RankSmog-
FormingGlobal
Warming CombinedTesla 37.6 30.4 34.0
Honda 82.7 84.2 83.4 1
Mitsubishi 84.0 84.8 84.4
Mazda 83.8 86.8 85.3
Subaru 85.2 87.2 86.2
Hyundai-Kia 89.0 88.3 88.6 2
Nissan 88.3 91.5 89.9 3
Volkswagen 94.5 95.0 94.7 4
BMW 94.2 97.2 95.7
Toyota 98.7 97.9 98.3 5
Industry Average 100.0 100.0 100.0
Geely (Volvo) 103.4 99.0 101.2
Mercedes 104.7 105.6 105.2
Ford 108.1 107.8 107.9 6
Jaguar Land Rover 99.2 117.3 108.2
General Motors 114.2 110.3 112.3 7
Fiat Chrysler 115.5 116.5 116.0 8
McLaren 129.3 128.6 128.9
Ferrari 140.1 142.6 141.4
Aston Martin 145.7 149.8 147.7
Emissions from the average vehicle have reached the lowest levels in the history of the Automaker Rankings, but large disparities continue to exist within the industry. Notes: Emissions scores reflect both direct tailpipe and upstream emissions and are scaled to an industry average of 100. Combined scores reflect an average of the smog-forming and global warming emissions scores. Full-line manufacturers are shaded and ranked, to aid comparison with previous Automaker Rankings.

4 union of concerned scientists
figure eS-2. Penetration of an Assortment of Technologies to Reduce Emissions from the 2008 and 2017 New Vehicle Fleets
My2008
My2017
Gasoline Direct
Injection
Cylinder Deactivation
Boosted Engines
Stop-Start Electric Vehicles
Active Aerodynamics
Advanced EmissionsControls
Advanced Transmissions
100%
90%
80%
70%
60%
50%
40%
30%
20%
10%
0%
Mar
ket S
hare
(%)
All technologies illustrated have seen substantial growth in market share as a result of strong fuel economy and emissions standards. However, no technology highlighted is deployed in even close to 100 percent of the fleet, indicating room for further deployment to continue progress and meet even stronger standards over the next decade.
figure eS-3. Average Fuel Economy over Time, by Vehicle Segment
Industry Average
Small Cars Midsize Cars
Sports Cars
Small SUVs
Pickups VansLarge Cars
35
30
25
20
15
10
5
0
Mile
s pe
r G
allo
n
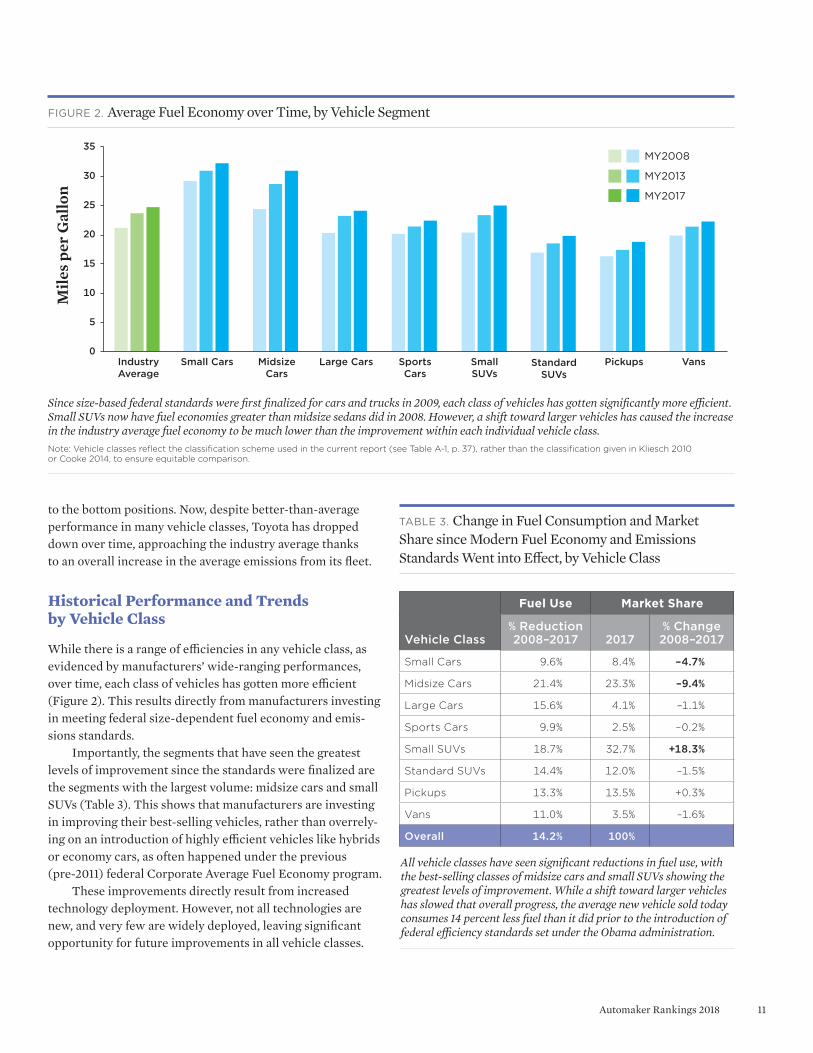
Since size-based federal standards were first finalized for cars and trucks in 2009, each class of vehicles has gotten significantly more efficient. Small SUVs now have fuel economies greater than midsize sedans did in 2008. However, a shift toward larger vehicles has caused the increase in the industry average fuel economy to be much lower than the improvement within each individual vehicle class.Note: Vehicle classes reflect the classification scheme used in the current report (see Table A-1, p. 37), rather than the classification given in Kliesch 2010 or Cooke 2014, to ensure equitable comparison.
My2008
My2013
My2017
Standard SUVs

5Automaker Rankings 2018
Introduction
[ chapter 1 ]
Ever since the mass-market Ford Model T first rolled off the line, the automobile has been a mainstay of American culture. A driver of that iconic Model T could expect fuel economy up to 21 miles per gallon (mpg) (Ford n.d.). While a lot has changed over the past century to make vehicles safer and more comfortable, the Model T’s level of efficiency is still better than one-fourth of all vehicles sold in 2017.
To help both drivers and automakers better understand the environmental performance of light-duty vehicles and how it has changed over the years, the Union of Concerned Scientists (UCS) has published Automaker Rankings every few years since 2000. This report, the seventh in that series, uses the most recent information on both global warming and smog-forming emissions to assess all manufacturers and rank the top eight full-line automakers on their vehicles’ environmental performance. The report also helps identify leaders and laggards. For the first time, in this report, we have included smaller manufacturers in our analysis. As a result of this and other changes, we will no longer crown a Greenest Automaker (Box 1, p. 6).
Brief Description of the Methodology
To develop our rankings, we measure the average per-mile emissions for each light-duty vehicle sold by each automaker. This method ensures that the best overall scores go to those automakers that show strong environmental performance across their product lines, not those that sell a few “green” models.
To determine global warming emissions, we consider the fuel economy, fuel type, and sales volume of each type of vehicle sold by each automaker in the 2017 model year
(MY2017). We consider the upstream global warming emissions from producing and distributing the fuel used by each vehicle, as well as emissions from the vehicles them-selves. Together, those sources account for almost 90 percent of the global warming pollution a conventional vehicle pro-duces across its entire life cycle (Nealer, Reichmuth, and Anair 2015).
We then calculate the sales-weighted average global warming emissions for each automaker, as well as for the entire new passenger vehicle fleet. We assign the industry average a score of 100 and then give each automaker a score indexed to the industry average. A score of 80 for an auto-maker indicates that its average light-duty vehicle has global warming emissions equal to 80 percent of the industry average—that is, 20 percent better than average. A score of more than 100 indicates a worse-than-average performance.
To calculate smog-forming emissions for each vehicle, we similarly consider tailpipe emissions of nonmethane organic gases (NMOG) and nitrogen oxides (NOx), which together contribute to smog in the presence of sunlight, as well as those emissions during the production and distribution
Ever since the mass-market Ford Model T first rolled off the line, the automobile has been a mainstay of American culture.
6 union of concerned scientists
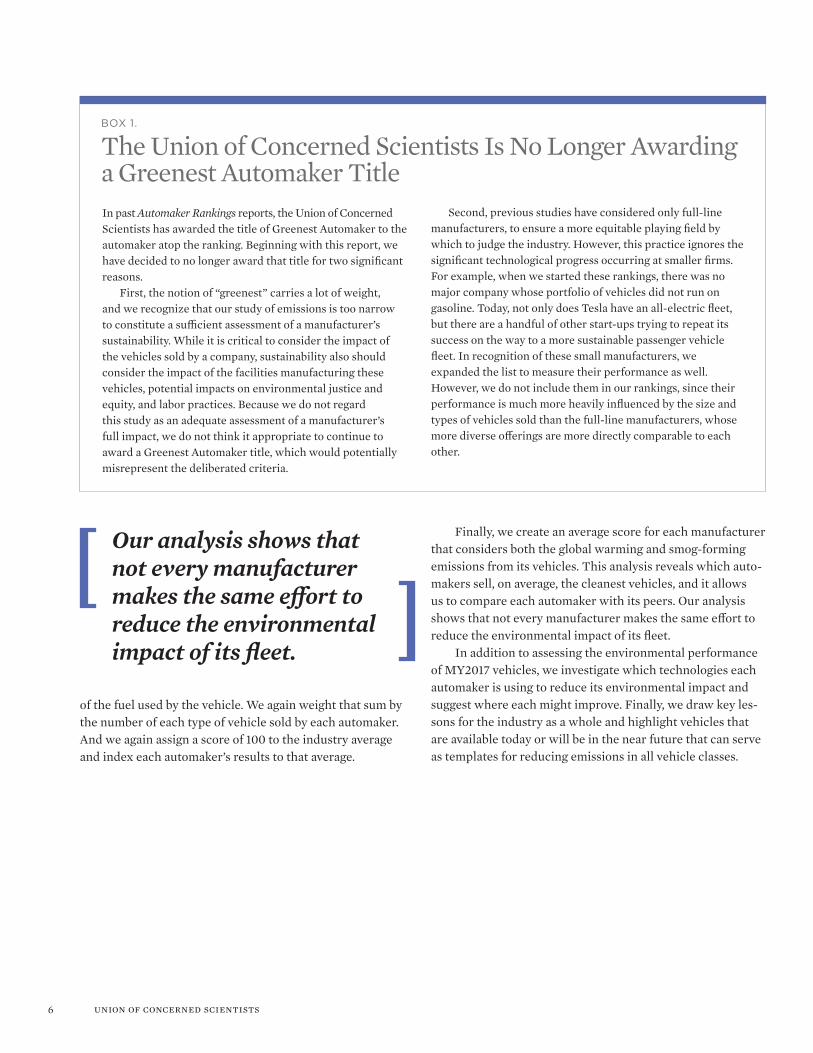
Our analysis shows that not every manufacturer makes the same effort to reduce the environmental impact of its fleet.
of the fuel used by the vehicle. We again weight that sum by the number of each type of vehicle sold by each automaker. And we again assign a score of 100 to the industry average and index each automaker’s results to that average.
In past Automaker Rankings reports, the Union of Concerned Scientists has awarded the title of Greenest Automaker to the automaker atop the ranking. Beginning with this report, we have decided to no longer award that title for two significant reasons. First, the notion of “greenest” carries a lot of weight, and we recognize that our study of emissions is too narrow to constitute a sufficient assessment of a manufacturer’s sustainability. While it is critical to consider the impact of the vehicles sold by a company, sustainability also should consider the impact of the facilities manufacturing these vehicles, potential impacts on environmental justice and equity, and labor practices. Because we do not regard this study as an adequate assessment of a manufacturer’s full impact, we do not think it appropriate to continue to award a Greenest Automaker title, which would potentially misrepresent the deliberated criteria.
bOx 1.
The Union of Concerned Scientists Is No Longer Awarding a Greenest Automaker Title
Second, previous studies have considered only full-line manufacturers, to ensure a more equitable playing field by which to judge the industry. However, this practice ignores the significant technological progress occurring at smaller firms. For example, when we started these rankings, there was no major company whose portfolio of vehicles did not run on gasoline. Today, not only does Tesla have an all-electric fleet, but there are a handful of other start-ups trying to repeat its success on the way to a more sustainable passenger vehicle fleet. In recognition of these small manufacturers, we expanded the list to measure their performance as well. However, we do not include them in our rankings, since their performance is much more heavily influenced by the size and types of vehicles sold than the full-line manufacturers, whose more diverse offerings are more directly comparable to each other.
Finally, we create an average score for each manufacturer that considers both the global warming and smog-forming emissions from its vehicles. This analysis reveals which auto-makers sell, on average, the cleanest vehicles, and it allows us to compare each automaker with its peers. Our analysis shows that not every manufacturer makes the same effort to reduce the environmental impact of its fleet.
In addition to assessing the environmental performance of MY2017 vehicles, we investigate which technologies each automaker is using to reduce its environmental impact and suggest where each might improve. Finally, we draw key les-sons for the industry as a whole and highlight vehicles that are available today or will be in the near future that can serve as templates for reducing emissions in all vehicle classes.
7Automaker Rankings 2018
Automaker Performance
[ chapter 2 ]
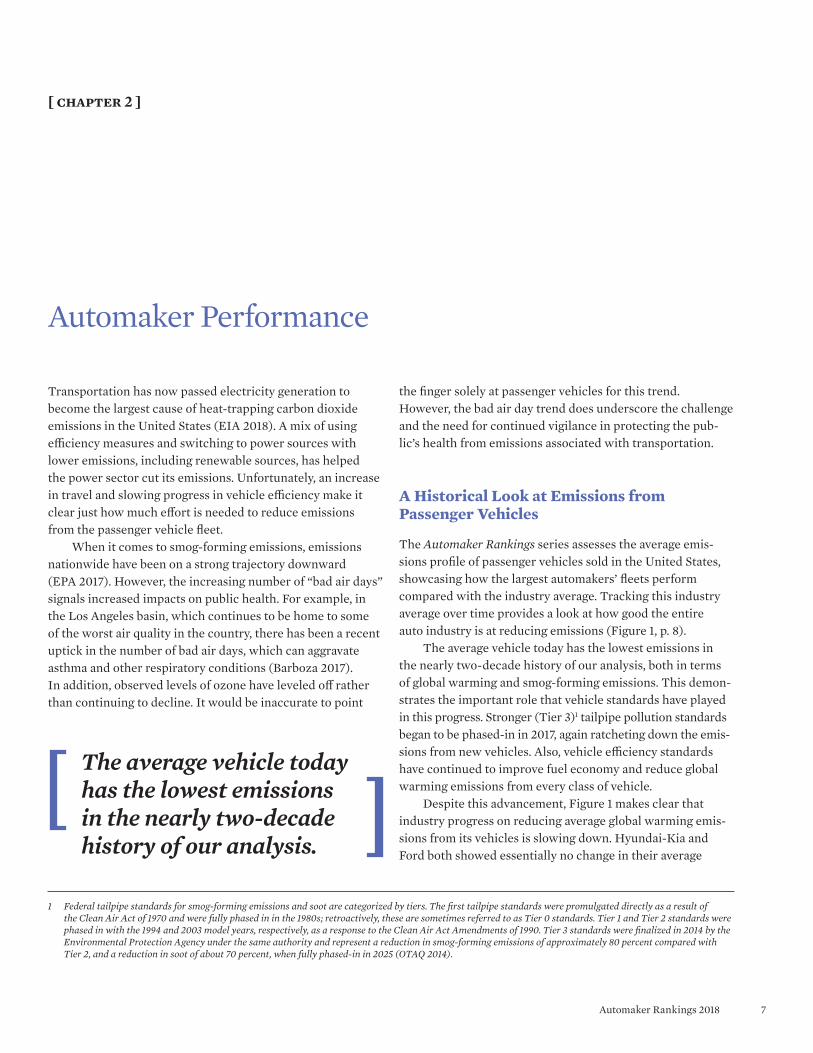
The average vehicle today has the lowest emissions in the nearly two-decade history of our analysis.
1 Federal tailpipe standards for smog-forming emissions and soot are categorized by tiers. The first tailpipe standards were promulgated directly as a result of the Clean Air Act of 1970 and were fully phased in in the 1980s; retroactively, these are sometimes referred to as Tier 0 standards. Tier 1 and Tier 2 standards were phased in with the 1994 and 2003 model years, respectively, as a response to the Clean Air Act Amendments of 1990. Tier 3 standards were finalized in 2014 by the Environmental Protection Agency under the same authority and represent a reduction in smog-forming emissions of approximately 80 percent compared with Tier 2, and a reduction in soot of about 70 percent, when fully phased-in in 2025 (OTAQ 2014).
Transportation has now passed electricity generation to become the largest cause of heat-trapping carbon dioxide emissions in the United States (EIA 2018). A mix of using efficiency measures and switching to power sources with lower emissions, including renewable sources, has helped the power sector cut its emissions. Unfortunately, an increase in travel and slowing progress in vehicle efficiency make it clear just how much effort is needed to reduce emissions from the passenger vehicle fleet.
When it comes to smog-forming emissions, emissions nationwide have been on a strong trajectory downward (EPA 2017). However, the increasing number of “bad air days” signals increased impacts on public health. For example, in the Los Angeles basin, which continues to be home to some of the worst air quality in the country, there has been a recent uptick in the number of bad air days, which can aggravate asthma and other respiratory conditions (Barboza 2017). In addition, observed levels of ozone have leveled off rather than continuing to decline. It would be inaccurate to point
the finger solely at passenger vehicles for this trend. However, the bad air day trend does underscore the challenge and the need for continued vigilance in protecting the pub-lic’s health from emissions associated with transportation.
A Historical Look at Emissions from Passenger Vehicles
The Automaker Rankings series assesses the average emis-sions profile of passenger vehicles sold in the United States, showcasing how the largest automakers’ fleets perform compared with the industry average. Tracking this industry average over time provides a look at how good the entire auto industry is at reducing emissions (Figure 1, p. 8).
The average vehicle today has the lowest emissions in the nearly two-decade history of our analysis, both in terms of global warming and smog-forming emissions. This demon-strates the important role that vehicle standards have played in this progress. Stronger (Tier 3)1 tailpipe pollution standards began to be phased-in in 2017, again ratcheting down the emis-sions from new vehicles. Also, vehicle efficiency standards have continued to improve fuel economy and reduce global warming emissions from every class of vehicle.
Despite this advancement, Figure 1 makes clear that industry progress on reducing average global warming emis-sions from its vehicles is slowing down. Hyundai-Kia and Ford both showed essentially no change in their average
8 union of concerned scientists
figure 1. Average Emissions from Light-Duty Vehicles Sold by the Top Eight Automakers, 1998–2017
emissions, compared with our last rankings in 2014, and Toyota shows a net increase in emissions. As will be discussed, these trends indicate a fleet that is shifting to larger vehicles faster than many manufacturers are deploying efficiency improvements in those vehicles.
Importantly, manufacturers do not exert equal effort to reduce emissions from their fleets—and that is crystal clear in the results of our analysis.
Automaker Performance Overall
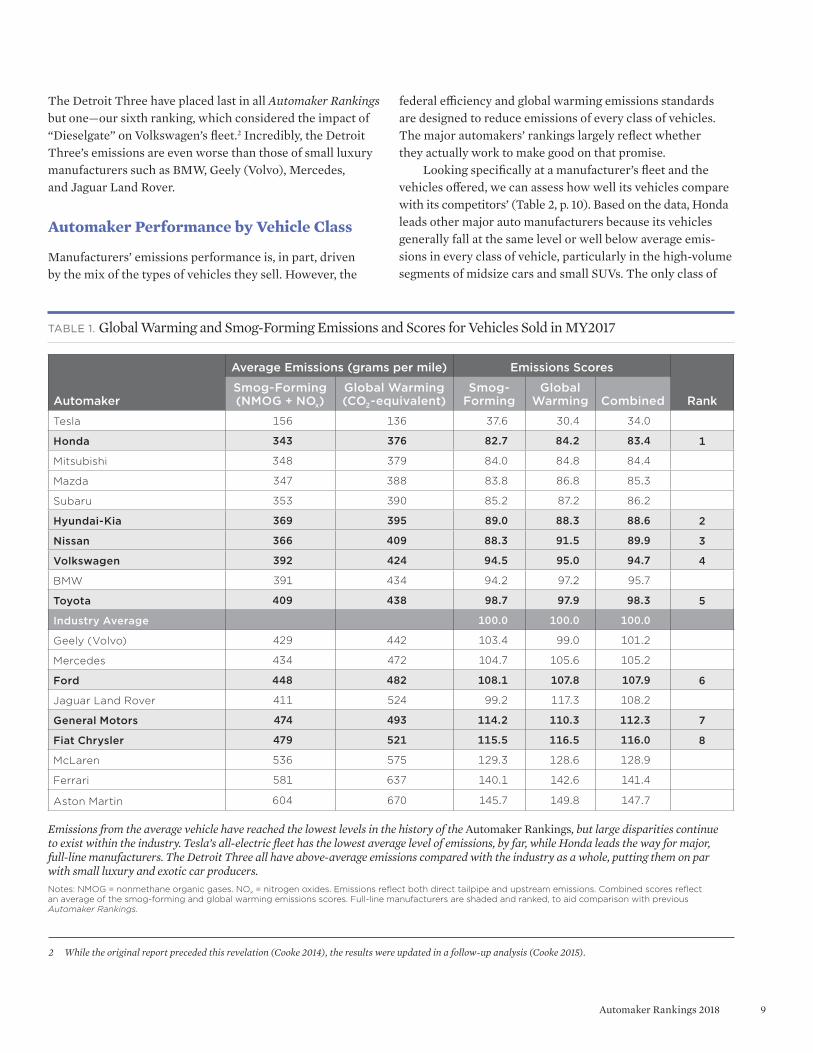
Federal standards aim to drive efficiency improvements across a manufacturer’s fleet. However, some manufacturers significantly outperform their competitors. Of the eight larg-est automakers, Honda has the lowest average emissions from its fleet in both smog-forming and global warming emissions (see Table 1). The company lowered emissions to more than 5 percent below the next major manufacturer, Hyundai-Kia.
While Honda’s performance is head and shoulders better than that of other major manufacturers, it has a long way to go before it can achieve an emissions profile as low as the company that tops our list, Tesla. While it maintains a very limited portfolio of just three models, Tesla’s all-electric vehicle fleet is leaps and bounds better than that of any other company, scoring an incredibly low 34 out of 100.
To put Tesla’s score in perspective, the difference in emissions between Tesla’s average vehicle and Honda’s average vehicle is even greater than the difference between Honda’s average vehicle today and the average vehicle sold in 2000. The year 2000 featured the worst environmental performance measured by the Automaker Rankings.
Still, plenty of manufacturers continue to have poor environmental performance. Once again, Fiat Chrysler (FCA) places at the bottom of the heap, having an average emissions score better than only three manufacturers, all of which sell nothing but exotic sports cars. FCA stands nearly as far behind the other seven major manufacturers as Honda is ahead of its nearest competitor.
The other Detroit manufacturers, Ford and General Motors (GM), are the only other major manufacturers to fall behind the industry average environmental performance.
Fiat Chrysler stands nearly as far behind the other major manufacturers as Honda is ahead of its nearest competitor.
—— Chrysler —— gM —— ford —— Toyota —— Volkswagen —— Nissan —— Hyundai-Kia —— Honda
1998 2002 2006 2010 2014 2018
650
500
350
Global Warming Emissions (g/mile)
Automakers have reduced average global warming and smog-forming emissions from their vehicles by 18 and 70 percent, respectively, since our first Automaker Rankings. Notes: Smog data for 1998 are not shown because they were based on 50,000-mile testing, rather than the lifetime testing now used. Dotted lines for Hyundai-Kia and Volkswagen indicate that we did not include them in our analysis from model year (MY) 1998 to MY2005.
SOurCeS: COOKe 2014; KlieSCH 2010; MaCKeNzie 2007; friedMaN aNd MaCKeNzie 2004; MarK 2002; MOrey eT al. 2000.
1998 2002 2006 2010 2014 2018
1.7
1.0
0.3
Smog-Forming Emissions (g/mile)
9Automaker Rankings 2018
Automaker
Average Emissions (grams per mile) Emissions Scores
RankSmog-Forming (NMOG + NOx)
Global Warming (CO2-equivalent)
Smog-Forming
Global Warming Combined
Tesla 156 136 37.6 30.4 34.0
Honda 343 376 82.7 84.2 83.4 1
Mitsubishi 348 379 84.0 84.8 84.4
Mazda 347 388 83.8 86.8 85.3
Subaru 353 390 85.2 87.2 86.2
Hyundai-Kia 369 395 89.0 88.3 88.6 2
Nissan 366 409 88.3 91.5 89.9 3
Volkswagen 392 424 94.5 95.0 94.7 4
BMW 391 434 94.2 97.2 95.7
Toyota 409 438 98.7 97.9 98.3 5
Industry Average 100.0 100.0 100.0
Geely (Volvo) 429 442 103.4 99.0 101.2
Mercedes 434 472 104.7 105.6 105.2
Ford 448 482 108.1 107.8 107.9 6
Jaguar Land Rover 411 524 99.2 117.3 108.2
General Motors 474 493 114.2 110.3 112.3 7
Fiat Chrysler 479 521 115.5 116.5 116.0 8
McLaren 536 575 129.3 128.6 128.9
Ferrari 581 637 140.1 142.6 141.4
Aston Martin 604 670 145.7 149.8 147.7 Emissions from the average vehicle have reached the lowest levels in the history of the Automaker Rankings, but large disparities continue to exist within the industry. Tesla’s all-electric fleet has the lowest average level of emissions, by far, while Honda leads the way for major, full-line manufacturers. The Detroit Three all have above-average emissions compared with the industry as a whole, putting them on par with small luxury and exotic car producers.Notes: NMOG = nonmethane organic gases. NOx = nitrogen oxides. Emissions reflect both direct tailpipe and upstream emissions. Combined scores reflect an average of the smog-forming and global warming emissions scores. Full-line manufacturers are shaded and ranked, to aid comparison with previous Automaker Rankings.
Table 1. Global Warming and Smog-Forming Emissions and Scores for Vehicles Sold in MY2017
The Detroit Three have placed last in all Automaker Rankings but one—our sixth ranking, which considered the impact of “Dieselgate” on Volkswagen’s fleet.2 Incredibly, the Detroit Three’s emissions are even worse than those of small luxury manufacturers such as BMW, Geely (Volvo), Mercedes, and Jaguar Land Rover.
Automaker Performance by Vehicle Class
Manufacturers’ emissions performance is, in part, driven by the mix of the types of vehicles they sell. However, the
federal efficiency and global warming emissions standards are designed to reduce emissions of every class of vehicles. The major automakers’ rankings largely reflect whether they actually work to make good on that promise.
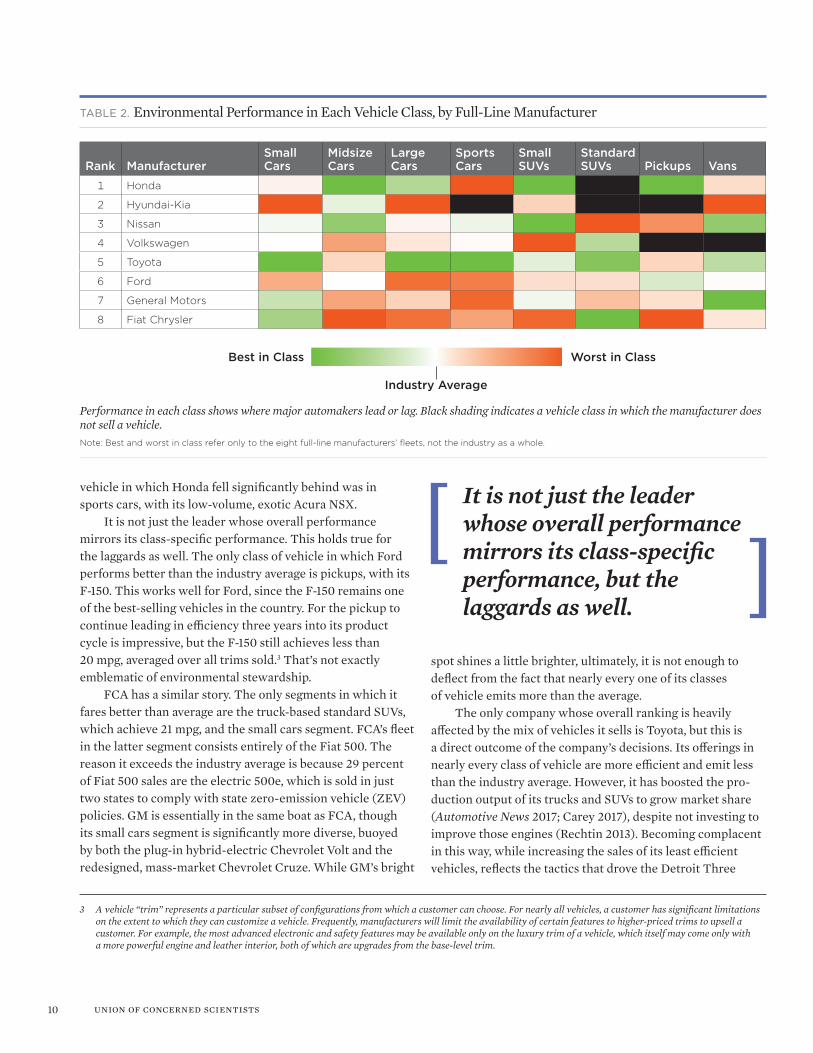
Looking specifically at a manufacturer’s fleet and the vehicles offered, we can assess how well its vehicles compare with its competitors’ (Table 2, p. 10). Based on the data, Honda leads other major auto manufacturers because its vehicles generally fall at the same level or well below average emis-sions in every class of vehicle, particularly in the high-volume segments of midsize cars and small SUVs. The only class of
2 While the original report preceded this revelation (Cooke 2014), the results were updated in a follow-up analysis (Cooke 2015).
10 union of concerned scientists
3 A vehicle “trim” represents a particular subset of configurations from which a customer can choose. For nearly all vehicles, a customer has significant limitations on the extent to which they can customize a vehicle. Frequently, manufacturers will limit the availability of certain features to higher-priced trims to upsell a customer. For example, the most advanced electronic and safety features may be available only on the luxury trim of a vehicle, which itself may come only with a more powerful engine and leather interior, both of which are upgrades from the base-level trim.
It is not just the leader whose overall performance mirrors its class-specific performance, but the laggards as well.
vehicle in which Honda fell significantly behind was in sports cars, with its low-volume, exotic Acura NSX.
It is not just the leader whose overall performance mirrors its class-specific performance. This holds true for the laggards as well. The only class of vehicle in which Ford performs better than the industry average is pickups, with its F-150. This works well for Ford, since the F-150 remains one of the best-selling vehicles in the country. For the pickup to continue leading in efficiency three years into its product cycle is impressive, but the F-150 still achieves less than 20 mpg, averaged over all trims sold.3 That’s not exactly emblematic of environmental stewardship.
FCA has a similar story. The only segments in which it fares better than average are the truck-based standard SUVs, which achieve 21 mpg, and the small cars segment. FCA’s fleet in the latter segment consists entirely of the Fiat 500. The reason it exceeds the industry average is because 29 percent of Fiat 500 sales are the electric 500e, which is sold in just two states to comply with state zero-emission vehicle (ZEV) policies. GM is essentially in the same boat as FCA, though its small cars segment is significantly more diverse, buoyed by both the plug-in hybrid-electric Chevrolet Volt and the redesigned, mass-market Chevrolet Cruze. While GM’s bright
Rank ManufacturerSmall Cars
Midsize Cars
Large Cars
Sports Cars
Small SUVs
Standard SUVs Pickups Vans
1 Honda
2 Hyundai-Kia
3 Nissan
4 Volkswagen
5 Toyota
6 Ford
7 General Motors
8 Fiat Chrysler
Table 2. Environmental Performance in Each Vehicle Class, by Full-Line Manufacturer
Best in Class Worst in Class
Industry Average
Performance in each class shows where major automakers lead or lag. Black shading indicates a vehicle class in which the manufacturer does not sell a vehicle.Note: Best and worst in class refer only to the eight full-line manufacturers’ fleets, not the industry as a whole.
spot shines a little brighter, ultimately, it is not enough to deflect from the fact that nearly every one of its classes of vehicle emits more than the average.
The only company whose overall ranking is heavily affected by the mix of vehicles it sells is Toyota, but this is a direct outcome of the company’s decisions. Its offerings in nearly every class of vehicle are more efficient and emit less than the industry average. However, it has boosted the pro-duction output of its trucks and SUVs to grow market share (Automotive News 2017; Carey 2017), despite not investing to improve those engines (Rechtin 2013). Becoming complacent in this way, while increasing the sales of its least efficient vehicles, reflects the tactics that drove the Detroit Three
11Automaker Rankings 2018
figure 2. Average Fuel Economy over Time, by Vehicle Segment
Vehicle Class
Fuel Use Market Share
% Reduction 2008–2017 2017
% Change 2008–2017
Small Cars 9.6% 8.4% –4.7%
Midsize Cars 21.4% 23.3% –9.4%
Large Cars 15.6% 4.1% –1.1%
Sports Cars 9.9% 2.5% –0.2%
Small SUVs 18.7% 32.7% +18.3%
Standard SUVs 14.4% 12.0% –1.5%
Pickups 13.3% 13.5% +0.3%
Vans 11.0% 3.5% –1.6%
Overall 14.2% 100%
Table 3. Change in Fuel Consumption and Market Share since Modern Fuel Economy and Emissions Standards Went into Effect, by Vehicle Class
All vehicle classes have seen significant reductions in fuel use, with the best-selling classes of midsize cars and small SUVs showing the greatest levels of improvement. While a shift toward larger vehicles has slowed that overall progress, the average new vehicle sold today consumes 14 percent less fuel than it did prior to the introduction of federal efficiency standards set under the Obama administration.
to the bottom positions. Now, despite better-than-average performance in many vehicle classes, Toyota has dropped down over time, approaching the industry average thanks to an overall increase in the average emissions from its fleet.
Historical Performance and Trends by Vehicle Class
While there is a range of efficiencies in any vehicle class, as evidenced by manufacturers’ wide-ranging performances, over time, each class of vehicles has gotten more efficient (Figure 2). This results directly from manufacturers investing in meeting federal size-dependent fuel economy and emis-sions standards.
Importantly, the segments that have seen the greatest levels of improvement since the standards were finalized are the segments with the largest volume: midsize cars and small SUVs (Table 3). This shows that manufacturers are investing in improving their best-selling vehicles, rather than overrely-ing on an introduction of highly efficient vehicles like hybrids or economy cars, as often happened under the previous (pre-2011) federal Corporate Average Fuel Economy program.
These improvements directly result from increased technology deployment. However, not all technologies are new, and very few are widely deployed, leaving significant opportunity for future improvements in all vehicle classes.
Industry Average
Small Cars Midsize Cars
Sports Cars
Small SUVs
Pickups VansLarge Cars
35
30
25
20
15
10
5
0
Mile
s pe
r G
allo
n
Since size-based federal standards were first finalized for cars and trucks in 2009, each class of vehicles has gotten significantly more efficient. Small SUVs now have fuel economies greater than midsize sedans did in 2008. However, a shift toward larger vehicles has caused the increase in the industry average fuel economy to be much lower than the improvement within each individual vehicle class.Note: Vehicle classes reflect the classification scheme used in the current report (see Table A-1, p. 37), rather than the classification given in Kliesch 2010 or Cooke 2014, to ensure equitable comparison.
My2008
My2013
My2017
Standard SUVs

12 union of concerned scientists
Technology
[ chapter 3 ]
To improve the efficiency of their vehicles, all major manu-facturers have focused primarily on reducing the fuel used by conventional, gasoline-powered vehicles. However, new advancements in electrification are bridging the gap between “conventional” and “hybrid,” and new models of plug-in hybrid-, battery-, and now even fuel cell–electric vehicles appear on the market as well. This section details the growth of seven different technologies to improve the global warming emissions performance of new vehicles, the technologies used to reduce soot and smog-forming emissions from the tailpipe, and how the development and the deployment of these technologies has changed since federal emissions standards were first proposed.
Gasoline Direct Injection
No matter the engine, it needs fuel to be delivered to the combustion chamber before it can be used to generate work. Since the creation of the first gasoline-powered automobile, fuel delivery has constantly evolved to be more efficient, and this is no different today. Forty years ago, virtually every engine used a carburetor, which controls the mixture of air and fuel in the combustion process simply by controlling the amount of air being pulled into the engine. Port-fuel injection gradually replaced the carburetor. This process injected the fuel near the intake valve of each chamber and allowed for more precise fuel delivery than did the simple carburetor.
Today, gasoline direct injection (GDI) has pushed that evolution even farther by directly injecting the fuel into the cylinders of the engine. Spraying the fuel directly into the cylinder helps minimize inefficiencies in the engine related to either early ignition of the fuel (i.e., the hot air-fuel mixture
combusting before completion of the compression stroke) or partial combustion, where fuel is left uncombusted be-cause of dispersal farther from the spark. The more complete level of combustion in a GDI engine allows a manufacturer to increase the compression ratio, which provides greater power to the same size engine. This could enable the use of smaller engines (whose benefit is described in a later section).
As Figure 3 shows, GDI use has exploded over the past few years thanks to its relative low cost and abiity to enable greater emissions reductions from gasoline vehicles.
figure 3. Penetration of Gasoline Direct Injection for the 2008 and 2017 New Vehicle Fleets
2008 2017
The use of gasoline direct injection has skyrocketed in recent years, due to its low cost and increased efficiency.
60%
50%
40%
30%
20%
10%
0%
Mar
ket S
hare
(%)
13Automaker Rankings 2018
Cylinder deactivation provides a way of “right-sizing” an engine on demand, saving fuel.
However, GDI is found in barely more than half of the new vehicle fleet.
Cylinder Deactivation
The larger the total cylinder volume in an engine, the larger the amount of power that can be generated from that engine. However, when the engine is operating below “full throttle” conditions, there are significant losses in efficiency due to differences in pressure between the fuel intake and the engine which require additional work to overcome. Ideally, an engine would be sized to provide precisely the right amount of power at a given time to eliminate the losses associate with throttling, but even with a transmission, the range of different operating speeds and power required for smooth performance is quite vast.
Cylinder deactivation provides a way of “right-sizing” an engine on demand to help mitigate this issue. When the extra power of a larger engine is needed, the vehicle can use all its cylinders to provide it. However, in low-power situations (e.g., cruising at a steady speed on a highway), cylinder deactivation shuts off the valves to the cylinders, eliminating fuel use to those cylinders and essentially behaving like a smaller engine.
Cylinder deactivation has been used in some form since the 1980s, when it was first used in the crude and poorly
figure 4. Penetration of Cylinder Deactivation for the 2008 and 2017 New Vehicle Fleets
2008 2017
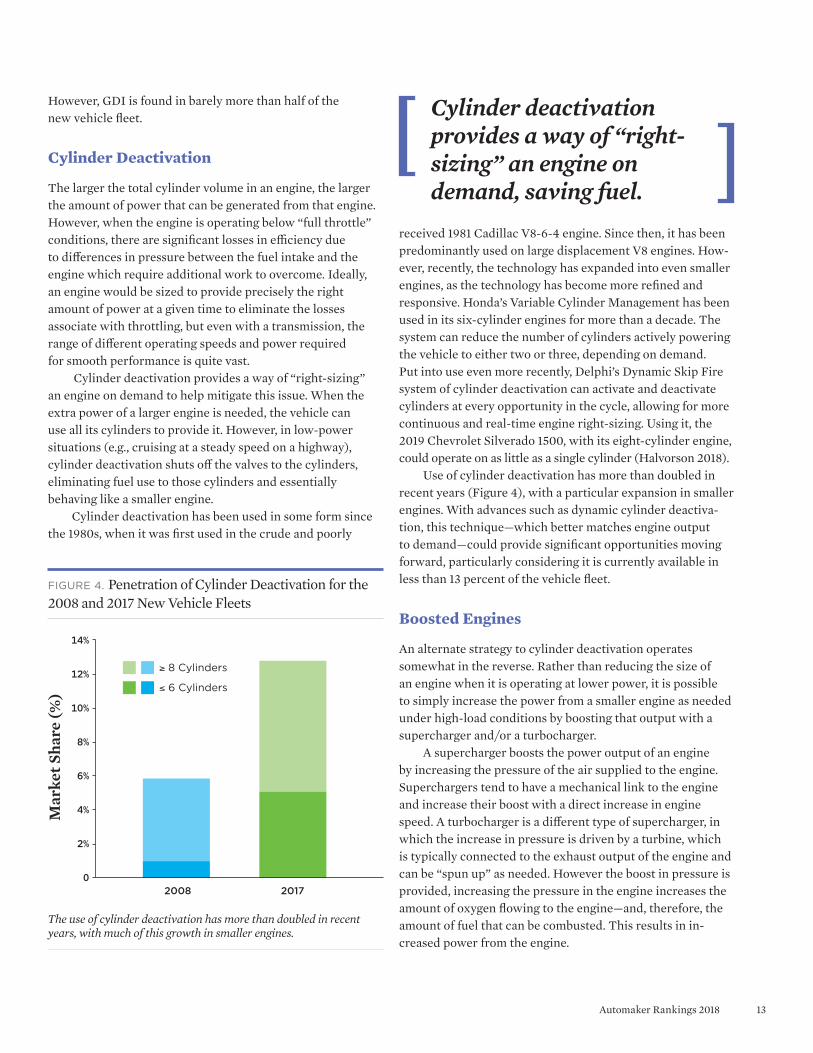
The use of cylinder deactivation has more than doubled in recent years, with much of this growth in smaller engines.
14%
12%
10%
8%
6%
4%
2%
0
Mar
ket S
hare
(%)
≥ 8 Cylinders
≤ 6 Cylinders
received 1981 Cadillac V8-6-4 engine. Since then, it has been predominantly used on large displacement V8 engines. How-ever, recently, the technology has expanded into even smaller engines, as the technology has become more refined and responsive. Honda’s Variable Cylinder Management has been used in its six-cylinder engines for more than a decade. The system can reduce the number of cylinders actively powering the vehicle to either two or three, depending on demand. Put into use even more recently, Delphi’s Dynamic Skip Fire system of cylinder deactivation can activate and deactivate cylinders at every opportunity in the cycle, allowing for more continuous and real-time engine right-sizing. Using it, the 2019 Chevrolet Silverado 1500, with its eight-cylinder engine, could operate on as little as a single cylinder (Halvorson 2018).
Use of cylinder deactivation has more than doubled in recent years (Figure 4), with a particular expansion in smaller engines. With advances such as dynamic cylinder deactiva-tion, this technique—which better matches engine output to demand—could provide significant opportunities moving forward, particularly considering it is currently available in less than 13 percent of the vehicle fleet.
Boosted Engines
An alternate strategy to cylinder deactivation operates somewhat in the reverse. Rather than reducing the size of an engine when it is operating at lower power, it is possible to simply increase the power from a smaller engine as needed under high-load conditions by boosting that output with a supercharger and/or a turbocharger.
A supercharger boosts the power output of an engine by increasing the pressure of the air supplied to the engine. Superchargers tend to have a mechanical link to the engine and increase their boost with a direct increase in engine speed. A turbocharger is a different type of supercharger, in which the increase in pressure is driven by a turbine, which is typically connected to the exhaust output of the engine and can be “spun up” as needed. However the boost in pressure is provided, increasing the pressure in the engine increases the amount of oxygen flowing to the engine—and, therefore, the amount of fuel that can be combusted. This results in in-creased power from the engine.
14 union of concerned scientists
# of cylinders 2008 2017< 4 0.2% 0.6%
4 37.3% 58.3%
≤ 6 44.7% 29.4%
8 17.7% 11.7%
> 8 0.1% 0.0%
Average Engine (# cyl, vol. [L]) 5.6, 3.3l 5.0, 2.9l
Median Engine (# cyl, vol. [L]) V6, 3.5l i4, 2.5l
Table 4. Engine Size Distribution in 2008 and 2017
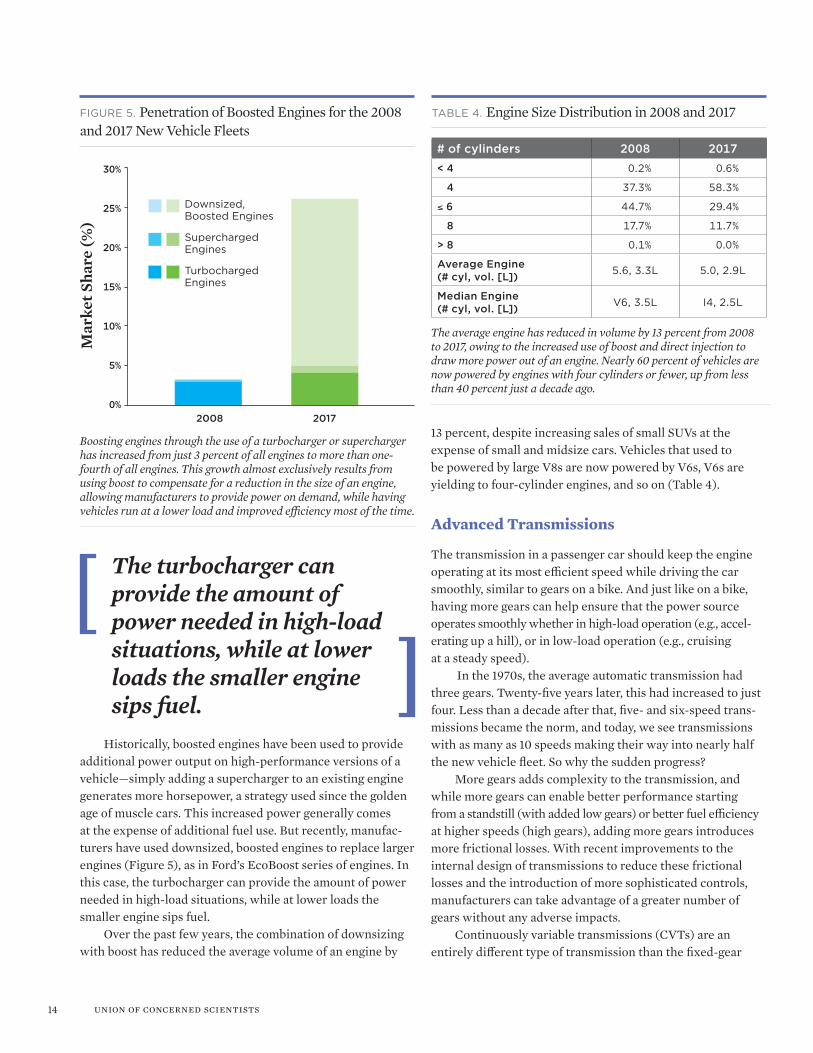
The average engine has reduced in volume by 13 percent from 2008 to 2017, owing to the increased use of boost and direct injection to draw more power out of an engine. Nearly 60 percent of vehicles are now powered by engines with four cylinders or fewer, up from less than 40 percent just a decade ago.
The turbocharger can provide the amount of power needed in high-load situations, while at lower loads the smaller engine sips fuel.
figure 5. Penetration of Boosted Engines for the 2008 and 2017 New Vehicle Fleets
2008 2017
Boosting engines through the use of a turbocharger or supercharger has increased from just 3 percent of all engines to more than one-fourth of all engines. This growth almost exclusively results from using boost to compensate for a reduction in the size of an engine, allowing manufacturers to provide power on demand, while having vehicles run at a lower load and improved efficiency most of the time.
30%
25%
20%
15%
10%
5%
0%
Mar
ket S
hare
(%)
downsized, boosted engines
Supercharged engines
Turbocharged engines
Historically, boosted engines have been used to provide additional power output on high-performance versions of a vehicle—simply adding a supercharger to an existing engine generates more horsepower, a strategy used since the golden age of muscle cars. This increased power generally comes at the expense of additional fuel use. But recently, manufac-turers have used downsized, boosted engines to replace larger engines (Figure 5), as in Ford’s EcoBoost series of engines. In this case, the turbocharger can provide the amount of power needed in high-load situations, while at lower loads the smaller engine sips fuel.
Over the past few years, the combination of downsizing with boost has reduced the average volume of an engine by
13 percent, despite increasing sales of small SUVs at the expense of small and midsize cars. Vehicles that used to be powered by large V8s are now powered by V6s, V6s are yielding to four-cylinder engines, and so on (Table 4).
Advanced Transmissions
The transmission in a passenger car should keep the engine operating at its most efficient speed while driving the car smoothly, similar to gears on a bike. And just like on a bike, having more gears can help ensure that the power source operates smoothly whether in high-load operation (e.g., accel-erating up a hill), or in low-load operation (e.g., cruising at a steady speed). In the 1970s, the average automatic transmission had three gears. Twenty-five years later, this had increased to just four. Less than a decade after that, five- and six-speed trans-missions became the norm, and today, we see transmissions with as many as 10 speeds making their way into nearly half the new vehicle fleet. So why the sudden progress?
More gears adds complexity to the transmission, and while more gears can enable better performance starting from a standstill (with added low gears) or better fuel efficiency at higher speeds (high gears), adding more gears introduces more frictional losses. With recent improvements to the internal design of transmissions to reduce these frictional losses and the introduction of more sophisticated controls, manufacturers can take advantage of a greater number of gears without any adverse impacts.
Continuously variable transmissions (CVTs) are an entirely different type of transmission than the fixed-gear
15Automaker Rankings 2018
design. However, the principle is largely the same, which is simply to better enable the engine to operate at its most efficient speed. CVTs essentially act as an infinite-gear transmis-sion. This process comes with increased internal losses in energy, and having a continuous, single “gear” can take some getting used to when it comes to driving behavior. Such challenges have limited the deployment of CVTs until recently. Recent advances to reduce frictional losses (similar to the evolution of the traditional automatic transmission) and novel “skipping” (which mimics the feel of a traditional gear-shift upon acceleration) have helped to accelerate the adoption of CVTs (Figure 6).
While the six-gear transmission is on its way out, even today’s continuously variable transmissions and those with eight or more gears have room for continued advancement to improve efficiency.
Stop-Start Systems
When a typical gasoline-powered vehicle stops at a traffic light and is not moving, the engine is still running and
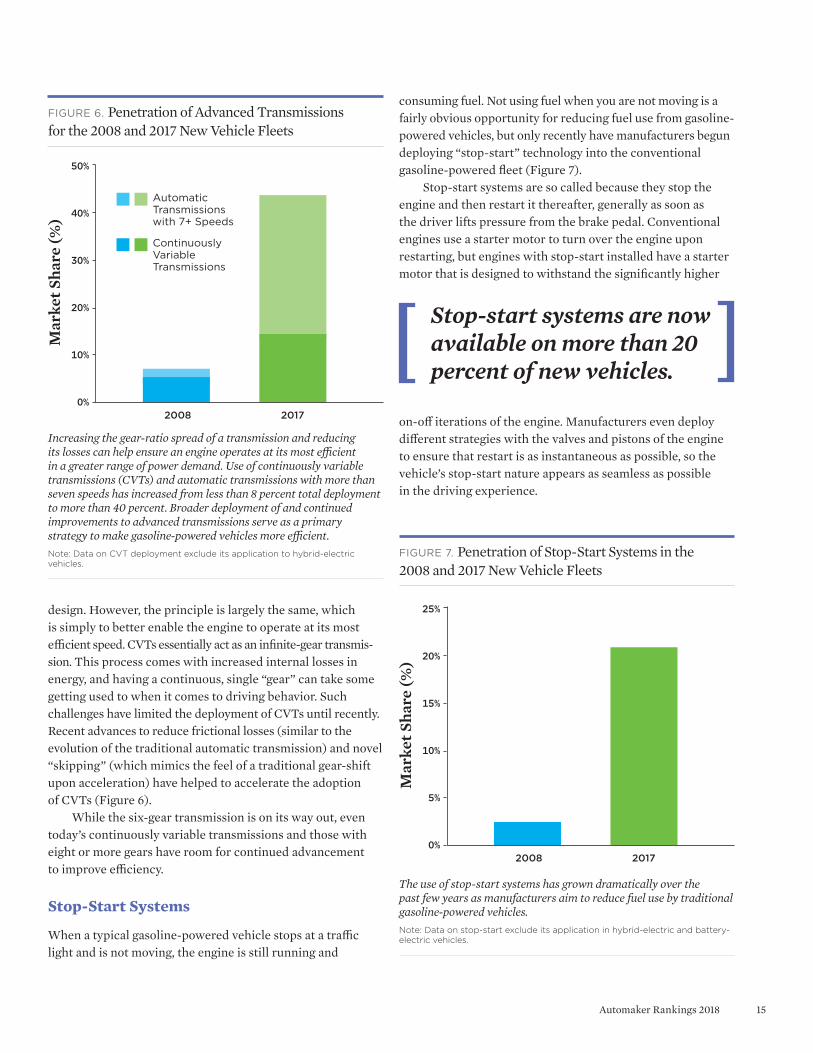
consuming fuel. Not using fuel when you are not moving is a fairly obvious opportunity for reducing fuel use from gasoline- powered vehicles, but only recently have manufacturers begun deploying “stop-start” technology into the conventional gasoline-powered fleet (Figure 7).
Stop-start systems are so called because they stop the engine and then restart it thereafter, generally as soon as the driver lifts pressure from the brake pedal. Conventional engines use a starter motor to turn over the engine upon restarting, but engines with stop-start installed have a starter motor that is designed to withstand the significantly higher
figure 6. Penetration of Advanced Transmissions for the 2008 and 2017 New Vehicle Fleets
2008 2017
50%
40%
30%
20%
10%
0%
Mar
ket S
hare
(%)
Increasing the gear-ratio spread of a transmission and reducing its losses can help ensure an engine operates at its most efficient in a greater range of power demand. Use of continuously variable transmissions (CVTs) and automatic transmissions with more than seven speeds has increased from less than 8 percent total deployment to more than 40 percent. Broader deployment of and continued improvements to advanced transmissions serve as a primary strategy to make gasoline-powered vehicles more efficient.Note: Data on CVT deployment exclude its application to hybrid-electric vehicles.
automatic Transmissions with 7+ Speeds
Continuously Variable Transmissions
Stop-start systems are now available on more than 20 percent of new vehicles.
on-off iterations of the engine. Manufacturers even deploy different strategies with the valves and pistons of the engine to ensure that restart is as instantaneous as possible, so the vehicle’s stop-start nature appears as seamless as possible in the driving experience.
figure 7. Penetration of Stop-Start Systems in the 2008 and 2017 New Vehicle Fleets
2008 2017
25%
20%
15%
10%
5%
0%
Mar
ket S
hare
(%)
The use of stop-start systems has grown dramatically over the past few years as manufacturers aim to reduce fuel use by traditional gasoline-powered vehicles.Note: Data on stop-start exclude its application in hybrid-electric and battery-electric vehicles.
16 union of concerned scientists
gasoline-powered vehicles. Over the past few years, however, advances in battery chemistry and an interest in reducing fuel consumption and global warming emissions have propelled renewed interest in electrification.
In discussing different levels of electrification, it is important to distinguish between technology such as stop-start, mentioned above, and traditional hybrid-electric vehicles (“hybrids”). In the case of stop-start, the vehicle is propelled almost exclusively by a gasoline engine. While the electric motor can engage with and supplement the gasoline engine, it is generally incapable of moving the vehicle forward by itself. This is in contrast to hybrids such as the Toyota Prius, which can be driven entirely by the electric motor at low speeds.
While a hybrid can be driven under some conditions exclusively by an electric motor (generally at lower speeds and/or short distances), the vehicle primarily uses the motor (or, in some cases, motors) in tandem with a gasoline engine to drive the vehicle forward. However, a hybrid has a small battery and does not draw any electricity from the electric grid. It is ultimately fueled exclusively by gasoline. Because a hybrid is not generally propelled solely by its electric motor, for clarity, it is excluded in the definition of “electric vehicle” as used throughout this report.
A plug-in hybrid-electric vehicle (PHEV) can behave much the same as a traditional hybrid. However, it has a larger battery that can store energy drawn from the electric grid. Often, a PHEV is designed to operate exclusively on an elec-tric motor under most or all operating conditions, though this is a characteristic that varies widely across the industry. The range of operation on electricity spans only from about 10 to 50 miles, depending on the vehicle—though most are in the 20- to 30-mile range. This is generally enough to support commuting at least one way entirely on electricity, and once the battery is fully depleted, the vehicle behaves like a con-ventional hybrid.
A battery-electric vehicle (BEV) is designed with no such backup. It is designed to be driven exclusively by an electric motor.4 This greatly streamlines the propulsion and reduces maintenance (no engine, no oil, simpler transmission), but it limits the range to the size of the battery and the availability of charging infrastructure. On a daily basis, most drivers plug their vehicles in when they get home, and the following morning, they have a full “tank” of typically 100 to 300 miles. Public charging infrastructure can supplement this for longer
Simple stop-start systems are now available on more than 20 percent of new vehicles. Until recently, the systems have been primarily limited to luxury automakers such as BMW, Jaguar Land Rover, and Mercedes, who have deployed the technology broadly across their fleets. However, all three Detroit manufacturers have recently introduced the technol-ogy on high-volume models (Ford F-150, Chevrolet Cruze, and the forthcoming Ram 1500 pickup). Even greater benefits from 48-volt (48V) stop-start systems (discussed in chapter 5, “Looking to the Future”) should help to drive even more sig-nificant adoption in the coming years, given the technology’s relatively low-cost, high-opportunity approach to reducing fuel.
Hybrids and Electric Vehicles
Some of the first automobiles more than a century ago were powered by electricity, but the energy density of petroleum-based liquid fuels compared with those earliest batteries ended up giving way to an auto industry dominated by
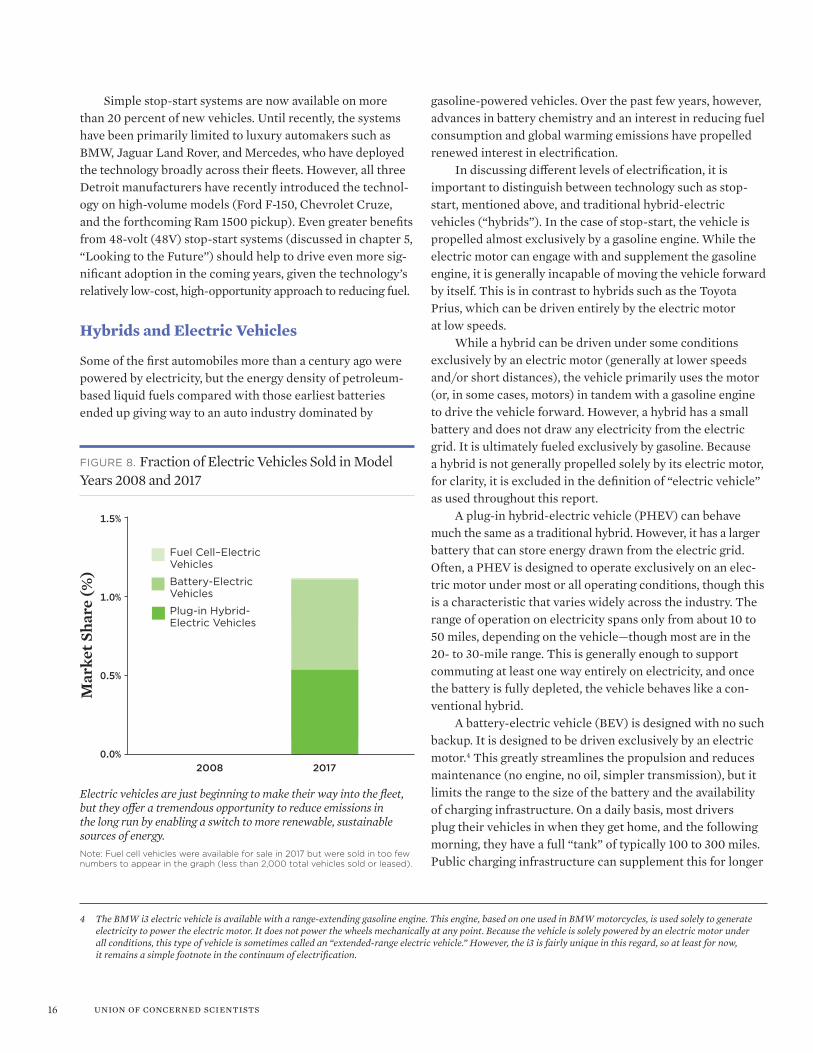
figure 8. Fraction of Electric Vehicles Sold in Model Years 2008 and 2017
2008 2017
1.5%
1.0%
0.5%
0.0%
Mar
ket S
hare
(%)
Electric vehicles are just beginning to make their way into the fleet, but they offer a tremendous opportunity to reduce emissions in the long run by enabling a switch to more renewable, sustainable sources of energy.Note: Fuel cell vehicles were available for sale in 2017 but were sold in too few numbers to appear in the graph (less than 2,000 total vehicles sold or leased).
fuel Cell–electric Vehicles
battery-electric Vehicles
Plug-in Hybrid- electric Vehicles
4 The BMW i3 electric vehicle is available with a range-extending gasoline engine. This engine, based on one used in BMW motorcycles, is used solely to generate electricity to power the electric motor. It does not power the wheels mechanically at any point. Because the vehicle is solely powered by an electric motor under all conditions, this type of vehicle is sometimes called an “extended-range electric vehicle.” However, the i3 is fairly unique in this regard, so at least for now, it remains a simple footnote in the continuum of electrification.

17Automaker Rankings 2018
travel distances, though the availability of such infrastructure is strongly dependent upon location.
The importance of infrastructure is even more critical for hydrogen fuel cell–electric vehicles (“fuel cell vehicles”). Fuel cell vehicles are driven solely by an electric motor, but unlike with BEVs, the electricity is not stored. Instead, it is generated on board through the use of a membrane to separate electrons from hydrogen gas. The “exhaust” from
Furthermore, PHEVs, and especially BEVs, have been con-centrated in the small vehicles class, a fact that obscures the successful growth that the electric vehicle (EV) market has seen. Plug-in electric vehicles made up 3.5 percent of small car sales in 2017. This segment has the most EV choices for consumers.
EVs have the potential to shift the auto industry to a much more sustainable future. UCS analysis shows that plug-in electric vehicles have lower global warming emissions than the average new gasoline-powered vehicle everywhere in the country (Reichmuth 2018; Nealer, Reichmuth, and Anair 2015). As the electric grid becomes cleaner and cleaner, the environmental performance of these vehicles also will improve over time (Reichmuth 2018). Fuel cell vehicles also have the potential to shift the industry from fossil fuels to more sus-tainable, renewable transportation fuel. In California, at least one-third of the hydrogen powering these vehicles is required to be generated from renewable sources (California State Senate 2006). Continued investment in renewable fuel and supportive refueling infrastructure will grow the potential for sustainable fuel cell vehicle deployment.
The growth of electrification is just beginning. State and federal policies supporting and requiring their deployment will be a key factor in moving the industry forward to a more sustainable future.
Reducing Vehicle Load
One of the most basic ways to reduce a vehicle’s energy use is simply to reduce the energy losses from the vehicle itself. This is true whether the vehicle is powered by gasoline or electricity.
Plug-in electric vehicles have lower global warming emissions than the average new gasoline-powered vehicle everywhere in the country.
this reaction is water. Unlike BEVs or PHEVs, which can be charged at home, fuel cell vehicles are a direct analog to conventional vehicles and are refueled at hydrogen stations. Limited in availability to California initially (the state has more than 30 hydrogen stations), fuel cell vehicles are now offered by Honda, Hyundai, and Toyota.
The availability of PHEVs and BEVs has also been fairly limited to date, with their production driven primarily by California’s ZEV policy (Reichmuth and Anair 2016). While manufacturers have gradually increased their offerings, the availability of PHEVs and BEVs has still been concentrated in California and in states that have adopted the ZEV standard.
Pho
tos:
Volk
swag
en
Automakers use tools like wind tunnels (left) and computer simulation (right) to design vehicles with reduced drag.
18 union of concerned scientists
One method involves simply reducing the weight of the vehicle. This strategy was initially deployed to meet the first fuel economy standards. But recent advances in lightweight materials have enabled more strategic and refined deploy-ment of different types of lightweight materials, including those that simultaneously reduce weight and improve safety and handling by incorporating materials with greater stiffness.
Another way to reduce the energy needed to propel a vehicle is to reduce the “rolling resistance” of the tires on the vehicle. Reducing rolling resistance has nothing to do with the traction of a tire. Rather, the chemical and structural properties of a tire can change the amount of energy lost to deformation of the spinning wheel. Lowering this energy loss can help reduce the energy needed to keep those tires rolling.
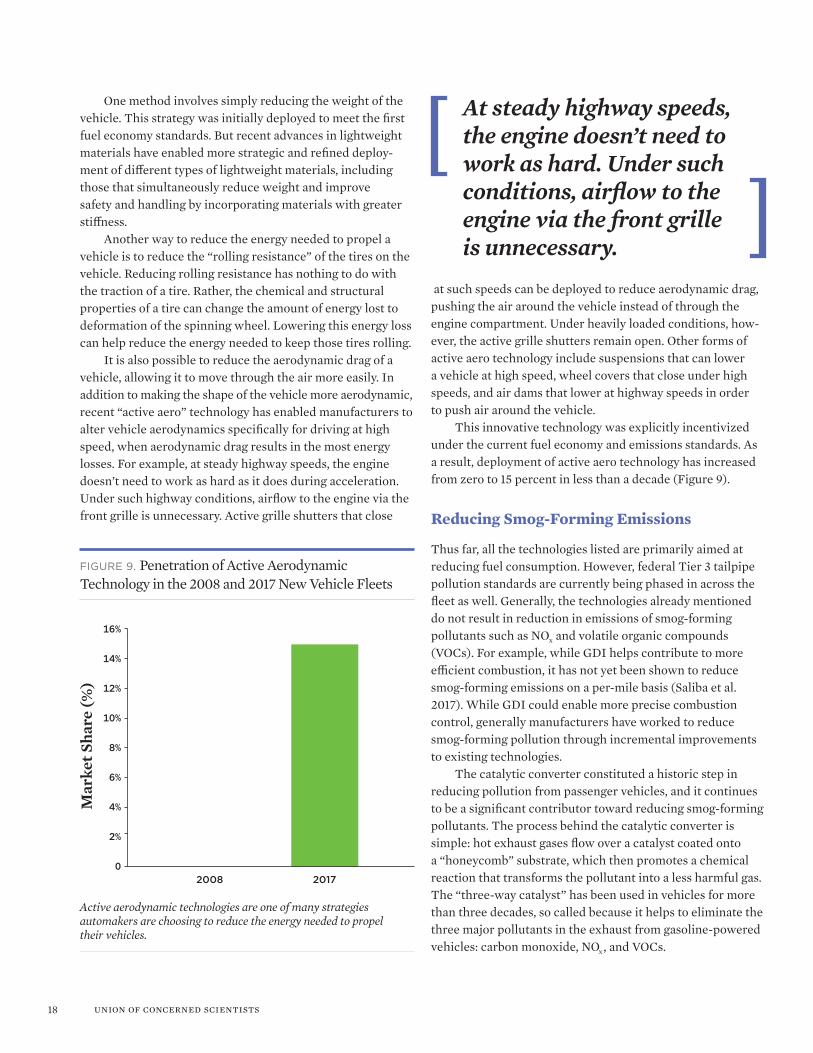
It is also possible to reduce the aerodynamic drag of a vehicle, allowing it to move through the air more easily. In addition to making the shape of the vehicle more aerodynamic, recent “active aero” technology has enabled manufacturers to alter vehicle aerodynamics specifically for driving at high speed, when aerodynamic drag results in the most energy losses. For example, at steady highway speeds, the engine doesn’t need to work as hard as it does during acceleration. Under such highway conditions, airflow to the engine via the front grille is unnecessary. Active grille shutters that close
at such speeds can be deployed to reduce aerodynamic drag, pushing the air around the vehicle instead of through the engine compartment. Under heavily loaded conditions, how-ever, the active grille shutters remain open. Other forms of active aero technology include suspensions that can lower a vehicle at high speed, wheel covers that close under high speeds, and air dams that lower at highway speeds in order to push air around the vehicle.
This innovative technology was explicitly incentivized under the current fuel economy and emissions standards. As a result, deployment of active aero technology has increased from zero to 15 percent in less than a decade (Figure 9).
Reducing Smog-Forming Emissions
Thus far, all the technologies listed are primarily aimed at reducing fuel consumption. However, federal Tier 3 tailpipe pollution standards are currently being phased in across the fleet as well. Generally, the technologies already mentioned do not result in reduction in emissions of smog-forming pollutants such as NOx and volatile organic compounds (VOCs). For example, while GDI helps contribute to more efficient combustion, it has not yet been shown to reduce smog-forming emissions on a per-mile basis (Saliba et al. 2017). While GDI could enable more precise combustion control, generally manufacturers have worked to reduce smog-forming pollution through incremental improvements to existing technologies.
The catalytic converter constituted a historic step in reducing pollution from passenger vehicles, and it continues to be a significant contributor toward reducing smog-forming pollutants. The process behind the catalytic converter is simple: hot exhaust gases flow over a catalyst coated onto a “honeycomb” substrate, which then promotes a chemical reaction that transforms the pollutant into a less harmful gas. The “three-way catalyst” has been used in vehicles for more than three decades, so called because it helps to eliminate the three major pollutants in the exhaust from gasoline-powered vehicles: carbon monoxide, NOx , and VOCs.
figure 9. Penetration of Active Aerodynamic Technology in the 2008 and 2017 New Vehicle Fleets
Active aerodynamic technologies are one of many strategies automakers are choosing to reduce the energy needed to propel their vehicles.
2008 2017
16%
14%
12%
10%
8%
6%
4%
2%
0
Mar
ket S
hare
(%)
At steady highway speeds, the engine doesn’t need to work as hard. Under such conditions, airflow to the engine via the front grille is unnecessary.

19Automaker Rankings 2018
An old catalytic converter, showcasing the “honeycomb” structure onto which the catalyst is coated. Modern emissions controls use even more sophisticated designs to minimize the use of expensive materials and reduce smog-forming emissions even further.
The
_Red
Burn
/Cre
ativ
e C
omm
ons (
Wik
imed
ia C
omm
ons)
figure 10. Penetration of Advanced Emissions Controls in the 2008 and 2017 New Vehicle Fleets
Improvements in catalyst design and engine operation have more than doubled the number of vehicles already meeting the Tier 3 standard; however, continued advancement of emissions control strategies will be key to 100 percent compliance in 2025.Note: Advanced emissions controls are characterized here as meeting the Tier 3, Bin 30 (NMOG + NOx = 30 mg/mi) standard, which is the average standard the new vehicle fleet must meet in 2025 after the Tier 3 standards have been phased in fully.
2008 2017
16%
14%
12%
10%
8%
6%
4%
2%
0
Mar
ket S
hare
(%)
One major challenge for catalytic converters is that they operate best at elevated temperatures, but when a car is first turned on, it takes a while to warm up to the tempera-ture at which the catalyst is most active. One strategy to mini-mize this “cold start” deficiency involves placing the catalytic converter closer to the engine. However, this has necessitated improved longevity and durability of the catalytic converter, which continues to evolve.
The greater the surface area of the catalyst in the con-verter, the more quickly and efficiently the pollutants can be converted into more benign gases. The catalyst in a modern pollution control system is typically a combination of expen-sive precious metals such as platinum, palladium, and rhodium, along with other metals like cerium that help store oxygen and improve the reactivity of the catalytic converter. The op-timal conditions for reducing emissions of harmful pollutants cannot be created by simply adding more catalyst to the sys-tem. Instead, manufacturers of catalytic converters have used more complex material chemistries and coating techniques to increase the temperature durability and effective surface area of the coated metal surface, significantly improving the effectiveness of the catalyst. Improvements in the design of the honeycomb itself have, over the years, also helped improve performance.
Engine manufacturers are taking advantage of some modern efficiency control strategies to reduce emissions as
20 union of concerned scientists
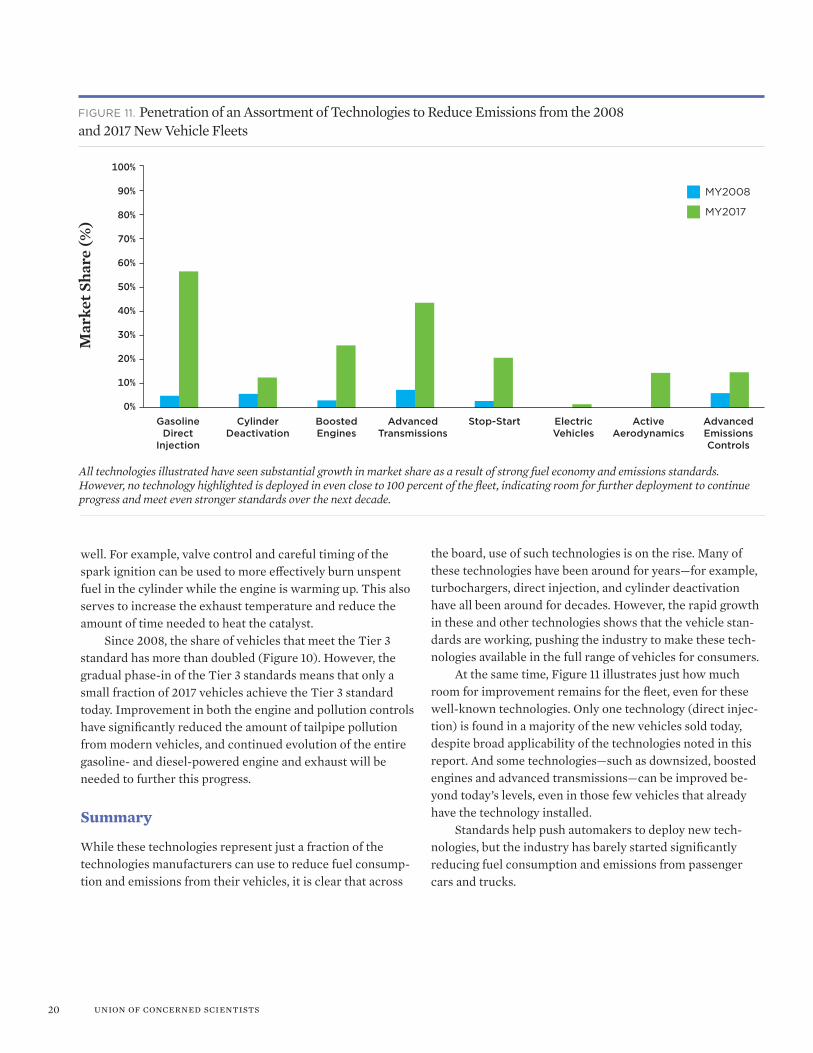
figure 11. Penetration of an Assortment of Technologies to Reduce Emissions from the 2008 and 2017 New Vehicle Fleets
My2008
My2017
Gasoline Direct
Injection
Cylinder Deactivation
Boosted Engines
Stop-Start Electric Vehicles
Active Aerodynamics
Advanced EmissionsControls
Advanced Transmissions
100%
90%
80%
70%
60%
50%
40%
30%
20%
10%
0%
Mar
ket S
hare
(%)
All technologies illustrated have seen substantial growth in market share as a result of strong fuel economy and emissions standards. However, no technology highlighted is deployed in even close to 100 percent of the fleet, indicating room for further deployment to continue progress and meet even stronger standards over the next decade.
well. For example, valve control and careful timing of the spark ignition can be used to more effectively burn unspent fuel in the cylinder while the engine is warming up. This also serves to increase the exhaust temperature and reduce the amount of time needed to heat the catalyst.
Since 2008, the share of vehicles that meet the Tier 3 standard has more than doubled (Figure 10). However, the gradual phase-in of the Tier 3 standards means that only a small fraction of 2017 vehicles achieve the Tier 3 standard today. Improvement in both the engine and pollution controls have significantly reduced the amount of tailpipe pollution from modern vehicles, and continued evolution of the entire gasoline- and diesel-powered engine and exhaust will be needed to further this progress.
Summary
While these technologies represent just a fraction of the technologies manufacturers can use to reduce fuel consump-tion and emissions from their vehicles, it is clear that across
the board, use of such technologies is on the rise. Many of these technologies have been around for years—for example, turbochargers, direct injection, and cylinder deactivation have all been around for decades. However, the rapid growth in these and other technologies shows that the vehicle stan-dards are working, pushing the industry to make these tech-nologies available in the full range of vehicles for consumers.
At the same time, Figure 11 illustrates just how much room for improvement remains for the fleet, even for these well-known technologies. Only one technology (direct injec-tion) is found in a majority of the new vehicles sold today, despite broad applicability of the technologies noted in this report. And some technologies—such as downsized, boosted engines and advanced transmissions—can be improved be-yond today’s levels, even in those few vehicles that already have the technology installed.
Standards help push automakers to deploy new tech- nologies, but the industry has barely started significantly reducing fuel consumption and emissions from passenger cars and trucks.

21Automaker Rankings 2018
Consumer Choice
[ chapter 4 ]
The wider availability of technologies over the past few years has meant that consumers have more efficient vehicle choices. This section highlights five different vehicles to show how these and other technologies have improved automakers’ offerings since 2008.
The average small car reduced its fuel use by less than 10 percent from 2008 to 2017. The Chevrolet Cruze more than doubled that progress compared with its predecessor, the Chevrolet Cobalt. These improvements are attributed to the adoption of a number of technologies, including stop-start; better transmissions; reduced weight and drag; and a smaller, boosted engine. At more than 200,000 in sales for MY2017, the Cruze is one of the best-selling cars in the country and was the top-selling car in GM’s portfolio in MY2017.
Small Cars: Chevrolet CruzeSubset of technologies added since 2008:
• Turbocharged, downsized engine
• Stop-start
• Lightweight materials (mainly high-strength steel [World auto Steel 2016]), yielding a 5 percent reduction in weight
• Increased gear-ratio spread transmission, up to nine speeds in some variants
• Nearly a 15 percent reduction in aerodyna- mic drag
Improved fuel economy (2008–2017): 26.5 mpg–34.4 mpg
Percent reduction in fuel: 23.0%
Lifetime fuel savings compared with 2008: $3,800
The average small car reduced its fuel use by less than 10 percent from 2008 to 2017. The Chevrolet Cruze, one of the best-selling cars in the country, more than doubled that progress.
Bull-
Dos
er/C
reat
ive
Com
mon
s (W
ikim
edia
Com
mon
s)
22 union of concerned scientists
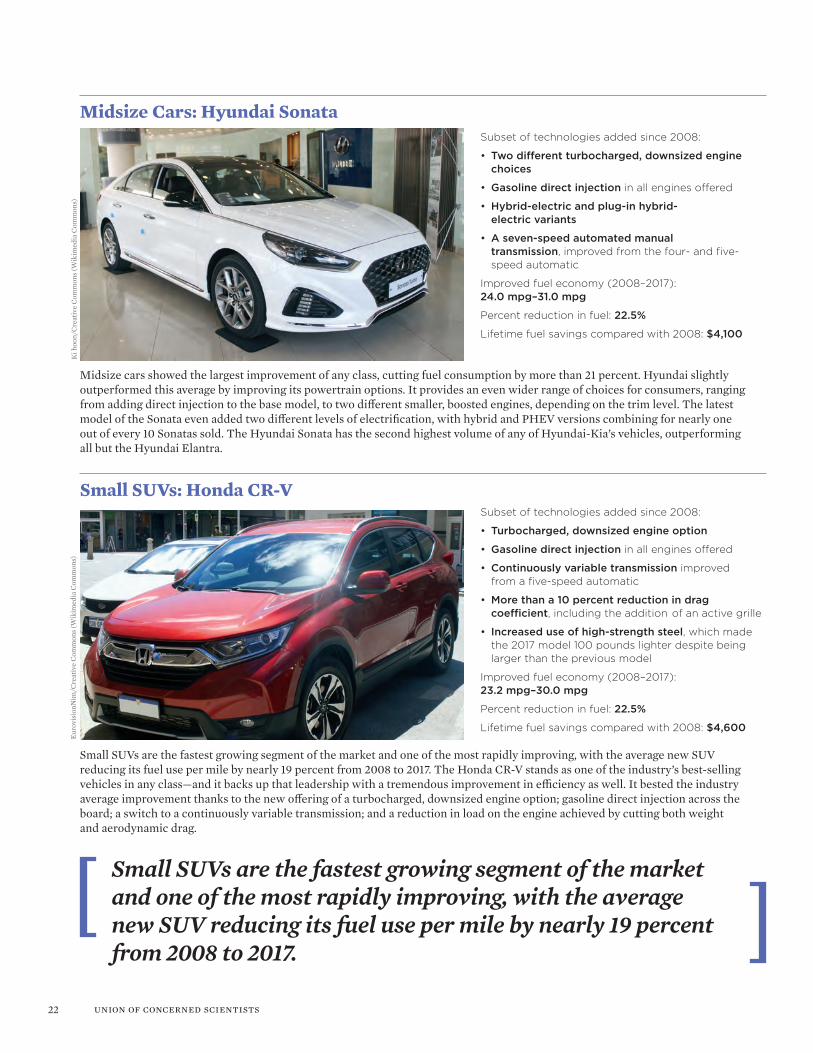
Midsize cars showed the largest improvement of any class, cutting fuel consumption by more than 21 percent. Hyundai slightly outperformed this average by improving its powertrain options. It provides an even wider range of choices for consumers, ranging from adding direct injection to the base model, to two different smaller, boosted engines, depending on the trim level. The latest model of the Sonata even added two different levels of electrification, with hybrid and PHEV versions combining for nearly one out of every 10 Sonatas sold. The Hyundai Sonata has the second highest volume of any of Hyundai-Kia’s vehicles, outperforming all but the Hyundai Elantra.
Midsize Cars: Hyundai SonataSubset of technologies added since 2008:
• Two different turbocharged, downsized engine choices
• Gasoline direct injection in all engines offered
• Hybrid-electric and plug-in hybrid- electric variants
• A seven-speed automated manual transmission, improved from the four- and five-speed automatic
Improved fuel economy (2008–2017): 24.0 mpg–31.0 mpg
Percent reduction in fuel: 22.5%
Lifetime fuel savings compared with 2008: $4,100
Small SUVs are the fastest growing segment of the market and one of the most rapidly improving, with the average new SUV reducing its fuel use per mile by nearly 19 percent from 2008 to 2017. The Honda CR-V stands as one of the industry’s best-selling vehicles in any class—and it backs up that leadership with a tremendous improvement in efficiency as well. It bested the industry average improvement thanks to the new offering of a turbocharged, downsized engine option; gasoline direct injection across the board; a switch to a continuously variable transmission; and a reduction in load on the engine achieved by cutting both weight and aerodynamic drag.
Small SUVs: Honda CR-VSubset of technologies added since 2008:
• Turbocharged, downsized engine option
• Gasoline direct injection in all engines offered
• Continuously variable transmission improved from a five-speed automatic
• More than a 10 percent reduction in drag coefficient, including the addition of an active grille
• Increased use of high-strength steel, which made the 2017 model 100 pounds lighter despite being larger than the previous model
Improved fuel economy (2008–2017): 23.2 mpg–30.0 mpg
Percent reduction in fuel: 22.5%
Lifetime fuel savings compared with 2008: $4,600
Small SUVs are the fastest growing segment of the market and one of the most rapidly improving, with the average new SUV reducing its fuel use per mile by nearly 19 percent from 2008 to 2017.
Ki h
oon/
Cre
ativ
e C
omm
ons (
Wik
imed
ia C
omm
ons)
Euro
visi
onN
im/C
reat
ive
Com
mon
s (W
ikim
edia
Com
mon
s)
23Automaker Rankings 2018
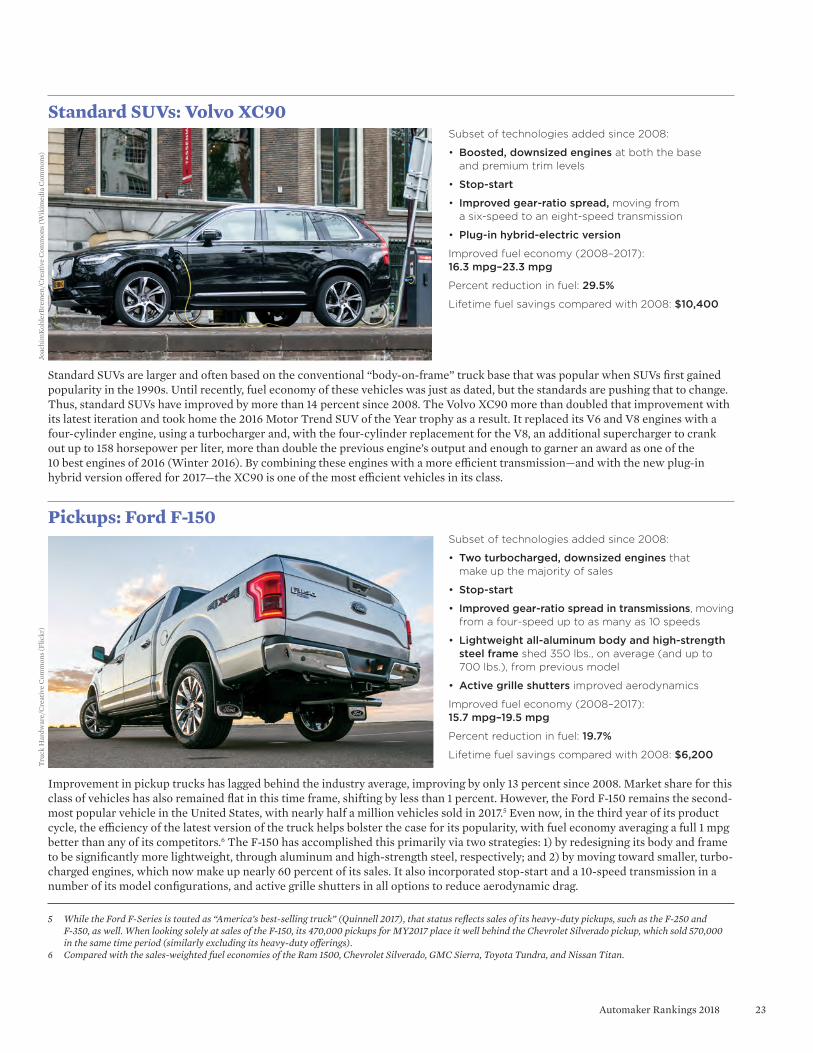
Standard SUVs are larger and often based on the conventional “body-on-frame” truck base that was popular when SUVs first gained popularity in the 1990s. Until recently, fuel economy of these vehicles was just as dated, but the standards are pushing that to change. Thus, standard SUVs have improved by more than 14 percent since 2008. The Volvo XC90 more than doubled that improvement with its latest iteration and took home the 2016 Motor Trend SUV of the Year trophy as a result. It replaced its V6 and V8 engines with a four-cylinder engine, using a turbocharger and, with the four-cylinder replacement for the V8, an additional supercharger to crank out up to 158 horsepower per liter, more than double the previous engine’s output and enough to garner an award as one of the 10 best engines of 2016 (Winter 2016). By combining these engines with a more efficient transmission—and with the new plug-in hybrid version offered for 2017—the XC90 is one of the most efficient vehicles in its class.
Standard SUVs: Volvo XC90Subset of technologies added since 2008:
• Boosted, downsized engines at both the base and premium trim levels
• Stop-start
• Improved gear-ratio spread, moving from a six-speed to an eight-speed transmission
• Plug-in hybrid-electric version
Improved fuel economy (2008–2017): 16.3 mpg–23.3 mpg
Percent reduction in fuel: 29.5%
Lifetime fuel savings compared with 2008: $10,400
Improvement in pickup trucks has lagged behind the industry average, improving by only 13 percent since 2008. Market share for this class of vehicles has also remained flat in this time frame, shifting by less than 1 percent. However, the Ford F-150 remains the second-most popular vehicle in the United States, with nearly half a million vehicles sold in 2017.5 Even now, in the third year of its product cycle, the efficiency of the latest version of the truck helps bolster the case for its popularity, with fuel economy averaging a full 1 mpg better than any of its competitors.6 The F-150 has accomplished this primarily via two strategies: 1) by redesigning its body and frame to be significantly more lightweight, through aluminum and high-strength steel, respectively; and 2) by moving toward smaller, turbo-charged engines, which now make up nearly 60 percent of its sales. It also incorporated stop-start and a 10-speed transmission in a number of its model configurations, and active grille shutters in all options to reduce aerodynamic drag.
Pickups: Ford F-150Subset of technologies added since 2008:
• Two turbocharged, downsized engines that make up the majority of sales
• Stop-start
• Improved gear-ratio spread in transmissions, moving from a four-speed up to as many as 10 speeds
• Lightweight all-aluminum body and high-strength steel frame shed 350 lbs., on average (and up to 700 lbs.), from previous model
• Active grille shutters improved aerodynamics
Improved fuel economy (2008–2017): 15.7 mpg–19.5 mpg
Percent reduction in fuel: 19.7%
Lifetime fuel savings compared with 2008: $6,200
5 While the Ford F-Series is touted as “America’s best-selling truck” (Quinnell 2017), that status reflects sales of its heavy-duty pickups, such as the F-250 and F-350, as well. When looking solely at sales of the F-150, its 470,000 pickups for MY2017 place it well behind the Chevrolet Silverado pickup, which sold 570,000 in the same time period (similarly excluding its heavy-duty offerings).
6 Compared with the sales-weighted fuel economies of the Ram 1500, Chevrolet Silverado, GMC Sierra, Toyota Tundra, and Nissan Titan.
Truc
k H
ardw
are/
Cre
ativ
e C
omm
ons (
Flic
kr)
Joac
him
Koh
lerB
rem
en/C
reat
ive
Com
mon
s (W
ikim
edia
Com
mon
s)

24 union of concerned scientists
Consumer Savings
Since 2008, the average vehicle has reduced its global warm-ing emissions by 14 percent. The two most popular classes of vehicles, midsize cars and small SUVs, have led in this reduc-tion. Choices in every vehicle class have gotten upward of 20 to 30 percent more efficient in that time frame. That’s great for consumers, who now save thousands of dollars in fuel as a result, even with reduced gas prices in that span of time. Even with the application of technologies such as smaller, boosted
engines and improved transmissions, not to mention the tremendous growth of new safety and connectivity features, average vehicle prices have largely tracked inflation, with only $1,300 per vehicle in increased costs attributable to all the brand-new features added since 2008, including elec-tronics, safety, and fuel economy technologies (Cooke 2017). Combined with fuel savings doubling and tripling that amount, these improvements help new consumers who finance their vehicles save money the moment they drive off the lot (Comings, Allison, and Ackerman 2016).
At the same time, while consumers save thousands of dollars, a tremendous opportunity lies ahead for even greater savings. Since the federal standards went into effect, con-sumers have saved more than $60 billion, and every day those savings grow (UCS n.d.). And that progress can con-tinue. Barely a fraction of today’s vehicles deploy some of the most well-known technologies, as noted in chapter 3 (“Technology”), and manufacturers continue to improve and develop new vehicles that raise the bar higher.
Since the federal standards went into effect, consumers have saved more than $60 billion, and every day those savings grow.
Consumers have already saved millions of dollars at the pump thanks to the more efficient vehicles being produced as a result of strong vehicles standards, and even greater savings lie ahead.
Kirsten.stanley/C
reative Com
mons (W
ikimedia C
omm
ons)
25Automaker Rankings 2018
Looking to the Future
[ chapter 5 ]
If the auto industry today could best be summed up in one word, that word would be “uncertainty.” Automakers’ push for weaker national standards leaves the rules governing the future ill defined. Over the past few years, electrification has made a lot of headway in driving down costs and improving performance. Still, many manufacturers have barely dipped a toe in the water regarding electrification, so many poten- tial customers have had little opportunity to experience the technology. And there has been much ado about autonomous vehicles and other safety technologies, but there are little real-world data on the technology at this point. Thus, despite the potential for rethinking transportation and bending the curve toward sustainability, we could instead see a catastrophic rise in passenger travel without a significant reduction in emissions from the vehicles carrying those passengers, blowing a hole in our ability to protect the climate.
This chapter discusses some future technologies to pro-vide further evidence for how much more vehicle emissions can decrease, and to provide a blueprint for manufacturers
to better enable their fleets to head toward a more sustain-able future.
Coming Soon to a Dealership Near You
Chapter 3 (“Technology”) discussed some of the improve-ments that are already making their way into new vehicles today, but that list did not come close to detailing all the potential technologies that could shape the vehicles of tomorrow. Manufacturers have announced a number of new vehicles, coming soon, that use technologies that were barely a blip on the radar of possibilities a decade ago.
SPArk-ConTroLLEd CoMPrESSIon IGnITIon
Mazda has spent the past decade focusing its technology prowess on refining the gasoline engine. Its SkyActiv-G family of engines used a high compression ratio, precise valve control, and a unique exhaust strategy to wrangle a tremen-dous amount of efficiency out of the gasoline engine, without resorting to a smaller, boosted strategy. The next step in that evolutionary process is spark-controlled compression ignition (SpCCI), found in its SkyActiv-X engine.
SpCCI is one of a host of ideas to combine the best aspects of a compression-ignition diesel engine and a spark-ignition gasoline engine, providing both improved efficiency and lower emissions. Diesel combustion occurs by compress-ing the air-fuel mixture to such a high pressure that it spon-taneously combusts in the piston, but this very hot combustion results in a lot of soot and smog-forming NOx emissions in a diesel engine. Therefore, it requires that the engine withstand a lot of heat and pressure. Spark ignition works by igniting the air-fuel mixture with a spark. This is a slower and less
A catastrophic rise in passenger travel without a significant reduction in emissions from the vehicles carrying those passengers could blow a hole in our ability to protect the climate.
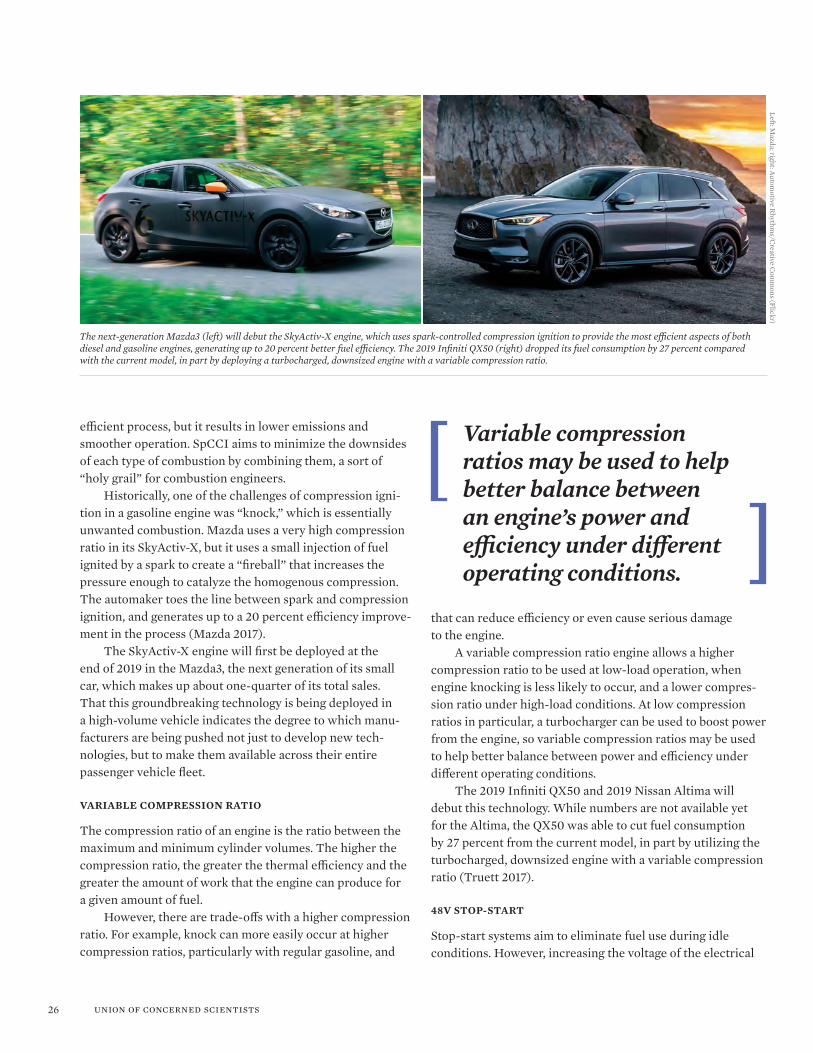
26 union of concerned scientists
The next-generation Mazda3 (left) will debut the SkyActiv-X engine, which uses spark-controlled compression ignition to provide the most efficient aspects of both diesel and gasoline engines, generating up to 20 percent better fuel efficiency. The 2019 Infiniti QX50 (right) dropped its fuel consumption by 27 percent compared with the current model, in part by deploying a turbocharged, downsized engine with a variable compression ratio.
efficient process, but it results in lower emissions and smoother operation. SpCCI aims to minimize the downsides of each type of combustion by combining them, a sort of “holy grail” for combustion engineers.
Historically, one of the challenges of compression igni-tion in a gasoline engine was “knock,” which is essentially unwanted combustion. Mazda uses a very high compression ratio in its SkyActiv-X, but it uses a small injection of fuel ignited by a spark to create a “fireball” that increases the pressure enough to catalyze the homogenous compression. The automaker toes the line between spark and compression ignition, and generates up to a 20 percent efficiency improve-ment in the process (Mazda 2017).
The SkyActiv-X engine will first be deployed at the end of 2019 in the Mazda3, the next generation of its small car, which makes up about one-quarter of its total sales. That this groundbreaking technology is being deployed in a high-volume vehicle indicates the degree to which manu-facturers are being pushed not just to develop new tech- nologies, but to make them available across their entire passenger vehicle fleet.
VArIAbLE CoMPrESSIon rATIo
The compression ratio of an engine is the ratio between the maximum and minimum cylinder volumes. The higher the compression ratio, the greater the thermal efficiency and the greater the amount of work that the engine can produce for a given amount of fuel.
However, there are trade-offs with a higher compression ratio. For example, knock can more easily occur at higher compression ratios, particularly with regular gasoline, and
that can reduce efficiency or even cause serious damage to the engine.
A variable compression ratio engine allows a higher compression ratio to be used at low-load operation, when engine knocking is less likely to occur, and a lower compres-sion ratio under high-load conditions. At low compression ratios in particular, a turbocharger can be used to boost power from the engine, so variable compression ratios may be used to help better balance between power and efficiency under different operating conditions.
The 2019 Infiniti QX50 and 2019 Nissan Altima will debut this technology. While numbers are not available yet for the Altima, the QX50 was able to cut fuel consumption by 27 percent from the current model, in part by utilizing the turbocharged, downsized engine with a variable compression ratio (Truett 2017).
48V SToP-STArT
Stop-start systems aim to eliminate fuel use during idle conditions. However, increasing the voltage of the electrical
Variable compression ratios may be used to help better balance between an engine’s power and efficiency under different operating conditions.
Left: Mazda; right: A
utomotive R
hythms/C
reative Com
mons (Flickr)
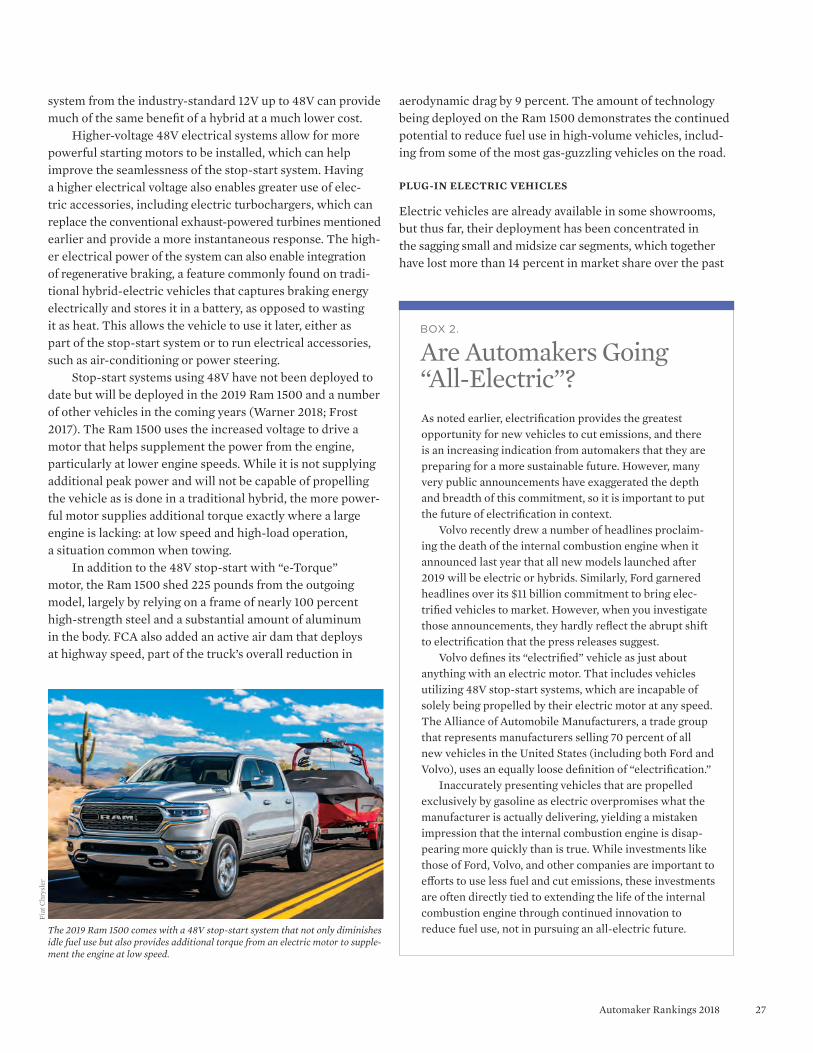
27Automaker Rankings 2018
system from the industry-standard 12V up to 48V can provide much of the same benefit of a hybrid at a much lower cost.
Higher-voltage 48V electrical systems allow for more powerful starting motors to be installed, which can help improve the seamlessness of the stop-start system. Having a higher electrical voltage also enables greater use of elec- tric accessories, including electric turbochargers, which can replace the conventional exhaust-powered turbines mentioned earlier and provide a more instantaneous response. The high-er electrical power of the system can also enable integration of regenerative braking, a feature commonly found on tradi-tional hybrid-electric vehicles that captures braking energy electrically and stores it in a battery, as opposed to wasting it as heat. This allows the vehicle to use it later, either as part of the stop-start system or to run electrical accessories, such as air-conditioning or power steering.
Stop-start systems using 48V have not been deployed to date but will be deployed in the 2019 Ram 1500 and a number of other vehicles in the coming years (Warner 2018; Frost 2017). The Ram 1500 uses the increased voltage to drive a motor that helps supplement the power from the engine, particularly at lower engine speeds. While it is not supplying additional peak power and will not be capable of propelling the vehicle as is done in a traditional hybrid, the more power-ful motor supplies additional torque exactly where a large engine is lacking: at low speed and high-load operation, a situation common when towing.
In addition to the 48V stop-start with “e-Torque” motor, the Ram 1500 shed 225 pounds from the outgoing model, largely by relying on a frame of nearly 100 percent high-strength steel and a substantial amount of aluminum in the body. FCA also added an active air dam that deploys at highway speed, part of the truck’s overall reduction in
The 2019 Ram 1500 comes with a 48V stop-start system that not only diminishes idle fuel use but also provides additional torque from an electric motor to supple-ment the engine at low speed.
As noted earlier, electrification provides the greatest opportunity for new vehicles to cut emissions, and there is an increasing indication from automakers that they are preparing for a more sustainable future. However, many very public announcements have exaggerated the depth and breadth of this commitment, so it is important to put the future of electrification in context. Volvo recently drew a number of headlines proclaim-ing the death of the internal combustion engine when it announced last year that all new models launched after 2019 will be electric or hybrids. Similarly, Ford garnered headlines over its $11 billion commitment to bring elec-trified vehicles to market. However, when you investigate those announcements, they hardly reflect the abrupt shift to electrification that the press releases suggest. Volvo defines its “electrified” vehicle as just about anything with an electric motor. That includes vehicles utilizing 48V stop-start systems, which are incapable of solely being propelled by their electric motor at any speed. The Alliance of Automobile Manufacturers, a trade group that represents manufacturers selling 70 percent of all new vehicles in the United States (including both Ford and Volvo), uses an equally loose definition of “electrification.” Inaccurately presenting vehicles that are propelled exclusively by gasoline as electric overpromises what the manufacturer is actually delivering, yielding a mistaken impression that the internal combustion engine is disap-pearing more quickly than is true. While investments like those of Ford, Volvo, and other companies are important to efforts to use less fuel and cut emissions, these investments are often directly tied to extending the life of the internal combustion engine through continued innovation to reduce fuel use, not in pursuing an all-electric future.
bOx 2.
Are Automakers Going “All-Electric”?
aerodynamic drag by 9 percent. The amount of technology being deployed on the Ram 1500 demonstrates the continued potential to reduce fuel use in high-volume vehicles, includ-ing from some of the most gas-guzzling vehicles on the road.
PLuG-In ELECTrIC VEhICLES
Electric vehicles are already available in some showrooms, but thus far, their deployment has been concentrated in the sagging small and midsize car segments, which together have lost more than 14 percent in market share over the past
Fiat
Chr
ysle
r
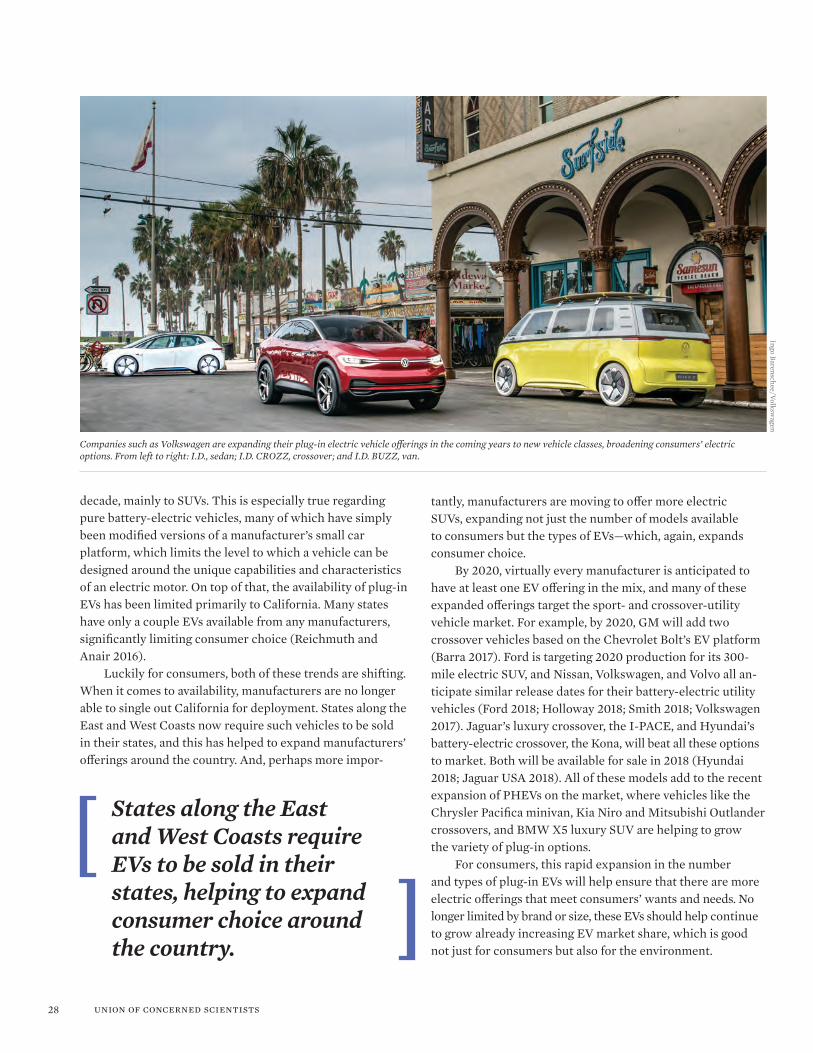
28 union of concerned scientists
Companies such as Volkswagen are expanding their plug-in electric vehicle offerings in the coming years to new vehicle classes, broadening consumers’ electric options. From left to right: I.D., sedan; I.D. CROZZ, crossover; and I.D. BUZZ, van.
decade, mainly to SUVs. This is especially true regarding pure battery-electric vehicles, many of which have simply been modified versions of a manufacturer’s small car platform, which limits the level to which a vehicle can be designed around the unique capabilities and characteristics of an electric motor. On top of that, the availability of plug-in EVs has been limited primarily to California. Many states have only a couple EVs available from any manufacturers, significantly limiting consumer choice (Reichmuth and Anair 2016).
Luckily for consumers, both of these trends are shifting. When it comes to availability, manufacturers are no longer able to single out California for deployment. States along the East and West Coasts now require such vehicles to be sold in their states, and this has helped to expand manufacturers’ offerings around the country. And, perhaps more impor-
tantly, manufacturers are moving to offer more electric SUVs, expanding not just the number of models available to consumers but the types of EVs—which, again, expands consumer choice.
By 2020, virtually every manufacturer is anticipated to have at least one EV offering in the mix, and many of these expanded offerings target the sport- and crossover-utility vehicle market. For example, by 2020, GM will add two crossover vehicles based on the Chevrolet Bolt’s EV platform (Barra 2017). Ford is targeting 2020 production for its 300-mile electric SUV, and Nissan, Volkswagen, and Volvo all an-ticipate similar release dates for their battery-electric utility vehicles (Ford 2018; Holloway 2018; Smith 2018; Volkswagen 2017). Jaguar’s luxury crossover, the I-PACE, and Hyundai’s battery-electric crossover, the Kona, will beat all these options to market. Both will be available for sale in 2018 (Hyundai 2018; Jaguar USA 2018). All of these models add to the recent expansion of PHEVs on the market, where vehicles like the Chrysler Pacifica minivan, Kia Niro and Mitsubishi Outlander crossovers, and BMW X5 luxury SUV are helping to grow the variety of plug-in options.
For consumers, this rapid expansion in the number and types of plug-in EVs will help ensure that there are more electric offerings that meet consumers’ wants and needs. No longer limited by brand or size, these EVs should help continue to grow already increasing EV market share, which is good not just for consumers but also for the environment.
States along the East and West Coasts require EVs to be sold in their states, helping to expand consumer choice around the country.
Ingo Barenschee/Volkswagen
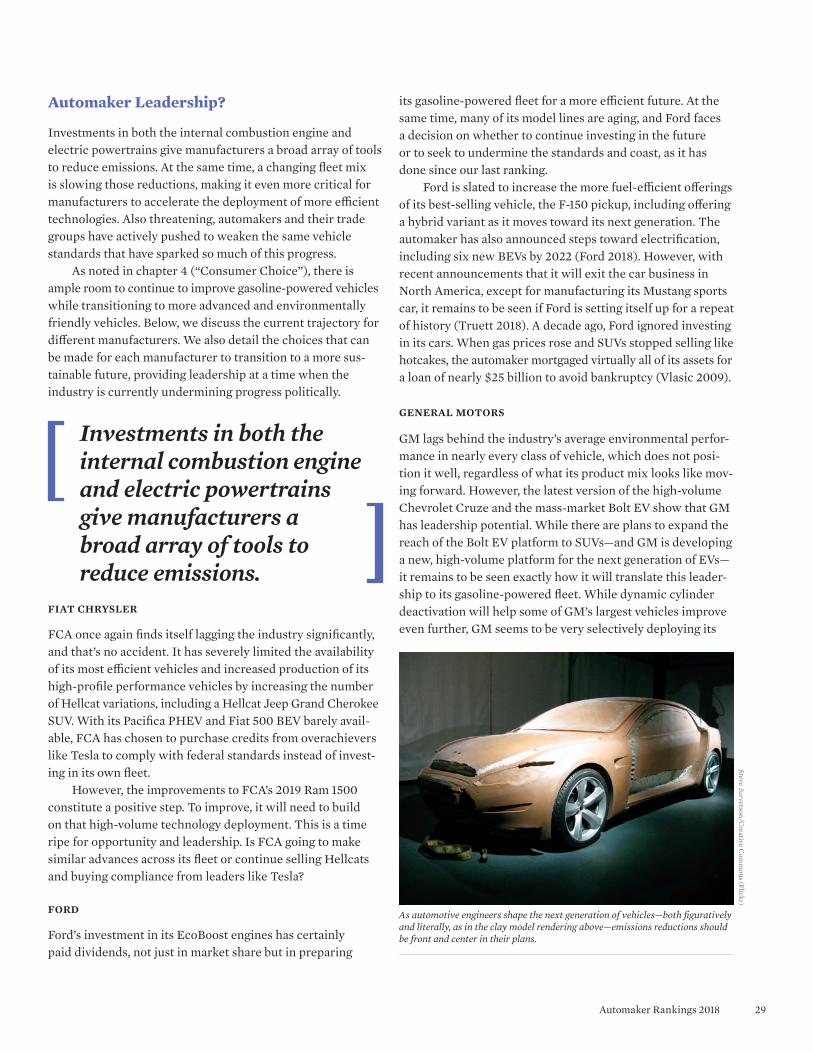
29Automaker Rankings 2018
Automaker Leadership?
Investments in both the internal combustion engine and electric powertrains give manufacturers a broad array of tools to reduce emissions. At the same time, a changing fleet mix is slowing those reductions, making it even more critical for manufacturers to accelerate the deployment of more efficient technologies. Also threatening, automakers and their trade groups have actively pushed to weaken the same vehicle standards that have sparked so much of this progress.
As noted in chapter 4 (“Consumer Choice”), there is ample room to continue to improve gasoline-powered vehicles while transitioning to more advanced and environmentally friendly vehicles. Below, we discuss the current trajectory for different manufacturers. We also detail the choices that can be made for each manufacturer to transition to a more sus-tainable future, providing leadership at a time when the industry is currently undermining progress politically.
its gasoline-powered fleet for a more efficient future. At the same time, many of its model lines are aging, and Ford faces a decision on whether to continue investing in the future or to seek to undermine the standards and coast, as it has done since our last ranking.
Ford is slated to increase the more fuel-efficient offerings of its best-selling vehicle, the F-150 pickup, including offering a hybrid variant as it moves toward its next generation. The automaker has also announced steps toward electrification, including six new BEVs by 2022 (Ford 2018). However, with recent announcements that it will exit the car business in North America, except for manufacturing its Mustang sports car, it remains to be seen if Ford is setting itself up for a repeat of history (Truett 2018). A decade ago, Ford ignored investing in its cars. When gas prices rose and SUVs stopped selling like hotcakes, the automaker mortgaged virtually all of its assets for a loan of nearly $25 billion to avoid bankruptcy (Vlasic 2009).
GEnErAL MoTorS
GM lags behind the industry’s average environmental perfor-mance in nearly every class of vehicle, which does not posi-tion it well, regardless of what its product mix looks like mov-ing forward. However, the latest version of the high-volume Chevrolet Cruze and the mass-market Bolt EV show that GM has leadership potential. While there are plans to expand the reach of the Bolt EV platform to SUVs—and GM is developing a new, high-volume platform for the next generation of EVs—it remains to be seen exactly how it will translate this leader-ship to its gasoline-powered fleet. While dynamic cylinder deactivation will help some of GM’s largest vehicles improve even further, GM seems to be very selectively deploying its
Investments in both the internal combustion engine and electric powertrains give manufacturers a broad array of tools to reduce emissions.
FIAT ChrySLEr
FCA once again finds itself lagging the industry significantly, and that’s no accident. It has severely limited the availability of its most efficient vehicles and increased production of its high-profile performance vehicles by increasing the number of Hellcat variations, including a Hellcat Jeep Grand Cherokee SUV. With its Pacifica PHEV and Fiat 500 BEV barely avail-able, FCA has chosen to purchase credits from overachievers like Tesla to comply with federal standards instead of invest-ing in its own fleet.
However, the improvements to FCA’s 2019 Ram 1500 constitute a positive step. To improve, it will need to build on that high-volume technology deployment. This is a time ripe for opportunity and leadership. Is FCA going to make similar advances across its fleet or continue selling Hellcats and buying compliance from leaders like Tesla?
Ford
Ford’s investment in its EcoBoost engines has certainly paid dividends, not just in market share but in preparing
As automotive engineers shape the next generation of vehicles—both figuratively and literally, as in the clay model rendering above—emissions reductions should be front and center in their plans.
Steve Jurvetson/Creative C
omm
ons (Flickr)
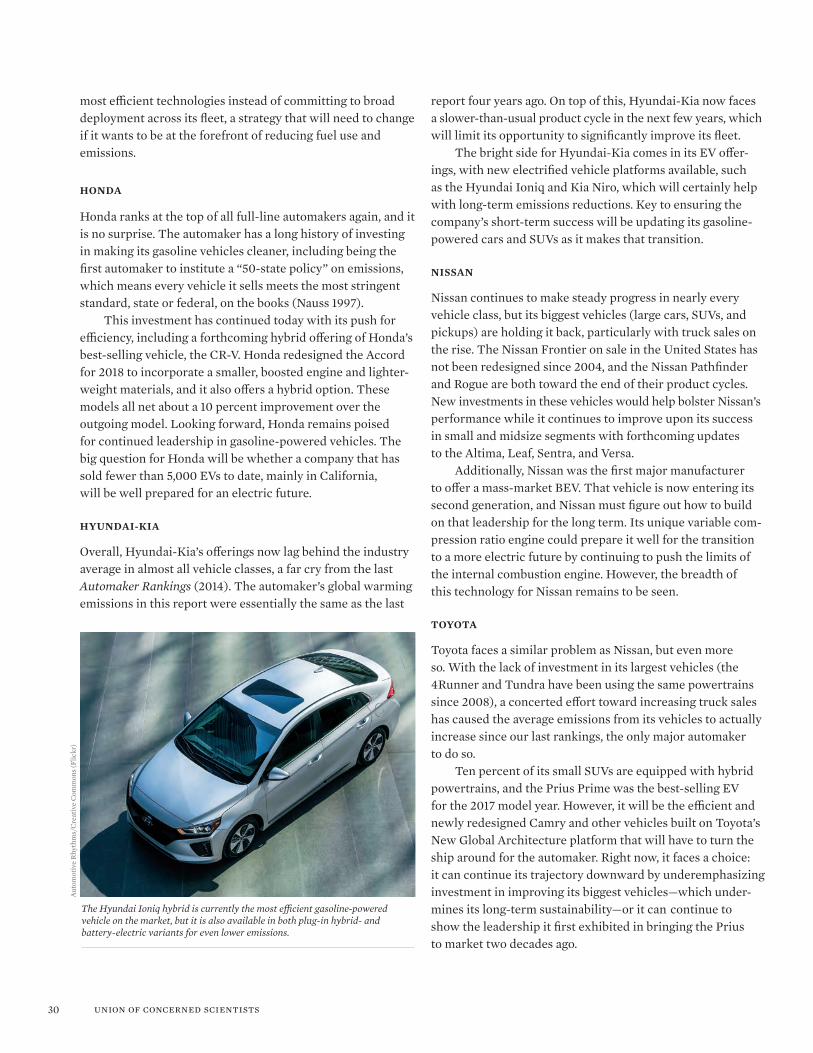
30 union of concerned scientists
most efficient technologies instead of committing to broad deployment across its fleet, a strategy that will need to change if it wants to be at the forefront of reducing fuel use and emissions.
hondA
Honda ranks at the top of all full-line automakers again, and it is no surprise. The automaker has a long history of investing in making its gasoline vehicles cleaner, including being the first automaker to institute a “50-state policy” on emissions, which means every vehicle it sells meets the most stringent standard, state or federal, on the books (Nauss 1997).
This investment has continued today with its push for efficiency, including a forthcoming hybrid offering of Honda’s best-selling vehicle, the CR-V. Honda redesigned the Accord for 2018 to incorporate a smaller, boosted engine and lighter-weight materials, and it also offers a hybrid option. These models all net about a 10 percent improvement over the outgoing model. Looking forward, Honda remains poised for continued leadership in gasoline-powered vehicles. The big question for Honda will be whether a company that has sold fewer than 5,000 EVs to date, mainly in California, will be well prepared for an electric future.
hyundAI-kIA
Overall, Hyundai-Kia’s offerings now lag behind the industry average in almost all vehicle classes, a far cry from the last Automaker Rankings (2014). The automaker’s global warming emissions in this report were essentially the same as the last
report four years ago. On top of this, Hyundai-Kia now faces a slower-than-usual product cycle in the next few years, which will limit its opportunity to significantly improve its fleet.
The bright side for Hyundai-Kia comes in its EV offer-ings, with new electrified vehicle platforms available, such as the Hyundai Ioniq and Kia Niro, which will certainly help with long-term emissions reductions. Key to ensuring the company’s short-term success will be updating its gasoline-powered cars and SUVs as it makes that transition.
nISSAn
Nissan continues to make steady progress in nearly every vehicle class, but its biggest vehicles (large cars, SUVs, and pickups) are holding it back, particularly with truck sales on the rise. The Nissan Frontier on sale in the United States has not been redesigned since 2004, and the Nissan Pathfinder and Rogue are both toward the end of their product cycles. New investments in these vehicles would help bolster Nissan’s performance while it continues to improve upon its success in small and midsize segments with forthcoming updates to the Altima, Leaf, Sentra, and Versa.
Additionally, Nissan was the first major manufacturer to offer a mass-market BEV. That vehicle is now entering its second generation, and Nissan must figure out how to build on that leadership for the long term. Its unique variable com-pression ratio engine could prepare it well for the transition to a more electric future by continuing to push the limits of the internal combustion engine. However, the breadth of this technology for Nissan remains to be seen.
ToyoTA
Toyota faces a similar problem as Nissan, but even more so. With the lack of investment in its largest vehicles (the 4Runner and Tundra have been using the same powertrains since 2008), a concerted effort toward increasing truck sales has caused the average emissions from its vehicles to actually increase since our last rankings, the only major automaker to do so.
Ten percent of its small SUVs are equipped with hybrid powertrains, and the Prius Prime was the best-selling EV for the 2017 model year. However, it will be the efficient and newly redesigned Camry and other vehicles built on Toyota’s New Global Architecture platform that will have to turn the ship around for the automaker. Right now, it faces a choice: it can continue its trajectory downward by underemphasizing investment in improving its biggest vehicles—which under-mines its long-term sustainability—or it can continue to show the leadership it first exhibited in bringing the Prius to market two decades ago.
The Hyundai Ioniq hybrid is currently the most efficient gasoline-powered vehicle on the market, but it is also available in both plug-in hybrid- and battery-electric variants for even lower emissions.
Aut
omot
ive
Rhy
thm
s/C
reat
ive
Com
mon
s (Fl
ickr
)
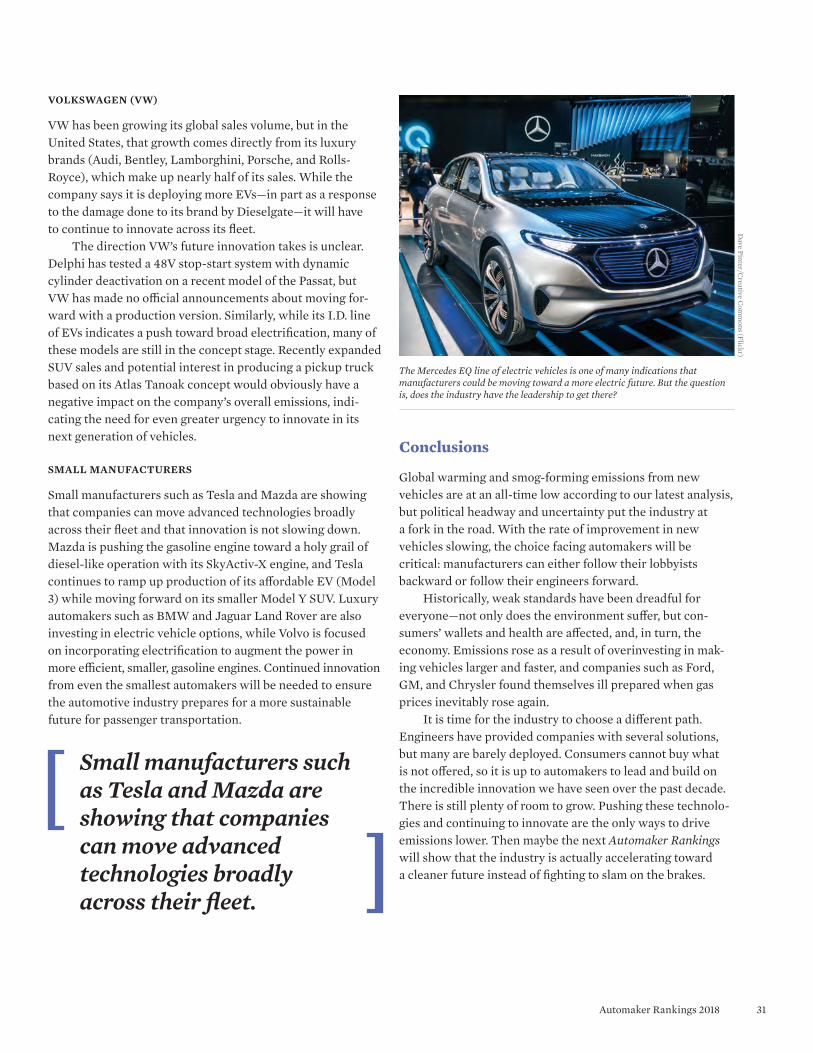
31Automaker Rankings 2018
Small manufacturers such as Tesla and Mazda are showing that companies can move advanced technologies broadly across their fleet.
VoLkSWAGEn (VW)
VW has been growing its global sales volume, but in the United States, that growth comes directly from its luxury brands (Audi, Bentley, Lamborghini, Porsche, and Rolls-Royce), which make up nearly half of its sales. While the company says it is deploying more EVs—in part as a response to the damage done to its brand by Dieselgate—it will have to continue to innovate across its fleet.
The direction VW’s future innovation takes is unclear. Delphi has tested a 48V stop-start system with dynamic cylinder deactivation on a recent model of the Passat, but VW has made no official announcements about moving for-ward with a production version. Similarly, while its I.D. line of EVs indicates a push toward broad electrification, many of these models are still in the concept stage. Recently expanded SUV sales and potential interest in producing a pickup truck based on its Atlas Tanoak concept would obviously have a negative impact on the company’s overall emissions, indi-cating the need for even greater urgency to innovate in its next generation of vehicles.
SMALL MAnuFACTurErS
Small manufacturers such as Tesla and Mazda are showing that companies can move advanced technologies broadly across their fleet and that innovation is not slowing down. Mazda is pushing the gasoline engine toward a holy grail of diesel-like operation with its SkyActiv-X engine, and Tesla continues to ramp up production of its affordable EV (Model 3) while moving forward on its smaller Model Y SUV. Luxury automakers such as BMW and Jaguar Land Rover are also investing in electric vehicle options, while Volvo is focused on incorporating electrification to augment the power in more efficient, smaller, gasoline engines. Continued innovation from even the smallest automakers will be needed to ensure the automotive industry prepares for a more sustainable future for passenger transportation.
The Mercedes EQ line of electric vehicles is one of many indications that manufacturers could be moving toward a more electric future. But the question is, does the industry have the leadership to get there?
Dave Pinter/C
reative Com
mons (Flickr)
Conclusions
Global warming and smog-forming emissions from new vehicles are at an all-time low according to our latest analysis, but political headway and uncertainty put the industry at a fork in the road. With the rate of improvement in new vehicles slowing, the choice facing automakers will be critical: manufacturers can either follow their lobbyists backward or follow their engineers forward.
Historically, weak standards have been dreadful for everyone—not only does the environment suffer, but con-sumers’ wallets and health are affected, and, in turn, the economy. Emissions rose as a result of overinvesting in mak-ing vehicles larger and faster, and companies such as Ford, GM, and Chrysler found themselves ill prepared when gas prices inevitably rose again.
It is time for the industry to choose a different path. Engineers have provided companies with several solutions, but many are barely deployed. Consumers cannot buy what is not offered, so it is up to automakers to lead and build on the incredible innovation we have seen over the past decade. There is still plenty of room to grow. Pushing these technolo-gies and continuing to innovate are the only ways to drive emissions lower. Then maybe the next Automaker Rankings will show that the industry is actually accelerating toward a cleaner future instead of fighting to slam on the brakes.
32 union of concerned scientists
All web pages accessed May 6, 2018.
Argonne National Laboratory (ANL). 2017. The greenhouse gases, regulated emissions, and energy use in transportation (GREET) model. Argonne, IL. Online at http://greet.es.anl.gov.
Automotive News. 2017. Toyota plots updates for trucks. September 29. Online at www.autonews.com/article/20170929/OEM04/ 170929755/toyota-plots-updates-for-trucks.
Barboza, T. 2017. Southern California smog worsens for second straight year despite reduced emissions. Los Angeles Times, November 15. Online at www.latimes.com/local/lanow/la-me-ln-bad-air-days-20171115-story.html.
Barra, M. 2017. General Motors. Presented at Barclays Global Automotive Conference, New York, November 15. Online at www.gm.com/content/dam/gm/events/docs/5265845- 684463-Chartset-11-15-2017.
California Air Resources Board (CARB). 2018. LCFS pathway certi-fied carbon intensities, updated May 4. Sacramento, CA. Online at www.arb.ca.gov/fuels/lcfs/fuelpathways/pathwaytable.htm.
California State Senate. 2006. Senate Bill No. 1505: Fuel: Hydrogen Alternative Fuel, September 30. Online at https://leginfolegislature.ca.gov/faces/billNavClient.xhtml?bill_id= 200520060SB1505.
Carey, N. 2017. U.S. Toyota executive says investments should boost truck, SUV sales in 2017. Reuters, February 9. Online at www.reuters.com/article/us-usa-toyota-trucks/u-s-toyota-executive- says-investments-should-boost-truck-suv-sales-in-2017- idUSKBN15O2XM.
Comings, T., A. Allison, and F. Ackerman. 2016. Fueling savings: High-er fuel economy standards result in big savings for consumers. Pre-pared for Consumers Union. Cambridge, MA: Synapse. Online at www:consumersunion.org/wp-content/uploads/2016/09/Fueling-Savings-Consumer-Savings-from-CAFE-2025-Final-1.pdf.
Cooke, D.W. 2017. Comments concerning the reconsideration of the final determination of the mid-term evaluation of greenhouse gas emissions standards for model year 2022-2025 light-duty vehicles and the appropriateness of model year 2021 greenhouse gas emissions standards, October 5. Online at www.regulations.gov/document?D=EPA-HQ-OAR-2015-0827-9200.
Cooke, D.W. 2015. Automaker Rankings revisited—does Volkswagen now have the “dirtiest tailpipe”? Cambridge, MA: Union of Concerned Scientists. Blog, October 13. Online at https://blog.ucsusa.org/dave-cooke/automaker-rankings-revisited-does- volkswagen-now-have-the-dirtiest-tailpipe-922.
Cooke, D. 2014. Automaker rankings 2014: The environmental perfor-mance of car companies. Cambridge, MA: Union of Concerned Scientists. Online at www.ucsusa.org/sites/default/files/legacy/assets/documents/clean_vehicles/Automaker-Rankings-2014.pdf.
[ references ]
Council of the European Communities (CEC). 1999. Case No. IV/M.1406—Hyundai / Kia, under Regulation (EEC) No. 4064/89—merger procedure. Document No. 399M1406, March 17. Brussels, Belgium. Online at http://ec.europa.eu/competition/mergers/cases/decisions/m1406_en.pdf.
Energy Information Administration (EIA). 2018. Annual energy outlook 2018, with projections to 2050. Washington, DC. Online at www.eia.gov/outlooks/aeo/data/pdf/AEO2018.pdf.
Energy Information Administration (EIA). 2017. Annual energy outlook 2017, with projections to 2050. Washington, DC. Online at www.eia.gov/outlooks/aeo/pdf/0383(2017).pdf.
Environmental Protection Agency (EPA). 2018a. Emissions database, updated April 18, 2018. Washington, DC. Online at www.fueleconomy.gov/feg/epadata/emissions.csv.zip.
Environmental Protection Agency (EPA). 2018b. Vehicle database, updated April 18, 2018. Washington, DC. Online at www.fueleconomy.gov/feg/epadata/vehicles.csv.zip.
Environmental Protection Agency (EPA). 2018c. Light-duty auto-motive technology, carbon dioxide emissions, and fuel economy trends: 1975 through 2017. EPA-420-R-18-001. Washington, DC. Online at https://nepis.epa.gov/Exe/ZyPDF.cgi?Dockey= P100TGDW.pdf.
Environmental Protection Agency (EPA). 2018d. Emissions & gen-eration resource integrated database (eGRID), released February 15. Washington, DC. Online at www.epa.gov/energy/emissions- generation-resource-integrated-database-egrid.
Environmental Protection Agency (EPA). 2017. Our nation’s air: Status and trends through 2016. Washington, DC. Online at https://gispub.epa.gov/air/trendsreport/2017.
Environmental Protection Agency (EPA). 2006. Final technical support document: Fuel economy labeling of motor vehicle revi-sions to improve calculation of fuel economy estimates. EPA-420-R-06-017. Washington, DC. Online at https://nepis.epa.gov/Exe/ZyPDF.cgi/P1004F41.PDF?Dockey=P1004F41.PDF.
Ford. 2018. Ford readies North America’s freshest lineup by 2020 with onslaught of connected new trucks, SUVs, and hybrids. March 15. Online at https://media.ford.com/content/fordmedia/fna/us/en/news/2018/03/15/ford-readies-north-americas-freshest-lineup-by-2020.html.
Ford. No date. Model T facts. Online at https://web.archive.org/web/20010617091406/http:/media.ford.com:80/article_display.cfm?article_id=858.
Friedman, D., and D. MacKenzie. 2004. Automaker rankings 2004: The environmental performance of car companies. Cambridge, MA: Union of Concerned Scientists. Online at www.ucsusa.org/assets/documents/clean_vehicles/autorankings2004.pdf.
33Automaker Rankings 2018
Frost, L. 2017. VW, PSA, Volvo, others adopt 48-volt mild hybrids in response to diesel decline. Reuters, September 23. Online at http://europe.autonews.com/article/20170923/ANE/170929892/vw-psa-volvo-others-adopt-48-volt-mild-hybrids-in-response-to-diesel.
Halvorson, B. 2018. 2019 Chevy, GMC trucks get smarter fuel-saving cylinder deactivation. Car and Driver, January 16. Online at www.caranddriver.com/news/2019-chevy-gmc-trucks-get- smarter-fuel-saving-cylinder-deactivation.
Holloway, H. 2018. Nissan Leaf SUV will be “breakthrough model” that cracks the mainstream. Autocar, March 16. Online at www.autocar.co.uk/car-news/new-cars/nissan-leaf-suv-will-be- breakthrough-model-cracks-mainstream.
Hyundai. 2018. Kona electric. Online at www.hyundaiusa.com/ kona-electric/index.aspx.
Jaguar USA. 2018. New all-electric Jaguar I-PACE 2019. Online at www.jaguarusa.com/Images/Jaguar-I-PACE-Brochure-1X5901910000BUSEN02P_tcm97-497681.pdf.
Kliesch, J. 2010. Automaker rankings 2010: The environmental perfor-mance of car companies. Cambridge, MA: Union of Concerned Scientists. Online at www.ucsusa.org/assets/documents/clean_vehicles/2010-automaker-report.pdf.
Korotney, D. 2016. Final estimate of E85 consumption in 2015. Memorandum to EPA air docket EPA-HQ-OAR-2016-0004, November 18. Online at www.regulations.gov/document?D= EPA-HQ-OAR-2016-0004-3750.
MacKenzie, D. 2007. Automaker rankings 2007: The environmental performance of car companies. Cambridge, MA: Union of Con-cerned Scientists. Online at www.ucsusa.org/assets/documents/clean_vehicles/autorank_2007report.pdf.
Mark, J. 2002. Automaker rankings: The environmental performance of car companies. Cambridge, MA: Union of Concerned Scientists. Online at www.ucsusa.org/assets/documents/clean_vehicles/autorank2002.pdf.
Mateja, J. 2017. Why car years are ahead of time. Chicago Tribune, February 12. Online at www.chicagotribune.com/classified/automotive/sc-car-model-years-reason-autocover-1103-20161101-story.html.
Mazda. 2017. SkyActiv-X next-generation gasoline engine. Online at https://insidemazda.mazdausa.com/press-release/mazda-next-generation-technology-press-information.
Morey, C, R. Hwang, J. Kliesch, and J. DeCicco. 2000. Pollution lineup: An environmental ranking of automakers. Cambridge, MA: Union of Concerned Scientists. Online at www.ucsusa.org/assets/documents/clean_vehicles/lineup_bro.pdf.
Nauss, D.W. 1997. Honda will sell low-emission cars nationwide. Los Angeles Times, July 18. Online at http://articles.latimes.com/ 1997/jul/18/business/fi-13800.
Nealer, R., D. Reichmuth, and D. Anair. 2015. Cleaner cars from cradle to grave: How electric cars beat gasoline cars on lifetime global warming emissions. Cambridge, MA: Union of Concerned Scien-tists. Online at www.ucsusa.org/sites/default/files/attach/2015/11/Cleaner-Cars-from-Cradle-to-Grave-full-report.pdf.
Office of Transportation and Air Quality (OTAQ). 2014. EPA sets Tier 3 tailpipe and evaporative emission and vehicle fuel standards. EPA-420-F-14-008. Washington, DC: Environmental Protection Agency. Online at https://nepis.epa.gov/Exe/ZyPURL.cgi?Dockey= P100HVZQ.TXT.
Quinnell, C. 2017. 40 years tough: America’s best selling truck. FordSocial. Online at https://social.ford.com/en_US/story/ford-community/built-ford-tough/40-years-tough-america-s-best-selling-truck.html.
Rechtin, M. 2013. Toyota engineer defends choice of carryover engines. Automotive News, August 5. Online at www.autonews.com/article/20130805/OEM02/308059986/toyota-engineer- defends-choice-of-carryover-engines.
Reichmuth, D. 2018. New data show electric vehicles continue to get cleaner. Cambridge, MA: Union of Concerned Scientists. Blog, March 8. Online at https://blog.ucsusa.org/dave-reichmuth/new-data-show-electric-vehicles-continue-to-get-cleaner.
Reichmuth, D., and D. Anair. 2016. Electrifying the vehicle market: Evaluating automaker leaders and laggards in the United States. Cambridge, MA: Union of Concerned Scientists. Online at www.ucsusa.org/sites/default/files/attach/2016/08/Electrifying-Vehicle-Market-full-report.pdf.
Saliba, G., R. Saleh, Y. Zhao, A.A. Presto, A.T. Lambe, B. Frodin, S. Sardar, H. Maldonado, C. Maddox, A.A. May, G.T. Drozd, A.H. Goldstein, L.M. Russell, F. Hagen, and A.L. Robinson. 2017. Comparison of gasoline direct-injection (GDI) and port fuel in-jection (PFI) vehicle emissions: Emission certification standards, cold-start, secondary organic aerosol formation potential, and potential climate impacts. Environmental Science and Technology 51(11):6542–6552. Online at http://dx.doi.org/10.1021/acs.est.6b06509.
Smith, L.J. 2018. New Volvo XC40 2018 – Electric version of the compact SUV confirmed. Daily Express, February 21. Online at www.express.co.uk/life-style/cars/921835/Volvo-XC40-2018- electric-car-new.
Truett, R. 2018. Con: At Ford, scrapping sedans is too easy, and a mistake. Automotive News, April 27. Online at www.autonews.com/article/20180427/BLOG06/180429789/ford-scrapping- cars-mistake-hackett.
Truett, R. 2017. Infiniti plays with power. Automotive News, November 20. Online at www.autonews.com/article/20171120/OEM06/171129970/infiniti-turbo-engine-fuel-efficiency- performance.
Union of Concerned Scientists (UCS). No date. Economic savings from fuel economy standards. Online at www.ucsusa.org/clean-vehicles/fuel-economy-ticker.
34 union of concerned scientists
Vlasic, B. 2009. Right on the money: Well-timed loans set Ford apart from its rivals. New York Times, April 9. Online at www.nytimes.com/2009/04/09/business/09ford.html.
Volkswagen. 2017. Striking I.D. CROZZ concept vehicle previews Volkswagen’s new compact electric SUV, due to launch in 2020. Press release, November 28. Online at https://media.vw.com/ en-us/releases/961.
WardsAuto. 2018a. U.S. cars and light trucks by body style, ’17 model year. January 16. Online at http://wardsauto.com/datasheet/us-cars-and-light-trucks-body-style-17-model-year.
WardsAuto. 2018b. Percent factory installed electronic/ADAS equip-ment on U.S. cars and light trucks, ’17 model year. January 16. Online at http://wardsauto.com/datasheet/factory-installed- electronicadas-equipment-us-cars-and-light-trucks-17-model-year.
WardsAuto. 2018c. Percent factory installed equipment on U.S. cars and light trucks, ’17 model year. January 16. Online at http://wardsauto.com/datasheet/factory-installed-equipment-us-cars- and-light-trucks-17-model-year.
WardsAuto. 2018d. Percent powertrain installations on U.S. cars and lt. trucks, ’17 model year. January 16. Online at http://wardsauto.com/datasheet/us-cars-and-light-trucks-body-style-17-model-year.
WardsAuto. 2017. U.S. light vehicle sales, September 2017. October 3. Online at http://wardsauto.com/datasheet/us-light-vehicle-sales- september-2017.
WardsAuto. 2016. WardsAuto U.S. light vehicle market segmentation and prices, ’17 model year. October 28. Online at http://wards-auto.com/datasheet/wardsauto-us-light-vehicle-market-segmentation- and-prices-17-model-year.
Warner, R. 2018. 2019 Ram 1500 eTorque system: What it is and how it works. Autoweek, January 19. Online at http://autoweek.com/article/technology/2019-ram-etorque-system-torque-down-low.
Winter, D. 2016. 2016 winner: Volvo XC90 T6 2.0L turbo/super-4. WardsAuto, January 8. Online at http://wardsauto.com/10-best- engines/2016-winner-volvo-xc90-t6-20l-turbosuper-4.
World Auto Steel. 2016. 2016-17 Chevy Cruze, HSS global platform. Online at www.worldautosteel.org/why-steel/steel-muscle-in- new-vehicles/2016-chevy-cruze-hss-global-platform.
35Automaker Rankings 2018
[ appendix ]
Methodology
While the Union of Concerned Scientists (UCS) has changed how it reports the automaker rankings, by incorporating small manufacturers and retiring the Greenest Automaker title, little has changed in the methodology for how the rankings are calculated. Therefore, while a more compre-hensive description of the methodology is available in Auto-maker Rankings 2014, this methodology section focuses largely on what is different, following a brief summary.
Summary
These rankings were developed by examining all model year (MY) 2017 vehicle sales for vehicles that were certified for sale by the Environmental Protection Agency (EPA). For our analysis, we consider MY sales to run from October 1, 2016, through September 30, 2017. Manufacturers have flex-ibility with the definition of a MY as it pertains to EPA certi-fication (beginning any day after January 1, 2016, and ending by December 31, 2017). However, the calendar definition used captures the early release of MY2017 vehicles but ensures that manufacturers are measured on a consistent basis for sales numbers, and one consistent with the historical record for product introduction in the United States (Mateja 2017).
TrIM-LEVEL SALES dATA For My2017
Data were gathered from a variety of publicly available sources to compile a comprehensive database of the vehicles sold by each manufacturer.
Model sales data were obtained from WardsAuto (WardsAuto 2017). In addition to sales data delineated by model, we have used 2017 production data from WardsAuto to delineate the options selected for each vehicle (WardsAuto 2018a, b, c, d). This production data is broken down at the model level and includes detailed information on the rela- tive production numbers for different body types, engines, transmissions, driveline capability, and electronic and safety features. By combining this information with the sales numbers, we are able to reasonably approximate the number of vehicles of a particular model configuration (trim).
dATA VALIdATIon
The 2014 automaker rankings were the first rankings to rely upon the data from WardsAuto to obtain trim-level information. Because the methodology has not changed significantly in that regard, the validation provided in that report remains valid.
In comparing the methodological result for MY2008 (Automaker Rankings 2010) using both the previous and cur-rent assessment of vehicle sales, there was very little deviation in the results. According to this analysis, the uncertainty is ±1.4 percent for smog-forming emissions scores, ±0.8 percent for global warming emissions scores, and ±1.0 percent for the combined scores, for all manufacturers.
To determine the ranking for major manufacturers, this uncertainty is assumed to reflect the standard deviation of a normal distribution around an automaker’s actual score. Ties are broken between manufacturers by testing the hypo-thesis that one manufacturer’s score is higher than another’s. If this probability exceeds 75 percent, then the first automaker is ranked above the second. If this probability is less than 75 percent, the automakers are considered tied. This method is approximately equivalent to the previous methodology, where ties were determined by whole-number rounding. Here, the implicit assumption of rounding to the nearest whole number has been converted to a one-sided t-test, which more explicitly incorporates uncertainty.
PoLLuTAnTS EVALuATEd
The combustion process in an engine or a fossil fuel power plant generates numerous pollutants. Two main classes of pollutants are considered in this analysis: smog-forming pollutants and global warming pollutants. Vehicles emit numerous other pollutants as well, including particulate matter, carbon monoxide, and carcinogens. However, emis-sions of smog-forming and global warming pollutants are arguably the most significant challenges facing the auto- motive industry today.
In addition to the direct emissions at the tailpipe, our analysis considers upstream emissions related to the
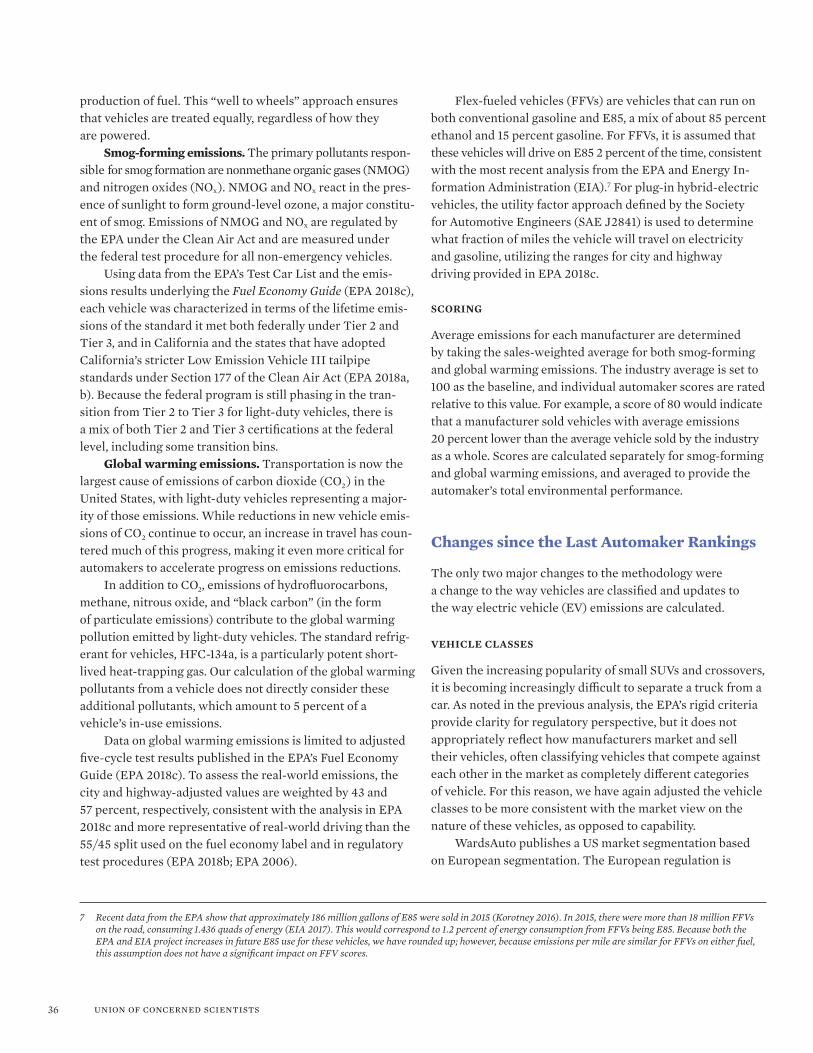
36 union of concerned scientists
7 Recent data from the EPA show that approximately 186 million gallons of E85 were sold in 2015 (Korotney 2016). In 2015, there were more than 18 million FFVs on the road, consuming 1.436 quads of energy (EIA 2017). This would correspond to 1.2 percent of energy consumption from FFVs being E85. Because both the EPA and EIA project increases in future E85 use for these vehicles, we have rounded up; however, because emissions per mile are similar for FFVs on either fuel, this assumption does not have a significant impact on FFV scores.
production of fuel. This “well to wheels” approach ensures that vehicles are treated equally, regardless of how they are powered.
Smog-forming emissions. The primary pollutants respon-sible for smog formation are nonmethane organic gases (NMOG) and nitrogen oxides (NOx). NMOG and NOx react in the pres-ence of sunlight to form ground-level ozone, a major constitu-ent of smog. Emissions of NMOG and NOx are regulated by the EPA under the Clean Air Act and are measured under the federal test procedure for all non-emergency vehicles.
Using data from the EPA’s Test Car List and the emis-sions results underlying the Fuel Economy Guide (EPA 2018c), each vehicle was characterized in terms of the lifetime emis-sions of the standard it met both federally under Tier 2 and Tier 3, and in California and the states that have adopted California’s stricter Low Emission Vehicle III tailpipe standards under Section 177 of the Clean Air Act (EPA 2018a, b). Because the federal program is still phasing in the tran-sition from Tier 2 to Tier 3 for light-duty vehicles, there is a mix of both Tier 2 and Tier 3 certifications at the federal level, including some transition bins.
Global warming emissions. Transportation is now the largest cause of emissions of carbon dioxide (CO2 ) in the United States, with light-duty vehicles representing a major-ity of those emissions. While reductions in new vehicle emis-sions of CO2 continue to occur, an increase in travel has coun-tered much of this progress, making it even more critical for automakers to accelerate progress on emissions reductions.
In addition to CO2, emissions of hydrofluorocarbons, methane, nitrous oxide, and “black carbon” (in the form of particulate emissions) contribute to the global warming pollution emitted by light-duty vehicles. The standard refrig-erant for vehicles, HFC-134a, is a particularly potent short-lived heat-trapping gas. Our calculation of the global warming pollutants from a vehicle does not directly consider these additional pollutants, which amount to 5 percent of a vehicle’s in-use emissions.
Data on global warming emissions is limited to adjusted five-cycle test results published in the EPA’s Fuel Economy Guide (EPA 2018c). To assess the real-world emissions, the city and highway-adjusted values are weighted by 43 and 57 percent, respectively, consistent with the analysis in EPA 2018c and more representative of real-world driving than the 55/45 split used on the fuel economy label and in regulatory test procedures (EPA 2018b; EPA 2006).
Flex-fueled vehicles (FFVs) are vehicles that can run on both conventional gasoline and E85, a mix of about 85 percent ethanol and 15 percent gasoline. For FFVs, it is assumed that these vehicles will drive on E85 2 percent of the time, consistent with the most recent analysis from the EPA and Energy In-formation Administration (EIA).7 For plug-in hybrid-electric vehicles, the utility factor approach defined by the Society for Automotive Engineers (SAE J2841) is used to determine what fraction of miles the vehicle will travel on electricity and gasoline, utilizing the ranges for city and highway driving provided in EPA 2018c.
SCorInG
Average emissions for each manufacturer are determined by taking the sales-weighted average for both smog-forming and global warming emissions. The industry average is set to 100 as the baseline, and individual automaker scores are rated relative to this value. For example, a score of 80 would indicate that a manufacturer sold vehicles with average emissions 20 percent lower than the average vehicle sold by the industry as a whole. Scores are calculated separately for smog-forming and global warming emissions, and averaged to provide the automaker’s total environmental performance.
Changes since the Last Automaker Rankings
The only two major changes to the methodology were a change to the way vehicles are classified and updates to the way electric vehicle (EV) emissions are calculated.
VEhICLE CLASSES
Given the increasing popularity of small SUVs and crossovers, it is becoming increasingly difficult to separate a truck from a car. As noted in the previous analysis, the EPA’s rigid criteria provide clarity for regulatory perspective, but it does not appropriately reflect how manufacturers market and sell their vehicles, often classifying vehicles that compete against each other in the market as completely different categories of vehicle. For this reason, we have again adjusted the vehicle classes to be more consistent with the market view on the nature of these vehicles, as opposed to capability.
WardsAuto publishes a US market segmentation based on European segmentation. The European regulation is
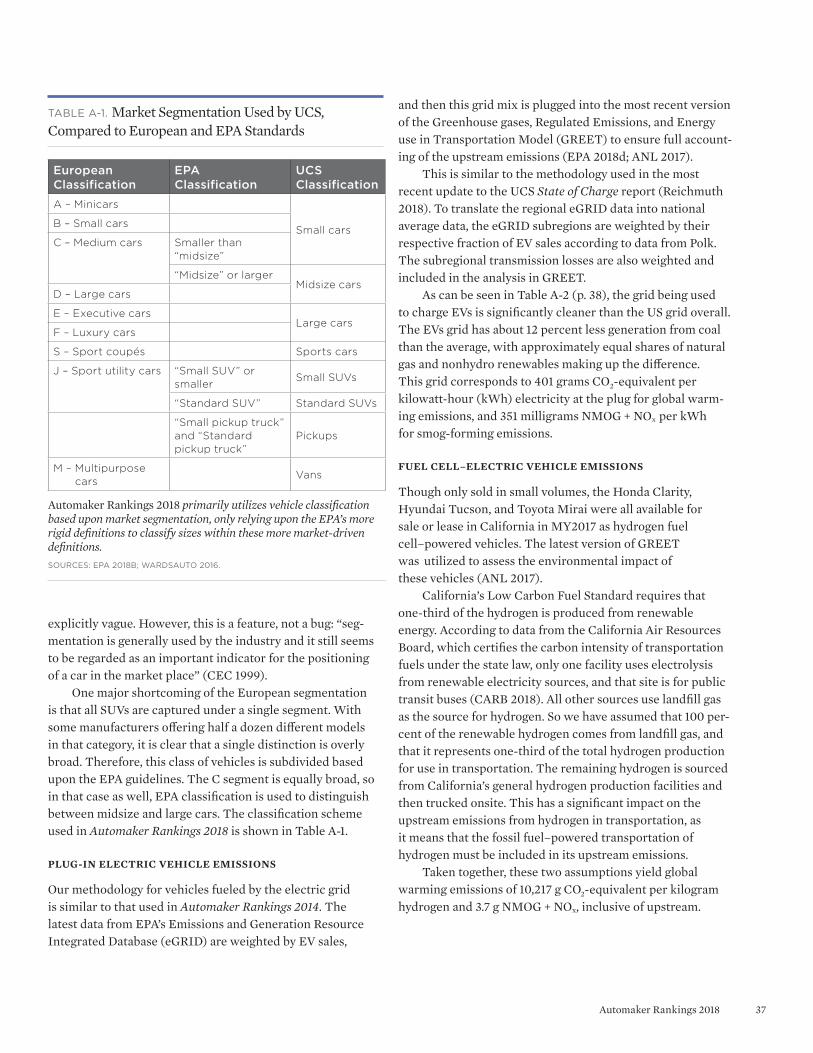
37Automaker Rankings 2018
and then this grid mix is plugged into the most recent version of the Greenhouse gases, Regulated Emissions, and Energy use in Transportation Model (GREET) to ensure full account-ing of the upstream emissions (EPA 2018d; ANL 2017).
This is similar to the methodology used in the most recent update to the UCS State of Charge report (Reichmuth 2018). To translate the regional eGRID data into national average data, the eGRID subregions are weighted by their respective fraction of EV sales according to data from Polk. The subregional transmission losses are also weighted and included in the analysis in GREET.
As can be seen in Table A-2 (p. 38), the grid being used to charge EVs is significantly cleaner than the US grid overall. The EVs grid has about 12 percent less generation from coal than the average, with approximately equal shares of natural gas and nonhydro renewables making up the difference. This grid corresponds to 401 grams CO2-equivalent per kilowatt-hour (kWh) electricity at the plug for global warm-ing emissions, and 351 milligrams NMOG + NOx per kWh for smog-forming emissions.
FuEL CELL–ELECTrIC VEhICLE EMISSIonS
Though only sold in small volumes, the Honda Clarity, Hyundai Tucson, and Toyota Mirai were all available for sale or lease in California in MY2017 as hydrogen fuel cell–powered vehicles. The latest version of GREET was utilized to assess the environmental impact of these vehicles (ANL 2017).
California’s Low Carbon Fuel Standard requires that one-third of the hydrogen is produced from renewable energy. According to data from the California Air Resources Board, which certifies the carbon intensity of transportation fuels under the state law, only one facility uses electrolysis from renewable electricity sources, and that site is for public transit buses (CARB 2018). All other sources use landfill gas as the source for hydrogen. So we have assumed that 100 per-cent of the renewable hydrogen comes from landfill gas, and that it represents one-third of the total hydrogen production for use in transportation. The remaining hydrogen is sourced from California’s general hydrogen production facilities and then trucked onsite. This has a significant impact on the upstream emissions from hydrogen in transportation, as it means that the fossil fuel–powered transportation of hydrogen must be included in its upstream emissions.
Taken together, these two assumptions yield global warming emissions of 10,217 g CO2-equivalent per kilogram hydrogen and 3.7 g NMOG + NOx, inclusive of upstream.
explicitly vague. However, this is a feature, not a bug: “seg-mentation is generally used by the industry and it still seems to be regarded as an important indicator for the positioning of a car in the market place” (CEC 1999).
One major shortcoming of the European segmentation is that all SUVs are captured under a single segment. With some manufacturers offering half a dozen different models in that category, it is clear that a single distinction is overly broad. Therefore, this class of vehicles is subdivided based upon the EPA guidelines. The C segment is equally broad, so in that case as well, EPA classification is used to distinguish between midsize and large cars. The classification scheme used in Automaker Rankings 2018 is shown in Table A-1.
PLuG-In ELECTrIC VEhICLE EMISSIonS
Our methodology for vehicles fueled by the electric grid is similar to that used in Automaker Rankings 2014. The latest data from EPA’s Emissions and Generation Resource Integrated Database (eGRID) are weighted by EV sales,
European Classification
EPA Classification
UCS Classification
A – Minicars
Small carsB – Small cars
C – Medium cars Smaller than “midsize”
“Midsize” or largerMidsize cars
D – Large cars
E – Executive carsLarge cars
F – Luxury cars
S – Sport coupés Sports cars
J – Sport utility cars “Small SUV” or smaller
Small SUVs
“Standard SUV” Standard SUVs
“Small pickup truck” and “Standard pickup truck”
Pickups
M – Multipurpose cars
Vans
Table a-1. Market Segmentation Used by UCS, Compared to European and EPA Standards
Automaker Rankings 2018 primarily utilizes vehicle classification based upon market segmentation, only relying upon the EPA’s more rigid definitions to classify sizes within these more market-driven definitions.SOurCeS: ePa 2018b; WardSauTO 2016.
38 union of concerned scientists
eGRID SubgridShare of EVs Sold Coal
Natural Gas Hydro Nuclear
Nonhydro Renewables Other
ASCC Alaska Grid (AKGD) 0.0% 12.6% 61.9% 12.6% 0.0% 3.8% 9.1%
ASCC Miscellaneous (AKMS) 0.0% 0.0% 7.9% 65.4% 0.0% 2.2% 24.6%
ERCOT, All (ERCT) 2.8% 25.9% 48.2% 0.3% 10.8% 14.1% 0.7%
FRCC, All (FRCC) 3.5% 16.0% 66.6% 0.1% 12.8% 2.6% 2.0%
HICC Misc. (HIMS) 0.3% 0.2% 0.0% 3.3% 0.0% 30.7% 65.8%
HICC Oahu (HIOA) 0.7% 20.7% 0.0% 0.0% 0.0% 9.7% 69.6%
MRO East (MROE) 0.5% 64.5% 20.5% 6.8% 0.0% 7.3% 0.9%
MRO West (MROW) 1.4% 52.7% 6.7% 5.0% 12.8% 22.4% 0.4%
NPCC Long Island (NYLI) 0.6% 0.0% 88.5% 0.0% 0.0% 8.8% 2.7%
NPCC New England (NEWE) 3.9% 2.4% 49.8% 5.3% 30.4% 11.3% 0.9%
NPCC NYC/Westchester (NYCW)
2.0% 0.0% 64.6% 0.0% 34.1% 0.9% 0.4%
NPCC Upstate NY (NYUP) 1.7% 2.1% 27.7% 31.6% 31.4% 6.9% 0.2%
RFC East (RFCE) 5.5% 17.6% 38.0% 0.9% 39.7% 3.3% 0.5%
RFC Michigan (RFCM) 2.5% 41.5% 31.4% 0.0% 17.5% 6.8% 2.8%
RFC West (RFCW) 4.5% 49.8% 16.7% 0.9% 27.6% 3.9% 1.2%
SERC Midwest (SRMW) 0.9% 71.4% 8.3% 1.2% 15.1% 3.6% 0.3%
SERC Mississippi Valley (SRMV)
0.4% 14.0% 58.7% 1.4% 21.2% 1.8% 2.9%
SERC South (SRSO) 4.1% 28.9% 47.0% 2.0% 18.2% 3.8% 0.2%
SERC Tennessee Valley (SRTV) 1.0% 43.7% 23.4% 6.4% 25.1% 0.8% 0.6%
SERC Virginia/Carolina (SRVC) 2.3% 24.9% 29.5% 1.5% 39.6% 4.1% 0.5%
SPP North (SPPN) 0.5% 57.9% 9.5% 0.3% 12.4% 19.9% 0.1%
SPP South (SPPS) 0.5% 34.8% 40.7% 3.6% 0.0% 18.7% 2.2%
WECC California (CAMX) 48.2% 4.3% 48.4% 12.1% 9.4% 24.7% 1.0%
WECC Northwest (NWPP) 7.2% 22.5% 15.3% 47.2% 3.4% 11.0% 0.6%
WECC Rockies (RMPA) 1.7% 51.3% 20.2% 12.1% 0.0% 16.2% 0.1%
WECC Southwest (AZNM) 3.2% 29.5% 39.8% 3.5% 19.5% 7.6% 0.1%
EV Sales-Weighted Electric Grid 100.0% 18.3% 39.4% 10.8% 15.9% 14.9% 0.7%
United States Average Electric Grid
30.4% 33.8% 6.4% 19.8% 8.5% 1.1%
Table a-2. Weighting of Sources of Electricity for Electric Vehicles, by eGRID Subgrid
Electric vehicles are being fueled by electricity with much lower emissions than the United States average, owing to a significant reduction in coal power compensated equally by renewable energy and natural gas.
SOurCeS: uCS aNalySiS; ePa 2018d.

39Automaker Rankings 2018
web: www.ucsusa.org printed on recycled paper using vegetable-based inks © JUNE 2018 union of concerned scientists
NatioNal HeadqUarterS Two Brattle SquareCambridge, MA 02138-3780Phone: (617) 547-5552Fax: (617) 864-9405
WaSHiNgtoN, dC, oFFiCe1825 K St. NW, Suite 800Washington, DC 20006-1232Phone: (202) 223-6133Fax: (202) 223-6162
WeSt CoaSt oFFiCe500 12th St., Suite 340Oakland, CA 94607-4087Phone: (510) 843-1872Fax: (510) 451-3785
MidWeSt oFFiCeOne N. LaSalle St., Suite 1904Chicago, IL 60602-4064Phone: (312) 578-1750Fax: (312) 578-1751
The Union of Concerned Scientists puts rigorous, independent science to work to solve our planet’s most pressing problems. Joining with people across the country, we combine technical analysis and effective advocacy to create innovative, practical solutions for a healthy, safe, and sustainable future.
find this document online: www.ucsusa.org/autorankings2018
The product planning decisions of a small number of automotive companies have an immense influence on the environmental health of the United States and the world. This report—the seventh in a continuing series the Union of Concerned Scientists launched 18 years ago—analyzes the bottom-line environmental performance of the entire industry and focuses on the eight full-line manufacturers that together account for 90 percent of the cars and trucks sold in the United States.
Using publicly available data on model year 2017 vehicles, we evaluate each automaker’s average per-mile emissions of smog-
forming and global warming pollutants. More stringent emissions and fuel economy standards have pushed the average global warming and smog-forming emissions from new vehicles to record low levels, but that progress slows while the industry moves to weaken those protections.
This report highlights leadership across the industry and outlines a path forward for both the leaders and laggards. However, in recognition of the current state of the industry, and owing to the narrow focus of this report on emissions, UCS is no longer crowning a Greenest Automaker.
Automaker Rankings 2018The Environmental Performance of Car Companies
This report analyzes the bottom-line environmental performance of the automotive industry, focusing on the eight full-line manufacturers that together account for 90 percent of the cars and trucks sold in the United States.