
SERIES EDITORS SCIENTIAE RERUM NATURALIUM A …jultika.oulu.fi/files/isbn9789514260766.pdf ·...
78
UNIVERSITATIS OULUENSIS ACTA A SCIENTIAE RERUM NATURALIUM OULU 2009 A 544 Eija Saari TOWARDS MINIMIZING MEASUREMENT UNCERTAINTY IN TOTAL PETROLEUM HYDROCARBON DETERMINATION BY GC-FID FACULTY OF SCIENCE, DEPARTMENT OF CHEMISTRY, UNIVERSITY OF OULU A 544 ACTA Eija Saari
Transcript of SERIES EDITORS SCIENTIAE RERUM NATURALIUM A …jultika.oulu.fi/files/isbn9789514260766.pdf ·...

ABCDEFG
UNIVERS ITY OF OULU P.O.B . 7500 F I -90014 UNIVERS ITY OF OULU F INLAND
A C T A U N I V E R S I T A T I S O U L U E N S I S
S E R I E S E D I T O R S
SCIENTIAE RERUM NATURALIUM
HUMANIORA
TECHNICA
MEDICA
SCIENTIAE RERUM SOCIALIUM
SCRIPTA ACADEMICA
OECONOMICA
EDITOR IN CHIEF
PUBLICATIONS EDITOR
Professor Mikko Siponen
University Lecturer Elise Kärkkäinen
Professor Hannu Heusala
Professor Helvi Kyngäs
Senior Researcher Eila Estola
Information officer Tiina Pistokoski
University Lecturer Seppo Eriksson
University Lecturer Seppo Eriksson
Publications Editor Kirsti Nurkkala
ISBN 978-951-42-6075-9 (Paperback)ISBN 978-951-42-6076-6 (PDF)ISSN 0355-3191 (Print)ISSN 1796-220X (Online)
U N I V E R S I TAT I S O U L U E N S I SACTAA
SCIENTIAE RERUM NATURALIUM
U N I V E R S I TAT I S O U L U E N S I SACTAA
SCIENTIAE RERUM NATURALIUM
OULU 2009
A 544
Eija Saari
TOWARDS MINIMIZING MEASUREMENT UNCERTAINTY IN TOTAL PETROLEUM HYDROCARBON DETERMINATION BY GC-FID
FACULTY OF SCIENCE,DEPARTMENT OF CHEMISTRY,UNIVERSITY OF OULU
A 544
ACTA
Eija Saari

A C T A U N I V E R S I T A T I S O U L U E N S I SA S c i e n t i a e R e r u m N a t u r a l i u m 5 4 4
EIJA SAARI
TOWARDS MINIMIZING MEASUREMENT UNCERTAINTYIN TOTAL PETROLEUM HYDROCARBON DETERMINATION BY GC-FID
Academic dissertation to be presented with the assent ofthe Faculty of Science of the University of Oulu for publicdefence in Auditorium TA105, Linnanmaa, on 18December 2009, at 12 noon
OULUN YLIOPISTO, OULU 2009

Copyright © 2009Acta Univ. Oul. A 544, 2009
Supervised byProfessor Paavo PerämäkiDocent Jorma Jalonen
Reviewed byDocent Veikko KitunenDocent Risto Pöykiö
ISBN 978-951-42-6075-9 (Paperback)ISBN 978-951-42-6076-6 (PDF)http://herkules.oulu.fi/isbn9789514260766/ISSN 0355-3191 (Printed)ISSN 1796-220X (Online)http://herkules.oulu.fi/issn03553191/
Cover designRaimo Ahonen
OULU UNIVERSITY PRESSOULU 2009

Saari, Eija, Towards minimizing measurement uncertainty in total petroleumhydrocarbon determination by GC-FID. Faculty of Science, Department of Chemistry, University of Oulu, P.O.Box 3000, FI-90014University of Oulu, Finland Acta Univ. Oul. A 544, 2009Oulu, Finland
AbstractDespite tightened environmental legislation, spillages of petroleum products remain a seriousproblem worldwide. The environmental impacts of these spillages are always severe and reliablemethods for the identification and quantitative determination of petroleum hydrocarbons inenvironmental samples are therefore needed. Great improvements in the definition and analysis oftotal petroleum hydrocarbons (TPH) were finally introduced by international organizations forstandardization in 2004. This brought some coherence to the determination and, nowadays, mostlaboratories seem to employ ISO/DIS 16703:2004, ISO 9377-2:2000 and CEN prEN14039:2004:E draft international standards for analysing TPH in soil. The implementation of thesemethods, however, usually fails because the reliability of petroleum hydrocarbon determinationhas proved to be poor.
This thesis describes the assessment of measurement uncertainty for TPH determination in soil.Chemometric methods were used to both estimate the main uncertainty sources and identify themost significant factors affecting these uncertainty sources. The method used for thedeterminations was based on gas chromatography utilizing flame ionization detection (GC-FID).
Chemometric methodology applied in estimating measurement uncertainty for TPHdetermination showed that the measurement uncertainty is in actual fact dominated by theanalytical uncertainty. Within the specific concentration range studied, the analytical uncertaintyaccounted for as much as 68–80% of the measurement uncertainty. The robustness of theanalytical method used for petroleum hydrocarbon determination was then studied in more detail.A two-level Plackett-Burman design and a D-optimal design were utilized to assess the mainanalytical uncertainty sources of the sample treatment and GC determination procedures. It wasalso found that the matrix-induced systematic error may also significantly reduce the reliability ofpetroleum hydrocarbon determination.
The results showed that strict implementation of the ISO and CEN draft standards is necessaryowing to the method dependence of the analyzed parameter. Care should be taken to ensure thatthe methods used for petroleum hydrocarbon determination are comprehensively validated, andthat routine quality control is carried out in order to ensure that the validation conclusions areapplicable in the daily work.
Keywords: extraction, gas chromatography, measurement uncertainty, petroleumhydrocarbons, soil analysis


“There is an understandable lack of enthusiasm for rousing the sleeping dogs
of sampling when there is a fair chance of being severely bitten”
– Michael Thompson

6

7
Acknowledgements
The research for this thesis was carried out at the Department of Chemistry,
University of Oulu, during the years 2005–2008. Financial support from the Neste
Oy Foundation is gratefully acknowledged.
I wish to express sincere gratitude to my supervisor, Professor Paavo
Perämäki, for allowing me to design and implement this thesis in my own way
and with my own ideas. His encouraging attitude to explore the interesting field
of analytical chemistry was certainly vital for the outcome of this thesis.
Especially, I am indebted to his patient support in getting this thesis finished. I
also express my deep gratitude to Ph. Lic Henrik Westerholm (Neste Oil Oyj,
Porvoo Refinery) for having shared his expertise in the field of oil refining
technology and for arousing my interest in the constructive elements of this
thesis.
My specific thanks go to Päivi Joensuu (Department of Chemistry, University
of Oulu) for providing me with the instrumental support, to Seppo Nikunen
(Pöyry Building Services Oy) for his co-operation and to Mia Virtanen (Golder
Associates Oy) for letting me carry out the primary sampling in a remediation
site. I’m also indebted to PhD Risto Pöykiö and PhD Veikko Kitunen for the
scientific and to PhD John Derome for the linguistic revision of the original
manuscript.
And then, last but not least, I am most indebted to you, Kaitsu, for your
personal support and trust. It was actually your vision that encouraged me to
reach for the impossible. I also wish to express my sincere gratitude to you,
Marjatta. In fact, both of you deserve special thanks for providing me with the
opportunity of a lifetime to do research in one of the most fascinating fields of
chemistry.
Finally, my deepest gratitude goes to my husband, Tapani, and to my dear
children, Tuomas, Tanja and Timi, for all the patience and understanding they
have shown throughout this project. You are the most valuable thing in my life.
The inspiration for these studies matured along the intelligent and strong
musical elements of the Sonata Arctica albums from Ecliptica to Unia.
Oulu, November 2009 Eija Saari

8
9
Abbreviations and definitions
ANOVA analysis of variance
CEN European Committee for Standardization
CITAC international organization with the mission to improve co-
operation on international traceability in analytical chemistry
ERM-CC015a a certified reference material (mineral oil contaminated
sediment, TPH 1820 ± 130 mg/kg
EURACHEM a network of organizations in Europe having the objective of
establishing a system for the international traceability of
chemical measurements and the promotion of good quality
practices
FT-ICR-MS Fourier transform ion cyclotron resonance mass spectrometry
GC-FID gas chromatography flame ionization detection
GC-MS gas chromatography mass spectrometry
ISO International Organization for Standardization
MODDE a commercial computer program for statistical experimental
design
MWAE microwave-assisted extraction
PAH polycyclic aromatic hydrocarbons
PCB polychlorinated biphenyls
SPSS a commercial statistical computer program
TPH total petroleum hydrocarbons
Type A
evaluation
(top-down) method for evaluating uncertainty by the statistical analysis of
series of observations
Type B
uncertainty
(bottom-up) method for evaluating uncertainty by means other than the
statistical analysis of series of observations
US ultrasonic
USEPA U.S. Environmental Protection Agency
a slope of a calibration line
b intercept of a calibration line
rsd relative standard deviation
s standard deviation

10
se spread of measurements around the fitted regression line
sep2 pooled estimated variance
Urel expanded uncertainty (relative)
n number of replicates
m number of replicates

11
List of original publications
This thesis is based on the following original papers, which are referred to in the
text by Roman numerals:
I Saari E, Perämäki P, Jalonen J (2007) A comparative study of solvent extraction of total petroleum hydrocarbons in soil. Microchim. Acta 158: 261–268.
II Saari E, Perämäki P, Jalonen J (2007) Effect of sample matrix on the determination of total petroleum hydrocarbons (TPH) in soil by gas chromatography-flame ionization detection. Microchem J 87: 113–118.
III Saari E, Perämäki P, Jalonen J (2008) Measurement uncertainty in the determination of total petroleum hydrocarbons (TPH) in soil by GC-FID. Chemometrics and Intelligent Laboratory Systems 92: 3–12.
IV Saari E, Perämäki P, Jalonen J (2008) Evaluating the impact of extraction and cleanup parameters on the yield of total petroleum hydrocarbons in soil. Anal Bioanal Chem 392: 1231–1240.
V Saari E, Perämäki P, Jalonen J (in press) Evaluating the impact of GC operating settings on GC-FID performance for total petroleum hydrocarbon (TPH) determination. Microchem J (in press) DOI: doi:10.1016/j.microc.2009.09.004.

12

13
Contents
Abstract
Acknowledgements 7 Abbreviations and definitions 9 List of original publications 11 Contents 13 1 Introduction 15
1.1 Characteristics of petroleum products ..................................................... 16 1.2 Behaviour and fate of petroleum hydrocarbons within the soil
environment ............................................................................................ 17 1.3 Sampling and analysis of petroleum hydrocarbon contaminated
soil ........................................................................................................... 19 1.3.1 Why are petroleum hydrocarbons monitored? ............................. 19 1.3.2 Methods and definitions for petroleum hydrocarbon
determination in soil ..................................................................... 19 1.3.3 State of the art in petroleum hydrocarbon determination ............. 20
1.4 Sources of measurement uncertainty in TPH determination in
soil ........................................................................................................... 22 1.4.1 Primary sampling stage ................................................................ 22 1.4.2 Sample treatment procedure ......................................................... 23 1.4.3 Gas chromatographic determination ............................................. 25
1.5 Assessment of measurement uncertainty for environmental
analysis .................................................................................................... 27 1.6 Significance of measurement uncertainty in environmental
analysis .................................................................................................... 29 2 Aims of the research 31 3 Experimental 33
3.1 Sample types, sampling and pre-treatment ............................................. 33 3.2 Sample extraction procedures ................................................................. 34 3.3 Analytical equipment .............................................................................. 35 3.4 Calibration and quality control ................................................................ 37 3.5 Experimental design and statistical analysis ........................................... 37
4 Results and discussion 39 4.1 TPH concentrations in the contaminated site .......................................... 39 4.2 Estimation of measurement uncertainty for TPH determination in
soil (III) ................................................................................................... 40

14
4.3 Factors affecting the analytical uncertainty ............................................. 43 4.3.1 The effect of extraction method (I) ............................................... 43 4.3.2 Matrix effects in GC determination (II) ........................................ 48 4.3.3 The effects of extraction and clean-up parameters (IV) ............... 50 4.3.4 The effect of GC operating settings (V) ....................................... 54
5 Conclusions 59 References 63 Original publications 73

15
1 Introduction
Oil consumption has increased steadily during recent decades along with the
growing demand for energy worldwide. (1) Despite this growth in consumption
the total amount of spillages has been decreasing, mainly due to tightened
environmental legislation. (2) However, the release of petroleum products into the
environment still remains a serious and increasingly prevalent problem. The
estimated amount spilled during the period 1991–2000 was nearly 1 600 000
tonnes. The severe impacts of these spillages have created an urgent need for
developing more reliable methods for the identification and quantification of
petroleum products in the environment.
According to ISO, the reliability of a measurement can be expressed by
stating the uncertainty of a measurement result. However, the assessment of
measurement uncertainty for environmental analysis is a great challenge for
environmental and analytical chemists because a comprehensive understanding is
required of the performance of the whole analysis chain in order to produce valid
information about the type and extent of contamination. Thus, the primary
sampling stage must also be recognized as a source of uncertainty that affects the
reliability of the measurement result. (3, 4)
The concepts and practices of analytical uncertainty assessment have been
well described and are recognized by analytical chemists. However, the
incorporation of primary sampling uncertainty means that measurement
uncertainty assessment becomes a multidisciplinary subject that goes well beyond
traditional analytical chemistry and incorporates chemometrics, sampling theory
and national guidelines on the environmental monitoring of harmful substances.
The estimation process also becomes laborious in practice because it requires
comprehensive sampling strategy planning and realization, as well as a large
number of replicated assays.
Despite these difficulties, measurement uncertainty assessment and
minimization will become increasingly important steps in environmental studies.
As a number of studies have already demonstrated, it can, depending on the
analyte, be either the primary sampling or the analytical stage that contributes the
largest source (50–70%) of measurement uncertainty. (5–8) Therefore, if the
reliability of environmental analysis is to be improved, then the dominating
sources of uncertainty have to be identified and minimized. Only then can the
measurement uncertainty be efficiently reduced and appropriate assessment of the

16
environmental risks, as well as the selection and allocation of remediation
resources, be carried out reliably.
1.1 Characteristics of petroleum products
Petroleum products are derived from crude oil by fractional distillation. In a
simplified description of petroleum refining, crude oil is first distilled into
different boiling range fractions which are then further treated by a range of
conversion, blending and additive treatment processes. (9) A processed petroleum
product is a highly complex mixture of thousands of different organic compounds
including paraffinic compounds (CnH2n+2), naphtenic compounds
(cycloparaffines, CnH2n), olefinic compounds (alkenes, CnH2n), aromatic and
polycyclic aromatic hydrocarbons (PAH), as well as heteroatom (N, O, S)
containing organic compounds. In addition, it also contains small amounts of
metals (e.g. Ni, V, Fe) as well as organometallic compounds. (10) The total
number of compounds belonging to these structural classes of hydrocarbons is
vast. It is estimated that the number of chemically distinct constituents in crude
oil lies in the range of 10 000–100 000. (11) Recent development in the area of
ultrahigh resolution FT-ICR mass analysis has indicated that crude oil contains
heteroatom-containing organic compounds (N, O, S) with more than 20 000
distinct elemental compositions (CcHhNnOoSs). (11) The composition of diesel oil
is less complex, although the number of chemically distinct compounds is still
large. (12) The compositional complexity is well represented by the fact that the
identification of different hydrocarbon groups of petroleum products even is
difficult. (13, 14) A database was recently established for supporting the
collection and distribution of the chemical and physical information related to
petroleum products. (15)
Different crude oil sources usually have a unique hydrocarbon composition.
Furthermore, due to differences in refining technologies and refinery operating
conditions, each refining process has a distinct impact on the hydrocarbon
composition of the product. (9, 16) Therefore, each petroleum product has its
unique, product-specific hydrocarbon pattern known as the chemical fingerprint
of the petroleum product. The potential of gas chromatography for producing
information on the product-specific hydrocarbon pattern has for long been
recognized by researchers in the field of petroleum hydrocarbon analysis. (17)
Therefore, research related to the utilization of e.g. pattern recognition procedures
for interpretation of GC data is in focus. (18) The results indicate that combining

17
gas chromatographic information with pattern recognition methods, such as
principal component analysis, cluster analysis, discriminant analysis and genetic
algorithms, simplifies the complex GC data (19–21) and makes it possible to trace
the spill to its source (22), identify fuel types in complex spillage cases, and to
determine the date of contaminant release into the environment. (23, 24)
Selected compound ratios, the type and composition of additives, as well as
legislation relating to e.g. petroleum product quality requirements, can sometimes
be utilized as indicators for differentiating contaminant types, their source and
release time. (21, 23–26) In the case of complex hydrocarbon mixtures and their
prolonged contact with soil, integration of various fingerprinting techniques is,
however, required for the complete characterization of spillage. Although
compositional variability assists in identifying spilled products and potential
sources of contamination, it also makes the selection of calibration standard for
quantitative determination difficult.
1.2 Behaviour and fate of petroleum hydrocarbons within the soil environment
The major part of soil petroleum hydrocarbon contamination is derived from the
spillages related to the use and transportation of petroleum products. (1) Spillages
into the soil environment usually occur through accidental surface spills or as a
result of steady, slow release from leaking pipelines and underground storage
tanks. (1) Due to their toxicity and multiple interactions with the environment,
spilled hydrocarbons pose a threat that affects not only the land, but also the
oceans, lakes, rivers and groundwater.
Following spillage into the soil, petroleum hydrocarbons become distributed
among the gas, liquid and solid phases. (10) Especially the low boiling-point
fraction vaporizes into the pore space in the soil. Part of the spilled petroleum
products may also remain as a liquid in the pore space. The liquid fraction can
then eventually dissolve in the groundwater, or float at the surface of the
groundwater table and subsequently migrate over relatively long distances within
the soil matrix. (10) Hydrocarbons may also become sorbed onto soil particles.
(10) In such cases the migration of contaminants can be effectively retarded by
increasing the organic matter content of the soil. (27) The proportion of
compounds sequestered into organic matter may also increase along with of the
time since contamination occurred. (27) Various mechanisms have been reported

18
for the diffusion and retention of hydrocarbon compounds within the soil matrix.
(28–30)
The complex composition of petroleum products is further complicated by
the fact that, as soon as they are released into the soil environment, the
composition of the spilled product begins to change. The reactions that lead to
compositional changes and to the depletion of certain hydrocarbon compounds
are called collectively weathering. (10, 21, 23) Weathering can be induced by
physicochemical processes such as dissolution, evaporation, photooxidation,
polymerization, and adsorptive interactions between hydrocarbons and the soil.
(10, 21, 31–33) Weathering is also controlled by biological factors, e.g. microbial
species and strains, their activity and adaptability. (10, 34) In actual fact, the
biodegradation of petroleum hydrocarbons by natural populations of
microorganisms is a widely utilized remediation method for depleting
hydrocarbon pollutants in the soil.
The extent and rate of weathering vary for each spill, depending on the
intrinsic composition of the spilled product and environmental factors such as soil
temperature, oxygen content, electron acceptor availability, nutrients, moisture
and acidity. (35, 36) Furthermore, the weathering rate also depends on the type of
petroleum contaminant because the susceptibility of petroleum hydrocarbons to
biodegradation varies. It is known, for instance, that n-alkanes are among the
most biodegradable hydrocarbons and therefore they are easily broken down and
preferentially depleted from soil samples. (23, 24) The degree of branching of
alkanes retards the biodegradation rate. Some compounds, such as the hopanes
and steranes, are exceptionally resistant to biodegradation. (23, 24) Due to the
distinctive order of compositional changes caused by biodegradation, the age of
contamination can be approximated by determining the presence or the absence of
selected compounds (23), and by measuring the ratios of biodegradable to less
biodegradable compounds. (21, 23–25) For example, it has been suggested that
the C17 / pristane ratio can be used to determine the age of diesel oil spills in the
soil with a standard error of two years. This approach and its applicability have,
however, remained rather controversial. (37–41)

19
1.3 Sampling and analysis of petroleum hydrocarbon contaminated soil
1.3.1 Why are petroleum hydrocarbons monitored?
The environmental impacts of petroleum spillages are severe. It is well known
that petroleum products cause extensive damage not only to terrestrial and marine
life but also to natural resources and human health. Certain petroleum residues
may continue to persist indefinitely in the sedimentary record, and certain
compounds formed through weathering processes may even be more toxic than
their precursors. (42–44) In order to monitor and help prevent the severe impacts
of spillages on ecosystem and biodiversity, petroleum hydrocarbons have to be
determined in environmental samples.
Reliable monitoring methods are also required so that effective soil
remediation methods for spillages can be developed, selected and targeted
properly. Reliable analysis results are also required to demonstrate that the quality
of remediated soil is safe for the future purpose of its use. The tightening of
environmental regulations has resulted in a need for characterizing the source and
time of release so that responsibility issues can be reliably decided. Unambiguous
characterization is then of utmost importance because the analysis results may be
used as court admissible evidence for settling legal liability and for supporting
litigation against the party responsible for the spill. Also the verification of the
compliance or non-compliance of oily effluents to regulatory limits requires the
development of reliable measurement methods for petroleum hydrocarbon
determination.
1.3.2 Methods and definitions for petroleum hydrocarbon
determination in soil
At the present time no single analytical method is capable of providing
comprehensive chemical information on petroleum contaminants. Non-specific
methods can be used to produce information e.g. on the type and total amount of
hydrocarbons present in soil, whereas specific methods are required to give
detailed individual component and source-specific information on contaminants.
(21, 24)
Depending mainly on the regulatory framework, a number of techniques have
been used for characterizing petroleum hydrocarbon contamination in soil. (45–

20
61) These techniques include gravimetry, high-performance liquid
chromatography, isotope ratio mass spectrometry, ultraviolet fluorescence
spectroscopy, thin layer chromatography, size-exclusion chromatography,
supercritical fluid chromatography and inductively coupled plasma optical
emission spectroscopy. In addition, a few on-site methods based on infrared
spectroscopy (62, 63), laser-induced fluorescence spectroscopy (64) and
ultraviolet fluorescence spectroscopy (65) are available. Infrared spectroscopy
and gas chromatography with various detection modes (FID, MS) have for long
been used for the determination of petroleum hydrocarbons, although nowadays
GC-FID and GC-MS have mainly replaced the former IR-based method.
Instrumental and method development in the area of gas chromatography have
also provided new possibilities for use in the determination of petroleum
hydrocarbons. (66–70) These methods have been compared and reviewed in
many papers. (71–79)
This wide range of instrumental techniques, as well as the diverging
requirements about which hydrocarbon compounds are to be included in the
analysis, has created a lot of confusion in the interpretation and exploitation of the
results. Additionally, in the case of GC determination, variable carbon ranges
from C10 to C19-C50 have been reported as TPH. (56)
Reliable sampling, pretreatment and analysis of petroleum hydrocarbon
contaminated soil is already a complicated task due to the complex and variable
composition of petroleum products. In addition, soil is a complex matrix whose
interaction with hydrocarbon contaminants presents additional problems for the
extraction and determination stages. Furthermore, as the results obtained in
several national and international interlaboratory studies have shown, many
laboratories have great problems in producing acceptable results in petroleum
hydrocarbon analysis. (56, 57, 80) Therefore, the major sources of uncertainty in
the petroleum hydrocarbon determination chain have to be identified. By locating
the main sources of uncertainty and the factors affecting the measurement
uncertainty, it will become possible to minimize the uncertainty related to
petroleum hydrocarbon determination. This enables the reliability of petroleum
hydrocarbon determination in environmental samples to be improved.
1.3.3 State of the art in petroleum hydrocarbon determination
Due to the compositional complexity of petroleum products, it is impossible to
assess the extent of petroleum hydrocarbon contamination by separately

21
measuring the concentration of each hydrocarbon contaminant. One parameter
that is currently widely used for expressing the total concentration of nonpolar
petroleum hydrocarbons in soil is termed TPH. It is a non-specific, method-
defined parameter which is determined by GC-FID.
According to the recent draft standards ISO/DIS 16703:2004 and CEN prEN
14039:2004:E proposed by ISO and CEN for TPH determination, the soil sample
is extracted with an acetone - n-heptane mixture. (45, 46) Acetone is then
removed from the extract with water. The resulting organic phase is solid phase
extracted by Florisil, and the eluate analyzed by gas chromatography with flame
ionization detection. The total peak area of resolved and unresolved components
in the chromatogram range delimited by the retention times of n-decane and
n-tetracontane is integrated (figure 1). Only semi- and non-volatile hydrocarbons
are therefore included in the TPH parameter. By performing external calibration,
this integrated response is related to the known TPH concentration in the
calibration standards. However, due to the complexity of petroleum hydrocarbon
mixtures, the selection of a calibration standard identical to the spilled
hydrocarbon product is difficult. Suitable oil products for calibration are
described in ISO/DIS 16703:2004 and CEN prEN 14039:2004:E. (45, 46)
Fig. 1. Gas chromatographic determination of the parameter TPH (45, 46) and
approximate description of petroleum hydrocarbon fractions determined by GC-FID.
The integrated total peak area between the retention time window standards n-decane
and n-tetracontane represents the sum of total petroleum hydrocarbons (TPH). Exact
retention time windows for the indicated petroleum hydrocarbon fractions have not
been unambiguously defined.
n-decane
n-tetracontane
0 26.00 Retention time [min]
FID
res
pon
se
Motor oilGasoline Diesel oil
0 26.00 Retention time [min]

22
The advantage of gas chromatographic determination of petroleum hydrocarbons
is that, in addition to the TPH concentration, it can also provide useful qualitative
information about the type of contaminant (figure 1).
The major disadvantage of gas chromatographic determination is, however,
that although ultimate separation temperatures are utilized, the total analysis time
for a sample is too long. In the case of a standard GC system, for instance, the
time required for a single separation may typically be over 20 min. The
temperatures required for the determination also challenge the durability of the
columns and causes column bleed, which deteriorates the analytical precision.
In addition to GC-FID, GC-MS methods have also become valuable tools for
petroleum hydrocarbon analysis. By utilizing gas chromatography-mass
spectrometry (GC-MS) in a selected ion monitoring mode, compound specific
information on e.g. PAH´s, biomarker compounds and other persistent
hydrocarbons that occur at relatively low levels in petroleum products can be
obtained. (24, 81) In some cases, the compound-specific information and unique
compound distribution patterns are decisive for resolving forensic problems.
1.4 Sources of measurement uncertainty in TPH determination in
soil
1.4.1 Primary sampling stage
It has been reported that the primary sampling stage may actually represent the
largest source (50–70%) of measurement uncertainty related to the assessment of
soil contamination. (3–6) This uncertainty primarily arises from the fact that the
location of the individual primary sampling point cannot be properly defined.
When primary sampling is repeated, the location of the true sampling point may
easily vary e.g. from 1 to 5 meters. A part of the primary sampling uncertainty
therefore arises from the inhomogeneous distribution of the analyte in this
imprecisely defined area. (82) The sequestration, leaching and volatility of
hydrocarbon compounds certainly complicate the management of the primary
sampling stage and affect the quality of primary sampling. Volatility also places
considerable strain on the management of the sample storage stage.
In addition to this small-scale variation, sampling uncertainty consists of
factors related to e.g. the sampling strategy, sampler(s), sampling equipment,
sample stability, environmental circumstances and properties of the sampling site.

23
(83) All these factors, too, represent various systematic and random uncertainty
sources that affect the precision and accuracy of the primary sampling stage.
It is a well-known fact that the uncertainties related to the primary sampling
stage cannot be compensated for afterwards by improving the quality of the
analytical method in the laboratory. A composite sampling procedure has been
discussed as one option to reducing inter-sample variance and, consequently, the
variance of the primary sampling stage. However, this approach cannot be utilized
when sampling volatile and semi-volatile petroleum hydrocarbon contaminated
soil.
1.4.2 Sample treatment procedure
Traditional instrumental methods for TPH analysis require samples in liquid form.
Therefore, prior to determination the petroleum contaminants have to be extracted
from the soil matrix into a suitable solvent.
The reliability of the sample treatment procedure for petroleum hydrocarbon
determination has certainly suffered from the slow progress in standardization and
consequent lack of uniform analytical methodology for petroleum hydrocarbon
determination. In addition, the reliability has also suffered from the lack of
certified reference materials for petroleum hydrocarbon determination.
Furthermore, the differing instructions of the authorities have supported the use of
a range of sample treatment procedures for extracting petroleum products and
their compounds from a soil matrix. (50, 56, 57) Therefore, traditional Soxhlet
extraction (84) is now being challenged by modern techniques such as
supercritical fluid extraction (59, 61, 85–87), solid-phase microextraction (63),
pressurized fluid extraction (78) ultrasonic extraction (84, 88) and microwave-
assisted extraction (77, 89–92). Solvent extraction is also challenged by thermal
desorption methods (66, 93). Also microwave-assisted extraction utilizing non-
ionic surfactant solutions instead of traditional organic solvents has been
successfully applied to the extraction of hydrocarbons from soil and sediment
samples (94).
The application of different extraction methods to solid matrices has been
critically reviewed in the scientific literature (95). However, the studies mainly
deal with the extraction of PAHs or selected hydrocarbon compounds. Relatively
little data have been published on the effect of different extraction methods on the
reliability of TPH analytics. A number of interlaboratory comparisons for the
analysis of mineral oil in polluted soil using GC-FID have, however, indicated

24
that variability in the extraction and clean-up stages does have adverse effects on
the quality of the results. (56, 57, 96)
The reasons for the varying extraction recovery are multiple. First of all, the
extraction recovery depends on the selection of a sub-sample for analysis.
However, homogenization of the primary sample before sub-sampling has to be
avoided in order to prevent the loss of hydrocarbons through evaporation. The
consequent inhomogeneous distribution of contaminants certainly complicates the
selection of sub-sample size for analysis and, as a result, increases the analytical
uncertainty. Therefore, a sufficiently large sub-sample size has to be selected for
the analysis. Otherwise the recovery will be adversely affected by the
inhomogeneous distribution of hydrocarbons in the primary sample.
The extraction process itself is complicated due to the diversity of the
chemical and physical properties of petroleum hydrocarbons. The differing
solvent properties, as well as extraction conditions, affect not only the solubility
of hydrocarbons in the solvents but also the solubility of the matrix components.
Thus, many non-petroleum hydrocarbon compounds, such as naturally occurring
terpenes, industrial solvents, chlorinated (PCB’s, organochlorine pesticides) and
oxygen-containing molecules (phthalates, triglycerides, sterols), may also be
simultaneously extracted from the soil matrix.
The sorption of hydrophobic compounds on soil organic matter and mineral
soil, as well as the aging of the contamination, reduces the extractability of certain
hydrocarbon compounds. Weathering processes in different soil matrices change
the overall composition of the spilled hydrocarbon product and alter the
concentrations of the individual hydrocarbon compounds in contaminated soil.
These processes may then further impact the performance of sample extraction
and clean-up stages. It has also been reported that a high moisture content of the
soil may reduce interaction between the nonpolar extraction solvent with the
hydrated soil surfaces, consequently leading to decreased extraction recoveries.
(97) The research carried out on the effect of different solvents on the extraction
recoveries has, however, mainly focused on individual hydrocarbon groups
(PAH’s) or selected hydrocarbon compounds. (98–101) Extraction methods have
also been compared, although the significance of the results remains questionable
due to differences in the subsequent analytical stages utilized. (84, 97, 102, 103)
The extraction of soil samples results in extracts that contain various co-
extracted substances. A clean-up stage utilizing e.g. solid-phase extraction is
usually applied to remove these interfering, co-extracted substances (e.g. fulvic
acids, plant fats, surfactants). A range of methods and sorbents have been used for

25
extract clean-up, but rather conflicting conclusions have been presented
concerning the efficiency and selectivity of these adsorbents. (86, 104, 105)
Ineffective extract clean-up may, however, be problematic because it easily results
in a matrix-induced, chromatographic response effect during GC determination.
Without effective extract clean-up, the quantification of non-petroleum based
compounds subsequently results in false positive values for petroleum
hydrocarbons. (106, 107) The effect of ineffective clean-up becomes even more
pronounced when sampling a site with a variable soil composition.
Uncontrollable matrix effects may occur if clean-up is ineffective. It has also been
reported that photodegradation reactions of some hydrocarbon compounds in
organic solvents during the clean-up stage may also change the composition of
the original contaminant. (105, 108, 109)
The problem, therefore, is that differing sample treatment procedures involve
different kinds of treatment stage, which introduce variable sources of
measurement uncertainty in the result. If this measurement uncertainty is not
stated, then the comparison of results becomes difficult. However, little is known
about which factors or combination of factors in the sample treatment procedure
has the greatest effect on the quality of TPH analyses carried out by individual
laboratories. As the use of conflicting extraction methods challenges the
credibility and comparability of the results, it would therefore be necessary to
study which stages in the determination chain most significantly affect the
reliability of TPH results.
1.4.3 Gas chromatographic determination
Gas chromatography with flame ionization detection (GC-FID) is nowadays the
most common analytical technique for TPH determination. However, the slow
standardization, lack of certified reference materials and differing environmental
regulations have resulted in the use of a wide range of GC operating settings for
TPH determination. (56, 57, 109–112) Even the latest draft standards still lack a
detailed description of the gas chromatographic settings for measuring total
petroleum hydrocarbons. (45, 46) Only recommendations are given, and they
often seem to be overlooked by laboratories. Instead, the laboratories use
proprietary GC settings for TPH determination.
Because TPH parameter is method-dependent, the adaptation of GC settings
may easily lead to serious interferences which affect the total peak area between
the retention times of n-decane and n-tetracontane. As a result, both the accuracy

26
and precision of the analysis results and the profiles of the chromatograms may
become affected.
In fact, the evaluation of interlaboratory comparison and method validation
data has indicated that a major part of the problems in gas chromatographic
determination usually originate in the calibration and performance of the GC
instrument. (57, 113) The effect of different GC settings on the performance of
TPH determination has, however, not yet been thoroughly assessed.
Typical problems that occur in gas chromatographic analysis are interferences
due to e.g. mass discrimination and matrix-induced chromatographic response
enhancement. (114) The matrix effect in GC determination originates from the
irreversible adsorption of certain sample components on the active sites (free
silanol groups, metals) that are potentially present even in high quality
deactivated glass injection liners. Residues of non-volatile compounds originating
from previous analyses may also act as active sites in the injection liner. When a
matrix-free standard solution is injected into a GC system, active sites are
available for analyte absorption. This results in a reduced transfer of analytes into
the chromatographic column due to their retention in the injector. The blocking of
active sites on the liner by co-extracted matrix components will, however,
improve the transfer of analytes from the injection port to the column. Therefore,
compared to the response of analytes in a matrix-free solvent, there will be
enhanced chromatographic response of analytes in the presence of matrix
components. (115–118) Because the interference is not only sample- and matrix-
dependent, but also partly instrument-dependent, it may cause problems in TPH
determination.
Despite the fact that alternative injection systems are available, the splitless
injection mode is frequently utilized for TPH determination. (114, 119) This
means that there is a strong possibility that interferences caused by mass
discrimination occur. Mass discrimination is promoted by thermal degradation of
the analytes at the hot surfaces of the injection liner. This happens especially
when there is insufficient masking of active sites in the injection liner by matrix
components. Compound degradation during splitless injection subsequently leads
to the situation where the hydrocarbon composition of the vaporized sample
injected on the GC column does not represent the true hydrocarbon composition
of the original sample. Numerous examples of mass discrimination based
quantitation problems in e.g. pesticide analytics as well as in petroleum
hydrocarbon analytics have been reported. (68, 120) These examples indicate
27
that, especially in the case of splitless injection, prevention of the thermal
degradation of analytes and consequent mass discrimination becomes necessary.
Mass discrimination interference can be reduced by utilizing optional
injectors or by optimizing the GC operating settings for the determination.
(119, 120) Optimum operating conditions for separation and detection have been
considered for other analytes. (121) However, relatively little data on mass
discrimination in TPH analytics have been published in the scientific literature
and, consequently, the significance of GC operating settings is not known.
The occurrence and intensity of matrix interferences in gas chromatographic
analysis are often reduced by enhancing the selectivity of the extraction or
purification of the extract. (122) Selected analyte protectants, which possess
multiple polar groups to support interaction with the active sites in the injection
liner, have also been used to counteract the matrix-induced effect. (123, 124) In
addition, matrix-matched calibration has also been found to be an effective way
of avoiding errors in the quantification of selected analytes. (122) However, due
to the complexity of petroleum hydrocarbons as well as to the variability of the
soil matrix, further improvement of e.g. extraction and clean-up stages is hardly
possible. The development of effective analyte protectant(s) for use in TPH
analytics may also be difficult because the volatility of the analyte protectant(s)
should be similar to that of the analytes, which in this case cover a wide volatility
range. The polar nature of protectant(s) may also limit their solubility in the
relatively non-polar solvents used for TPH determination. Therefore, the only
realistic alternative is the utilization of matrix-matched calibration standards.
The potential GC interference effects and their correction and consequent
effect on the measurement uncertainty have been critically reviewed by
Thompson and Ellison. (125) However, little is known about which factors or
combination of factors in TPH determination by GC-FID has the greatest effect
on the quality of TPH analyses produced by individual laboratories. Therefore,
improvement of the accuracy and precision of the gas chromatographic
determination of petroleum hydrocarbons requires the identification of the major
uncertainty sources in the determination.
1.5 Assessment of measurement uncertainty for environmental
analysis
According to the internationally accepted approach, the reliability of a
measurement can be expressed by stating the expanded uncertainty of the

28
measurement result. This uncertainty then characterizes the range within which
the true value lies with a specified probability. (126)
Over the past few years substantial efforts have been made to improve the
methodology for estimating analytical uncertainty. The concepts and practices of
analytical uncertainty assessment have been well documented, and they are
recognized by analytical chemists. (127) EURACHEM/CITAC has published
documents showing how the concepts of the ISO Guide (126) should be applied
in chemical measurements, and how the procedures needed for the uncertainty
estimation process should be integrated with existing quality assurance measures
in analytical chemistry. (128–130) For the end-user of the environmental data,
however, the measurand of interest is the concentration of the analyte in the
primary sampling target. Thus, the individual uncertainty sources related to
primary sampling have to be considered because they may strongly influence the
analytical results. (83, 131, 132)
Although the contribution of primary sampling to the measurement
uncertainty is required in order to completely understand the reliability of
analytical results, the assessment of uncertainty associated with primary sampling
has long lacked specific guidance. (132) In actual fact, it has only recently been
treated by EURACHEM/CITAC. (133) Approaches have been presented in the
literature for estimating the uncertainties introduced by the analytical and primary
sampling stages. (83, 131, 134–137) It has been shown that the primary sampling
uncertainty can be estimated by determining separately all the sources of
uncertainty related to the primary sampling process. (83, 138) However, the
uncertainty estimation based on this type B approach is often far too complicated
and laborious for routine analyses, mainly because of the difficulty in quantifying
each uncertainty component independently.
When a specific sampling design is used the measurement uncertainty can be
calculated as a combination of the linear models for sampling and analysis. (139–
141) In the case of nested sampling designs, statistical methods can also be used
to split the total variance of the results into spatial, sampling and analytical
components. (5, 142–144) However, owing to the specific characteristics
(distribution, constancy of the measurement variance) of the measurement data,
the assumptions of statistical methods required for the type A approach tend to
present problems. The violations of these assumptions can affect the power and
significance level of the test and consequently reduce the reliability of uncertainty
estimate. Robust statistics and mathematical transformation of raw data can be
used to reduce the problems with the assumptions of normality and

29
homoscedasticity. (131, 145, 146) However, their utilization requires detailed
knowledge of statistical procedures. The mathematical modification of data also
cause problems in the interpretation of the results and, consequently, the results
may differ from the general guidelines given by EURACHEM/CITAC for
reporting the expanded uncertainty of a chemical measurement. (145, III) In
addition, the disadvantage of these uncertainty estimation methods is that they
exclude the sampling bias from the measurement uncertainty.
In order to obtain reliable measurement uncertainty estimates for analysis,
careful sampling strategy planning, as well as selection of the method for
estimating the required components of sampling and analytical uncertainties, is
required. However, although a predetermined sampling strategy could be helpful
in assessing sampling uncertainty, its application to different contaminated sites
may fail. In these cases the determination of sampling uncertainty should be
driven by the characteristics of the data obtained from the contaminated site.
Otherwise the expanded uncertainty becomes uncertain itself, and no benefit is
gained that supports the end-use of the data. As far as primary sampling
uncertainty is concerned, it should also be noted that there are large differences in
European soil sampling guidelines. (147) Sampling uncertainty is also strongly
affected by the environmental conditions in the soil ecosystem, and by the
contaminant and its concentration distribution across the sampling target. (83)
Therefore the results obtained for sampling uncertainty should be generalized
only with great care.
1.6 Significance of measurement uncertainty in environmental
analysis
The result of a chemical analysis is always an estimate of the exact
concentration/content of the analyte in the sample/sampling target. Therefore the
measurement uncertainty related to the analysis result needs to be stated so that
the end-user of the chemical data can estimate the reliability of the chemical data.
The end-user of the data can, for example, compare whether the result differs
either from the limiting value of this characteristic quantity or from the previous
measurement result. (148)
The use of measurement uncertainty in the interpretation of environmental
monitoring results could reduce the risk of misinterpretations and, consequently,
reduce the chance of underestimating the risks to human health or the
environment. The concept of measurement uncertainty has also been found to

30
have significant implications for environmental risk assessment, for the
identification of causes of measurement uncertainty, and for the remediation costs
of contaminated areas. It has been shown that the concept of measurement
uncertainty can be utilized to estimate performance for contaminated soil
remediation. (149)
The significance of measurement uncertainty has also recently been
recognized by the environmental authorities and, as a result, the estimation of
measurement uncertainty has been accepted as an essential objective in the
development of the environmental monitoring of harmful substances. (150)

31
2 Aims of the research
The main objective of this research was to assess the significance of different
stages of the analysis chain on the uncertainty in the determination of
environmentally interesting concentrations of TPH in soil. By identifying the
main uncertainty sources and related factors inducing this uncertainty, it will be
possible to minimize the uncertainty related to TPH determination. This will
result in the generation of more reliable information about petroleum hydrocarbon
contamination and the consequent fate and effects of petroleum hydrocarbons in
the environment. The most important aims of this study were:
1. To compare the suitability of three different extraction methods for the
determination of total petroleum hydrocarbons by GC-FID. Both qualitative
and quantitative aspects were discussed. (I)
2. To investigate the presence of a matrix effect, and to evaluate the potential
quantitative errors resulting from the matrix effect in the gas chromatographic
analysis of petroleum hydrocarbon contaminated soil samples. (II)
3. To estimate the measurement uncertainty for the determination of total
petroleum hydrocarbons in soil by GC-FID and to compare the relative
contributions of sampling and analysis to measurement uncertainty. (III)
4. To study in more detail the ruggedness of the draft standard procedure CEN
prEN 14039:2004:E for extracting total petroleum hydrocarbons in soil. (IV)
5. To investigate in more detail the ruggedness of the gas chromatographic
method for the determination of total petroleum hydrocarbons. (V)

32
33
3 Experimental
3.1 Sample types, sampling and pre-treatment
Soil samples from three different petroleum hydrocarbon contaminated and
uncontaminated areas were used in the investigations. In the comparative
extraction studies (I, IV), as well as in the matrix effect investigations (II), spiked
soil samples were used. Soil #1, which was used for spiking, was collected at a
soil extraction area in North Ostrobothnia. The other soil type (soil #2), which
was used for assessing the matrix effect (II), had a higher organic matter content
and was collected at a peat extraction area in South Ostrobothnia. The soil
samples (soil #3) used for assessing the measurement uncertainty in the
determination of total petroleum hydrocarbons in soil by GC-FID (III) were
collected from an area in South Ostrobothnia that had earlier been used for the
retail sale of petroleum products. The soil was contaminated with petroleum
hydrocarbon products over a period of at least twenty years. Sampling at this site
was carried out below the asphalt cover that restricted the penetration and
percolation of rain water into the contaminated soil. Sampling at the contaminated
site was carried out in accordance with the national guidelines for the sampling of
organic contaminants. (151)
Two types of soil sample were used in evaluating the ruggedness of the draft
standard procedure for extracting total petroleum hydrocarbons in soil (IV). One
of the samples was soil #2, described in the above. (II) The other type of soil (soil
#4), which had a lower organic matter content, was sampled at the
Sammallahdenmäki bronze age burial site, western Finland. Sampling at this site
was carried out by the personnel of the National Board of Antiquities of Finland.
Before the spiking procedure, soil samples #1, #2 and #4, were air dried for
24 hours and sieved. The < 2 mm particle size fraction was used in all the
experiments. The spiking solution was prepared by mixing equal amounts (by
mass) of additive-free diesel oil (Neste Oil Oyj) and additive-free lubricating oil
(Neste Oil Oyj) in acetone. No sample pretreatment was performed on the
contaminated soil samples (#3) (III) in order to prevent the loss of hydrocarbons.
Detailed information about the sampling sites and sample treatment, as well as the
spiking procedures, are given in the original papers. (I, II, III, IV)
34
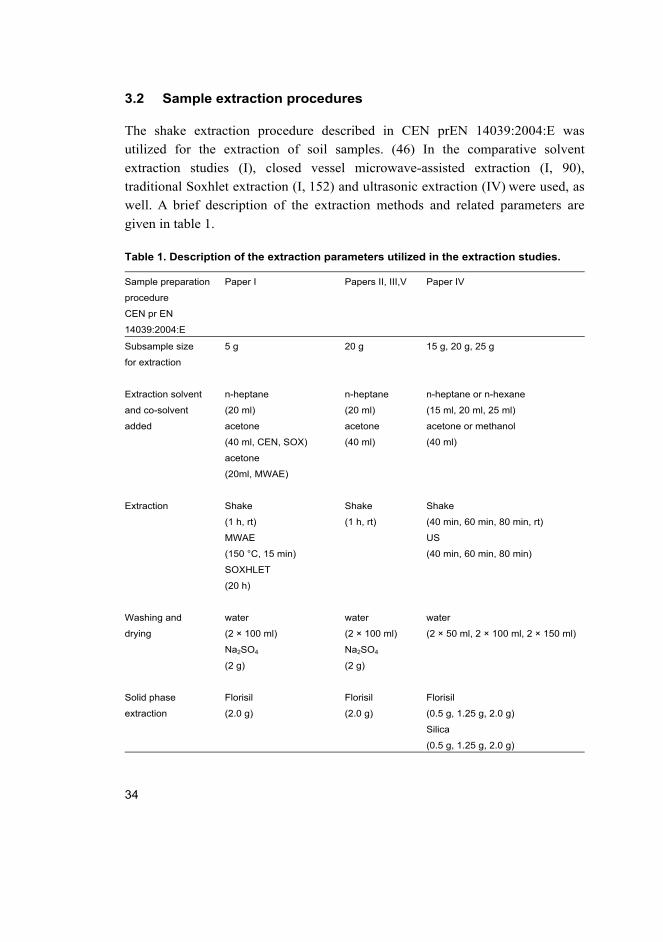
3.2 Sample extraction procedures
The shake extraction procedure described in CEN prEN 14039:2004:E was
utilized for the extraction of soil samples. (46) In the comparative solvent
extraction studies (I), closed vessel microwave-assisted extraction (I, 90),
traditional Soxhlet extraction (I, 152) and ultrasonic extraction (IV) were used, as
well. A brief description of the extraction methods and related parameters are
given in table 1.
Table 1. Description of the extraction parameters utilized in the extraction studies.
Sample preparation
procedure
CEN pr EN
14039:2004:E
Paper I Papers II, III,V Paper IV
Subsample size
for extraction
5 g 20 g 15 g, 20 g, 25 g
Extraction solvent
and co-solvent
added
n-heptane
(20 ml)
n-heptane
(20 ml)
n-heptane or n-hexane
(15 ml, 20 ml, 25 ml)
acetone
(40 ml, CEN, SOX)
acetone
(40 ml)
acetone or methanol
(40 ml)
acetone
(20ml, MWAE)
Extraction Shake
(1 h, rt)
Shake
(1 h, rt)
Shake
(40 min, 60 min, 80 min, rt)
MWAE
(150 °C, 15 min)
US
(40 min, 60 min, 80 min)
SOXHLET
(20 h)
Washing and
drying
water
(2 × 100 ml)
water
(2 × 100 ml)
water
(2 × 50 ml, 2 × 100 ml, 2 × 150 ml)
Na2SO4
(2 g)
Na2SO4
(2 g)
Solid phase
extraction
Florisil
(2.0 g)
Florisil
(2.0 g)
Florisil
(0.5 g, 1.25 g, 2.0 g)
Silica
(0.5 g, 1.25 g, 2.0 g)

35
Following the procedure of CEN prEN 14039:2004:E, the sample was shaken by
hand with 40 ml of acetone. After the addition of 20 ml of n-heptane containing
30 mg/l of n-decane and n-tetracontane, the mixture was extracted by mechanical
shaking for 1 h at room temperature. Soxhlet extraction was performed according
to USEPA 3540C. (109) Samples were extracted with the solvent mixture for 20
hours at 4–6 cycles per hour. Microwave-assisted extraction was carried out
according to the method presented by CEM Corp. (90). The sample was weighed
into the microwave extraction vessel, the solvent mixture added, and the vessels
then closed. Twelve samples were extracted at the same time in the temperature
controlled microwave system at 150 °C for 15 min. For ultrasonic extraction the
shake extraction stage described in CEN prEN 14039:2004:E was replaced by
ultrasonic extraction. The soil samples were always extracted in random order.
After the extraction stage, acetone was removed by washing the organic
phase with water. The organic layer was dried with Na2SO4 and the solid phase
extracted with Florisil or silica. The eluate was analyzed by GC-FID. More
detailed information on the extraction procedures is given in the original papers.
(I,IV)
3.3 Analytical equipment
The determination of TPH in the extracts was carried out by gas chromatography-
flame ionization detection. The determinations were carried out using an HP
Agilent 6890 gas chromatograph equipped with a FID detector, an Agilent 7673
autosampler and a low-bleed Supelco Equity™-5 capillary column (15m × 0.25
mm i.d.) with a nominal film thickness of 0.25 μm. Splitless injection method was
utilized with a deactivated, splitless inlet liner with adsorbent material and taper
(I-IV). In addition, deactivated, a single-taper splitless inlet liner without glass
wool was used when the ruggedness of the gas chromatographic method was
studied. (V) Detailed information on the instrumental settings utilized in studies
I–V is presented in table 2. The method used in studies I–IV gave a complete
chromatographic run within 27 min.
36
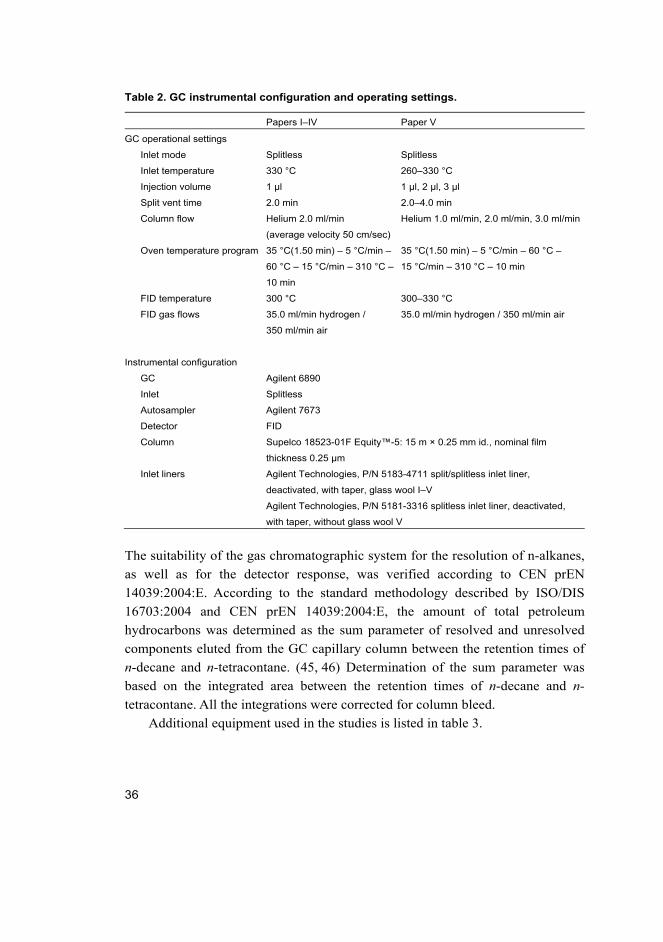
Table 2. GC instrumental configuration and operating settings.
Papers I–IV Paper V
GC operational settings
Inlet mode Splitless Splitless
Inlet temperature 330 °C 260–330 °C
Injection volume 1 μl 1 μl, 2 μl, 3 μl
Split vent time 2.0 min 2.0–4.0 min
Column flow Helium 2.0 ml/min
(average velocity 50 cm/sec)
Helium 1.0 ml/min, 2.0 ml/min, 3.0 ml/min
Oven temperature program 35 °C(1.50 min) – 5 °C/min –
60 °C – 15 °C/min – 310 °C –
10 min
35 °C(1.50 min) – 5 °C/min – 60 °C –
15 °C/min – 310 °C – 10 min
FID temperature 300 °C 300–330 °C
FID gas flows 35.0 ml/min hydrogen /
350 ml/min air
35.0 ml/min hydrogen / 350 ml/min air
Instrumental configuration
GC Agilent 6890
Inlet Splitless
Autosampler Agilent 7673
Detector FID
Column Supelco 18523-01F Equity™-5: 15 m × 0.25 mm id., nominal film
thickness 0.25 μm
Inlet liners Agilent Technologies, P/N 5183-4711 split/splitless inlet liner,
deactivated, with taper, glass wool I–V
Agilent Technologies, P/N 5181-3316 splitless inlet liner, deactivated,
with taper, without glass wool V
The suitability of the gas chromatographic system for the resolution of n-alkanes,
as well as for the detector response, was verified according to CEN prEN
14039:2004:E. According to the standard methodology described by ISO/DIS
16703:2004 and CEN prEN 14039:2004:E, the amount of total petroleum
hydrocarbons was determined as the sum parameter of resolved and unresolved
components eluted from the GC capillary column between the retention times of
n-decane and n-tetracontane. (45, 46) Determination of the sum parameter was
based on the integrated area between the retention times of n-decane and n-tetracontane. All the integrations were corrected for column bleed.
Additional equipment used in the studies is listed in table 3.

37
Table 3. Additional equipment used in the studies.
Microwave oven for extraction
Vessels for MW extraction
Ultrasonic bath
CEM Mars 5X (CEM Corp.)
CEM Plus™ Vessels (XP-1500 Plus)
Bandelin, Sonorex Super RK 103H
Shaking device for CEN extraction Griffin flask shaker
CHNS-analysis Perkin-Elmer 2400 series II CHNS/O analyzer
3.4 Calibration and quality control
For TPH quantitation, a petroleum hydrocarbon standard solution (20 mg/ml) was
prepared by mixing equal amounts (by mass) of additive-free diesel oil (DIKC,
Neste Oil Oyj, Finland) and lubricating oil (CORE, Neste Oil Oyj, Finland) in n-
heptane (J.T.Baker, HPLC-grade). Selected volumes of this solution were further
diluted with n-heptane to give a series of working standards with TPH
concentrations of 1.0, 2.0, 5.0, 10.0 and 15.0 mg/ml. Certified reference material
ERM-CC015a was used to estimate the accuracy of the analytical procedure.
Certified reference material ERM-CC015a is a sediment sample which has been
contaminated over decades by industrial and sewage sludge. The certified TPH
concentration in this reference material was 1820 ± 130 mg/kg. The presence of
analytical bias was evaluated by comparing the mean value obtained for
analytical replicates against the certified value.
3.5 Experimental design and statistical analysis
In the comparative study on the solvent extraction of TPH in soil, homogeneity of
the variances was tested using the Bartlett’s test (I), and the statistical significance
of the extraction method on the recovery results was tested with a single-factor
analysis of variance (ANOVA) (I). In the matrix effect study (II), comparison of
the slopes of the regression lines was performed by means of a t-test. The equality
of residual variances was tested using the F-test. The statistical significance of the
analytical bias (III, IV) was tested using the two-way Student’s t-test. The
equality of variances was tested using the F-test and the uncertainty of the
difference between the certified value and the analysis result was calculated by
using a pooled estimate of the standard deviation. In the assessment of
measurement uncertainty for TPH determination (III), the total variance of the
experimental results was broken down into geochemical, sampling and analytical
variation using classical ANOVA (type I SS). The normality of the experimental

38
data (III,IV) was evaluated using the Kolmogorov-Smirnov test of normality. The
measurement uncertainty for TPH determination was also assessed using the
linear precision modelling method presented by Lee and Ramsay. (141) SPSS
14.0 for Windows was used for the statistical evaluation of the experimental data,
and MODDE 7.0 software was used for the experimental design. (IV,V) The
effects of 11 factors on the extraction recovery of TPHs in soil samples were
investigated using a two-level Plackett-Burman design. A D-optimal design was
elaborated to investigate in more detail the ruggedness of the gas
chromatographic method for TPH determination. (V, 153) Because the
optimization of the GC operating conditions resulted in a multiple response
problem, a desirability function was constructed. (154)

39
4 Results and discussion
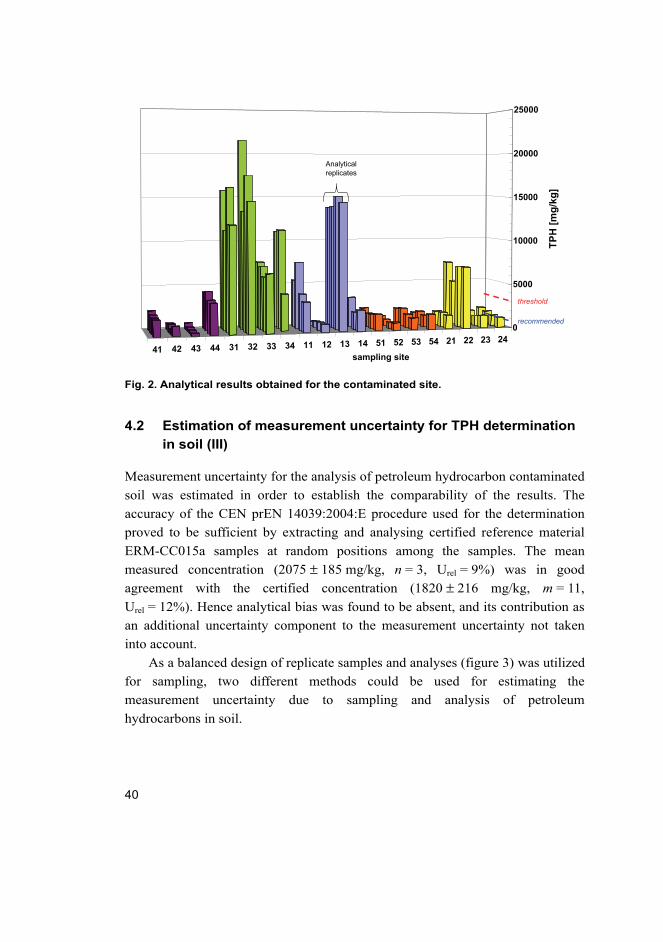
4.1 TPH concentrations in the contaminated site
The TPH concentrations were compared against both the recommended
maximum value (900 mg/kg, representing fractions C10–C21 + C21–C40 in total)
and the threshold value (3000 mg/kg, representing fractions C10–C21 + C21–C40
in total) for mineral oil in soil in Finland. The results indicated that the TPH
concentrations in most cases exceeded the recommended maximum value for
mineral oil in soil (Figure 2). Some sampling areas appeared to be highly
contaminated because the TPH concentrations exceeded the threshold value for
mineral oil in soil. This indicates a potential environmental and health risk, and
the possible need to reduce the risk by decreasing the TPH concentration in the
site. However, the above-mentioned SAMASE values are currently being
replaced due to a decision by the Finnish Council of State in 2007. The current
values are given in table 4.
Table 4. Threshold and guideline values in Finland based on the decision of the
Council of State in 2007.
Mineral oil carbon range Threshold value
mg/kg
Lower guideline value
mg/kg
Higher guideline value
mg/kg
C10–C21
C21–C40
C10–C40
300
300
600
1000
2000
40
Fig. 2. Analytical results obtained for the contaminated site.
4.2 Estimation of measurement uncertainty for TPH determination in soil (III)
Measurement uncertainty for the analysis of petroleum hydrocarbon contaminated
soil was estimated in order to establish the comparability of the results. The
accuracy of the CEN prEN 14039:2004:E procedure used for the determination
proved to be sufficient by extracting and analysing certified reference material
ERM-CC015a samples at random positions among the samples. The mean
measured concentration (2075 ± 185 mg/kg, n = 3, Urel = 9%) was in good
agreement with the certified concentration (1820 ± 216 mg/kg, m = 11,
Urel = 12%). Hence analytical bias was found to be absent, and its contribution as
an additional uncertainty component to the measurement uncertainty not taken
into account.
As a balanced design of replicate samples and analyses (figure 3) was utilized
for sampling, two different methods could be used for estimating the
measurement uncertainty due to sampling and analysis of petroleum
hydrocarbons in soil.
2423222154535251141312113433323144434241
0
5000
10000
15000
20000
25000
TP
H [
mg
/kg
]
sampling site
Analytical replicates
recommended
threshold
41
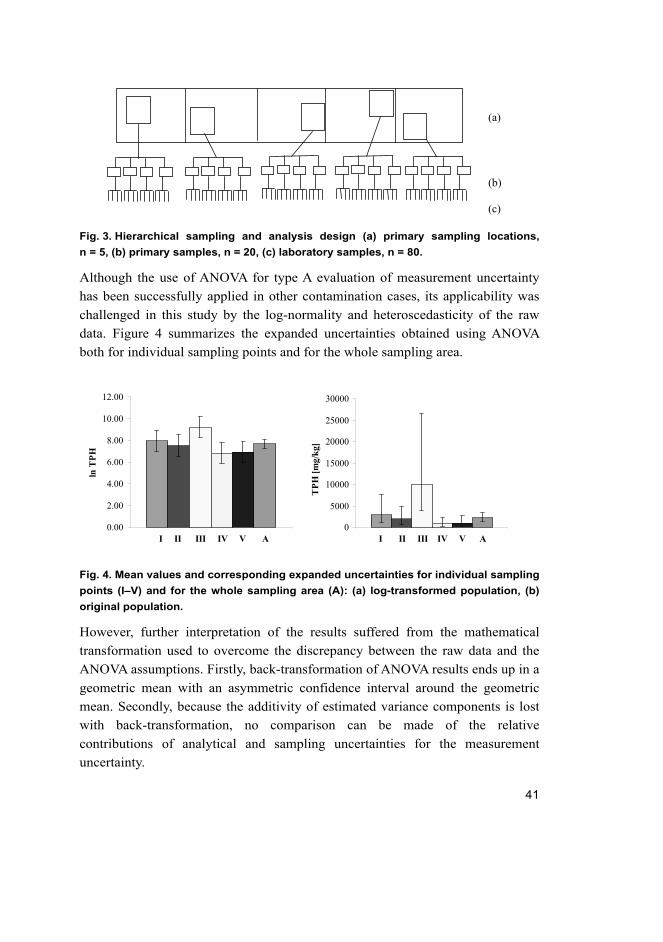
Fig. 3. Hierarchical sampling and analysis design (a) primary sampling locations,
n = 5, (b) primary samples, n = 20, (c) laboratory samples, n = 80.
Although the use of ANOVA for type A evaluation of measurement uncertainty
has been successfully applied in other contamination cases, its applicability was
challenged in this study by the log-normality and heteroscedasticity of the raw
data. Figure 4 summarizes the expanded uncertainties obtained using ANOVA
both for individual sampling points and for the whole sampling area.
Fig. 4. Mean values and corresponding expanded uncertainties for individual sampling
points (I–V) and for the whole sampling area (A): (a) log-transformed population, (b)
original population.
However, further interpretation of the results suffered from the mathematical
transformation used to overcome the discrepancy between the raw data and the
ANOVA assumptions. Firstly, back-transformation of ANOVA results ends up in a
geometric mean with an asymmetric confidence interval around the geometric
mean. Secondly, because the additivity of estimated variance components is lost
with back-transformation, no comparison can be made of the relative
contributions of analytical and sampling uncertainties for the measurement
uncertainty.
(a) (b) (c)
0
5000
10000
15000
20000
25000
30000
1
TP
H [
mg/
kg]
I II III IV V A0.00
2.00
4.00
6.00
8.00
10.00
12.00
1
ln T
PH
I II III IV V A

42
The measurement uncertainty was also estimated from the calculated linear
precision equations for sampling and analysis. Linear precision modelling showed
a statistically significant precision change for sampling and analysis along with
increasing TPH concentration. Consequently, the measurement uncertainty was
calculated as a combination of the analytical and sampling precision equations.
Figure 5 summarizes the expanded uncertainty values obtained with linear
measurement precision modelling and classical ANOVA.
Fig. 5. Comparison of the expanded uncertainties at the geometric means of individual
sampling points (I–V) and at the geometric mean of the whole sampling area (A).
Comparison of the uncertainty values to those obtained with ANOVA revealed
that ANOVA overestimated the expanded uncertainty at both low and high TPH
concentrations. This discrepancy may be due to fact that ANOVA assumes a
constant value for measurement precision, which was not valid in this study.
According to the linear precision modelling, the relative expanded
uncertainty for TPH determination was moderate, ranging from 21% at a TPH
concentration of 895 mg/kg to 9% at a concentration of 10 019 mg/kg. However,
when the relative contributions of the sampling and analytical uncertainty
components were compared, it was found that the main part of the measurement
uncertainty originated from the analytical uncertainty. Within the concentration
range studied here, the analytical uncertainty comprised as much as 68% - 80% of
the measurement uncertainty (Figure 6). The result indicated that, if the
0
5000
10000
15000
20000
25000
30000
1
TP
H [
mg/
kg]
I II III IV V A
unweighted lin. regr.
weighted lin. regr.
ANOVA

43
measurement uncertainty is to be improved, then the variance of analytical stage
has be reduced.
Fig. 6. Relative size of the uncertainties in the analytical and sampling stages.
One potential reason for the unexpectedly large proportion of analytical
uncertainty may be the fact that the inhomogeneous distribution of contaminants
increases the variance of subsampling for analysis. When an extensive area is
sampled, the change in matrix may also reduce the repeatability and accuracy of
the extraction, clean-up and GC determination stages. Furthermore, the petroleum
hydrocarbon composition of the calibration standard may be clearly distinct from
that of the petroleum product extracted from the sample. The last one point is,
however, always a problem especially with older contamination sites with highly
degraded and variable hydrocarbon products. The significance of uncertainty
sources related to these stages were investigated in this study. The influence of
sample matrix on the uncertainty of TPH determination was also evaluated.
4.3 Factors affecting the analytical uncertainty
4.3.1 The effect of extraction method (I)
Measurement uncertainty for TPH determination was found to be dominated by
analytical uncertainty. Consequently, the uncertainty of the analytical stage should
be the main reduction target in order to minimize measurement uncertainty.
0 %20 %40 %60 %80 %
100 %
0
20
0
40
0
60
0
80
0
10
00
30
00
50
00
70
00
90
00
12
00
0
16
00
0
TPH [mg/kg]
% o
f th
e m
ea
su
rem
en
t u
nc
ert
ain
ty
analytical sampling

44
Because the analytical uncertainty is undoubtedly affected by both the accuracy
and precision of the extraction stage, the performance characteristics of the CEN
prEN 14039:2004:E draft standard method were compared to those obtained with
Soxhlet extraction and microwave-assisted extraction.
The efficiencies of the three extraction methods were studied by analysing
samples prepared by adding known amounts of petroleum hydrocarbons to the
soil matrix. In addition, the petroleum hydrocarbon mixture used for soil spiking
was also extracted.
The TPH recoveries obtained for the petroleum hydrocarbon mixture were
acceptable (Table 5). The best recovery and repeatability values (99% ± 3%) were
obtained with microwave-assisted extraction, which indicated that petroleum
hydrocarbons can be completely recovered by this method. However, there was a
statistically significant difference between the extraction performances of the
different methods. The recoveries obtained with CEN prEN 14039:2004:E and
Soxhlet extraction were significantly lower than the recovery obtained with
microwave-assisted extraction. The result indicated that the sophisticated
microwave-assisted extraction system gives a higher recovery with good
precision within a shorter time scale than conventional extraction methods. One
reason for the good recovery may be that the closed vessel system prevents the
loss of volatile hydrocarbon compounds during extraction.
Table 5. Recoveries obtained for a standard oil mixture (std oil) with different
extraction methods. Sample treatment, excluding extraction, was performed
according to CEN prEN 14039:2004:E.
Sample Extraction method Target value
(mg/l)
Obtained results; n = 3
Average s
(mg/l) ± (mg/l)
rsd
(%)
Recovery s
(%) ± (%)
rsd
(%)
Std oil CEN shake 1870 1500 ± 161 11 80 ± 9 11
Soxhlet 1730 1250 ± 65 5 72 ± 4 5
MW-assisted 1930 1920 ± 57 3 99 ± 3 3
The results obtained for spiked soil samples were found to be different. The
average TPH recoveries obtained with microwave-assisted and Soxhlet
extractions were relatively good, whereas the efficiency of the CEN prEN
14039:2004:E shake extraction was poorer (Table 6). On the other hand, the
precision of the CEN prEN 14039:2004:E method (6%) was the best of the three
methods. In the case of the soil samples, however, there were no significant

45
differences between the TPH recoveries obtained with the individual extraction
methods. Further analysis of the recovery results indicated that the differences
between the methods were actually obscured by the variation attributable to the
heterogeneous distribution of the analytes in the spiked soil sample.
When the overall profiles of the gas chromatograms, as well as the individual
peak heights and peak areas of certain hydrocarbon compounds were compared, a
distinct difference between the extraction methods was found. The
chromatograms presented in figure 7 indicated that the overall GC profile
obtained from non-spiked soil using the microwave-assisted extraction method
clearly differs from that obtained using the CEN-shake extraction method.
Table 6. The results obtained for spiked soil samples and for non-spiked soil samples
with different extraction methods. Sample treatment, excluding extraction, was done
according to CEN prEN 14039:2004:E.
Sample Extraction method Target value
(mg/g)
Obtained results; n = 3
Average s
(mg/g) ± (mg/g)
rsd
(%)
Recovery*
s (%) ± (%)
rsd
(%)
Spiked
soil
CEN shake
Soxhlet
MW-assisted
6.75
6.75
6.75
6.4 ±
7.4 ±
7.9 ±
0.3
1.3
3.0
6
20
44
78 ± 4
102 ± 20
103 ± 45
6
20
44
Non-
spiked
soil
CEN shake
Soxhlet
MW-assisted
–
–
–
1.1 ±
0.6 ±
1.0 ±
0.6
0.1
0.2
58
24
22
–
–
–
–
–
– *The blank value was subtracted

46
Fig. 7. GC chromatograms obtained for non-spiked soil with the different extraction
procedures. The chromatograms are at the same scale. a = microwave-assisted
extraction, b = Soxhlet-extraction, c = CEN prEN 14039:2004:E shake extraction.
The same was the case with Soxhlet –extraction, although the difference was not
so evident. Of course the variation in the profile of the GC trace in the
chromatogram may be caused either by the heterogeneous distribution of the
contaminants in the soil samples or by diverging TPH concentrations in the
sample. However, the same trend was observed in the chromatogram profiles for
standard oil mixtures and for the spiked soil samples, as well (figure 8).
4.00 6.00 8.00 10.00 12.00 14.00 16.00 18.00 20.00 22.00 24.00 26.00 28.00
200000
400000
600000
800000
1000000
1200000
1400000
1600000
1800000
2000000
2200000
e
21.80
4.00 6.00 8.00 10.0012.0014.0016.0018.0020.0022.0024.0026.0028.003
200000
400000
600000
800000
1000000
1200000
1400000
1600000
1800000
2000000
2200000
e
21.81
4.00 6.00 8.00 10.00 12.00 14.00 16.00 18.00 20.00 22.00 24.00 26.00 28.00
200000
400000
600000
800000
1000000
1200000
1400000
1600000
1800000
2000000
2200000
e
21.59
Retention time [min]
FID response a)
b)
c)

47
Because the composition of the standard oil mixtures was considered to be
very homogeneous, it was assumed that the differences in the overall profile of
the gas chromatogram resulted from the difference between the extraction
methods. The clearest differences in the GC traces appeared to be in the peak
height of the middle-distillate region compounds. This distinctive variation,
caused by the extraction method, demonstrated that care should be taken when
using chromatograms obtained after the application of different extraction
methods on petroleum contaminated samples in fingerprinting or age-dating
studies. Otherwise misleading conclusions concerning the age of the spillage
could be drawn.
Fig. 8. GC chromatograms obtained for standard oil mixtures (left column) and for
spiked soil samples (right column) with the different extraction procedures. The
chromatograms are at the same scale. a = microwave-assisted extraction, b = Soxhlet-
extraction, c = CEN prEN 14039:2004:E shake-extraction.
8.00 12.00 16.00 20.00 24.00 28.00
c)
2400000
8.00 12.00 16.00 20.00 24.00 28.00
b)
2400000
8.00 12.00 16.00 20.00 24.00 28.00
a)
2400000
Retention time [min]
FID response
Retention time [min]
Retention time [min]
FID response
FID response
8.00 12.00 16.00 20.00 24.00 28.00
a)
2400000
b)
8.00 12.00 16.00 20.00 24.00 28.00
2400000
c)
2400000
8.00 12.00 16.00 20.00 24.00 28.00
FID response
Retention time [min]
Retention time [min]
FID response
Retention time [min]
FID response

48
4.3.2 Matrix effects in GC determination (II)
The effect of a matrix-induced chromatographic response appears to be a
commonly encountered problem in gas chromatographic analysis. Because its
occurrence is not only dependent on the sample matrix, but also partly on the
instrument used, it may also reduce the accuracy and precision of the gas
chromatographic determination of TPH in soil samples. (115) In this study, the
presence of a matrix effect and its consequent effect on quantitative determination
of TPH by GC-FID was investigated. Two types of soil with three different TPH
levels were selected for the evaluation. The occurrence of the relative systematic
error resulting from the matrix effect was investigated by comparing the slopes of
the matrix-matched calibration lines with that of a pure solvent calibration line
(table 7).
Table 7. Statistical comparison of the slopes of matrix-matched calibration and
conventional calibration.
Soil sample TPH
[mg/kg]
Slope
a ± 95% CI se2 F-test F crit sep
2 t-test t crit
Conventional
calibration
8.94E+08 ± 1.54E+07 3.24E+16
Multiple standard
addition method
Soil #1 10 000 1.06E+09 ± 1.68E+07 1.13E+16 2.87 15.44 2.19E+16 6.30 2.45
Soil #1 2 500 1.07E+09 ± 1.90E+07 1.45E+16 2.23 15.44 2.35E+16 6.24 2.45
Soil #1 – 1.01E+09 ± 1.20E+07 5.78E+15 5.61 15.44 1.91E+16 4.84 2.45
Soil #2 10 000 1.03E+09 ± 1.12E+07 2.53E+15 12.80 39.17 2.05E+16 3.92 2.57
Soil #2 2 500 1.06E+09 ± 1.60E+07 1.03E+16 3.15 15.44 2.14E+16 6.21 2.45
Soil #2 – 1.02E+09 ± 1.73E+07 1.21E+16 2.68 15.44 2.23E+16 4.75 2.45
As the results indicate, the slopes of the conventional calibration line and the
standard addition line were significantly different at the 5% probability level.
Hence, there was significant enhancement of the response when matrix
components were present. The same was true for both types of soil at each of the
TPH level studied. The results confirmed that enhancement of the matrix-induced
chromatographic response may result in a proportional systematic error in TPH
determination by GC-FID. Due to the matrix effect, too high TPH concentrations
were obtained when using external calibration with a standard oil diluted in an
extracting solvent. Consequently, the results confirmed that the presence of a

49
matrix effect may prevent the accurate determination of TPH concentration in soil
by GC-FID.
Despite various potential approaches for compensating for the matrix effect,
few of them are actually applicable to TPH determination in soil (II). The
standard addition method is often used as a means of correcting matrix
interference effects that result in relative systematic errors. However, when the
standard addition line was studied in more detail, there was a clear deviation from
linearity over the extrapolated region. Figure 9 presents the observed percentage
enhancement of the FID response due to the presence of a constant concentration
of interfering matrix. The percentage enhancement of the FID response due to the
presence of an interfering matrix was calculated as [100 × (A − B)/B], where
A = the matrix standard response, and B = the fitted response (external
calibration). The percentage suppression of the FID response compared to the
response estimated from the regression line calculated from the measured
calibration data was calculated as [100 × (C − D)/D], where C = the solvent
standard response, and D = the fitted response (external calibration).
Fig. 9. Percentage enhancement of the FID response due to the presence of an
interfering matrix in sample extracts ( ♦ Soil #1 Soil #2) and percentage suppression
of the FID response compared to the response estimated from the regression line
calculated from the measured calibration data ( External calibration). For the
calculation of suppression and enhancement values please refer to the text.
-200
0
200
400
600
800
1000
1200
0.00 2.00 4.00 6.00 8.00 10.00 12.00 14.00 16.00 18.00
TPH [mg/ml]
resp
on
se e
nh
ance
men
t (%
)
Soil #1Soil #2
Conv. calibration

50
It was also evident that, over the extrapolated region, the percentage change in the
FID response due to the interfering matrix was neither constant nor directly
proportional to the TPH concentration.
Greater enhancement of the response was encountered at lower analyte
concentrations. The magnitude of the matrix effect diminished at TPH
concentrations higher than about 3 mg/ml and, as a consequence, the dependence
of the response was linear. Because the CEN prEN 14039:2004:E procedure was
used for sample preparation in this study, this concentration corresponds to a
mineral oil concentration in soil of 3000 mg/kg. Consequently, it can be
concluded that the range over which a linear response can be expected must be
established when using matrix-matched calibration or the method of standard
additions. Otherwise too high TPH concentrations will be obtained.
The shape of the external calibration line within the low TPH concentration
region (< 3 mg/ml) was also studied. A slight deviation from linearity was
detected. At lower analyte concentrations the FID response was suppressed due to
the adsorption of certain analytes on the liner during injection. The calculated
percentage suppression of the FID response compared to the response estimated
from the regression line calculated from the measured calibration data is
presented in figure 9. As a result of this suppression, the results obtained using the
linear least squares regression line were underestimates of the actual TPH
concentration of the sample. At higher TPH concentrations, the contribution of
adsorptive effects diminishes and linear dependence of the response will be
attained. It should be noted that this deviation from linearity occurs over a TPH
concentration range that is important in environmental monitoring. For instance,
at the recommended maximum value for mineral oil in soil (900 mg/kg in
Finland), the results appear to be 30% lower than the target value. Therefore,
matrix effect may increase the probability of underestimating the risk posed to
human health or to the environment.
4.3.3 The effects of extraction and clean-up parameters (IV)
A two-level Plackett-Burman design was utilized to determine the effect of CEN
prEN 14039:2004:E extraction method parameters on the extraction recovery of
TPH in soil. The effects of 11 different method parameters, including both
quantitative and qualitative factors, were investigated. The analytical methods
used by the individual laboratories in an interlaboratory comparison were utilized
in selecting the values for the upper and lower levels of the quantitative factors, as
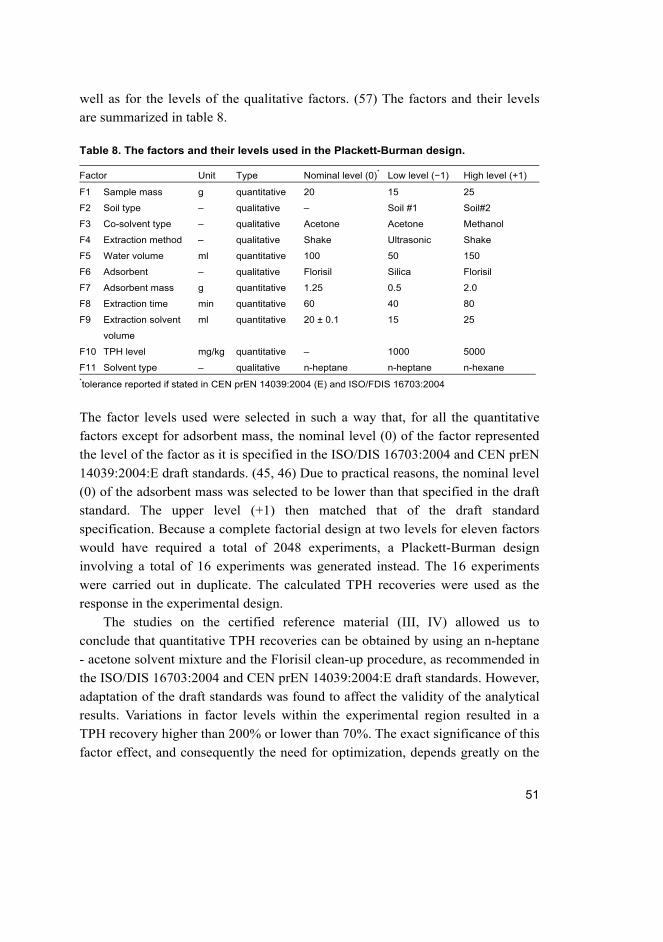
51
well as for the levels of the qualitative factors. (57) The factors and their levels
are summarized in table 8.
Table 8. The factors and their levels used in the Plackett-Burman design.
Factor Unit Type Nominal level (0)* Low level (−1) High level (+1)
F1 Sample mass g quantitative 20 15 25
F2 Soil type – qualitative – Soil #1 Soil#2
F3 Co-solvent type – qualitative Acetone Acetone Methanol
F4 Extraction method – qualitative Shake Ultrasonic Shake
F5 Water volume ml quantitative 100 50 150
F6 Adsorbent – qualitative Florisil Silica Florisil
F7 Adsorbent mass g quantitative 1.25 0.5 2.0
F8 Extraction time min quantitative 60 40 80
F9 Extraction solvent
volume
ml quantitative 20 ± 0.1 15 25
F10 TPH level mg/kg quantitative – 1000 5000
F11 Solvent type – qualitative n-heptane n-heptane n-hexane *tolerance reported if stated in CEN prEN 14039:2004 (E) and ISO/FDIS 16703:2004
The factor levels used were selected in such a way that, for all the quantitative
factors except for adsorbent mass, the nominal level (0) of the factor represented
the level of the factor as it is specified in the ISO/DIS 16703:2004 and CEN prEN
14039:2004:E draft standards. (45, 46) Due to practical reasons, the nominal level
(0) of the adsorbent mass was selected to be lower than that specified in the draft
standard. The upper level (+1) then matched that of the draft standard
specification. Because a complete factorial design at two levels for eleven factors
would have required a total of 2048 experiments, a Plackett-Burman design
involving a total of 16 experiments was generated instead. The 16 experiments
were carried out in duplicate. The calculated TPH recoveries were used as the
response in the experimental design.
The studies on the certified reference material (III, IV) allowed us to
conclude that quantitative TPH recoveries can be obtained by using an n-heptane
- acetone solvent mixture and the Florisil clean-up procedure, as recommended in
the ISO/DIS 16703:2004 and CEN prEN 14039:2004:E draft standards. However,
adaptation of the draft standards was found to affect the validity of the analytical
results. Variations in factor levels within the experimental region resulted in a
TPH recovery higher than 200% or lower than 70%. The exact significance of this
factor effect, and consequently the need for optimization, depends greatly on the

52
permissible variation in TPH recovery. Because there was no change in the
standard deviation with changes in concentration, it was concluded that the
presence of analytical bias cannot be demonstrated over a TPH recovery range of
84–116%. This was then accepted as a permissible variation in TPH recovery.
The factorial experiment revealed the statistically significant main effects on
TPH recovery (Figure 10). The plot displays the change in the predicted values of
the response, when the factor varies from a low to a high level, all other factors in
the design being set at their average values. As can be seen from figure 10, the
factors with a statistically significant effect on TPH recovery were the solvent and
co-solvent used for extraction, the extraction time, adsorbent and its mass and
sample TPH concentration.
The selection of extracting solvent had an especially strong influence on TPH
recovery. n-heptane was found to be the preferred solvent for extracting TPH in
soil, because using n-hexane as the solvent resulted in too high TPH recoveries.
Thus, the results indicate that n-heptane should not be replaced by n-hexane. The
effects of co-solvent, extraction time, adsorbent type and its mass and sample
TPH concentration were moderate.
Fig. 10. Main effect plot for TPH recovery. The 95% confidence interval is shown for
each effect.

53
When the influence of different co-solvents was studied, using acetone as a co-
solvent and nominal levels for the other factors resulted in good TPH recoveries
irrespective of the sample TPH concentration. Although a slight decrease in TPH
recovery was observed with decreasing TPH concentrations, this variation was
insignificant. It was assumed that the slight decrease in recovery probably
resulted from the fact that a small part of the TPH is strongly adsorbed and is
therefore non-extractable.
In contrast, when methanol was substituted for acetone, the decrease in
recovery with decreasing TPH concentration eventually resulted in too low TPH
recovery values at a TPH concentration close to the recommended maximum
value for mineral oil in soil. (IV) Slightly better recoveries, especially at low TPH
concentrations, were again obtained by optimizing the extraction time and mass
of the adsorbent. With decreasing sample TPH concentration and methanol as co-
solvent, longer extraction times were actually needed for quantitative TPH
recovery. It is therefore evident that adaptation of the draft standards with respect
to the significant factors especially, easily leads to erroneous TPH values. Acetone
was found to be a slightly more effective co-solvent than methanol. This
supported the earlier observations on the outstanding ability of acetone to remove
entrained compounds. This is probably due to its ability to swell the soil matrix,
which consequently enhances the diffusion of analytes and matrix components
from the matrix into the solvent. The role of co-solvent seemed to be especially
significant at low TPH concentrations, where the strongly adsorbed fraction of the
hydrocarbons has to be removed from the soil matrix into the solvent.
The ISO/DIS 16703:2004 and CEN prEN 14039:2004:E draft standards
consider Florisil to be applicable for extract clean-up. When the efficiencies of
Florisil and silica were compared, both the type of adsorbent and its weight were
found to have a significant influence on TPH recovery. By using nominal amounts
of Florisil, good TPH recoveries could be obtained irrespective of the sample
TPH concentration. When silica was substituted for Florisil, the increase in TPH
recovery with increasing TPH concentration eventually resulted in too high TPH
recovery values at high TPH concentrations. It was also found that, with
increasing sample TPH concentration, a larger amount of silica was needed for
quantitative TPH recovery. This clearly indicated the presence of an interfering
agent, which was a consequence of the inefficient clean-up stage. Florisil was,
therefore, found to be a more efficient adsorbent for the clean-up procedure.
Consequently, the replacement of Florisil by silica should not be considered
without careful method optimization.

54
As a whole this approach allowed us to conclude that the adaptation of draft
standards certainly affects the validity of the analytical results.
4.3.4 The effect of GC operating settings (V)
The performance criterion proposed by ISO and CEN draft standards ISO/FDIS
16703:2004 and CEN prEN 14039:2004:E states that the response of n-C40 with
respect to n-C20 shall be at least 0.8. If this criterion is not fulfilled during TPH
determination by GC-FID, the validity of the results will be affected by mass
discrimination. A D-optimal design was therefore utilized to study the effects of
six different GC operating settings on this performance criterion. One qualitative
factor (liner design) and five quantitative factors (inlet temperature, injection
volume, split vent time, column flow and detector temperature) were selected as
variables in the D-optimal design. The settings of these design variables were
selected both from the analytical methods used by individual laboratories in an
interlaboratory comparison and from the literature. The factors, as well as the
levels of these factors, are summarized in table 9.
Table 9. Factors and their levels used in the D-optimal design.
Factor Unit Type Low level (−1) High level (+1)
F1 Injection temperature °C quantitative 260 330
F2 Split vent time min quantitative 2 4
F3 Injection volume μl quantitative 1 3
F4 FID temperature °C quantitative 300 330
F5 Column flow ml/min quantitative 2 3
F6 Inlet liner design – qualitative with ads no ads
A D-optimal design was then generated: RSM design, quadratic model with
potential cubic terms, total runs 406. The best subset of experiments from the
candidate set was selected on the basis of the G efficiency. In conclusion, a
D-optimal design with 42 runs including three centre points was generated
(G efficiency 60.6, condition number 14.6). The design matrix based on the
G efficiency for the D-optimal design is presented in table 10.

55
Table 10. The design matrix based on G efficiency for D-optimal design.
Exp No F1 F2 F3 F4 F5 F6
1 1 1 −1 1 −1 with ads
2 −1 1 1 1 −1 with ads
3 1 1 −1 −1 1 with ads
4 −1 1 1 −1 1 with ads
6 −1 −1 1 1 1 with ads
7 1 1 1 1 1 with ads
8 −1 −1 −1 −1 −0.4 with ads
9 −1 −1 −1 0.333 −1 with ads
10 −1 −1 1 −0.333 −1 with ads
11 −1 −1 0 −1 1 with ads
12 −1 1 0 −1 −1 with ads
13 1 −1 −1 1 0.4 with ads
14 1 −1 0 −1 1 with ads
15 1 −1 0 1 −1 with ads
16 1 1 1 0.333 −1 with ads
17 1 0.3 −1 −1 −1 with ads
18 0.343 −1 1 −1 −1 with ads
19 0 0 0 0 0 with ads
20 1 −1 −1 −1 −1 no ads
21 1 1 1 −1 −1 no ads
22 1 −1 1 1 −1 no ads
23 −1 −1 −1 1 1 no ads
24 −1 1 1 1 1 no ads
25 −1 −1 1 1 −0.4 no ads
26 −1 −1 0 −1 −1 no ads
27 −1 1 −1 −0.333 −1 no ads
28 −1 −0.3 −1 −1 1 no ads
29 −1 0.3 −1 1 −1 no ads
30 −1 0.3 1 −1 −1 no ads
31 1 −1 −1 0.333 1 no ads
32 1 −1 1 −1 0.4 no ads
33 1 1 −1 1 0.4 no ads
34 1 1 0 −1 1 no ads
35 1 −0.3 1 1 1 no ads
36 −0.343 −1 −1 1 −1 no ads
37 −0.343 −1 1 −1 1 no ads
38 −0.343 1 −1 −1 1 no ads
39 0.343 1 1 1 −1 no ads
40 0 0 0 0 0 no ads
41 0 0 0 0 0 no ads
42 0 0 0 0 0 no ads

56
The performance of the GC system was then tested by analysing aliquots of an
n-heptane solution containing 30 mg/l of n-decane, n-eicosane and n-tetracontane
according to the experimental design. For the evaluation, a desirability function
(154) was constructed from three responses; 1) peak area for n-eicosane, 2) peak
area for n-tetracontane, and 3) the peak area ratio (n-tetracontane / n-eicosane).
This was required because the acceptable response ratio could be obtained, even
though the GC operating conditions resulted in detrimental peak broadening and
too low a signal-to-noise ratio. The experiment indicated the main effects and the
statistical significances of factors for the response (Figure 11).
Fig. 11. Main effect plot for TPH recovery. The 95% confidence interval is shown for
each effect.
This approach allowed us to conclude that the operating settings of the gas
chromatographic system do have a significant influence on the n-C20 and n-C40
peak areas and on the proposed GC performance criteria. (V) The use of splitless
injection with a non-optimal combination of GC system and operating settings
easily result in the mass discrimination of high-boiling compounds. In particular,
the combination of liner design, inlet temperature and injection volume require
optimization. Liner design was expected to be significant, because literature
surveys have indicated that the use of an adsorbent material inside the liner
facilitates the vaporization of less volatile, high-boiling compounds. This
consequently minimizes mass discrimination. Furthermore, the inlet temperature
requires optimization in order to ensure that there will be enough thermal energy
in the inlet liner to be absorbed by the high-boiling hydrocarbon compounds.
(114) Only then can the interference caused by mass discrimination during sample
vapour injection on the column be minimized.

57
An increase in injection volume resulted in a higher signal-to-noise ratio and
sensitivity. As a result, this assisted in distinguishing the analyte peaks from the
background. The results also indicated that, with a constant injection volume,
higher peak areas and acceptable values for the response ratio can be more easily
obtained with increasing inlet temperature. This was suggested to be a
consequence of more efficient volatilization of n-C40, which then results in a
larger peak area and response ratio. The measurement method was, however,
robust with respect to small changes in the split vent time, column flow and
detector temperature.
The results obtained in this study showed that, because the variation in GC
splitless injection settings clearly affects the accuracy of TPH results, the splitless
injection settings presuppose careful optimization. If no further specifications
concerning the GC operating conditions are to be given, then it should be required
that, especially when adapted methods are used for TPH analysis, the
measurement uncertainty be stated together with the analysis result. This not only
supports the credibility of analytical services, but also prevents the data end-users
from drawing misleading conclusions concerning the environmental risks and
potential need for remediation.

58
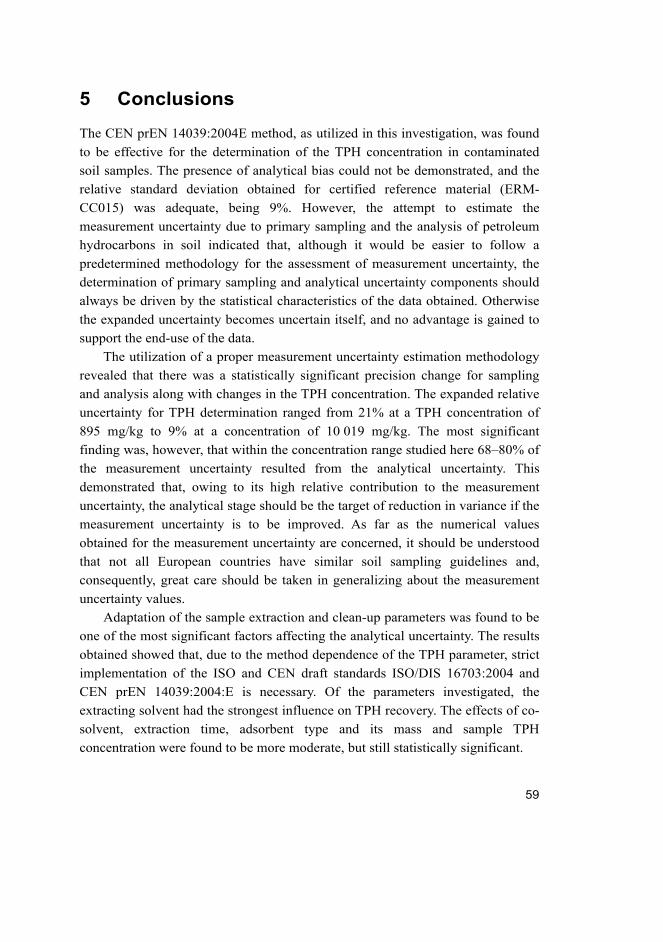
59
5 Conclusions
The CEN prEN 14039:2004E method, as utilized in this investigation, was found
to be effective for the determination of the TPH concentration in contaminated
soil samples. The presence of analytical bias could not be demonstrated, and the
relative standard deviation obtained for certified reference material (ERM-
CC015) was adequate, being 9%. However, the attempt to estimate the
measurement uncertainty due to primary sampling and the analysis of petroleum
hydrocarbons in soil indicated that, although it would be easier to follow a
predetermined methodology for the assessment of measurement uncertainty, the
determination of primary sampling and analytical uncertainty components should
always be driven by the statistical characteristics of the data obtained. Otherwise
the expanded uncertainty becomes uncertain itself, and no advantage is gained to
support the end-use of the data.
The utilization of a proper measurement uncertainty estimation methodology
revealed that there was a statistically significant precision change for sampling
and analysis along with changes in the TPH concentration. The expanded relative
uncertainty for TPH determination ranged from 21% at a TPH concentration of
895 mg/kg to 9% at a concentration of 10 019 mg/kg. The most significant
finding was, however, that within the concentration range studied here 68–80% of
the measurement uncertainty resulted from the analytical uncertainty. This
demonstrated that, owing to its high relative contribution to the measurement
uncertainty, the analytical stage should be the target of reduction in variance if the
measurement uncertainty is to be improved. As far as the numerical values
obtained for the measurement uncertainty are concerned, it should be understood
that not all European countries have similar soil sampling guidelines and,
consequently, great care should be taken in generalizing about the measurement
uncertainty values.
Adaptation of the sample extraction and clean-up parameters was found to be
one of the most significant factors affecting the analytical uncertainty. The results
obtained showed that, due to the method dependence of the TPH parameter, strict
implementation of the ISO and CEN draft standards ISO/DIS 16703:2004 and
CEN prEN 14039:2004:E is necessary. Of the parameters investigated, the
extracting solvent had the strongest influence on TPH recovery. The effects of co-
solvent, extraction time, adsorbent type and its mass and sample TPH
concentration were found to be more moderate, but still statistically significant.

60
Adaptation of the operating settings of the gas chromatographic system was
also found to have a significant influence on the proposed GC performance
criteria and, consequently, on the quality of TPH determination. In the case of
splitless injection, the results were found to be seriously affected by the
interference caused by the mass discrimination of high-boiling compounds.
Avoidance of this mass discrimination interference required proper optimization
of liner design, inlet temperature and injection volume. The measurement method,
however, was robust with respect to small changes in split vent time, column flow
and flame ionization detector temperature. The results demonstrated that
adaptation of the draft standards by laboratories with respect to the significant
factors of extraction, clean-up and GC determination stages certainly leads to
erroneous TPH values. Therefore, adaptation clearly undermines the credibility of
the data produced by laboratories and creates confusion for the end-users of the
data.
Comparison of the extraction methods used for TPH determination indicated
that the analytical uncertainty cannot be successfully reduced by replacing the
CEN prEN 14039:2004:E shake extraction method by Soxhlet or microwave-
assisted extraction. In the case of TPH-contaminated soil samples, there were no
significant differences between the TPH recoveries obtained with the different
extraction methods. The differences between the methods were obscured by the
variation created by the heterogeneous distribution of the analytes in the spiked
soil sample. In the case of synthetic solvent samples, however, there was a
statistically significant difference between the extraction performances of the
different methods. The best recovery and repeatability values (99% ± 3%) were
obtained with microwave-assisted extraction.
The matrix-induced chromatographic response effect was found to have a
significant effect on the TPH determination by GC-FID. Due to the matrix effect
there was a relative systematic error. As a result, too high TPH concentrations are
obtained when conventional solvent calibration is used. Avoidance of the matrix
effect by using standard addition method was not successful because there was a
clear deviation from linearity over the extrapolated region. Thus, it is obvious
that, when using matrix-matched calibration or the method of standard additions
for the minimization of the matrix effect, the range over which a linear response
can be expected has to be established. However, due to the variability in soil
composition the effect of the matrix on TPH determination requires further study.
The results of this study showed that TPH concentrations can be reliably
determined in contaminated soil samples by GC-FID. However, the results also
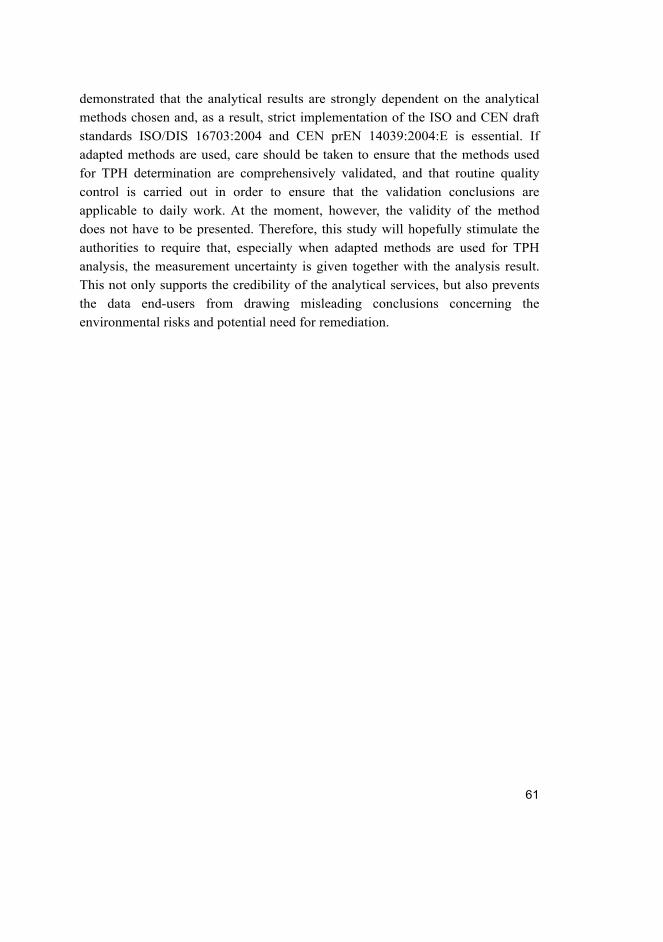
61
demonstrated that the analytical results are strongly dependent on the analytical
methods chosen and, as a result, strict implementation of the ISO and CEN draft
standards ISO/DIS 16703:2004 and CEN prEN 14039:2004:E is essential. If
adapted methods are used, care should be taken to ensure that the methods used
for TPH determination are comprehensively validated, and that routine quality
control is carried out in order to ensure that the validation conclusions are
applicable to daily work. At the moment, however, the validity of the method
does not have to be presented. Therefore, this study will hopefully stimulate the
authorities to require that, especially when adapted methods are used for TPH
analysis, the measurement uncertainty is given together with the analysis result.
This not only supports the credibility of the analytical services, but also prevents
the data end-users from drawing misleading conclusions concerning the
environmental risks and potential need for remediation.

62

63
References
1. Energy Information Administration (EIA) (2008) Official Energy Statistics from the U.S. Government. URI: http://www.eia.doe.gov/emeu/international/ oilconsumption.html.
2. U.S. Department of the Interior Minerals Management Service (2002) OCS Oil Spill Facts. URI: http://www.mms.gov/stats/PDFs/2002OilSpillFacts.pdf.
3. Ramsey MH, Argyraki A & Thompson M (1995) On the collaborative trial in sampling. Analyst 120: 2309–2312.
4. Thompson M & Ramsey MH (1995) Quality concepts and practices applied to sampling—an exploratory study. Analyst 120: 261–270.
5. Ramsey MH & Argyraki A (1997) Estimation of measurement uncertainty from field sampling: implications for the classification of contaminated land. Sci Total Environ 198: 243–257.
6. Squire S, Ramsey MH & Gardner MJ (2000) Collaborative trial in sampling for the spatial delineation of contamination and the estimation of uncertainty. Analyst 125: 139–145.
7. Saari E (2004) Näytteenoton epävarmuus arvioitaessa maa-alueen pilaantuneisuutta. liesnsiaatintutkimus, Oulun yliopisto, Kemian laitos.
8. Saari E, Perämäki P & Jalonen J (2008) Measurement uncertainty in the determination of total petroleum hydrocarbons (TPH) in soil by GC-FID. Chemom Intell Lab Syst 92: 3–12.
9. Owen K & Coley T (1990) Automotive fuels handbook. Warrendale PA, Society for Automotive Engineers SAE.
10. Forsbacka A (1996) Öljy-yhdisteiden biologinen hajoaminen ja saastuneen maan biosaneeraus. Helsinki.
11. Marshall AG & Rodgers RP (2004) The next grand challenge for Chemical Analysis. Acc Chem Res 37: 3–59.
12. Song C, Hsu CS & Mochida I (2000) Chemistry of Diesel Fuels. New York, Taylor & Francis.
13. Kamiński M, Kartanowicz R, Gilgenast E & Namieśnik J (2005) High-Performance Liquid Chromatography in Group-Type Separation and Technical or Process Analytics of Petroleum Products. Crit Rev Anal Chem 35: 193–216.
14. Frysinger GS, Gaines RB, Xu L & Reddy CM (2003) Resolving the Unresolved Complex mixture in Petroleum-Contaminated Sediments. Environ Sci Technol 37: 1653–1662.
15. Environment Canada, Environmental Science and Technology Centre (2008) Oil properties database. URI: http://www.etc-cte.ec.gc.ca.
16. Uhler AD, Stout SA, Douglas GS & McCarthy KJ (2001) The influences of refining on petroleum fingerprinting, part I The refining process. Contam Soils 16–18.
17. Kawahara FK & Yang YY (1976) Systems chemical analysis of petroleum pollutants. Anal Chem 48: 651–656.

64
18. Christensen JH & Tomasi G (2007) Practical aspects of chemometrics for oil spill fingerprinting. J Chromatogr A 1169: 1–22.
19. Lavine BK, Ritter J, Moores AJ, Wilson M, Faruque A & Mayfield HT (2000) Source Identification of Underground Fuel Spills by Solid-Phase Microextraction/High-Resolution Gas Chromatography / Genetic Algorithms. Anal Chem 72: 423–431.
20. Lavine BK, Mayfield H, Kromann PR & Faruque A (1995) Source Identification of Underground Fuel Spills by Pattern Recognition Analysis of High-Speed Gas Chromatograms. Anal Chem 67: 3846–3852.
21. Wang Z, Fingas MF & Page DS (1999) Oil Spill Identification. J Chromatogr A 843: 369–411.
22. Stout SA, Uhler AD & McCarthy KJ (2001) A Strategy and Methodology for Defensibly Correlating Spilled Oil to Source Candidates. Environ Forensics 2: 87–98.
23. Kaplan I, Galperin Y, Lu SH & Lee RP (1997) Forensic environmental geochemistry: differentiation of fuel-types, their sources and release time. Org Geochem 2: 289–317.
24. Wang Z & Fingas MF (2003) Development of oil hydrocarbon fingerprinting and identification techniques. Mar Poll Bullet 47: 423–452.
25. Wang Z, Fingas MF & Sergy G (1994) Study of 22-Year Old Arrow Oil Samples Using Biomarker Compounds by GC/MS. Environ Sci Technol 28: 1733–1746.
26. Grice K, Alexander R & Kagi RI (2000) Diamondoid hydrocarbon ratios as indicators of biodegradation in Australian crude oils. Org Geochem 31: 67–73.
27. Northcott GL & Jones KC (2001) Partitioning, Extractability and Formation of Nonextractable PAH Residues in Soil. 1. Compound Differences in Aging and Sequestration. Environ Sci Technol 35: 1103–1110.
28. Brusseau ML, Jessup RE & Rao PSC (1991) Nonequilibrium sorption of organic chemicals: elucidation of rate-limiting processes. Environ Sci Technol 25: 134–142.
29. Pignatello JJ & Xing B (1996) Mechanisms of Slow Sorption of Organic Chemicals to Natural Particles. Environ Sci Technol 30: 1–11.
30. Leboeuf EJ & Weber WJ (1997) A Distributed Reactivity Model for Sorption by Soils and Sediments. 8. Sorbent Organic Domains: Discovery of a Humic Acid Glass Transition and an Argument for a Polymer-Based Model. Environ Sci Technol 31: 1697–1702.
31. Garrett RM, Pickering IJ, Haith CE & Prince RC (1998) Photooxidation of Crude Oils. Environ Sci Technol 32: 3719–3723.
32. Bekymer TD & Hites RA (1988) Photolysis of polycyclic aromatic hydrocarbons adsorbed on fly-ash. Environ Sci Technol 22: 1311–1319.
33. Douglas GS, Owens EH, Hardenstine J & Prince RC (2002) The OSSA II Pipeline Oil Spill: the character and weathering of the spilled oil. Spill Sci Technol B 7: 135–148.
34. Leahy JG & Colwell RR (1990) Microbial degradation of hydrocarbons in the environment. Microbiol Rev 54: 305–315.
35. Zhou E & Crawford RL (1995) Effects of oxygen, nitrogen and temperature on gasoline biodegradation in soil. Biodegradation 6: 127–140.
36. Leahy JG & Colwell RR (1993) Microbial degradation of hydrocarbons in the environment. Microbiol Rev 54: 305–315.
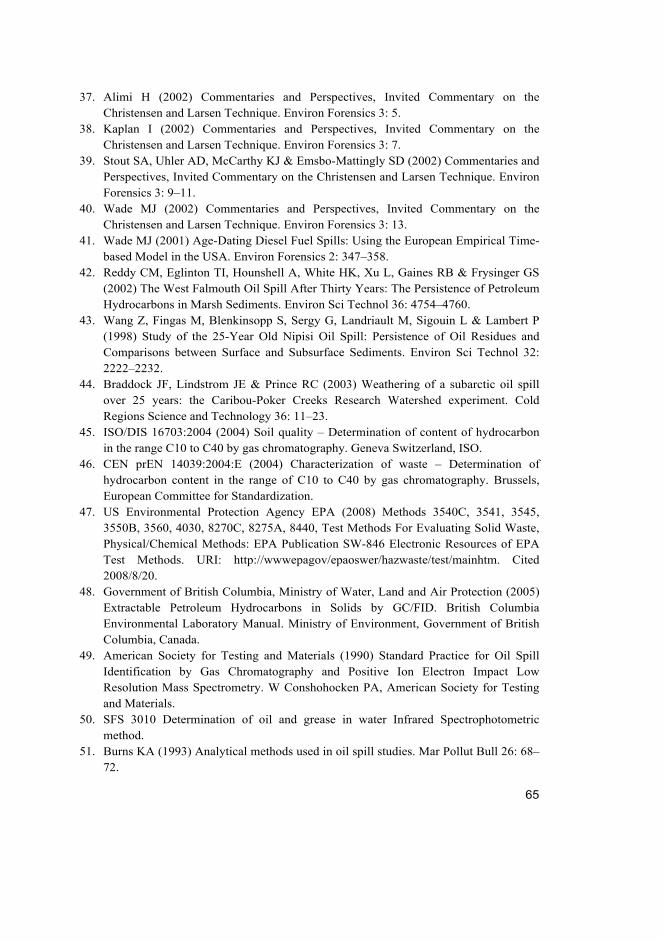
65
37. Alimi H (2002) Commentaries and Perspectives, Invited Commentary on the Christensen and Larsen Technique. Environ Forensics 3: 5.
38. Kaplan I (2002) Commentaries and Perspectives, Invited Commentary on the Christensen and Larsen Technique. Environ Forensics 3: 7.
39. Stout SA, Uhler AD, McCarthy KJ & Emsbo-Mattingly SD (2002) Commentaries and Perspectives, Invited Commentary on the Christensen and Larsen Technique. Environ Forensics 3: 9–11.
40. Wade MJ (2002) Commentaries and Perspectives, Invited Commentary on the Christensen and Larsen Technique. Environ Forensics 3: 13.
41. Wade MJ (2001) Age-Dating Diesel Fuel Spills: Using the European Empirical Time-based Model in the USA. Environ Forensics 2: 347–358.
42. Reddy CM, Eglinton TI, Hounshell A, White HK, Xu L, Gaines RB & Frysinger GS (2002) The West Falmouth Oil Spill After Thirty Years: The Persistence of Petroleum Hydrocarbons in Marsh Sediments. Environ Sci Technol 36: 4754–4760.
43. Wang Z, Fingas M, Blenkinsopp S, Sergy G, Landriault M, Sigouin L & Lambert P (1998) Study of the 25-Year Old Nipisi Oil Spill: Persistence of Oil Residues and Comparisons between Surface and Subsurface Sediments. Environ Sci Technol 32: 2222–2232.
44. Braddock JF, Lindstrom JE & Prince RC (2003) Weathering of a subarctic oil spill over 25 years: the Caribou-Poker Creeks Research Watershed experiment. Cold Regions Science and Technology 36: 11–23.
45. ISO/DIS 16703:2004 (2004) Soil quality – Determination of content of hydrocarbon in the range C10 to C40 by gas chromatography. Geneva Switzerland, ISO.
46. CEN prEN 14039:2004:E (2004) Characterization of waste – Determination of hydrocarbon content in the range of C10 to C40 by gas chromatography. Brussels, European Committee for Standardization.
47. US Environmental Protection Agency EPA (2008) Methods 3540C, 3541, 3545, 3550B, 3560, 4030, 8270C, 8275A, 8440, Test Methods For Evaluating Solid Waste, Physical/Chemical Methods: EPA Publication SW-846 Electronic Resources of EPA Test Methods. URI: http://wwwepagov/epaoswer/hazwaste/test/mainhtm. Cited 2008/8/20.
48. Government of British Columbia, Ministry of Water, Land and Air Protection (2005) Extractable Petroleum Hydrocarbons in Solids by GC/FID. British Columbia Environmental Laboratory Manual. Ministry of Environment, Government of British Columbia, Canada.
49. American Society for Testing and Materials (1990) Standard Practice for Oil Spill Identification by Gas Chromatography and Positive Ion Electron Impact Low Resolution Mass Spectrometry. W Conshohocken PA, American Society for Testing and Materials.
50. SFS 3010 Determination of oil and grease in water Infrared Spectrophotometric method.
51. Burns KA (1993) Analytical methods used in oil spill studies. Mar Pollut Bull 26: 68–72.

66
52. Karlsen DA & Larter SR (1991) Analysis of petroleum fraction by TLC-FID: application to petroleum reservoir description. Org Geochem 17: 603–617.
53. Sink CW & Hardy DR (1994) Quantification of compound classes in complex mixtures and fuels using HPLC with differential refractive index detection. Anal Chem 66: 1334–1338.
54. Krahn MM, Ylitalo GM, Buzitis J, Chan S & Varanasi U (1993) Rapid high-performance liquid chromatographic methods that screen for aromatic compounds in environmental samples. J Chromatogr A 642: 15–32.
55. Hartonen K (1999) Supercritical fluid extraction and pressurized hot water extraction novel environmentally friendly analytical techniques. Helsinki, University of Helsinki.
56. Turle N, Nason T, Malle H & Fowlie P (2007) Development and Implementation of the CCME Reference Method for the Canada-Wide Standard for Petroleum Hydrocarbons (PHC) in soil: a case study. Anal Bioanal Chem 387: 957–964.
57. Mäkinen I, Suortti AM, Huhtala S & Pönni S (2002) Interlaboratory comparison 4/2002 Mineral oil from polluted soil and water. Helsinki, Suomen ympäristökeskus.
58. Pavon JLP, del Nogal Sanchez M, Garcia Pinto C, Esther Fernandez Laespada M, Moreno Cordero B & Guerrero Pena A (2003) Method for the Detection of Hydrocarbon Pollution in Soils by Headspace Mass Spectrometry and Pattern Recognition Techniques. Anal Chem 75: 2034–2041.
59. Current RW & Tilotta DC (1997) Determination of total petroleum hydrocarbons in soil by on-line supercritical fluid extraction – infrared spectroscopy using a fiberoptic transmission cell and a simple filter spectrometer. J Chromatorgr A 785: 269–277.
60. Napolitano GE, Richmond JE & Stewart AJ (1998) Characterzation of petroleum contaminated soils by thin-layer chromatography with flame-ionization detection. Soil Sediment Contam 7: 709–724.
61. Liang S & Tilotta DC (1998) On-line non-metal detection for argon supercritical fluid extraction using inductively coupled plasma optical emission spectroscopy. Anal Chem 70: 4487–4493.
62. Kasper KD, Twoney DM & Dinsmore D (1991) On-site analysis of fuel-related hydrocarbons in soils by infrared methods. Gr Wat Mon 8: 673–688.
63. Malley DF, Hunter KN & Barrier-Webster GR (1999) Analysis of diesel fuel contamination in soils by near-infrared-reflectance spectrometry and solid phase microextraction – gas chromatography. Soil Sediment Contam 8: 481–489.
64. Apitz SE, Borbridge LM, Theriault GA & Lieberman SH (1992) Remote in-situ determination of fuel oil products in soils: field results and laboratory investigations. Analysis 20: 461–474.
65. Greason S (2002) EPA performance study for field measurement of total petroleum hydrocarbons using ultraviolet fluorescence technology. Soil Sediment Contam 11: 870.
66. Banerjee DK & Gray MR (1997) Analysis of hydrocarbon-contaminated soil by thermal extraction gas chromatography. Environ Sci Technol 31: 646–650.

67
67. Grall A, Leonard C & Sacks R (2000) Peak Capacity, Peak-Capacity Production Rate, and Boiling Point Resolution for Temperature Programmed GC with Very High Programming Rates. Anal Chem 72: 591–598.
68. Miñones Vázquez M, Vázquez Blanco ME, Muniategui Lorenzo S, López Mahía P, Fernández Fernández E & Prada Rodríquez D (2001) Application Of Programmed Temperature Split/Splitless Injection To The Trace Analysis Of Aliphatic Hydrocarbons By Gas Chromatography. J Chromatogr A 919: 363–371.
69. Cavagnino D, Magni P, Zilioli G & Trestianu S (2003) Comprehensive two-dimensional gas chromatography using large sample volume injection for the determination of polynuclear aromatic hydrocarbons in complex matrices. J Chromatogr A 1019: 211–220.
70. Frysinger GS, Gaines RB (2002) GC x GC – A new analytical tool for environmental forensics. Environ Forensics 3: 27–34.
71. Whittaker M, Pollard SJT & Fallick TE (1995) Characterization of refractory wastes at heavy-oil contamination sites: A review of conventional and novel analytical methods. Environ Sci Technol 16: 1009–1033.
72. Sadler R, Connell D (2003) Analytical methods for the determination of total petroleum hydrocarbons in soil in Proceedings of the Fifth National Workshop on the Assessment of site contamination. National Environment Protection Council Service Corporation.
73. Nadim F, Liu S, Hoag GE, Chen J, Carley RJ & Zack P (2002) A comparison of spectrophotometric and gas chromatographic measurements of heavy petroleum products in soil samples. Water Air Soil Pollut 134: 97–109.
74. Krupcík J, Oswald P, Oktavec D & Armstrong DW (2004) Calibration of GC-FID and IR spectrometric methods for the determination of high-boiling petroleum hydrocarbons in environmental samples. Water Air Soil Pollut 153: 329–341.
75. Becker R, Koch M, Wachholz S & Win T (2002) Quantification of total petroleum hydrocarbons (TPH) in soil by IR-spectrometry and gas chromatography – conclusions from three proficiency testing rounds. Accred Qual Assur 7: 286–289.
76. Morel G, Samhan O, Literathy P, Al-Hashash H, Moulin L, Saeed T, Al-Matrouk K, Martin-Bouyer M, Saber A, Paturel L, Jarosz J, Vial M, Combet E, Fachinger C & Suptil J (1991) Evaluation of chromatographic and spectroscopic methods for the analysis of petroleum-derived compounds in the environment. Fresenius J Anal Chem 339: 699–715.
77. Lopez-Avila V, Young R & Beckert WF (1994) Microwave-Assisted Extraction of Organic Compounds from Standard Reference Soils and Sediments. Anal Chem 66: 1097–1106.
78. Fisher JA, Scarlett MJ & Stott AD (1997) Accelerated solvent extraction: An evaluation for screening of soils for selected US EPA semivolatile organic priority pollutants. Environ Sci Technol 31: 1120–1127.
79. Miller MW, Wright MS, Allen AM & Dudek B (2005) Is method 1664A silica gel treated n-hexane extractable material (SGT-HEM: Non-polar materials) a measure of total petroleum hydrocarbons? Soil Sediment Contam 14: 105–113.
68
80. Malle H (2002) Interlaboratory Study of the Canadian Council for Ministers of the Environment (CCME) Method for the Analysis of Petroleum Hydrocarbons in Soil. , Burlington Ontario, Environment Canada, National Laboratory for Environmental Testing, National Water Research Institute.
81. Daling PS, Faksness LG, Hansen AB & Stout SA (2002) Improved and Standardized Methodology for Oil Spill Fingerprinting. Environ Forensics 3: 263–278.
82. Garner FC, Stapanian MA & Williams LR (1988) Composite Sampling for Environmental Monitoring. In: Keith LH (ed) Principles of Environmental Sampling. , Washington, American Chemical Society: 363–374.
83. de Zorzi P, Belli M, Barbizzi S, Menegon S & Deluisa A (2002) A Practical Approach to Assessment of Sampling Uncertainty. Accred Qual Assur 7: 182–188.
84. Buddhadasa SC, Barone S, Bigger SW & Orbell JD (2001) A comparison between extractant solvents in the quantitative analysis of total petroleum hydrocarbons in soil samples. J Jpn Petrol Inst 44: 378–383.
85. Hartonen K, Bøwadt S, Dybdal HP, Nylund K, Sporring S, Lund H & Oreld F (2002) Nordic Laboratory Intercomparison of Supercritical Fluid Extraction for the Determination of Total Petroleum Hydrocarbon, Polychlorinated Biphenyls and Polycyclic Aromatic Hydrocarbons in Soil. Chromatogr A 958: 239–248.
86. Yang Y, Hawthorne SB & Miller D (1995) Comparison of Sorbent and Solvent Trapping After Supercritical Fluid Extraction of Volatile Petroleum Hydrocarbons from Soil. J Chromatogr A 699: 265–276.
87. Chesler SN, Emery AP & Duewer DL (1997) Recovery of diesel fuel from soil by supercritical fluid extraction – gas chromatography. J Chromatogr A 790: 125–130.
88. US Environmental Protection Agency EPA (2008) Method 3550B, Electronic Resources of EPA Test Methods. URI: http://wwwepagov/epaoswer/hazwaste/test/ mainhtm. Cited 2008/8/20.
89. Letellier M & Budzinski H (1999) Microwave assisted extraction of organic compounds. Analusis 27: 259–271.
90. CEM Corporation (2000) Microwave-Accelerated Reaction System, Model MARS-X, for the Extraction of Organic Pollutants from Solid Matrices. Matthews NC, Environmental Technology Certification Program, Evaluation report CEM corporation.
91. Letellier M, Budzinski H, Belloq J & Connan J (1999) Focused Microwave-Assisted Extraction of Polycyclic Aromatic Hydrocarbons and Alkanes from Sediments and Source Rocks. Org Geochem 30: 1353–1365.
92. Flotron V, Houessou J, Bosio A, Delteil C, Bermond A & Camel V (2003) Rapid determination of polycyclic aromatic hydrocarbons in sewage sludges using microwave-assisted solvent extraction. Comparison with other extraction methods. J Chromatogr A 99: 175–184.
93. Geerdink MJ, Erkelens C, Van Dam JC, Frank J & Luyben KAM (1995) Fast screening of contaminated soil samples using thermal desorption mass spectrometry. Anal Chim Acta 315: 159–166.

69
94. Prevot AB, Gulmini M, Zelano V & Pramauro E (2001) Microwave-Assisted Extraction of Polycyclic Aromatic Hydrocarbons from Marine Sediments Using Nonionic Surfactant Solutions. Anal Chem 73: 3790–3795.
95. Camel V (2001) Recent extraction techniques for solid matrices-supercritical fluid extraction, pressurized fluid extraction and microwave-assisted extraction; their potential and pitfalls. Analyst 126: 1182–1193.
96. Mäkinen I, Suortti AM, Pönni S & Huhtala S (2002) Proficiency test on the determination of mineral oil from polluted soils. Accred Qual Assur 7: 209–213.
97. Schwab AP, Su J, Wetzel S, Pekarek S & Banks MK (1999) Extraction of petroleum hydrocarbons from soil by mechanical shaking. Environ Sci Technol 33: 1940–1945.
98. Bøwadt S, Dybdahl HP, Bennetzen S, Merry J, Andersen KJ & Vejbøl J (2000) Udvikling af analysemetode til bestemmelse af Polycykliske Aromatiske Hydrocarboner (PAH’er) i jord. DHI, Institut for Vand og Miljø, Denmark.
99. Guerin T (2007) Validation of petroleum hydrocarbon extraction methodologies. Remed J 10: 85–93.
100. Hollender J, Koch B, Lutermann C & Dott W (2003) Efficiency of different methods and solvents for the extraction of polycyclic aromatic hydrocarbons from soils. Intern J Environ Anal Chem 83: 21–32.
101. Chee KK, Wong MK & Lee HK (1997) Optimization of the microwave-assisted solvent extraction of petroleum hydrocarbons in marine sediment and soil. Environ Monit Assess 44: 587–603.
102. Ventura K, Adam M & Dostalek J (2003) Comparison of modern extraction techniques in analysis of soil contaminated with fuel and crude oil spills. J Liq Chromatogr Relat Technol 26: 247–259.
103. Eckert-Tilotta SE, Hawthorne SB & Miller DJ (1993) Supercritical fluid extraction with carbon dioxide for the determination of total petroleum hydrocarbons in soil. Fuel 72: 1015 -1023.
104. US Environmental Protection Agency EPA (2008) Method 3620C, Electronic Resources of EPA Test Methods URI: http://wwwepagov/epaoswer/hazwaste/test/ mainhtm. Cited 2008/8/20.
105. Cvrčková O & Ciganek M (2005) Photostability of polycyclic aromatic hydrocarbons (PAHs) and nitrated polycyclic aromatic hydrocarbons (NPAHs) in dichloromethane and isooctane solutions. Polycyclic Aromat Compd 25: 141–156.
106. Hajšlová J, Holadová K, Kocourek V, Poustka J, Godula M, Cuhra P & Kempný M (1998) Matrix-induced effects: a critical point in the gas chromatographic analysis of pesticide residues. J Chromatogr A 800: 283–295.
107. Harvey EA & McMillen S (2002) Total petroleum hydrocarbons detected in naturally occurring materials. Soil Sediment Contam 11: 412.
108. Teinemaa E & Kirso U (1999) Photochemical Transformation of Polycyclic Aromatic Hydrocarbons on Solid Particles. Polycyclic Aromat Compd 14: 275–284.

70
109. US Environmental Protection Agency EPA (2008) Methods 3540C, 3541, 3545, 3550B, 3560, 4030, 8270C, 8275A, 8440, Test Methods For Evaluating Solid Waste, Physical/Chemical Methods: EPA Publication SW-846 Electronic Resources of EPA Test Methods. URI: http://wwwepagov/epaoswer/hazwaste/test/mainhtm. Cited 2008/8/20.
110. Government of British Columbia, Ministry of Water, Land and Air Protection (2005) Extractable Petroleum Hydrocarbons in Solids by GC/FID British Columbia Environmental Laboratory Manual, Ministry of Environment, Government of British Columbia, Canada.
111. American Society for Testing and Materials (1990) Standard Practice for Oil Spill Identification by Gas Chromatography and Positive Ion Electron Impact Low Resolution Mass Spectrometry. W Conshohocken PA
112. US Environmental Protection Agency EPA (2008) Method 8015B, Electronic Resources of EPA Test Methods. URI: http://wwwepagov/epaoswer/hazwaste/test/ mainhtm. Cited: 2008/8/20.
113. Woitke P, Kressner R, Lepom P (2001) Determination of hydrocarbons in water – interlaboratory method validation before monitoring. Accred Qual Assur 6: 173–177.
114. Schomburg G (1990) Gas Chromatography. A Practical Course. Weinheim, VCH. 115. Erney DR, Gillespie AM, Gilvydis DM, Poole CF (1993) Explanation of the matrix-
induced chromatographic response enhancement of organophosphorus pesticides during open tubular column gas chromatography with splitless or hot on-column injection and flame photometric detection. J Chromatogr A 638: 57–63.
116. Albero B, Sánches-Brunete C, Tadeo JL (2004) Analysis of Pesticides in Honey by Solid-Phase Extraction and Gas-Chromatography-Mass Spectrometry. J Agric Food Chem 52: 5828–5835.
117. Sánches-Brunete C, Albero B & Tadeo JL (2004) Multiresidue Determination of Pesticides in Soil by Gas Chromatography-Mass Spectrometry Detection. J Agric Food Chem 52: 1445–1451.
118. Albero B, Sánches-Brunete C & Tadeo JL (2005) Multiresidue Determination of Pesticides in Juice by Solid-Phase Extraction and Gas-Chromatography-Mass Spectrometry. Talanta 66: 917–924.
119. Bailey R (2005) Injectors for capillary gas chromatography and their application to environmental analysis. J Environ Monit 7: 1054–1058.
120. Regueiro J, Llompart M, Garcia-Jares C & Cela R (2007) Factorial-design optimization of gas chromatographic analysis of tetrabrominated diphenyl ethers. Anal Bioanal Chem 388: 1095–1107.
121. El-Naggar AY (2006) Factors affecting linearity and response of flame ionization detector. Pet Sci Technol 24: 41–50.
122. Egea Gonzáles FJE, Hernández Torres ME, Almansa López E, Cuadros-Rodríguez L & Martínez Vidal JL (2002) Matrix-effects of vegetable commodities in electron-capture detection applied to pesticide multiresidue analysis. J Chromatogr A 966: 155–165.
71
123. Sánchez-Brunete C, Albero B, Martín G & Tadeo JL (2005) Determination of Pesticide Residues by GC-MS Using Analyte Protectants to Counteract the Matrix Effect. Anal Sci 21: 1291–1296.
124. Anastassiades M, Maštovská K & Lehotay SJ (2003) Evaluation of analyte protectants to improve gas chromatographic analysis of pesticides. J Chromatogr A 1015: 163–184.
125. Thompson M & Ellison SLR (2005) A review of interference effects and their correction in chemical analysis with special reference to uncertainty. Accred Qual Assur 10: 82–97.
126. International Organization for Standardization (1993) Guide to the expression of uncertainty in measurement. International Organization for Standardization, Genève.
127. Horwitz W & Albert R (1997) The Concept of Uncertainty as Applied to Chemical Measurements. Analyst 122: 615–617.
128. Eurachem/Citac (1995) Quantifying Uncertainty in Analytical Measurement. English ed, first ed Eurachem/Citac.
129. Eurachem/Citac (2002) Guide to Quality in Analytical Chemistry – An Aid to Accreditation. Eurachem/Citac.
130. Eurachem/Citac (2000) Quantifying Uncertainty in Analytical Measurement. English ed, second ed. Eurachem/Citac.
131. Ramsey MH (1998) Sampling as a source of measurement uncertainty: techniques for quantification and comparison with analytical sources. J Anal At Spectrom 13: 97–104.
132. Muntau H, Rehnert A, Desaules A, Wagner G, Theocharopoulos S & Quevauviller P (2001) Analytical aspects of the CEEM soil project. Sci Total Environ 264: 27–49.
133. Ramsey MH & Ellison SLR (eds) (2007) Eurachem/EUROLAB/CITAC/Nordtest/ AMC Guide: Measurement uncertainty arising from sampling: a guide to methods and approaches. Eurachem.
134. Ramsey MH (1993) Sampling and analytical quality Control (SAX) for improved error estimation in the measurement of Pb in the environment using robust analysis of variance. Appl Geochem 2: 149–153.
135. Ramsey MH, Argyraki A & Thompson M (1995) Estimation of sampling bias between different sampling protocols on contaminated land. Analyst 120: 1353–1356.
136. Argyraki A, Ramsey MH & Thompson M (1995) Proficiency testing in sampling: pilot study on contaminated land. Analyst 120: 2799–2804.
137. Minkkinen P (2000) Liite 1: Näytteenoton virhelähteet, luotettavuuden estimointi ja näytteenottoketjun optimointi. In Mittatekniikan keskus, FINAS akkreditointi. Opas näytteenoton teknisten vaatimusten täyttämiseksi akkreditointia varten. FINAS S51/2000.
138. Gustavsson B, Luthbom K & Lagerkvist A (2006) Comparison of analytical error and sampling error for contaminated soil. J Hazard Mater B 138: 252–260.
139. Thompson M & Howarth RJ (1976) Duplicate analysis in geochemical practice, part I, Theoretical Approach and estimation if analytical reproducibility. Analyst 101: 690–698.
72
140. Howarth RJ & Thompson M (1976) Duplicate analysis in geochemical practice, part II, Examination of proposed method and examples of its use. Analyst 101: 699–709.
141. Lee JC & Ramsey MH (2001) Modelling measurement uncertainty as a function of concentration: an example from a contaminated land investigation. Analyst 126: 1784–1791.
142. Minkkinen P (2004) Practical applications of sampling theory. Chemom Intell Lab Syst 74: 85–94.
143. Nordtest (2007) Uncertainty from sampling. A Nordtest handbook for sampling planners on sampling quality assurance and uncertainty estimation. Nordic Innovation Centre.
144. Thompson M (1998) Uncertainty of Sampling in Chemical Analysis. Accred Qual Assur 3: 117–121.
145. Limpert E, Stahel WA & Abbt M (2001) Log-normal distributions across the sciences: keys and clues. BioScience 51: 341–352.
146. Garrett RG (1969) The determination of sampling and analytical errors in exploration geochemistry. Econ Geol 64: 568–569.
147. Theocharopoulos SP, Wagner G, Sprengart J, Mohr ME, Desaules A, Muntau H, Christou M & Quevauviller P (2001) European soil sampling guidelines for soil pollution studies. Sci Total Environ 264: 51–62.
148. Ellison S, Wegscheider W & Williams A (1997) Measurement Uncertainty. Analytical Chemistry News & Features 1: 607A-613A.
149. Green C (2005) Contaminated Land – Why use on site analysis? International Environmental Technology 15: 38–39.
150. Peltola J (2000) Haitallisten aineiden ympäristöseurannan kehittäminen. Suomen ympäristökeskuksen moniste 209.
151. Mittatekniikan keskus, FINAS akkreditointi (2000) Opas näytteenoton teknisten vaatimusten täyttämiseksi akkreditointia varten. FINAS S51/2000.
152. US Environmental Protection Agency EPA Method 3540C Soxhlet extraction Revision 3 (2008) Electronic Resources of EPA Test Methods. URI: http://wwwepagov/epaoswer/hazwaste/test/mainhtm. Cited 2008/8/20.
153. de Aguiar PF, Bourgiognon B, Khots MS, Massart DL & Phan-Tan-Luu R (1995) Tutorial D-optimal designs. Chemom Intell Lab Syst 30: 199–210.
154. Bayne CK & Rubin IB (1986) Practical Experimental Designs and Optimization Methods for Chemists. Deerfield Beach FL, VCH Publishers Inc.

73
Original publications
I Saari E, Perämäki P & Jalonen J (2007) A comparative study of solvent extraction of total petroleum hydrocarbons in soil. Microchim. Acta 158: 261–268.
II Saari E, Perämäki P & Jalonen J (2007) Effect of sample matrix on the determination of total petroleum hydrocarbons (TPH) in soil by gas chromatography-flame ionization detection. Microchem J 87: 113–118.
III Saari E, Perämäki P & Jalonen J (2008) Measurement uncertainty in the determination of total petroleum hydrocarbons (TPH) in soil by GC-FID. Chemometrics and Intelligent Laboratory Systems 92: 3–12.
IV Saari E, Perämäki P & Jalonen J (2008) Evaluating the impact of extraction and cleanup parameters on the yield of total petroleum hydrocarbons in soil. Anal Bioanal Chem 392: 1231–1240.
V Saari E, Perämäki P & Jalonen J (in press) Evaluating the impact of GC operating settings on GC-FID performance for total petroleum hydrocarbon (TPH) determination. Microchem J (in press) DOI: doi:10.1016/j.microc.2009.09.004.
Reprinted with permission from Elsevier [II, III, V] and Springer Science +
Business Media [I, IV].
Original publications are not included in the electronic version of the dissertation.

74
A C T A U N I V E R S I T A T I S O U L U E N S I S
Distributed byOULU UNIVERSITY LIBRARY
P.O. Box 7500, FI-90014University of Oulu, Finland
Book orders:OULU UNIVERSITY PRESSP.O. Box 8200, FI-90014University of Oulu, Finland
S E R I E S A S C I E N T I A E R E R U M N A T U R A L I U M
528. Arhippainen, Leena (2009) Studying user experience: issues and problems ofmobile services. – Case ADAMOS: User experience (im)possible to catch?
529. Niemelä, Marika (2009) Biotic interactions and vegetation management on coastalmeadows
530. Sørensen, Louise Ilum (2009) Grazing, disturbance and plant soil interactions innorthern grasslands
531. Salo, Antti (2009) Expression of lysyl hydroxylases and characterization of a noveldisorder caused by mutations in the lysyl hydroxylase 3 gene
532. Vaismaa, Matti (2009) Development of benign synthesis of some terminal ?-hydroxy ketones and aldehydes
533. Meriläinen, Gitte (2009) Structural and enzymological studies of the thiolaseenzymes
534. Astorga, Anna (2009) Diversity patterns in marine and freshwater environments.The role of environmental and spatial factors across multiple scales
535. Rivinoja, Antti (2009) Golgi pH and glycosylation
536. Salmi, Tuukka (2009) Very small families generated by bounded and unboundedcontext-free languages
537. Kokkonen, Nina (2009) Role of altered pH homeostasis and hypoxia in thephenotypic changes of cancer cells
538. Kangas, Katja (2009) Recreation and tourism induced changes in northern borealenvironments
539. Laari-Salmela, Sari (2009) The process of strategy formation in software business:three cases from Kainuu region, Finland
540. Väyrynen, Karin (2009) Evolution of software business in industrial companies:Resources, capabilities and strategy
541. Eskelinen, Anu (2009) Plant community dynamics in tundra: propagule availability,biotic and environmental control
542. Still, Kaisa (2009) Mobile technology for interest-based communities. Conceptdesign with a knowledge-based approach
543. Tarvainen, Oili (2009) Scots pine and its ectomycorrhizal symbionts underchronic low-level urban pollution—responses and restoration

ABCDEFG
UNIVERS ITY OF OULU P.O.B . 7500 F I -90014 UNIVERS ITY OF OULU F INLAND
A C T A U N I V E R S I T A T I S O U L U E N S I S
S E R I E S E D I T O R S
SCIENTIAE RERUM NATURALIUM
HUMANIORA
TECHNICA
MEDICA
SCIENTIAE RERUM SOCIALIUM
SCRIPTA ACADEMICA
OECONOMICA
EDITOR IN CHIEF
PUBLICATIONS EDITOR
Professor Mikko Siponen
University Lecturer Elise Kärkkäinen
Professor Hannu Heusala
Professor Helvi Kyngäs
Senior Researcher Eila Estola
Information officer Tiina Pistokoski
University Lecturer Seppo Eriksson
University Lecturer Seppo Eriksson
Publications Editor Kirsti Nurkkala
ISBN 978-951-42-6075-9 (Paperback)ISBN 978-951-42-6076-6 (PDF)ISSN 0355-3191 (Print)ISSN 1796-220X (Online)
U N I V E R S I TAT I S O U L U E N S I SACTAA
SCIENTIAE RERUM NATURALIUM
U N I V E R S I TAT I S O U L U E N S I SACTAA
SCIENTIAE RERUM NATURALIUM
OULU 2009
A 544
Eija Saari
TOWARDS MINIMIZING MEASUREMENT UNCERTAINTY IN TOTAL PETROLEUM HYDROCARBON DETERMINATION BY GC-FID
FACULTY OF SCIENCE,DEPARTMENT OF CHEMISTRY,UNIVERSITY OF OULU
A 544
ACTA
Eija Saari


![Profile Arctica User Manual[1]](https://static.fdocuments.net/doc/165x107/577d385d1a28ab3a6b97ad12/profile-arctica-user-manual1.jpg)


