Serial Assessment of Renal Anatomy and Function in Mice ... fileSerial Assessment of Renal Anatomy...
1
Serial Assessment of Renal Anatomy and Function in Mice with Unilateral Ureteral Obstruction Using Multi-modal Imaging C. Chad Quarles 1 , Feng Weng 1 , Mohammed Tantawy 1 , Rosie Jiang 2 , Keiko Takahashi 2 , Chuan-Ming Hao 2 , Todd Peterson 1 , Raymond Harris 2 , and Takamune Takahashi 2 1 Institute of Imaging Science, Vanderbilt University, Nashville, TN, United States, 2 O'Brien Mouse Kidney Physiology and Disease Center, Vanderbilt University, Nashville, TN, United States Introduction: The application of non-invasive imaging techniques in mouse models of renal disease could be useful for the serial evaluation of the functional, structural, and metabolic changes which occur during disease progression. The goal of this study was to systematically optimize high-field, high-resolution T 1 , T 2 and Magnetization Transfer Contrast (MTC) MRI and 99m Tc-mercaptoacetyltriglycine ( 99m Tc-MAG3) scintigraphy for mouse renal imaging and apply them to investigate the anatomical and functional changes that occur following unilateral ureteral obstruction (UUO). Methods: Multi-modality images of mice were acquired using a 7T MRI scanner and a NanoSPECT/CT system. The imaging parameters for each modality were optimized in cohorts of control mice. For MRI, the pulse sequence selection, parameters and use of respiratory gating, navigator echos and fat saturation were all optimized to enhance image contrast between the cortex and medulla. Once optimized, imaging data was acquired in sham operated (n = 8) and UUO mice (n = 8) at 0 (3 hours), 1, 3 and 6 days after surgery. Histology was acquired in separate cohorts of UUO mice. For 99m Tc-MAG3, Time-Activity Curves (TACs) were produced for each kidney and relative renal blood flow (rRBF) and functional parameters were assessed using the slope of 99m Tc-MAG3 influx, peak activity, and the time-to-peak (TTP). Results: Figure 1 shows example T 1 - and T 2 - weighted MR images of a UUO mouse at 0, 1, 3 and 6 days post-surgery. The renal pelvic space was gradually expanded in obstructed kidneys as early as 1 day post ureteral ligation and the components of renal medulla, especially inner medulla and papilla, was remarkably decreased as the disease progressed. Reduction of renal cortex was also observed at day 3 and day 6. Histological investigation displayed typical patterns of UUO renal disease including tubular dilatation, flattening, and atrophy, and expansion of interstitial area with extracellular matrix accumulation and infiltration of inflammatory cells. Tubulointerstitial region progressed markedly over 6 days after ureteral obstruction. Obvious structural changes were not observed in contra-lateral kidneys and sham operation mouse kidneys. The MTC data analysis is currently underway. Figure 2 shows example 99m Tc-MAG3 TACs 3 hours and 6 days after surgery. Compared to sham mice, rRBF was remarkably (>60%) reduced in UUO kidneys as early as day 1 post-surgery and the TACs plateaued, indicating that 99m Tc-MAG3 is not excreted in these kidneys. The plateau activity in UUO kidneys was relatively low (~40% of sham kidney’s peak activity) and the time to plateau exceeded 200 sec, indicating reduced functional vessels and slow perfusion. Conversely, rRBF was progressively increased in contra-lateral kidneys, exhibiting a ~130% increase at day 6, although peak activity and TTPs were minimally changed. These data demonstrate that renal perfusion is remarkably and rapidly reduced in UUO kidneys, whereas it is gradually increased in contra-lateral kidneys. Conclusion: In pre-clinical models of renal disease, these imaging techniques could be effective tools for screening pharmacological agents and for elucidating pathological mechanisms of obstructive kidney disease. Acknowledgements: NIDDK 1P30 DK079341 Figure 1: T 1 and T 2 weighted images of UUO progression. C = Cortex, OM = outer medulla, IM = inner medulla, P = papilla Figure 2: 99m Tc-MAG3 TACs 3 hours and 6 days after surgery. Time 6 days 3 hours %ID/g %ID/g 4071 Proc. Intl. Soc. Mag. Reson. Med. 20 (2012)
Transcript of Serial Assessment of Renal Anatomy and Function in Mice ... fileSerial Assessment of Renal Anatomy...
Serial Assessment of Renal Anatomy and Function in Mice with Unilateral Ureteral Obstruction Using Multi-modal Imaging C. Chad Quarles1, Feng Weng1, Mohammed Tantawy1, Rosie Jiang2, Keiko Takahashi2, Chuan-Ming Hao2, Todd Peterson1, Raymond Harris2, and Takamune
Takahashi2 1Institute of Imaging Science, Vanderbilt University, Nashville, TN, United States, 2O'Brien Mouse Kidney Physiology and Disease Center, Vanderbilt University,
Nashville, TN, United States
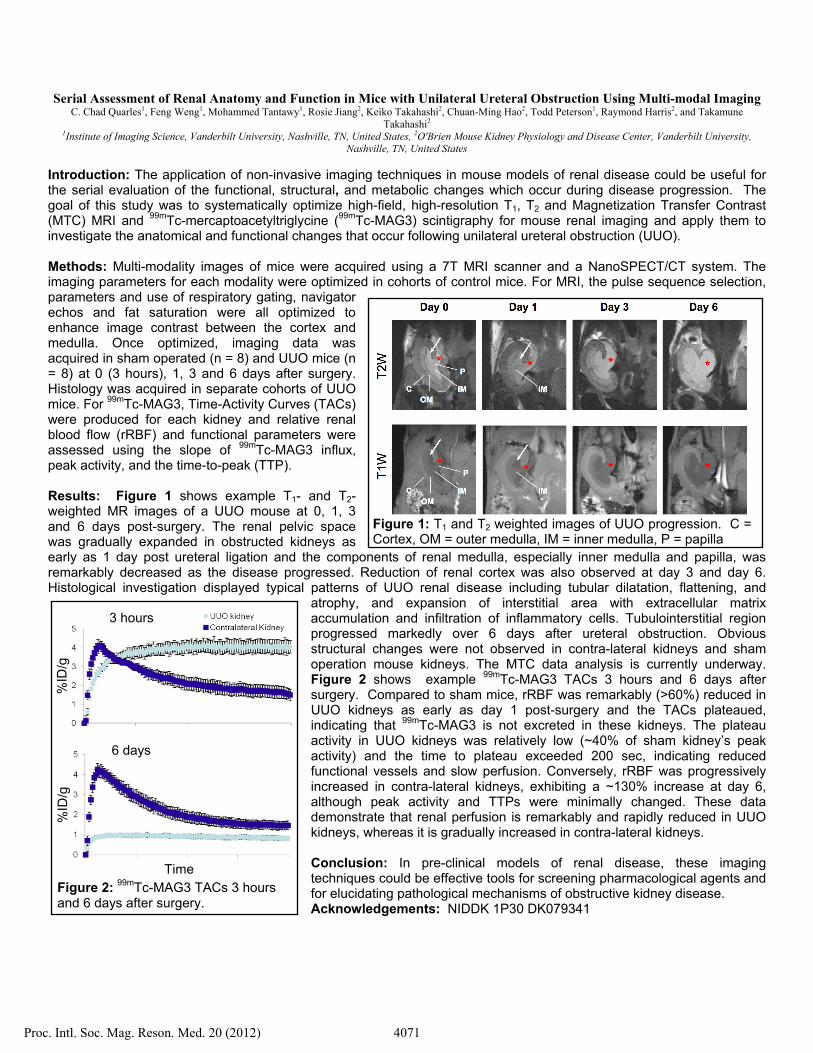
Introduction: The application of non-invasive imaging techniques in mouse models of renal disease could be useful for the serial evaluation of the functional, structural, and metabolic changes which occur during disease progression. The goal of this study was to systematically optimize high-field, high-resolution T1, T2 and Magnetization Transfer Contrast (MTC) MRI and 99mTc-mercaptoacetyltriglycine (99mTc-MAG3) scintigraphy for mouse renal imaging and apply them to investigate the anatomical and functional changes that occur following unilateral ureteral obstruction (UUO). Methods: Multi-modality images of mice were acquired using a 7T MRI scanner and a NanoSPECT/CT system. The imaging parameters for each modality were optimized in cohorts of control mice. For MRI, the pulse sequence selection, parameters and use of respiratory gating, navigator echos and fat saturation were all optimized to enhance image contrast between the cortex and medulla. Once optimized, imaging data was acquired in sham operated (n = 8) and UUO mice (n = 8) at 0 (3 hours), 1, 3 and 6 days after surgery. Histology was acquired in separate cohorts of UUO mice. For 99mTc-MAG3, Time-Activity Curves (TACs) were produced for each kidney and relative renal blood flow (rRBF) and functional parameters were assessed using the slope of 99mTc-MAG3 influx, peak activity, and the time-to-peak (TTP). Results: Figure 1 shows example T1- and T2-weighted MR images of a UUO mouse at 0, 1, 3 and 6 days post-surgery. The renal pelvic space was gradually expanded in obstructed kidneys as early as 1 day post ureteral ligation and the components of renal medulla, especially inner medulla and papilla, was remarkably decreased as the disease progressed. Reduction of renal cortex was also observed at day 3 and day 6. Histological investigation displayed typical patterns of UUO renal disease including tubular dilatation, flattening, and
atrophy, and expansion of interstitial area with extracellular matrix accumulation and infiltration of inflammatory cells. Tubulointerstitial region progressed markedly over 6 days after ureteral obstruction. Obvious structural changes were not observed in contra-lateral kidneys and sham operation mouse kidneys. The MTC data analysis is currently underway. Figure 2 shows example 99mTc-MAG3 TACs 3 hours and 6 days after surgery. Compared to sham mice, rRBF was remarkably (>60%) reduced in UUO kidneys as early as day 1 post-surgery and the TACs plateaued, indicating that 99mTc-MAG3 is not excreted in these kidneys. The plateau activity in UUO kidneys was relatively low (~40% of sham kidney’s peak activity) and the time to plateau exceeded 200 sec, indicating reduced functional vessels and slow perfusion. Conversely, rRBF was progressively increased in contra-lateral kidneys, exhibiting a ~130% increase at day 6, although peak activity and TTPs were minimally changed. These data demonstrate that renal perfusion is remarkably and rapidly reduced in UUO kidneys, whereas it is gradually increased in contra-lateral kidneys. Conclusion: In pre-clinical models of renal disease, these imaging techniques could be effective tools for screening pharmacological agents and for elucidating pathological mechanisms of obstructive kidney disease. Acknowledgements: NIDDK 1P30 DK079341
Figure 1: T1 and T2 weighted images of UUO progression. C =Cortex, OM = outer medulla, IM = inner medulla, P = papilla
Figure 2: 99mTc-MAG3 TACs 3 hours and 6 days after surgery.
Time
6 days
3 hours
%ID
/g
%ID
/g
4071Proc. Intl. Soc. Mag. Reson. Med. 20 (2012)