Sequestration Using Isotopes and Perfluorocarbon Tracers Library/Events/2016/fy16 cs rd/Tues... ·...
29
Monitoring of Geological CO 2 Sequestration Using Isotopes and Perfluorocarbon Tracers Project Number FEAA-045 Joachim Moortgat 3 Team: D. E. Graham 1 , S. M. Pfiffner 2 , T. J. Phelps 2 , D. R. Cole 3 , R . Soltanian 3 U.S. Department of Energy National Energy Technology Laboratory Mastering the Subsurface Through Technology, Innovation and Collaboration: Carbon Storage and Oil and Natural Gas Technologies Review Meeting August 16-18, 2016 1 2 3
Transcript of Sequestration Using Isotopes and Perfluorocarbon Tracers Library/Events/2016/fy16 cs rd/Tues... ·...

Monitoring of Geological CO2Sequestration Using Isotopes and
Perfluorocarbon TracersProject Number FEAA-045
Joachim Moortgat3
Team: D. E. Graham1, S. M. Pfiffner2, T. J. Phelps2, D. R. Cole3, R. Soltanian3
U.S. Department of EnergyNational Energy Technology Laboratory
Mastering the Subsurface Through Technology, Innovation and Collaboration:Carbon Storage and Oil and Natural Gas Technologies Review Meeting
August 16-18, 2016
1 2 3
2
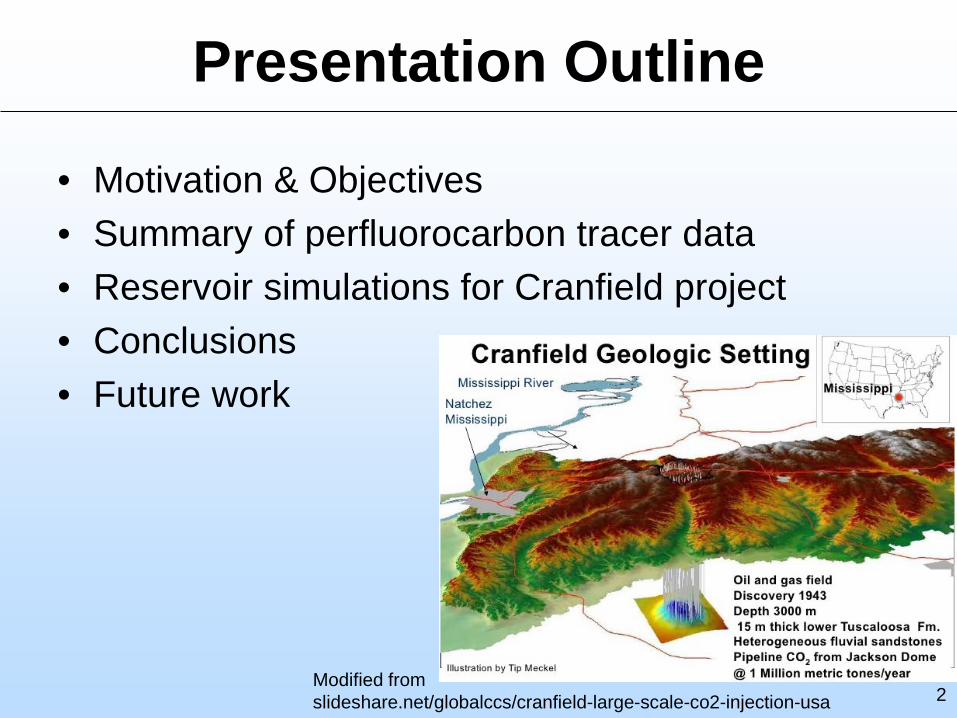
Presentation Outline
• Motivation & Objectives• Summary of perfluorocarbon tracer data• Reservoir simulations for Cranfield project• Conclusions • Future work
Modified from slideshare.net/globalccs/cranfield-large-scale-co2-injection-usa

Benefit to Program
3
Modified from NETL Carbon Storage GSRA Technology Research Areas Illustration
Use tracers to monitor & validate (99%) CO2 storage permanence
New subsurface signal to monitor physical & chemical processes that can affect storage efficiency:• Alter porosity & permeability,
e.g., fracturing• Control fluid flow, e.g.,
diffusion, mixing, advection, capillarity, and reaction
Couple tracers with reservoir modeling to predict storage capacity & effectiveness, aid future site selection & characterization

4
Project Overview
Develop complementary tracer methods to interrogate sub-surface for improved CO2 storage efficiency & permanence
– Complete geochemical and PFT analysis from 5-year Cranfield, Mississippi storage project
– Improve ultra-trace detection methods for PFT mixtures– Integrate geochemical, isotope and PFT results into an
advanced reservoir simulator for improved predictions• Step 1: Develop high-resolution petrophysical model &
reproduce earlier simulations for pressure & CO2
• Step 2: Incorporate natural (isotopic) and introduced (PFTs, SF6) tracer data in simulations
– Transfer technology to storage project partners
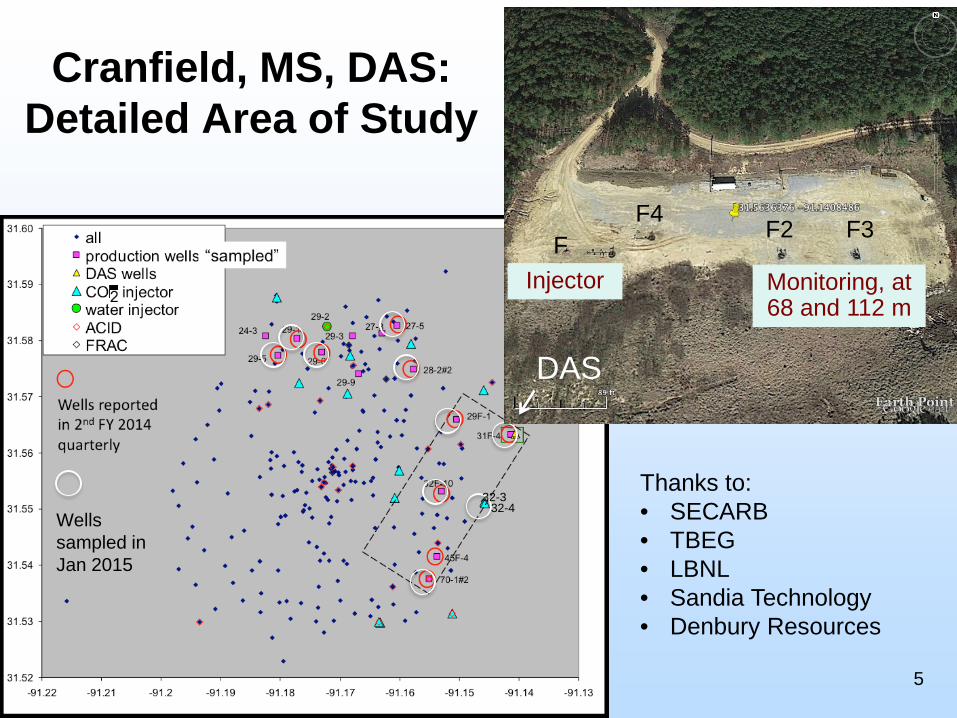
5
Wells sampled in Jan 2015
32-332-4
F1
F2 F3
Injector Monitoring, at 68 and 112 m
F4
Cranfield, MS, DAS:Detailed Area of Study
DAS
Thanks to:• SECARB• TBEG• LBNL• Sandia Technology• Denbury Resources

SUMMARY OF TRACER ANALYSES
6
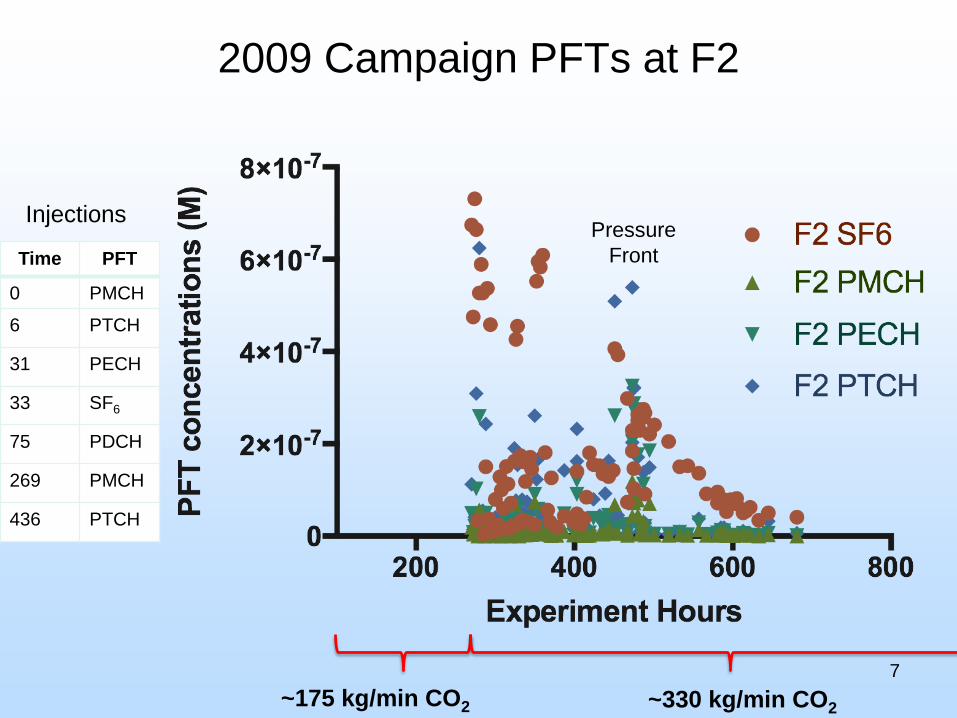
2009 Campaign PFTs at F2
7
Time PFT
0 PMCH
6 PTCH
31 PECH
33 SF6
75 PDCH
269 PMCH
436 PTCH
InjectionsPressure
Front
~175 kg/min CO2 ~330 kg/min CO2

2009 Campaign PFTs Relative to PECH
8
Injection timeline:PMCH PMCHPTCH PTCH(PECH)
Time PFT
0 PMCH
6 PTCH
31 PECH
33 SF6
75 PDCH
269 PMCH
436 PTCH
11.3 days
15 days
7.6 days + 3.3 days =9.9 days

2010 Campaign PFTs Relative to PTCH
9
4/12/2010
3.3 days
PMCPPDCH PECH
2009 background

RESERVOIR MODELING
10
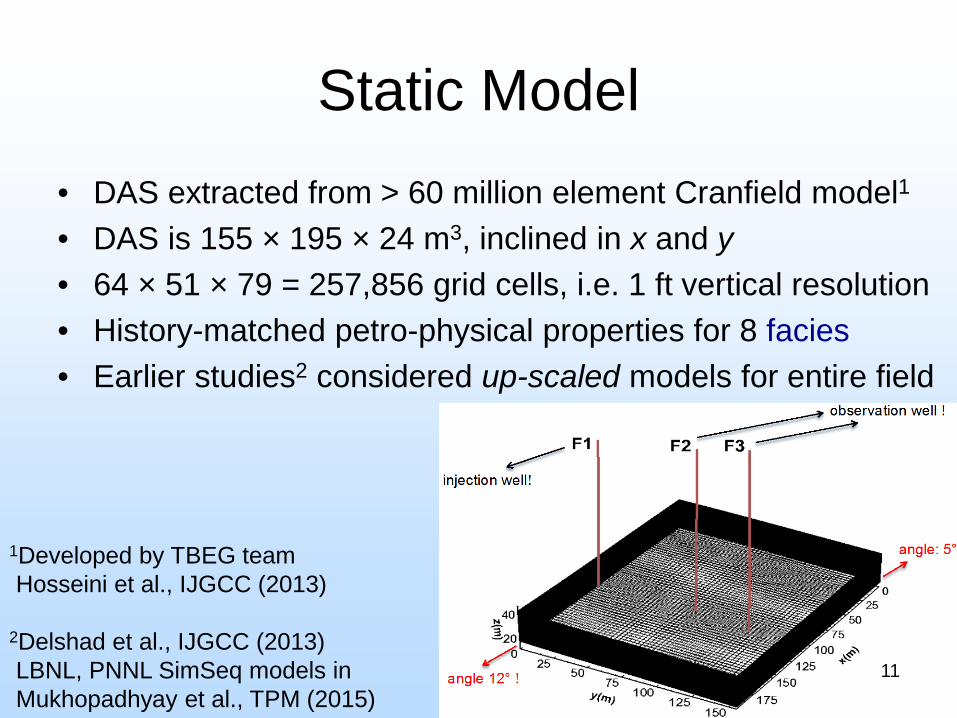
Static Model• DAS extracted from > 60 million element Cranfield model1
• DAS is 155 × 195 × 24 m3, inclined in x and y• 64 × 51 × 79 = 257,856 grid cells, i.e. 1 ft vertical resolution• History-matched petro-physical properties for 8 facies• Earlier studies2 considered up-scaled models for entire field
11
1Developed by TBEG teamHosseini et al., IJGCC (2013)
2Delshad et al., IJGCC (2013)LBNL, PNNL SimSeq models in Mukhopadhyay et al., TPM (2015)

Permeability
12Fluvial depositional features: high permeability channels & tight shales
z = 17.5 m z = 22.5 m
z = 27.5 m z = 32.5 m z = 37.5 m
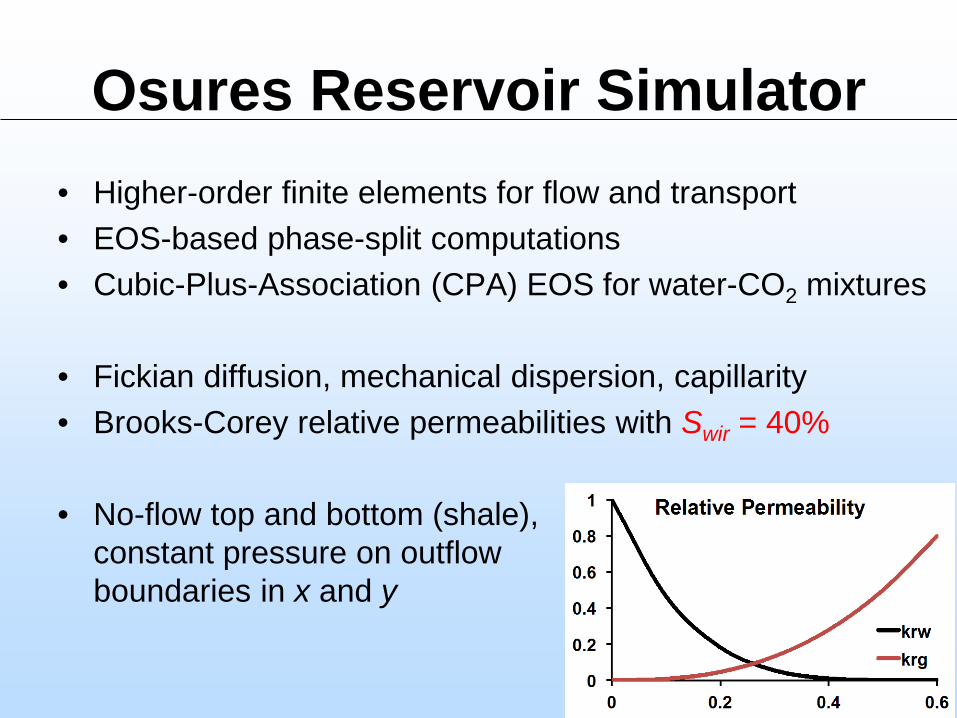
Osures Reservoir Simulator• Higher-order finite elements for flow and transport• EOS-based phase-split computations• Cubic-Plus-Association (CPA) EOS for water-CO2 mixtures
• Fickian diffusion, mechanical dispersion, capillarity• Brooks-Corey relative permeabilities with Swir = 40%
• No-flow top and bottom (shale),constant pressure on outflow boundaries in x and y
13
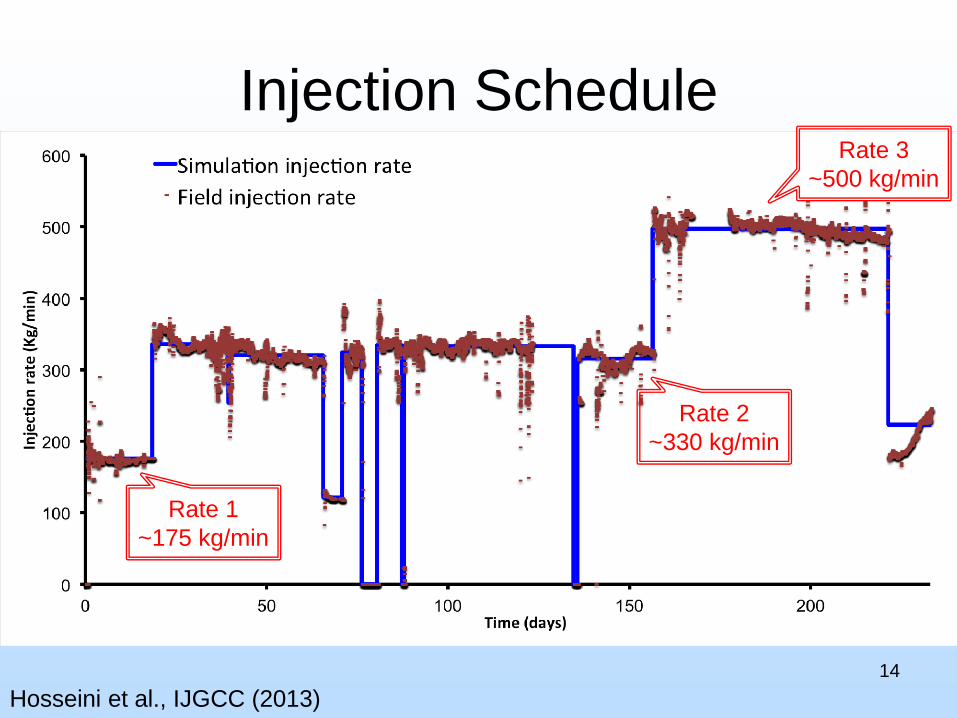
Injection Schedule
14Hosseini et al., IJGCC (2013)
Rate 1~175 kg/min
Rate 2~330 kg/min
Rate 3~500 kg/min

Results
15

Pressure Response in F1
163 detailed TBEG static models. Model selected in Hosseini et al. (2013) and Delshad et al. (2013) (blue) also shows best agreement with our simulations

Compared to IPARS, CMG, TOUGH2
17CMG in Hosseini et al., IJGCC (2013)
Our results
IPARS in Deshad et al., IJGCC (2013)
TOUGH2 2015 Mukhopadhyay et al.
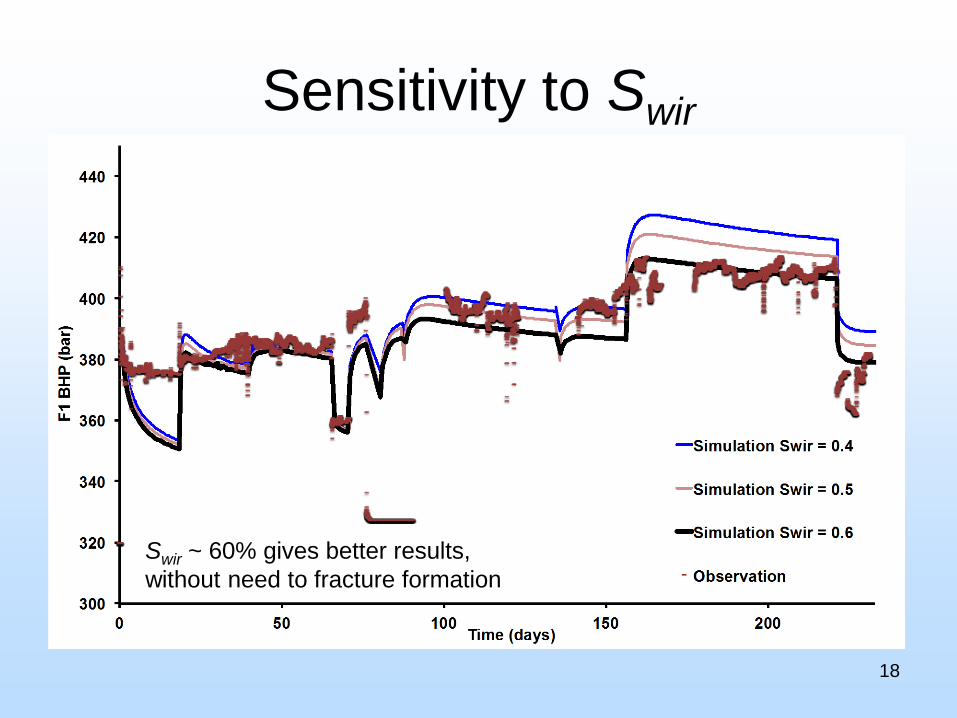
Sensitivity to Swir
18
Swir ~ 60% gives better results,without need to fracture formation

CO2 Breakthrough Times
19
Unit = days F2 F3 #cells from F1-F3Observed 11 16Our simulations 9.3 – 13.2 20.8 – 26.3 37
IPARS: Delshad et al. (2013) 13 90 7CMG: Hosseini et al. (2013) 7, 13, 28, 16 21, 28, 33, 46 7TOUGH2: LBNL model (Mukhopadhyay et al., 2015)
19 53 <7
STOMP: PNNL model (Mukhopadhyay et al., 2015)
8-14 19-53 <7

Conclusions from Simulations• Qualitative agreement with previous studies, but closer
to field data due to high-resolution static model, higher-order FE methods, and robust physics
• Agreement (mostly) on static model and wettability• However, pressures at highest rate and CO2
breakthrough in F3 overestimated in all models• Most likely cause: missing fluvial conduits of flow
• Next step: can we further constrain heterogeneity by modeling tracer experiment?
20
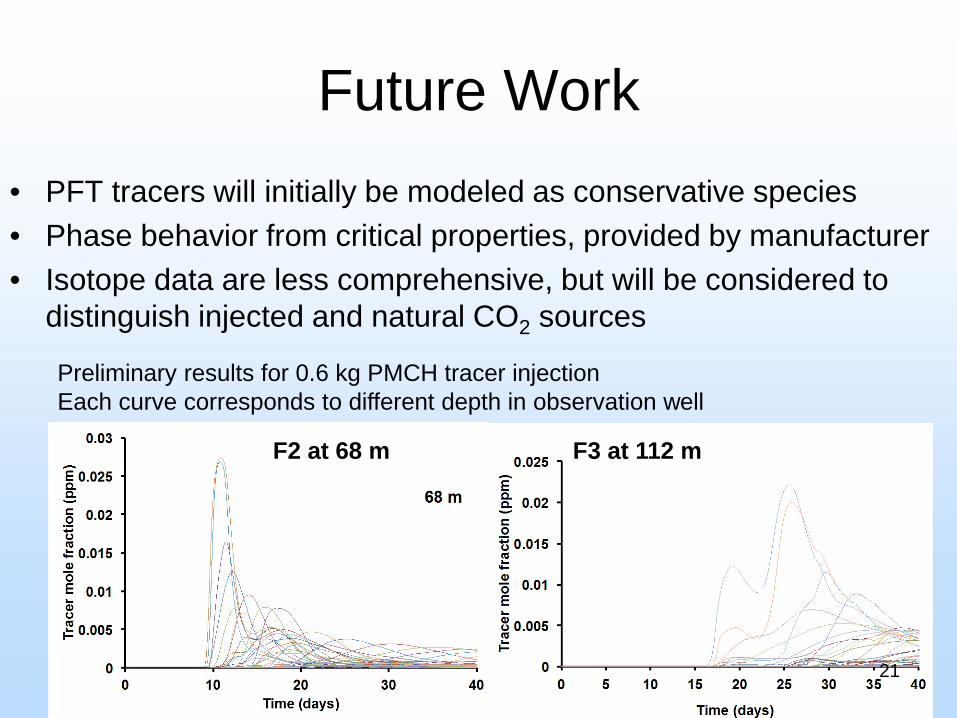
Future Work• PFT tracers will initially be modeled as conservative species• Phase behavior from critical properties, provided by manufacturer• Isotope data are less comprehensive, but will be considered to
distinguish injected and natural CO2 sources
21
F2 at 68 m F3 at 112 m
Preliminary results for 0.6 kg PMCH tracer injectionEach curve corresponds to different depth in observation well
Appendix
22

Future Plans & Synergies
23
Interpret PFT andgeochemical tracer results in advancedreservoir simulator
Improve ultra-trace detection
of PFTs
Tracer fielddeployment
& Tech Transfer
Enhancedprediction
of CO2storage
capacity & optimizing injection
plan
Validate methods to
assess storage
permanence
MVA,reservoir operation
for storage efficiency
Best practices:
Reported in FY2016 Q3

24
Project Organization
Tommy PhelpsSusan Pfiffner
David ColeM. R. SoltanianJ. Moortgat
David Graham, PI
RCSPs
Collaborators:
25
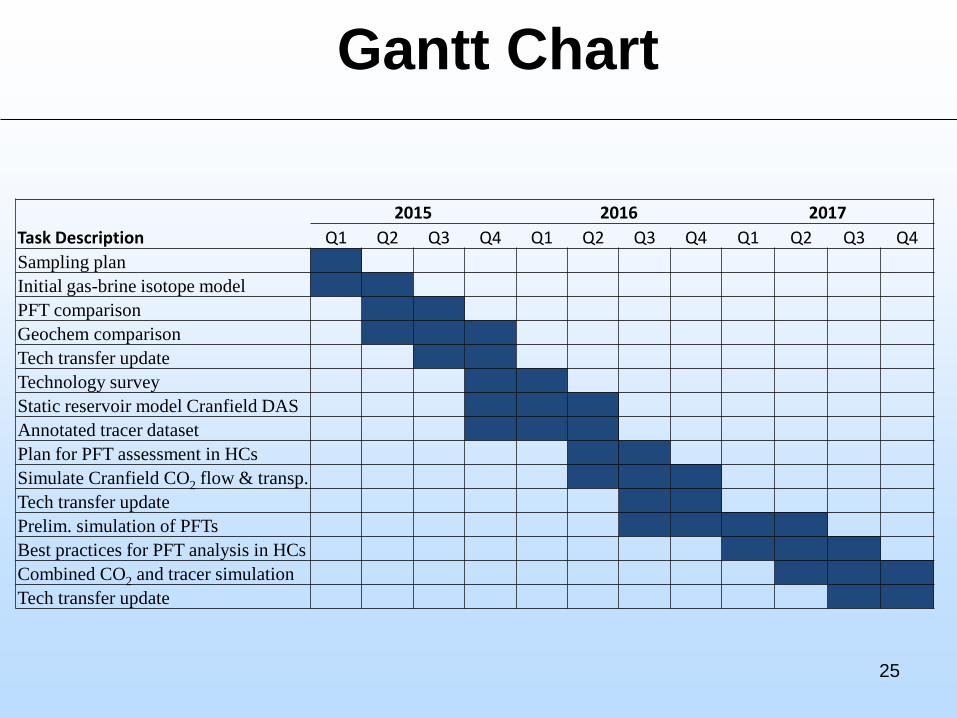
Gantt Chart
2015 2016 2017Task Description Q1 Q2 Q3 Q4 Q1 Q2 Q3 Q4 Q1 Q2 Q3 Q4Sampling planInitial gas-brine isotope modelPFT comparisonGeochem comparisonTech transfer updateTechnology surveyStatic reservoir model Cranfield DASAnnotated tracer datasetPlan for PFT assessment in HCsSimulate Cranfield CO2 flow & transp.Tech transfer updatePrelim. simulation of PFTsBest practices for PFT analysis in HCsCombined CO2 and tracer simulationTech transfer update

Bibliography
26
Soltanian, M. R., M. A. Amooie, D. R. Cole, D. Graham, S. A. Hosseini, S. Hovorka, S. Pfiffner, T. Phelps, J. Moortgat. 2016. Simulating the Cranfield Geological Carbon Sequestration Project with High-Resolution Static Models and an Accurate Equation of State. Submitted to International Journal of Greenhouse Gas Control.
Wilkins, M. J., R. Daly, P. J. Mouser, R. Trexler, K. C. Wrighton, S. Sharma, D. R. Cole, J. F. Biddle, E. Denis, J. K. Fredrickson, T. L. Kieft, T. C. Onstott, L. Petersen, S. M. Pfiffner, T. J. Phelps, and M. O. Schrenk. 2014. Trends and Future Challenges in Sampling the Deep Terrestrial Biosphere. Frontiers in Microbiology 5:481.
DePaolo, D. J., Cole, D. R., Navrotsky, A. and Bourg, I. C. (2013, Editors) Geochemistry of Geologic CO2 Sequestration. In: Geochemistry of Geologic Carbon Sequestration (D.J. DePaolo, D. R. Cole. A. Navrotsky and I. Bourg, eds.), Rev. Mineral. Geochem. 77, 539p.
DePaolo, D. J and Cole, D. R. (2013) Geochemistry of geologic carbon sequestration. An overview. Rev Mineral. Geochem. 77, 1-14.
Yousif K. Kharaka, David R. Cole, James J. Thordsen, Katherine D. Gans, and R. Burt Thomas, (2013) Geochemical Monitoring for Potential Environmental Impacts of Geologic Sequestration of CO2. In: Geochemistry of Geologic Carbon Sequestration (D.J. DePaolo, D. R. Cole. A. Navrotsky and I. Bourg, eds), Rev. Mineral. Geochem. 77, 399-430.

27
Accomplishments and Benefits to Program• Accomplishments• Assessing water-mineral-CO2 interactions using geochemical modeling and isotopic
signatures in baseline, during and post injection for multiple sites and campaigns.
• Determine behavior of perfluorocarbon tracer suites, breakthrough, development of reservoir storage over time at multiple sites.
• Delineate CO2 fronts with PFT’s, isotopes and on-line sensors (T, pH, Cond.).
• Established methods, proven successful, inexpensive, ongoing collaborations.
• Developed high-resolution Cranfield model to investigate CO2 and tracer transport
• Procedures for monitoring, verification and accounting (MVA) as tech transfer for larger sequestration demonstrations complementing other sites/partnerships.
• Benefits, • Fate, Breakthroughs, Transport, Interactions, MVA, and Technology Transfer.
• Established, successful, inexpensive, Technology Transfer collaborations.
• Lessons Learned of baseline needs and multiple natural and added tracers.
• Publications: 13 journal/book articles, a dozen proceedings papers.
• Education: 4 Students and 2 postgraduates.

Porosity
28Fluvial depositional features: high permeability channels & tight shales
z = 17.5 m z = 22.5 m
z = 27.5 m z = 32.5 m z = 37.5 m
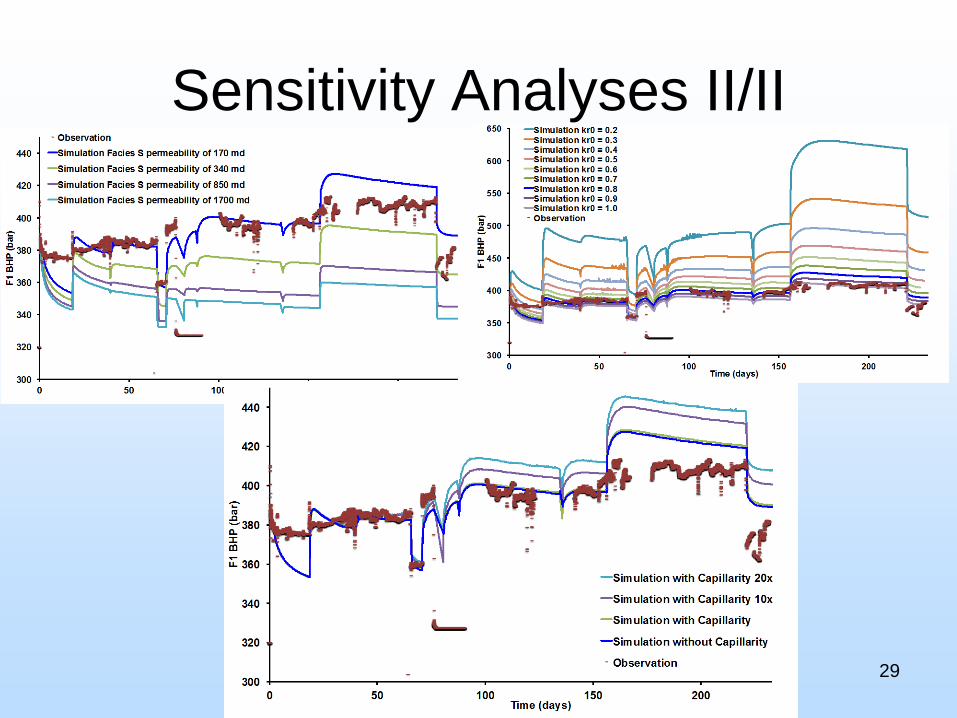
Sensitivity Analyses II/II
29